

Submitted:
19 August 2026
Posted:
21 August 2026
You are already at the latest version
Abstract
For patients treated with semaglutide or tirzepatide, weight-loss plateau followed by regain is a major concern, yet rebound occurring while treatment continues to be documented remains underappreciated and its biological correlates are poorly understood. Using a federated de-identified electronic health record (EHR) system across over 29 million de-identified U.S. patients, we analyzed adults initiating semaglutide or tirzepatide between 2021 and 2024. Among 58,618 patients who achieved ≥5% weight loss with evaluable 1-year weight trajectories, 8,389 (14.3%) regained ≥5 percentage points from their lowest observed bodyweight ("nadir"). Post-nadir treatment was ascertained from structured prescription orders together with positive mentions of medication received from clinical notes via AI-augmented curation. Among patients with at least of 90 days follow-up post-nadir, 45.8% of weight-regain patients were documented on treatment for at least half of their follow-up at a dose maintained at or above their pre-nadir maximum dose, compared with 51.6% of sustained responders (P < 0.001). Measured at the nadir relative to treatment initiation, weight-regain patients had a greater increase in neutrophil-to-lymphocyte ratio (+0.73 vs. +0.29) and neutrophils (+0.48 vs. +0.12 ×10⁹/L), with corresponding changes in albumin (−0.12 vs. −0.03 g/dL) and HDL (−0.65 vs. +1.03 mg/dL) (all P<0.001). These differences remained significant for the 45.8% of weight-regain patients with documented evidence of maintained treatment throughout their follow-up, indicating that the nadir-centred inflammatory, acute-phase, and lipoprotein changes may not be confined to patients whose treatment documentation lapsed. Gastrointestinal diagnoses and infections also peaked in weight-regain patients during the 3 months preceding the nadir (3.23% vs. 1.26% and 2.84% vs. 1.43%, both P<0.001). When weight status was reassessed longitudinally, event rates during regained time exceeded those during maintained-loss time (all q<0.001), including nonfatal MACE (12.9 vs. 9.6 per 1,000 person-years; adjusted RR: 1.43, 95% CI 1.22–1.67), heart failure (20.1 vs. 13.6; RR: 1.66, 1.45–1.89), and cardiac arrest (1.8 vs. 0.9; RR: 2.11, 1.37–3.26). Our findings identify the weight nadir as an underappreciated transition point that may help recognize patients entering rebound while treatment continues, motivating prospective study of whether weight-loss durability can be preserved and whether doing so alters cardiovascular risk.
Keywords:
GLP1
; weight regain
; inflammation
Introduction
Incretin-based therapies produce weight reduction of a magnitude previously achievable only with surgery, and their use has expanded rapidly in routine care [1,2,3]. Attention has consequently shifted from average efficacy toward durability, and in particular toward the substantial fraction of patients whose weight returns after an initial response. Trial data describe the average trajectory well but say little about the patients who diverge from it, and in practice that divergence is what clinicians encounter.
Randomized withdrawal studies have established that stopping incretin therapy is followed by substantial regain. Participants randomized to withdraw semaglutide in STEP 1 regained approximately two-thirds of lost weight within a year [4,5,6], and the SURMOUNT-4 withdrawal design produced a comparable result for tirzepatide. These trials characterize the consequence of drug removal. They have also shaped a widely held clinical inference that regain observed in practice reflects the same mechanism, an inference made plausible by real-world discontinuation rates approaching 50% within the first year [7,8,9,10]. A patient who begins regaining weight is therefore likely to be asked first whether they have stopped taking the drug.
That inference has not been examined directly, in part because the necessary data are rarely available together. Claims databases record dispensing without weights [7,11]; randomized trials record weights under protocolized exposure that does not resemble routine care [1,2]. Electronic health records contain both, but present a structural difficulty. The point at which a patient stops losing weight and begins to regain arrives at a different calendar time for every patient, so an analysis anchored on the prescription date averages across patients at entirely different stages of their own treatment course [12]. A cohort compared at one year after initiation contains some patients still losing weight and others many months past their lowest point, and the difference between those states is precisely what is of interest.
We addressed this by anchoring the analysis on each patient's own weight nadir rather than on the index date. This design permits a direct comparison of what the treatment record shows between patients who regained weight and those who did not, and allows the laboratory, gastrointestinal, infectious, and pharmacologic context of the nadir to be characterized. Because treatment records in routine care are incomplete, we ascertained treatment from structured orders and administrations together with positive mentions of medication received extracted from clinical notes, and we describe the resulting categories in terms of what the record shows rather than what patients are presumed to have done. We additionally allowed weight status to vary over follow-up, since a patient who regains weight may subsequently lose it again, and a status fixed at one timepoint would misclassify anyone who moves.
In this study we characterize the treatment, laboratory, and event correlates of weight regain during incretin therapy in a large real-world cohort [13]. We ask whether the pattern of documented treatment is consistent with the prevailing attribution of regain to stopping therapy, what else distinguishes patients who regain weight from those who do not, and what happens around the nadir itself.
Results
Cohort Construction and Definition of Weight Response Groups
Among 455,560 adults with an index prescription order for semaglutide or tirzepatide between 2021 and 2024, 117,771 met all eligibility criteria, 95,794 had enough recorded weights to trace a first-year trajectory, and 66,695 achieved at least 5% total body weight loss (Figure 1A). The analytic cohort comprised the 58,618 patients who additionally had a weight recorded at 1 year after the index date (±60 days tolerance). We defined the weight nadir as the lowest weight recorded during the first year after the index date and measured regain as the difference between that nadir and the weight recorded at 1 year post-index. Patients regaining at least 5 percentage points of body weight from their own nadir were categorized as weight regain (n = 8,389, 14.3%); those regaining less than 5 percentage points, including patients who continued to lose weight, were categorized as sustained response (n = 50,229, 85.7%). Because both quantities are measured inside the same first-year window, patients whose nadir occurred later had a shorter interval over which regain could accrue.
Among patients with weight regain, 15.8% reached the nadir within 90 days, 40.9% between 90 and 180 days, 35.0% between 180 and 270 days, and 8.4% at 270 days or later (capped at 360 days); the corresponding proportions among sustained responders significantly differed (P < 0.001) and were 2.3%, 11.2%, 24.4%, and 62.1%, respectively (Figure 1D). Mean time to nadir was 212.1 days (SD 111.6) versus 319.3 days (SD 85.0), a standardized mean difference (SMD) of −1.08 (P < 0.001, Figure 2C, Table 2). The proportion of eligible responders categorized as weight regain differed significantly across brands (P < 0.001, Figure S1): Zepbound 10.8% (485 of 4,481), Mounjaro 13.2% (1,617 of 12,277), Wegovy 13.3% (1,014 of 7,609), Ozempic 15.2% (4,875 of 31,982), and Rybelsus 17.5% (398 of 2,269). Brand-specific trajectories, nadir depths, and dose distributions appear in Figure S1.
Baseline Characteristics and Treatment Course
Ten of nineteen baseline characteristics exceeded a standardized mean difference of 0.1, the conventional threshold for imbalance, and eighteen of nineteen differed significantly between patients with weight regain and sustained responders (Figure 2A, Table 1). Patients with weight regain were more often prescribed insulin (22.3 vs. 15.4%, SMD +0.18, P < 0.001) and more often carried diagnoses of heart failure (13.1 vs. 8.6%, SMD +0.14, P < 0.001), neuropsychiatric conditions (19.3 vs. 14.1%, SMD +0.14, P < 0.001), depression (33.0 vs. 27.6%, SMD +0.12, P < 0.001), malnutrition (2.8 vs. 1.4%, SMD +0.10, P < 0.001), and chronic kidney disease (19.4 vs. 15.6%, SMD +0.10, P < 0.001). HbA1c was higher (7.0 vs. 6.8%, SMD +0.12, P < 0.001) and female sex less frequent (65.1 vs. 70.8%, SMD −0.12, P < 0.001) in patients with weight regain. Age was similar between groups (54.5 vs. 54.9 years, SMD −0.03, P = 0.02). Benjamini–Hochberg q values are reported alongside P values and did not change which comparisons reached significance.
Patients with weight regain reached a lower nadir depth than sustained responders (12.2%, SD 6.5 vs. 13.5%, SD 6.9; SMD −0.19, P < 0.001; Figure 2D, Table 2). Patients with weight regain were also less likely to be receiving a labelled maintenance dose at the nadir. Each brand's approved maintenance doses were defined from the product label (semaglutide subcutaneous 0.5, 1.0, and 2.0 mg; semaglutide for obesity 1.7 and 2.4 mg; oral semaglutide 7 and 14 mg; tirzepatide 5 through 15 mg), with all lower strengths treated as titration steps. At the nadir, 80.9% of patients with weight regain and 89.1% of sustained responders with a prescription dose on record were receiving a maintenance dose (P < 0.001). The difference was present in every brand and largest for semaglutide for obesity (Wegovy, 47.6 vs. 72.3%, P < 0.001) and smallest for oral semaglutide (Rybelsus, 72.9 vs. 79.3%, P = 0.07). The distribution across titration steps is shown in Figure 2B and Table 2, and across individual milligram doses in Figure S1.

Table 2.
Treatment course to the nadir, timing of the nadir, and dose reached.
| Measure | Metric | Weight regain | n | Sustained response | n | SMD | P |
| Time from index to nadir, d | mean (SD) | 212.1 (111.6) | 8,389 | 319.3 (85.0) | 50,229 | -1.08 | <0.001 |
| <90 d | n (%) | 811 (15.8) | 5,149 | 641 (2.3) | 27,638 | — | <0.001 |
| 90–180 d | n (%) | 2,105 (40.9) | 5,149 | 3,096 (11.2) | 27,638 | — | |
| 180–270 d | n (%) | 1,803 (35.0) | 5,149 | 6,735 (24.4) | 27,638 | — | |
| ≥270 d | n (%) | 430 (8.4) | 5,149 | 17,166 (62.1) | 27,638 | — | |
| Body weight lost at nadir, % | mean (SD) | 12.25 (6.47) | 8,389 | 13.51 (6.88) | 50,229 | -0.19 | <0.001 |
| Titration step before nadir | mean (SD) | 3.27 (1.24) | 7,233 | 3.63 (1.18) | 46,184 | -0.30 | <0.001 |
| Titration step after nadir | mean (SD) | 3.44 (1.20) | 5,204 | 3.73 (1.16) | 32,574 | -0.24 | <0.001 |
| Step 1 at nadir | n (%) | 617 (14.0) | 4,410 | 1,997 (7.8) | 25,706 | — | <0.001 |
| Step 2 at nadir | n (%) | 687 (15.6) | 4,410 | 2,868 (11.2) | 25,706 | — | |
| Step 3 at nadir | n (%) | 1,138 (25.8) | 4,410 | 6,713 (26.1) | 25,706 | — | |
| Step 4 at nadir | n (%) | 1,634 (37.1) | 4,410 | 10,176 (39.6) | 25,706 | — | |
| Step 5 at nadir | n (%) | 262 (5.9) | 4,410 | 2,771 (10.8) | 25,706 | — | |
| Step 6 at nadir | n (%) | 72 (1.6) | 4,410 | 1,181 (4.6) | 25,706 | — | |
| On a maintenance dose at nadir | n (%) | 3,567 (80.9) | 4,410 | 22,915 (89.1) | 25,706 | — | <0.001 |
| Ozempic | n (%) | 2,080 (94.8) | 2,193 | 11,671 (97.8) | 11,934 | — | <0.001 |
| Wegovy | n (%) | 294 (47.6) | 617 | 2,538 (72.3) | 3,508 | — | <0.001 |
| Rybelsus | n (%) | 151 (72.9) | 207 | 566 (79.3) | 714 | — | 0.07 |
| Mounjaro | n (%) | 781 (73.9) | 1,057 | 5,807 (84.3) | 6,886 | — | <0.001 |
| Zepbound | n (%) | 261 (77.7) | 336 | 2,333 (87.6) | 2,664 | — | <0.001 |
n denotes patients contributing data to each row. Nadir timing bands are of patients with a computable nadir date; the single P is from a χ² test across all four bands. Titration step denotes position on the ladder of the brand the patient was receiving, so brands with different milligram ranges are comparable, and dose step denominators are restricted to patients with a resolvable dose at the nadir; the single P is from a χ² test across all six steps. Maintenance doses were defined from each product label as semaglutide subcutaneous 0.5, 1.0, and 2.0 mg; semaglutide for obesity 1.7 and 2.4 mg; oral semaglutide 7 and 14 mg; and tirzepatide 5 through 15 mg, with all lower strengths treated as titration steps.
Treatment Documentation and Dose Titration over Time
Treatment was ascertained from two sources: structured prescription orders and positive mentions of medication received extracted from clinical notes by AI-augmented curation. A patient counted as documented on treatment at a given timepoint if either source recorded the index drug within the preceding 90 days. This establishes that the drug was prescribed or reported as received. Documented treatment declined in both groups from the index date onward (Figure 3). Measured from the index date, 71.4% of weight-regain patients and 78.0% of sustained responders were documented on treatment at 180 days, 54.7 and 67.5% at 1 year, and 31.4 and 36.7% at 2 years (all P < 0.001; Figure 3A). Measured from each patient's own nadir, the two were nearly indistinguishable: 79.0 and 77.2% at the nadir, 50.3 and 54.8% at 180 days after it, and 40.7 and 39.0% at 360 days (Figure 3B). Sustained responders reached their nadir 107 days later and therefore sat earlier in their own treatment course at any fixed date after initiation, which accounts for the difference between the two anchorings. Treatment documentation relative to both the index and the nadir by the evidence source is provided in Figure S2.
Dose escalation followed the same course in both groups for roughly 6 months after the index date and diverged thereafter (Figure 3C). Both climbed the dose ladder at a similar rate through 180 days. Sustained responders continued to escalate over the second half of the first year and held that higher position through 2 years, whereas weight-regain patients plateaued, drifted downward over the same period, and only partially recovered. Anchored on the nadir, mean dose settled at a consistently lower step in the weight-regain group and remained so throughout the following year (Figure 3D).
Post-Nadir Treatment Documentation Categories
Post-nadir treatment was classified into four mutually exclusive categories, restricted to patients with at least 90 days of follow-up after their nadir. Among weight-regain patients, 45.8% were documented on treatment for at least half of their observable post-nadir window with maximum dose at or above their pre-nadir maximum. For 36.9%, documentation covered less than half of that window. For 11.9%, an alternate molecule was documented at any point in the window (e.g., switched from semaglutide to tirzepatide or vice versa). For 5.3%, documentation covered at least half the window but the maximum dose after the nadir fell below the pre-nadir maximum. Corresponding proportions among sustained responders were 51.6%, 28.7%, 12.8%, and 6.9% (P < 0.001; Figure 4A, Table 3). A further 192 patients with weight regain and 2,977 sustained responders had fewer than 90 observable days after the nadir and could not be classified.
Weight regained by one year differed by roughly one percentage point across these categories despite a sixfold difference in documented treatment. Among weight-regain patients, those documented at a maintained dose regained a mean of +5.6 percentage points from the nadir, with 76% still documented at 180 days; those whose documentation covered less than half the window regained +6.6 points, with 13% documented at 180 days (P < 0.001; Figure 4B). Patients with an alternate molecule documented regained +4.6 points and those documented at a reduced dose +6.1 points. Among sustained responders the same ordering appeared at roughly a fifth the magnitude: −0.7, +0.7, +2.5, and +2.4 points for those with an alternate molecule documented, those documented at a maintained dose, those with documentation covering less than half the window, and those documented at a reduced dose, respectively (Figure 4C).
Chart review supported the documentation categories in most patients whose records permitted a judgement (Table S2). We sampled 35 patients with weight regain documented on treatment at a maintained dose and 35 documented for less than half the window. Physician adjudication, blinded to the algorithmic category, was possible for 25 of the first group and 17 of the second; the remainder had documentation too sparse to classify and were recorded as indeterminate rather than as errors. Among adjudicable patients documented at a maintained dose, 17 of 25 (68.0%, 95% CI 48.4–82.8) were confirmed as continuing treatment. Among adjudicable patients documented for less than half the window, 5 of 17 (29.4%, 13.3–53.1) were confirmed as having stopped, reflecting that an absence of records is weaker evidence of cessation than a presence of records is of continuation. Overall concordance with physician adjudication was 22 of 42 (52.4%).
Laboratory Measurements over Time
Most laboratory differences between the weight regain and sustained response groups were present before treatment began. Ten of twelve measures significantly differed at the index date, including HbA1c by 0.22 percentage points and triglycerides by 7.2 mg/dL (Table 4). Over the first 90–180 days of treatment, both groups improved on the metabolic measures and the curves stayed roughly parallel (Figure 5A–L). Expressing each series as a relative change from the value at index controls for differences at treatment start and isolates differences during treatment (Figure 5M–X, Table 4). On this scale, HbA1c, triglycerides, triglyceride-to-HDL ratio, albumin, AST, and TSH were significantly different at 1 year post-treatment, with sustained responders improving more. Neutrophils (P = 0.46), lymphocytes (P = 0.51), platelets (P = 0.23), eGFR (P = 0.36) and the neutrophil-to-lymphocyte ratio (P = 0.05) did not significantly differ.
Aligning on each patient's own nadir gives a different picture. Eleven of twelve measures differed at the nadir, with lab trajectories favoring sustained responders (Figure 6A–L, Table 4). All differences at the nadir were small and standardized effect sizes ranged from 0.19 to 0.35: albumin −0.35 (4.01 vs. 4.16 g/dL), HbA1c +0.31 (6.59 vs. 6.15%), neutrophil-to-lymphocyte ratio +0.30 (3.86 vs. 3.00), neutrophils +0.27 (5.56 vs. 4.92 × 10⁹/L), triglyceride-to-HDL ratio +0.26 (3.62 vs. 2.97), triglycerides +0.24 (148.8 vs. 129.4 mg/dL), HDL −0.22 (46.3 vs. 49.1 mg/dL), and AST +0.19 (25.4 vs. 22.8 U/L). Mean HbA1c, triglycerides, the triglyceride-to-HDL ratio, and the neutrophil-to-lymphocyte ratio lay outside the normal range of values in the weight-regain group for part or all of the observation window.
Applying the same change-from-index scale at the nadir separates four measures that did not differ at 1 year (Figure 6M–X, Table 4). HDL declined in the weight-regain group and rose in sustained responders (−0.65 vs. +1.03 mg/dL, P < 0.001), neutrophils rose more (+0.48 vs. +0.12 × 10⁹/L, P < 0.001), the neutrophil-to-lymphocyte ratio rose more (+0.73 vs. +0.29, P < 0.001), and platelets rose rather than fell (+4.5 vs. −0.5 × 10⁹/L, P = 0.006). Albumin declined further in the weight-regain group (−0.12 vs. −0.03 g/dL, P < 0.001). eGFR did not significantly differ. Restricting the analysis to patients documented on treatment for at least half their follow-up at a maintained dose, reproduced these differences (Figure 7). Albumin, neutrophils, the neutrophil-to-lymphocyte ratio, and HDL all remained at P < 0.001. Platelets did not (P = 0.14), nor did eGFR (P = 0.16). Benjamini–Hochberg q values were computed separately within the absolute-value and change families; the complete set of laboratory values at each time period relative to index and the nadir is reported in Table S3.
Gastrointestinal Diagnoses
Gastrointestinal, infection, and allergy diagnoses were grouped into composite sets whose component codes appear in Table S3. When assessing gastrointestinal (GI) diagnoses over time relative to the index date, GI diagnoses was recorded in 3.05% of the weight-regain group and 2.06% of sustained responders during the first 90 days (P < 0.001) and declined thereafter in both groups, with no difference from 450 days onward (Figure 8A). Serious GI diagnoses differed at every 90-day interval across 2 years, from 1.22 vs. 0.52% in the first 90 days to 0.74 vs. 0.47% at 630 days (all P ≤ 0.03; Figure 8B, Table 5A). When assessing GI diagnoses over time relative to the nadir, diagnoses peaked in the 3 months preceding the nadir: 3.23 vs. 1.26% for any diagnosis (P < 0.001) and 2.19 vs. 0.70% for serious diagnoses (P < 0.001), compared with 2.15 vs. 1.95% (P = 0.23) and 0.87 vs. 0.49% (P < 0.001) one year earlier (Figure 8C–D, Table 5A). Within the weight-regain group, GI burden between the index date and the nadir did not differ between patients whose documentation subsequently continued at a maintained dose and those whose documentation lapsed for any symptom (32.4 vs. 32.8%, P = 0.76) or for any serious event (3.7 vs. 4.1%, P = 0.37) (Figure 8E, Table 5B). Pancreatitis was more frequent among those whose documentation lapsed (0.5 vs. 1.1%, P = 0.009), as was diarrhoea (9.0 vs. 10.4%, P = 0.05). The same comparison among sustained responders showed higher rates of serious events (1.8 vs. 2.6%, P < 0.001), pancreatitis (0.2 vs. 0.5%, P < 0.001), and biliary disease (1.2 vs. 1.5%, P = 0.01) in patients whose documentation lapsed (Figure 8F, Table 5B).
Medications Initiated After the Nadir
Patients in the weight-regain group initiated more medications in 19 of 22 classes over the year following the nadir (Figure S3, Table 6). The largest differences were observed for corticosteroids (38.8 vs. 27.5%), opioids (30.6 vs. 20.1%), gabapentinoids (13.4 vs. 9.3%), insulin (10.2 vs. 6.2%), and antipsychotics (8.9 vs. 5.6%; all P < 0.001). Classes expected to reduce weight differed in the same direction, including weight-loss agents (8.2 vs. 5.5%), SGLT2 inhibitors (7.3 vs. 5.2%), and bupropion (6.9 vs. 5.2%; all P < 0.001). Statins (P = 0.30), thiazides (P = 0.48), and levothyroxine (P = 0.11) did not differ. A prescription for a different GLP-1RA was recorded for 4.8 vs. 2.3% of patients (P < 0.001). Denominators differ across classes because patients already receiving a medication class prior to the nadir were excluded.
Infection and Allergy Diagnoses
Infection diagnoses recorded between the index date and the nadir were more frequent in patients with weight regain across every diagnosis examined (Figure 9A–B; Table 7A). The rate of any infection was 425.7 per 1,000 person-years versus 243.0 (incidence rate ratio 1.75, 95% CI 1.67–1.84). Sepsis showed the largest difference at 54.0 versus 11.7 per 1,000 person-years (4.61, 3.98–5.35), followed by pneumonia at 76.2 versus 28.1 (2.71, 2.41–3.04), skin or soft tissue infection at 95.0 versus 50.2 (1.89, 1.71–2.09), urinary tract infection at 191.5 versus 104.6 (1.83, 1.71–1.96), and influenza or COVID-19 at 113.9 versus 75.1 (1.52, 1.39–1.66). All were significant at q < 0.001. Allergy diagnoses followed the same direction with smaller differences. Any allergy occurred at 42.9 versus 22.2 per 1,000 person-years (1.93, 1.66–2.24), drug allergy at 26.1 versus 9.7 (2.68, 2.20–3.27), and urticaria at 15.8 versus 11.0 (1.44, 1.13–1.84, q = 0.003). Anaphylaxis did not differ (2.3 versus 2.1; 1.08, 0.58–2.01, q = 0.81). Measured from the index date, the proportion of patients with any infection diagnosis declined in both groups over follow-up, from 2.39% versus 1.76% in the first 90 days to 0.90% versus 0.82% at 630 days, with no difference from 450 days onward (Figure 9C, Table 7B). Aligned on the nadir, the proportion in the weight-regain group rose from 1.97% at 360 days before to 2.84% in the interval beginning 90 days before the nadir, then fell to 1.24% in the 90 days after; the corresponding proportions among sustained responders were 1.73%, 1.43%, and 1.00% (Figure 9D).
Event Rates with Weight Status Treated as Time-Varying
Event rates during regained time exceeded rates during maintained-loss time for 13 of 16 outcomes examined (Figure 10B, 10C; Table 8). With interval, brand, and age held fixed, adjusted rate ratios were 2.26 for chronic kidney disease stage 4–5 (7.8 vs. 4.1 per 1,000 person-years; 95% CI 1.83–2.79), 2.11 for cardiac arrest (1.8 vs. 0.9; 1.37–3.26), 1.67 for venous thromboembolism (9.8 vs. 6.5; 1.39–2.01), 1.66 for heart failure hospitalization (20.1 vs. 13.6; 1.45–1.89), 1.61 for acute kidney injury (23.2 vs. 16.5; 1.42–1.82), 1.59 for all-cause death (10.7 vs. 5.9; 1.34–1.89), 1.49 for ischemic stroke (5.4 vs. 3.7; 1.18–1.90), 1.43 for nonfatal MACE (12.9 vs. 9.6; 1.22–1.67), and 1.33 for delirium (21.1 vs. 16.3; 1.18–1.51). Malnutrition (1.17, 0.98–1.38, q = 0.09) and syncope (1.03, 0.91–1.17, q = 0.65) did not differ. Adding death to the MACE composite left the estimate unchanged.
Discussion
In this large real-world cohort, weight regain occurred while treatment continued to be documented at maintained doses. Nearly half of patients who regained weight were documented on treatment across most of the following year at a dose held at or above the level they had previously reached, and the amount they regained differed only slightly from that of patients whose documentation lapsed. Whether these patients were in fact taking the drug is the central question this design cannot answer, and it governs how the finding should be read.
A record shows that a drug was prescribed or reported as received, not that it was taken. This cuts both ways. A patient who fills prescriptions and never uses them looks like someone documented on treatment. A patient buying medication outside the recorded system — through cash-pay channels, compounding pharmacies, or telehealth services these records do not capture — looks like someone who stopped. Both were common during the study period, when shortages pushed many patients to out-of-pocket sources. The two sources also fail differently. A structured order records that a prescription was written, not that it was filled or taken. A note mention records that the drug was reported as received, which is closer to intake but rests on an extraction pipeline and on what was said at a visit. Roughly a quarter of documented evidence of treatment continuation in each group rested on note mentions alone. We tested this directly in a subsample of patients with weight regain classified as documented on treatment at a maintained dose. Physician review of longitudinal notes, blinded to the algorithmic classification, confirmed continued treatment in 17 of 25 patients whose documentation permitted a judgement (68.0%). This review is evidence to support the finding but not enough to settle it. Confirming it would require an objective measure of intake, such as dispensing or pharmacy fill data, which these records do not contain.
Baseline characteristics and treatment course separated those with weight regain versus sustained response. Baseline characteristics differed, including higher baseline HbA1c and higher rates of insulin use, heart failure, neuropsychiatric conditions, depression, malnutrition, and chronic kidney disease in those with weight regain post-treatment. On average, patients who regained weight reached their lowest weight months earlier than sustained responders, and fewer of them were receiving a labelled maintenance dose when they got there [14]. Whether stopping short on the dose ladder contributes to regain, or is simply a consequence of a course that ended early, cannot be resolved here. Dose achieved and time to nadir are two descriptions of the same treatment history, so the data cannot separate them.
The laboratory differences are small and should not be read as establishing a mechanism. Effect sizes at the nadir were modest throughout, and differences of that size are easy to detect in a cohort this large without being clinically meaningful on their own. What makes the pattern worth reporting is its shape rather than its size. Three measures behaved differently. HDL fell in the weight-regain group while it rose in sustained responders, and neutrophils and the neutrophil-to-lymphocyte ratio rose further in the weight-regain group, in each case at the nadir but not a year after treatment started. The same pattern held in patients who had documentation of continued treatment at a maintained dose.
Infections recorded before the nadir were substantially more common in patients who regained weight, most markedly sepsis and pneumonia, and the rate of any infection peaked in the three months preceding it. This offers a competing explanation for the neutrophil findings, which are what an acute-phase response looks like [15,16] rather than anything specific to weight regain. Allergy diagnoses were also more frequent, though anaphylaxis did not differ. Whether infection helps produce the weight regain we observed — through the illness itself, its treatment, or the recovery that follows — or instead marks patients who were sicker throughout in ways these records do not capture, cannot be determined here and needs prospective ascertainment
A single explanation is unlikely to cover both routes to weight regain. For patients whose treatment documentation lapsed, randomized withdrawal trials already supply one [4,5,6]: removing the drug is followed by regain. For patients who regained with evidence of treatment continuation at a maintained dose, that explanation does not apply, and several others remain open — the drug losing effect over time [17], the body compensating for the weight already lost [18,19], changes in diet or activity, or illness we did not measure. Two of our findings bear on that last possibility. Patients who regained weight had more infections and gastrointestinal diagnoses recorded before the nadir, and started more corticosteroids, opioids and gabapentinoids in the year after it. Both are what one would expect if some of the weight loss preceding the nadir was involuntary and driven by illness rather than by the drug, in which case the subsequent regain would represent recovery and the weight-regain label would follow from how we defined it. Illness offers a second route as well: patients are commonly advised to hold incretin therapy during acute illness, hospitalization, or procedures, and a pause of that kind leaves the record intact while the drug goes untaken.
Letting weight status change over follow-up removes one bias and introduces its own constraints. Because status was reassigned every 90 days against each patient's running minimum, nobody was categorized using information from the future, and patients who regained and later lost weight moved between states. Event rates during regained time exceeded rates during maintained-loss time for 13 of 16 outcomes examined, including non-fatal MACE, and were highest for advanced chronic kidney disease, venous thromboembolism, and heart failure hospitalization. These estimates describe a weight state and an event rate occurring in the same window. They do not show that regaining weight produces the events, and reverse causation is easy to imagine, since heart failure, kidney disease, and venous thromboembolism are all conditions that alter body weight in their own right [20].
This study has several further limitations. First, both the nadir and the regain were identified inside the same first-year window, so patients whose nadir occurred later had less remaining time in which regain could accumulate. This contributes to the difference in nadir timing between the groups, and that difference should not be read as purely biological. Second, patients who regained weight were sicker at baseline and accumulated more diagnoses during follow-up, and sicker patients attend clinic more often. More visits mean more weights recorded, which makes a nadir easier to detect and a regain easier to observe, and more opportunities for a diagnosis to be entered. Differences in infection, gastrointestinal, and outcome rates between the groups therefore reflect some combination of true incidence and differential ascertainment, and we cannot separate the two. Third, we required enough recorded weights and a further order for the index drug within the first year, which selects for patients engaged with care and, among those, for patients whose weight was tracked closely enough to detect a nadir at all; how far these findings extend to less closely followed populations is unknown. Fourth, laboratory tests are ordered when a clinician has reason to order them, so the trajectories describe patients who were tested rather than the cohort, and the number behind each point falls by roughly two-thirds across the observation window. Finally, we did not adjust the treatment documentation comparisons for baseline differences between the groups, so the association between documented treatment and regain is unadjusted and residual confounding by indication is likely.
Weight regain in this cohort frequently occurred while treatment continued to be documented at a maintained dose, was preceded by an earlier nadir reached at a lower dose, and coincided with a fall in albumin and HDL and a rise in neutrophils and the neutrophil-to-lymphocyte ratio, alongside more frequent gastrointestinal and infectious diagnoses in the months before the nadir. Time spent in a regained state also carried higher rates of cardiovascular and renal events, including non-fatal MACE, heart failure hospitalization, and advanced chronic kidney disease. Whether the patients we classified as documented on treatment were actually taking the drug cannot be settled from these records, and that question should be answered by an objective assessment of drug intake before the finding is relied upon. If it holds, it would mean that regain seen in routine care should not be attributed to stopping treatment by default.
Methods
Data Source
This study analyzed de-identified electronic health record (EHR) data from a federated network in the United States via the nference nSights Analytics Platform21. Prior to analysis, all data underwent expert determination de-identification satisfying Health Insurance Portability and Accountability Act (HIPAA) Privacy Rule requirements [45 Code of Federal Regulations (CFR) §164.514(b)(1)]. Analysis code was executed within the secure data environment and only aggregate, non-identifiable summaries were returned; no patient-level data left the environment. All reported quantities are additive functions of counts, sums, or moments, such that the aggregate estimates correspond to those obtainable from patient-level data. These de-identified data environments were designed to enable analysis without requiring Institutional Review Board oversight, approval, or exemption confirmation. Accordingly, informed consent and IRB review were not required. Positive mentions of medication received were extracted using a previously validated information-extraction pipeline based on BERT transformer language models, which performs named-entity recognition followed by sequential qualifier models for subject, temporality, and certainty.
Cohort Selection
The index date was the first recorded order for semaglutide or tirzepatide under any of five brand names (Ozempic, Wegovy, Rybelsus, Mounjaro, or Zepbound). Patients were eligible if they were ≥18 years of age at initiation, had an index order between 2021 and 2024, had no order for any other incretin agent in the 365 days before the index date, so that the index order represents the start of incretin therapy rather than a switch, had no history of bariatric surgery, had at least two pre-index encounters and two pre-index weight measurements, the second requirement being needed to establish a stable pre-treatment weight rather than a single reading that may reflect measurement error or an acute illness, had a weight recorded within 90 days before the index date, and received a further order within 360 days of the index date, indicating that therapy continued beyond a single prescription. These criteria yielded 117,771 patients, of whom 95,794 had at least three post-index weights and therefore a computable trajectory. Patient counts at each step are shown in A. The gastrointestinal, infection, allergy, medication, and outcome analyses were run as a separate extraction that applied the same eligibility criteria but did not additionally require the minimum number of post-index weights and a measurement after month six used for the trajectory analyses. They therefore include 8,495 patients with weight regain and 53,561 sustained responders rather than 8,389 and 50,229; the additional patients have sparser weight records, and denominators for those analyses are given in the corresponding tables.
Nadir Identification and Response Categories
For each patient, the weight nadir was identified as the lowest weight recorded during the 360 days after the index date, and its date was recovered from the weight series so that all subsequent measures shared a common reference point. Patients achieving at least 5% total body weight loss at the nadir were eligible for analysis (n = 66,695), of whom 58,618 had a weight recorded at 1 year after the index date. Weight regain was defined as regain of at least 5 percentage points of body weight from the patient's own nadir, measured from the nadir to the 1-year weight; sustained response was defined as regain of less than 5 percentage points. Patients who never achieved 5% loss were excluded rather than categorized. Because the nadir and the regain were both identified within the first-year window, patients whose nadir occurred later had a shorter interval over which regain could accrue. Time-varying measures were computed on a 30-day grid spanning ±360 days around the nadir and, separately, on a 0 to 720 day grid from the index date.
Treatment Documentation
Treatment documentation was ascertained from two sources. The first was structured prescription orders for the index molecule. The second was positive mentions of the drug having been received, extracted from unstructured clinical notes by an AI-augmented curation pipeline that identifies the medication and then classifies subject, temporality, and certainty, retaining only mentions attributed to the patient, current, and affirmed. Each record was carried forward 90 days, and a patient counted as documented on treatment if either source placed the drug within that interval. Documentation is the share of the observable post-nadir window covered by the union of these carried-forward intervals, where the window ends at the earlier of 360 days after the nadir or the patient's last recorded observation. Patients were assigned to four mutually exclusive categories: an alternate molecule documented at any point in the window; documentation covering less than half the window; documentation covering at least half the window with maximum dose after the nadir below the pre-nadir maximum; and documentation covering at least half the window with dose at or above that maximum. Patients with fewer than 90 observable days after the nadir were not classified and are excluded from category comparisons. Because an order records that a drug was prescribed and a note mention records that it was reported as received, neither source confirms ingestion, and these categories describe the documentary record rather than treatment behaviour.
Dose Ascertainment
Doses were extracted from structured order text and resolved to a numeric milligram value. Because the five brands use different titration ladders, each dose was mapped to its titration step on the ladder of the brand the patient was receiving (Ozempic 0.25—2.0 mg over four steps; Wegovy 0.25—2.4 mg over five; Rybelsus 3—14 mg over three; Mounjaro and Zepbound 2.5—15 mg over six). Dose step was used wherever brands were combined; absolute milligram comparisons are reported within brand only (Figure S1). Doses were additionally classified as labelled maintenance doses or titration steps using each product's approved dosing schedule: semaglutide subcutaneous 0.5, 1.0, and 2.0 mg; semaglutide for obesity 1.7 and 2.4 mg; oral semaglutide 7 and 14 mg; and tirzepatide 5, 7.5, 10, 12.5, and 15 mg. All lower strengths are titration steps intended to be escalated. We report both the dose step, which preserves the ordering of doses within a brand, and the maintenance-dose classification, which maps directly onto prescribing guidance.
Laboratory Trajectory Analysis
Twelve laboratory measures were analyzed on two alignments: a 0 to 720 day grid from the index date and a −360 to +360 day grid around each patient's nadir. At each 90-day point we averaged all values recorded within ±45 days for a patient, so that each patient contributes at most one value per point, then combined patients within each response group to give a mean, standard deviation, and standard error. Two quantities are reported for each measure. The absolute value is the group mean at that point. The relative change is the same series expressed as the difference from that group's own mean at the index date, which removes the difference present between the groups before treatment began and isolates movement occurring during treatment. Reference intervals were taken from standard adult clinical ranges and are used only to orient the reader: HbA1c below 5.7%, triglycerides below 150 mg/dL, HDL above 40 mg/dL, triglyceride-to-HDL ratio below 3.0, neutrophil-to-lymphocyte ratio 1.0 to 3.0, neutrophils 1.8 to 7.7 × 10⁹/L, lymphocytes 1.0 to 4.8 × 10⁹/L, platelets 150 to 400 × 10⁹/L, albumin 3.5 to 5.0 g/dL, AST 10 to 40 U/L, eGFR above 60 mL/min/1.73 m², and TSH 0.4 to 4.0 mIU/L. Comparisons were prespecified at one landmark per alignment: 360 days for the index-anchored series and the nadir for the nadir-anchored series. Absolute values were compared with Welch's t test and relative changes with a z test on the difference of the two changes. Benjamini–Hochberg q values were computed separately within the twelve absolute comparisons and the twelve relative-change comparisons, since these answer different questions.
Gastrointestinal, Infection, and Allergy Diagnoses
Gastrointestinal, infection, and allergy diagnoses were grouped into composite sets. Any gastrointestinal diagnosis is the union of digestive-tract diagnoses and symptoms; serious gastrointestinal diagnosis comprises pancreatitis, biliary disease, bowel obstruction, gastroparesis, perforation, and bleeding. Infection was grouped into sepsis, pneumonia, urinary tract, skin and soft tissue, and influenza or COVID-19, with a composite of all five. Allergy was grouped into anaphylaxis, urticaria, and drug allergy, with a composite of all three. Component codes appear in Table S1. Gastrointestinal diagnoses are reported as the percentage of patients with at least one diagnosis in each 90-day interval, relative to the index date and to the nadir, with denominators taken as the patients under observation at the start of each interval. Infection and allergy diagnoses accrued between the index date and the nadir are reported as rates per 1,000 person-years, with person-time calculated as each group's size multiplied by its mean time to nadir.
Concomitant Medications
Concomitant medications were identified from structured orders by ingredient name and grouped into 22 classes: metformin; insulin; SGLT2 inhibitors (any gliflozin); sulfonylureas (glipizide, glyburide, glimepiride, gliclazide); DPP-4 inhibitors (any gliptin); thiazolidinediones (pioglitazone, rosiglitazone); other GLP-1 receptor agonists (liraglutide, dulaglutide, exenatide, lixisenatide); antipsychotics (olanzapine, quetiapine, risperidone, clozapine, aripiprazole, paliperidone, ziprasidone, haloperidol); SSRIs and SNRIs (fluoxetine, sertraline, citalopram, escitalopram, paroxetine, venlafaxine, duloxetine, desvenlafaxine); mirtazapine; bupropion; corticosteroids (prednisone, prednisolone, dexamethasone, hydrocortisone, methylprednisolone); loop diuretics (furosemide, bumetanide, torsemide); thiazides (hydrochlorothiazide, chlorthalidone); beta blockers (metoprolol, atenolol, carvedilol, bisoprolol, propranolol); statins (atorvastatin, rosuvastatin, simvastatin, pravastatin, lovastatin, pitavastatin, fluvastatin); levothyroxine; weight-loss agents (phentermine, topiramate, naltrexone, orlistat); stimulants (amphetamine, methylphenidate, lisdexamfetamine); anticoagulants (warfarin, apixaban, rivaroxaban, dabigatran, edoxaban); opioids (oxycodone, hydrocodone, morphine, tramadol, fentanyl); and gabapentinoids (gabapentin, pregabalin). A medication counted as newly initiated only if the class was absent for the 180 days before the nadir and at least 90 observable days followed the nadir. Denominators exclude patients already receiving the class and those without 90 observable days after the nadir, and therefore differ across classes
Time-Varying Weight Status
To allow weight status to change during follow-up, each patient's follow-up was divided into 90-day intervals, and a status was assigned at the start of each interval from the most recent weight at least 30 days earlier, so that an event could not determine the status of the interval in which it occurred. Three statuses were defined: pre-response, before 5% loss was achieved; maintained loss, within 5 percentage points of the patient's running minimum weight; and regained, 5 or more percentage points above that minimum. The running minimum was updated as follow-up proceeded, so that a patient who regained, lost, and regained weight again moved between statuses. Weights were carried forward at most 180 days; person-time without a usable weight was designated unclassified and excluded from rate comparisons. Events and person-time were tabulated by interval, status, and stratum, and rate ratios were estimated with a Poisson model using log person-time as an offset and terms for interval, brand, and age. Code sets used for each outcome are described in Table S1.
Statistical Analysis
Continuous variables are summarized as means with standard deviations and compared using Welch's t test; proportions are compared using χ² tests. Standardized mean differences are reported for baseline comparisons, with absolute values <0.1 considered indicative of adequate balance. For time-varying comparisons, a single landmark was prespecified per analysis: the nadir for laboratory measures, since both groups are at their own minimum weight at that point; 180 days after the nadir for weight change and treatment documentation; and 360 days from the index date for the treatment-start trajectory. The correlation between nadir depth and time to nadir was computed from sufficient statistics, which reproduces the patient-level Pearson correlation exactly. Analyses were performed in Python 3.12 using pandas, NumPy, SciPy, and statsmodels. Where a family of related comparisons was made — the baseline characteristics, the twelve absolute laboratory values, the twelve relative laboratory changes, the 22 medication classes, and the outcome set — Benjamini–Hochberg q values are reported alongside P values, corrected within each family.
Validation of Treatment Documentation by Chart Review
To test whether the documentation categories reflected actual treatment, we sampled patients with weight regain whose post-nadir treatment could be evaluated (n = 6,783) and drew 35 patients classified as documented on treatment at a maintained dose, using a fixed random seed. For each patient, a large language model reviewed longitudinal clinical documentation spanning 7 days before through 365 days after the nadir and produced a treatment-exposure assessment with the supporting text. The model was instructed not to reassess weight, the nadir, or cohort eligibility, all of which were established from structured data, and was told that an active medication-list entry or an isolated prescription alone was not sufficient evidence of continued treatment. Each assessment was then adjudicated by a physician who confirmed or corrected the classification while blinded to the algorithmic category. Patients whose documentation did not permit reliable classification — administrative entries only, contradictory evidence, or insufficient follow-up notes — were recorded as indeterminate and reported separately rather than counted as errors.
Data Availability
This study involves the analysis of de-identified Electronic Health Record (EHR) data via the nference Federated Clinical Analytics Platform (FCAP). Data shown and reported in this manuscript were extracted from this environment using an established protocol for data extraction, aimed at preserving patient privacy. The data has been de-identified pursuant to an expert determination in accordance with the HIPAA Privacy Rule. Any data beyond what is reported in the manuscript, including but not limited to the raw EHR data, cannot be shared or released due to the parameters of the expert determination to maintain the data de-identification. The corresponding author should be contacted for additional details regarding the nference platform.
De-Identification and HIPAA Compliance Certification
Prior to analysis, all EHR data were de-identified under an expert determination consistent with the Health Insurance Portability and Accountability Act (HIPAA) Privacy Rule (45 CFR §164.514(b)(1)). The de-identification methodology employed a multi-layered transformation approach to both structured and unstructured data fields [21]. In structured data, direct identifiers including patient names and precise geographic locations were excluded entirely, while indirect identifiers underwent specific transformations: patient identifiers, medical record numbers, and accession numbers were replaced with one-way cryptographic hashes using confidential salts to preserve linkage across patient encounters; all dates were shifted backward by patient-specific random offsets (1–31 days) to preserve temporal relationships while obscuring exact event timing; the ZIP codes were truncated to two-digit state-level resolution; and continuous variables including age, height, weight, and body mass index were thresholded to prevent identification of extreme values (for example, ages ≥89 years transformed to ‘89+’ and BMI >40 transformed to ‘40+’). In unstructured clinical text, an ensemble de-identification system that combines attention-based deep learning models with rule-based methods achieved an estimated >99% recall for personally identifiable information (PII) detection, with detected identifiers replaced by plausible fictional surrogates [21].
Data Harmonization
To address heterogeneity in EHR data, we harmonized clinical variables including medications, anthropometric measurements, and diagnoses to standardized concepts. For medications, we first constructed a standardized drug concept database combining the nference knowledge graph with RXNorm (https://www.nlm.nih.gov/research/umls/rxnorm/index.html) hierarchies to capture ingredient, brand, and dose-specific information. EHR medication records were matched using a hierarchical approach prioritizing RXNorm codes when available, followed by ingredient-level matching, and finally natural language processing and pattern matching on free-text medication orders when structured codes were absent. For anthropometric measurements (height, weight, BMI), we created a unified vocabulary from SNOMED (https://www.snomed.org/, https://athena.ohdsi.org) and LOINC (https://loinc.org/) terminologies and matched EHR measurement descriptions using standardized text matching algorithms with abbreviation expansion and synonym resolution; ambiguous mappings were resolved using OpenAI GPT-4o (https://platform.openai.com/docs/models/gpt-4o) with summary statistics as context, followed by manual verification. For diagnoses, we developed a hierarchical disease concept database from the nference knowledge graph and matched EHR diagnosis descriptions and codes by identifying the most specific common child concept in the hierarchy. This approach enabled consistent identification of clinical entities while preserving granularity where available.
Code Availability
The analysis code is not publicly available. The corresponding author should be contacted for additional details.
Supplementary Materials
The following supporting information can be downloaded at the website of this paper posted on Preprints.org.
Author Contributions
V.S. conceived and designed the study. Data queries and statistical analyses were conducted by R.M., C.G, and A.J.V. All authors interpreted the data, contributed to writing the manuscript and the revisions, and approved the final version for submission.
Funding
This research received no external funding.
Acknowledgments
We thank the nference engineering team for the development of the nference federated AI platform, and Patrick Lenehan for helpful clinical feedback.
Conflicts of Interest Statement
The authors are employees of nference, inc., which conducts research collaborations with various biopharmaceutical companies whose therapeutic products are included in this study. None of these companies, nor any other nference collaborator, funded, supported, or had any role in the independent study design, data acquisition, analysis, interpretation, manuscript preparation, or the decision to submit this work for publication. All analyses were conducted by the authors using de-identified electronic health record data. The authors declare no additional competing interests.
References
- Wilding, J.P.H.; Batterham, R.L.; Calanna, S.; et al. Once-weekly semaglutide in adults with overweight or obesity. N Engl. J. Med. 2021, 384(11), 989–1002. [Google Scholar] [CrossRef]
- Jastreboff, A.M.; Aronne, L.J.; Ahmad, N.N.; et al. Tirzepatide once weekly for the treatment of obesity. N Engl. J. Med. 2022, 387(3), 205–216. [Google Scholar] [CrossRef]
- Davies, M.; Færch, L.; Jeppesen, O.K.; et al. Semaglutide 2.4 mg once a week in adults with overweight or obesity, and type 2 diabetes (STEP 2): a randomised, double-blind, double-dummy, placebo-controlled, phase 3 trial. Lancet 2021, 397(10278), 971–984. [Google Scholar] [CrossRef]
- Wilding, J.P.H.; Batterham, R.L.; Davies, M.; et al. Weight regain and cardiometabolic effects after withdrawal of semaglutide: the STEP 1 trial extension. Diabetes Obes. Metab. 2022, 24(8), 1553–1564. [Google Scholar] [CrossRef]
- Aronne, L.J.; Sattar, N.; Horn, D.B.; et al. Continued treatment with tirzepatide for maintenance of weight reduction in adults with obesity: the SURMOUNT-4 randomized clinical trial. JAMA 2024, 331(1), 38–48. [Google Scholar]
- Rubino, D.; Abrahamsson, N.; Davies, M.; et al. Effect of continued weekly subcutaneous semaglutide vs placebo on weight loss maintenance in adults with overweight or obesity: the STEP 4 randomized clinical trial. JAMA 2021, 325(14), 1414–1425. [Google Scholar]
- Gleason, P.P.; Urick, B.Y.; Marshall, L.Z.; et al. Real-world persistence and adherence to glucagon-like peptide-1 receptor agonists among obese commercially insured adults without diabetes. J. Manag Care Spec. Pharm. 2024, 30(8), 860–867. [Google Scholar] [CrossRef]
- Rodriguez, P.J.; Zhang, V.; Gratzl, S.; et al. Discontinuation and reinitiation of dual-labeled GLP-1 receptor agonists among US adults with overweight or obesity. JAMA Netw. Open 2025, 8(1), e2457349. [Google Scholar] [CrossRef]
- Do, D.; Lee, T.; Peasah, S.K.; et al. GLP-1 receptor agonist discontinuation among patients with obesity and/or type 2 diabetes. JAMA Netw. Open 2024, 7(5), e2413172. [Google Scholar] [CrossRef]
- Marshall, L.Z.; Gleason, P.P.; Friedlander, N.; Urick, B.Y. Trends in 1-year persistence and adherence among initiators of high-potency, weight loss–indicated glucagon-like peptide 1 receptor agonists. J. Manag Care Spec. Pharm. 2026, 32(3), 281–289. [Google Scholar] [CrossRef]
- Samuels, J.M.; Hetherington-Rauth, M.; Almandoz, J.P.; et al. Real-world titration, persistence and weight loss of semaglutide and tirzepatide in an academic obesity clinic. Diabetes Obes. Metab. 2025, 27(11), 6200–6209. [Google Scholar] [CrossRef]
- Allam, A.; Feuerriegel, S.; Rebhan, M.; Krauthammer, M. Analyzing patient trajectories with artificial intelligence. J. Med. Internet Res. 2021, 23(12), e29812. [Google Scholar] [CrossRef]
- Squire, P.; Naude, J.; Zentner, A.; Bittman, J.; Khan, N. Factors associated with weight loss response to GLP-1 analogues for obesity treatment: a retrospective cohort analysis. BMJ Open 2025, 15(1), e089477. [Google Scholar] [CrossRef]
- Horn, D.B.; Kahan, S.; Batterham, R.L.; et al. Time to weight plateau with tirzepatide treatment in the SURMOUNT-1 and SURMOUNT-4 clinical trials. Clin. Obes. 2025, 15(3), e12734. [Google Scholar] [CrossRef]
- Zahorec, R. Neutrophil-to-lymphocyte ratio, past, present and future perspectives. Bratisl. Lek. Listy 2021, 122(7), 474–488. [Google Scholar] [CrossRef]
- Gabay, C.; Kushner, I. Acute-phase proteins and other systemic responses to inflammation. N Engl. J. Med. 1999, 340(6), 448–454. [Google Scholar] [CrossRef]
- Wang, D.; Djalalvandi, A.; Saed, C.T.; Morrison, K.M.; Steinberg, G.R. Can muscle avert GLP1R weight plateau and regain? Cell Rep. Med. 2025, 6(9), 102308. [Google Scholar] [CrossRef]
- Rosenbaum, M.; Leibel, R.L. Adaptive thermogenesis in humans. Int. J. Obes. (Lond) 2010, 34 (Suppl 1), S47–S55. [Google Scholar] [CrossRef]
- Müller, M.J.; Enderle, J.; Bosy-Westphal, A. Changes in energy expenditure with weight gain and weight loss in humans. Curr. Obes. Rep. 2016, 5(4), 413–423. [Google Scholar] [CrossRef]
- Lincoff, A.M.; Brown-Frandsen, K.; Colhoun, H.M.; et al. Semaglutide and cardiovascular outcomes in obesity without diabetes. N Engl. J. Med. 2023, 389(24), 2221–2232. [Google Scholar] [CrossRef]
- Murugadoss, K.; Rajasekharan, A.; Tulsian, V.; et al. Building a best-in-class automated de-identification tool for electronic health records through ensemble learning. Patterns (N Y) 2021, 2(6), 100255. [Google Scholar] [CrossRef]
Figure 1.
Cohort construction, study design, weight trajectories, and timing of the nadir. A) Derivation of the analytic cohort. The extraction begins from 731,092 prescription orders; 455,560 adults had an index order within the study window, of whom 117,771 met all eligibility criteria. Counts excluded at each step are shown at right. B) Study design, showing the pre-index window, the first-year window in which the weight nadir is identified, and the post-nadir window over which treatment documentation is evaluated; definitions are listed. C) Mean percentage of body weight lost from the index date, with 95% CIs, annotated at 180, 360, and 720 days. D) Distribution of time from the index date to the nadir in 90-day bands, with the percentage and count for each band; P from a χ² test on the whole distribution.
Figure 1.
Cohort construction, study design, weight trajectories, and timing of the nadir. A) Derivation of the analytic cohort. The extraction begins from 731,092 prescription orders; 455,560 adults had an index order within the study window, of whom 117,771 met all eligibility criteria. Counts excluded at each step are shown at right. B) Study design, showing the pre-index window, the first-year window in which the weight nadir is identified, and the post-nadir window over which treatment documentation is evaluated; definitions are listed. C) Mean percentage of body weight lost from the index date, with 95% CIs, annotated at 180, 360, and 720 days. D) Distribution of time from the index date to the nadir in 90-day bands, with the percentage and count for each band; P from a χ² test on the whole distribution.
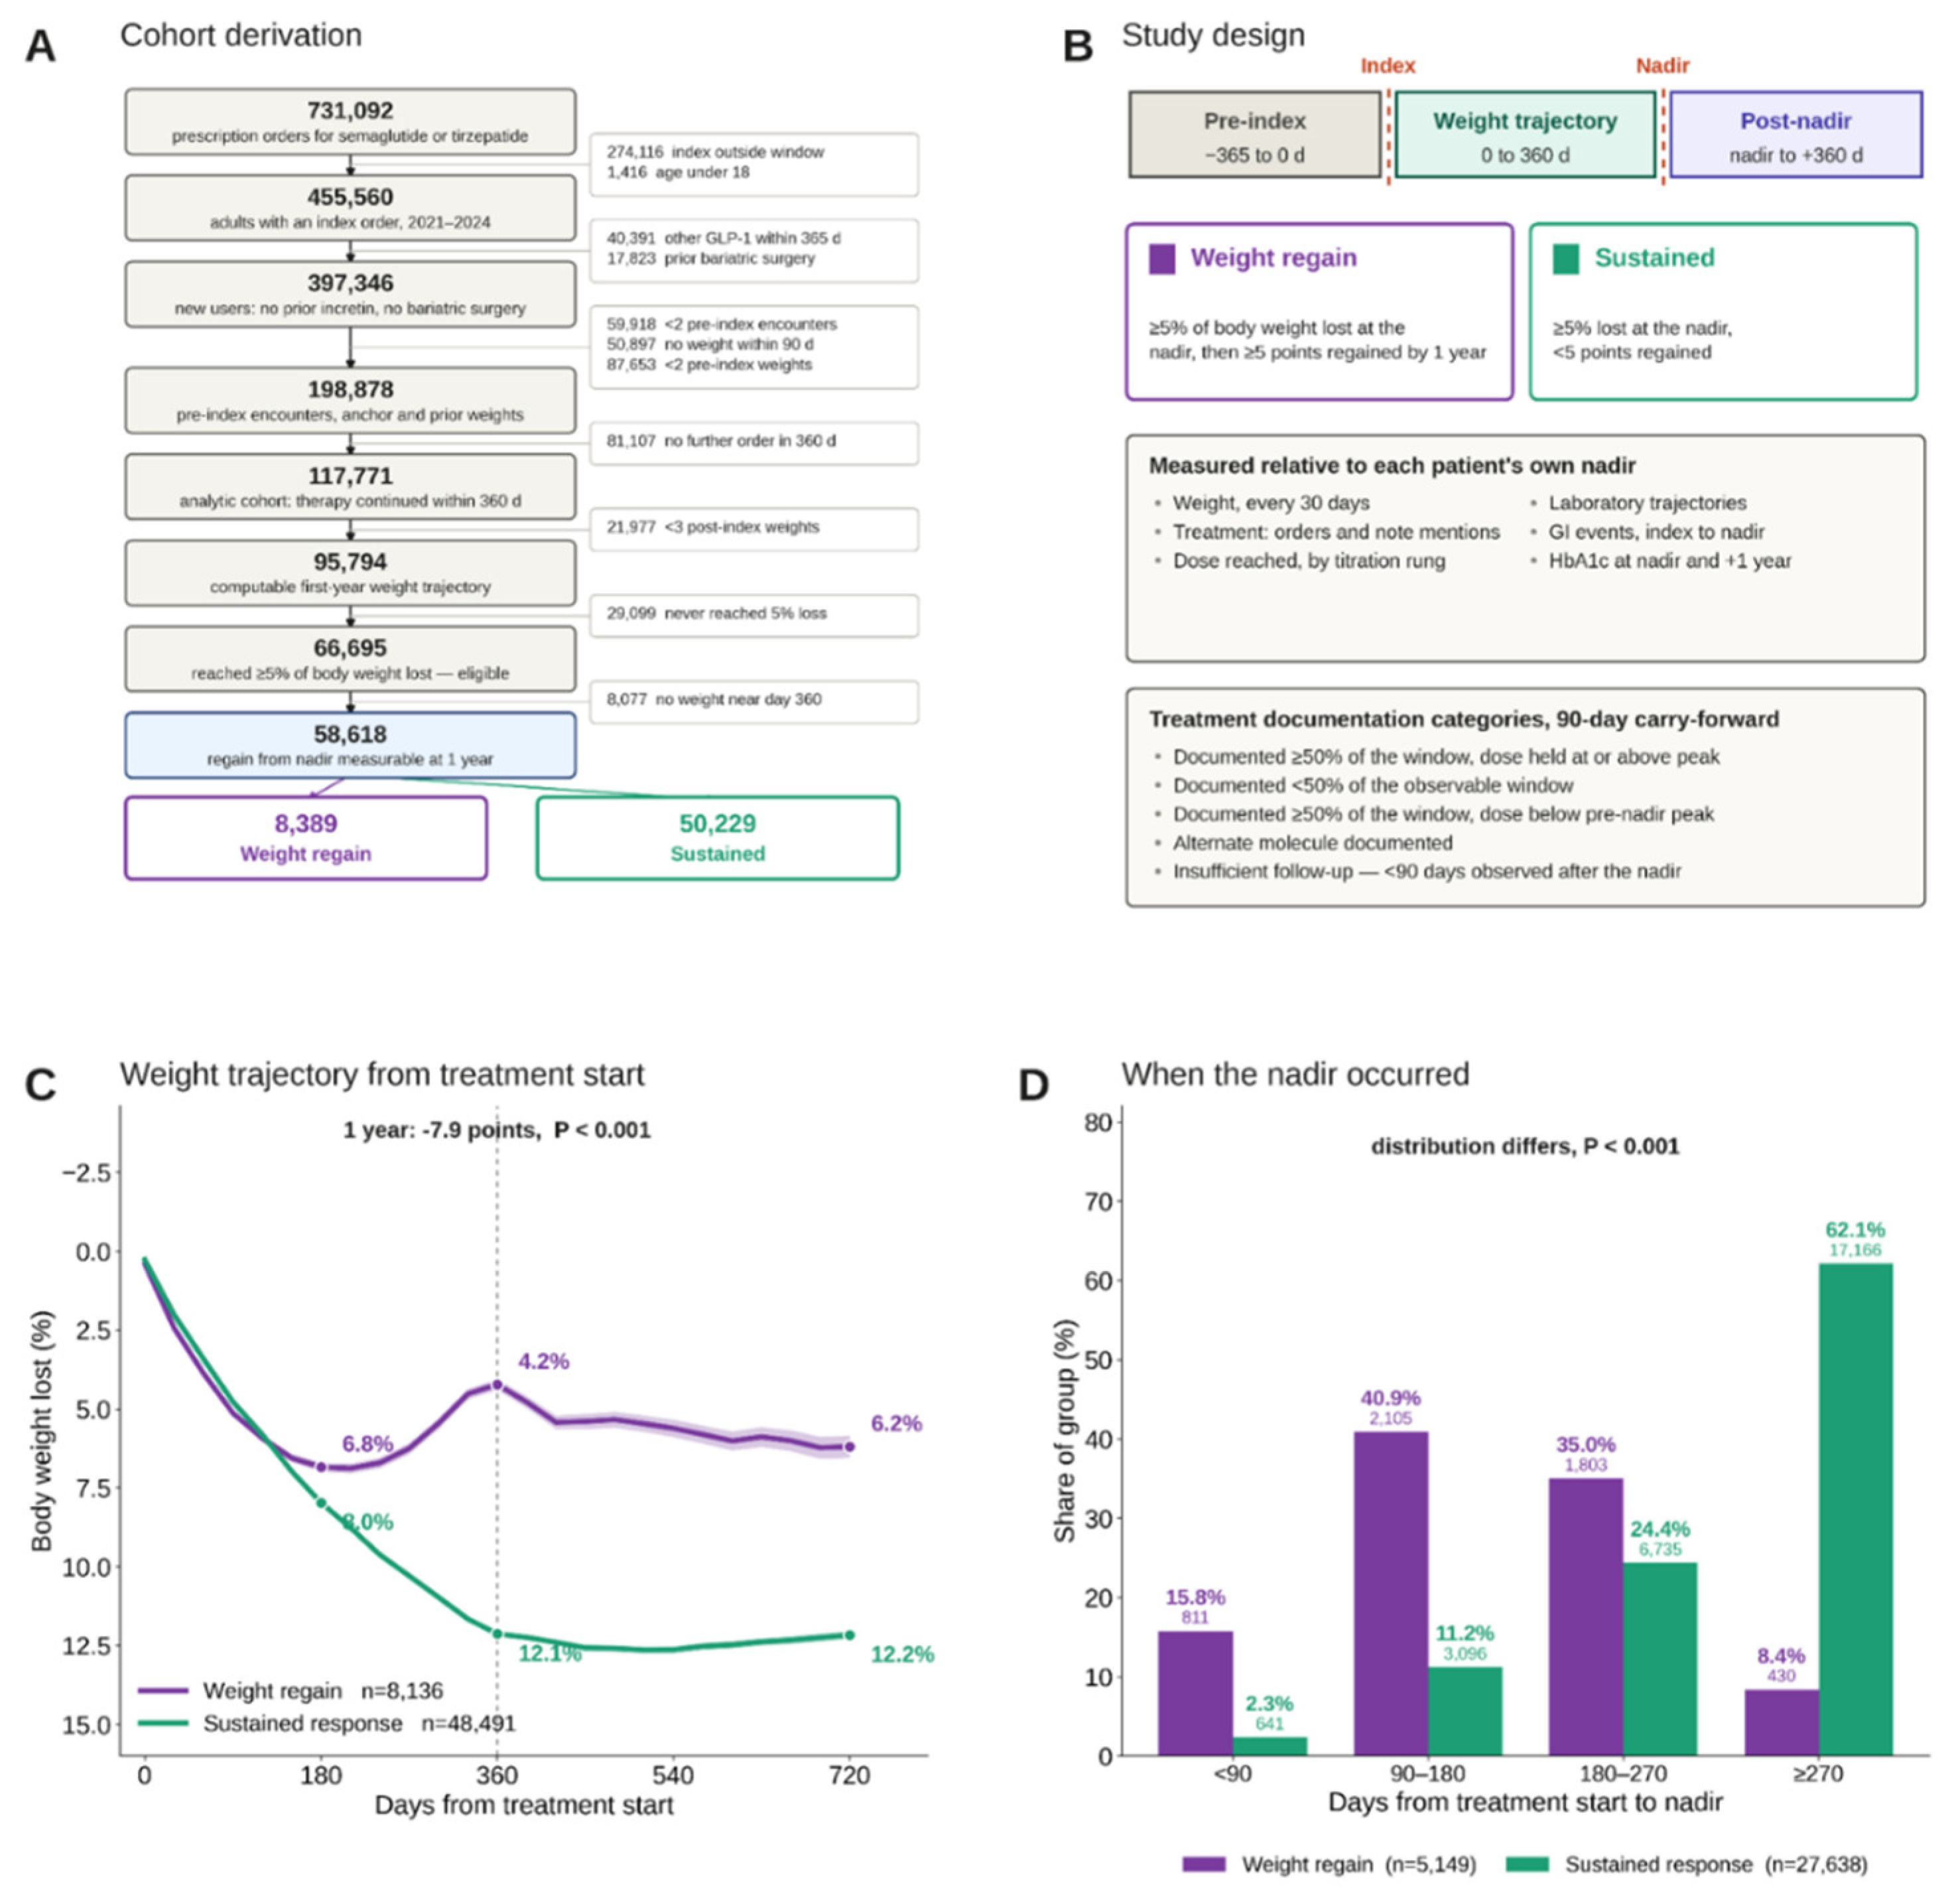
Figure 2.
Baseline characteristics, dose reached, and nadir characteristics. A) Standardized mean differences in baseline characteristics, weight regain minus sustained response; positive values indicate a higher prevalence or level in the weight-regain group. The shaded band marks ±0.1, the conventional threshold below which groups are considered balanced. P and Benjamini–Hochberg q values appear at right. B) Proportion of patients receiving a labelled maintenance dose of their brand at the nadir, overall and within each brand, among patients with a resolvable dose; the labelled maintenance doses defining the classification are listed beneath, and all lower strengths are treated as titration steps. C) Time from index date to nadir and D) body weight lost at the nadir, mean ± SD, with the between-group difference, standardized mean difference, and P. E, F) Joint distribution of nadir depth and time to nadir for each response group; cells are shaded by their share of that group, the line is the regression of depth on time, and the marker denotes the bivariate mean.
Figure 2.
Baseline characteristics, dose reached, and nadir characteristics. A) Standardized mean differences in baseline characteristics, weight regain minus sustained response; positive values indicate a higher prevalence or level in the weight-regain group. The shaded band marks ±0.1, the conventional threshold below which groups are considered balanced. P and Benjamini–Hochberg q values appear at right. B) Proportion of patients receiving a labelled maintenance dose of their brand at the nadir, overall and within each brand, among patients with a resolvable dose; the labelled maintenance doses defining the classification are listed beneath, and all lower strengths are treated as titration steps. C) Time from index date to nadir and D) body weight lost at the nadir, mean ± SD, with the between-group difference, standardized mean difference, and P. E, F) Joint distribution of nadir depth and time to nadir for each response group; cells are shaded by their share of that group, the line is the regression of depth on time, and the marker denotes the bivariate mean.
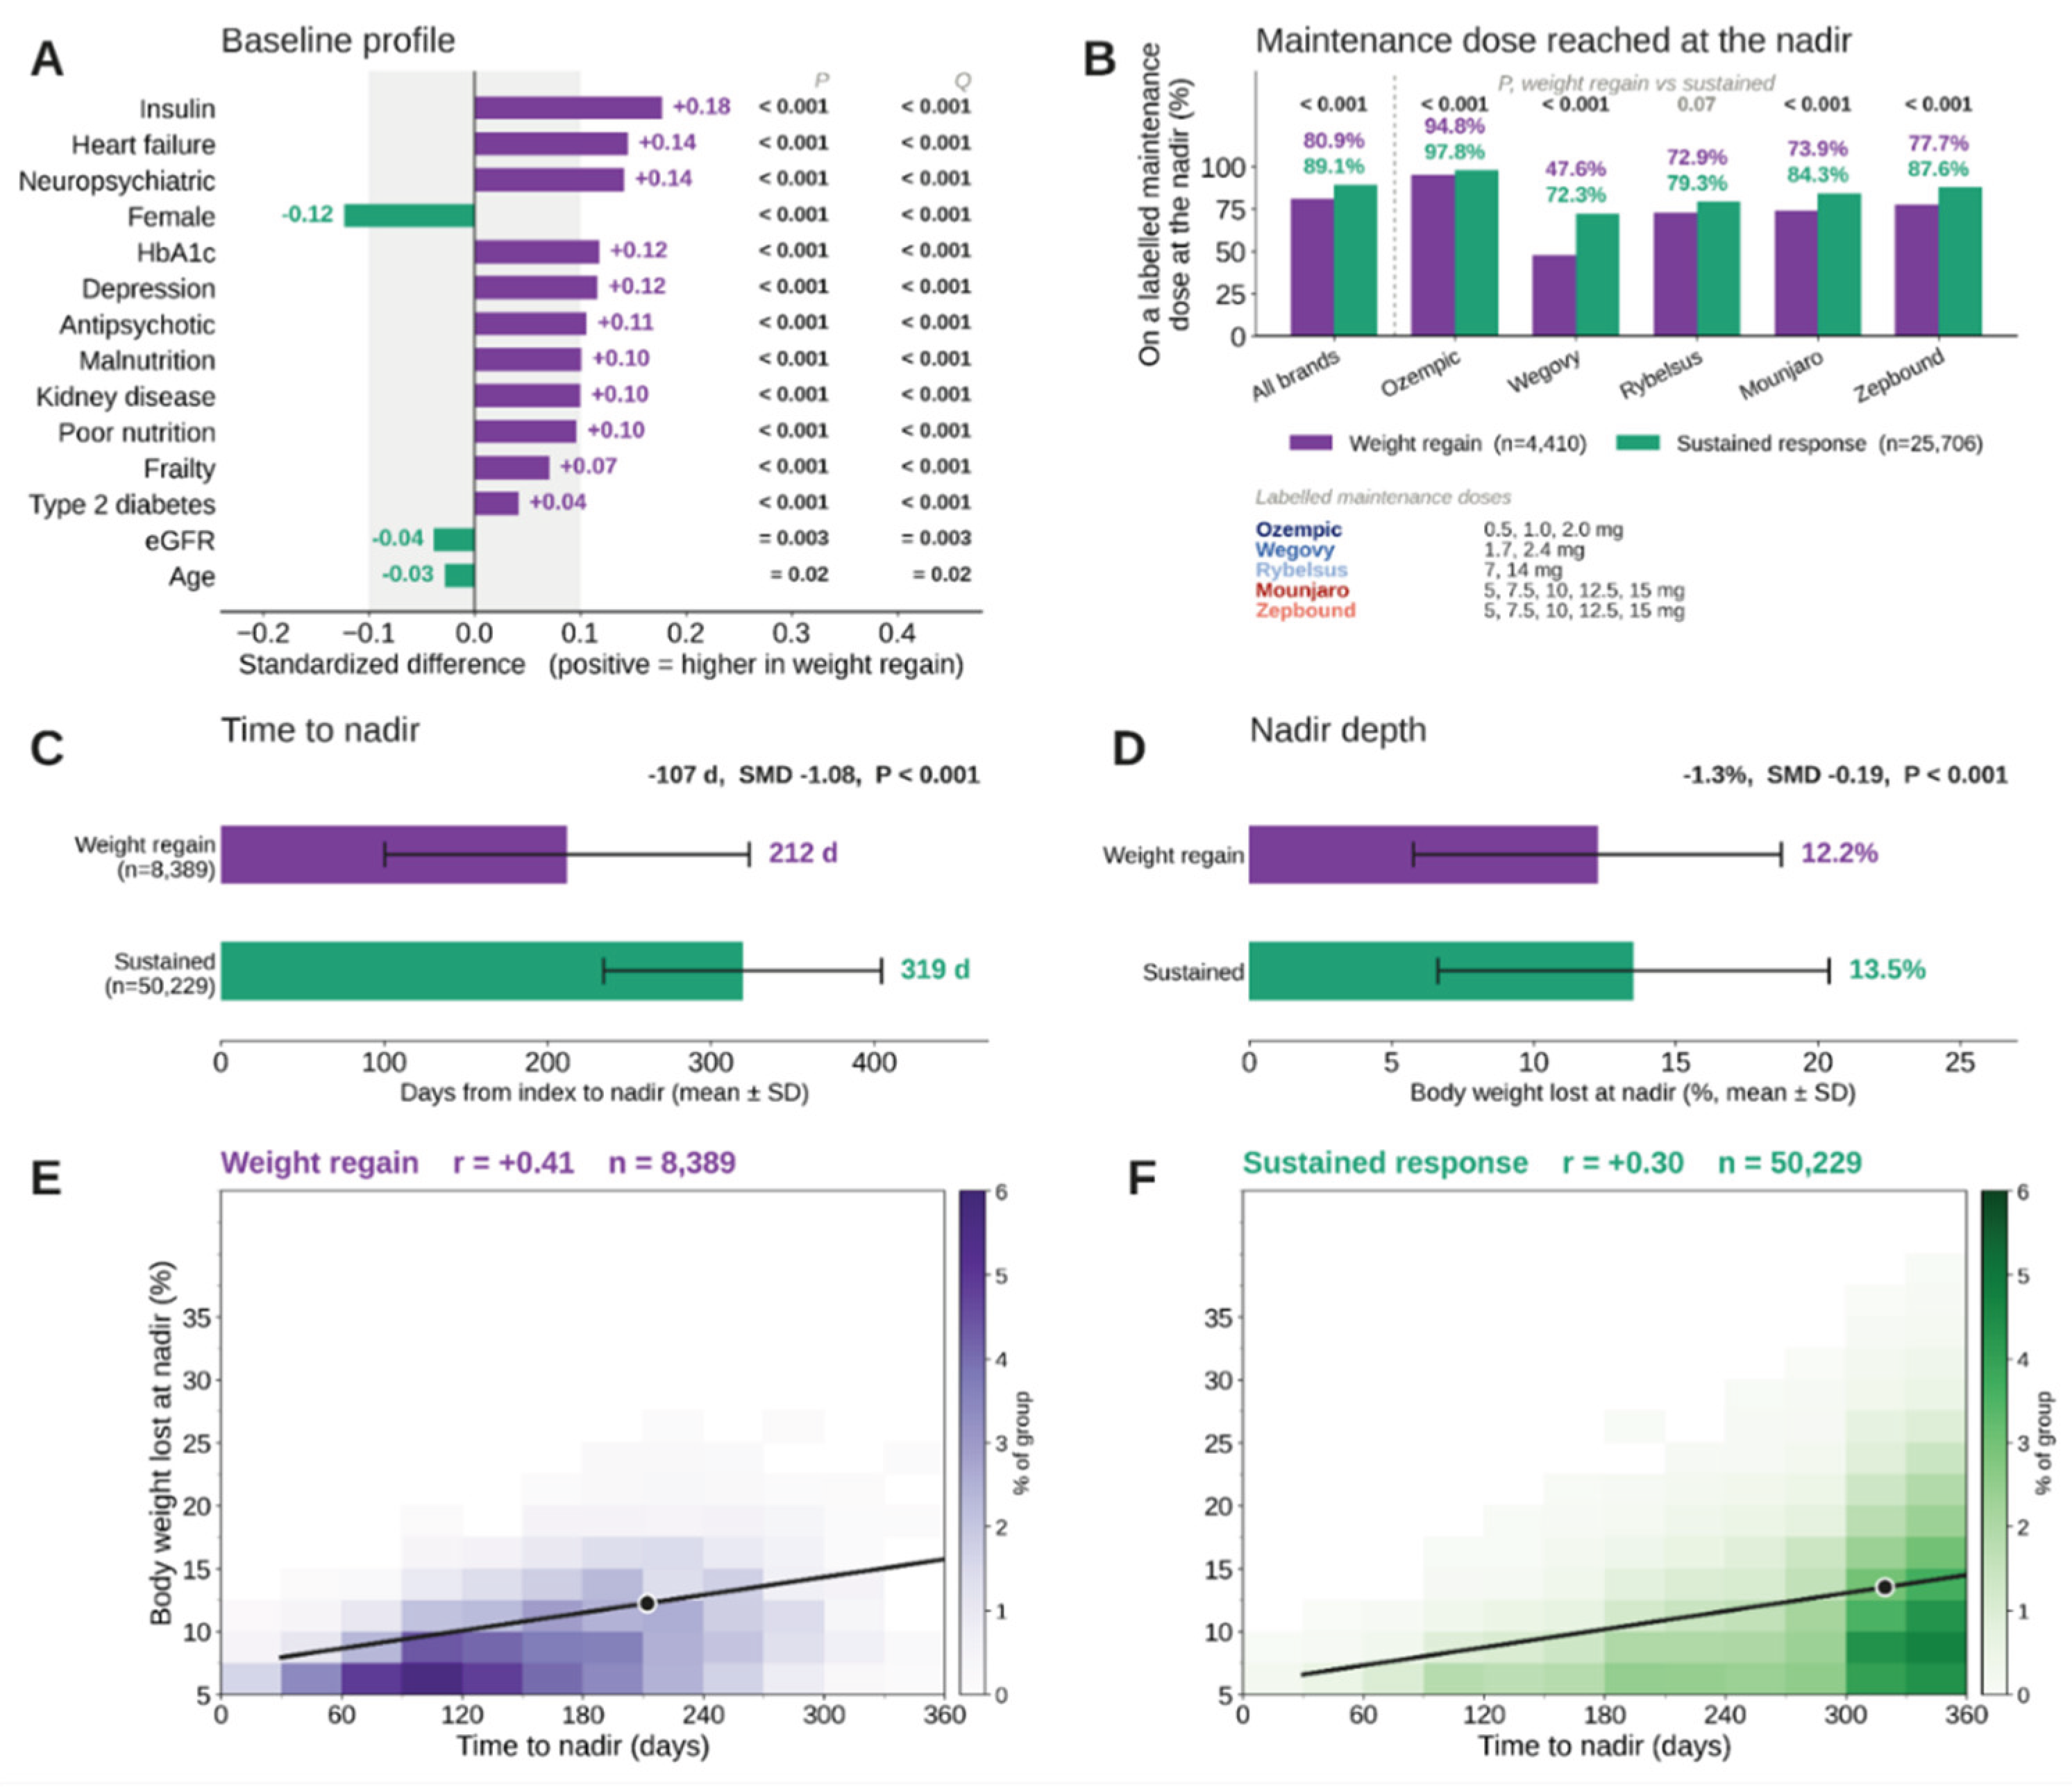
Figure 3.
Documented treatment and dose under two alignments. A patient counts as documented on treatment if a structured order or a positive mention of medication received extracted from clinical notes by AI-augmented curation falls within the preceding 90 days. A) Proportion documented on treatment measured from the index date and B) from each patient's own nadir, with P at each interval and the number remaining under observation beneath. C) Mean dose step from the index date and D) from the nadir, with 95% CIs; counts beneath denote patients with a resolvable dose at each point. Sustained responders reach the nadir 107 days later than patients with weight regain and therefore occupy an earlier position in their own treatment course at any fixed time after initiation, which accounts for the difference between the two alignments.
Figure 3.
Documented treatment and dose under two alignments. A patient counts as documented on treatment if a structured order or a positive mention of medication received extracted from clinical notes by AI-augmented curation falls within the preceding 90 days. A) Proportion documented on treatment measured from the index date and B) from each patient's own nadir, with P at each interval and the number remaining under observation beneath. C) Mean dose step from the index date and D) from the nadir, with 95% CIs; counts beneath denote patients with a resolvable dose at each point. Sustained responders reach the nadir 107 days later than patients with weight regain and therefore occupy an earlier position in their own treatment course at any fixed time after initiation, which accounts for the difference between the two alignments.
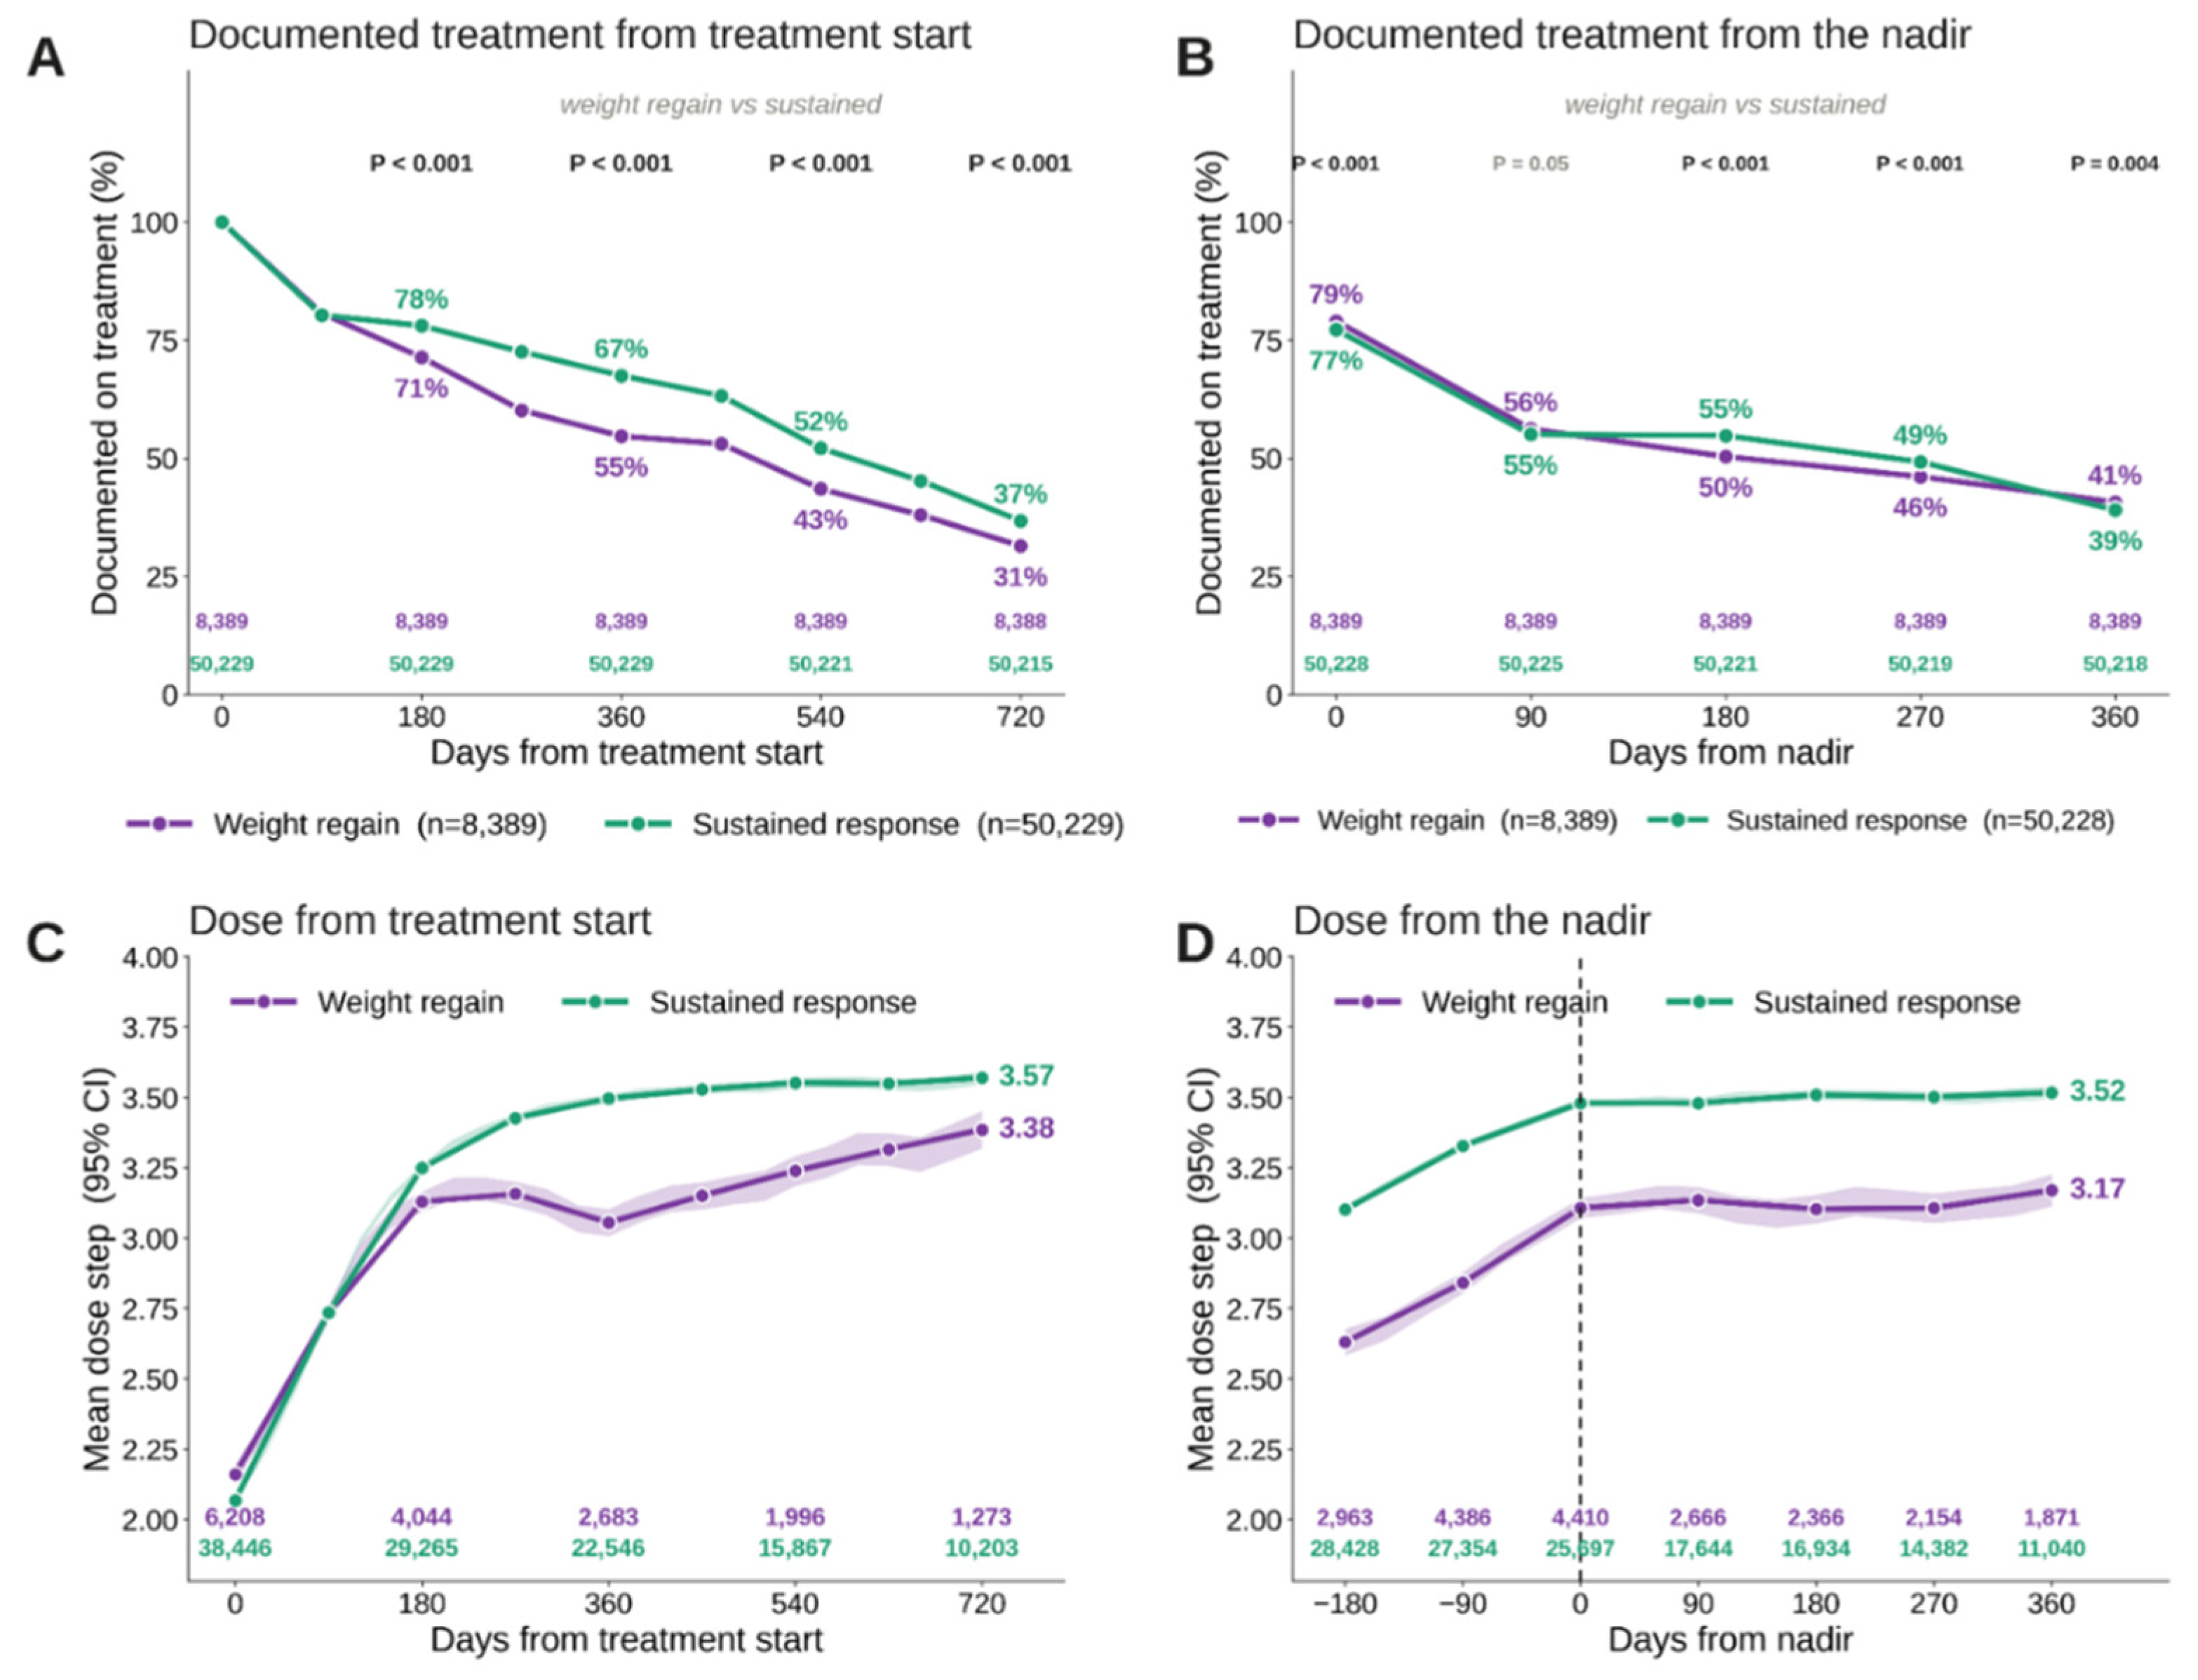
Figure 4.
Weight change and dose within post-nadir treatment documentation categories. Categories are defined from what the record shows after the nadir: documented on treatment for at least half of the observable window with maximum dose at or above the pre-nadir maximum; documented for less than half of that window; an alternate molecule documented at any point; and documented for at least half the window with maximum dose after the nadir below the pre-nadir maximum. Categories are shaded within each group's own hue, purple for weight regain and green for sustained response. A) Distribution of categories within each response group, with counts. B, C) Weight change from the nadir by category, with 95% CIs; category size and the proportion documented at 180 days appear in the legend, and the 180-day comparison of patients documented at a maintained dose against those documented for less than half the window is annotated. D, E) Mean dose step over time by category, with 95% CIs; patients documented for less than half the window are omitted because too few have a resolvable dose after the nadir to estimate a mean. Patients with fewer than 90 observable days after the nadir (192 weight regain, 2,977 sustained response) are excluded throughout.
Figure 4.
Weight change and dose within post-nadir treatment documentation categories. Categories are defined from what the record shows after the nadir: documented on treatment for at least half of the observable window with maximum dose at or above the pre-nadir maximum; documented for less than half of that window; an alternate molecule documented at any point; and documented for at least half the window with maximum dose after the nadir below the pre-nadir maximum. Categories are shaded within each group's own hue, purple for weight regain and green for sustained response. A) Distribution of categories within each response group, with counts. B, C) Weight change from the nadir by category, with 95% CIs; category size and the proportion documented at 180 days appear in the legend, and the 180-day comparison of patients documented at a maintained dose against those documented for less than half the window is annotated. D, E) Mean dose step over time by category, with 95% CIs; patients documented for less than half the window are omitted because too few have a resolvable dose after the nadir to estimate a mean. Patients with fewer than 90 observable days after the nadir (192 weight regain, 2,977 sustained response) are excluded throughout.
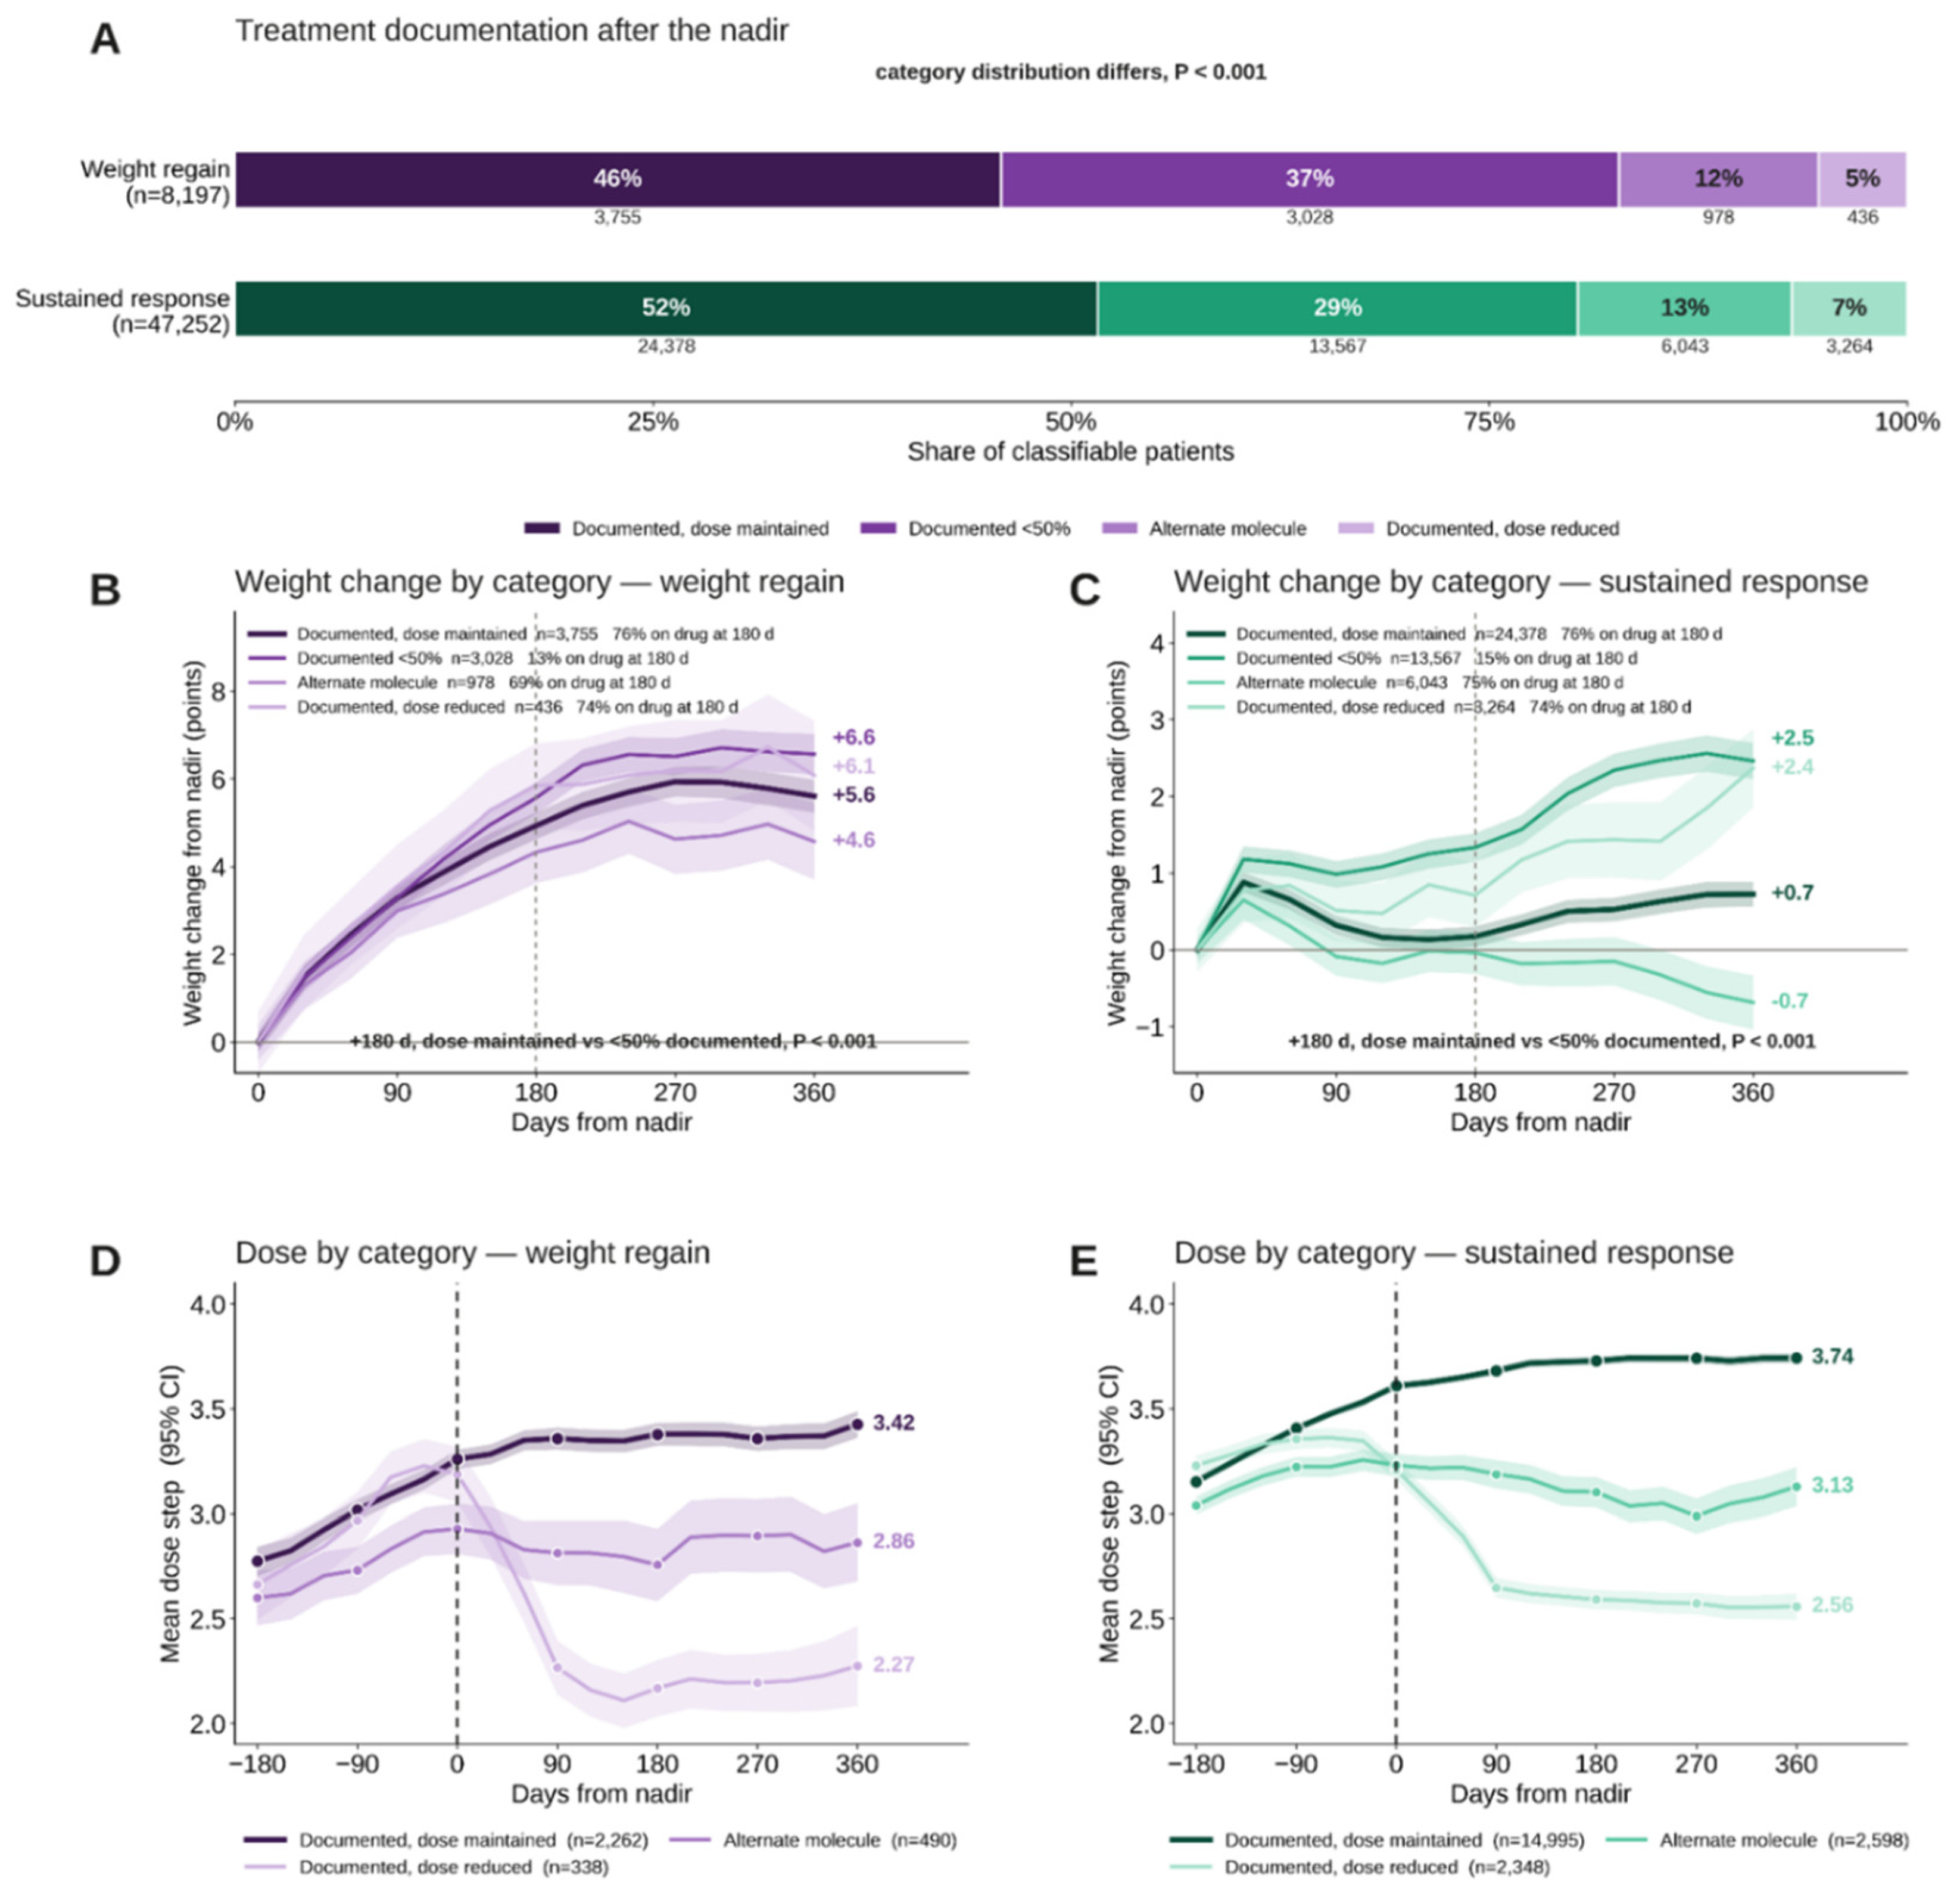
Figure 5.
Laboratory trajectories from the index date. A–L) Mean value with 95% CI for each of the twelve laboratory measures available throughout the network. Dotted lines mark reference interval bounds and shading covers the abnormal range; bounds falling outside the plotted window are not drawn, and shading indicates where a group mean lies outside the reference interval rather than the proportion of individual patients outside it. The number of patients in each group contributing a measurement at 360 days appears at bottom right of each panel, with P and Benjamini–Hochberg q for comparison at 360 days at bottom left. M–X) The same series expressed as change from each group's own value at initiation, with P and q for the comparison of change at 360 days. Referencing each group to its own baseline removes the difference present before treatment began. q values are computed separately within the absolute-value and relative-change blocks. The number of patients contributing varies across the window because laboratory tests are ordered for clinical reasons rather than at fixed intervals.
Figure 5.
Laboratory trajectories from the index date. A–L) Mean value with 95% CI for each of the twelve laboratory measures available throughout the network. Dotted lines mark reference interval bounds and shading covers the abnormal range; bounds falling outside the plotted window are not drawn, and shading indicates where a group mean lies outside the reference interval rather than the proportion of individual patients outside it. The number of patients in each group contributing a measurement at 360 days appears at bottom right of each panel, with P and Benjamini–Hochberg q for comparison at 360 days at bottom left. M–X) The same series expressed as change from each group's own value at initiation, with P and q for the comparison of change at 360 days. Referencing each group to its own baseline removes the difference present before treatment began. q values are computed separately within the absolute-value and relative-change blocks. The number of patients contributing varies across the window because laboratory tests are ordered for clinical reasons rather than at fixed intervals.
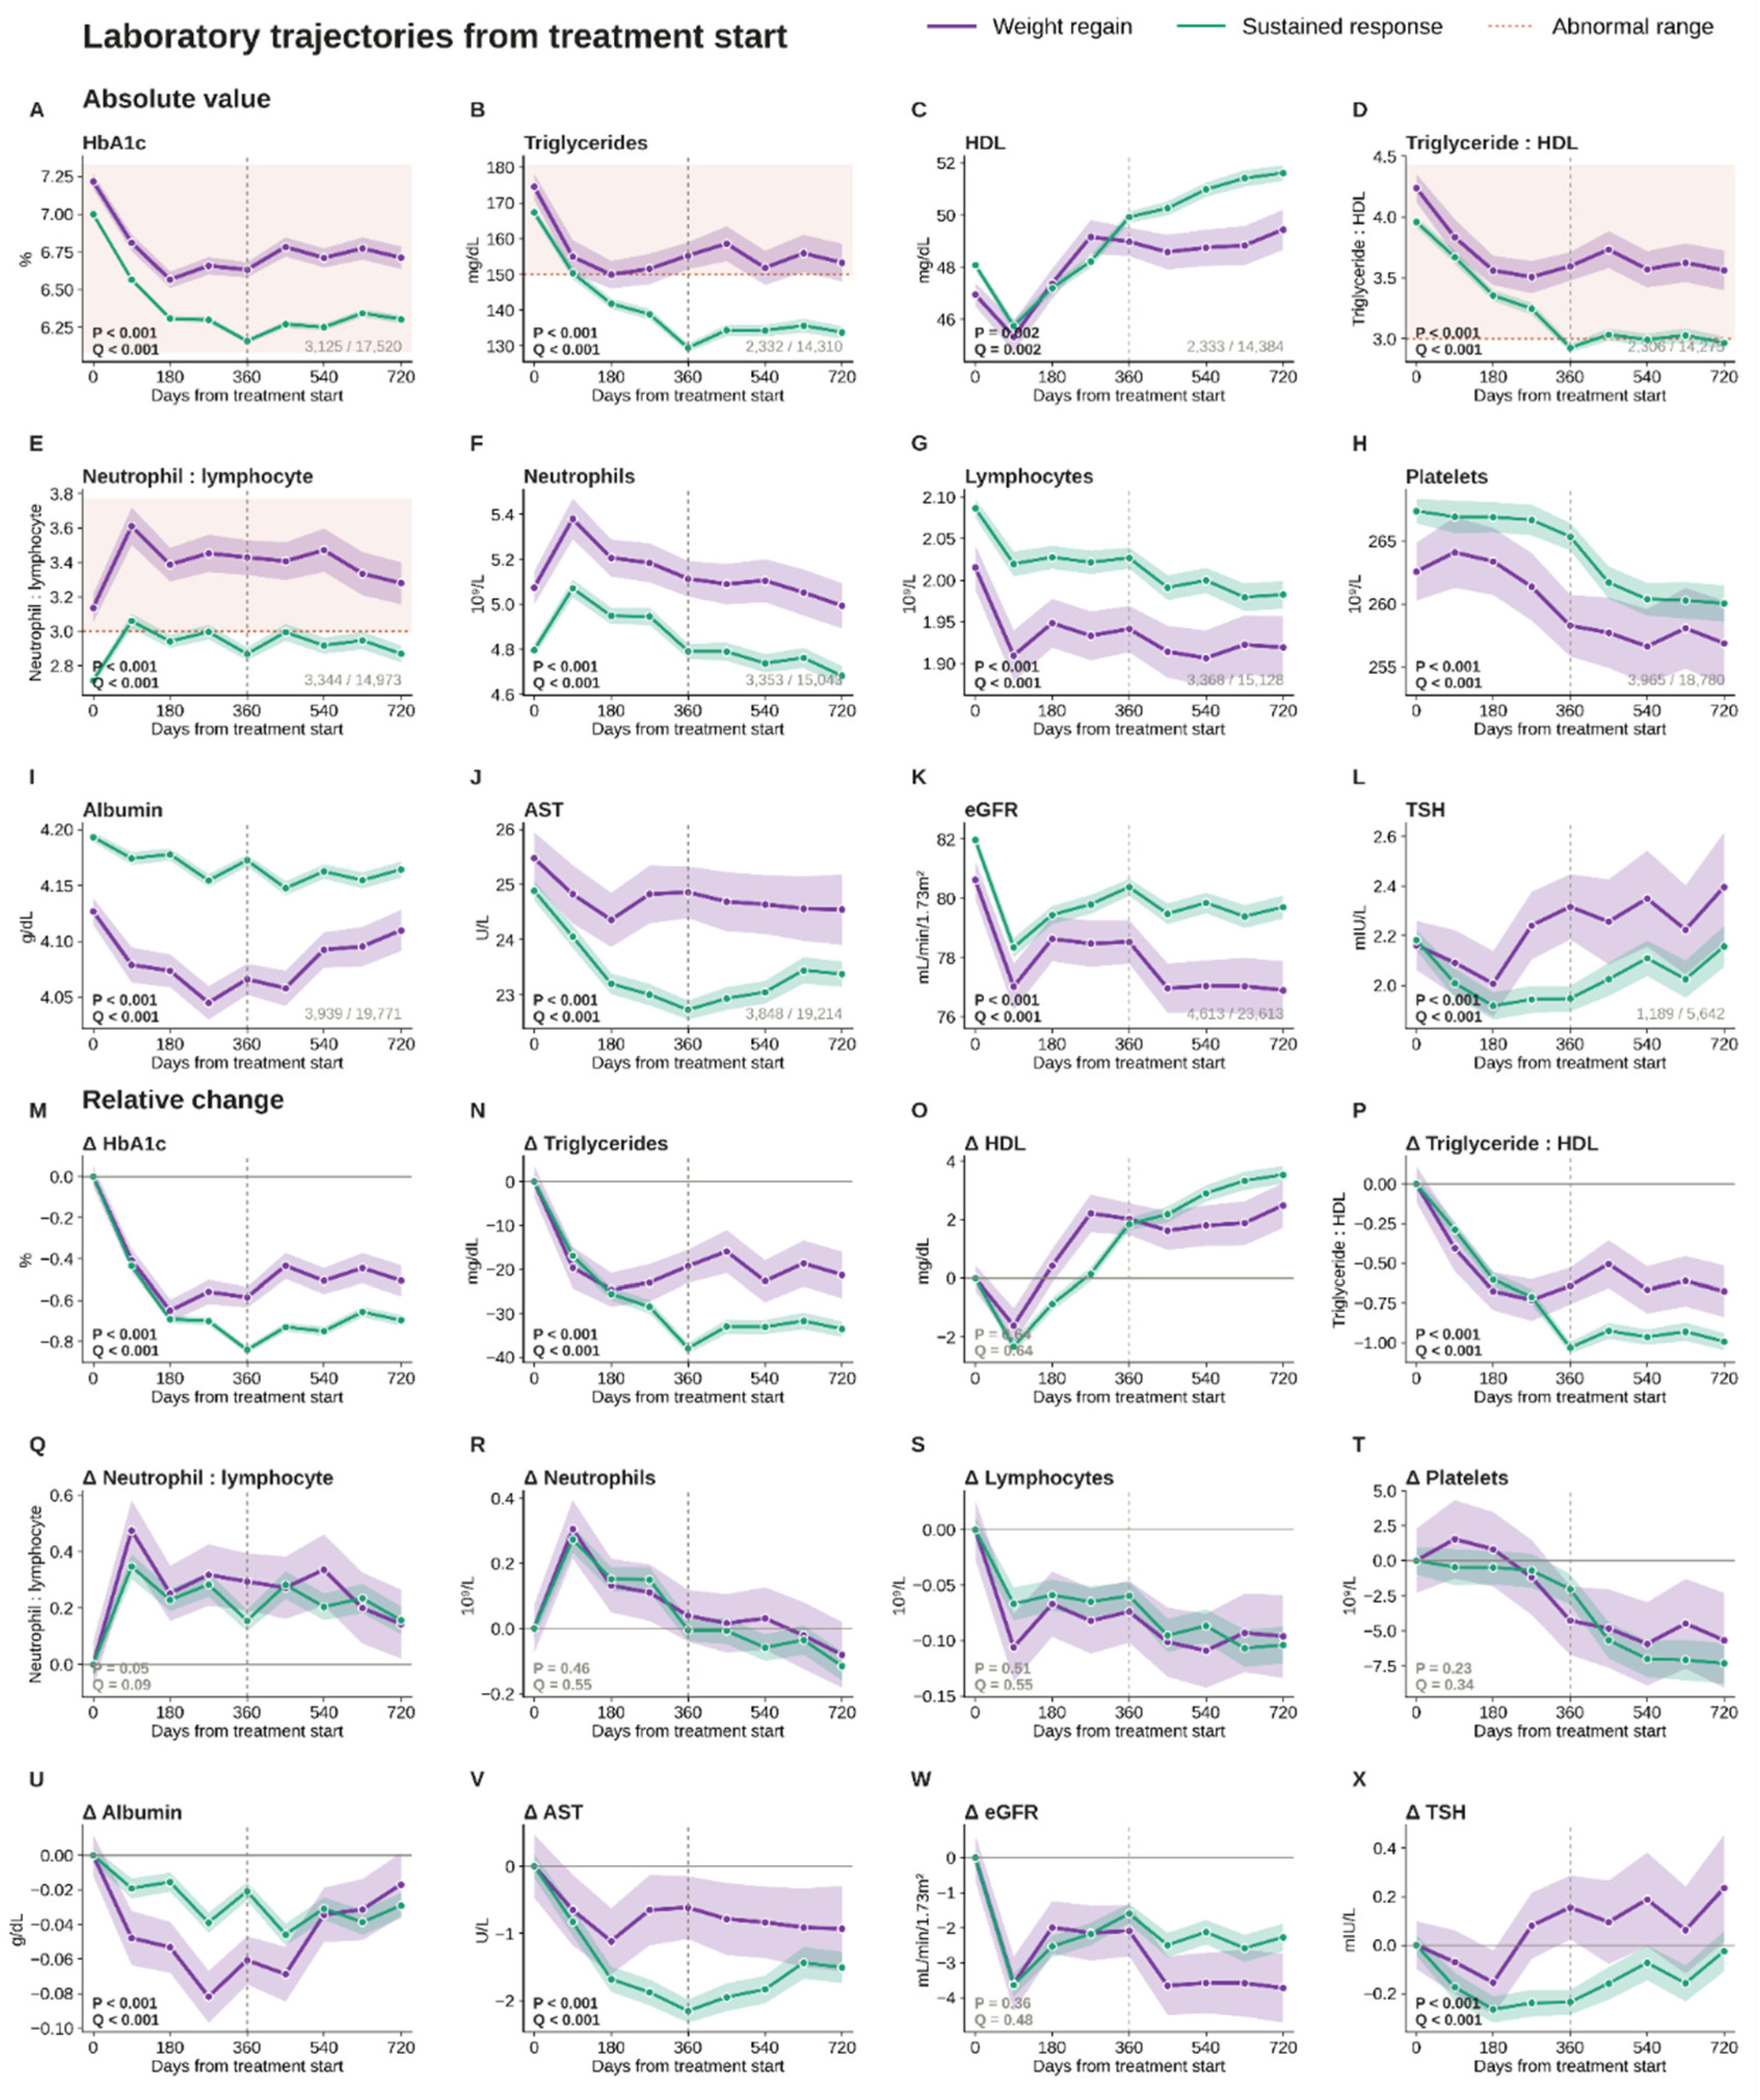
Figure 6.
Laboratory trajectories around the nadir. A–L) Mean value with 95% CI for the same twelve measures, aligned on each patient's own nadir, with reference intervals annotated as in Fig. 5 and P and q for the comparison at the nadir. M–X) The same series expressed as change from each group's value at the index date, with P and q for the comparison of change at the nadir; the reference point matches Fig. 5, so the two sets of change panels can be read against each other. Because the horizontal axis is nadir-relative while the reference point is the index date, the value plotted at −360 days already incorporates change accrued during treatment.
Figure 6.
Laboratory trajectories around the nadir. A–L) Mean value with 95% CI for the same twelve measures, aligned on each patient's own nadir, with reference intervals annotated as in Fig. 5 and P and q for the comparison at the nadir. M–X) The same series expressed as change from each group's value at the index date, with P and q for the comparison of change at the nadir; the reference point matches Fig. 5, so the two sets of change panels can be read against each other. Because the horizontal axis is nadir-relative while the reference point is the index date, the value plotted at −360 days already incorporates change accrued during treatment.
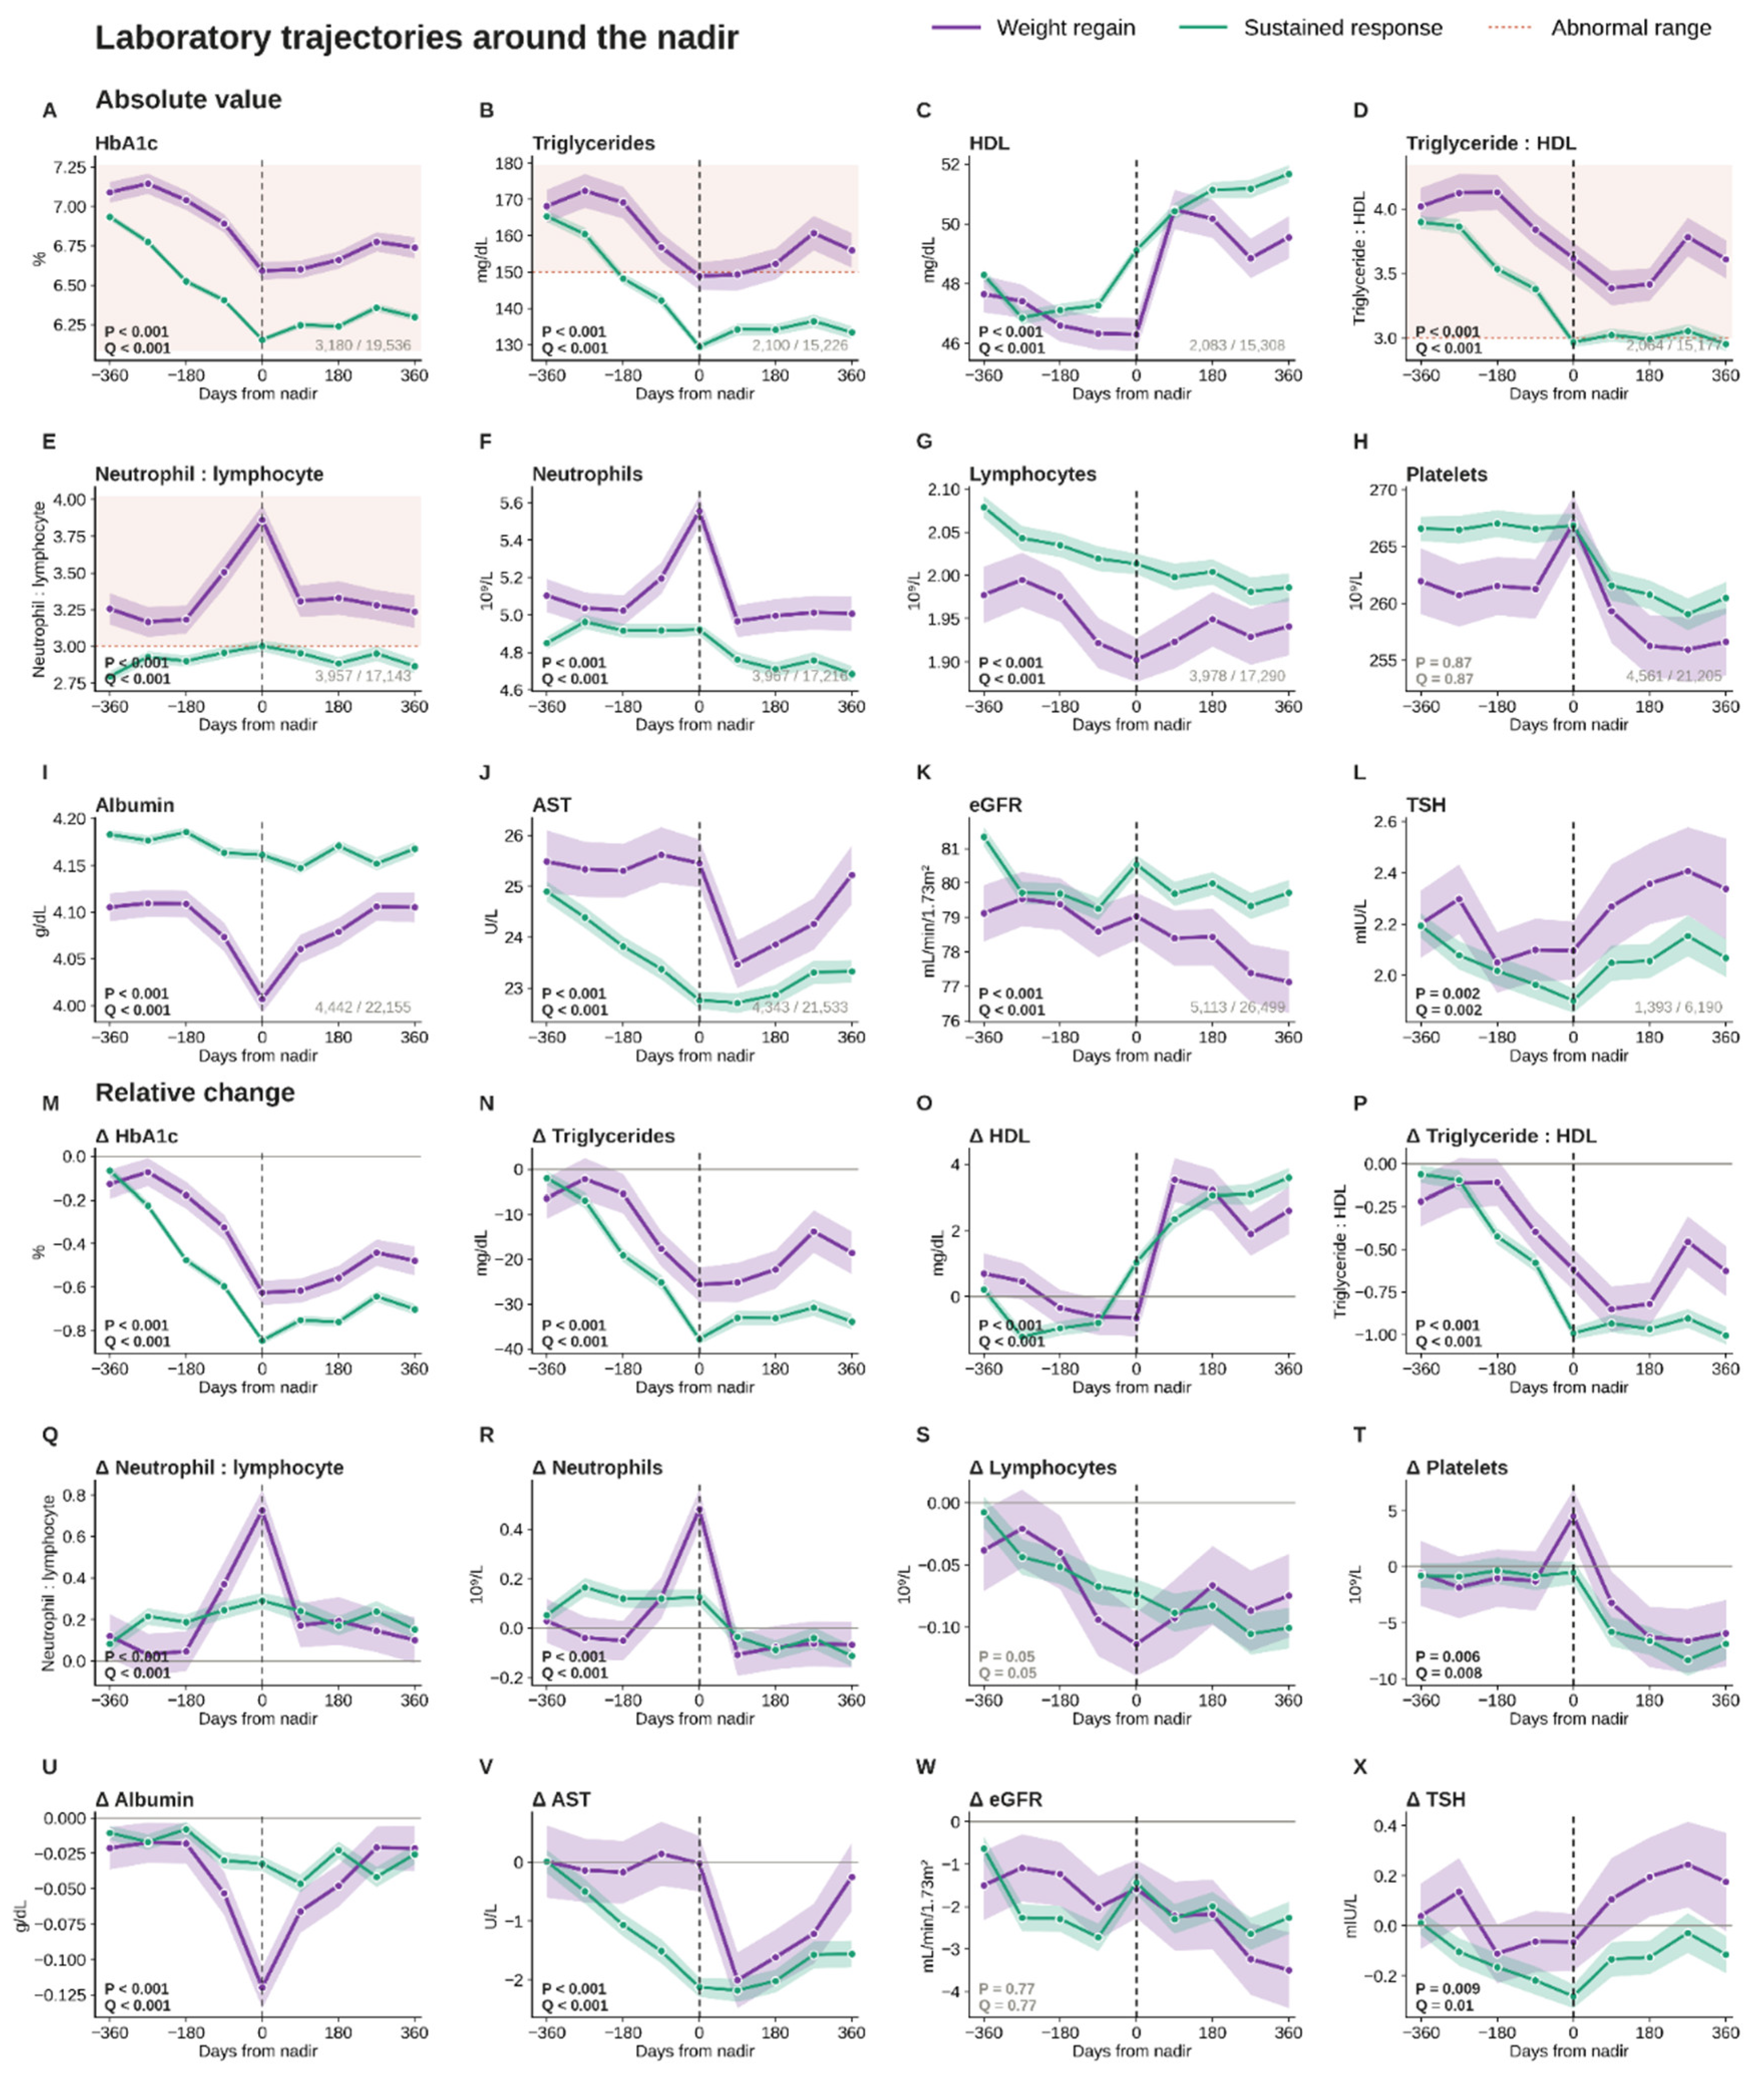
Figure 7.
Laboratory trajectories around the nadir among patients documented on treatment at a maintained dose. As Figure 6, restricted to patients documented on treatment for at least half of the observable post-nadir window with maximum dose at or above the pre-nadir maximum, in both response groups. A–L) Mean value with 95% CI, aligned on the nadir, with P and q for the comparison at the nadir. M–X) Change from each group's value at the index date, with P and q for the comparison of change at the nadir.
Figure 7.
Laboratory trajectories around the nadir among patients documented on treatment at a maintained dose. As Figure 6, restricted to patients documented on treatment for at least half of the observable post-nadir window with maximum dose at or above the pre-nadir maximum, in both response groups. A–L) Mean value with 95% CI, aligned on the nadir, with P and q for the comparison at the nadir. M–X) Change from each group's value at the index date, with P and q for the comparison of change at the nadir.
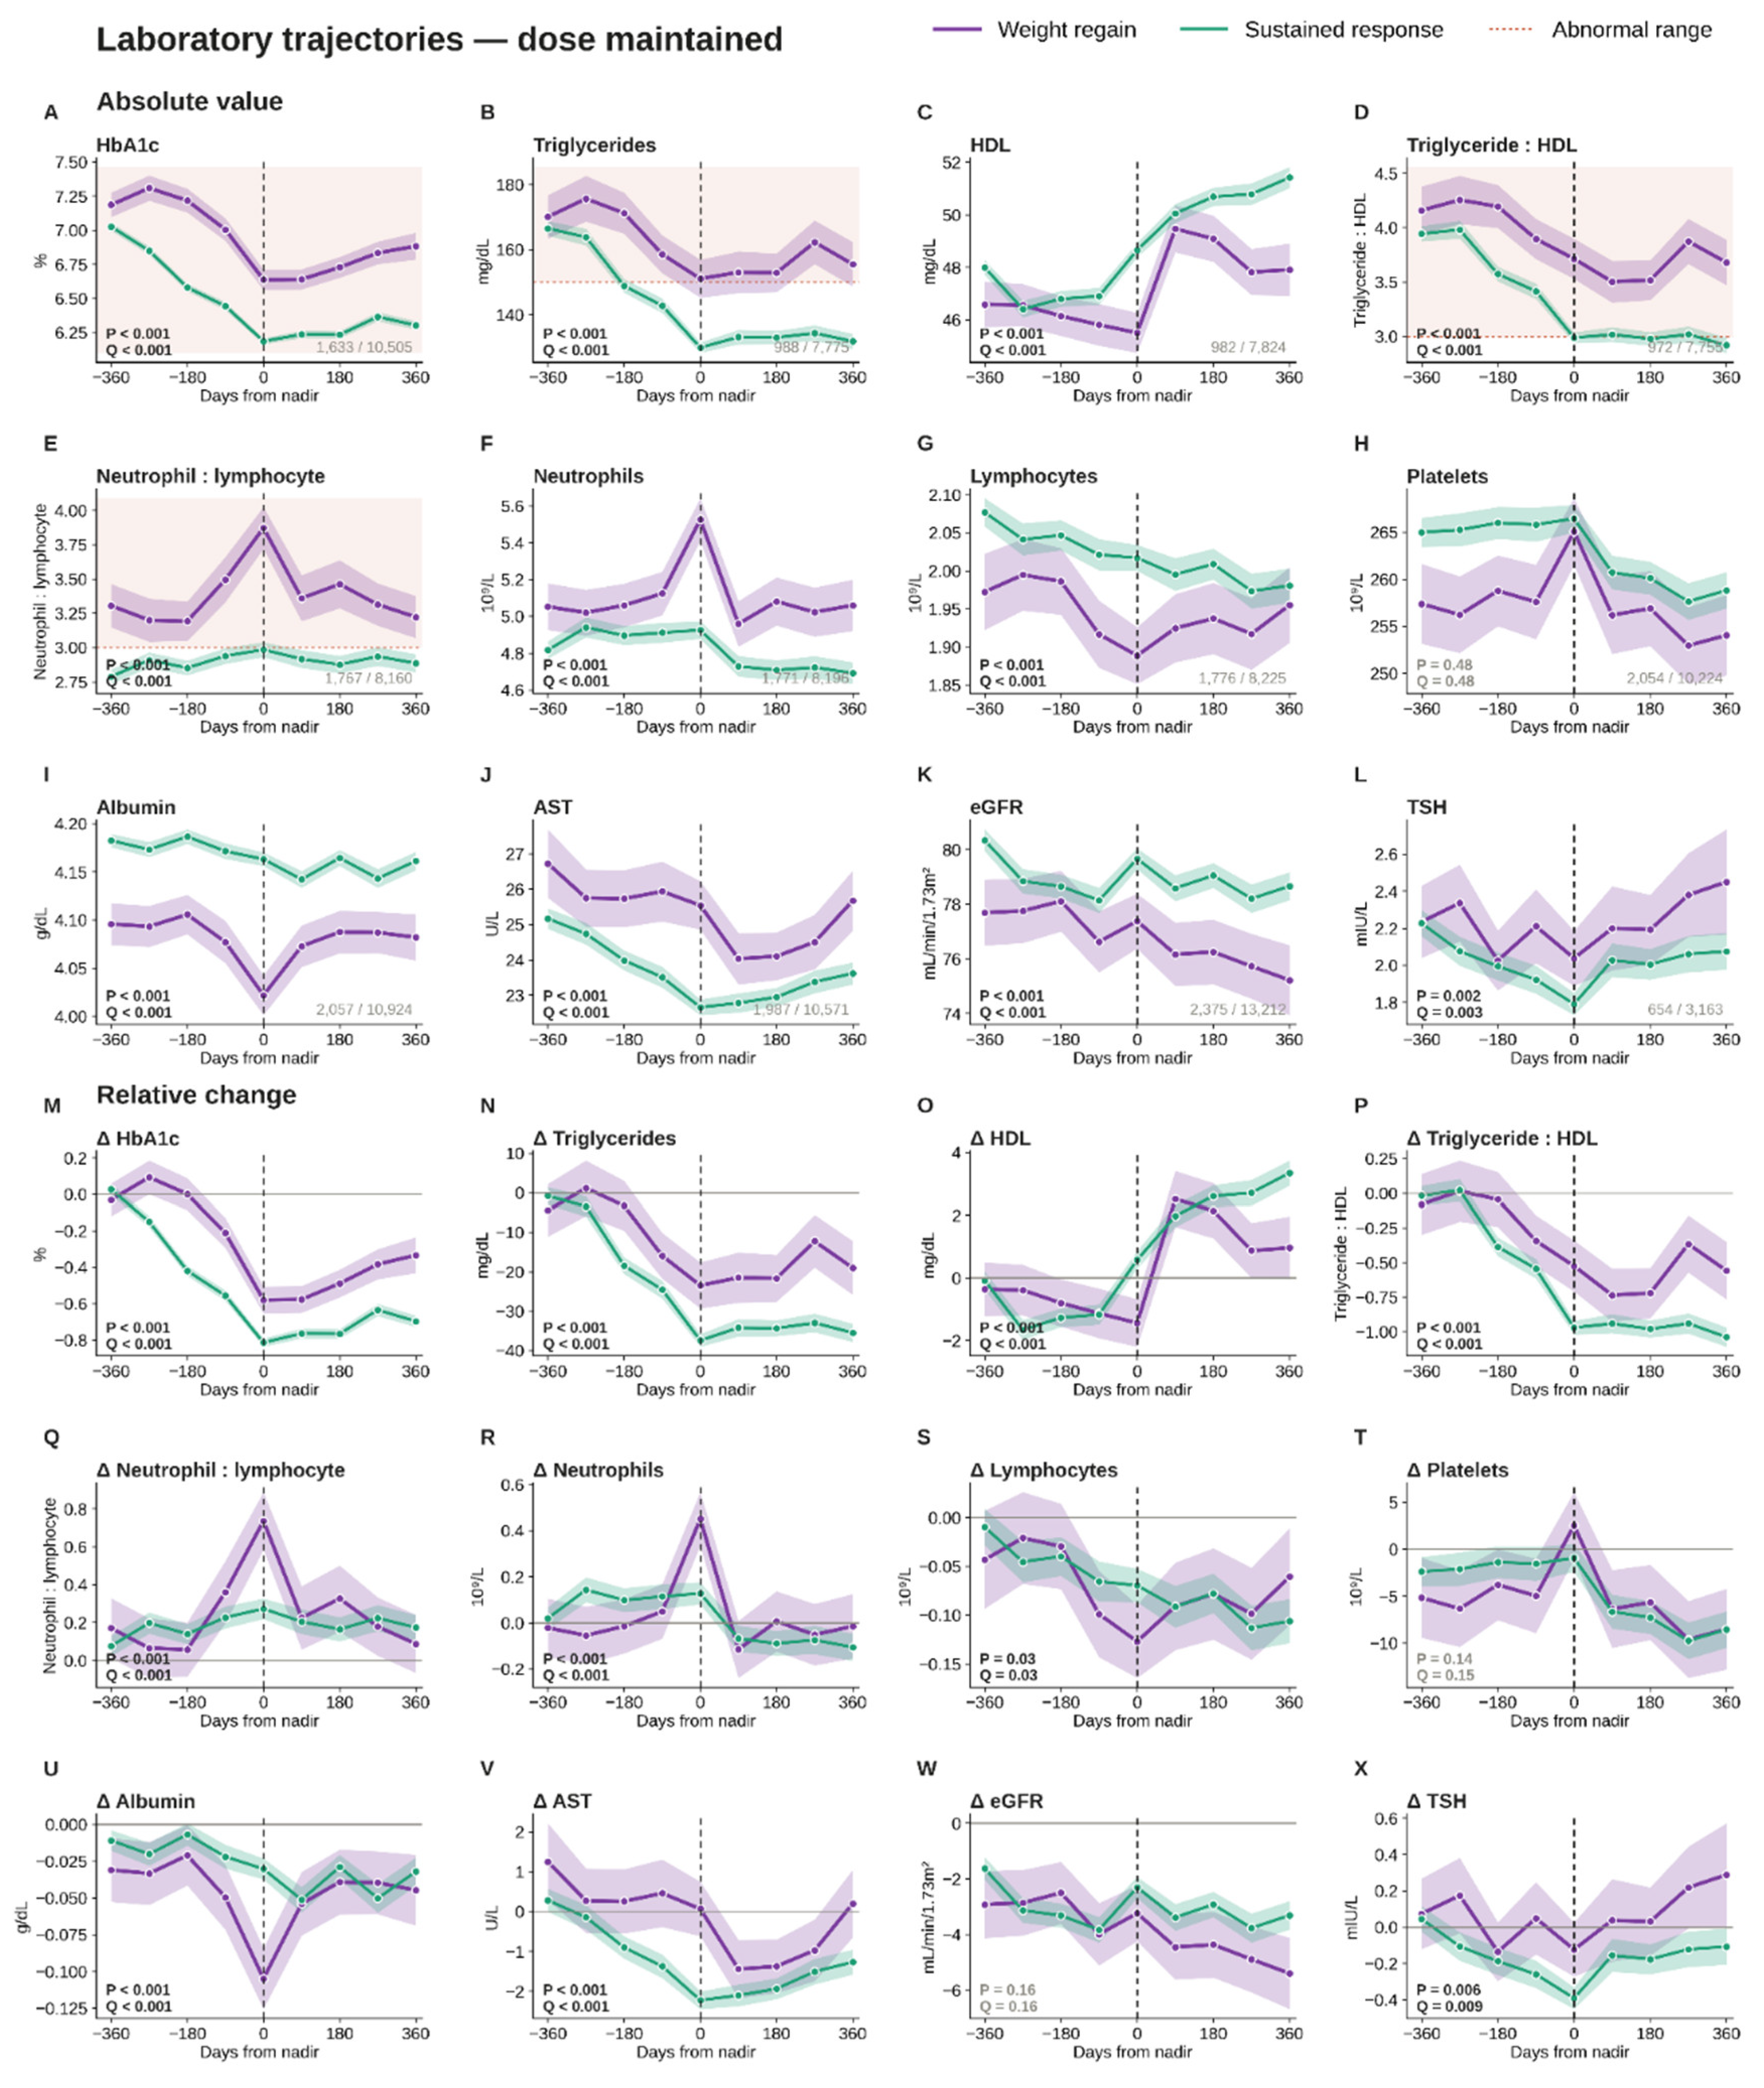
Figure 8.
Gastrointestinal diagnoses in relation to the nadir. A, B) Proportion of patients with any gastrointestinal diagnosis and with a serious gastrointestinal diagnosis in each 90-day interval measured from the index date. C, D) The same two measures aligned on each patient's own nadir. Proportions are annotated at every interval with P above. Serious diagnoses comprise pancreatitis, biliary disease, bowel obstruction, gastroparesis, perforation, and gastrointestinal bleeding. E, F) Gastrointestinal burden accrued between the index date and the nadir, compared between patients whose treatment documentation subsequently continued at a maintained dose and those documented for less than half the post-nadir window, within the weight-regain group and the sustained-response group respectively; both bars in each panel come from the same response group, so shading follows that group's hue. P and Benjamini–Hochberg q are shown above each pair.
Figure 8.
Gastrointestinal diagnoses in relation to the nadir. A, B) Proportion of patients with any gastrointestinal diagnosis and with a serious gastrointestinal diagnosis in each 90-day interval measured from the index date. C, D) The same two measures aligned on each patient's own nadir. Proportions are annotated at every interval with P above. Serious diagnoses comprise pancreatitis, biliary disease, bowel obstruction, gastroparesis, perforation, and gastrointestinal bleeding. E, F) Gastrointestinal burden accrued between the index date and the nadir, compared between patients whose treatment documentation subsequently continued at a maintained dose and those documented for less than half the post-nadir window, within the weight-regain group and the sustained-response group respectively; both bars in each panel come from the same response group, so shading follows that group's hue. P and Benjamini–Hochberg q are shown above each pair.
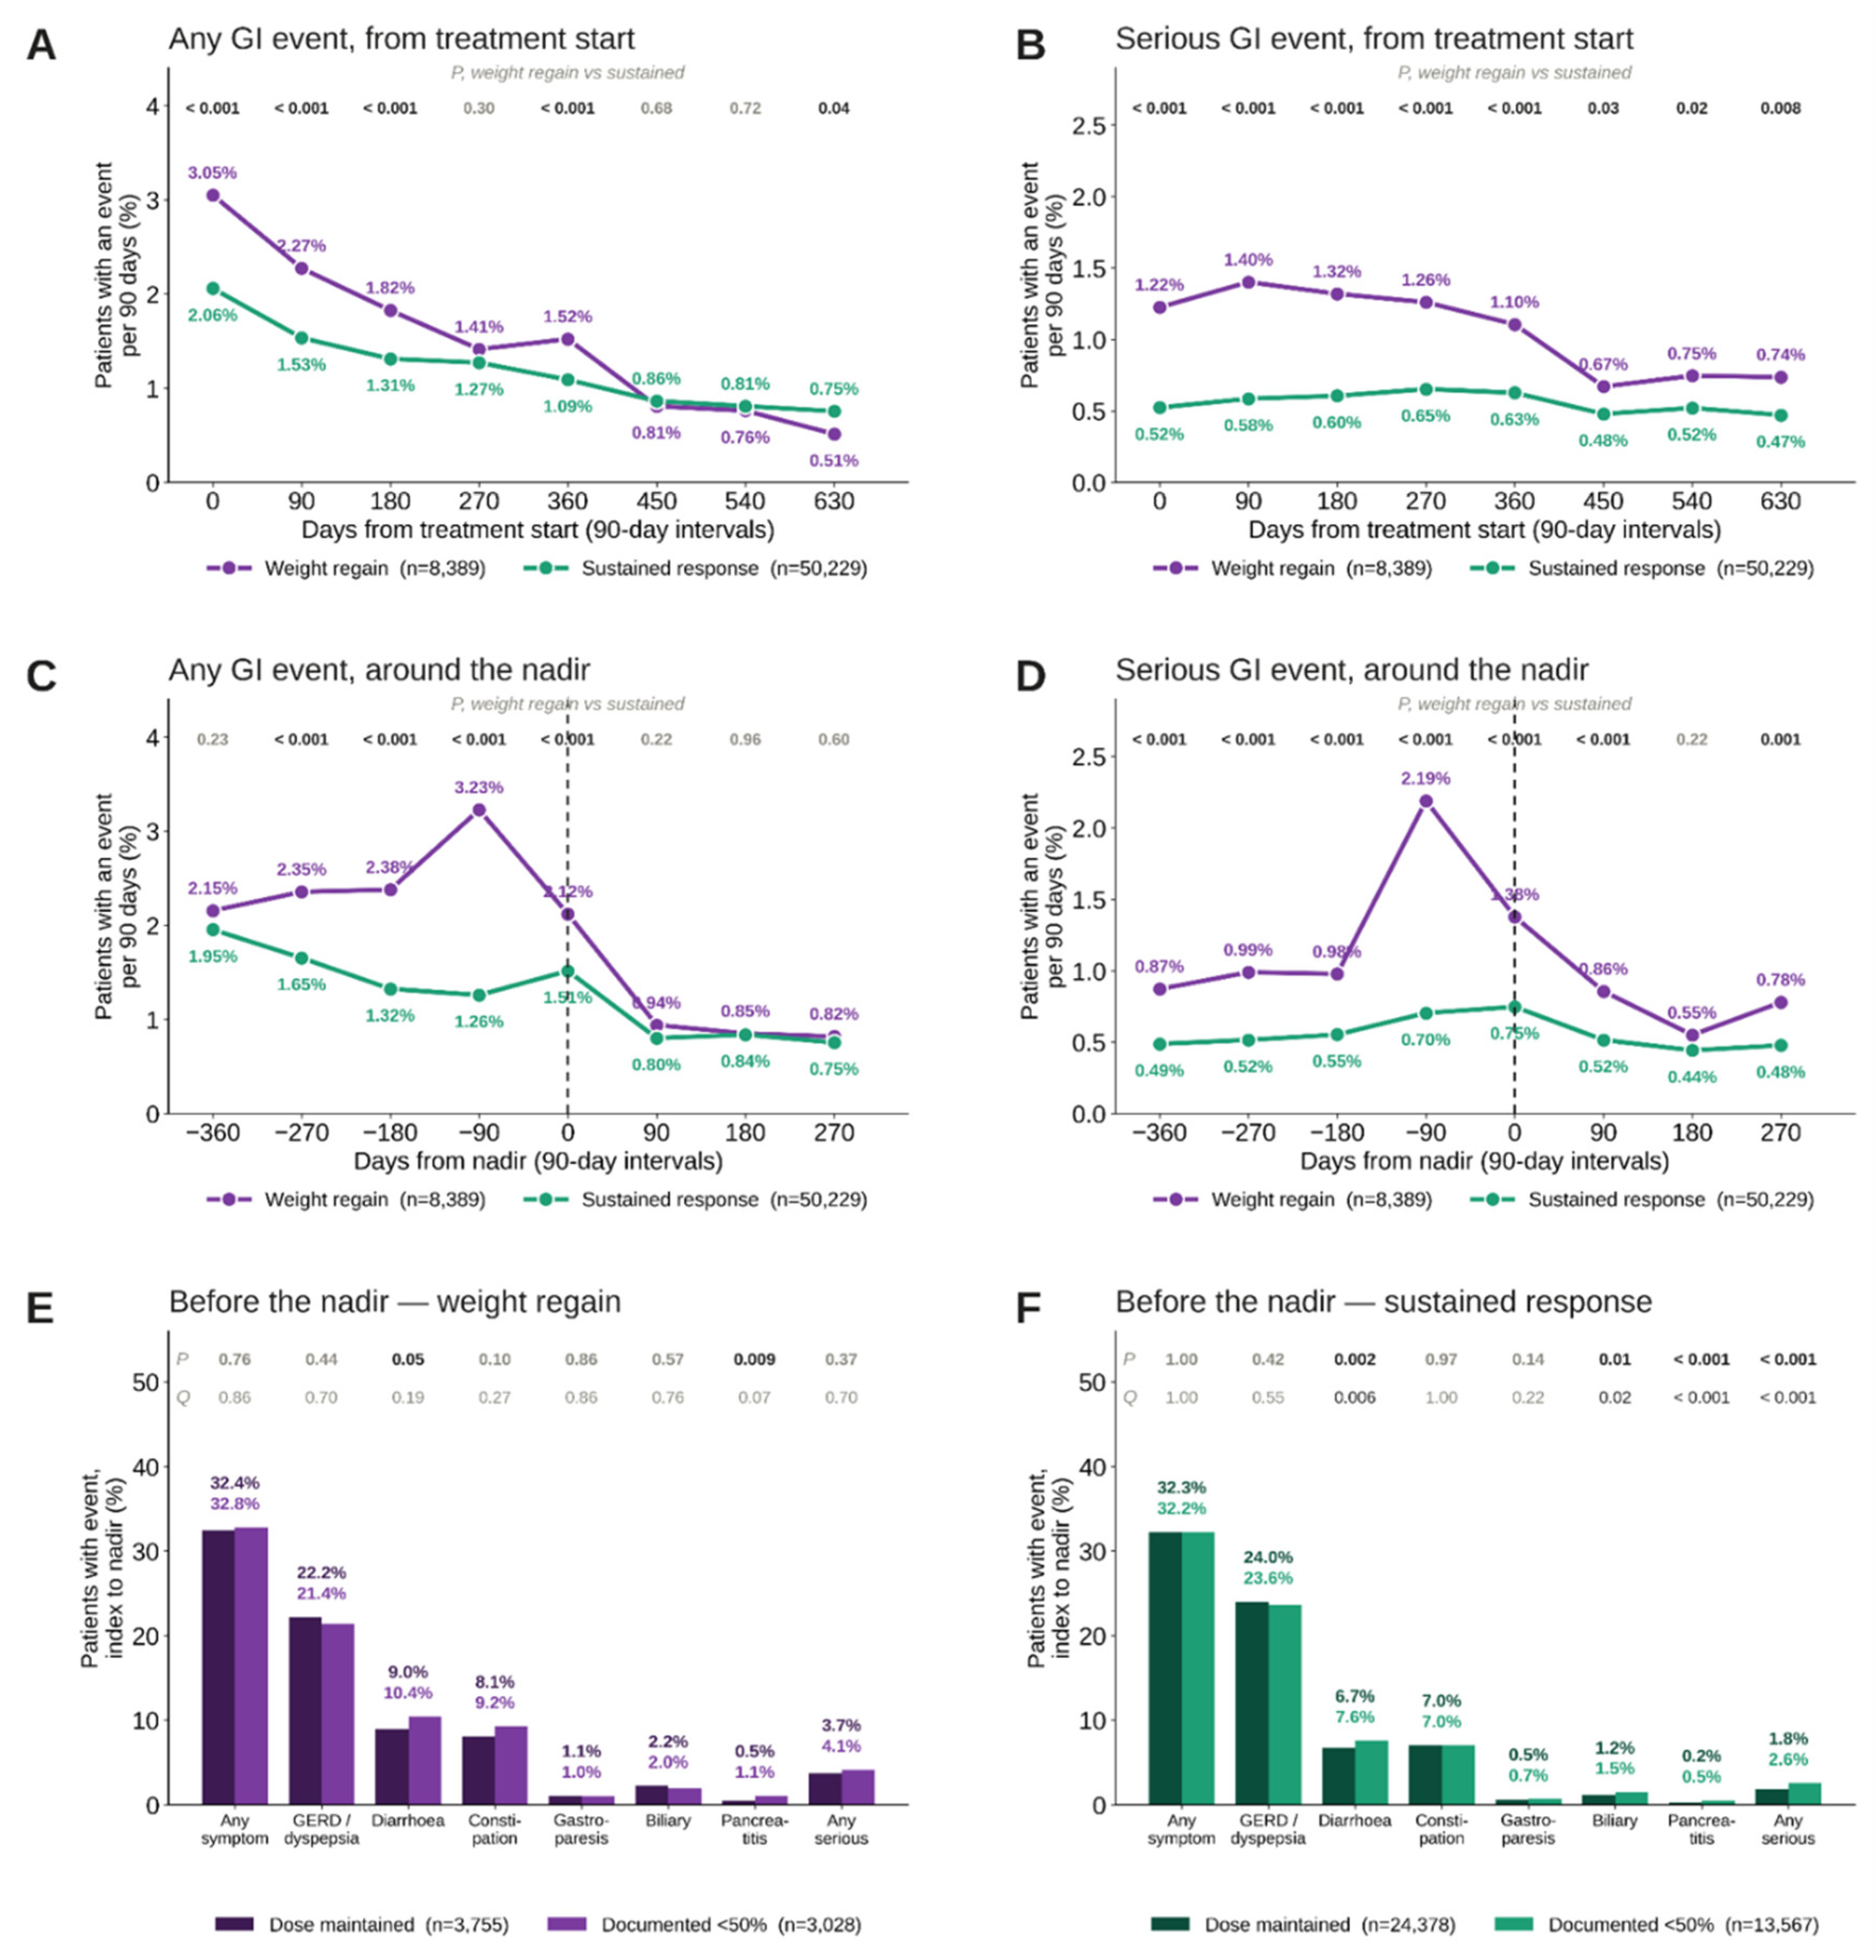
Figure 9.
Infection and allergy diagnoses in relation to the nadir. A) Diagnoses per 1,000 person-years between the index date and the nadir. Bold labels denote the composite sets, which are the union of their component diagnoses. B) Incidence rate ratio for weight regain against sustained response, with 95% CIs, P, and Benjamini–Hochberg q across the ten categories shown. C, D) Percentage of patients with any infection diagnosis in each 90-day interval measured from the index date and from each patient's own nadir, with the value annotated at every interval and P above.
Figure 9.
Infection and allergy diagnoses in relation to the nadir. A) Diagnoses per 1,000 person-years between the index date and the nadir. Bold labels denote the composite sets, which are the union of their component diagnoses. B) Incidence rate ratio for weight regain against sustained response, with 95% CIs, P, and Benjamini–Hochberg q across the ten categories shown. C, D) Percentage of patients with any infection diagnosis in each 90-day interval measured from the index date and from each patient's own nadir, with the value annotated at every interval and P above.
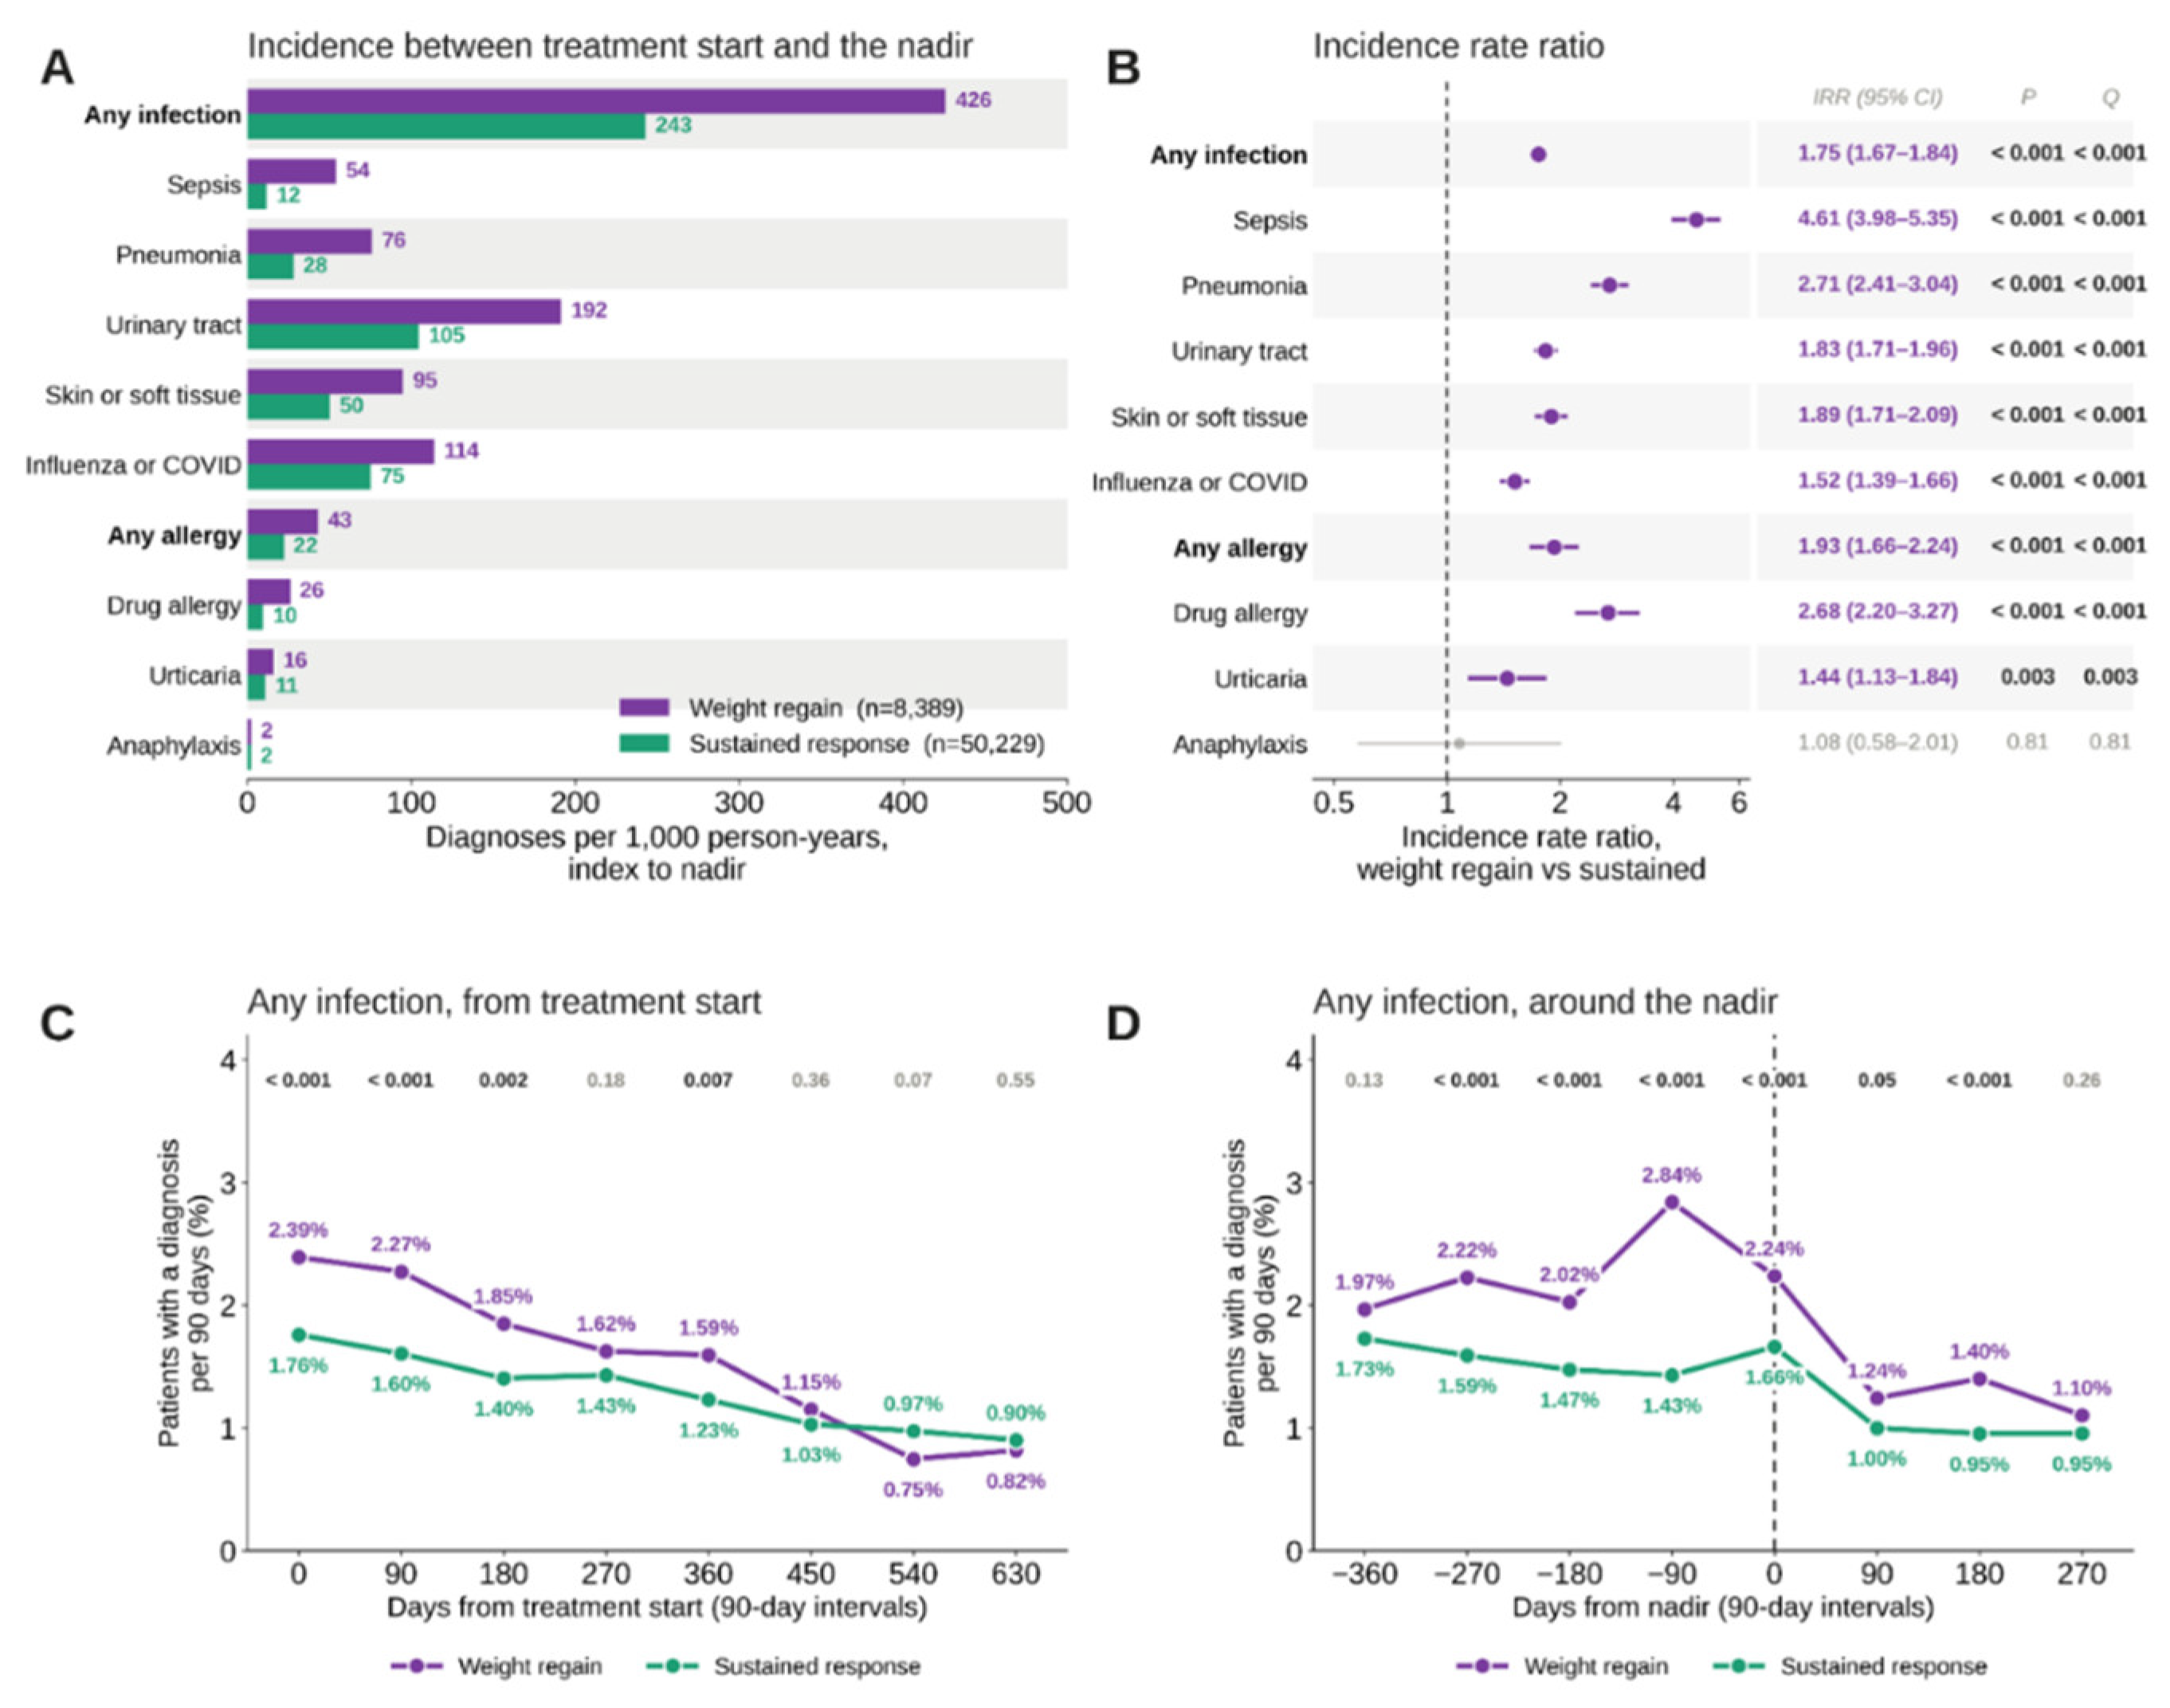
Figure 10.
Weight status reassessed at 90-day intervals and event rates within each status. A) Proportion of person-time spent in each weight status by interval from the index date. Status is assigned at the start of each interval from the most recent weight at least 30 days earlier, measured against the patient's running minimum: pre-response before 5% loss is achieved, maintained loss within 5 percentage points of that minimum, and regained 5 or more percentage points above it. The running minimum updates as follow-up proceeds, so patients move between statuses in both directions. Unclassified time denotes person-time with no usable weight in the preceding window and is excluded from the rate comparisons. B) Crude event rates per 1,000 person-years within each status. C) Adjusted rate ratios for regained against maintained-loss time, from a Poisson model using log person-time as an offset with terms for 90-day interval, brand, and age stratum, with P and Benjamini–Hochberg q.
Figure 10.
Weight status reassessed at 90-day intervals and event rates within each status. A) Proportion of person-time spent in each weight status by interval from the index date. Status is assigned at the start of each interval from the most recent weight at least 30 days earlier, measured against the patient's running minimum: pre-response before 5% loss is achieved, maintained loss within 5 percentage points of that minimum, and regained 5 or more percentage points above it. The running minimum updates as follow-up proceeds, so patients move between statuses in both directions. Unclassified time denotes person-time with no usable weight in the preceding window and is excluded from the rate comparisons. B) Crude event rates per 1,000 person-years within each status. C) Adjusted rate ratios for regained against maintained-loss time, from a Poisson model using log person-time as an offset with terms for 90-day interval, brand, and age stratum, with P and Benjamini–Hochberg q.
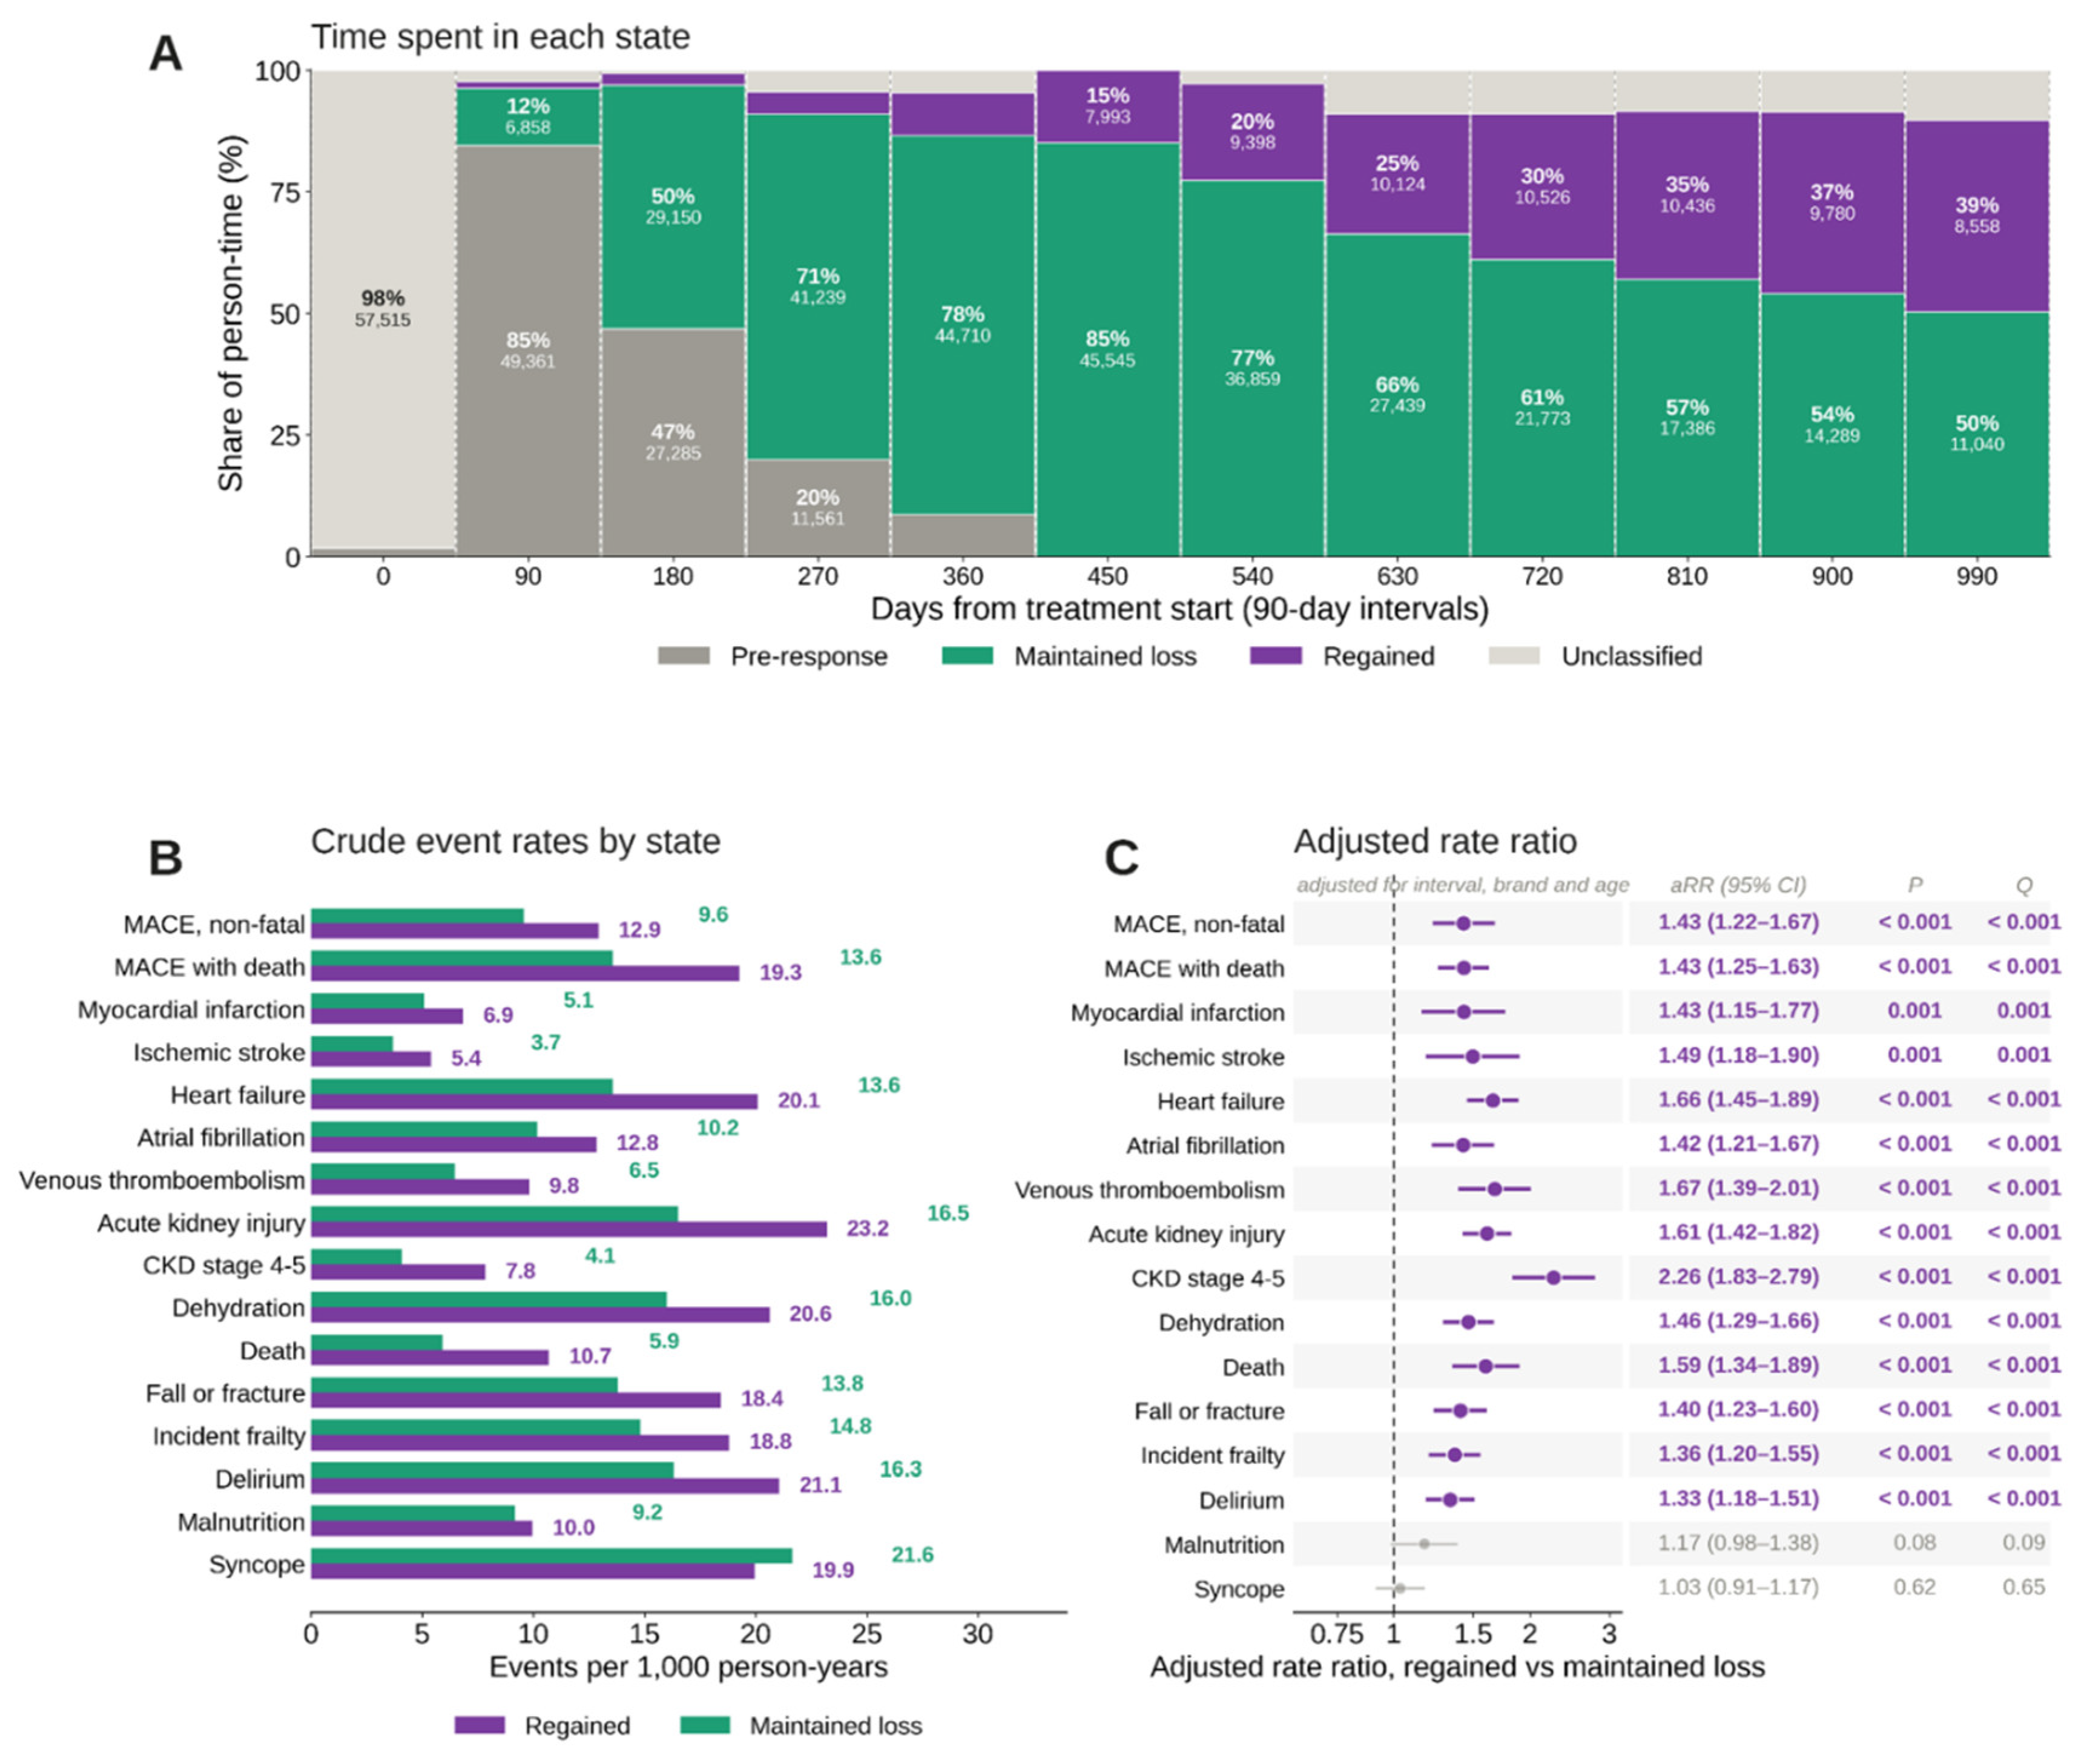
Table 1.
Baseline characteristics of patients with weight regain versus sustained response.
| Characteristic | Metric | Weight regain | n | Sustained response | n | SMD | P | Q |
| Age, y | mean (SD) | 54.5 (14.8) | 8,389 | 54.9 (13.9) | 43,771 | -0.03 | 0.02 | 0.02 |
| Female sex | n (%) | 5,459 (65.1) | 8,389 | 31,007 (70.8) | 43,771 | -0.12 | <0.001 | <0.001 |
| HbA1c, % | mean (SD) | 7.0 (1.9) | 6,270 | 6.8 (1.6) | 37,574 | +0.12 | <0.001 | <0.001 |
| eGFR, mL/min/1.73 m² | mean (SD) | 83.0 (24.2) | 7,651 | 83.9 (22.0) | 45,348 | -0.04 | 0.003 | 0.004 |
| Type 2 diabetes | n (%) | 3,617 (43.1) | 8,389 | 20,627 (41.1) | 50,229 | +0.04 | <0.001 | <0.001 |
| Insulin | n (%) | 1,869 (22.3) | 8,389 | 7,722 (15.4) | 50,229 | +0.18 | <0.001 | <0.001 |
| Hypertension | n (%) | 5,621 (67.0) | 8,389 | 33,409 (66.5) | 50,229 | +0.01 | 0.38 | 0.38 |
| Heart failure | n (%) | 1,097 (13.1) | 8,389 | 4,312 (8.6) | 50,229 | +0.14 | <0.001 | <0.001 |
| Chronic kidney disease | n (%) | 1,627 (19.4) | 8,389 | 7,836 (15.6) | 50,229 | +0.10 | <0.001 | <0.001 |
| Cancer history | n (%) | 1,264 (15.1) | 8,389 | 7,096 (14.1) | 50,229 | +0.03 | 0.02 | 0.03 |
| Depression | n (%) | 2,765 (33.0) | 8,389 | 13,879 (27.6) | 50,229 | +0.12 | <0.001 | <0.001 |
| Antipsychotic | n (%) | 909 (10.8) | 8,389 | 3,897 (7.8) | 50,229 | +0.11 | <0.001 | <0.001 |
| Malnutrition | n (%) | 234 (2.8) | 8,389 | 679 (1.4) | 50,229 | +0.10 | <0.001 | <0.001 |
| Frailty | n (%) | 636 (7.6) | 8,389 | 2,923 (5.8) | 50,229 | +0.07 | <0.001 | <0.001 |
| Neuropsychiatric | n (%) | 1,622 (19.3) | 8,389 | 7,071 (14.1) | 50,229 | +0.14 | <0.001 | <0.001 |
| Poor nutrition | n (%) | 2,287 (27.3) | 8,389 | 11,594 (23.1) | 50,229 | +0.10 | <0.001 | <0.001 |
| Age ≥75 y | n (%) | 683 (8.1) | 8,389 | 3,669 (7.3) | 50,229 | +0.03 | 0.007 | 0.009 |
| Prior weight-loss drug | n (%) | 1,128 (13.4) | 8,389 | 5,844 (11.6) | 50,229 | +0.05 | <0.001 | <0.001 |
| Cognitive impairment | n (%) | 47 (0.6) | 8,389 | 202 (0.4) | 50,229 | +0.02 | 0.05 | 0.05 |
n denotes the number of patients contributing data to each comparison. The analytic cohort comprised 8,389 patients with weight regain and 50,229 sustained responders; denominators are lower for HbA1c and eGFR because not every patient had a pre-index measurement, and for age and sex because those variables were obtained under an earlier classification pass. SMD, standardized mean difference, with positive values indicating a higher value in the weight-regain group; values above 0.1 in absolute terms indicate imbalance. Q, Benjamini–Hochberg false discovery rate across the characteristics shown.
Table 3.
Post-nadir treatment documentation category, weight change, and documented treatment.
| Category | Weight regain n (%) | Δ wt, pts | n | On drug 180 d, % | Sustained n (%) | Δ wt, pts | n | On drug 180 d, % |
| Documented ≥50%, dose maintained |
3,755 (45.8) | +5.6 | 2,118 | 76 | 24,378 (51.6) | +0.7 | 11,446 | 76 |
| Documented <50% | 3,028 (36.9) | +6.6 | 1,626 | 13 | 13,567 (28.7) | +2.5 | 5,813 | 15 |
| Alternate molecule documented (switched) | 978 (11.9) | +4.6 | 561 | 69 | 6,043 (12.8) | -0.7 | 2,940 | 75 |
| Documented ≥50%, dose reduced (de-escalated) | 436 (5.3) | +6.1 | 220 | 74 | 3,264 (6.9) | +2.4 | 1,339 | 74 |
Percentages in the count columns are of the four classifiable categories (8,197 weight regain, 47,252 sustained response); 192 and 2,977 patients respectively had fewer than 90 observable days after the nadir and could not be classified. Δ wt denotes the change in percentage of body weight from the nadir to 1 year thereafter, in percentage points, where positive values indicate weight regained, and n denotes patients with a weight recorded at that point. On drug 180 d is the proportion documented on treatment 180 days after the nadir.
Table 4.
Laboratory measures at treatment start, at 360 days post-treatment start, and at the nadir, in absolute terms and as relative change from treatment initiation value.
Table 4.
Laboratory measures at treatment start, at 360 days post-treatment start, and at the nadir, in absolute terms and as relative change from treatment initiation value.
| Comparison | Measure | Weight regain | n | Sustained response | n | P | Q |
| Absolute, treatment start | HbA1c, % | 7.22 (1.79) | 4,523 | 7.00 (1.59) | 26,991 | <0.001 | <0.001 |
| Absolute, treatment start | Triglycerides, mg/dL | 174.5 (105.5) | 3,307 | 167.3 (100.7) | 20,240 | <0.001 | <0.001 |
| Absolute, treatment start | HDL, mg/dL | 47.0 (13.0) | 3,336 | 48.1 (12.9) | 20,411 | <0.001 | <0.001 |
| Absolute, treatment start | Triglyceride:HDL | 4.24 (3.36) | 3,296 | 3.96 (3.16) | 20,197 | <0.001 | <0.001 |
| Absolute, treatment start | Neutrophil:lymphocyte | 3.14 (2.51) | 3,568 | 2.71 (2.06) | 17,774 | <0.001 | <0.001 |
| Absolute, treatment start | Neutrophils, 10⁹/L | 5.07 (2.26) | 3,581 | 4.80 (2.00) | 17,839 | <0.001 | <0.001 |
| Absolute, treatment start | Lymphocytes, 10⁹/L | 2.02 (0.82) | 3,604 | 2.09 (0.78) | 17,988 | <0.001 | <0.001 |
| Absolute, treatment start | Platelets, 10⁹/L | 262.6 (77.0) | 4,321 | 267.4 (74.6) | 22,445 | <0.001 | <0.001 |
| Absolute, treatment start | Albumin, g/dL | 4.13 (0.41) | 4,623 | 4.19 (0.35) | 25,093 | <0.001 | <0.001 |
| Absolute, treatment start | AST, U/L | 25.5 (16.1) | 4,524 | 24.9 (14.2) | 24,482 | 0.02 | 0.02 |
| Absolute, treatment start | eGFR, mL/min/1.73 m² | 80.6 (24.5) | 5,350 | 82.0 (22.5) | 29,776 | <0.001 | <0.001 |
| Absolute, treatment start | TSH, mIU/L | 2.16 (1.93) | 1,461 | 2.18 (1.96) | 8,523 | 0.70 | 0.70 |
| Absolute, 360 days | HbA1c, % | 6.63 (1.43) | 3,125 | 6.16 (1.20) | 17,520 | <0.001 | <0.001 |
| Absolute, 360 days | Triglycerides, mg/dL | 155.2 (93.3) | 2,332 | 129.4 (74.3) | 14,310 | <0.001 | <0.001 |
| Absolute, 360 days | HDL, mg/dL | 49.0 (13.4) | 2,333 | 49.9 (13.1) | 14,384 | 0.002 | 0.002 |
| Absolute, 360 days | Triglyceride:HDL | 3.59 (2.85) | 2,306 | 2.93 (2.27) | 14,275 | <0.001 | <0.001 |
| Absolute, 360 days | Neutrophil:lymphocyte | 3.43 (2.98) | 3,344 | 2.87 (2.35) | 14,973 | <0.001 | <0.001 |
| Absolute, 360 days | Neutrophils, 10⁹/L | 5.11 (2.34) | 3,353 | 4.79 (2.11) | 15,043 | <0.001 | <0.001 |
| Absolute, 360 days | Lymphocytes, 10⁹/L | 1.94 (0.82) | 3,368 | 2.03 (0.80) | 15,128 | <0.001 | <0.001 |
| Absolute, 360 days | Platelets, 10⁹/L | 258.3 (78.5) | 3,965 | 265.3 (75.8) | 18,780 | <0.001 | <0.001 |
| Absolute, 360 days | Albumin, g/dL | 4.07 (0.45) | 3,939 | 4.17 (0.38) | 19,771 | <0.001 | <0.001 |
| Absolute, 360 days | AST, U/L | 24.9 (14.8) | 3,848 | 22.7 (12.2) | 19,214 | <0.001 | <0.001 |
| Absolute, 360 days | eGFR, mL/min/1.73 m² | 78.5 (25.3) | 4,613 | 80.4 (22.5) | 23,613 | <0.001 | <0.001 |
| Absolute, 360 days | TSH, mIU/L | 2.32 (2.31) | 1,189 | 1.95 (1.95) | 5,642 | <0.001 | <0.001 |
| Absolute, nadir | HbA1c, % | 6.59 (1.60) | 3,180 | 6.15 (1.23) | 19,536 | <0.001 | <0.001 |
| Absolute, nadir | Triglycerides, mg/dL | 148.8 (89.4) | 2,100 | 129.4 (73.5) | 15,226 | <0.001 | <0.001 |
| Absolute, nadir | HDL, mg/dL | 46.3 (12.8) | 2,083 | 49.1 (12.9) | 15,308 | <0.001 | <0.001 |
| Absolute, nadir | Triglyceride:HDL | 3.62 (2.81) | 2,064 | 2.97 (2.27) | 15,177 | <0.001 | <0.001 |
| Absolute, nadir | Neutrophil:lymphocyte | 3.86 (3.24) | 3,957 | 3.00 (2.53) | 17,143 | <0.001 | <0.001 |
| Absolute, nadir | Neutrophils, 10⁹/L | 5.56 (2.56) | 3,967 | 4.92 (2.22) | 17,216 | <0.001 | <0.001 |
| Absolute, nadir | Lymphocytes, 10⁹/L | 1.90 (0.81) | 3,978 | 2.01 (0.79) | 17,290 | <0.001 | <0.001 |
| Absolute, nadir | Platelets, 10⁹/L | 267.1 (81.4) | 4,561 | 266.8 (76.3) | 21,205 | 0.87 | 0.87 |
| Absolute, nadir | Albumin, g/dL | 4.01 (0.50) | 4,442 | 4.16 (0.39) | 22,155 | <0.001 | <0.001 |
| Absolute, nadir | AST, U/L | 25.4 (15.8) | 4,343 | 22.8 (12.3) | 21,533 | <0.001 | <0.001 |
| Absolute, nadir | eGFR, mL/min/1.73 m² | 79.0 (24.9) | 5,113 | 80.5 (22.5) | 26,499 | <0.001 | <0.001 |
| Absolute, nadir | TSH, mIU/L | 2.10 (2.16) | 1,393 | 1.90 (1.90) | 6,190 | 0.002 | 0.002 |
| Relative change, 360 days | HbA1c, % | -0.59 | — | -0.84 | — | <0.001 | <0.001 |
| Relative change, 360 days | Triglycerides, mg/dL | -19.3 | — | -37.9 | — | <0.001 | <0.001 |
| Relative change, 360 days | HDL, mg/dL | +2.02 | — | +1.84 | — | 0.64 | 0.64 |
| Relative change, 360 days | Triglyceride:HDL | -0.64 | — | -1.03 | — | <0.001 | <0.001 |
| Relative change, 360 days | Neutrophil:lymphocyte | +0.29 | — | +0.15 | — | 0.05 | 0.09 |
| Relative change, 360 days | Neutrophils, 10⁹/L | +0.04 | — | -0.01 | — | 0.46 | 0.55 |
| Relative change, 360 days | Lymphocytes, 10⁹/L | -0.07 | — | -0.06 | — | 0.51 | 0.55 |
| Relative change, 360 days | Platelets, 10⁹/L | -4.28 | — | -2.04 | — | 0.23 | 0.34 |
| Relative change, 360 days | Albumin, g/dL | -0.06 | — | -0.02 | — | <0.001 | <0.001 |
| Relative change, 360 days | AST, U/L | -0.62 | — | -2.16 | — | <0.001 | <0.001 |
| Relative change, 360 days | eGFR, mL/min/1.73 m² | -2.09 | — | -1.60 | — | 0.36 | 0.48 |
| Relative change, 360 days | TSH, mIU/L | +0.16 | — | -0.24 | — | <0.001 | <0.001 |
| Relative change, nadir | HbA1c, % | -0.63 | — | -0.85 | — | <0.001 | <0.001 |
| Relative change, nadir | Triglycerides, mg/dL | -25.7 | — | -37.9 | — | <0.001 | <0.001 |
| Relative change, nadir | HDL, mg/dL | -0.65 | — | +1.03 | — | <0.001 | <0.001 |
| Relative change, nadir | Triglyceride:HDL | -0.62 | — | -0.99 | — | <0.001 | <0.001 |
| Relative change, nadir | Neutrophil:lymphocyte | +0.73 | — | +0.29 | — | <0.001 | <0.001 |
| Relative change, nadir | Neutrophils, 10⁹/L | +0.48 | — | +0.12 | — | <0.001 | <0.001 |
| Relative change, nadir | Lymphocytes, 10⁹/L | -0.11 | — | -0.07 | — | 0.05 | 0.05 |
| Relative change, nadir | Platelets, 10⁹/L | +4.50 | — | -0.54 | — | 0.006 | 0.008 |
| Relative change, nadir | Albumin, g/dL | -0.12 | — | -0.03 | — | <0.001 | <0.001 |
| Relative change, nadir | AST, U/L | -0.03 | — | -2.13 | — | <0.001 | <0.001 |
| Relative change, nadir | eGFR, mL/min/1.73 m² | -1.59 | — | -1.44 | — | 0.77 | 0.77 |
| Relative change, nadir | TSH, mIU/L | -0.07 | — | -0.28 | — | 0.009 | 0.01 |
| Relative change at nadir, treatment documentation + maintained dose | HbA1c, % | -0.58 | — | -0.81 | — | <0.001 | <0.001 |
| Relative change at nadir, treatment documentation + maintained dose | Triglycerides, mg/dL | -23.5 | — | -37.5 | — | <0.001 | <0.001 |
| Relative change at nadir, treatment documentation + maintained dose | HDL, mg/dL | -1.44 | — | +0.58 | — | <0.001 | <0.001 |
| Relative change at nadir, treatment documentation + maintained dose | Triglyceride:HDL | -0.53 | — | -0.97 | — | <0.001 | <0.001 |
| Relative change at nadir, treatment documentation + maintained dose | Neutrophil:lymphocyte | +0.74 | — | +0.27 | — | <0.001 | <0.001 |
| Relative change at nadir, treatment documentation + maintained dose | Neutrophils, 10⁹/L | +0.45 | — | +0.13 | — | <0.001 | <0.001 |
| Relative change at nadir, treatment documentation + maintained dose | Lymphocytes, 10⁹/L | -0.13 | — | -0.07 | — | 0.03 | 0.03 |
| Relative change at nadir, treatment documentation + maintained dose | Platelets, 10⁹/L | +2.50 | — | -0.94 | — | 0.14 | 0.15 |
| Relative change at nadir, treatment documentation + maintained dose | Albumin, g/dL | -0.10 | — | -0.03 | — | <0.001 | <0.001 |
| Relative change at nadir, treatment documentation + maintained dose | AST, U/L | +0.06 | — | -2.23 | — | <0.001 | <0.001 |
| Relative change at nadir, treatment documentation + maintained dose | eGFR, mL/min/1.73 m² | -3.24 | — | -2.31 | — | 0.16 | 0.16 |
| Relative change at nadir, treatment documentation + maintained dose | TSH, mIU/L | -0.12 | — | -0.39 | — | 0.006 | 0.009 |
Absolute rows are group means with standard deviations, and n denotes patients contributing a measurement at that timepoint. Relative-change rows are the change in each group's mean from its own value at treatment start, so no comparison is made at treatment start itself and no separate denominator applies; the associated P compares that change between groups, treating the two timepoints as independent, which overstates the variance where the same patients contribute to both and is therefore conservative. The final block repeats the change comparison at the nadir among patients documented on treatment at a maintained dose.
Table 5.
A. Gastrointestinal diagnoses by 90-day interval under both alignments. B. Gastrointestinal burden between the index date and the nadir, by post-nadir treatment documentation category.
Table 5.
A. Gastrointestinal diagnoses by 90-day interval under both alignments. B. Gastrointestinal burden between the index date and the nadir, by post-nadir treatment documentation category.
| A | ||||||||||||||
| Alignment | Diagnosis set | Interval start, d | Weight regain n (%) | n | Sustained response n (%) | n | P | |||||||
| From index | Any GI | 0 | 259 (3.05) | 8,495 | 1,102 (2.06) | 53,561 | <0.001 | |||||||
| From index | Any GI | 90 | 193 (2.27) | 8,495 | 821 (1.53) | 53,561 | <0.001 | |||||||
| From index | Any GI | 180 | 155 (1.82) | 8,494 | 702 (1.31) | 53,561 | <0.001 | |||||||
| From index | Any GI | 270 | 120 (1.41) | 8,494 | 680 (1.27) | 53,561 | 0.30 | |||||||
| From index | Any GI | 360 | 128 (1.52) | 8,419 | 577 (1.09) | 53,014 | <0.001 | |||||||
| From index | Any GI | 450 | 64 (0.81) | 7,917 | 427 (0.86) | 49,557 | 0.68 | |||||||
| From index | Any GI | 540 | 54 (0.76) | 7,111 | 356 (0.81) | 44,067 | 0.72 | |||||||
| From index | Any GI | 630 | 32 (0.51) | 6,251 | 289 (0.75) | 38,301 | 0.04 | |||||||
| From index | Serious GI | 0 | 104 (1.22) | 8,495 | 280 (0.52) | 53,561 | <0.001 | |||||||
| From index | Serious GI | 90 | 119 (1.40) | 8,495 | 313 (0.58) | 53,561 | <0.001 | |||||||
| From index | Serious GI | 180 | 112 (1.32) | 8,494 | 324 (0.60) | 53,561 | <0.001 | |||||||
| From index | Serious GI | 270 | 107 (1.26) | 8,494 | 349 (0.65) | 53,561 | <0.001 | |||||||
| From index | Serious GI | 360 | 93 (1.10) | 8,419 | 332 (0.63) | 53,014 | <0.001 | |||||||
| From index | Serious GI | 450 | 53 (0.67) | 7,917 | 237 (0.48) | 49,557 | 0.03 | |||||||
| From index | Serious GI | 540 | 53 (0.75) | 7,111 | 229 (0.52) | 44,067 | 0.02 | |||||||
| From index | Serious GI | 630 | 46 (0.74) | 6,251 | 180 (0.47) | 38,301 | 0.008 | |||||||
| From nadir | Any GI | -360 | 183 (2.15) | 8,495 | 1,046 (1.95) | 53,561 | 0.23 | |||||||
| From nadir | Any GI | -270 | 200 (2.35) | 8,495 | 885 (1.65) | 53,561 | <0.001 | |||||||
| From nadir | Any GI | -180 | 202 (2.38) | 8,495 | 709 (1.32) | 53,561 | <0.001 | |||||||
| From nadir | Any GI | -90 | 274 (3.23) | 8,495 | 674 (1.26) | 53,561 | <0.001 | |||||||
| From nadir | Any GI | 0 | 180 (2.12) | 8,494 | 811 (1.51) | 53,552 | <0.001 | |||||||
| From nadir | Any GI | 90 | 78 (0.94) | 8,299 | 403 (0.80) | 50,287 | 0.22 | |||||||
| From nadir | Any GI | 180 | 68 (0.85) | 8,000 | 386 (0.84) | 46,076 | 0.96 | |||||||
| From nadir | Any GI | 270 | 61 (0.82) | 7,448 | 305 (0.75) | 40,438 | 0.60 | |||||||
| From nadir | Serious GI | -360 | 74 (0.87) | 8,495 | 261 (0.49) | 53,561 | <0.001 | |||||||
| From nadir | Serious GI | -270 | 84 (0.99) | 8,495 | 276 (0.52) | 53,561 | <0.001 | |||||||
| From nadir | Serious GI | -180 | 83 (0.98) | 8,495 | 296 (0.55) | 53,561 | <0.001 | |||||||
| From nadir | Serious GI | -90 | 186 (2.19) | 8,495 | 377 (0.70) | 53,561 | <0.001 | |||||||
| From nadir | Serious GI | 0 | 117 (1.38) | 8,494 | 400 (0.75) | 53,552 | <0.001 | |||||||
| From nadir | Serious GI | 90 | 71 (0.86) | 8,299 | 259 (0.52) | 50,287 | <0.001 | |||||||
| From nadir | Serious GI | 180 | 44 (0.55) | 8,000 | 204 (0.44) | 46,076 | 0.22 | |||||||
| From nadir | Serious GI | 270 | 58 (0.78) | 7,448 | 193 (0.48) | 40,438 | 0.001 | |||||||
| B | ||||||||||||||
| Response group | Event | Documentation ≥50% maintained dose n(%) | n | Documentation <50% n (%) | n | P | Q | |||||||
| Weight regain | Any GI symptom | 1,217 (32.4) | 3,755 | 993 (32.8) | 3,028 | 0.76 | 0.86 | |||||||
| Weight regain | GERD or dyspepsia | 833 (22.2) | 3,755 | 647 (21.4) | 3,028 | 0.44 | 0.70 | |||||||
| Weight regain | Diarrhoea | 337 (9.0) | 3,755 | 316 (10.4) | 3,028 | 0.05 | 0.19 | |||||||
| Weight regain | Constipation | 304 (8.1) | 3,755 | 280 (9.2) | 3,028 | 0.10 | 0.27 | |||||||
| Weight regain | Gastroparesis | 40 (1.1) | 3,755 | 30 (1.0) | 3,028 | 0.86 | 0.86 | |||||||
| Weight regain | Biliary disease | 83 (2.2) | 3,755 | 60 (2.0) | 3,028 | 0.57 | 0.76 | |||||||
| Weight regain | Pancreatitis | 18 (0.5) | 3,755 | 32 (1.1) | 3,028 | 0.009 | 0.07 | |||||||
| Weight regain | Any serious GI event | 138 (3.7) | 3,755 | 125 (4.1) | 3,028 | 0.37 | 0.70 | |||||||
| Sustained response | Any GI symptom | 7,862 (32.3) | 24,378 | 4,375 (32.2) | 13,567 | 1.00 | 1.00 | |||||||
| Sustained response | GERD or dyspepsia | 5,851 (24.0) | 24,378 | 3,205 (23.6) | 13,567 | 0.42 | 0.55 | |||||||
| Sustained response | Diarrhoea | 1,638 (6.7) | 24,378 | 1,026 (7.6) | 13,567 | 0.002 | 0.006 | |||||||
| Sustained response | Constipation | 1,705 (7.0) | 24,378 | 951 (7.0) | 13,567 | 0.97 | 1.00 | |||||||
| Sustained response | Gastroparesis | 131 (0.5) | 24,378 | 90 (0.7) | 13,567 | 0.14 | 0.22 | |||||||
| Sustained response | Biliary disease | 285 (1.2) | 24,378 | 201 (1.5) | 13,567 | 0.01 | 0.02 | |||||||
| Sustained response | Pancreatitis | 60 (0.2) | 24,378 | 70 (0.5) | 13,567 | <0.001 | <0.001 | |||||||
| Sustained response | Any serious GI event | 436 (1.8) | 24,378 | 347 (2.6) | 13,567 | <0.001 | <0.001 | |||||||
A: Counts are patients with at least one diagnosis in the interval; n denotes patients under observation at the start of that interval. Serious diagnoses comprise pancreatitis, biliary disease, bowel obstruction, gastroparesis, perforation, and gastrointestinal bleeding. The any-diagnosis set is the union of digestive-tract diagnoses and symptoms listed in Table S1. Denominators for this analysis derive from the event extraction, which applied the same eligibility criteria without the trajectory-density requirement, and exceed the analytic cohort by 1.3% in the weight-regain group and 6.6% in the sustained-response group. B: Both columns within each response group describe patients from that group, compared according to what their treatment record showed after the nadir. n denotes patients in each category. Q, Benjamini–Hochberg false discovery rate computed within each response group across the eight event types shown; the pancreatitis and diarrhoea differences within the weight-regain group do not survive correction.
Table 6.
Medication classes newly initiated in the year after the nadir.
| Expected direction | Class | Weight regain n (%) | n at risk | Sustained response n (%) | n at risk | P | Q |
| Weight-promoting | Corticosteroid | 1,942 (38.8) | 5,004 | 10,115 (27.5) | 36,776 | <0.001 | <0.001 |
| Neutral or mixed | Opioid | 1,551 (30.6) | 5,072 | 7,799 (20.1) | 38,767 | <0.001 | <0.001 |
| Weight-promoting | Gabapentinoid | 859 (13.4) | 6,415 | 4,010 (9.3) | 42,940 | <0.001 | <0.001 |
| Weight-promoting | Insulin | 644 (10.2) | 6,318 | 2,775 (6.2) | 44,479 | <0.001 | <0.001 |
| Weight-promoting | SSRI or SNRI | 997 (17.9) | 5,564 | 5,449 (14.5) | 37,557 | <0.001 | <0.001 |
| Weight-promoting | Antipsychotic | 655 (8.9) | 7,357 | 2,683 (5.6) | 47,551 | <0.001 | <0.001 |
| Weight-promoting | Beta blocker | 896 (14.7) | 6,082 | 4,700 (11.6) | 40,646 | <0.001 | <0.001 |
| Neutral or mixed | Loop diuretic | 529 (7.4) | 7,151 | 1,994 (4.3) | 46,817 | <0.001 | <0.001 |
| Weight-lowering | Weight-loss agent | 611 (8.2) | 7,444 | 2,564 (5.5) | 46,669 | <0.001 | <0.001 |
| Other incretin | Other GLP-1 agent | 384 (4.8) | 7,986 | 1,119 (2.3) | 48,901 | <0.001 | <0.001 |
| Weight-lowering | SGLT2 inhibitor | 543 (7.3) | 7,436 | 2,393 (5.2) | 46,256 | <0.001 | <0.001 |
| Weight-lowering | Bupropion | 521 (6.9) | 7,504 | 2,412 (5.2) | 46,295 | <0.001 | <0.001 |
| Weight-lowering | Metformin | 914 (14.8) | 6,179 | 5,230 (13.4) | 38,979 | 0.004 | 0.004 |
| Weight-promoting | Sulfonylurea | 281 (3.6) | 7,710 | 1,128 (2.4) | 47,835 | <0.001 | <0.001 |
| Neutral or mixed | Anticoagulant | 333 (4.4) | 7,569 | 1,543 (3.2) | 47,554 | <0.001 | <0.001 |
| Weight-promoting | Mirtazapine | 110 (1.3) | 8,160 | 266 (0.5) | 49,935 | <0.001 | <0.001 |
| Neutral or mixed | DPP-4 inhibitor | 98 (1.2) | 8,150 | 319 (0.6) | 49,801 | <0.001 | <0.001 |
| Weight-promoting | Thiazolidinedione | 73 (0.9) | 8,189 | 258 (0.5) | 49,865 | <0.001 | <0.001 |
| Weight-lowering | Stimulant | 140 (1.8) | 7,888 | 682 (1.4) | 48,056 | 0.02 | 0.02 |
| Neutral or mixed | Thiazide | 556 (7.8) | 7,109 | 3,263 (7.6) | 43,078 | 0.48 | 0.48 |
| Neutral or mixed | Levothyroxine | 356 (4.9) | 7,198 | 2,386 (5.4) | 44,059 | 0.11 | 0.12 |
| Neutral or mixed | Statin | 1,326 (26.0) | 5,102 | 8,824 (26.7) | 33,053 | 0.30 | 0.31 |
A class was counted as newly initiated only if absent for 180 days before the nadir, so that continuation of an existing therapy is not counted as an addition. n at risk excludes patients already receiving the class and those without 90 observable days after the nadir, and therefore differs across classes. Expected direction reflects the labelled effect of the class on body weight; several classes are mixed. Q, Benjamini–Hochberg false discovery rate across the 22 classes.
Table 7.
A. Infection and allergy diagnoses between treatment start and the nadir. B. Any infection diagnosis by 90-day interval under both alignments.
Table 7.
A. Infection and allergy diagnoses between treatment start and the nadir. B. Any infection diagnosis by 90-day interval under both alignments.
| A | ||||||||||||||
| Category | Events | Person-y | Rate | Events | Person-y | Rate | IRR (95% CI) | P | Q | |||||
| Any infection | 2,074 | 4,871 | 425.7 | 10,670 | 43,910 | 243.0 | 1.75 (1.67–1.84) | <0.001 | <0.001 | |||||
| Sepsis | 263 | 4,871 | 54.0 | 514 | 43,910 | 11.7 | 4.61 (3.98–5.35) | <0.001 | <0.001 | |||||
| Pneumonia | 371 | 4,871 | 76.2 | 1,234 | 43,910 | 28.1 | 2.71 (2.41–3.04) | <0.001 | <0.001 | |||||
| Urinary tract infection | 933 | 4,871 | 191.5 | 4,594 | 43,910 | 104.6 | 1.83 (1.71–1.96) | <0.001 | <0.001 | |||||
| Skin or soft tissue | 463 | 4,871 | 95.0 | 2,203 | 43,910 | 50.2 | 1.89 (1.71–2.09) | <0.001 | <0.001 | |||||
| Influenza or COVID-19 | 555 | 4,871 | 113.9 | 3,299 | 43,910 | 75.1 | 1.52 (1.39–1.66) | <0.001 | <0.001 | |||||
| Any allergy | 209 | 4,871 | 42.9 | 976 | 43,910 | 22.2 | 1.93 (1.66–2.24) | <0.001 | <0.001 | |||||
| Drug allergy | 127 | 4,871 | 26.1 | 427 | 43,910 | 9.7 | 2.68 (2.20–3.27) | <0.001 | <0.001 | |||||
| Urticaria | 77 | 4,871 | 15.8 | 481 | 43,910 | 11.0 | 1.44 (1.13–1.84) | 0.003 | 0.003 | |||||
| Anaphylaxis | 11 | 4,871 | 2.3 | 92 | 43,910 | 2.1 | 1.08 (0.58–2.01) | 0.81 | 0.81 | |||||
| B | ||||||||||||||
| Alignment | Interval start, d | Weight regain n (%) | n | Sustained response n (%) | n | P | ||||||||
| From index | 0 | 203 (2.39) | 8,495 | 942 (1.76) | 53,561 | <0.001 | ||||||||
| From index | 90 | 193 (2.27) | 8,495 | 859 (1.60) | 53,561 | <0.001 | ||||||||
| From index | 180 | 157 (1.85) | 8,494 | 752 (1.40) | 53,561 | 0.002 | ||||||||
| From index | 270 | 138 (1.62) | 8,494 | 765 (1.43) | 53,561 | 0.18 | ||||||||
| From index | 360 | 134 (1.59) | 8,419 | 651 (1.23) | 53,014 | 0.007 | ||||||||
| From index | 450 | 91 (1.15) | 7,917 | 510 (1.03) | 49,557 | 0.36 | ||||||||
| From index | 540 | 53 (0.75) | 7,111 | 429 (0.97) | 44,067 | 0.07 | ||||||||
| From index | 630 | 51 (0.82) | 6,251 | 345 (0.90) | 38,301 | 0.55 | ||||||||
| From nadir | -360 | 167 (1.97) | 8,495 | 925 (1.73) | 53,561 | 0.13 | ||||||||
| From nadir | -270 | 189 (2.22) | 8,495 | 851 (1.59) | 53,561 | <0.001 | ||||||||
| From nadir | -180 | 172 (2.02) | 8,495 | 789 (1.47) | 53,561 | <0.001 | ||||||||
| From nadir | -90 | 241 (2.84) | 8,495 | 765 (1.43) | 53,561 | <0.001 | ||||||||
| From nadir | 0 | 190 (2.24) | 8,494 | 889 (1.66) | 53,552 | <0.001 | ||||||||
| From nadir | 90 | 103 (1.24) | 8,299 | 502 (1.00) | 50,287 | 0.05 | ||||||||
| From nadir | 180 | 112 (1.40) | 8,000 | 439 (0.95) | 46,076 | <0.001 | ||||||||
| From nadir | 270 | 82 (1.10) | 7,448 | 386 (0.95) | 40,438 | 0.26 | ||||||||
A. Person-time is each group's size multiplied by its mean time to nadir (212.1 days for weight regain, 319.3 days for sustained response), which is exact in expectation because every patient is followed from the index date to their own nadir. Rate denotes diagnoses per 1,000 person-years. Composite categories are the union of their component diagnoses and therefore overlap with the rows beneath them. IRR, incidence rate ratio. Q, Benjamini–Hochberg false discovery rate across the ten categories shown. Denominators for this analysis derive from the event extraction, which applied the same eligibility criteria without the trajectory-density requirement, and exceed the analytic cohort by 1.3% in the weight-regain group and 6.6% in the sustained-response group. B. Counts are patients with at least one infection diagnosis in the interval; n denotes patients under observation at the start of that interval. Codes defining the composite are listed in Table S1. Denominators for this analysis derive from the event extraction, which applied the same eligibility criteria without the trajectory-density requirement, and exceed the analytic cohort by 1.3% in the weight-regain group and 6.6% in the sustained-response group.
Table 8.
Event rates and adjusted rate ratios by concurrent weight status.
| Outcome | Events | Person-y | Rate | Events | Person-y | Rate | Adjusted RR (95% CI) | P | Q |
| MACE, non-fatal | 230 | 17,800 | 12.9 | 667 | 69,692 | 9.6 | 1.43 (1.22–1.67) | <0.001 | <0.001 |
| MACE with death | 343 | 17,800 | 19.3 | 947 | 69,692 | 13.6 | 1.43 (1.25–1.63) | <0.001 | <0.001 |
| Myocardial infarction | 127 | 18,538 | 6.9 | 365 | 71,692 | 5.1 | 1.43 (1.15–1.77) | 0.001 | 0.001 |
| Unstable angina | 56 | 19,119 | 2.9 | 128 | 73,052 | 1.8 | 1.77 (1.27–2.47) | <0.001 | 0.001 |
| Ischemic stroke | 102 | 18,902 | 5.4 | 268 | 72,646 | 3.7 | 1.49 (1.18–1.90) | 0.001 | 0.001 |
| Hemorrhagic stroke | 39 | 19,423 | 2.0 | 112 | 73,970 | 1.5 | 1.44 (0.98–2.11) | 0.06 | 0.08 |
| TIA | 105 | 18,797 | 5.6 | 344 | 72,206 | 4.8 | 1.22 (0.97–1.54) | 0.09 | 0.10 |
| Cardiac arrest | 35 | 19,519 | 1.8 | 66 | 74,255 | 0.9 | 2.11 (1.37–3.26) | <0.001 | 0.001 |
| HF hospitalization | 337 | 16,768 | 20.1 | 911 | 67,080 | 13.6 | 1.66 (1.45–1.89) | <0.001 | <0.001 |
| Atrial fibrillation | 225 | 17,534 | 12.8 | 691 | 67,966 | 10.2 | 1.42 (1.21–1.67) | <0.001 | <0.001 |
| Venous thromboembolism | 177 | 18,037 | 9.8 | 454 | 70,058 | 6.5 | 1.67 (1.39–2.01) | <0.001 | <0.001 |
| Peripheral arterial disease | 171 | 18,158 | 9.4 | 495 | 70,412 | 7.0 | 1.50 (1.25–1.80) | <0.001 | <0.001 |
| Acute kidney injury | 382 | 16,460 | 23.2 | 1,108 | 67,106 | 16.5 | 1.61 (1.42–1.82) | <0.001 | <0.001 |
| CKD stage 4-5 | 146 | 18,612 | 7.8 | 294 | 71,959 | 4.1 | 2.26 (1.83–2.79) | <0.001 | <0.001 |
| Dialysis | 63 | 19,171 | 3.3 | 106 | 73,485 | 1.4 | 2.82 (2.02–3.93) | <0.001 | <0.001 |
| Dehydration | 347 | 16,828 | 20.6 | 1,088 | 68,015 | 16.0 | 1.46 (1.29–1.66) | <0.001 | <0.001 |
| All-cause death | 210 | 19,612 | 10.7 | 441 | 74,444 | 5.9 | 1.59 (1.34–1.89) | <0.001 | <0.001 |
| Fall or fracture | 320 | 17,355 | 18.4 | 934 | 67,727 | 13.8 | 1.40 (1.23–1.60) | <0.001 | <0.001 |
| Hip fracture | 33 | 19,401 | 1.7 | 126 | 73,936 | 1.7 | 0.97 (0.65–1.44) | 0.86 | 0.86 |
| Incident frailty | 330 | 17,541 | 18.8 | 1,022 | 68,904 | 14.8 | 1.36 (1.20–1.55) | <0.001 | <0.001 |
| Delirium | 364 | 17,271 | 21.1 | 1,113 | 68,245 | 16.3 | 1.33 (1.18–1.51) | <0.001 | <0.001 |
| Malnutrition | 186 | 18,668 | 10.0 | 668 | 72,707 | 9.2 | 1.17 (0.98–1.38) | 0.08 | 0.09 |
| Sarcopenia | 30 | 19,478 | 1.5 | 94 | 74,066 | 1.3 | 1.18 (0.76–1.81) | 0.46 | 0.50 |
| Syncope | 335 | 16,793 | 19.9 | 1,438 | 66,480 | 21.6 | 1.03 (0.91–1.17) | 0.62 | 0.65 |
The first three numeric columns describe person-time accrued in a regained state and the next three person-time in a maintained-loss state. Rate denotes events per 1,000 person-years. Weight status was reassessed every 90 days, so patients contribute person-time to whichever status they occupied in each interval and appear in both sets of columns. Adjusted rate ratios were estimated with a Poisson model using log person-time as an offset and terms for 90-day interval, brand, and age stratum. Q, Benjamini–Hochberg false discovery rate across the outcomes shown. Denominators for this analysis derive from the event extraction, which applied the same eligibility criteria without the trajectory-density requirement, and exceed the analytic cohort by 1.3% in the weight-regain group and 6.6% in the sustained-response group.
Disclaimer/Publisher’s Note: The statements, opinions and data contained in all publications are solely those of the individual author(s) and contributor(s) and not of MDPI and/or the editor(s). MDPI and/or the editor(s) disclaim responsibility for any injury to people or property resulting from any ideas, methods, instructions or products referred to in the content. |
© 2026 by the authors. Licensee MDPI, Basel, Switzerland. This article is an open access article distributed under the terms and conditions of the Creative Commons Attribution (CC BY) license (http://creativecommons.org/licenses/by/4.0/).
Copyright: This open access article is published under a Creative Commons CC BY 4.0 license, which permit the free download, distribution, and reuse, provided that the author and preprint are cited in any reuse.