

Submitted:
20 August 2026
Posted:
20 August 2026
You are already at the latest version
Abstract
Live-cell imaging can generate misleading readouts when physically complex multicomponent matrices alter light transmission, fluorescence, sedimentation, focusing, or segmentation. We retrospectively reconstructed a sequential fit-for-purpose qualification workflow using six coded phospholipoproteomic nutraceutical matrices (M1–M6) and two predefined pools. Records included U87 optical-compatibility screens at nominal 25%, 10%, 1%, and 0.1% inputs, one 47.5 h quantitative U87 imaging run at a laboratory-designated working input, and qualitative observations in T98G, SiHa, A375, and HMC3 stocks under complete and serum-free basal conditions. High-input conditions impaired microscopy, and a software-derived death-associated signal reached 78.85% at time zero but fell below 3.89% by 6 h, indicating early analytical instability. After lower-interference conditions were established, M4 showed the lowest sustained complete-medium image-derived trajectory, with an area under the curve (AUC) 31.3% below control and a 47.5 h endpoint of 0.910 ± 0.100 versus 1.630 ± 0.265. In basal medium, M2 showed the lowest cumulative trajectory, with an AUC 25.0% below control. The patterns were context dependent and were not supported by independent biological replication or orthogonal endpoints. Sequential qualification therefore provides a practical framework for separating matrix-related analytical interference from image-derived signals requiring biological confirmation.
Keywords:
live-cell imaging
; assay qualification
; matrix effects
; optical interference
; image segmentation
; complex multicomponent matrices
; nutraceutical matrices
; technical replication
; context dependence
; experimental biology
1. Introduction
Complex multicomponent preparations are not necessarily represented analytically by the arithmetic sum of their individual constituents. Concentration, solubility, colloidal organization, phospholipid-protein association, particle size, extracellular protein binding, uptake competition, and constituent-to-constituent interactions may modify the physical environment in which a biological assay operates [1,2]. Consequently, the final matrix itself must be experimentally evaluated before additivity, synergy, biological neutrality, or constituent-level behavior can be inferred [3,4].
Cell-based assays provide an important bridge between physicochemical characterization and biological hypothesis generation. However, a measured change in an in vitro signal does not necessarily identify the cellular process responsible for that change; orthogonal endpoints are required when viability, proliferation, death, or mechanism is inferred from a surrogate readout [5,6,7]. This distinction is particularly important in real-time and high-content imaging, where image-derived confluence or relative-signal measurements can be influenced by cell number, spreading, morphology, adhesion, detachment, focusing, segmentation, or combinations of these variables [8,9,10].
Physically complex matrices impose an additional analytical layer. Colored, viscous, particulate, lipid-associated, proteinaceous, colloidal, or incompletely soluble preparations may scatter light, autofluoresce, precipitate, form surface deposits, obscure the imaging field, or be misclassified by image-analysis algorithms [11,12,13]. Vessel geometry may further affect sedimentation and effective local exposure [14]. Under such conditions, fit-for-purpose assay qualification becomes an experimental prerequisite rather than a purely technical preliminary step [15,16].
A useful strategy is therefore to establish analytical interpretability sequentially before assigning biological meaning to a time-resolved signal. Early experiments can identify optical or physical conditions incompatible with reliable observation; lower-interference conditions can then establish whether quantitative monitoring is technically feasible; and independently replicated orthogonal endpoints can subsequently determine the biological basis of any persistent trajectory.
The experimental program examined here comprised six coded phospholipoproteomic nutraceutical matrices and two predefined three-matrix pools. These materials provided a model of a dense multicomponent system in which matrix-level optical and physicochemical effects could plausibly coexist with cellular effects. The neutral publication designations M1–M6, Pool A, and Pool B are used consistently throughout the manuscript, Supplementary Materials, and figures. The source-to-code key, component identities, ratios, lot crosswalks, and commercial correspondence are maintained in controlled internal technical records and were not included in the neutralized analytical dataset used for matrix-level comparisons.
The experimental sequence was adaptive. Initial studies addressed physical behavior and field interpretability during direct cell exposure. After a lower-interference range had been identified, a U87-designated laboratory stock was monitored in real time, and qualitative microscopy was subsequently extended to T98G, SiHa, A375, and HMC3 laboratory stocks. Complete and serum-free basal media were evaluated as distinct culture environments. The objectives were to: (i) determine whether sequential exposure qualification could establish an interpretable imaging window for a physically complex multicomponent matrix; (ii) characterize time-dependent U87 image-derived trajectories after that qualification step; (iii) compare coded individual and pooled conditions; (iv) assess whether reported patterns were conserved across laboratory stocks and culture environments; and (v) define the experimental requirements necessary to advance an image-derived observation toward biological interpretation. The sequential qualification pathway is summarized in Figure 1.
2. Materials and Methods
2.1. Study Design
This retrospective, descriptive investigation integrated nine sequential in vitro experiments designated Experiments 4–12. The sequence was adaptive: observations from one experiment informed later input, imaging, and model choices. The work was not preregistered, no prospective power calculation was performed, and endpoints were reconstructed and analyzed post hoc from the available records. Early studies examined analytical feasibility at recorded 25% and 10% nominal inputs; later studies used recorded lower-input conditions, live-cell imaging, and additional laboratory stocks (Table 1).
The archived experimental datasets analyzed in the present retrospective study are distinct from those reported in the authors’ previous publications. None of the numerical data, experimental outputs, figures, curves, or tables presented in this manuscript has been previously published. Because historical stock-level cross-referencing was not preserved consistently in the available archive, continuity or independence of identically designated laboratory stocks across separate studies cannot be established retrospectively.
2.2. Coded Matrices, Scientific Scope, and Neutral Nomenclature
Six coded matrices and two predefined pools were evaluated under neutral publication designations. Pool A contained M1–M3 and Pool B contained M4–M6. Component identities, ratios, lot crosswalks, and commercial correspondence are maintained in controlled internal technical records and were not part of the neutralized analytical dataset. Accordingly, the present study makes no component-level comparison or interaction claim.
The analysis was intentionally conducted at the coded matrix level; complete qualitative and quantitative composition was outside the analytical dataset. The study therefore does not attribute an observed signal to any phytochemical, phospholipid, protein, or other constituent. Results apply only to the tested coded materials and cannot establish ingredient attribution, batch equivalence, or independent formulation reproduction.
2.3. Preparation and Nominal Exposure Designations
Working materials were prepared from coded source matrices under the procedures recorded for each experiment and were applied using the documented nominal exposure designations. Process-specific operating parameters—including exact preparation volumes, component ratios, identity crosswalks, and commercial correspondence—are retained in controlled internal technical records. The present manuscript reports the experimental sequence, cellular models, exposure designations, analytical procedures, endpoints, and limitations required to evaluate the matrix-level findings.
Because concentration labels and preparation records were not fully harmonized across the sequence, the reported percentages must be interpreted as nominal within-experiment designations rather than independently verified original-product-equivalent concentrations. This limitation precludes cross-experiment dose equivalence and requires prospective harmonization.
2.4. Cell Models and Culture Media
The evaluated laboratory stocks were designated U87, T98G, SiHa, A375, and HMC3. The available archived records identify these materials as established laboratory cell-line stocks used in the reported experiments; additional historical provenance, including the original commercial supplier, source institution, catalogue number, passage history, short tandem repeat (STR) authentication records, thaw date, and mycoplasma-testing records, could not be reliably reconstructed from the available archive. None of these stocks was newly established or generated de novo for the present study, and no new human biological material, identifiable donor information, or associated clinical data were involved. Accordingly, the findings are restricted to the laboratory stocks actually used in these experiments and should not be generalized to authenticated reference lines bearing the same designations [17,18]. This qualification is particularly important for U87-designated stocks [19]. HMC3 was used as an immortalized non-neoplastic neural-lineage comparator [20], not as a normal-cell safety surrogate.
The records described high-glucose Dulbecco’s Modified Eagle Medium (DMEM) with antibiotics and glutamine. Complete medium additionally contained 10% fetal bovine serum (FBS); basal medium was serum-free and therefore represented both a different matrix environment and a major cellular stress condition [21]. Incubation details were not restated consistently across all experiments.
2.5. Seeding, Exposure, and Sequential Assay Qualification
Documented experiments used 48-well plates. Cells were allowed to attach before exposure, but seeding density, attachment interval, and starting confluence were not standardized or retained consistently across the sequence. The initial U87 record reported an approximate seeding density, whereas later records used target-confluence descriptions. These differences limit cross-experiment comparison.
Experiments 4 and 5 evaluated nominal 25% and 10% conditions and identified major opacity and extracellular interference. Experiments 6 and 8 evaluated nominal 1% and 0.1% conditions, respectively, at which cellular observation became more interpretable. The sequence functioned as retrospective assay qualification rather than a prospectively fixed dose-response study.
2.6. Real-Time IncuCyte Experiment
Experiment 7 evaluated the U87-designated stock at a laboratory-designated working input in complete and serum-free basal media. Each condition comprised three technical wells in a single experimental run. A membrane-impermeant SYTOX-family reagent was included, and an IncuCyte system [22] acquired an image-derived normalized signal and a death-associated channel every 0.5 h from 0 to 47.5 h. The exact reagent product, final reagent concentration, instrument model, software version, objective, and segmentation settings were not retained in the neutralized records.
The kinetic stage followed lower-exposure microscopy in which the monolayer was visually observable. It should therefore be understood as a single exploratory characterization run after assay qualification, not as an independently replicated efficacy test.
2.7. Quantitative Data Processing
The laboratory-exported normalized variable is reported as an image-derived relative signal because its exact segmentation definition was unavailable. A value of 1 represents the run-specific normalized baseline used in the source export, not an absolute cell count.
For each condition and valid time point, the arithmetic mean and sample standard deviation (SD) of three technical wells were used. One acquisition at 36.5 h contained missing values across multiple conditions and was excluded globally, leaving 95 retained time points. Area under the curve (AUC) was calculated by trapezoidal integration and is reported in relative units·h. Relative difference was calculated as 100 × (condition − matched control)/matched control. The technical wells were nested measurements within one run, not independent biological replicates [23].
The wells were technical replicates, not independent biological experiments [24]. The analysis was descriptive and post hoc; no treatment-effect p values, confidence intervals, or inferential comparisons were calculated. Low well-to-well dispersion indicates within-run technical precision only and cannot establish biological reproducibility.
2.8. Evaluation of the SYTOX-Associated Output
The SYTOX-associated output was evaluated for baseline plausibility, temporal direction, concordance with the image-derived relative-signal trajectory, and suitability as a cumulative measure of cell death. Several complete-medium conditions began with values exceeding 50% and then declined rapidly toward zero during the first hours of acquisition. Because a membrane-impermeant death-associated signal would not be expected to show this pattern if it represented irreversible membrane compromise, the early values were considered analytically unstable. In the absence of matrix-only, dye-only, no-cell, fluorescence-background, and orthogonal viability or cytotoxicity controls, the channel was considered vulnerable to optical interference, background fluorescence, focusing artifacts, or segmentation error. Accordingly, it was reported only as a software-derived death-associated signal and was not interpreted as apoptosis, necrosis, cumulative cell death, or reversible cytotoxicity [25].
2.9. Qualitative Cross-Model Synthesis
Microscopy reports documented attached-cell coverage, detachment, aggregates, debris, precipitation, and other well-level appearances at 24 and 48 h. No blinded assessment, automated cell counting, validated ordinal scale, or morphometry was available. Symbols such as ++ and +++ are retained only as original report descriptors and are not quantitative effect sizes.
2.10. Use of AI-Assisted Technologies
AI-assisted technologies were used during manuscript preparation for editorial and organizational support, including language refinement, document structuring, and the preparation of conceptual materials. These technologies were not used to generate, modify, infer, or analyze experimental data, raw measurements, statistical outputs, or numerical results. All AI-assisted outputs were critically reviewed and validated by the authors, who take full responsibility for the final content of the manuscript.
3. Results
3.1. Sequential Qualification Identified an Interpretable Imaging Window
At nominal 25% and 10% exposures, visibility was limited by high optical density and extracellular material, particularly in pooled conditions. Improved visibility after washing in one documented experiment supported an extracellular contribution but did not identify its physicochemical basis.
At nominal 1% and 0.1% exposures, cells were more consistently observable. The concentration sequence therefore separated high-exposure conditions dominated by physical interference from lower-exposure conditions suitable for exploratory image review.
3.2. M4 Was Associated with the Lowest Sustained U87 Image-Derived Signal in Complete Medium
In complete medium, the control reached a mean image-derived value of 1.630 at 47.5 h. Within the same single run, M4 was associated with the lowest sustained trajectory. Its AUC was 39.24 relative units·h versus 57.10 for control, a relative cumulative difference of -31.3%.
The relative difference between M4 and control increased from -13.3% at 6 h to -44.2% at 47.5 h. M4 ended at 0.910, below its normalized starting reference, while control reached 1.630. The mean technical coefficient of variation (CV) for M4 was 5.4%, indicating low dispersion among the three wells within this run, not biological reproducibility (Figure 2; Table 3).
M3, M5, and M6 showed intermediate relative AUC differences of -18.4%, -17.6%, and -19.7%, respectively. M1 showed a -12.6% difference with greater technical dispersion. M2 followed a biphasic image-derived trajectory: it was above control at 6, 12, and 24 h but ended 26.5% below control, yielding an AUC 3.3% above control.
3.3. Coded Pooled Conditions Yielded Trajectories Distinct from Individual Matrices
Pool A was above control by 82.9% at 6 h, 77.3% at 12 h, and 54.8% at 24 h; it approached control at 47.5 h, while its AUC remained 41.0% higher. These values describe the coded pooled condition only and do not establish stimulation of cell number.
Pool B had an AUC 19.9% above control, ended 16.0% above control, and showed the greatest technical dispersion among complete-medium conditions. Exposure equivalence and formulation-level information were not available in the neutralized dataset, so no component-level comparison is made.
The predefined pools yielded trajectories different from those of the individually coded matrices; the basis of those differences could not be determined. Synergy, antagonism, and biological interaction were not tested because exposure-equivalent component doses, concentration-response matrices, vehicle equivalence, and independent replication were unavailable [26] (Figure 3 and Figure 4).
3.4. Culture Environment Substantially Altered the Within-Run Pattern
The serum-free basal control increased throughout the run and reached 2.479 at 47.5 h. Because serum withdrawal is a major cellular stress and the output was normalized, this trajectory cannot be interpreted as absolute cell-number expansion; attachment, spreading, morphology, segmentation, and the baseline denominator may have contributed.
M2 was associated with the lowest cumulative basal-medium trajectory. Its AUC was 66.04 versus 88.00 for the matched basal control, a relative difference of -25.0%. The trajectory was biphasic: above control at 6 and 12 h, then 35.3% and 43.5% below control at 24 and 47.5 h, respectively.
3.5. Qualitative Differences Remained Observable at the Nominal 0.1% U87 Exposure
At nominal 0.1%, visibility improved relative to the 25% and 10% studies. At 48 h, the reports described lower visible attached-cell coverage for M2, M4, and Pool A in complete medium and for M2 and M4 in basal medium. Because the experiment lacked quantitative segmentation, these observations are qualitative and do not establish activity, magnitude, concentration-response, or reproducibility.
3.6. Cross-Model Microscopy Revealed Experimental Heterogeneity
T98G reports described limited differences. At 24 h, M2 and Pool A had lower attached-cell coverage in complete medium; by 48 h, only a mild difference remained for Pool A. The contrast with the U87-designated stock suggests laboratory-stock dependence but does not establish lineage-specific sensitivity.
SiHa reports described the most prominent qualitative differences. M2 and M5 received the original +++ descriptor for reduced visible attached-cell coverage, M4 received ++, and several other conditions were described as lower coverage or aggregation. These unblinded report-level descriptors require quantitative confirmation.
A375 reports described limited change in complete medium. M2 and Pool B had mildly reduced attached-cell coverage at 24 h, while most conditions were described as visually similar to control at 48 h. M4 had reduced coverage only in basal medium. These observations do not establish resistance, cytotoxicity, or selectivity.
HMC3 was the only non-neoplastic comparator. In complete medium, M3, M4, M5, and M6 were described as having attached-cell coverage visually similar to control, whereas M1 and M2 had mild-to-moderate reductions. Under serum-free basal conditions, several conditions showed extensive well-level loss of attached cells. This qualitative, separate-run comparison cannot establish safety or tumor selectivity. A publication-coded summary of the cross-model observations is provided in Table 5.
Entries in Table 5 summarize unblinded report-level observations and are not directly comparable effect sizes. Different laboratory stocks were evaluated in separate experiments, and later nominal exposure descriptions could not be harmonized fully.
3.7. The SYTOX-Associated Output Was Not Analytically Interpretable as Cumulative Cell Death
Several complete-medium conditions had high apparent initial SYTOX-associated values that declined rapidly. For M4, the output fell from approximately 74% at 0 h to approximately 5% at 4 h and below 2% at 6 h. Such reversal is inconsistent with a straightforward cumulative measure of membrane-compromised cells.
Without the required matrix-only, dye-only, no-cell, and orthogonal controls, the source of the pattern cannot be assigned. Optical, fluorescence, sedimentation, detachment, denominator, or segmentation effects remain possible [27,28]. The channel was therefore excluded from biological and mechanistic claims [29] (Figure 6).
3.8. Integrated Result
The integrated dataset identifies two distinct experimental layers. First, analytical interpretability depended strongly on exposure conditions: high nominal inputs generated overt optical and extracellular interference, whereas lower-input conditions permitted direct observation and time-resolved imaging. Second, once an interpretable window had been established, coded matrices generated distinct image-derived trajectories whose magnitude and direction depended on culture environment and experimental model. Within the single quantitative run, M4 showed the lowest sustained complete-medium trajectory, but this pattern was not conserved after serum withdrawal. The central result is therefore not a generalized biological effect of a matrix class, but the demonstration that matrix-specific assay qualification is necessary before a persistent image-derived difference can be separated from obvious analytical interference and advanced toward biological confirmation.
4. Discussion
4.1. Sequential Assay Qualification as the Principal Methodological Finding
The principal contribution of this study is the reconstruction of a sequential qualification pathway for live-cell imaging in the presence of physically complex multicomponent matrices. At high nominal inputs, opacity and extracellular material restricted direct observation; progressive reduction of nominal exposure improved field interpretability and permitted subsequent kinetic analysis. This sequence is important because an image-analysis system can produce numerical output even when the underlying field is analytically compromised.
The workflow separates two questions that are frequently conflated: whether the analytical system can reliably observe cells in the presence of the test matrix, and whether, once analytical interpretability has been established, an observed trajectory warrants biological investigation. Only the second question becomes meaningful after the first has been addressed. The findings therefore position assay qualification as part of experimental design rather than as troubleshooting performed only after anomalous data appear.
4.2. Interpretation of the Within-Run M4 Trajectory
M4 was associated with the lowest sustained complete-medium trajectory in the single quantitative run. The relative difference from control increased from -13.3% at 6 h to -44.2% at 47.5 h. Its low mean technical CV reflects agreement among three wells within that run only. The endpoint below the normalized baseline does not identify whether cell number, spreading, adhesion, detachment, morphology, or segmentation changed.
The mechanism cannot be resolved from imaging alone. A confirmatory study should pair direct nuclear counts with orthogonal measures of metabolic viability [30], membrane integrity [31], apoptosis, and cell-cycle state [32], while reviewing raw images under fixed prospective segmentation settings.
Accordingly, M4 is best interpreted as a prominent within-run trajectory selected for confirmatory investigation, rather than as a prospectively validated inhibitor or therapeutic candidate.
4.3. Limits of Mechanistic Inference
Complex matrices may exhibit coupled physicochemical, compositional, and cell-interaction effects [33], and related processed phospholipoproteic preparations have therefore been evaluated through integrated proteomic and short-term live-cell workflows [34]. However, neither the neutralized composition nor the available endpoints in the present study permit constituent- or pathway-level attribution.
The experiments did not measure oxidative stress, mitochondrial function, membrane remodeling, transcriptional signaling, cytokine release, proteostasis, cell cycle, or differentiation markers. Consequently, the image-derived trajectory does not establish cytostasis, cytotoxicity, stress adaptation, or any specific signaling mechanism.
Mechanistic follow-up should use prespecified, independently replicated endpoints only after optical compatibility is established. Candidate measurements include reactive oxygen species, glutathione status, mitochondrial membrane potential, lipid peroxidation, stress-activated kinases, cell-cycle checkpoints, and direct cell-number measurements.
4.4. Temporal Resolution and Biphasic Behavior
M2 showed early elevation followed by a later lower signal in both media. Possible explanations include changes in spreading, adhesion, segmentation, uptake, metabolism, or stress response, but none was tested. The early phase cannot be interpreted as increased cell number.
This trajectory illustrates the value of continuous imaging [35]. Isolated early and late endpoints would have produced substantially different descriptions of the same condition. Time-resolved acquisition therefore provides information not only about magnitude but also about trajectory shape, transient behavior, stabilization, and possible analytical artifacts. Future studies should prespecify primary time points while retaining kinetic acquisition for trajectory characterization and artifact review.
4.5. Pooled Conditions and the Limits of Interaction Inference
The coded pools yielded trajectories that differed from individually coded matrices. Because exact exposure equivalence, vehicle balance, physicochemical behavior, and independent replication were unavailable, these differences cannot be assigned to biological or physicochemical interaction.
A formal interaction claim would require individual concentration-response curves, exposure-equivalent fixed-ratio matrices, matched total input and vehicle controls, and quantitative reference-model analysis [36]. The present observations therefore support confirmatory mixture-design experiments rather than synergy or antagonism claims. Importantly, Pool A and Pool B demonstrate that a pooled multicomponent condition cannot be assumed to behave as the arithmetic extension of its coded individual components.
4.6. Model-Dependent Experimental Heterogeneity
The U87-designated and SiHa stocks showed more prominent reported differences than T98G and A375 in their respective experiments. Because the stocks were evaluated in separate runs without standardized quantitative endpoints, this heterogeneity is hypothesis-generating and does not establish differential sensitivity [37].
Limited reported change in A375 under complete-medium conditions argues against a uniform immediate image-derived effect across all tested tumor-derived stocks, but it cannot establish biological resistance.
The HMC3 observations provide only a preliminary comparator hypothesis [38]. They do not demonstrate tumor selectivity or safety because the assessment was qualitative, performed in a separate run, and strongly affected by serum withdrawal. These observations reinforce the broader principle that the behavior of a complex matrix cannot be generalized from a single cell model without standardized cross-model confirmation.
4.7. Culture Environment as a Biological and Analytical Variable
Culture environment materially changed the within-run pattern. Serum proteins may alter matrix dispersion and free concentrations [39,40], while serum deprivation changes cellular proliferation, stress signaling, adhesion, morphology, and metabolism [41,42]. Complete and serum-free basal media must therefore be treated as different biological and analytical systems.
The M4 discordance is particularly informative: the same coded condition that exhibited the lowest sustained trajectory in complete medium did not reproduce that trajectory under serum-free basal conditions. This indicates strong context dependence, although the design cannot distinguish matrix-serum interactions from cellular responses to serum deprivation. Culture environment should therefore be treated prospectively as an experimental variable rather than as a simple background condition.
4.8. Implications for Live-Cell Experimental Biology
The concentration studies and SYTOX-associated kinetics converge on a broader methodological principle: physically complex matrices can compromise optical readouts before biological interpretation begins. Related phospholipoproteomic work has emphasized continuous kinetic documentation, viability monitoring, and traceable data handling under non-destructive ex vivo conditions [43]. In the present study, high-exposure opacity, extracellular material, and rapidly declining time-zero fluorescence indicate that matrix-only, reagent-only, and no-cell controls are essential when complex matrices are evaluated by fluorescence or image segmentation.
Future live-cell imaging studies of such systems should include matrix-only wells, matrix-plus-reagent wells without cells, untreated cells without fluorescent reagent, matched vehicle controls, validated positive analytical controls, fluorescence-background assessment, sedimentation documentation, raw-image verification, fixed prospective segmentation settings, and measurements of pH, osmolarity, and well-level distribution. Vessel geometry should also be documented because it may influence sedimentation and local effective exposure [14].
This assay-qualification pathway has broader methodological relevance for dense or colloidal preparations [44]. Such matrices should not automatically be introduced into workflows optimized for transparent, completely soluble small molecules. Analytical compatibility should instead be demonstrated before measured image-derived differences are interpreted as biological responses. Appropriate analytical qualification strengthens, rather than competes with, biological discovery by defining which signals remain after obvious physical and optical confounders have been controlled.
4.9. Translational Boundary for Nutraceutical Matrices
The study establishes an exploratory in vitro imaging framework under defined culture conditions. It does not establish that oral consumption produces the same cellular exposure.
For a nutraceutical matrix, any future transition from cell-based observation to consumption-related biological interpretation would require standardized simulated digestion [45], including validated approaches such as INFOGEST [46], followed by evaluation of the bioaccessible fraction at physiologically plausible concentrations [47]. Human exposure would subsequently require pharmacokinetic or biomarker evidence [48,49].
The current findings should therefore be understood at the experimental matrix-cell interface. Their translational value lies in identifying how a complex formulation can be studied more rigorously, defining which readouts are analytically trustworthy, and establishing the confirmatory sequence necessary before mechanistic or physiological interpretation.
4.10. Limitations and Confirmatory Requirements
This study was retrospective and not preregistered; no power calculation or prospective endpoint hierarchy was used. Principal limitations were a single quantitative run with technical rather than biological replicates; post hoc identification of the most prominent trajectories; incomplete raw metadata for IncuCyte acquisition and segmentation; lack of vehicle-matched, matrix-only, fluorescence, no-cell, and positive controls; incomplete laboratory-stock authentication, passage, and mycoplasma documentation; nominal input ambiguity; formulation identities unavailable in the public dataset; qualitative, unblinded cross-model assessment; optical interference; an uninterpretable early SYTOX-associated channel; serum-deprivation confounding; and absence of digestion, animal, or human studies. Low technical dispersion does not establish biological reproducibility. These limitations define the current evidentiary level and identify the minimum design requirements for prospective confirmation summarized in Table 6.
5. Conclusions
This study demonstrates that live-cell imaging of physically complex multicomponent matrices benefits from sequential fit-for-purpose qualification before quantitative image-derived signals are assigned biological meaning. High nominal inputs were dominated by opacity and extracellular interference, whereas lower-input conditions established an experimental window in which direct observation and time-resolved imaging became feasible.
Within that qualified window, coded matrices generated distinct trajectories. M4 showed the lowest sustained complete-medium U87 image-derived trajectory in the single quantitative run, while M2 showed the lowest cumulative trajectory under serum-free basal conditions. The lack of conservation of the M4 pattern across culture environments and the heterogeneous cross-model observations demonstrate that these signals are strongly context dependent.
The rapidly declining early SYTOX-associated output further illustrates how an apparently quantitative readout can become biologically uninterpretable in the absence of appropriate matrix, reagent, and no-cell controls. The principal contribution is therefore methodological: analytical qualification, artifact control, time-resolved observation, and orthogonal confirmation should be treated as a sequential experimental continuum when complex biological or nutraceutical matrices are studied by live-cell imaging.
The resulting framework provides a traceable basis for independently replicated, vehicle-matched, concentration-response studies with direct cell-number measurements and orthogonal biological endpoints.
Supplementary Materials
The following supporting information can be downloaded at the website of this paper posted on Preprints.org. The accompanying Supplementary Information contains Tables S1-S8 and Figures S1-S4, including the publication-code and disclosure architecture, sequential assay-qualification framework, quantitative U87 plate assignment, acquisition schedule, missingness and exclusion ledger, descriptive calculation methods, early death-associated signal summaries, image-derived endpoint and AUC results, cross-model qualitative observations, technical-well distributions, and the evidence-to-claim boundary.
Author Contributions
Conceptualization, R.G.-S.; methodology, R.G.-S., F.G.-C. and N.M.-G.; validation, R.G.-S., F.G.-C. and N.M.-G.; formal analysis, R.G.-S.; investigation, F.G.-C., N.M.-G., I.M., J.I., F.K. and A.L.; resources, R.G.-S.; data curation, F.G.-C., N.M.-G., I.M., J.I., F.K. and A.L.; writing—original draft preparation, R.G.-S.; writing—review and editing, R.G.-S., I.R. and C.P.-V.; visualization, R.G.-S. and A.T.; supervision, R.G.-S.; project administration, R.G.-S.; funding acquisition, R.G.-S. All authors have read and agreed to the published version of the manuscript.
Funding
This research was supported by Fundación Biotech under grant number FB-20222-1091. The coded nutraceutical matrices evaluated in this study were supplied by Biogenica Foundation. The Article Processing Charge (APC) was funded by Biogenica Foundation. The funders had no role in the design of the study; in the collection, analysis, or interpretation of data; in the writing of the manuscript; or in the decision to publish the results.
Institutional Review Board Statement
Not applicable. This retrospective in vitro study analyzed archived experimental outputs generated using established laboratory cell-line stocks and coded nutraceutical matrices. None of the cell-line stocks was newly established or generated de novo for the present study. No human participants were recruited, no new human biological samples were collected, no identifiable donor information or associated clinical data were accessed, and no animals were involved in the study.
Informed Consent Statement
Not applicable. No human participants, newly collected human biological material, identifiable donor information, or associated clinical data were involved in this study.
Data Availability Statement
The original contributions presented in this study are included in the article and the Supplementary Information. Further inquiries can be directed to the corresponding author.
Acknowledgments
The authors thank the technical teams who contributed to the experimental and analytical work. AI-assisted technologies were used during manuscript preparation for editorial and organizational support. They were not used to generate, modify, infer, or analyze experimental data or numerical results. All outputs were reviewed and validated by the authors, who take full responsibility for the final content.
Conflicts of Interest
Some authors are affiliated with OGRD Alliance LLC or collaborating entities involved in scientific research and development related to the evaluated coded nutraceutical matrices. Biogenica Foundation supplied the evaluated matrices and funded the Article Processing Charge. These relationships are disclosed for transparency. The material provider and funding entities had no role in data interpretation, manuscript drafting, peer-review response, or the decision to submit the work for publication. The authors declare no other conflicts of interest.
Abbreviations
| Abbreviation | Definition |
| AUC | Area under the curve |
| CV | Coefficient of variation |
| DMEM | Dulbecco’s Modified Eagle Medium |
| FBS | Fetal bovine serum |
| HMC3 | Human microglial clone 3 |
| PBS | Phosphate-buffered saline |
| SD | Standard deviation |
| SYTOX | Membrane-impermeant nucleic-acid dye used as a death-associated fluorescence reagent |
References
- Nicolescu, A.; Babotă, M.; Barros, L.; Rocchetti, G.; Lucini, L.; Tanase, C.; Mocan, A.; Bunea, C.I.; Crișan, G. Bioaccessibility and Bioactive Potential of Different Phytochemical Classes from Nutraceuticals and Functional Foods. Front. Nutr. 2023, 10, 1184535. [Google Scholar] [CrossRef]
- van Straten, D.; Sork, H.; van de Schepop, L.; Frunt, R.; Ezzat, K.; Schiffelers, R.M. Biofluid-Specific Protein Coronas Affect Lipid Nanoparticle Behavior In Vitro. J. Control. Release 2024, 373, 481–492. [Google Scholar] [CrossRef]
- Escher, B.I.; Lamoree, M.; Antignac, J.-P.; Scholze, M.; Herzler, M.; Hamers, T.; Jensen, T.K.; Audebert, M.; Busquet, F.; Maier, D.; et al. Mixture Risk Assessment of Complex Real-Life Mixtures—The PANORAMIX Project. Int. J. Environ. Res. Public Health 2022, 19, 12990. [Google Scholar] [CrossRef]
- Rønneberg, L.; Kirk, P.D.W.; Zucknick, M. Dose–Response Prediction for In Vitro Drug Combination Datasets: A Probabilistic Approach. BMC Bioinform. 2023, 24, 161. [Google Scholar] [CrossRef]
- Kim, S.; Kang, K.; Kim, H.; Seo, M. In Vitro Toxicity Screening of Fifty Complex Mixtures in HepG2 Cells. Toxics 2024, 12, 126. [Google Scholar] [CrossRef]
- Featherston, T.; Helem, S.; Smyth, L.C.D.; Hampton, M.B.; Paumann-Page, M. Comparing Automated Cell Imaging with Conventional Methods of Measuring Cell Proliferation and Viability. Toxicol. Mech. Methods 2024, 34, 886–896. [Google Scholar] [CrossRef]
- Özkaya, A.B.; Geyik, C. From Viability to Cell Death: Claims with Insufficient Evidence in High-Impact Cell Culture Studies. PLoS ONE 2022, 17, e0250754. [Google Scholar] [CrossRef]
- Mikheeva, A.M.; Bogomolov, M.A.; Gasca, V.A.; Sementsov, M.V.; Spirin, P.V.; Prassolov, V.S.; Lebedev, T.D. Improving the Power of Drug Toxicity Measurements by Quantitative Nuclei Imaging. Cell Death Discov. 2024, 10, 181. [Google Scholar] [CrossRef]
- Pylvänäinen, J.W.; Gómez-de-Mariscal, E.; Henriques, R.; Jacquemet, G. Live-Cell Imaging in the Deep Learning Era. Curr. Opin. Cell Biol. 2023, 85, 102271. [Google Scholar] [CrossRef]
- Shroff, H.; Testa, I.; Jug, F.; Manley, S. Live-Cell Imaging Powered by Computation. Nat. Rev. Mol. Cell Biol. 2024, 25, 443–463. [Google Scholar] [CrossRef]
- Tapia-Rojas, S.; García-Paitán, M.; Del Rosario-Chavarri, J.; Santiani, A.; Alvarez-Vega, S.; Amiel-Pérez, J.; Mayanga-Herrera, A. Medicinal Plant Extracts Interfere in Gastric Cancer Stem Cells Fluorescence-Based Assays. Saudi J. Biol. Sci. 2024, 31, 104000. [Google Scholar] [CrossRef]
- Tan, L.; Hirte, S.; Palmacci, V.; Stork, C.; Kirchmair, J. Tackling Assay Interference Associated with Small Molecules. Nat. Rev. Chem. 2024, 8, 319–339. [Google Scholar] [CrossRef]
- Martin, L.; Lopez, K.; Fritz, S.; Easterling, C.P.; Krawchuck, J.A.; Poerwoprajitno, A.R.; Xu, W. Determination of the Optical Interference of Iron Oxide Nanoparticles in Fluorometric Cytotoxicity Assays. Heliyon 2024, 10, e25378. [Google Scholar] [CrossRef]
- Glaubitz, C.; Haeni, L.; Sušnik, E.; Rothen-Rutishauser, B.; Balog, S.; Petri-Fink, A. The Influence of Liquid Menisci on Nanoparticle Dosimetry in Submerged Cells. Small 2023, 19, e2206903. [Google Scholar] [CrossRef]
- Szulczewski, J.M.; Yesilkoy, F.; Ulland, T.K.; Bartels, R.; Millis, B.A.; Boppart, S.A.; Eliceiri, K.W. To Label or Not: The Need for Validation in Label-Free Imaging. J. Biomed. Opt. 2024, 29, S22717. [Google Scholar] [CrossRef]
- Pierce, L.; Anderson, H.; Sarkar, S.; Bauer, S.R.; Sarkar, S. Experimental and Computational Approach to Establish Fit-for-Purpose Cell Viability Assays. Regen. Med. 2024, 19, 27–45. [Google Scholar] [CrossRef]
- Souren, N.Y.; Fusenig, N.E.; Heck, S.; Dirks, W.G.; Capes-Davis, A.; Bianchini, F.; Plass, C. Cell Line Authentication: A Necessity for Reproducible Biomedical Research. EMBO J. 2022, 41, e111307. [Google Scholar] [CrossRef]
- Weiskirchen, R. Research Reporting Guidelines for Cell Lines: More than Just a Recommendation. Ann. Transl. Med. 2023, 11, 421. [Google Scholar] [CrossRef]
- Hirst, T.C.; Wilson, E.; Browne, D.; Sena, E.S. A Machine Learning-Assisted Systematic Review of Preclinical Glioma Modeling: Is Practice Changing with the Times? Neurooncol. Adv. 2024, 6, vdae193. [Google Scholar] [CrossRef]
- Gunasegaran, B.; Krishnamurthy, S.; Chow, S.S.; Villanueva, M.D.; Guller, A.; Ahn, S.B.; Heng, B. Comparative Analysis of HMC3 and C20 Microglial Cell Lines Reveals Differential Myeloid Characteristics and Responses to Immune Stimuli. Immunology 2025, 175, 84–102. [Google Scholar] [CrossRef]
- Giraulo, C.; Turiello, R.; Orlando, L.; Leonardelli, S.; Landsberg, J.; Belvedere, R.; Rolshoven, G.; Müller, C.E.; Hölzel, M.; Morello, S. The CD73 Is Induced by TGF-β1 Triggered by Nutrient Deprivation and Highly Expressed in Dedifferentiated Human Melanoma. Biomed. Pharmacother. 2023, 165, 115225. [Google Scholar] [CrossRef]
- Gidda, A.K.; Chittaranjan, S.; Gorski, S.M. Real-Time IncuCyte® Assay for the Dynamic Assessment of Live and Dead Cells in 2D Cultures. Bio-protocol 2025, 15, e5210. [Google Scholar] [CrossRef]
- Zweifach, A. Determining How Many Cells to Average for Statistical Testing of Microscopy Experiments. J. Cell Biol. 2024, 223, e202401074. [Google Scholar] [CrossRef]
- Senft, R.A.; Diaz-Rohrer, B.; Colarusso, P.; Swift, L.; Jamali, N.; Jambor, H.; Pengo, T.; Brideau, C.; Montero Llopis, P.; Uhlmann, V.; et al. A Biologist’s Guide to Planning and Performing Quantitative Bioimaging Experiments. PLoS Biol. 2023, 21, e3002167. [Google Scholar] [CrossRef]
- Kari, S.; Subramanian, K.; Altomonte, I.A.; Murugesan, A.; Yli-Harja, O.; Kandhavelu, M. Programmed Cell Death Detection Methods: A Systematic Review and a Categorical Comparison. Apoptosis 2022, 27, 482–508. [Google Scholar] [CrossRef]
- Ianevski, A.; Giri, A.K.; Aittokallio, T. SynergyFinder 3.0: An Interactive Analysis and Consensus Interpretation of Multi-Drug Synergies across Multiple Samples. Nucleic Acids Res. 2022, 50, W739–W743. [Google Scholar] [CrossRef]
- Dahlin, J.L.; Close, D.A.; Johnston, P.A.; Haney, S.A.; Titus, S.A.; Wagner, B.K.; Trask, O.J. Interference and Artifacts in High-Content Screening. In Assay Guidance Manual [Internet]; Markossian, S., Grossman, A., Baskir, H., et al., Eds.; Eli Lilly & Company and the National Center for Advancing Translational Sciences: Bethesda, MD, USA, 2025; NCBI Bookshelf ID: NBK615088. [Google Scholar] [PubMed]
- Cheimarios, N.; Pem, B.; Tsoumanis, A.; Ilić, K.; Vinković Vrček, I.; Melagraki, G.; Bitounis, D.; Isigonis, P.; Dusinska, M.; Lynch, I.; et al. An In Vitro Dosimetry Tool for the Numerical Transport Modeling of Engineered Nanomaterials Powered by the Enalos RiskGONE Cloud Platform. Nanomaterials 2022, 12, 3935. [Google Scholar] [CrossRef]
- Lefsih, K.; Radja, L.; Khettar, F.; Berkoud, M. Cell Viability and Cytotoxicity Assays: Biochemical Elements and Cellular Compartments. Cell Biochem. Funct. 2024, 42, e4007. [Google Scholar] [CrossRef]
- Madorran, E.; Ambrož, M.; Knez, J.; Sobočan, M. An Overview of the Current State of Cell Viability Assessment Methods Using OECD Classification. Int. J. Mol. Sci. 2025, 26, 220. [Google Scholar] [CrossRef]
- Eder, K.M.; Marzi, A.; Wågbø, A.M.; Vermeulen, J.P.; de la Fonteyne-Blankestijn, L.J.J.; Rösslein, M.; Ossig, R.; Klinkenberg, G.; Vandebriel, R.J.; Schnekenburger, J. Standardization of an In Vitro Assay Matrix to Assess Cytotoxicity of Organic Nanocarriers: A Pilot Interlaboratory Comparison. Drug Deliv. Transl. Res. 2022, 12, 2187–2206. [Google Scholar] [CrossRef]
- Lieschke, E.; Wang, Z.; Chang, C.; Weeden, C.E.; Kelly, G.L.; Strasser, A. Flow Cytometric Single Cell-Based Assay to Simultaneously Detect Cell Death, Cell Cycling, DNA Content and Cell Senescence. Cell Death Differ. 2022, 29, 1004–1012. [Google Scholar] [CrossRef]
- Wang, B.; LvYe, J.; Yang, S.; Shi, Y.; Chen, Q. Critical Review of Food Colloidal Delivery System for Bioactive Compounds: Physical Characterization and Application. Foods 2024, 13, 2596. [Google Scholar] [CrossRef]
- Gutiérrez-Sandoval, R.; Gutiérrez-Castro, F.; Muñoz-Godoy, N.; Rivadeneira, I.; Lagos, A.; Iturra, J.; Krakowiak, F.; Muñoz, I.; Toledo, A. Proteomic Stability and Ex Vivo Compatibility of a Processed Phospholipoproteic Secretome-Derived Formulation. Pharmaceutics 2026, 18, 847. [Google Scholar] [CrossRef]
- Gutiérrez-Sandoval, R.; Gutiérrez-Castro, F.; Muñoz-Godoy, N.; Rivadeneira, I.; Sobarzo, A.; Iturra, J.; Muñoz, I.; Peña-Vargas, C.; Vidal, M.; Krakowiak, F. Real-Time Functional Stratification of Tumor Cell Lines Using a Non-Cytotoxic Phospholipoproteomic Platform: A Label-Free Ex Vivo Model. Biology 2025, 14, 953. [Google Scholar] [CrossRef]
- Duarte, D.; Vale, N. Evaluation of Synergism in Drug Combinations and Reference Models for Future Orientations in Oncology. Curr. Res. Pharmacol. Drug Discov. 2022, 3, 100110. [Google Scholar] [CrossRef] [PubMed]
- Xia, F.; Allen, J.; Balaprakash, P.; Brettin, T.; Garcia-Cardona, C.; Clyde, A.; Cohn, J.; Doroshow, J.; Duan, X.; Dubinkina, V.; et al. A Cross-Study Analysis of Drug Response Prediction in Cancer Cell Lines. Brief. Bioinform. 2022, 23, bbab356. [Google Scholar] [CrossRef]
- Woolf, Z.; Stevenson, T.J.; Lee, K.; Highet, B.; Macapagal Foliaki, J.; Ratiu, R.; Rustenhoven, J.; Correia, J.; Schweder, P.; Heppner, P.; et al. In Vitro Models of Microglia: A Comparative Study. Sci. Rep. 2025, 15, 15621. [Google Scholar] [CrossRef]
- Önal Acet, B.; Gül, D.; Stauber, R.H.; Odabaşı, M.; Acet, Ö. A Review for Uncovering the “Protein–Nanoparticle Alliance”: Implications of the Protein Corona for Biomedical Applications. Nanomaterials 2024, 14, 823. [Google Scholar] [CrossRef]
- Kolli, A.R. Deriving Protein Binding-Corrected Chemical Concentrations for In Vitro Testing. Clin. Transl. Sci. 2023, 16, 2123–2129. [Google Scholar] [CrossRef] [PubMed]
- Bhowmick, T.; Biswas, S.; Mukherjee, A. Cellular Response during Cellular Starvation: A Battle for Cellular Survivability. Cell Biochem. Funct. 2024, 42, e4101. [Google Scholar] [CrossRef]
- Pfeifer, L.M.; Sensbach, J.; Pipp, F.; Werkmann, D.; Hewitt, P. Increasing Sustainability and Reproducibility of In Vitro Toxicology Applications: Serum-Free Cultivation of HepG2 Cells. Front. Toxicol. 2024, 6, 1439031. [Google Scholar] [CrossRef]
- Gutiérrez-Sandoval, R.; Gutiérrez-Castro, F.; Muñoz-Godoy, N.; Rivadeneira, I.; Lagos, A.; Muñoz, I.; Iturra, J.; Krakowiak, F.; Peña-Vargas, C.; Vidal, M.; et al. Ex Vivo Traceability Platform for Phospholipoproteomic Formulations: Functional Evidence Without Clinical Exposure. Biomedicines 2025, 13, 2101. [Google Scholar] [CrossRef] [PubMed]
- Glenn, I.S.; Hall, L.N.; Khalid, M.M.; Ott, M.; Shoichet, B.K. Colloidal Aggregation Confounds Cell-Based Covid-19 Antiviral Screens. J. Med. Chem. 2024, 67, 10263–10274. [Google Scholar] [CrossRef]
- Ośko, J.; Nasierowska, K.; Grembecka, M. Application of In Vitro Digestion Models in the Evaluation of Dietary Supplements. Foods 2024, 13, 2135. [Google Scholar] [CrossRef]
- Zhou, H.; Tan, Y.; McClements, D.J. Applications of the INFOGEST In Vitro Digestion Model to Foods: A Review. Annu. Rev. Food Sci. Technol. 2023, 14, 135–156. [Google Scholar] [CrossRef]
- Kondrashina, A.; Arranz, E.; Cilla, A.; Faria, M.A.; Santos-Hernández, M.; Miralles, B.; Hashemi, N.; Rasmussen, M.K.; Young, J.F.; Barberá, R.; et al. Coupling In Vitro Food Digestion with In Vitro Epithelial Absorption; Recommendations for Biocompatibility. Crit. Rev. Food Sci. Nutr. 2024, 64, 9618–9636. [Google Scholar] [CrossRef]
- Schmiech, M.; Abdel-Kahaar, E.; Ulrich, J.; Pfeiffer, M.; Duweb, A.; Zolk, O.; Syrovets, T.; Simmet, T. Single-Dose Comparative Pharmacokinetic/Pharmacodynamic Study of a Micellar Formulation versus a Native Boswellia serrata Dry Extract in Healthy Volunteers. Phytomedicine 2024, 132, 155863. [Google Scholar] [CrossRef]
- Landberg, R.; Karra, P.; Hoobler, R.; Loftfield, E.; Huybrechts, I.; Rattner, J.I.; Noerman, S.; Claeys, L.; Neveu, V.; Vidkjaer, N.H.; et al. Dietary Biomarkers—An Update on Their Validity and Applicability in Epidemiological Studies. Nutr. Rev. 2024, 82, 1260–1280. [Google Scholar] [CrossRef]
Figure 1.
Evidence landscape of the sequential assay-qualification program. Recorded nominal matrix inputs were progressively reduced to improve image interpretability before the single quantitative U87 kinetic run and qualitative cross-model extension. The stages are compatibility screens and do not constitute a formal concentration-response series.
Figure 1.
Evidence landscape of the sequential assay-qualification program. Recorded nominal matrix inputs were progressively reduced to improve image interpretability before the single quantitative U87 kinetic run and qualitative cross-model extension. The stages are compatibility screens and do not constitute a formal concentration-response series.
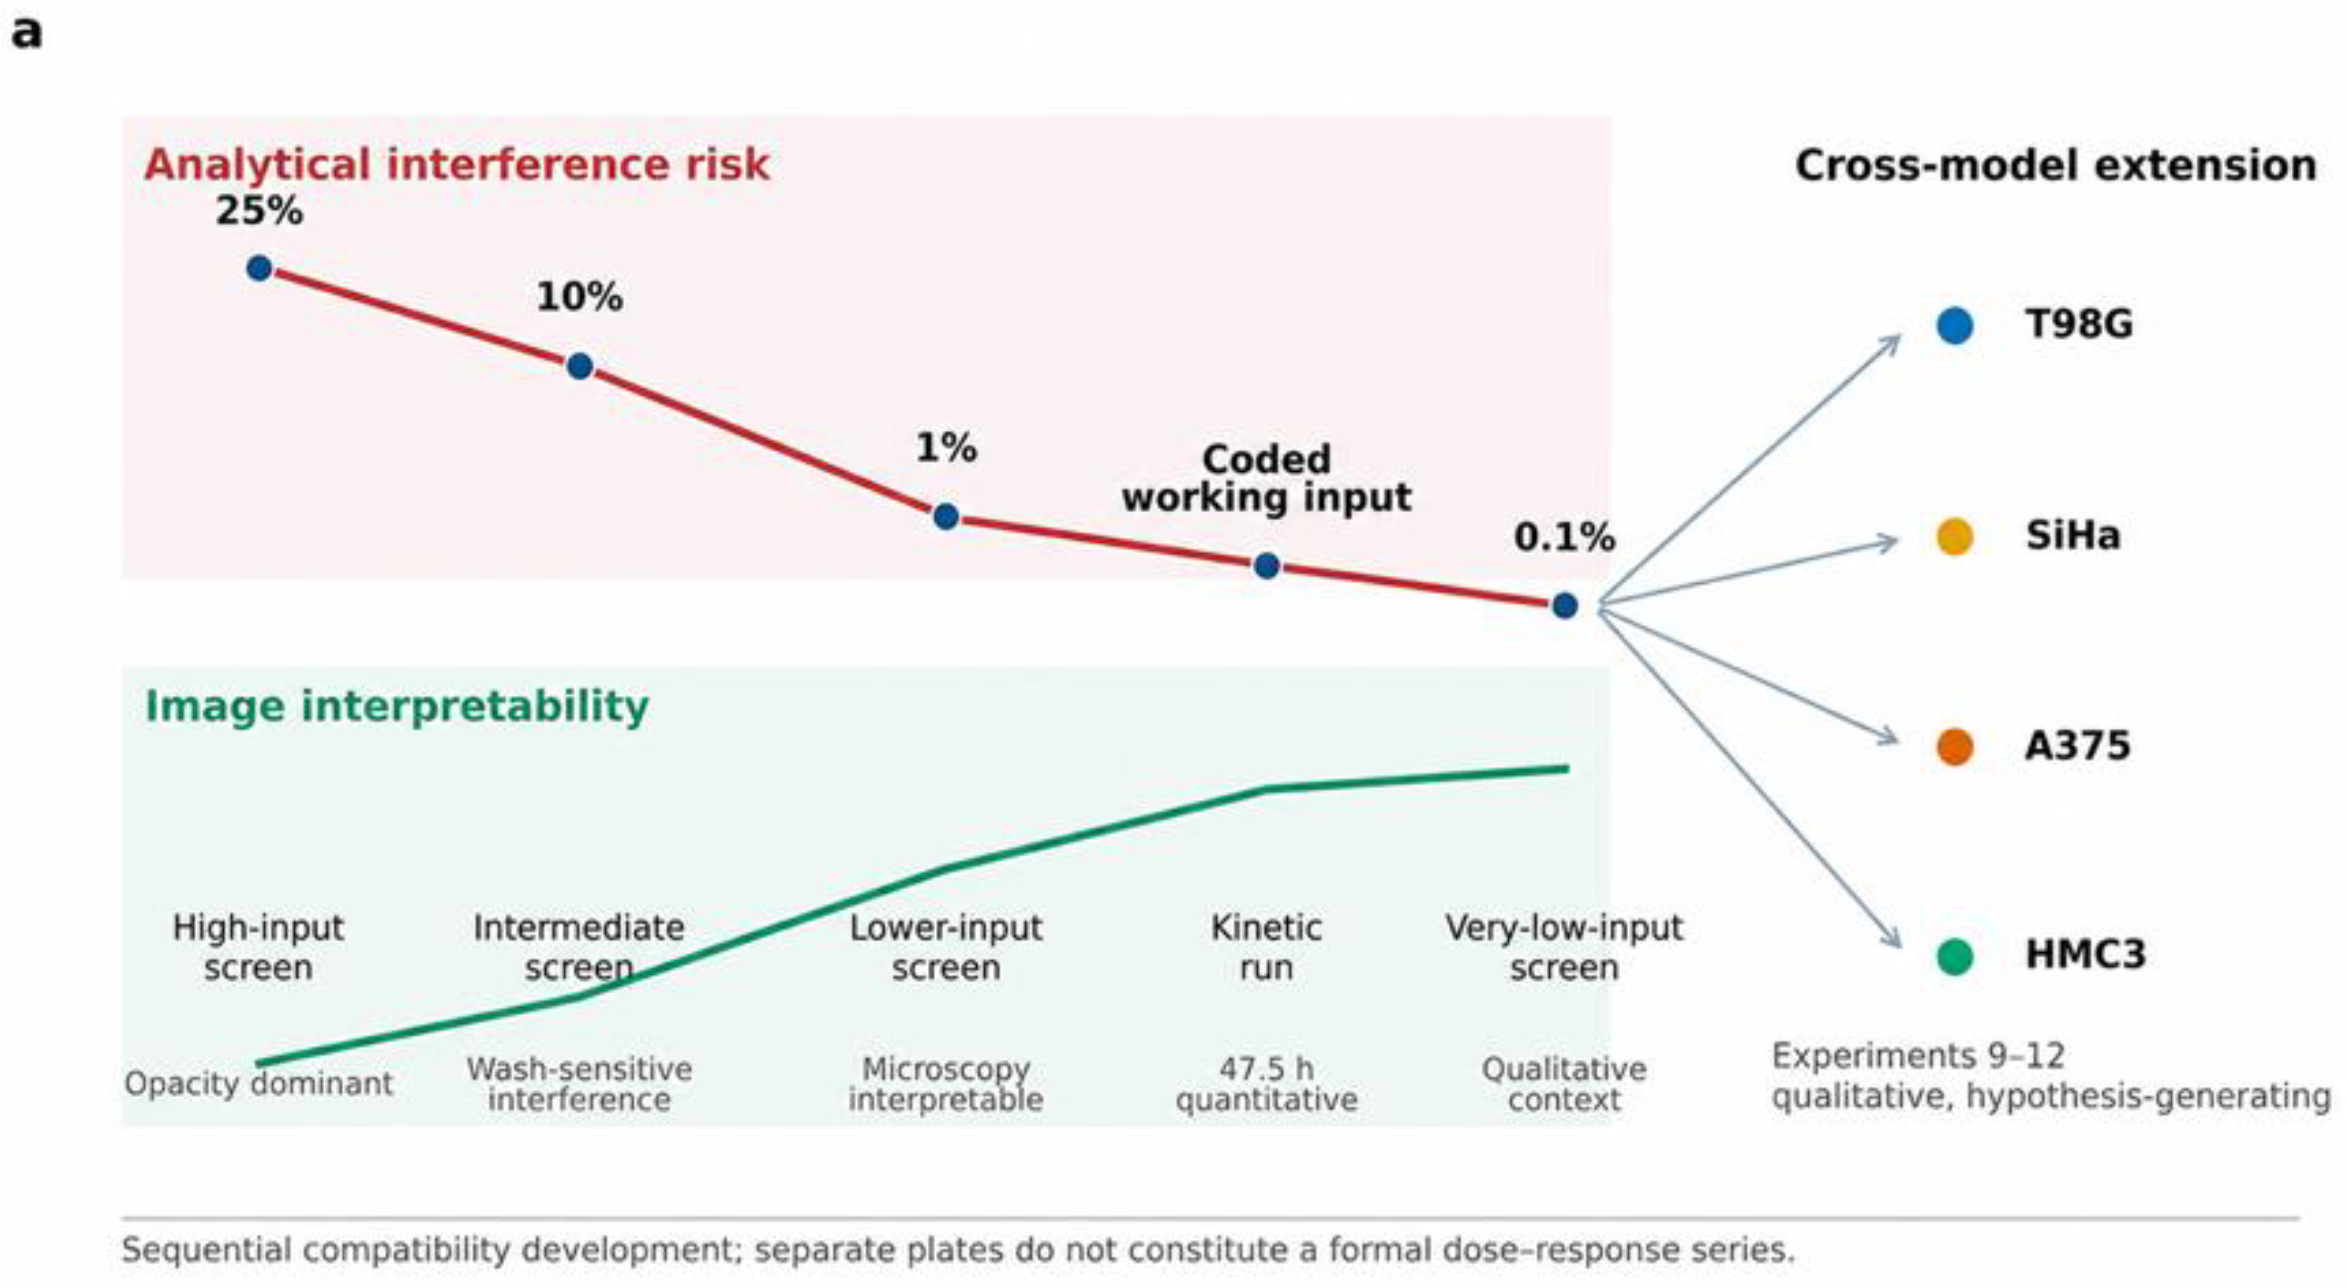
Figure 2.
Complete-medium U87 kinetic analysis. (a) Mean image-derived trajectories for the matched control and six coded matrices; shaded bands show the sample standard deviation (SD) across the three technical wells for Control and M4. (b) Time-resolved relative difference between M4 and its matched control. n = 3 technical wells per condition in one experimental run; no independent biological replication or inferential statistics were applied.
Figure 2.
Complete-medium U87 kinetic analysis. (a) Mean image-derived trajectories for the matched control and six coded matrices; shaded bands show the sample standard deviation (SD) across the three technical wells for Control and M4. (b) Time-resolved relative difference between M4 and its matched control. n = 3 technical wells per condition in one experimental run; no independent biological replication or inferential statistics were applied.
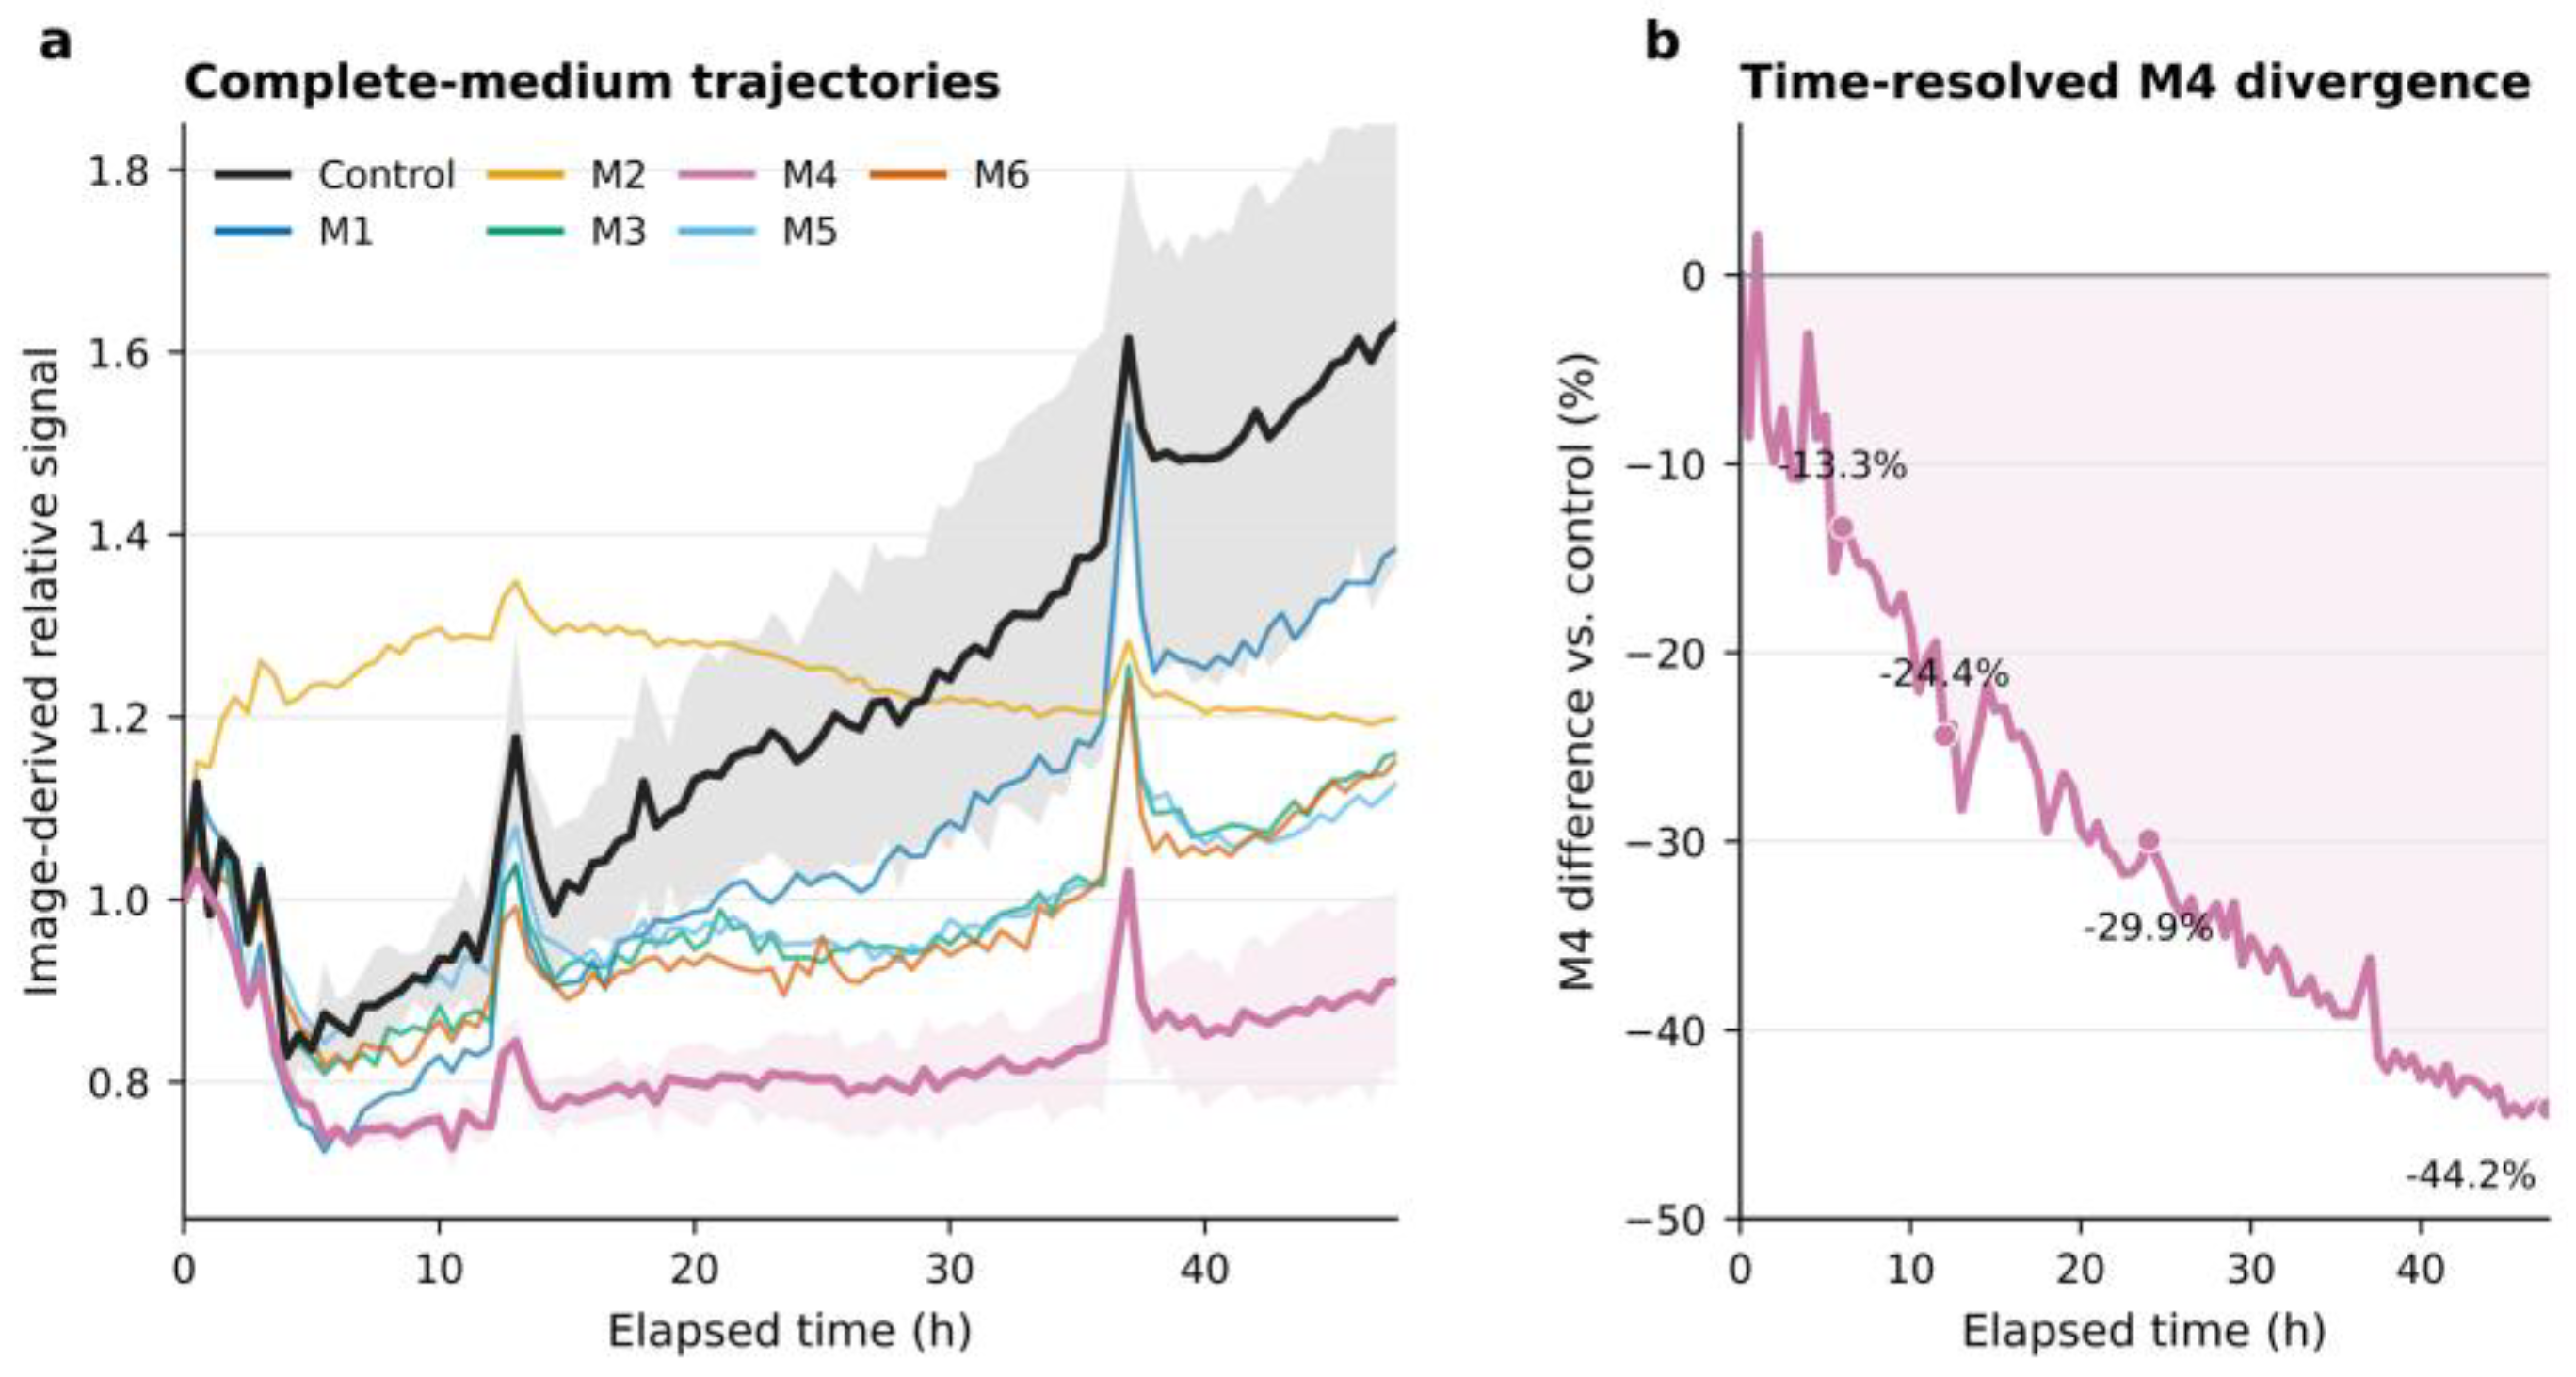
Figure 3.
Image-derived trajectories of coded individual and pooled conditions. (a) Matched control, M4, Pool A, and Pool B trajectories in complete medium. (b) Descriptive AUC and 47.5 h endpoint differences relative to control. The observations do not identify a physicochemical or biological interaction. n = 3 technical wells per condition in one experimental run.
Figure 3.
Image-derived trajectories of coded individual and pooled conditions. (a) Matched control, M4, Pool A, and Pool B trajectories in complete medium. (b) Descriptive AUC and 47.5 h endpoint differences relative to control. The observations do not identify a physicochemical or biological interaction. n = 3 technical wells per condition in one experimental run.
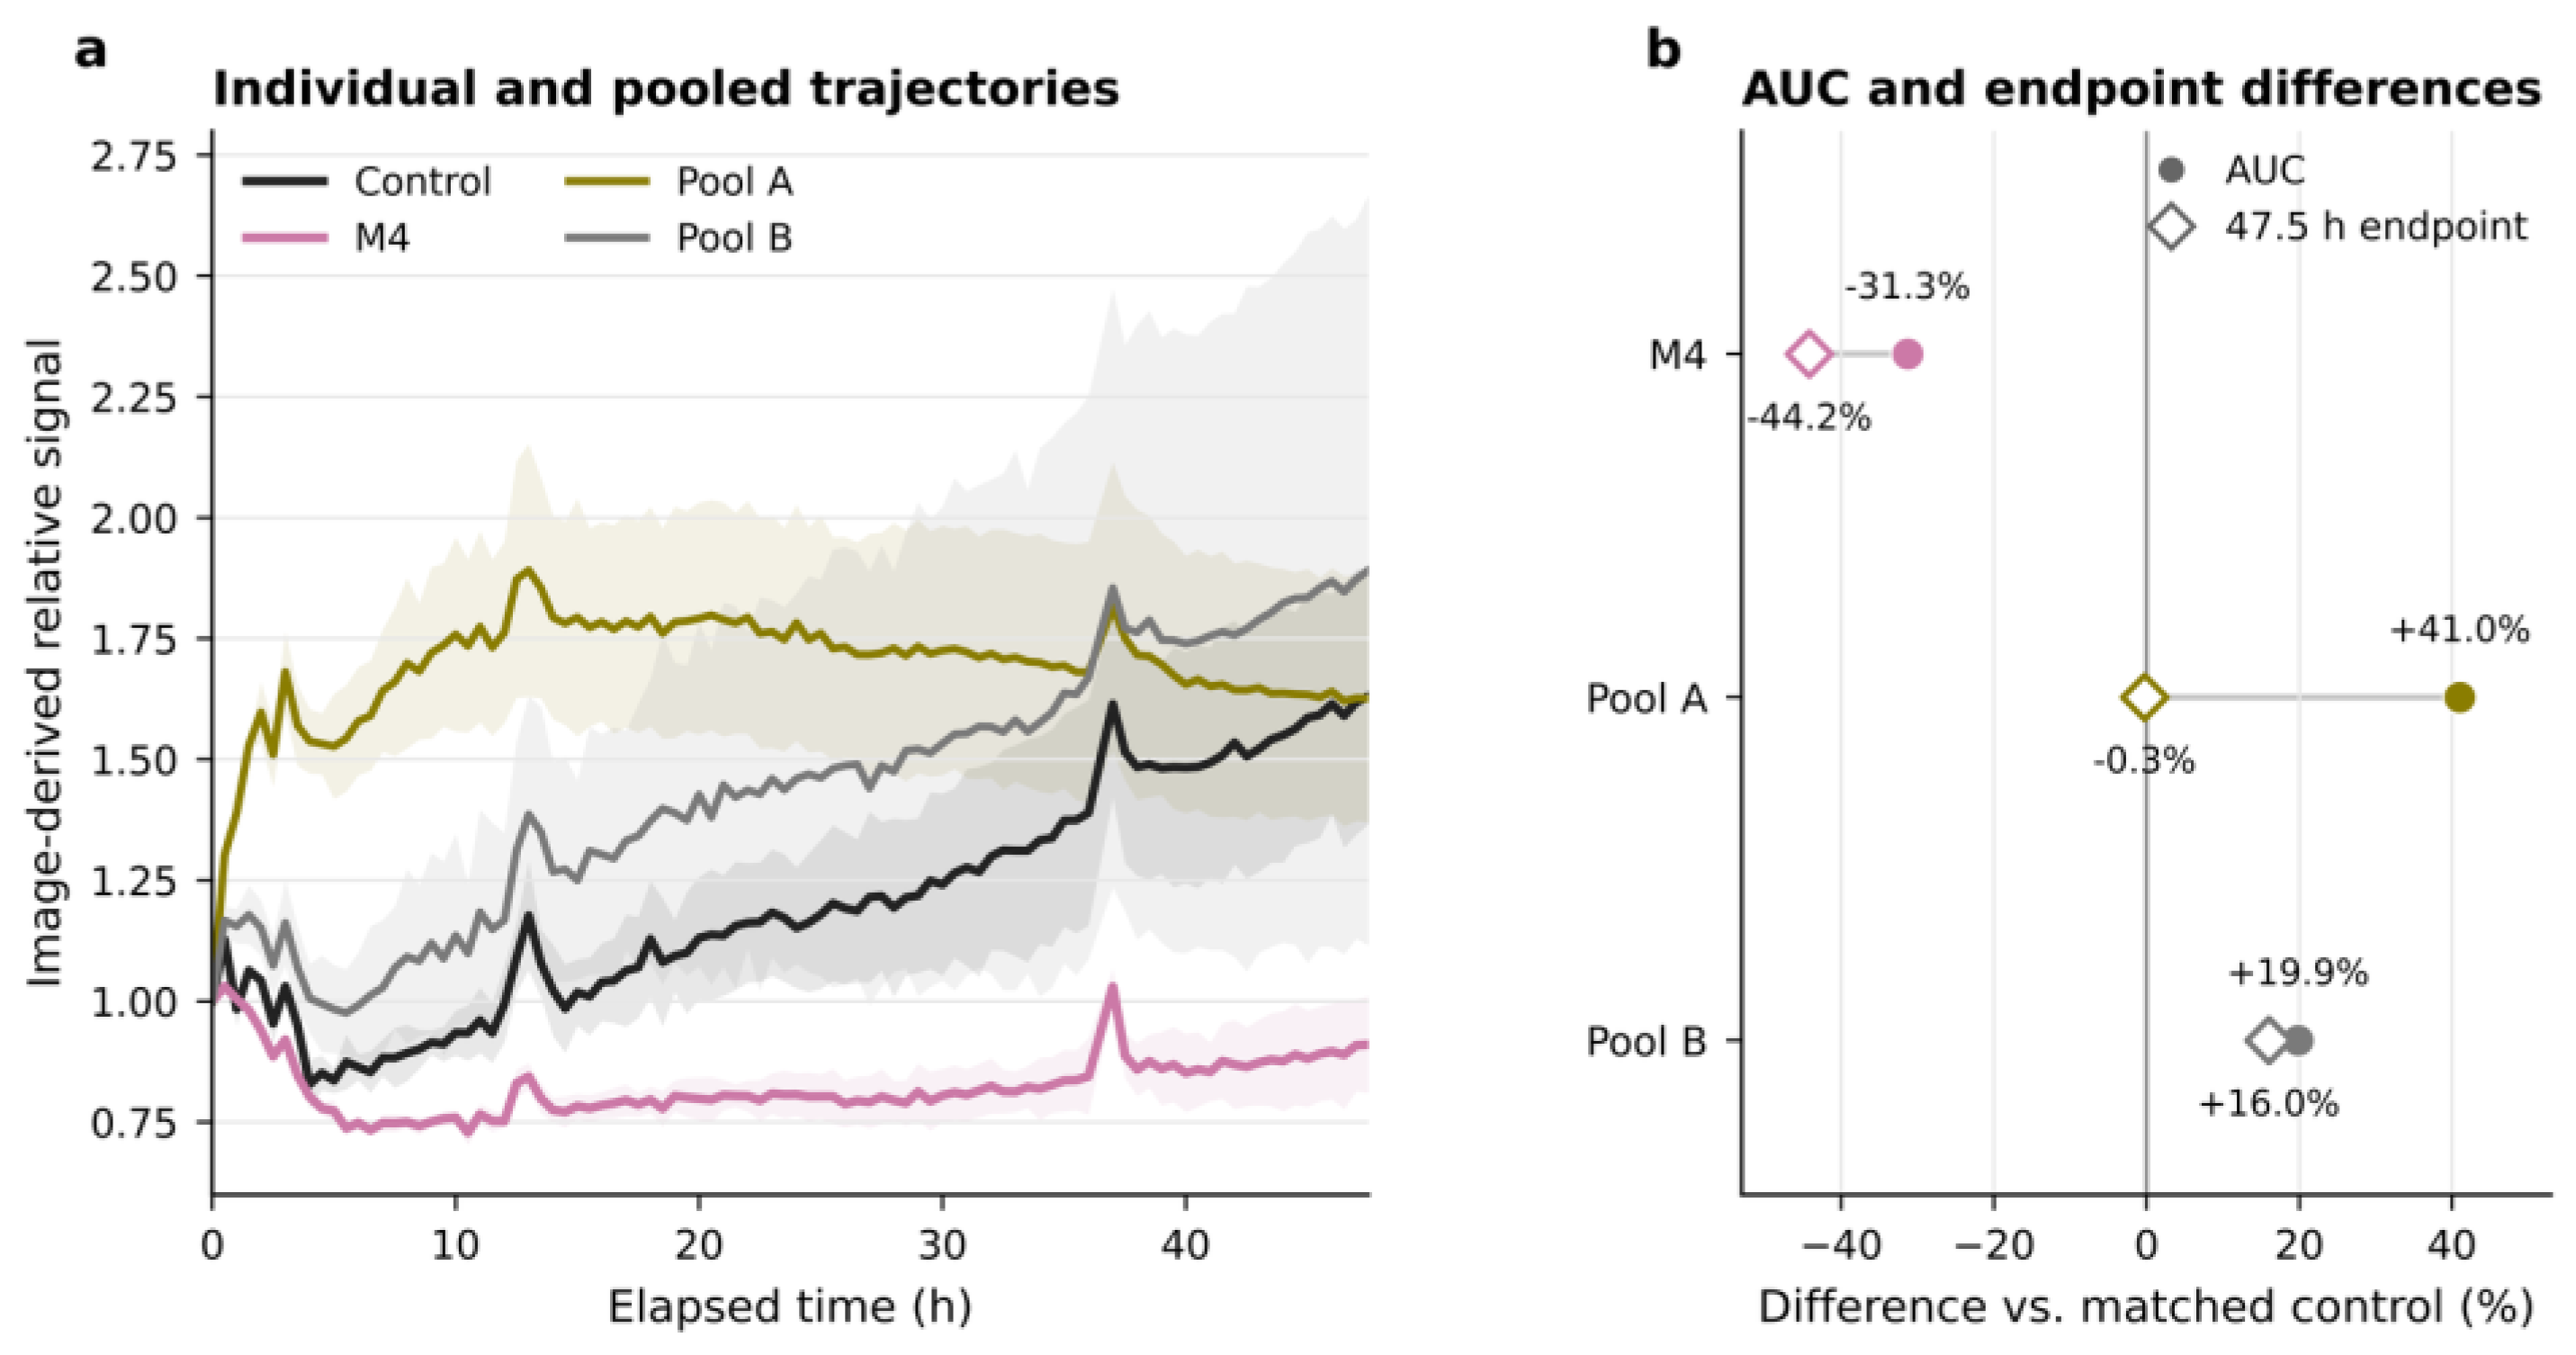
Figure 4.
Integrated quantitative response maps. (a) Complete-medium AUC and 47.5 h endpoint differences relative to the matched control. (b) Comparison of AUC differences in complete and serum-free basal media; displacement from the diagonal indicates environment-dependent discordance. Descriptive analysis of one experimental run with three technical wells per condition.
Figure 4.
Integrated quantitative response maps. (a) Complete-medium AUC and 47.5 h endpoint differences relative to the matched control. (b) Comparison of AUC differences in complete and serum-free basal media; displacement from the diagonal indicates environment-dependent discordance. Descriptive analysis of one experimental run with three technical wells per condition.
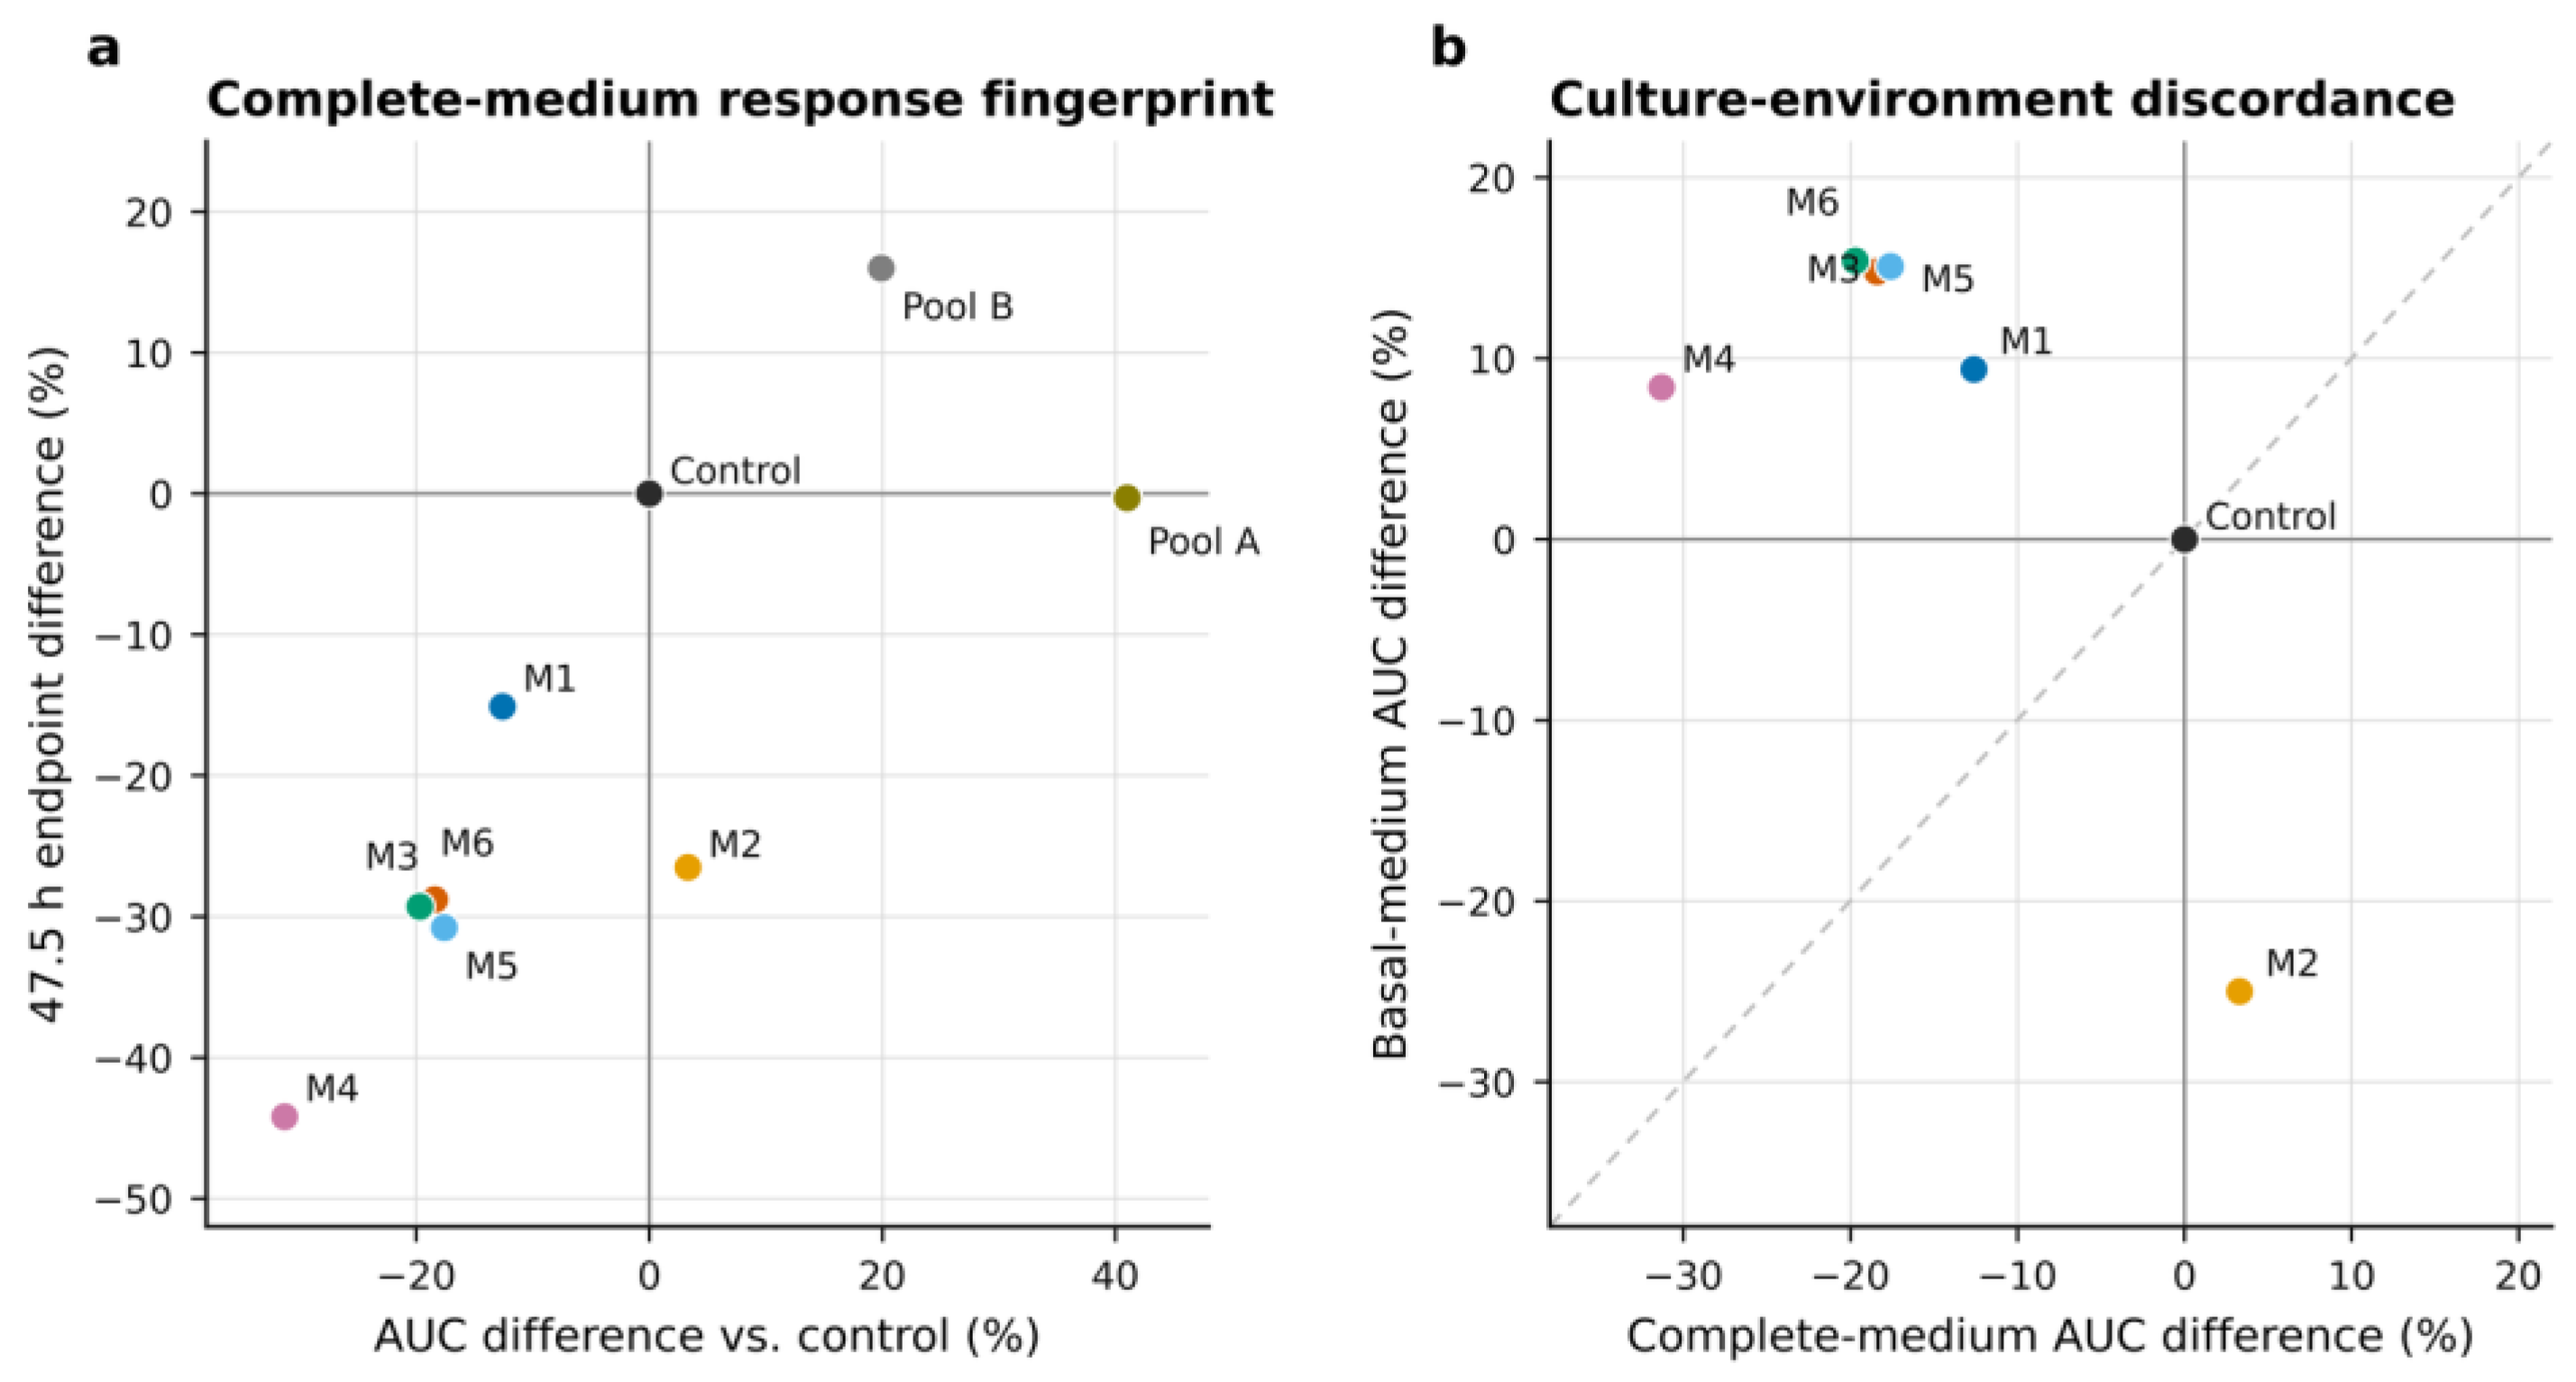
Figure 5.
Culture-environment dependence. (a) U87 image-derived trajectories in serum-free basal medium. (b) Relative difference between M4 and its matched control in complete versus serum-free basal medium. The comparison combines different cellular and matrix environments and is descriptive only. n = 3 technical wells per condition in one experimental run.
Figure 5.
Culture-environment dependence. (a) U87 image-derived trajectories in serum-free basal medium. (b) Relative difference between M4 and its matched control in complete versus serum-free basal medium. The comparison combines different cellular and matrix environments and is descriptive only. n = 3 technical wells per condition in one experimental run.
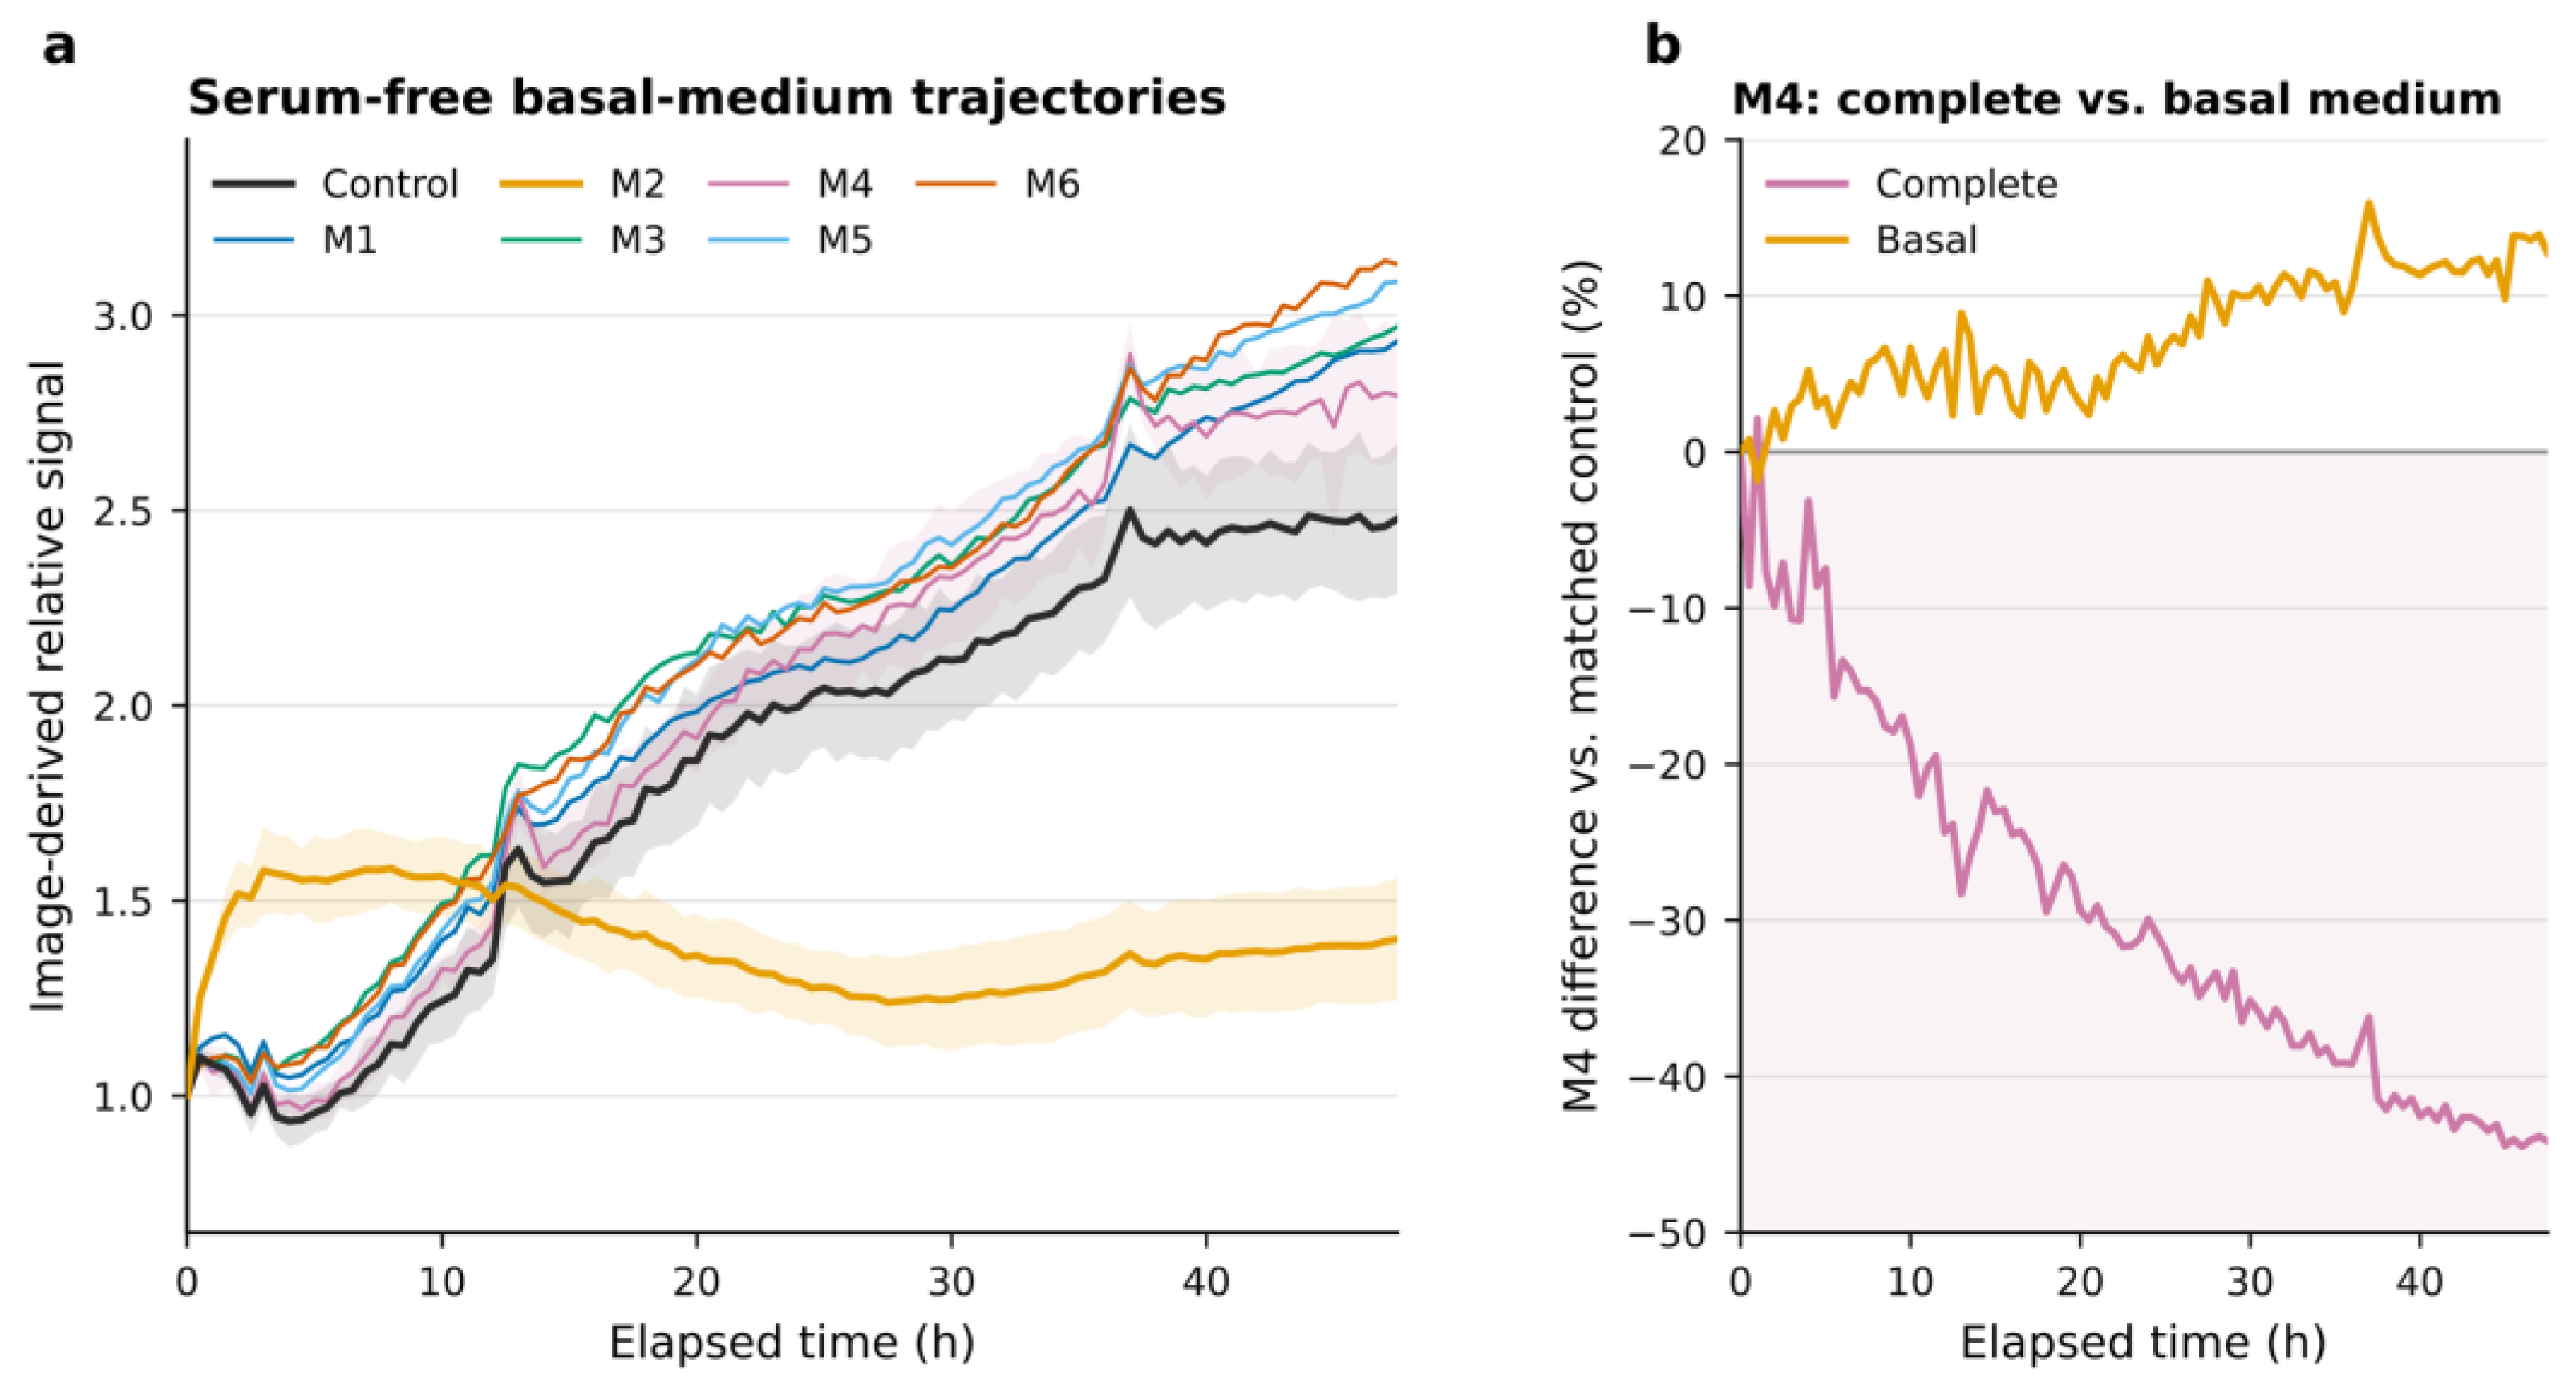
Figure 6.
Analytical interpretability and evidentiary classification. (a) Rapidly declining outputs from the membrane-impermeant SYTOX-associated channel were not analytically interpretable as cumulative cell death under the tested conditions. (b) Evidence classification based on quantitative versus qualitative readout, independent biological replication, orthogonal endpoint confirmation, and field interpretability. No condition had independent biological replication or an orthogonal endpoint.
Figure 6.
Analytical interpretability and evidentiary classification. (a) Rapidly declining outputs from the membrane-impermeant SYTOX-associated channel were not analytically interpretable as cumulative cell death under the tested conditions. (b) Evidence classification based on quantitative versus qualitative readout, independent biological replication, orthogonal endpoint confirmation, and field interpretability. No condition had independent biological replication or an orthogonal endpoint.
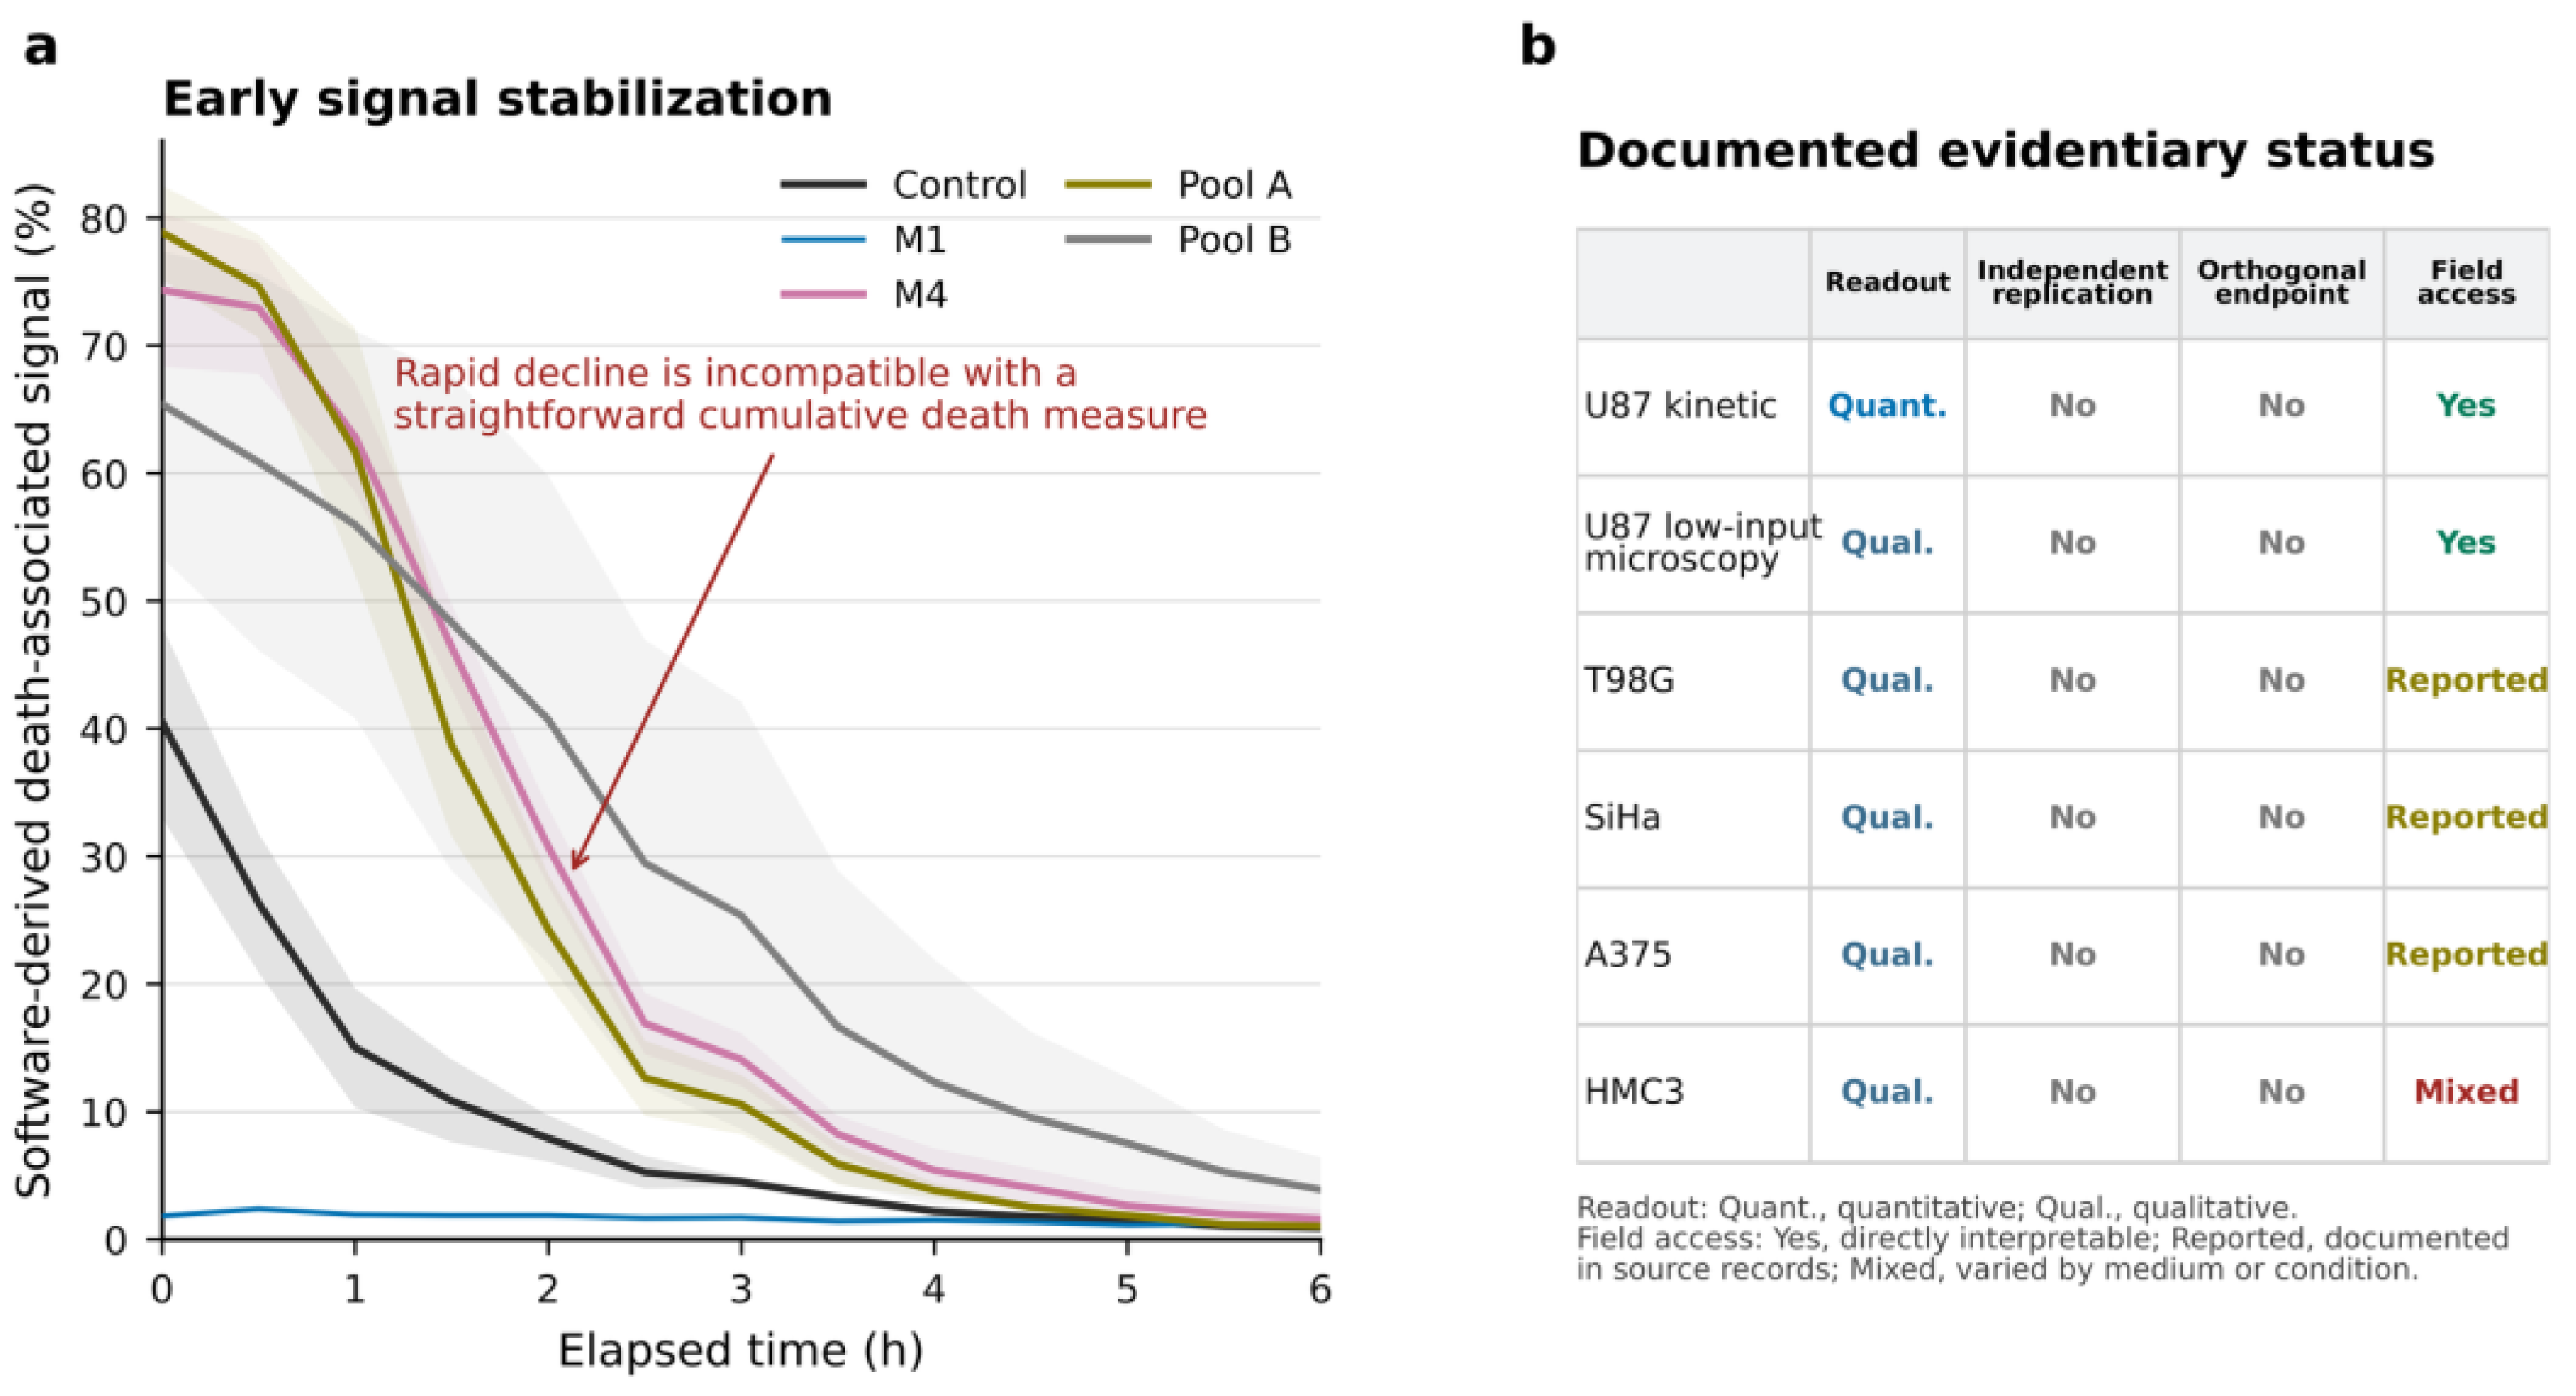

Table 1.
Integrated experimental sequence.
| Experiment | Laboratory stock | Nominal exposure | Replication | Medium | Primary assessment and time |
| 4 | U87 | 25% | 4 technical wells | Complete/basal | Bright-field microscopy; initial observation |
| 5 | U87 | 10% | 4 technical wells | Complete/basal | Microscopy before/after wash; ~20–24 h |
| 6 | U87 | 1% | 3 technical wells | Complete/basal | Microscopy before/after wash |
| 7 | U87 | Laboratory-designated working input | 3 technical wells | Complete/basal | IncuCyte image-derived and SYTOX-associated outputs; 0-47.5 h |
| 8 | U87 | 0.1% nominal | 3 technical wells | Complete/basal | Bright-field microscopy; 48 h |
| 9 | T98G | 0.1% nominal | 3 technical wells | Complete/basal | Bright-field microscopy; 24 and 48 h |
| 10 | SiHa | Low-input working condition | 3 technical wells | Complete/basal | Bright-field microscopy; 24 and 48 h |
| 11 | A375 | Low-input working condition | 3 technical wells | Complete/basal | Bright-field microscopy; 24 and 48 h |
| 12 | HMC3 | Low-input working condition | 3 technical wells | Complete/basal | Bright-field microscopy; 24 and 48 h |
Note: Exposure values are nominal source-record designations. Exact original-product-equivalent concentrations could not be independently reconstructed from the neutralized dataset. The quantitative kinetic run and cross-model studies are therefore described as laboratory-designated working-input conditions rather than as verified concentration-equivalent experiments.
Table 2.
Concentration-dependent analytical feasibility in U87 cultures.
| Reported exposure | Microscopic interpretability | Principal analytical observation | Inference supported |
| 25% | Poor | High density and opacity; pooled conditions not visualizable | Insufficient for reliable cellular interpretation |
| 10% | Limited | Persistent opacity; visibility improved after phosphate-buffered saline (PBS) washing | Suggestive observations, highly vulnerable to matrix interference |
| 1% | Generally acceptable | Cells and matrix conditions visible; residual extracellular material remained | Suitable for exploratory kinetic and morphological evaluation |
| 0.1% | Good | No major visibility restriction reported | Suitable for exploratory low-exposure microscopy |
Table 3.
U87 image-derived relative signal in complete medium.
| Condition | AUC (relative units·h) | AUC difference vs. control | 6 h | 12 h | 24 h | 47.5 h | Mean technical CV |
| Control | 57.10 | Reference | 0.864 ± 0.027 | 0.994 ± 0.079 | 1.152 ± 0.125 | 1.630 ± 0.265 | 11.1% |
| M1 | 49.91 | -12.6% | 0.747 ± 0.013 | 0.838 ± 0.057 | 1.028 ± 0.196 | 1.385 ± 0.442 | 17.0% |
| M2 | 58.99 | +3.3% | 1.232 ± 0.007 | 1.285 ± 0.026 | 1.258 ± 0.102 | 1.199 ± 0.108 | 6.3% |
| M3 | 46.58 | -18.4% | 0.823 ± 0.075 | 0.865 ± 0.102 | 0.936 ± 0.065 | 1.161 ± 0.116 | 8.2% |
| M4 | 39.24 | -31.3% | 0.749 ± 0.015 | 0.752 ± 0.014 | 0.807 ± 0.044 | 0.910 ± 0.100 | 5.4% |
| M5 | 47.04 | -17.6% | 0.856 ± 0.044 | 0.919 ± 0.066 | 0.952 ± 0.085 | 1.128 ± 0.241 | 10.1% |
| M6 | 45.84 | -19.7% | 0.830 ± 0.053 | 0.896 ± 0.067 | 0.931 ± 0.047 | 1.153 ± 0.094 | 6.6% |
| Pool A | 80.53 | +41.0% | 1.580 ± 0.112 | 1.763 ± 0.188 | 1.783 ± 0.244 | 1.626 ± 0.255 | 12.5% |
| Pool B | 68.44 | +19.9% | 0.991 ± 0.109 | 1.168 ± 0.180 | 1.460 ± 0.384 | 1.892 ± 0.776 | 25.4% |
Values are mean ± SD of three technical wells in one run. Negative AUC differences denote a lower cumulative image-derived signal relative to the complete-medium control. No inferential statistics were applied.
Table 4.
U87 image-derived relative signal in serum-free basal medium.
| Condition | AUC (relative units·h) | AUC difference vs. control | 6 h | 12 h | 24 h | 47.5 h | Mean technical CV |
| Basal control | 88.00 | Reference | 1.006 ± 0.037 | 1.351 ± 0.092 | 1.996 ± 0.159 | 2.479 ± 0.191 | 7.5% |
| M1 | 96.31 | +9.4% | 1.132 ± 0.087 | 1.517 ± 0.128 | 2.102 ± 0.168 | 2.934 ± 0.027 | 6.4% |
| M2 | 66.04 | -25.0% | 1.562 ± 0.102 | 1.503 ± 0.104 | 1.292 ± 0.097 | 1.401 ± 0.158 | 8.4% |
| M3 | 101.05 | +14.8% | 1.184 ± 0.064 | 1.616 ± 0.124 | 2.253 ± 0.427 | 2.971 ± 0.658 | 14.7% |
| M4 | 95.40 | +8.4% | 1.039 ± 0.052 | 1.438 ± 0.071 | 2.143 ± 0.140 | 2.795 ± 0.162 | 5.4% |
| M5 | 101.28 | +15.1% | 1.101 ± 0.134 | 1.548 ± 0.224 | 2.262 ± 0.440 | 3.087 ± 0.517 | 16.0% |
| M6 | 101.55 | +15.4% | 1.177 ± 0.058 | 1.612 ± 0.052 | 2.224 ± 0.103 | 3.131 ± 0.112 | 3.9% |
Basal medium lacked FBS and represents both a distinct matrix environment and a serum-deprivation condition. Values are mean ± SD of three technical wells in one run.
Table 5.
Integrated descriptive cross-model profile in complete medium.
| Preparation | U87 nominal 0.1% | Tumor-derived cross-model microscopy | HMC3 microscopy |
| M1 | No clear reported difference | T98G: similar by 48 h; SiHa: lower coverage; A375: limited change | Mild-moderate lower coverage |
| M2 | Lower attached-cell coverage | T98G: transient/mild lower coverage; SiHa: +++ descriptor; A375: mild at 24 h | Mild-moderate lower coverage |
| M3 | No clear reported difference | T98G: visually similar; SiHa: lower coverage; A375: limited change | Coverage visually similar to control |
| M4 | Lower attached-cell coverage | T98G: visually similar; SiHa: ++ descriptor; A375: limited change | Coverage visually similar to control |
| M5 | No clear reported difference | T98G: visually similar; SiHa: +++ descriptor; A375: limited change | Coverage visually similar to control |
| M6 | No clear reported difference | T98G: visually similar; SiHa: lower coverage; A375: limited change | Coverage visually similar to control |
| Pool A | Lower attached-cell coverage | T98G: mild lower coverage; SiHa: lower coverage/aggregates; A375: limited change | Interpretation limited by debris |
| Pool B | No clear reported difference | T98G: visually similar; SiHa: lower coverage/aggregates; A375: mild at 24 h | Coverage visually similar to control |
Table 6.
Minimum requirements for confirmatory investigation.
| Domain | Minimum requirement | Scientific purpose |
| Biological replication | At least three independent experiments on different days | Estimate reproducibility beyond technical wells |
| Identity and quality control | Cell authentication, passage range, mycoplasma status, matrix lot, and a fit-for-purpose compositional specification | Ensure traceability and reproducibility |
| Exposure definition | Exact final original-product equivalent, vehicle matching, pH, osmolarity, distribution | Resolve concentration ambiguity and nonspecific stress |
| Dose-response | At least 5–7 concentrations for M4 and principal comparators | Determine potency, threshold, and non-monotonic behavior |
| Orthogonal endpoints | Nuclear count, ATP/resazurin, LDH, Annexin V/PI, caspase-3/7, cell cycle | Distinguish cytostasis, detachment, and death |
| Mechanistic endpoints | ROS, glutathione, NRF2-related signaling, mitochondrial potential, lipid peroxidation, stress kinases | Test the matrix-specific response hypothesis |
| Differential-response panel | Matched non-neoplastic cells under identical, independently replicated conditions | Assess differential response without implying safety or selectivity |
| Matrix controls | Matrix-only, dye-only, no-cell, vehicle, and positive controls | Identify autofluorescence, precipitation, and segmentation artifacts |
| Oral-translational layer | INFOGEST digestion and testing of the bioaccessible fraction | Evaluate activity after simulated gastrointestinal processing |
Disclaimer/Publisher’s Note: The statements, opinions and data contained in all publications are solely those of the individual author(s) and contributor(s) and not of MDPI and/or the editor(s). MDPI and/or the editor(s) disclaim responsibility for any injury to people or property resulting from any ideas, methods, instructions or products referred to in the content. |
© 2026 by the authors. Licensee MDPI, Basel, Switzerland. This article is an open access article distributed under the terms and conditions of the Creative Commons Attribution (CC BY) license (http://creativecommons.org/licenses/by/4.0/).
Copyright: This open access article is published under a Creative Commons CC BY 4.0 license, which permit the free download, distribution, and reuse, provided that the author and preprint are cited in any reuse.