

Submitted:
18 August 2026
Posted:
20 August 2026
You are already at the latest version
Abstract
The small GTPase Ras, a central switch in signal transduction of cell growth, is a crucial element in the development of many forms of cancer. Recent studies have shown that membrane association of Ras is essential to its downstream effector recruitment and signal transduction. Here we investigate the membrane association and interaction of K-Ras4B, the most frequently found Ras isoform in tumor cells, using all-atom molecular dynamics simulations totaling 8.5 µs. We find that the isoform-specific, farnesylated hypervariable region (HVR) of Ras plays an important role in the organization and oligomerization of its globular domain (G-domain) on the surface of the membrane. We show that the overall pose of the Ras G-domain on the membrane can be determined by its HVR. The HVR thus can control downstream effector binding by positioning the G-domain on the membrane in a specific orientation. Furthermore, we observe that the HVR alone already transiently dimerizes in the membrane and recruits negatively charged phosphatidylserine lipids around the K-Ras isoform specific poly-lysine region. The observed HVR dimerization potentially can initiate the dimerization of the full K-Ras, which is essential for downstream effector signaling via various pathways. These atomistic details behind the molecular mechanism of the HVR provide novel insight into Ras interaction with membrane and its availability for downstream effectors.
Keywords:
peripheral proteins
; lipid-protein interactions
; Ras proteins
; cancer
; membrane binding
; molecular dynamics simulation
; negative lipids
1. Introduction
The Ras (Rat sarcoma) family of proteins are vital regulators of major signaling pathways and key responses to external stimuli in the cell [1]. They are small GTPases mediating the activation of downstream components of cell growth and development when bound to GTP, and inactive otherwise. Constitutively active oncogenic mutations in Ras proteins are found in 30% of all human cancers [2]. Among the three Ras isoforms, H-Ras, N-Ras, and K-Ras (further divided into K-Ras4A and K-Ras4B sub-isoforms), K-Ras4B (from here on, referred to as simply K-Ras) is the most abundant isoform, and responsible for 85% of oncogenic mutations [3,4].
Ras activation is regulated by a GTP/GDP molecular switch. GTP binding is the key activation signal for Ras proteins. Deactivation is mediated by the conversion of the bound GTP to GDP, which is facilitated by binding of a GTPase-activating protein (GAP) [5]. Ras protein then recruits a guanine exchange factor (GEF), which significantly lowers Ras affinity for GDP, resulting in GDP unbinding and replacement by GTP.
Ras proteins are composed of two distinguishable parts: the globular, soluble G-domain, which hydrolyzes GTP and is highly conserved across isoforms, and a C-terminal unstructured hypervariable region (HVR), which is usually anchored in the membrane by one or more posttranslational acylations. The G-domain residues are further divided into two lobes, Lobe 1 and Lobe 2 [6]. Lobe 1, aka the effector lobe, is largely conserved across all Ras isoforms [7,8] and contains the functionally crucial regions such as the P-loop, switch I, and switch II. Lobe 2, the allosteric lobe, is less conserved and differs slightly across isoforms. The positioning and accessibility of these lobes dictate the ability of a Ras protein to bind to downstream effectors involved in its signaling, or to Ras activators which aid the switch between its active and inactive forms.
A key aspect of Ras biology and pathophysiology is the central role of the cellular membrane in its function. Ras proteins must associate with the membrane to activate their signaling pathways, as the membrane mediates the tight coordination of Ras proteins and their effectors. For example, the membrane has been indicated to mediate the recruitment of GAP and GEFs by Ras proteins [9,10]. The membrane also aids Ras with binding to downstream signaling effectors such as Raf [10,11,12]. As such, studies in the absence of the membrane might not provide an accurate account of the underlying molecular mechanism of Ras proteins.
Lipid-mediated regulation is a hallmark of Ras isoform-specific behavior. Lipid-protein interactions play an important role in signaling and membrane association of Ras proteins, their localization to the plasma membrane [13,14], and obviously in events such as lipid sorting by the HVR [15,16]. Furthermore, post-translational modifications such as prenylation, methylation, and farnesylation of the HVR have been shown to anchor the G-domain into the cytosolic side of the plasma membrane in a lipid-dependent manner. [17].
The HVR differs significantly across Ras isoforms, maintaining only 10-15% similarity in sequence. In contrast, the G-domains are >90% conserved [18], highlighting that the HVR may be responsible for functional differences between Ras isoforms. K-Ras, specifically, only contains one farnesyl anchor in its HVR, in contrast to N-Ras and H-Ras which undergo two and three post-translational acylations in this region, respectively. Membrane localization of K-Ras is instead thought to be stabilized by the six consecutive lysines, K175–K180, referred here to as the polylysine region, in its HVR. [16] This membrane interaction is believed to be isoform-specific and largely driven by the unique electrostatics of the HVR. As the amino acid sequence and structure of the HVR are tightly correlated to K-Ras function, atomistic details of their interactions with the membrane can bring invaluable insight into K-Ras physiology.
The highly dynamic HVR, especially in the absence of a membrane, is a challenging target for experimental structural determination. Currently, our knowledge of the HVR structure is limited to a few studies reporting full-length crystal structures for Ras proteins, all in the absence of membrane. For example, two structures of K-Ras4B in complex with PDE (PDBs 5TAR and 5TB5) show inconsistent conformations: one adopts a short helical HVR segment, while the other displays a flexible loop [19]. A more recent set of full-length K-Ras structures (PDBs 6GOD, 6GOE, and 6GOF) resolve only parts of the HVR, with no consistent secondary structure or membrane interaction [20]. These inconsistencies, due in part to the lack of the membrane context, make it difficult to capture the HVR’s physiological state. These discrepancies highlight the need for modeling the system in the presence of a membrane context to accurately capture HVR’s behavior.
The orientation of the G-domain, and in some cases its dimerization, on the surface of the membrane dictate its ability to recruit and interact with downstream effectors. As such, this aspect of Ras biology has been a target of many studies. Molecular dynamics (MD) simulations [21,22] and smFRET experiments [23] suggest oncogenic K-Ras G-domain can adopt two main poses on the membrane: one with its three C-terminal -helices facing the membrane, and the other with its N-terminal -sheets. Free energy analysis of the kinetic states [24] of membrane-bound K-Ras also details two major orientations in PS:PC membranes.
A recent study employing coarse-grained (CG) MD combined with various experimental techniques such as NMR, proposed a third, “membrane-distal” state in which the G-domain does not even make direct contact with the membrane but is available for Raf binding [25]. Recent studies combining experiments and simulations have shown that membrane lipids modulate K-Ras orientation, diffusion, and nanocluster formation, influencing effector access and dimerization [26,27]. These findings emphasize the importance of membrane context in K-Ras signaling and support the need for atomistic models of how the HVR might govern G-domain behavior.
While these studies reveal much about K-Ras behavior, the individual contributions of the HVR to the interactions with the membrane and how it may affect the G-domain are still not well understood. Here we report all-atom MD simulations systematically studying K-Ras G-domain and HVR, as well as the full-length protein. Our study will show that the G-Domain adopts many different orientations on the surface of the membrane when not tethered to its HVR. The role of the HVR in G-domain anchoring and orientation will also be detailed, providing insight into its importance in K-Ras dimerization and function by showing preferential interaction with negatively charged lipids, as well as a secondary anchor by the MET170 residue.
The exceedingly high value for K-Ras as an anti-cancer therapeutic target has solicited significant research interest in it, although Ras proteins have been studied for over three decades [28]. Currently, there is still a gap in understanding of which Ras structural elements are particularly important to its function. In particular, the role of the HVR in determining membrane interactions and domain orientation has remained elusive. This study is an attempt to provide atomistic details about the HVR interactions with the membrane and the resulting pose of the K-Ras G-domain on the surface of the membrane.
2. Materials and Methods
2.1. Membrane Preparation
Robust signaling activity of Ras proteins depends on their membrane association. Therefore, the interactions of all constitutive G-domain and HVR elements, as well as the full-length K-Ras, with the membrane are of high interest. A summary table with the systems and respective simulation times is provided in Supplementary Table S1. To assess protein-membrane interactions more efficiently, for all systems we performed simulations using the accelerated HMMM membrane model[29], with the exception of the part concerning the full-length K-Ras for which a full membrane was used (see below). HMMM is a membrane model with short-tailed phospholipid tails [30] and faster lipid diffusion that allows for enhanced sampling of lipid-protein interactions at reduced timescales, while retaining atomistic presentations on the surface of the membrane. [31,32,33,34,35,36,37].
For all simulations in this study, the HMMM membranes were built using the HMMM BUILDER [38] tool in CHARMM-GUI, [39] with a composition of 70:30 phosphatidylcholine (PC): phosphatidylserine (PS), a commonly used composition for both experimental and computational K-Ras studies. [25,40,41,42] The membranes contained 140 lipids in each leaflet (42 PS, 98 PC), resulting in membranes of 110×110 , with the membrane core filled with 1,584 solvent (dichloroethane; DCLE) molecules. To maintain membrane shape, harmonic restraints ( kcal mol−1) were applied along the z direction (membrane normal) to the acyl tail carbonyl carbons (C21 and C31) of all phospholipids. To prevent leaking of DCLE molecules into the aqueous phase, half harmonic potentials were applied when using the GridForce [43] feature of NAMD [44,45].
2.2. Membrane Binding of G-Domain Alone
In order to determine stable interactions between the G-domain and the membrane, six independent systems of G-domains in the presence of HMMM membranes were simulated. Each system included two G-domains (PDB 4OBE), whose bound GDP nucleotide was aligned and replaced with GTP before the simulations. The GTP replacement generated a nucleotide-bound state consistent with active KRAS, but no constraints were imposed on the switch regions. The proteins were capped with an N-terminal ammonium and a C-terminal carboxylate group. The proteins in each system were rotated about the x and/or y axis by 15–30 degrees to deliberately randomize their initial orientations and ensure less biased sampling of membrane-binding configurations, and were placed ∼125Å from each other (COM-COM distance) and ∼25Å from the cis leaflet of the membrane. The PSFGEN plugin of VMD (Visual Molecular Dynamics) [46] was used to assemble the protein-lipid systems. They were solvated using the SOLVATE plugin of VMD and neutralized with Na+ and Cl− ions for a concentration of 150 mM NaCl with AUTOIONIZE. The resulting systems consisted of ∼138,000 atoms and box sizes of ∼ 115×115×142 . The systems were energy minimized using the steepest descent method for 500 steps, followed by a 3 ns equilibration protocol restraining the protein heavy atoms, Mg2+, GTP molecules, the DCLE solvent, and the C21, C31 atoms of the phospholipids with a force constant of kcal mol−1. All restraints were then removed and a production run of 1 s for each system was performed, totaling 6 s of membrane-binding simulations of the G-domain alone. No external forces or positional biases were applied to drive membrane association, allowing the G-domain to interact with the membrane through spontaneous diffusion alone.
2.3. Membrane Binding of HVR Alone
The HVR sequence and structures are significantly different in different Ras isoforms, likely affecting their function and membrane interaction. The HVR is thought to be unstructured, and so we developed 24 different models for the K-Ras4B HVR (residues 166–185), which includes the linker region later implicated in dimerization, via the Rosetta ab initio structure prediction protocol[47]. Rosetta utilizes a local fragment library of solved structures in the Protein Data Bank as a starting point, and then iteratively exchanges fragments using a Metropolis Monte Carlo protocol to minimize a knowledge-based scoring function Kaufmann et al. [48]. From an initial pool of 992 Rosetta models we selected 24 representative low-energy structures to maximize structural diversity for subsequent simulations. Each of the HVRs was capped with an N-terminal acetyl capping group and a C-terminal methyl acetate group. The HVRs were also farnesylated at C185, as would be the case in the full-length K-Ras4B protein (KRAS4A contains an additional palmitoyl anchor and was not modeled here).
We set up three membrane simulation systems, each including eight HVR structures positioned above the membrane — four per leaflet — with their farnesyl groups oriented toward the bilayer to guide insertion during the simulation. This arrangement allowed spontaneous HVR–HVR encounters to be monitored and potential self-association/dimerization events to be quantified without bias. The HVRs were initially placed ∼5–8Å away from each leaflet (top and bottom), ∼60Å apart laterally, and ∼100Å diagonally from each other.
The parameters for the farnesyl group were obtained by analogy from the CHARMM36 [49] isoprene units, based on prior work Vermaas et al. [50]. The linkage to the cystine residue was similarly taken by analogy through combining the CHARMM36 lipid and protein force fields[49,51]; the choice of CHARMM36 rather than CHARMM36m was made to maintain compatibility with previously validated KRAS HVR parameters, although CHARMM36m arginine updates are not expected to qualitatively alter the membrane anchoring results here.
The combined HVR-membrane systems were solvated and neutralized with 150 mM KCl. The resulting systems contained 150,000–177,000 atoms and box sizes of approximately 115×115×150 .
Similar to the G-domain membrane-binding simulations, the HVR systems were energy minimized using steepest descent for 500 steps, followed by a 3-ns equilibration restraining the protein heavy atoms, the farnesyl tail, the DCLE solvent, and the C21, C31 atoms of the phospholipids ( kcal mol−1). These restraints were then removed and a production run of 0.5 s for each system was performed.
2.4. Membrane Binding of Full-Length K-Ras
After studying the constitutive functional domains of K-Ras, i.e., the G-domain and the HVR, separately, the full-length protein (residues 1-185, farnesylated) was constructed and simulated to observe how the interaction of the G-domain with the membrane might change in the presence of the HVR. The last frame of an HVR membrane binding simulation was chosen based on the solvent accessibility of its N-terminal K166 to be attached by the C-terminal R165 from the G-domain. The system was solvated and ionized as before. The newly generated full-length protein was minimized and equilibrated as above (500 steps of minimization and 3 ns of equilibration), followed by a production run of 500 ns with HMMM lipids. Subsequently, the last frame of this simulation was converted to a full-tailed membrane using PSFGEN. The resulting system was energy minimized for 500 steps and equilibrated with NAMD for 3 ns before transferred to the Anton2 supercomputer and simulated for an additional 500 ns using default Desmond conditions (e.g., with 2.5 fs timesteps). The simulation steps are outlined in Results.
2.5. Simulation Protocol
Unless stated otherwise, all simulations were performed using NAMD2 (v2.14) [44,45], TIP3P water [52] and the CHARMM36 force-field parameters for lipids and proteins [49,51] in an NPAT ensemble, and using a 2-fs timestep. Temperature was maintained at 310 K using the Langevin thermostat with a damping coefficient = 0.5 ps−1, while the pressure was kept constant using the Nosé-Hoover Langevin piston method [53,54]. A cutoff of 12Å and a switching distance of 10Å were used to calculate non-bonded forces. The particle mesh Ewald (PME) method [55] was used to calculate long-range electrostatics. ConstantArea in NAMD2 was used for the HMMM simulations to maintain headgroup densities.
2.6. Analysis
We defined a protein-lipid contact when any heavy atom of the protein was within 3.5Å of any heavy atom of the lipids. To compare binding interactions of different regions of the protein, these contacts were mapped separately for the effector lobe, allosteric lobe, and HVR, consistent with key functional distinctions. The resulting contacts are presented for each protein in each simulation system. Contacts to different protein parts are highlighted in this figure for easier identification of the functional parts of K-Ras interacting with the membrane: effector lobe (yellow), allosteric lobe (red), and the HVR (teal).
To characterize the orientation of the G-domain on the membrane, we defined two angles: (1) the “GTP” angle (), calculated between the membrane normal and the vector connecting the G-domain center of mass (COM) to the COM of GTP; and (2) the “Helix” angle (), defined as the angle between the membrane normal and the vector connecting the G-domain COM to the COM of helix 5. These angles provide a simplified yet informative projection of orientation space.
Since we observed multiple membrane-bound orientations, we performed clustering to classify them. The data from all G-domain simulations were concatenated and analyzed using the Gaussian Mixture Model (GMM) algorithm with the scikit-learn package. [56] The appropriate number of clusters to use was determined by calculating the fraction of variance explained (FVE). This calculation was repeated 10 times for up to clusters. The kink in the curve, which is approximately at , represents the optimal number of clusters for the GMM analysis.
The secondary structure of the HVR throughout the trajectories was evaluated by the Timeline plugin of VMD and plotted using Matplotlib [57]. To characterize the membrane binding mode for each HVR, the z-distances between the COM of individual HVR residues from the cis phosphate plane were used. These pairwise distances were then clustered using the k-medoids clustering algorithm [58] to characterize distinct poses that HVR assumes on the surface of the membrane. The clusters were projected using principle component analysis (PCA)[56] and plotted using the first two PCs, to reduce the dimensionality of the initial dataset and aid with the visualization. Two resulting clusters were identified from the HVR-only systems based on the z-distance between HVR residues and the membrane phosphate plane, and their respective centers (medoids) were calculated, providing two distinct representative types of HVR-membrane interactions. We further quantified HVR–HVR associations by computing inter-HVR contact frequency across all trajectories and visualizing distance distributions and contact lifetimes. To assess the HVR–lipid interactions, radial distribution function calculations were performed between the side-chain nitrogen atom of lysines and the phosphorus atom of lipids, using the measure gofr function in VMD with a delta value of 0.1Å and an rmax of 10Å. The contacts within 3.5Å between HVRs (inter-HVR contacts) as well as those between HVRs and lipids were calculated separately and normalized to the maximum number of contacts observed across the simulations.
The contacts within 3.5Å between HVRs (inter-HVR contacts) as well as those between HVRs and lipids were calculated separately and normalized to the maximum number of contacts observed across the simulations.
3. Results and Discussion
To characterize the structural organization of K-Ras on the membrane, we analyzed the conformations resulting from interactions between lipid bilayers and either the isolated G-domain, the isolated highly dynamic hypervariable region (HVR), or the full-length K-Ras protein. We present a comprehensive set of simulations, including 12 distinct G-domain orientations, 24 different HVR configurations, and one full-length K-Ras system embedded in simplified HMMM membranes [30] composed of 70:30 PC:PS lipids, as well as in full-tail membranes for comparison.
To evaluate the role of the HVR in G-domain membrane orientation, we compared the orientation of the G-domain in systems with and without a covalently attached HVR. In the first section we analyze how isolated G-domain interacts with the membrane by clustering its orientation across simulations.
Next, we examine the dynamics of the HVR in isolation, focusing on negative lipid recruitment driven by its isoform-specific poly-lysine motif and its transient, spatially restricted associations with neighboring HVRs. We also apply clustering analysis to identify two distinct membrane-bound conformations of the HVR, differentiated by their depth and interaction profiles.
Finally, we analyze full-length K-Ras to determine how HVR tethering modulates G-domain orientation on the membrane. This comparison reveals how different domains of K-Ras work cooperatively to establish membrane binding configurations and support a mechanistic model in which the HVR acts as both an anchor and modulator of G-domain positioning.
3.1. Characterizing G-Domain–Membrane Interaction
Signaling activity of K-Ras is dictated by both GTP binding and its obligatory association with the membrane [10,11]. The orientation and interactions of the G-domain on the membrane surface determine the ability of the Ras protein to bind to effectors and, subsequently, conduct downstream signaling.
To investigate the atomistic interaction of the G-domain at the membrane interface, we performed six simulations (replicas Rx) of systems containing two truncated K-Ras G-domains (Px; residues 1–165) lacking the HVR (Figure 1).
In order to characterize the binding of the G-domain to the surface of the membrane we monitored the contacts between the proteins and lipids (Figure 2). All G-domains established contact with the membrane within the first 100 ns, although without a consistent set of residues. In 83% of the replicas, the G-domains remained membrane-bound throughout the 1 s simulations. In the remaining cases (R4P1, R4P2), they transiently detached before rebinding via a different interface (Figure 2). Despite the membrane being PC-rich, we observed significant contacts with PS lipids, suggesting a possible electrostatic preference for negatively charged lipids.
To characterize G-domain orientation, we defined two angles between G-domain vectors and the membrane normal (Figure 1), and tracked them throughout the simulations. The G-domains initially diffuse above the membrane, then adopt stable orientations (Figure S1). The availability of the effector lobe and its functional constituents determine downstream binding, therefore the orientations were analyzed for the orientation of the membrane-bound G-domain to see if the conformations would allow for such interactions (Figure 3).
Among the 12 G-domains, we observed diverse membrane-bound poses with no apparent correlation to the starting configurations, suggesting no strongly preferred orientation.
While most G-domains sampled one dominant orientation, some (e.g., R4P2) transitioned between multiple distinct poses.
3.1.1. Clustering of Membrane-Bound States
To quantitatively assess the orientations adopted by the G-domain on the membrane, we employed Gaussian Mixture Model (GMM) clustering on the combined data from 12 simulation replicas. These simulations sampled orientations using two angles defined in Figure 1, enabling a systematic comparison of membrane-bound poses across all replicas. Clustering revealed seven distinct orientation clusters (Figure 4B), confirming that the truncated G-domain engages the membrane through multiple preferred binding modes. These results indicate that membrane association by the G-domain alone is inherently heterogeneous, with no dominant or persistent configuration.
Consistent with this variability, we observed that individual replicas displayed divergent behaviors. Some maintained stable membrane contact via the effector lobe, while others detached and reoriented to rebind through different residues. This highlights a lack of memory of initial membrane contact and suggests that electrostatic interactions alone are insufficient to anchor the G-domain in a consistent orientation. This dynamic rearrangement is functionally significant. Without the HVR, the G-domain exhibits low specificity and high rotational freedom on the membrane surface, which likely reduces the probability of maintaining a productive interface for effector binding. This finding supports the idea that additional elements, such as the HVR or partner proteins, are needed to stabilize G-domain orientations conducive to signaling. Future work could improve this clustering analysis by incorporating comparisons with randomized baselines or null models, allowing a more rigorous assessment of orientation enrichment and sampling preferences.
3.2. Membrane Binding of HVR as a Critical Step in Ras Signaling
Given the unpredictable behavior of the G-domain on the surface of the membrane, the HVR appears to offer an account for the significant difference in Ras isoforms, dictating where Ras localizes and functions. Studying the HVR experimentally is challenging due to its highly disordered nature. Nevertheless, atomistic details about HVR are needed due to their potentially critical role in embedding K-Ras into the membrane, and consequently enabling signaling partners through downstream effector binding.
Here we simulated 24 ab initio conformations of the HVR with varying initial secondary structures in the presence of membranes (Table S1). Some HVR structures are completely disordered, while others have modest helical contents, varying in both location and length (Figure 5A). The secondary structure of the HVRs remains dynamically variable, with some forming sporadic helical content over the trajectories, while others maintaining a random loop form (Figure S2).
3.2.1. Modes of Insertion of the HVR into the Membrane
With a large ensemble of HVR structures simulated, we could analyze the HVR interaction with the membrane and how its side chains lay on, or insert into the membrane. While the farnesylated C-terminal of all HVRs inserted into the membrane, the N-terminal residues are solvent exposed and free to diffuse or interact with the membrane. By analyzing the distance between the COM of each side chain to the phosphate plane (Figure 6), we observed patterns of two distinct membrane-bound states. In one state, the N-terminus is above the membrane plane, diffusing in solution, as shown by the large standard deviation in its position throughout the trajectories (e.g., R1L3 in Figure 6). In the other form, which is a more commonly observed state, the N-terminus is less flexibile, as the hydrophobic residue M170 inserts into the membrane, acting as a second anchor. The poly-lysine chain remains above the phosphate plane, which is to be expected, as the positively charged lysines form strong electrostatic interactions with the negatively charged PS head groups.
The k-medoid clustering analysis of the pairwise distances between the side-chain COMs and the phosphate plane also results in two well-defined populations (Figure 7A). PCA was also performed for ease of visualization, and the first two PC components are shown for the clustering results (Figure 7A). The centers of the clusters (i.e., the medoids) are subsequently chosen as representative structures for the clusters, showing two distinct membrane-binding poses (Figure 7B). The corresponding atomistic snapshots from the trajectories for the two medoids reveal the distinct position of the M170 hydrophobic residue, either exposed to the solvent or buried into the membrane.
3.2.2. Anionic Lipid Recruitment by HVR
K-Ras HVRs undergo post-translational modifications, during which residue C185 is methylated and farnesylated, thereby increasing the lipophilicity of the HVR. In the majority of our simulation set, the farnesyl tails are inserted into the membrane within the first 50 ns, similar to timescales observed for free lipid insertion into the membrane[31]. The other two isoforms of Ras, N- and H-Ras, have multiple lipidation sites to stabilize their membrane attachment. K-Ras compensates for its single farnesylation site with a positively charged poly-lysine chain, which can favorably interact with anionic lipids such as PS. Randomly dispersed PS lipids (Figure 8, initial frame) diffuse during the simulations, leading to an aggregated PS arrangement around the HVRs (Figure 8 final frame). The lysine side chains in the poly-lysine chain engage and recruit the anionic lipids (Figure 8C). The preferred interaction with PS lipids is also evident from the evolution of the pair distribution function () which shows a significantly higher density of PS lipids near the poly-lysine chain (Figure 8B). The electrostatic interactions arising from a single positively charged lysine are not sufficient to drive the PS clustering around the HVR, as can be observed by the number of interactions between each amino acid and the two types of lipids (Figure 8B). Residues K167, K169, K182 and K184, form contacts with PC and PS without a significant preference toward one or the other. The interaction with PS lipids in the plasma membrane is required for K-Ras to signal as the depletion of the PS lipids dissociates K-Ras from the membrane.[59] Therefore, the poly-lysine chain forms indispensable lipid interactions and is essential in K-Ras membrane association and function.
3.2.3. HVR-HVR Interactions
Previous studies suggest dimerization or nanoclustering of K-Ras as a necessary step for signal transduction [60,61,62,63]. K-Ras-Raf dimerization is also believed to be necessary for signaling, therefore K-Ras oligomerization is an active field of study. There are standing questions about the mechanistic details of dimer formation, the sequence of events, and protein association as the complex forms. Whether the dimerization is driven by K-Ras or its downstream effector, Raf, is unclear. In this study, we posit that the HVR-HVR interactions, most likely aided by anionic lipids, to be a precursor to the whole protein dimerization. Throughout the trajectories, the HVRs form transient dimers (Figure 9A), exploring close distances to each other. The residues most involved in this interaction are located toward the N-terminus of the HVR (Figure 9B), with E168 forming the most contacts with other HVRs. This negatively charged residue may help drive the transient dimerization by interaction with the lysines not belonging to the poly-lysine chain. This exploration of a dimer state by the HVRs may lead the dimerization process, by bringing two K-Ras proteins close, followed by a stronger, more stable association of the G-domains.
3.3. HVR Restrains the Orientations G-Domain
As detailed earlier, the G-domain alone does not bind to the membrane in a consistent manner to interact with downstream effectors but in the presence of the HVR, its binding seems to be largely affected by the way HVR is anchored in the membrane (Figure 10). The HVRs show strong preferential binding to anionic lipids, suggesting they are the ones dictating the K-Ras-membrane contacts. Interestingly, the HVR is the portion of the protein that shows variation between different isoforms while the G-domain is almost exactly the same between them.
When the G-domain is restricted by the HVR the simulations only show a specific mode of membrane binding, with the residues of the allosteric lobe of the G-domain facing the membrane, leaving the orientation open for Raf binding.
The G-domain undergoes binding and unbinding events, although persistently with residues in the allosteric lobe, and very few in the effector lobe. The HVR (residues 166-185) stays in the membrane, showing unperturbed contacts with lipids (Figure 11).
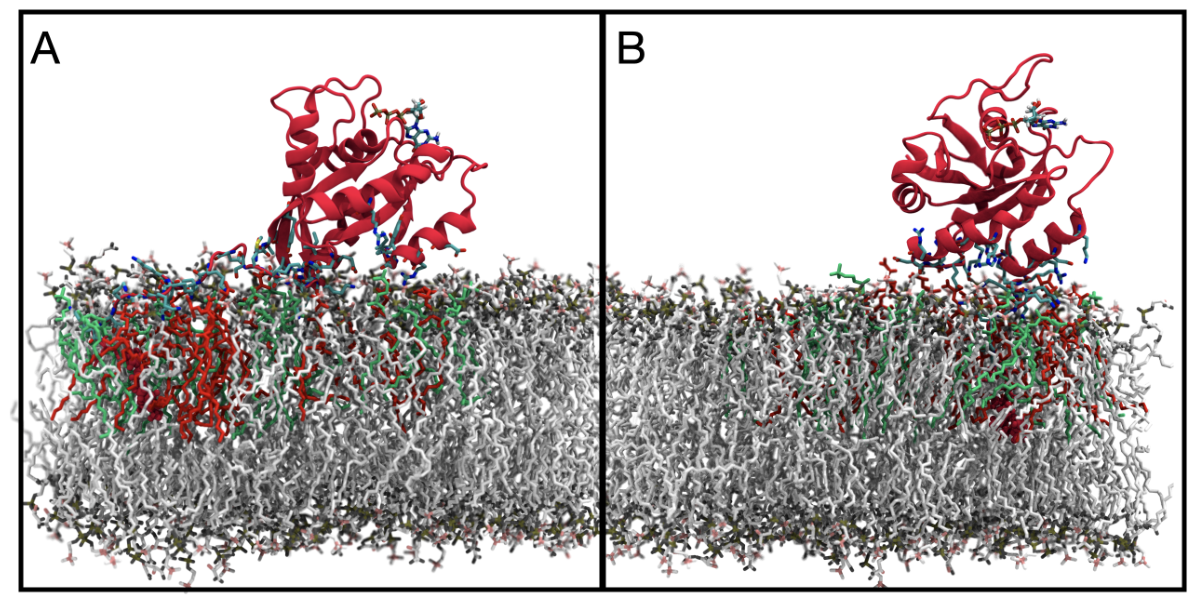
A recent study detailing the interface between Ras and Raf1 Ras-binding domain cysteine-rich domain (RBDCRD) reports the key residues in Ras are located in the switch I region, specifically I24-R41 [64]. The orientations observed in this study for full K-Ras show these residues would be exposed to the solvent, allowing for Raf1 binding (Figure 12 and Figure 13). Previous studies with significantly more sampling found the G-domain to be restrained to two [21,22] or three [24,42] orientations at the surface of the membrane, although a third orientation was found to act as a transitional one between two main states or one in which the G-domain is not membrane bound [25]. Our full-length system echoes these results, showing that the G-domain orientations can be clustered into two bound states (Figure 12). Since these restrictions only occur when the G-domain is tethered to the membrane by the HVR, the HVR must play a key role in determining the availability of the G-domain to bind to its downstream effectors.
4. Conclusions
K-Ras is one of the most mutated isoforms of Ras proteins, exhibiting 85% of their oncogenic activity. While its G-domain is highly similar to the other Ras isoforms, N- and H-Ras, it differs significantly in the HVR which aids in the membrane anchoring. The HVR therefore appears to be a very important element in the function of K-Ras, and yet its highly unstructured form makes it an elusive target. The present systematic computational study of the role of different structural constituents of K-Ras in its membrane binding and pose unveils the importance of the HVR in the process.
Using an ensemble of conformations, we captured a large number of orientations and various distinct modes in which the G-domain alone interacts with the membrane. Clustering results show seven orientations, and the contact analysis suggests most of these are unfavorable for downstream effector binding. The HVR, on the other hand, exhibits strong anionic lipid interaction with the poly-lysine chain. The hydrophobic M170 close to the N-terminus of the HVR acts as a second anchor in part of the simulations. When studying the full-length K-Ras, we found that the G-domain visits restrained orientations, suggesting the HVR plays a crucial role in the orientations the G-domain adapts at the surface of the membrane. The HVR not only makes direct contacts with the membrane, it also temporarily associates with other HVRs at the surface of the membrane. This HVR-induced dimerization event can have significant effect on the formation of the K-Ras dimers, as it can bring the G-domains in close proximity for them to form long-term, stable binding.
Supplementary Materials
The following supporting information can be downloaded at the website of this paper posted on Preprints.org.
Author Contributions
Conceptualization, Anda Trifan, Till Rudack, Josh Vermaas, Emad Tajkhorshid; Methodology, Anda Trifan, Josh Vermaas, Till Rudack, Hossein Omidi Ardali; Investigation, Anda Trifan, Hossein Omidi Ardali, Josh Vermaas; Resources, Emad Tajkhorshid; Supervision, Emad Tajkhorshid; Writing – Original Draft, Anda Trifan, Hossein Omidi Ardali; Writing – Review and Editing, Anda Trifan, Hossein Omidi Ardali, Josh Vermaas, Till Rudack, Emad Tajkhorshid.
Funding
The authors acknowledge support from the National Institute for General Medical Science through grants P41-GM104601 and R24-GM145965. Anda Trifan acknowledges support from the United States Department of Energy through the Computational Sciences Graduate Fellowship (DOE CSGF) under grant DE-SC0019323. We also acknowledge the computational resources provided by Stampede2 at TACC (ACCESS grant number MCA06N060) and Anton 2 computer time provided by the Pittsburgh Supercomputing Center (PSC) through Grant R01GM116961 from the National Institutes of Health. The Anton 2 machine at PSC was made available by D.E. Shaw Research.
Data Availability Statement
The simulation input files, structure files, parameters, and truncated MD trajectories have been deposited in a public repository [https://doi.org/10.5281/zenodo.15995392]. Simulation input scripts, analysis tools, and any custom code developed in this study are also available at this repository.
Conflicts of Interest
The authors declare no conflicts of interest. The funders had no role in the design of the study; in the collection, analyses, or interpretation of data; in the writing of the manuscript; or in the decision to publish the results.
References
- Gimple, R.C.; Wang, X. RAS: striking at the core of the oncogenic circuitry. Front. Oncol. 2019, 9, 965. [Google Scholar] [CrossRef] [PubMed]
- Holderfield, M.; Deuker, M.; McCormick, F.; McMahon, M. Targeting RAF Kinases for Cancer Therapy: BRAF Mutated Melanoma and Beyond. Nat. Rev. Cancer 2014, 14, 455–467. [Google Scholar] [CrossRef] [PubMed]
- Prior, I.A.; Lewis, P.D.; Mattos, C. A Comprehensive Survey of Ras Mutations in Cancer. Cancer Res. 2012, 72, 2457–2467. Available online: http://cancerres.aacrjournals.org/content/72/10/2457.full.pdf. [CrossRef] [PubMed]
- Hobbs, G.A.; Der, C.J.; Rossman, K.L. RAS isoforms and mutations in cancer at a glance. J. Cell Sci. 2016, 129, 1287–1292. [Google Scholar] [CrossRef] [PubMed]
- Cherfils, J.; Zeghouf, M. Regulation of Small GTPases by GEFs, GAPs, and GDIs. Physiol. Rev. 2013, 93, 269–309. [Google Scholar] [CrossRef] [PubMed]
- Gasper, R.; Wittinghofer, F. The Ras switch in structural and historical perspective. Biol. Chem. 2019, 401, 143–163. [Google Scholar] [CrossRef] [PubMed]
- Muegge, I.; Schweins, T.; Langen, R.; Warshel, A. Electrostatic Control of GTP and GDP Binding in the Oncoprotein P21ras. Structure 1996, 4, 475–489. [Google Scholar] [CrossRef] [PubMed]
- Buhrman, G.; O’Connor, C.; Zerbe, B.; Kearney, B.M.; Napoleon, R.; Kovrigina, E.A.; Vajda, S.; Kozakov, D.; Kovrigin, E.L.; Mattos, C. Analysis of Binding Site Hot Spots on the Surface of Ras GTPase. J. Mol. Biol. 2011, 413, 773–789. [Google Scholar] [CrossRef] [PubMed]
- Bos, J.L.; Rehmann, H.; Wittinghofer, A. GEFs and GAPs: critical elements in the control of small G proteins. Cell 2007, 129, 865–877. [Google Scholar] [CrossRef] [PubMed]
- Simanshu, D.; Nissley, D.; McCormick, F. RAS Proteins and Their Regulators in Human Disease. Cell 2017, 170, 17–33. [Google Scholar] [CrossRef] [PubMed]
- Inouye, K.; Mizutani, S.; Koide, H.; Kaziro, Y. Formation of the Ras dimer is essential for Raf-1 activation. J. Biol. Chem. 2000, 275, 3737–3740. [Google Scholar] [CrossRef] [PubMed]
- Li, S.; Jang, H.; Zhang, J.; Nussinov, R. Raf-1 Cysteine-Rich Domain Increases the Affinity of K-Ras/Raf at the Membrane, Promoting MAPK Signaling. Structure 2018, 26, 513–525.e2. [Google Scholar] [CrossRef]
- Schmick, M.; Vartak, N.; Papke, B.; Kovacevic, M.; Truxius, D.C.; Rossmannek, L.; Bastiaens, P.I. KRas Localizes to the Plasma Membrane by Spatial Cycles of Solubilization, Trapping and Vesicular Transport. Cell 2014, 157, 459–471. [Google Scholar] [CrossRef] [PubMed]
- Li, L.; Dwivedi, M.; Patra, S.; Erwin, N.; Möbitz, S.; Winter, R. Probing Colocalization of N-Ras and K-Ras4B Lipoproteins in Model Biomembranes. ChemBioChem 2019, 20, 1190–1195. [Google Scholar] [CrossRef] [PubMed]
- Hancock, J.F.; Paterson, H.; Marshall, C.J. A polybasic domain or palmitoylation is required in addition to the CAAX motif to localize p21ras to the plasma membrane. Cell 1990, 63, 133–139. [Google Scholar] [CrossRef] [PubMed]
- Zhou, Y.; Prakash, P.; Liang, H.; Cho, K.J.; Gorfe, A.A.; Hancock, J.F. Lipid-Sorting Specificity Encoded in K-Ras Membrane Anchor Regulates Signal Output. Cell 2017, 168, 239–251.e16. [Google Scholar] [CrossRef] [PubMed]
- Ahearn, I.; Haigis, K.; Bar-Sagi, D.; Philips, M. Regulating the Regulator: Post-Translational Modification of Ras. Nat. Rev. Mol. Cell Biol. 2011, 13. [Google Scholar] [CrossRef] [PubMed]
- Prior, I.A.; Hancock, J.F. Compartmentalization of Ras proteins. J. Cell Sci. 2001, 114, 1603–1608. [Google Scholar] [CrossRef] [PubMed]
- Dharmaiah, S.; Bindu, L.; Tran, T.H.; Gillette, W.K.; Frank, P.H.; Ghirlando, R.; Nissley, D.V.; Esposito, D.; McCormick, F.; Stephen, A.G.; et al. Structural basis of recognition of farnesylated and methylated KRAS4b by PDEδ. Proc. Natl. Acad. Sci. 2016, 113, E6766–E6775. [Google Scholar] [CrossRef] [PubMed]
- Cruz-Migoni, A.; Canning, P.; Quevedo, C.E.; Bataille, C.J.; Bery, N.; Miller, A.; Russell, A.J.; Phillips, S.E.; Carr, S.B.; Rabbitts, T.H. Structure-based Development of New RAS-effector Inhibitors From a Combination of Active and Inactive RAS-binding Compounds. Proc. Natl. Acad. Sci. USA 2019, 116, 2545–2550. [Google Scholar] [CrossRef] [PubMed]
- Prakash, P.; Zhou, Y.; Liang, H.; Hancock, J.F.; Gorfe, A.A. Oncogenic K-Ras Binds to an Anionic Membrane in Two Distinct Orientations: A Molecular Dynamics Analysis. Biophys. J. 2016, 110, 1125–1138. [Google Scholar] [CrossRef]
- Prakash, P.; Gorfe, A.A. Probing the conformational and energy landscapes of KRAS membrane orientation. J. Phys. Chem. B 2019, 123, 8644–8652. [Google Scholar] [CrossRef] [PubMed]
- Prakash, P.; Litwin, D.; Liang, H.; Sarkar-Banerjee, S.; Dolino, D.; Zhou, Y.; Hancock, J.F.; Jayaraman, V.; Gorfe, A.A. Dynamics of membrane-bound G12V-KRAS from simulations and single-molecule FRET in native nanodiscs. Biophys. J. 2019, 116, 179–183. [Google Scholar] [CrossRef] [PubMed]
- Ngo, V.A.; Sarkar, S.; Neale, C.; Garcia, A.E. How anionic lipids affect spatiotemporal properties of KRAS4B on model membranes. J. Phys. Chem. B 2020, 124, 5434–5453. [Google Scholar] [CrossRef] [PubMed]
- Van, Q.N.; López, C.A.; Tonelli, M.; Taylor, T.; Niu, B.; Stanley, C.B.; Bhowmik, D.; Tran, T.H.; Frank, P.H.; Messing, S.; et al. Uncovering a membrane-distal conformation of KRAS available to recruit RAF to the plasma membrane. Proc. Natl. Acad. Sci. 2020, 117, 24258–24268. [Google Scholar] [CrossRef] [PubMed]
- Shrestha, R.; Carpenter, T.S.; Van, Q.N.; Agamasu, C.; Tonelli, M.; Aydin, F.; Chen, D.; Gulten, G.; Glosli, J.N.; López, C.A.; et al. Membrane lipids drive formation of KRAS4b-RAF1 RBDCRD nanoclusters on the membrane. Commun. Biol. 2024, 7, 242. [Google Scholar]
- Lee, K.Y. Membrane-Driven Dimerization of the Peripheral Membrane Protein KRAS: Implications for Downstream Signaling. Int. J. Mol. Sci. 2024, 25, 2530. [Google Scholar] [CrossRef] [PubMed]
- Lu, S.; Jang, H.; Muratcioglu, S.; Gursoy, A.; Keskin, O.; Nussinov, R.; Zhang, J. Ras Conformational Ensembles, Allostery, and Signaling. Chem. Rev. 2016, 116, 6607–6665. [Google Scholar] [CrossRef] [PubMed]
- Ohkubo, Y.Z.; Morrissey, J.H.; Tajkhorshid, E. Dynamical view of membrane binding and complex formation of human factor VIIa and tissue factor. J. Thromb. Haem. 2010, 8, 1044–1053. [Google Scholar] [CrossRef] [PubMed]
- Ohkubo, Y.Z.; Pogorelov, T.V.; Arcario, M.J.; Christensen, G.A.; Tajkhorshid, E. Accelerating Membrane Insertion of Peripheral Proteins with a Novel Membrane Mimetic Model. Biophys. J. 2012, 102, 2130–2139. [Google Scholar] [CrossRef] [PubMed]
- Vermaas, J.V.; Tajkhorshid, E. A Microscopic View of Phospholipid Insertion into Biological Membranes. J. Phys. Chem. B 2014, 118, 1754–1764. [Google Scholar] [CrossRef] [PubMed]
- Vermaas, J.V.; Tajkhorshid, E. Conformational heterogeneity of α-synuclein in membrane. Biochim. Biophys. Acta Biomembr. 2014, 1838, 3107–3117. [Google Scholar] [CrossRef] [PubMed]
- Baylon, J.L.; Tajkhorshid, E. Capturing Spontaneous Membrane Insertion of the Influenza Virus Hemagglutinin Fusion Peptide. J. Phys. Chem. B 2015, 119, 7882–7893. [Google Scholar] [CrossRef] [PubMed]
- Vermaas, J.V.; Baylon, J.L.; Arcario, M.J.; Muller, M.P.; Wu, Z.; Pogorelov, T.V.; Tajkhorshid, E. Efficient Exploration of Membrane-Associated Phenomena at Atomic Resolution. J. Membr. Biol. 2015, 248, 563–582. [Google Scholar] [CrossRef] [PubMed]
- Muller, M.P.; Wang, Y.; Morrissey, J.H.; Tajkhorshid, E. Lipid Specificity of the Membrane Binding Domain of Coagulation Factor X. J. Thromb. Haem. 2017, 15, 2005–2016. [Google Scholar] [CrossRef] [PubMed]
- Vermaas, J.V.; Tajkhorshid, E. Differential Membrane Binding Mechanics of Synaptotagmin Isoforms Observed at Atomic Detail. Biochemistry 2017, 56, 281–293. [Google Scholar] [CrossRef] [PubMed]
- Pant, S.; Tajkhorshid, E. Microscopic Characterization of GRP1 PH Domain Interaction with Anionic Membranes. J. Comput. Chem. 2020, 41, 489–499. [Google Scholar] [CrossRef] [PubMed]
- Qi, Y.; Cheng, X.; Lee, J.; Vermaas, J.V.; Pogorelov, T.V.; Tajkhorshid, E.; Park, S.; Klauda, J.B.; Im, W. CHARMM-GUI HMMM Builder for Membrane Simulations with the Highly Mobile Membrane-Mimetic Model. Biophys. J. 2015, 109, 2012–2022. [Google Scholar] [CrossRef] [PubMed]
- Jo, S.; Kim, T.; Iyer, V.G.; Im, W. CHARMM-GUI: a Web-based Graphical User Interface for CHARMM. J. Comput. Chem. 2008, 29, 1859–1865. [Google Scholar] [CrossRef] [PubMed]
- Travers, T.; López, C.A.; Agamasu, C.; Hettige, J.J.; Messing, S.; García, A.E.; Stephen, A.G.; Gnanakaran, S. Anionic lipids impact RAS-binding site accessibility and membrane binding affinity of CRAF RBD-CRD. Biophys. J. 2020, 119, 525–538. [Google Scholar] [CrossRef] [PubMed]
- Agamasu, C.; Ghirlando, R.; Taylor, T.; Messing, S.; Tran, T.H.; Bindu, L.; Tonelli, M.; Nissley, D.V.; McCormick, F.; Stephen, A.G. KRAS prenylation is required for bivalent binding with calmodulin in a nucleotide-independent manner. Biophys. J. 2019, 116, 1049–1063. [Google Scholar] [CrossRef] [PubMed]
- Neale, C.; García, A.E. The plasma membrane as a competitive inhibitor and positive allosteric modulator of KRas4B signaling. Biophys. J. 2020, 118, 1129–1141. [Google Scholar] [CrossRef] [PubMed]
- Wells, D.B.; Abramkina, V.; Aksimentiev, A. Exploring Transmembrane Transport Through α-Hemolysin with Grid-Steered Molecular Dynamics. J. Chem. Phys. 2007, 127, 125101. [Google Scholar] [CrossRef] [PubMed]
- Phillips, J.C.; Braun, R.; Wang, W.; Gumbart, J.; Tajkhorshid, E.; Villa, E.; Chipot, C.; Skeel, R.D.; Kale, L.; Schulten, K. Scalable molecular dynamics with NAMD. J. Comput. Chem. 2005, 26, 1781–1802. [Google Scholar] [CrossRef] [PubMed]
- Phillips, J.C.; Hardy, D.J.; Maia, J.D.C.; Stone, J.E.; Ribeiro, J.V.; Bernardi, R.C.; Buch, R.; Fiorin, G.; Hénin, J.; Jiang, W.; et al. Scalable molecular dynamics on CPU and GPU architectures with NAMD. J. Chem. Phys. 2020, 153, 044130. [Google Scholar] [CrossRef] [PubMed]
- Humphrey, W.; Dalke, A.; Schulten, K. VMD – Visual Molecular Dynamics. J. Mol. Graph. 1996, 14, 33–38. [Google Scholar] [CrossRef] [PubMed]
- Leaver-Fay, A.; Tyka, M.; Lewis, S.M.; Lange, O.F.; Thompson, J.; Jacak, R.; Kaufman, K.; Renfrew, P.D.; Smith, C.A.; Sheffler, W.; et al. ROSETTA3: an Object-oriented Software Suite for the Simulation and Design of Macromolecules. Meth. Enzym. 2011, 487, 545. [Google Scholar] [CrossRef] [PubMed]
- Kaufmann, K.W.; Lemmon, G.H.; DeLuca, S.L.; Sheehan, J.H.; Meiler, J. Practically Useful: What the Rosetta Protein Modeling Suite Can Do for You. Biochemistry 2010, 49, 2987–2998. [Google Scholar] [CrossRef] [PubMed]
- Klauda, J.B.; Venable, R.M.; Freites, J.A.; O’Connor, J.W.; Tobias, D.J.; Mondragon-Ramirez, C.; Vorobyov, I.; MacKerell, A.D., Jr.; Pastor, R.W. Update of the CHARMM All-atom Additive Force Field for Lipids: Validation on Six Lipid Types. J. Phys. Chem. B 2010, 114, 7830–7843. [Google Scholar] [CrossRef] [PubMed]
- Vermaas, J.V.; Taguchi, A.T.; Dikanov, S.A.; Wraight, C.A.; Tajkhorshid, E. Redox Potential Tuning through Differential Quinone Binding in the Photosynthetic Reaction Center of Rhodobacter sphaeroides. Biochemistry 2015, 54, 2104–2116. [Google Scholar] [CrossRef] [PubMed]
- Best, R.B.; Zhu, X.; Shim, J.; Lopes, P.E.M.; Mittal, J.; Feig, M.; MacKerell, A.D. Optimization of the Additive CHARMM All-atom Protein Force Field Targeting Improved Sampling of the Backbone ϕ, ψ and Side-chain χ1 and χ2 Dihedral Angles. J. Chem. Theory Comput. 2012, 8, 3257–3273. [Google Scholar] [CrossRef] [PubMed]
- Jorgensen, W.; Chandrasekhar, J.; Maudura, J.D.; Impey, R.W.; Klein, M.L. Comparison of Simple Potential Functions for Simulating Liquid Water. J. Chem. Phys. 1983, 79, 926–935. [Google Scholar] [CrossRef]
- Feller, S.E.; Zhang, Y.; Pastor, R.W. Constant Pressure Molecular Dynamics Simulation: the Langevin Piston Method. J. Chem. Phys. 1995, 103, 4613–4621. [Google Scholar] [CrossRef]
- Martyna, G.J.; Tobias, D.J.; Klein, M.L. Constant Pressure Molecular Dynamics Algorithms. J. Chem. Phys. 1994, 101, 4177–4189. [Google Scholar] [CrossRef]
- Darden, T.; York, D.; Pedersen, L. Particle Mesh Ewald: an N·log(N) Method for Ewald Sums in Large Systems. J. Chem. Phys. 1993, 98, 10089–10092. [Google Scholar] [CrossRef]
- Pedregosa, F.; Varoquaux, G.; Gramfort, A.; Michel, V.; Thirion, B.; Grisel, O.; Blondel, M.; Prettenhofer, P.; Weiss, R.; Dubourg, V.; et al. Scikit-learn: Machine Learning in Python. J. Mach. Learn. Res. 2011, 12, 2825–2830. [Google Scholar]
- Hunter, J.D. Matplotlib: A 2D graphics environment. Comput. Sci. Eng. 2007, 9, 90–95. [Google Scholar] [CrossRef]
- Bauckhage, C. Numpy/Scipy Recipes for Data Science: K-medoids Clustering; Technical report; University of Bonn, 2015. [Google Scholar] [CrossRef]
- Henkels, K.M.; Cho, K.j. K-Ras Plasma Membrane Interactions: A Tractable Therapeutic Target. Am. J. Biomed. Sci. Res. 2020, 9. [Google Scholar] [CrossRef]
- Nussinov, R.; Tsai, C.J.; Jang, H. Is Nanoclustering Essential for All Oncogenic KRas Pathways? Can It Explain Why Wild-type KRas Can Inhibit its Oncogenic Variant? Semin Cancer Biol. 2018. [Google Scholar] [CrossRef]
- Nan, X.; Tamgüney, T.M.; Collisson, E.A.; Lin, L.J.; Pitt, C.; Galeas, J.; Lewis, S.; Gray, J.W.; McCormick, F.; Chu, S. Ras-GTP Dimers Activate the Mitogen-Activated Protein Kinase (MAPK) Pathway. Proc. Natl. Acad. Sci. USA 2015, 112, 7996–8001. [Google Scholar] [CrossRef] [PubMed]
- Lin, P.; Chen, X.; Moktan, H.; Arrese, E.L.; Duan, L.; Wang, L.; Soulages, J.L.; Zhou, D.H. Membrane Attachment and Structure Models of Lipid Storage Droplet Protein 1. Biochim. Biophys. Acta Biomembr. 2014, 1838, 874–881. [Google Scholar] [CrossRef] [PubMed]
- Ambrogio, C.; Köhler, J.; Zhou, Z.W.; Wang, H.; Paranal, R.; Li, J.; Capelletti, M.; Caffarra, C.; Li, S.; Lv, Q.; et al. KRAS Dimerization Impacts MEK Inhibitor Sensitivity and Oncogenic Activity of Mutant KRAS. Cell 2018, 172, 857–868. [Google Scholar] [CrossRef] [PubMed]
- Tran, T.H.; Chan, A.H.; Young, L.C.; Bindu, L.; Neale, C.; Messing, S.; Dharmaiah, S.; Taylor, T.; Denson, J.P.; Esposito, D.; et al. KRAS interaction with RAF1 RAS-binding domain and cysteine-rich domain provides insights into RAS-mediated RAF activation. Nat. Commun. 2021, 12, 1–16. [Google Scholar] [CrossRef] [PubMed]
Figure 1.
G-Domain simulation setup. Example of an initial G-domain configuration with truncated HVR, placed approximately 25Å above an HMMM membrane (left), and a representative membrane-bound orientation obtained from HMMM simulations (right). Vectors used to define orientation angles are colored as follows: membrane normal (blue), vector to GTP (green), and vector to helix 5 (yellow).
Figure 1.
G-Domain simulation setup. Example of an initial G-domain configuration with truncated HVR, placed approximately 25Å above an HMMM membrane (left), and a representative membrane-bound orientation obtained from HMMM simulations (right). Vectors used to define orientation angles are colored as follows: membrane normal (blue), vector to GTP (green), and vector to helix 5 (yellow).
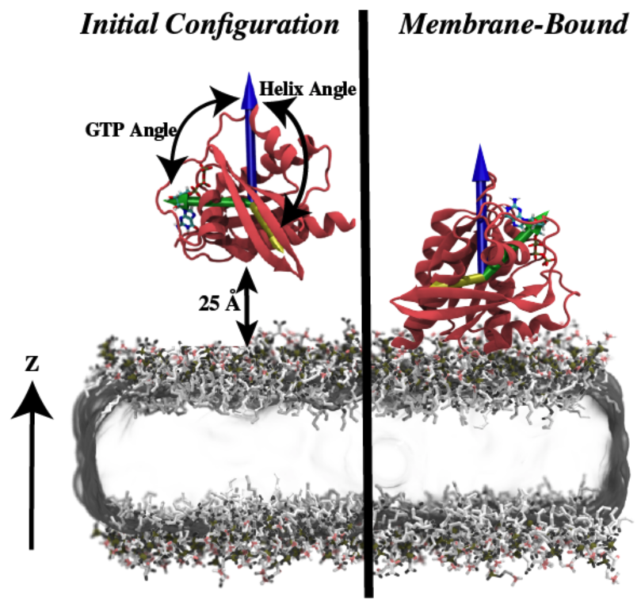
Figure 2.
Membrane contacts of the K-Ras G-domain without HVR. Time progression of the K-Ras–lipid interaction for the truncated G-domain. Protein interactions with PC lipids are indicated in blue, and with PS lipids in red. A contact is defined as a heavy atom of the protein within 3.5Å of any heavy atom of a lipid. Highlighted are the effector lobe (yellow) and the allosteric lobe (pink). Membrane interactions are distributed across both lobes of the G-domain, reflecting heterogeneous and dynamic binding.
Figure 2.
Membrane contacts of the K-Ras G-domain without HVR. Time progression of the K-Ras–lipid interaction for the truncated G-domain. Protein interactions with PC lipids are indicated in blue, and with PS lipids in red. A contact is defined as a heavy atom of the protein within 3.5Å of any heavy atom of a lipid. Highlighted are the effector lobe (yellow) and the allosteric lobe (pink). Membrane interactions are distributed across both lobes of the G-domain, reflecting heterogeneous and dynamic binding.
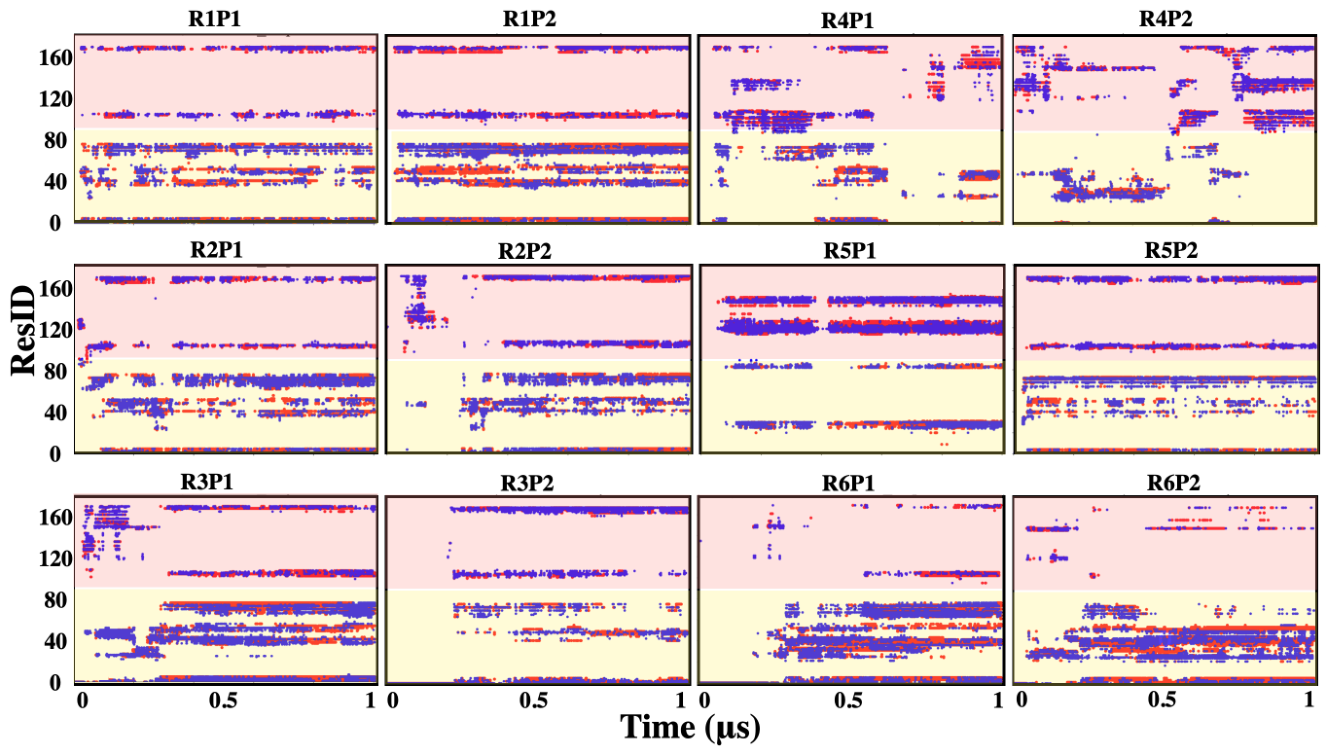
Figure 3.
Orientation of the K-Ras G-domain without the HVR on the surface of the membrane. Two vectors (Helix and GTP) were defined in the G-domain (Figure 1) and their angles with respect to the membrane normal were used to describe orientation. Each point represents the G-domain’s position over time, colored by distance of its center of mass (COM) to the membrane phosphate plane. Darker colors indicate closer binding.
Figure 3.
Orientation of the K-Ras G-domain without the HVR on the surface of the membrane. Two vectors (Helix and GTP) were defined in the G-domain (Figure 1) and their angles with respect to the membrane normal were used to describe orientation. Each point represents the G-domain’s position over time, colored by distance of its center of mass (COM) to the membrane phosphate plane. Darker colors indicate closer binding.
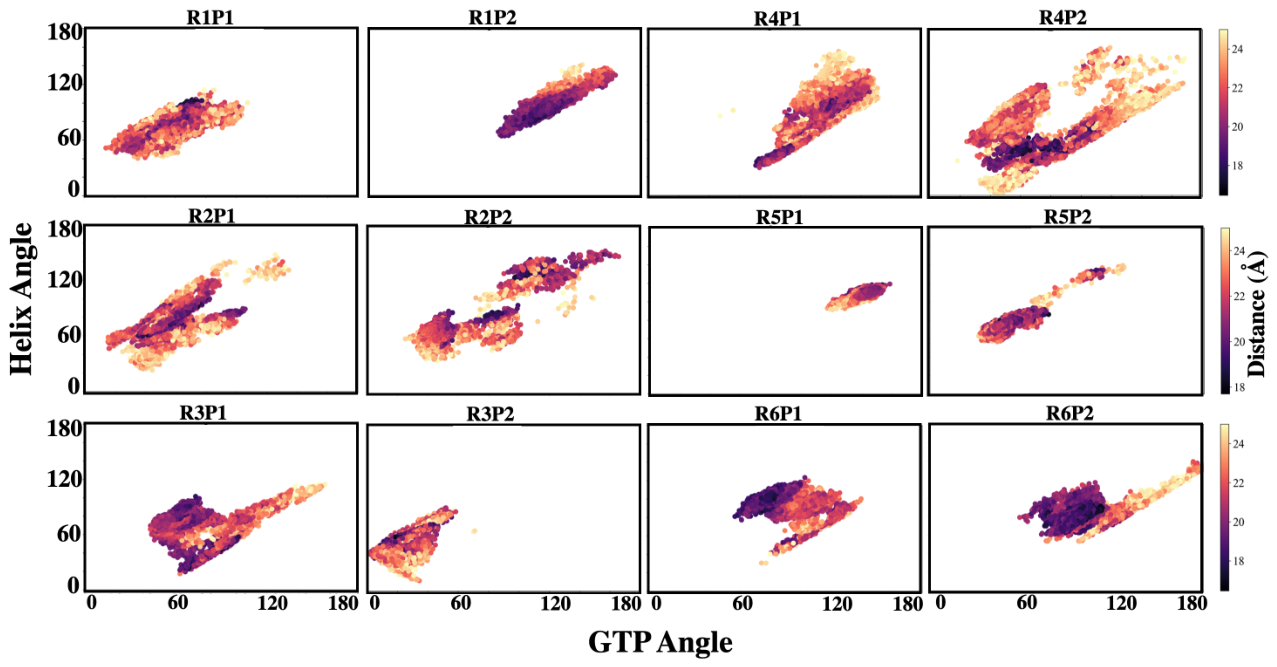
Figure 4.
Clustering the orientation of membrane-bound K-Ras G-domain without HVR. A: Orientation data from all 12 simulation replicas (see Figure 2) was merged. Bin colors range from low (purple) to high (yellow) frequency of occurrence. B: Gaussian Mixture Model (GMM) clustering reveals seven distinct membrane-bound orientations sampled by truncated K-Ras.
Figure 4.
Clustering the orientation of membrane-bound K-Ras G-domain without HVR. A: Orientation data from all 12 simulation replicas (see Figure 2) was merged. Bin colors range from low (purple) to high (yellow) frequency of occurrence. B: Gaussian Mixture Model (GMM) clustering reveals seven distinct membrane-bound orientations sampled by truncated K-Ras.
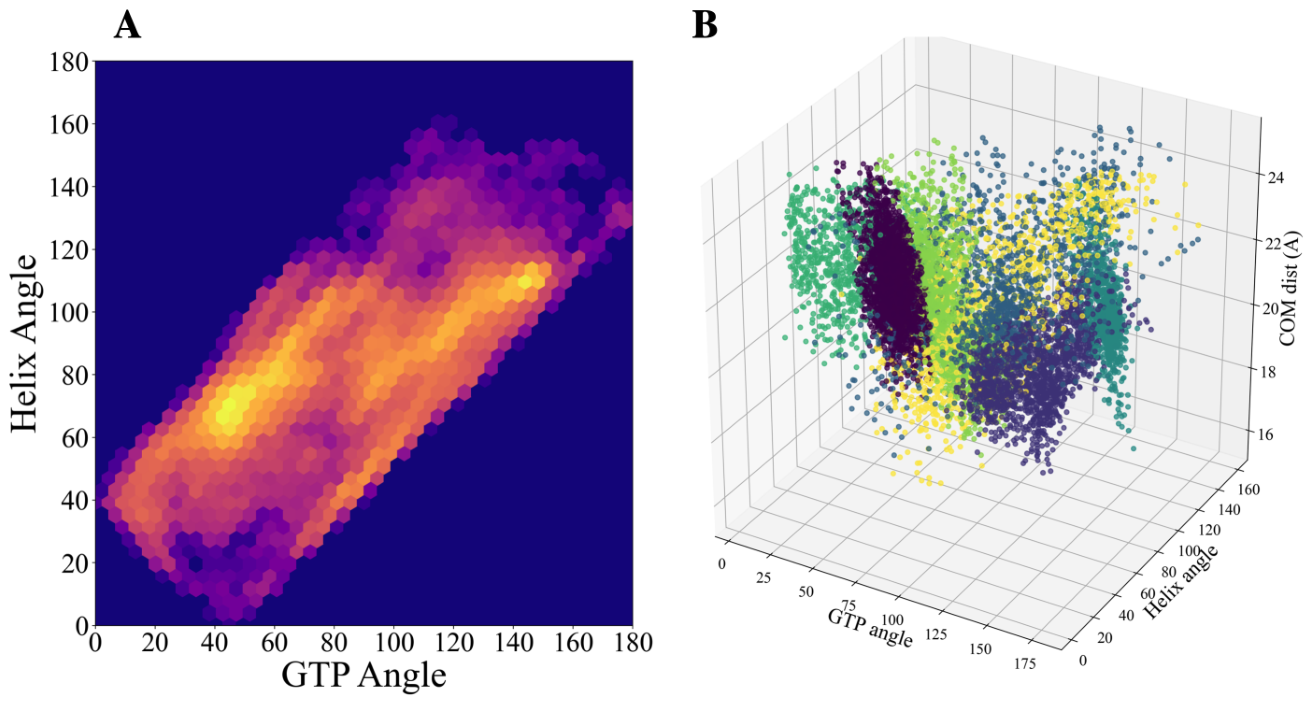
Figure 5.
Initial HVR structures and the HVR simulation setup. (A) These HVR structures were positioned close to the membrane and used to initiate three simulations of membrane-bound HVRs. (B) Example shown is the initial system R1. Eight HVR structures were placed initially in each simulation system (four above the membrane and 4 below it).
Figure 5.
Initial HVR structures and the HVR simulation setup. (A) These HVR structures were positioned close to the membrane and used to initiate three simulations of membrane-bound HVRs. (B) Example shown is the initial system R1. Eight HVR structures were placed initially in each simulation system (four above the membrane and 4 below it).
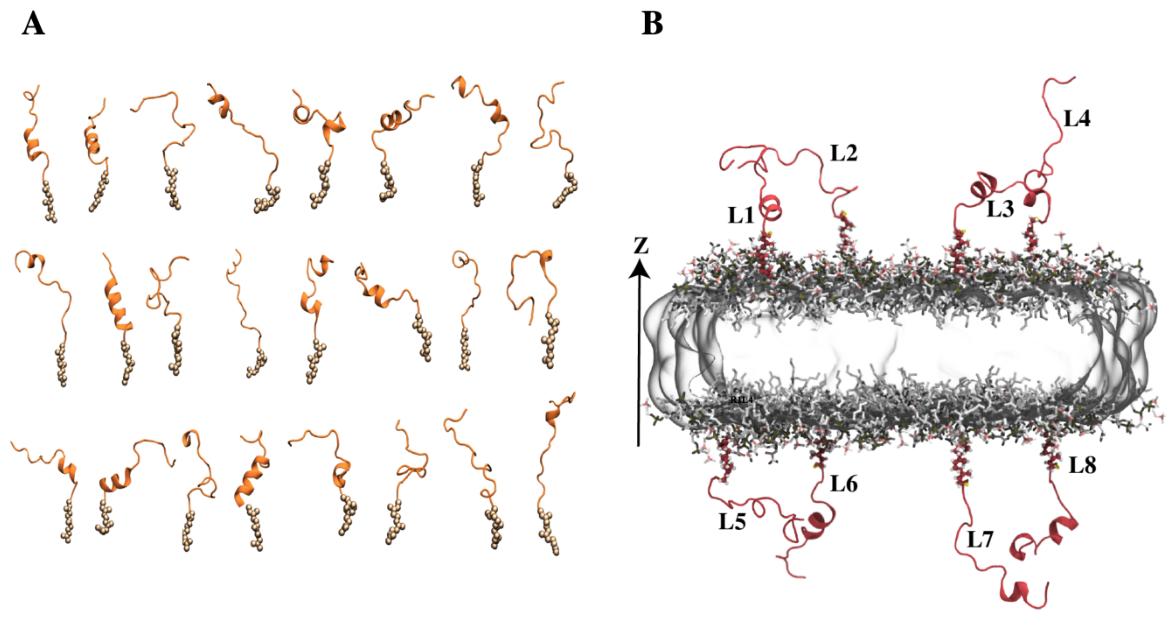
Figure 6.
HVR interaction with the membrane. The modes of interaction between the HVRs and the membrane lipids are shown. Each RnLm plot shows the distance between the COM of each side chain in the HVR to the phosphate plane of lipids (horizontal line at 0) in simulation replica Rn and HVR Lm. Orange solid line represents the average values, while the orange shaded area represents the standard deviation throughout the trajectory. The blue shaded areas highlight the poly-lysine chain.
Figure 6.
HVR interaction with the membrane. The modes of interaction between the HVRs and the membrane lipids are shown. Each RnLm plot shows the distance between the COM of each side chain in the HVR to the phosphate plane of lipids (horizontal line at 0) in simulation replica Rn and HVR Lm. Orange solid line represents the average values, while the orange shaded area represents the standard deviation throughout the trajectory. The blue shaded areas highlight the poly-lysine chain.
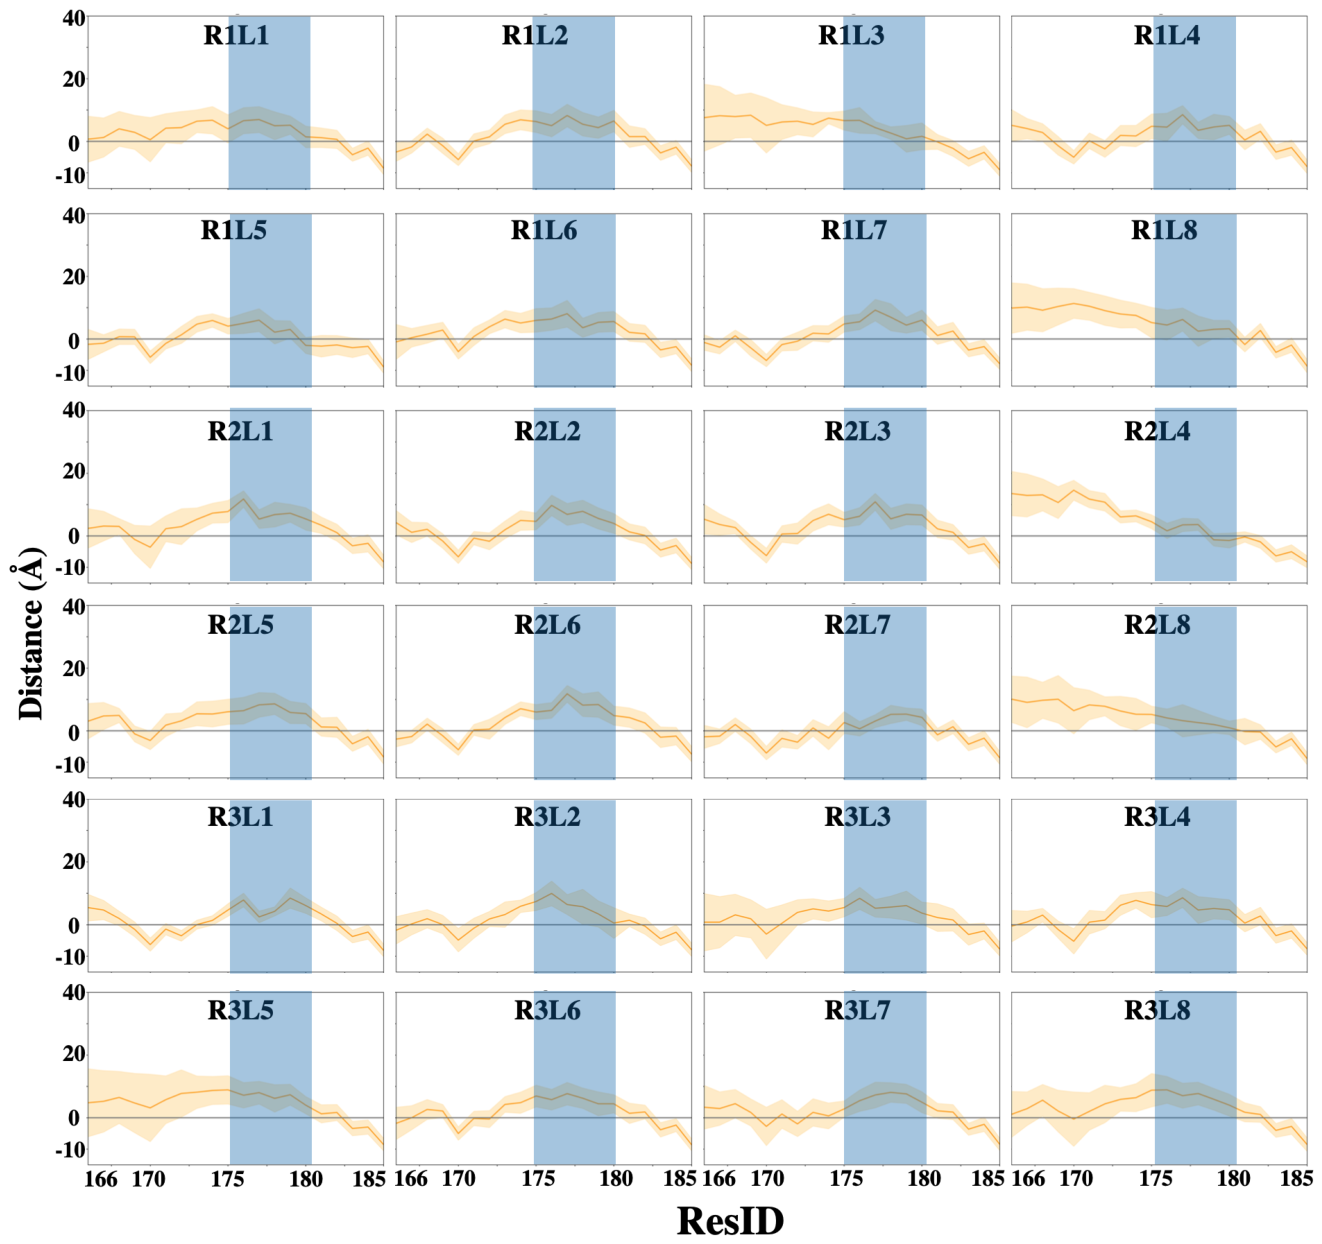
Figure 7.
Clustering of HVR membrane binding modes and representative structures. (A) Principle components (PC) of the dimensionally reduced data represented in Figure 6 clustered into binding modes colored with yellow and purple and their representative centers (Medoid 1: green, Medoid 2: blue). For each binding mode a representative structure is shown for the respective medoid (B). The HVR assumes two distinct poses on the surface of the membrane: one with N-terminus residues exposed to the solvent (from R1L8 at 286 ns), and another one where they are buried into the membrane with the hydrophobic residue M170 (from R1L8 at 328 ns). (C) The primary sequence of K-Ras HVR, with amino acids colored by type (blue: basic, red: acidic, green: polar, white: hydrophobic)
Figure 7.
Clustering of HVR membrane binding modes and representative structures. (A) Principle components (PC) of the dimensionally reduced data represented in Figure 6 clustered into binding modes colored with yellow and purple and their representative centers (Medoid 1: green, Medoid 2: blue). For each binding mode a representative structure is shown for the respective medoid (B). The HVR assumes two distinct poses on the surface of the membrane: one with N-terminus residues exposed to the solvent (from R1L8 at 286 ns), and another one where they are buried into the membrane with the hydrophobic residue M170 (from R1L8 at 328 ns). (C) The primary sequence of K-Ras HVR, with amino acids colored by type (blue: basic, red: acidic, green: polar, white: hydrophobic)
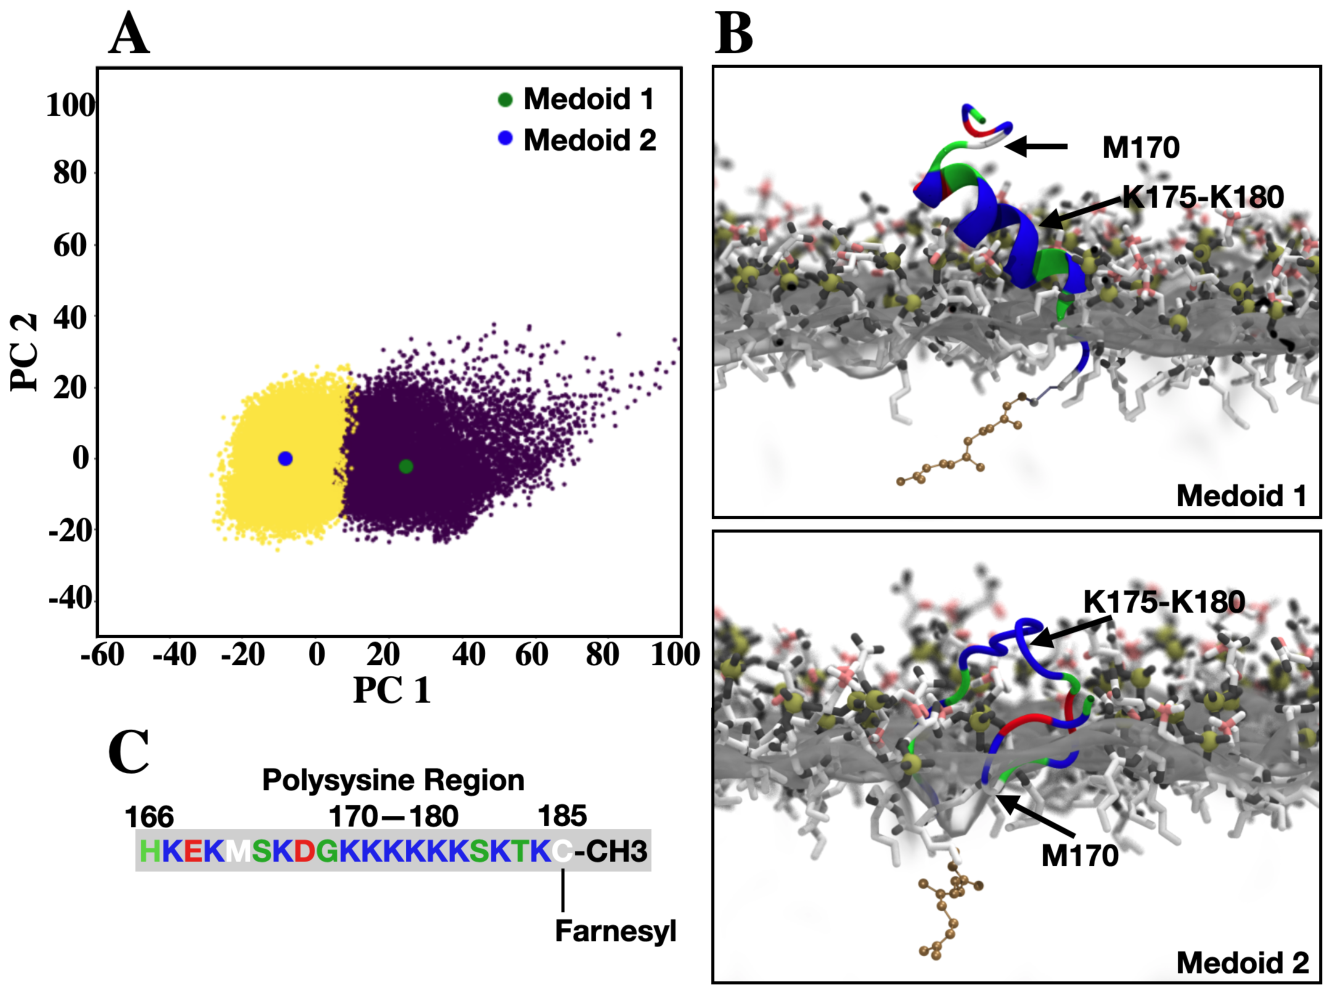
Figure 8.
Lipid interaction of HVR. A In initial simulation setup the different lipids (PS:red dots; PC:green dots) are randomly distributed as shown in the 2D map of the membrane. During the simulations, the PS lipids aggregate around the HVRs (hexagons), leading to a well ordered localization. B The radial distribution of lipids with respect to HVRs for all three systems supports the aggregation of PS around the HVR. Comparing the initial for PS and PC (dashed lines) with final ones (solid lines) clearly shows aggregation of lipids, especially PS around HVRs. C A representative snapshot showing PS (red) lipid aggregation around the HVRs (purple). D The positively charged poly-lysine chain (residues 175-180) has substantially more interactions with the negatively charged PS lipids (red bars) than the PC lipids (green bars). A contact is defined as a distance of 3.5Å or shorter between the HVR residues and the lipid heavy atoms. The values are normalized to the maximum number of contacts. The poly-lysine chain of the HVR leads to a local aggregation of PS lipids around the HVR.
Figure 8.
Lipid interaction of HVR. A In initial simulation setup the different lipids (PS:red dots; PC:green dots) are randomly distributed as shown in the 2D map of the membrane. During the simulations, the PS lipids aggregate around the HVRs (hexagons), leading to a well ordered localization. B The radial distribution of lipids with respect to HVRs for all three systems supports the aggregation of PS around the HVR. Comparing the initial for PS and PC (dashed lines) with final ones (solid lines) clearly shows aggregation of lipids, especially PS around HVRs. C A representative snapshot showing PS (red) lipid aggregation around the HVRs (purple). D The positively charged poly-lysine chain (residues 175-180) has substantially more interactions with the negatively charged PS lipids (red bars) than the PC lipids (green bars). A contact is defined as a distance of 3.5Å or shorter between the HVR residues and the lipid heavy atoms. The values are normalized to the maximum number of contacts. The poly-lysine chain of the HVR leads to a local aggregation of PS lipids around the HVR.
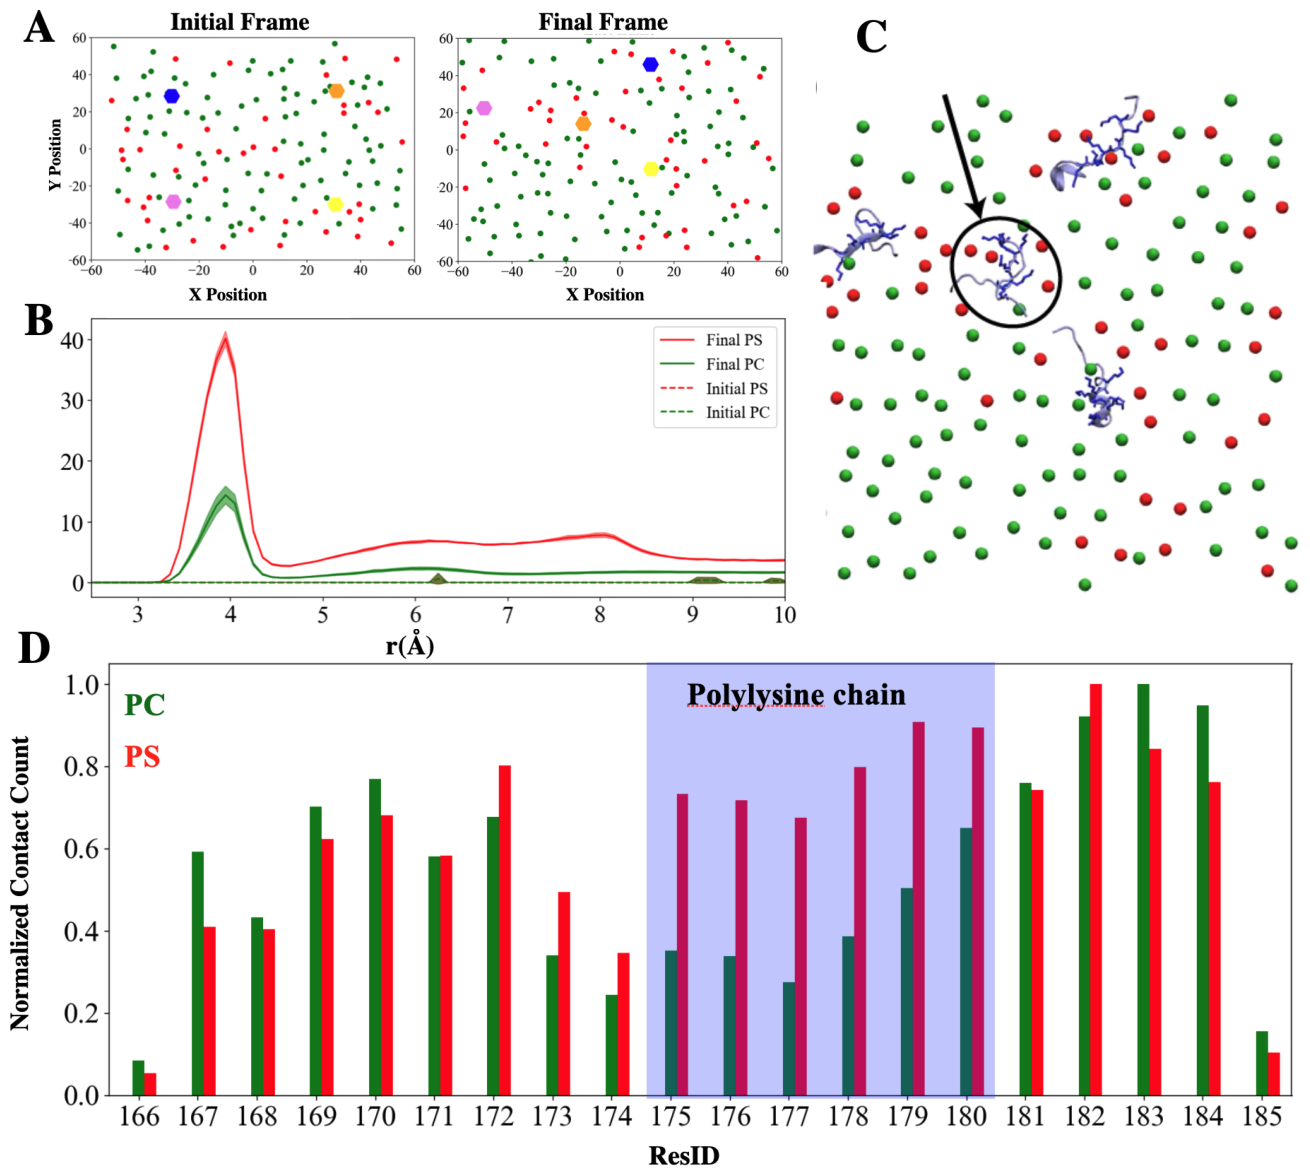
Figure 9.
HVR-HVR interactions in the membrane. A In the initial simulation setup the four HVRs (hexagons) are placed equidistant above the membrane as shown in the 2D map of the membrane (left). During the simulation, the HVRs form dimers, though some of them persist only transiently (right). B The key dimeric interactions involve residues 166 to 175 according to the contact analysis between HVRs from all simulations. The contact count is normalized to the maximum number of counts. C Structural model of the HVR colored by residue properties (blue: basic, red: acidic, green: polar, white: hydrophobic) and indicated interaction sites for dimerization (protein interaction) and PS interaction.
Figure 9.
HVR-HVR interactions in the membrane. A In the initial simulation setup the four HVRs (hexagons) are placed equidistant above the membrane as shown in the 2D map of the membrane (left). During the simulation, the HVRs form dimers, though some of them persist only transiently (right). B The key dimeric interactions involve residues 166 to 175 according to the contact analysis between HVRs from all simulations. The contact count is normalized to the maximum number of counts. C Structural model of the HVR colored by residue properties (blue: basic, red: acidic, green: polar, white: hydrophobic) and indicated interaction sites for dimerization (protein interaction) and PS interaction.
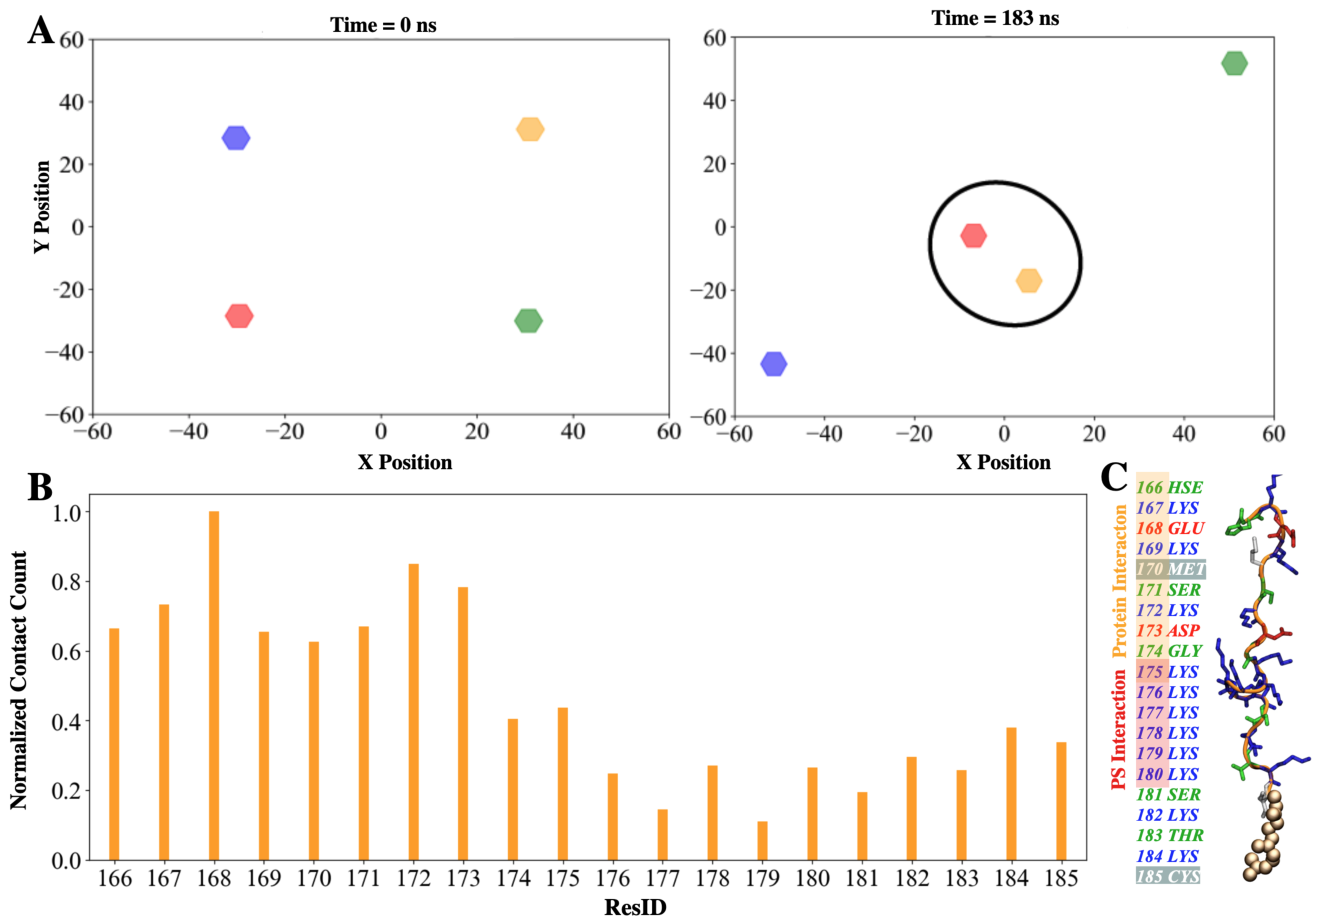
Figure 10.
Setup for full-length K-Ras simulations. Shown are three frames from the simulation sequence. The initial HVR structure is obtained from the final frame of the HVR-only HMMM simulations at s, which was used to connect the G-domain (left) and initialize the full-length simulation system in a full-tailed membrane (middle). The right panel shows the final configuration after 0.5 s of full-length simulation, at s.
Figure 10.
Setup for full-length K-Ras simulations. Shown are three frames from the simulation sequence. The initial HVR structure is obtained from the final frame of the HVR-only HMMM simulations at s, which was used to connect the G-domain (left) and initialize the full-length simulation system in a full-tailed membrane (middle). The right panel shows the final configuration after 0.5 s of full-length simulation, at s.
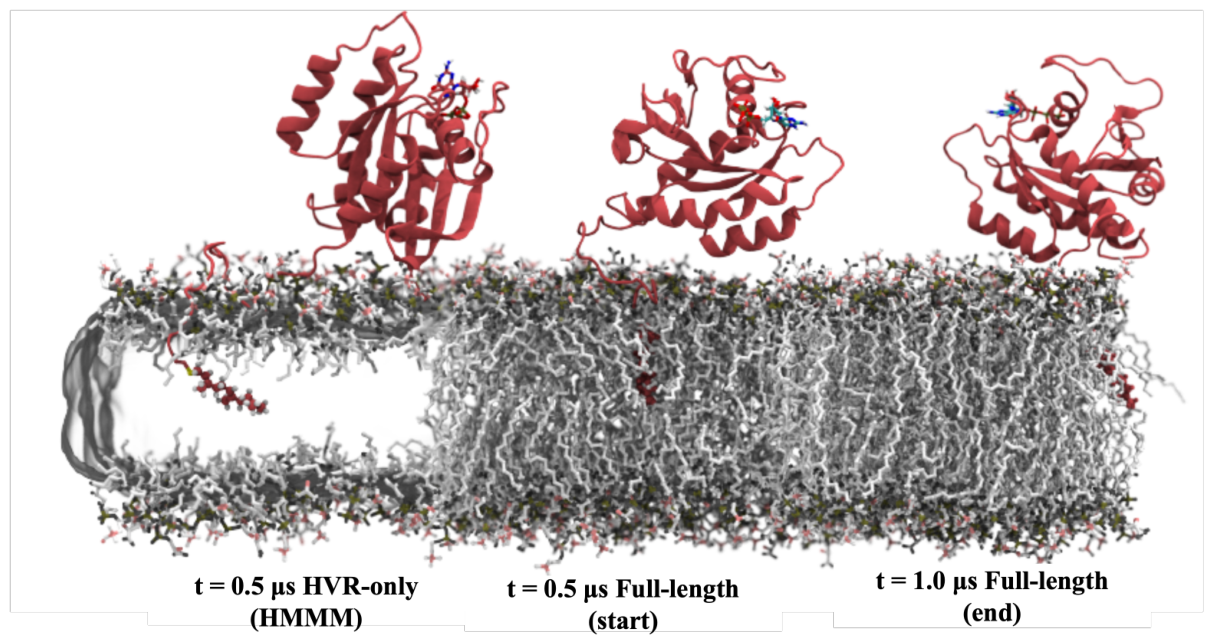
Figure 11.
Protein-lipid contacts and orientation behavior of full-length K-Ras. Top panels: Orientation distributions of full-length K-Ras in HMMM (left) and full-tailed (right) membranes, shown in the space formed by the GTP and Helix angles. Each point is colored by the distance between the G-domain and the membrane surface (color bar, right). Bottom panels: Time progression of protein-lipid contacts for the same systems. Contacts with PC and PS lipids are indicated in blue and red, respectively. Residue positions are shown on the y-axis, with the effector lobe (yellow), allosteric lobe (pink), and HVR (cyan) highlighted. Lipid interactions occur predominantly in the HVR, with additional contacts observed through the allosteric lobe of the G-domain.
Figure 11.
Protein-lipid contacts and orientation behavior of full-length K-Ras. Top panels: Orientation distributions of full-length K-Ras in HMMM (left) and full-tailed (right) membranes, shown in the space formed by the GTP and Helix angles. Each point is colored by the distance between the G-domain and the membrane surface (color bar, right). Bottom panels: Time progression of protein-lipid contacts for the same systems. Contacts with PC and PS lipids are indicated in blue and red, respectively. Residue positions are shown on the y-axis, with the effector lobe (yellow), allosteric lobe (pink), and HVR (cyan) highlighted. Lipid interactions occur predominantly in the HVR, with additional contacts observed through the allosteric lobe of the G-domain.
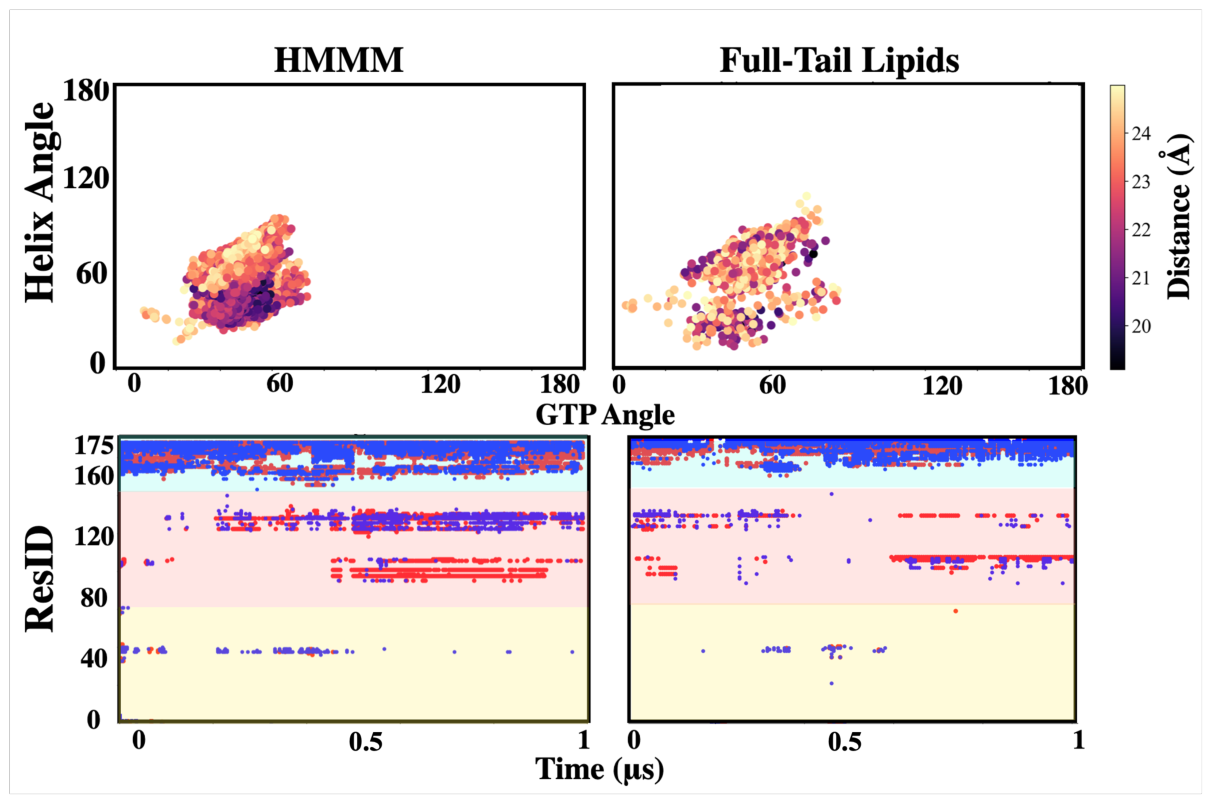
Figure 12.
Protein–membrane contacts of full K-Ras. (A) Orientation histogram for full-length K-Ras, generated by concatenating angular data across all replicas. The color gradient from purple (low frequency) to yellow (high frequency) reflects the relative density of sampled orientations in the angular space defined by the Helix and GTP angles. (B) GMM clustering reveals two dominant membrane-bound orientations for full-length K-Ras.
Figure 12.
Protein–membrane contacts of full K-Ras. (A) Orientation histogram for full-length K-Ras, generated by concatenating angular data across all replicas. The color gradient from purple (low frequency) to yellow (high frequency) reflects the relative density of sampled orientations in the angular space defined by the Helix and GTP angles. (B) GMM clustering reveals two dominant membrane-bound orientations for full-length K-Ras.
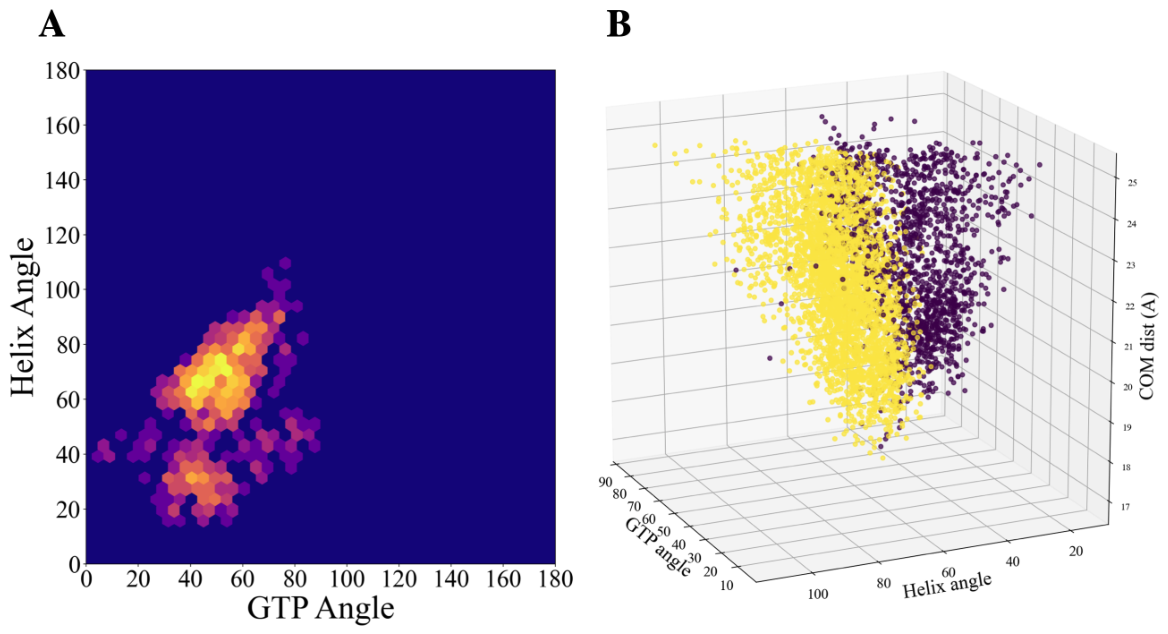
Figure 13.
Example bound states of full K-Ras. One frame was chosen to represent each of the two clusters shown in Figure 12, based on the highest populated bins in the histogram for each cluster. The G-domain faces the membrane making contact with the membrane either through the strands (A) or through the helices (B). The residues within 5Å of the membrane are displayed explicitly using Licorice. The lipids within 5Å of the protein are also colored (red for POPS and green for POPC).
Figure 13.
Example bound states of full K-Ras. One frame was chosen to represent each of the two clusters shown in Figure 12, based on the highest populated bins in the histogram for each cluster. The G-domain faces the membrane making contact with the membrane either through the strands (A) or through the helices (B). The residues within 5Å of the membrane are displayed explicitly using Licorice. The lipids within 5Å of the protein are also colored (red for POPS and green for POPC).
Disclaimer/Publisher’s Note: The statements, opinions and data contained in all publications are solely those of the individual author(s) and contributor(s) and not of MDPI and/or the editor(s). MDPI and/or the editor(s) disclaim responsibility for any injury to people or property resulting from any ideas, methods, instructions or products referred to in the content. |
© 2026 by the authors. Licensee MDPI, Basel, Switzerland. This article is an open access article distributed under the terms and conditions of the Creative Commons Attribution (CC BY) license (http://creativecommons.org/licenses/by/4.0/).
Copyright: This open access article is published under a Creative Commons CC BY 4.0 license, which permit the free download, distribution, and reuse, provided that the author and preprint are cited in any reuse.