

Submitted:
19 August 2026
Posted:
20 August 2026
You are already at the latest version
Abstract
PC3 prostate cancer (PCa) cells exhibit high metastatic potential, androgen independence, and activation of multiple oncogenic signaling pathways. Although Moringa oleifera exhibits recognized anticancer properties, its epigenetic effects in aggressive PCa remain largely unexplored. In this study, PC3 cells were treated with Moringa oleifera extract at 100 or 200 μg/mL, and its effects were assessed through functional and molecular analyses together with genome-wide DNA methylation profiling. Both concentrations increased apoptosis and reduced ERK1/2 and AKT activation, epithelial-mesenchymal transition markers, and invasion-associated molecules. Genome-wide methylation profiling revealed concentration-dependent changes in the biological pathways affected by Moringa oleifera treatment. At 100 μg/mL, hypermethylated DMR-associated genes were mainly enriched in pathways related to small GTPase signaling, focal adhesion, cytoskeletal organization, axon guidance, MAPK, Rap1 and RHO signaling. At 200 μg/mL, the enrichment profile shifted towards pathways involving cell adhesion, Wnt signalling, RAC1/CDC42 activity, and VEGF/VEGFR2-mediated angiogenesis. Hypomethylated DMR-associated genes showed a distinct, although partly overlapping, pattern of pathway enrichment. Direct comparison of the two concentrations demonstrated a preferential hypermethylation response at 200 μg/mL, particularly involving axon guidance, focal adhesion, actin-cytoskeleton regulation, MAPK and EPH–Ephrin signaling, whereas hypomethylated Reactome pathways were mainly related to NOTCH and RHOB/RHOC signaling. Collectively, these findings support Moringa oleifera as a natural multi-target epigenetic modulator capable of inducing coordinated DNA methylation remodeling in genes associated with multiple signaling networks implicated in metastatic PCa.
Keywords:
Moringa oleifera
; prostate cancer
; PC3
; DNA methylation
; epigenetics
; EMT
; MAPK
; PI3K-Akt
; angiogenesis
1. Introduction
Prostate cancer (PCa) remains one of the leading causes of cancer-related mortality among men despite major advances in diagnosis and treatment. While localized tumours are frequently cured by surgery or radiotherapy, progression to castration-resistant prostate cancer (CRPC) represents the principal cause of therapeutic failure because of metastatic dissemination and resistance to systemic therapies [1]. Among the available experimental models, the human PC3 cell line represents a well-established model of advanced androgen-independent PCa [2,3]. Derived from a bone metastasis of grade IV prostate adenocarcinoma, PC3 cells exhibit constitutive activation of PI3K/AKT and MAPK/ERK signaling pathways [4,5], together with enhanced epithelial-mesenchymal transition (EMT), extracellular matrix (ECM) remodeling, angiogenesis and high migratory and invasive capacity [6,7], thereby closely reproducing the biological characteristics of metastatic PCa.
Natural compounds have attracted increasing attention as multitarget anticancer agents because of their ability to simultaneously regulate oxidative stress, inflammation, apoptosis and tumor-associated signaling pathways. Among these, Moringa oleifera Lam., a medicinal plant widely used in traditional medicine, is rich in glucosinolates, isothiocyanates, flavonoids, phenolic compounds and other bioactive metabolites exhibiting antioxidant, anti-inflammatory, antiproliferative and pro-apoptotic properties [8,9,10,11]. Recently, we demonstrated that Moringa oleifera suppresses the aggressive phenotype of PC3 cells by downregulating IGF1R signaling, reducing ERK and AKT activation, inhibiting EMT and extracellular matrix remodeling, decreasing migration and promoting apoptosis, supporting its potential as a multitarget therapeutic agent against aggressive PCa [12].
Besides genetic alterations, increasing evidence indicates that PCa progression is profoundly influenced by epigenetic dysregulation. Epigenetic mechanisms-including DNA methylation, histone modifications and non-coding RNAs regulate gene expression without altering the DNA sequence and are now recognized as fundamental drivers of tumor initiation, progression and therapeutic response [13,14,15,16,17,18]. Because epigenetic alterations are potentially reversible, they also represent attractive therapeutic targets for cancer prevention and treatment [19].
Among these mechanisms, DNA methylation is one of the earliest, most stable and frequent molecular alterations occurring during prostate carcinogenesis. Aberrant methylation patterns, characterized by global hypomethylation associated with promoter-specific hypermethylation of tumor suppressor genes, contribute to genomic instability, transcriptional silencing and the coordinated rewiring of signaling networks controlling proliferation, apoptosis, EMT, migration, invasion, angiogenesis and therapeutic resistance [15,16,17,18,19,20].
Several tumor suppressor genes undergo recurrent promoter hypermethylation during PCa progression. Among these, GSTP1 represents the best-established epigenetic hallmark of the disease, whereas hypermethylation of APC, RASSF1A, RARB, PITX2, CCND2 and CDH1 has been consistently associated with tumor progression, biochemical recurrence, metastatic dissemination and poor clinical outcome [15,20,21,22]. In particular, APC promoter hypermethylation has been identified as an independent predictor of disease-free and disease-specific survival, emphasizing the clinical relevance of DNA methylation as both a prognostic biomarker and a potential therapeutic target [21].
Although several phytochemicals contained in Moringa oleifera, including isothiocyanates, quercetin and kaempferol, have been shown to modulate cancer cell behaviour, their genome-wide epigenetic effects remain largely unexplored. To date, no study has investigated the dose-dependent impact of Moringa oleifera on genome-wide DNA methylation in androgen-independent PC3 cells. Therefore, in the present study, we combined genome-wide DNA methylation profiling with Gene Ontology (GO), Kyoto Encyclopedia of Genes and Genomes (KEGG) and Reactome enrichment analyses to investigate the epigenetic mechanisms underlying the anticancer activity of Moringa oleifera. Our results demonstrate that Moringa oleifera induces a coordinated, dose-dependent epigenetic remodeling of pathways regulating cell migration, extracellular matrix organization, angiogenesis and proliferation, with significantly stronger effects following treatment with 200 μg/mL than with 100 μg/mL.
2. Results
2.1. Characterization of Moringa oleifera Extract
The chemical characterization of the Moringa oleifera ethanolic extract has been previously reported by our group [12]. Since the present study focused on the epigenetic effects of the extract, only quality-control verification of batch reproducibility was performed. The chromatographic profile obtained was consistent with that previously described and is reported in Figure S1 [12].
2.2. Apoptosis
Flow cytometric analysis demonstrated that treatment with Moringa oleifera increased apoptotic cell death in PC3 cells. Consistent with previously reported functional effects, both 100 and 200 μg/mL treatments significantly increased the proportion of apoptotic cells compared with untreated controls (Figure 1).
The higher dose produced a more pronounced increase in late apoptotic cells, indicating a dose-dependent strengthening of apoptotic signaling.
These findings confirm that Moringa oleifera promotes programmed cell death in metastatic PCa cells while maintaining relatively low cytotoxicity.
2.3. Real-Time qPCR
RT-qPCR analysis revealed that Moringa oleifera significantly modulated the expression of genes involved in EMT, extracellular matrix interaction, and tumor invasiveness.
In particular, the treatment reduced the gene expression of mesenchymal markers such as vimentin, N-cadherin and fibronectin (Figure 2A–C), as well as integrins α2 and β1 (Figure 3A,B), while increasing the expression of the epithelial tight-junction protein occludin (Figure 3C). Moreover, a significant upregulation of cystatin A and cystatin B and a reduction of MMP2, MMP9 and MMP13 expression were observed, suggesting a potential inhibitory effect on extracellular matrix degradation and tumor invasion (Figure 4A–G). c-MYC expression was significantly reduced following treatment with MO extract. Specifically, both concentrations (100 and 200 µg/mL) induced a significant decrease compared with the control group (Figure 3E, ***p < 0.001). Although the reduction was more pronounced at higher concentration, no statistically significant difference was observed between the two treatments.
Finally, Moringa oleifera treatment significantly increased the BAX/BCL2 ratio, indicating activation of pro-apoptotic molecular pathways (Figure 3D).
2.4. Western Blot Analysis
Western blot analysis revealed that Moringa oleifera modulates key oncogenic signaling pathways involved in PCa progression.
Treatment reduced phosphorylation of ERK1/2 and AKT, consistent with reduced activation of the MAPK and PI3K-AKT signaling axes (Figure 5A,B). In addition, phosphorylation of NF-κB was significantly decreased, suggesting suppression of downstream pro-survival and inflammatory pathways (Figure 5C).
Regarding EMT markers, Moringa oleifera significantly reduced vimentin, N-cadherin, and fibronectin protein expression, while E-cadherin showed a non-significant increase (Figure 2E–H). Finally, Moringa oleifera also reduced ALP expression, further supporting its inhibitory effect on the osteomimetic phenotype of PC3 cells.
Together, these results indicate that the extract interferes with molecular networks controlling EMT, migration and metastatic potential.
2.6. Functional Epigenetic Remodeling Induced by Moringa oleifera in PC3 Cells
Genome-wide DNA methylation profiling revealed concentration-dependent changes in the biological pathways affected by Moringa oleifera in PC3 cells. Enrichment analyses identified distinct biological processes and signaling pathways associated with hypermethylated and hypomethylated DMRs at both concentrations. Direct comparison of the two concentrations revealed a predominance of hypermethylation at 200 μg/mL, together with a distinct pattern of pathway enrichment compared with 100 μg/mL.
2.6.1. Moringa oleifera 100 μg/mL Preferentially Affects Methylation Networks Associated with Cell Motility and Adhesion
At 100 μg/mL, genes associated with hypermethylated DMRs showed significant enrichment in GO Biological Process terms related to small GTPase-mediated signal transduction, axonogenesis and neuron-projection development, as well as cell-substrate junction organization, focal-adhesion assembly, cell polarity and protein localization to the nucleus (Figure 6A). Consistent with these findings, KEGG analysis highlighted pathways involved in axon guidance, Rap1 and MAPK signaling, focal adhesion and IgSF CAM signaling, together with aminoacyl-tRNA biosynthesis (Figure 7A). Reactome analysis extended this profile to the RHO GTPase cycle, MTOR signaling, intracellular second messenger signaling, TGF-β receptor-complex signaling, semaphorin interactions, and PIP3-mediated AKT activation (Figure S2A).
Hypomethylated DMR-associated genes showed a partly overlapping but distinct enrichment profile. GO terms included cell polarity, axonogenesis, small GTPase signaling, regulation of Wnt signaling, neuron-projection development, and cell-junction assembly (Figure 6B). KEGG pathways were mainly related to focal adhesion, regulation of the actin cytoskeleton, Wnt and relaxin signaling, axon guidance and calcium signaling (Figure 7B), while Reactome highlighted MAPK-family signaling cascades, collagen formation and biosynthesis, SUMOylation and extracellular-matrix organization (Figure S2B). Overall, the findings at 100 μg/mL indicate that methylation changes involved interconnected pathways related to cell motility, adhesion and developmental signaling, with both hyper- and hypomethylation contributing to the observed profile.
2.6.2. Moringa oleifera 200 μg/mL Induces a Distinct Methylation Profile Involving Adhesion, Developmental and Receptor-Signaling Networks
At 200 μg/mL, genes associated with hypermethylated DMRs were significantly enriched in 106 GO Biological Process terms. Representative terms included homophilic cell adhesion via plasma-membrane adhesion molecules, embryonic organ development, cell-cell adhesion, Wnt-related signaling, small GTPase-mediated signal transduction, focal-adhesion regulation, mesenchymal-cell differentiation and cell-substrate junction assembly (Figure 8A). KEGG analysis identified eight significantly enriched pathways, including parathyroid hormone synthesis, secretion and action; EGFR tyrosine-kinase-inhibitor resistance; gastric cancer; proteoglycans in cancer; sphingolipid signaling; pancreatic cancer; colorectal cancer; and focal adhesion (Figure 9A). Reactome analysis further highlighted the RAC1 and CDC42 GTPase cycles, VEGF signaling, DCC-mediated attractive signaling, the VEGFA-VEGFR2 pathway and the RHO GTPase cycle (Figure S3A).
Genes associated with hypomethylated DMRs showed a broader enrichment profile, encompassing 277 GO Biological Process terms. Representative terms were related to neuron-projection development, axonogenesis, cell adhesion, dendrite development and axon guidance (Figure 8B). KEGG analysis identified 62 significantly enriched pathways, including IgSF CAM signaling, axon guidance, the Rap1, MAPK, thyroid hormone and ErbB pathways, focal adhesion and phospholipase D signaling (Figure 9B). Reactome analysis highlighted intracellular second-messenger signaling, ERBB2 and RET pathways, extracellular matrix organization, NTRK signaling, MAPK-family cascades, the RHO pathway and collagen formation (Figure S3B). Overall, the methylation profile at 200 μg/mL involved both hyper- and hypomethylated DMRs across distinct, yet partly interconnected, biological networks governing signal transduction, cell adhesion and developmental processes.
2.6.3. Direct Comparison of 200 and 100 μg/mL Reveals Concentration-Dependent Epigenetic Remodeling
Direct comparison of the two concentrations revealed a clear predominance of hypermethylation at 200 μg/mL. GO analysis identified 250 Biological Process terms associated with relatively hypermethylated DMRs, compared with 34 terms associated with relatively hypomethylated DMRs. Representative hypermethylated terms included axonogenesis, positive regulation of cell-projection organization, small GTPase-mediated signal transduction, regulation of neurogenesis, dendrite development, developmental cell growth, synapse organization and telencephalon development (Figure 10A). Relatively hypomethylated DMRs were associated with terms including cellular response to ketones, homophilic cell adhesion, central nervous system neuron axonogenesis, mitotic cell-cycle phase transition, regulation of Wnt signaling, small GTPase signaling, neuron-projection development and regulation of cell morphogenesis (Figure 10B).
KEGG analysis identified 22 pathways associated with relatively hypermethylated DMRs at 200 μg/mL, including axon guidance, focal adhesion, IgSF CAM signaling, regulation of the actin cytoskeleton, MAPK signaling, endocytosis, ABC transporters and Hedgehog signaling (Figure 11). No significantly enriched KEGG pathways were found among relatively hypomethylated DMRs.
Reactome analysis identified 28 pathways associated with relatively hypermethylated DMRs. These included EPH-Ephrin signaling, Sema3A-PAK-dependent axon repulsion, SUMOylation, ECM proteoglycans, the RHO and RAC1 GTPase cycles, non-integrin membrane-ECM interactions, MET-PTK2 signaling and extracellular-matrix organization (Figure S4A). In contrast, seven pathways were associated with relatively hypomethylated DMRs, mainly involving RUNX3-mediated regulation of NOTCH signaling, transcriptional regulation of NOTCH3 and NOTCH4, and the RHOB and RHOC GTPase cycles (Figure S4B). Overall, the comparison between the two concentrations indicates that 200 μg/mL is associated with a predominantly hypermethylated profile, particularly across pathways involved in cell adhesion, cytoskeletal organization, directional migration and cell-fate regulation.
Figure 10.
Gene Ontology (GO) Biological Process enrichment analysis of differentially methylated regions (DMRs) in PC3 cells treated with Moringa oleifera extract (200 μg/mL) compared with cells treated with 100 μg/mL. (A) Significantly enriched GO Biological Process terms associated with hypermethylated DMRs. (B) Significantly enriched GO Biological Process terms associated with hypomethylated DMRs. Bars represent enrichment significance expressed as -log10(FDR-adjusted P value), with higher values indicating stronger statistical enrichment.
Figure 10.
Gene Ontology (GO) Biological Process enrichment analysis of differentially methylated regions (DMRs) in PC3 cells treated with Moringa oleifera extract (200 μg/mL) compared with cells treated with 100 μg/mL. (A) Significantly enriched GO Biological Process terms associated with hypermethylated DMRs. (B) Significantly enriched GO Biological Process terms associated with hypomethylated DMRs. Bars represent enrichment significance expressed as -log10(FDR-adjusted P value), with higher values indicating stronger statistical enrichment.
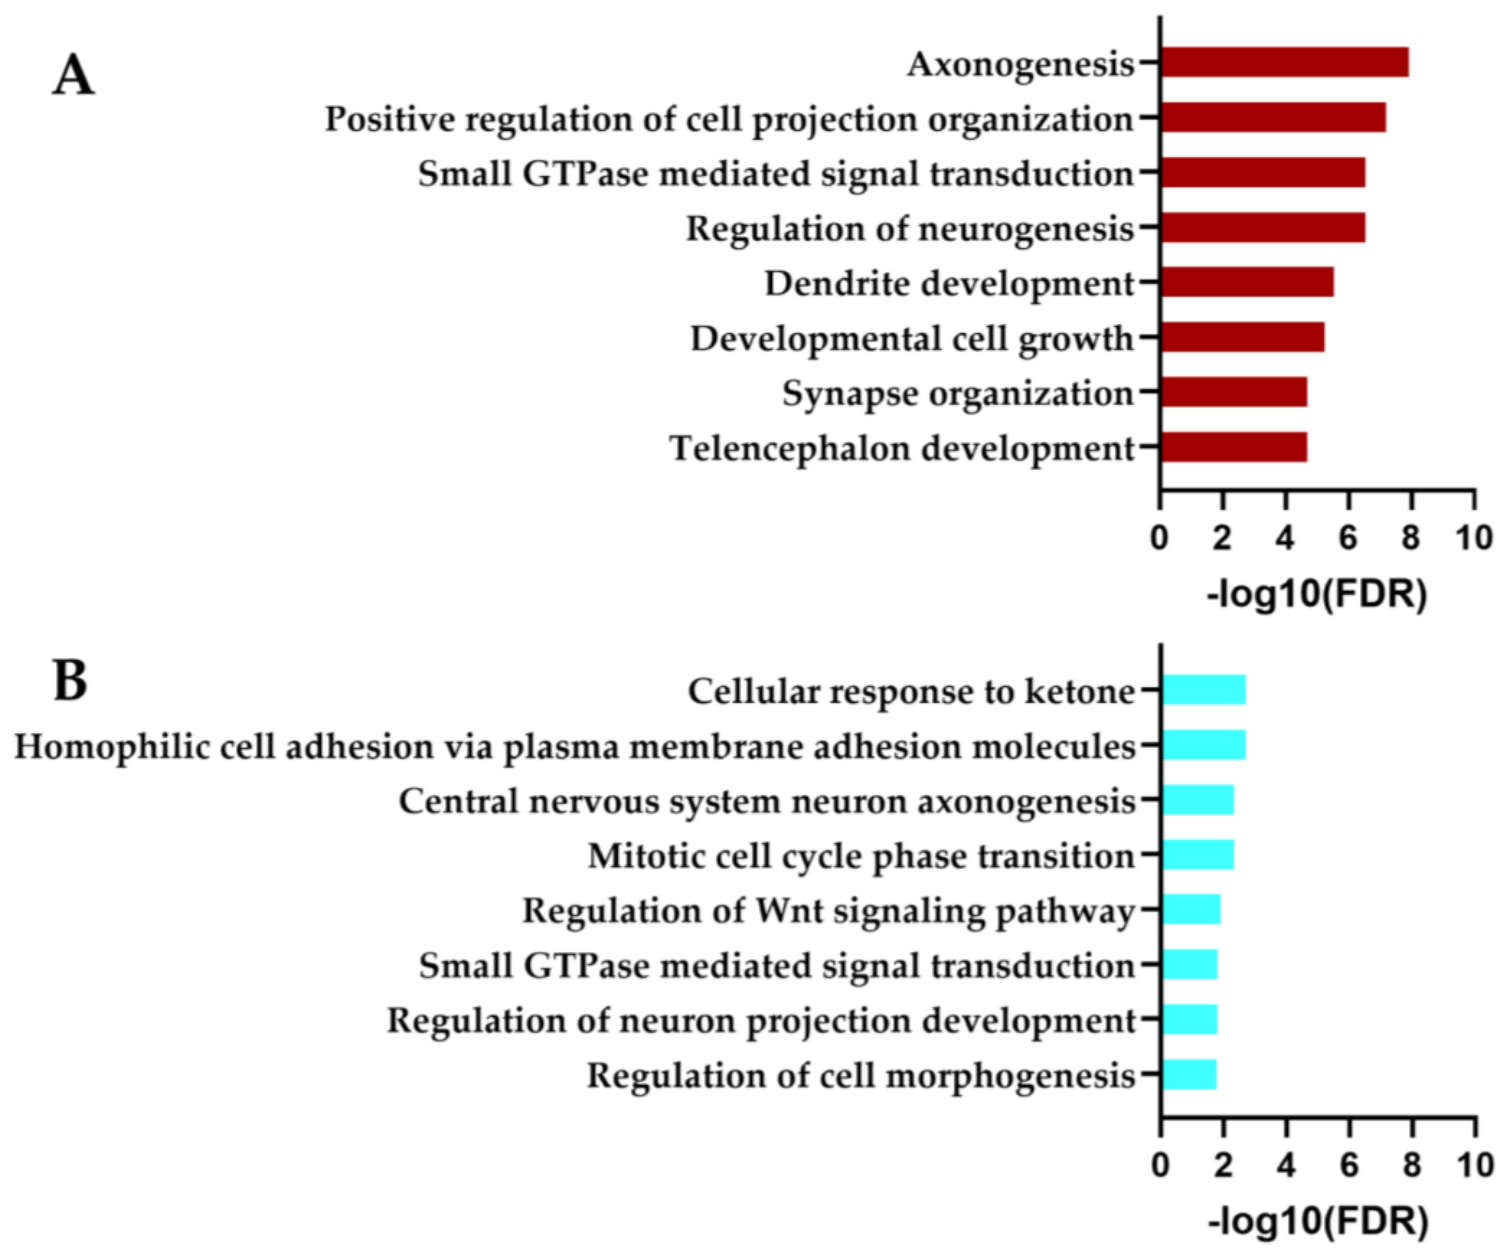
Figure 11.
Kyoto Encyclopedia of Genes and Genomes (KEGG) pathway enrichment analysis of differentially methylated regions (DMRs) in PC3 cells treated with Moringa oleifera extract (200 μg/mL) compared with cells treated with 100 μg/mL. Selected significantly enriched KEGG pathways associated with hypermethylated DMRs are shown. Bars represent enrichment significance, expressed as -log10(FDR-adjusted P value), with higher values indicating stronger statistical enrichment. No significantly enriched KEGG pathways were identified for hypomethylated DMRs.
Figure 11.
Kyoto Encyclopedia of Genes and Genomes (KEGG) pathway enrichment analysis of differentially methylated regions (DMRs) in PC3 cells treated with Moringa oleifera extract (200 μg/mL) compared with cells treated with 100 μg/mL. Selected significantly enriched KEGG pathways associated with hypermethylated DMRs are shown. Bars represent enrichment significance, expressed as -log10(FDR-adjusted P value), with higher values indicating stronger statistical enrichment. No significantly enriched KEGG pathways were identified for hypomethylated DMRs.
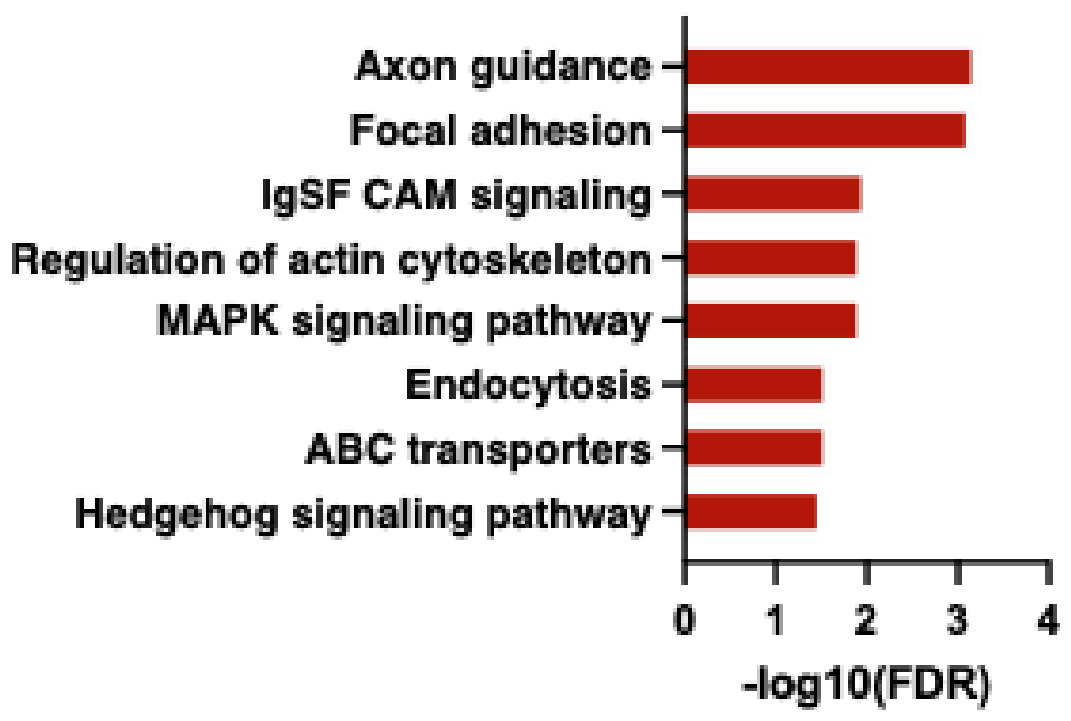
Figure 12.
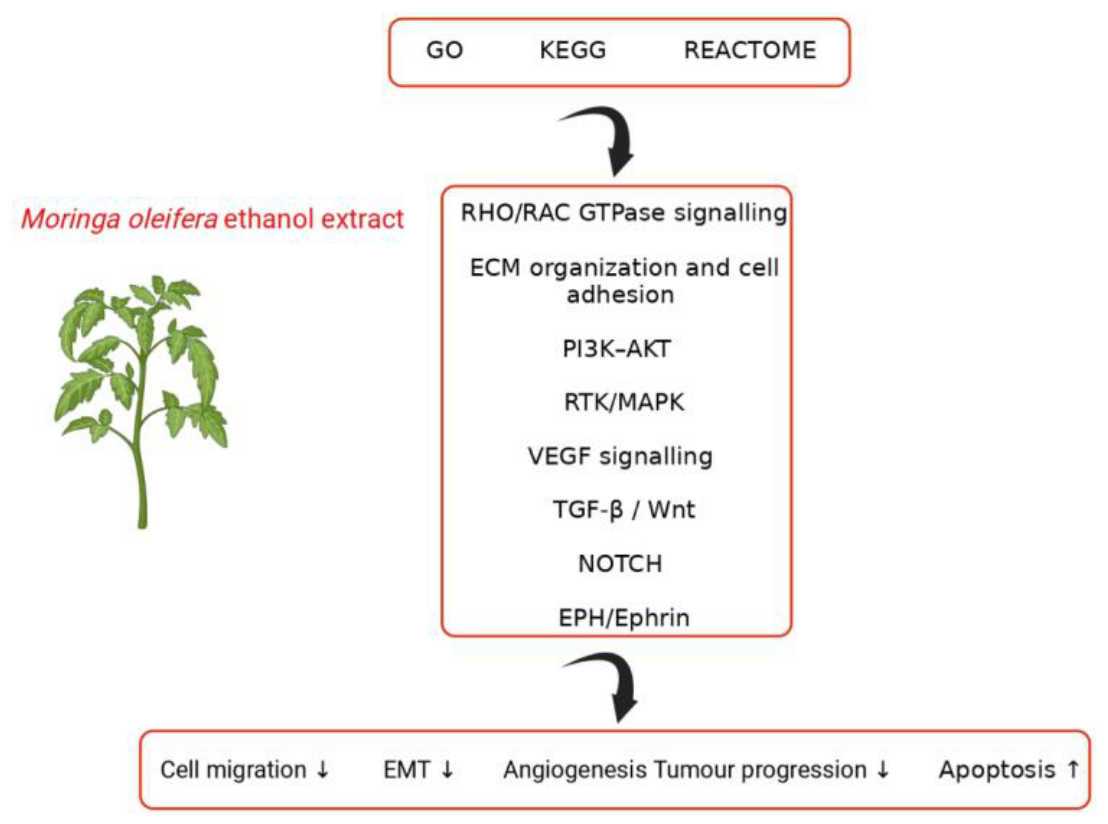
Proposed model summarizing the epigenetic and functional effects of Moringa oleifera in PC3 metastatic prostate cancer cells. Genome-wide DNA methylation analysis identified coordinated remodeling of genes associated with signaling pathways involved in cytoskeletal organization, extracellular matrix remodeling, receptor-mediated signaling, epithelial-mesenchymal transition, angiogenesis and cell survival following treatment with Moringa oleifera. Integration of GO, KEGG and Reactome enrichment analyses with functional validation supports a model in which the extract modulates interconnected oncogenic networks, consistent with the observed induction of apoptosis, inhibition of ERK1/2 and AKT signaling, attenuation of EMT, reduced extracellular matrix remodeling and impaired migratory potential. The schematic summarizes the proposed biological mechanisms underlying the anticancer activity of Moringa oleifera in PC3 cells. Created with BioRender.com.
Figure 12.
Proposed model summarizing the epigenetic and functional effects of Moringa oleifera in PC3 metastatic prostate cancer cells. Genome-wide DNA methylation analysis identified coordinated remodeling of genes associated with signaling pathways involved in cytoskeletal organization, extracellular matrix remodeling, receptor-mediated signaling, epithelial-mesenchymal transition, angiogenesis and cell survival following treatment with Moringa oleifera. Integration of GO, KEGG and Reactome enrichment analyses with functional validation supports a model in which the extract modulates interconnected oncogenic networks, consistent with the observed induction of apoptosis, inhibition of ERK1/2 and AKT signaling, attenuation of EMT, reduced extracellular matrix remodeling and impaired migratory potential. The schematic summarizes the proposed biological mechanisms underlying the anticancer activity of Moringa oleifera in PC3 cells. Created with BioRender.com.
2.6.4. Integrated GO-KEGG-Reactome Interpretation
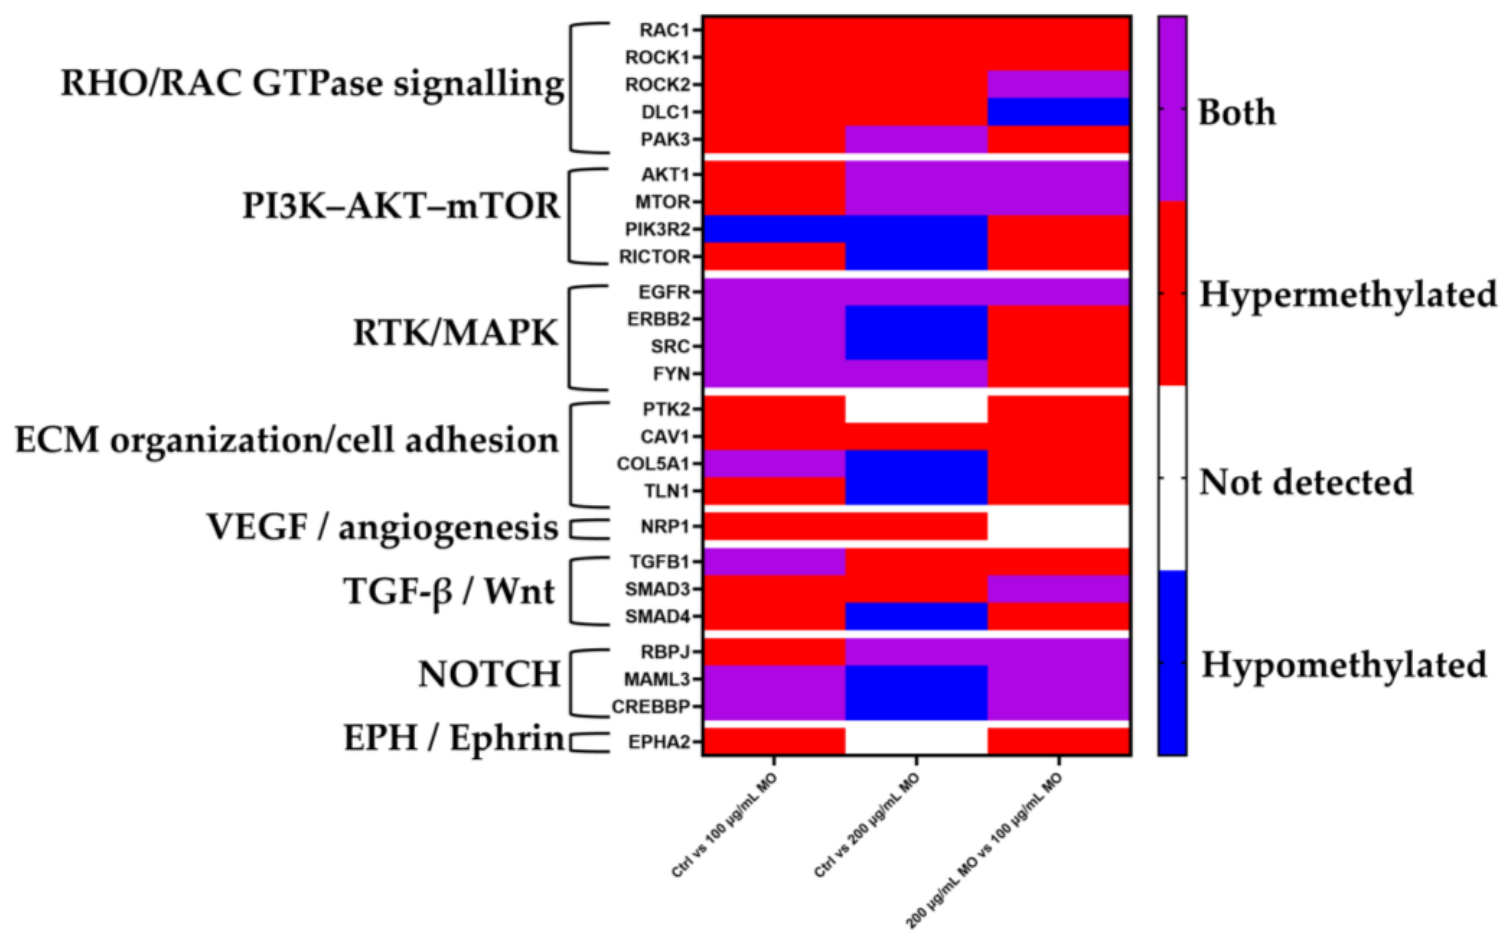
Combining the GO, KEGG and Reactome enrichment results identified 86 candidate genes involved in several functional pathways, including RHO/RAC, PI3K-AKT-MTOR, receptor tyrosine kinase/MAPK, TGF-β/Wnt, NOTCH and EPH-Ephrin signaling, as well as extracellular matrix organization, cell adhesion and angiogenesis. Of these, 25 hub genes were selected and included in the directional heat map shown in Figure 13. The categories hypermethylated, hypomethylated, both and not detected indicate how each gene was represented within the enriched DMR-associated gene sets. These categories describe methylation patterns and should not be considered as direct evidence of changes in gene expression. The full list of 86 candidate genes, with their annotations from the three databases, is reported in Table S1.
3. Discussion
This study is a follow-up to our previous work on PC3 cells, utilized as a model for PCa, treated with Moringa oleifera extract, in which we demonstrated that Moringa oleifera is able to modulate IGF1R-related signaling and to influence cellular programs potentially implicated in PCa [12]. To our knowledge, this is the first study to characterize concentration-dependent, genome-wide DNA methylation remodeling induced by a chemically characterized Moringa oleifera extract in PC3 PCa cells. Genome-wide profiling revealed widespread methylation changes in genes associated with cytoskeletal organization, extracellular matrix interactions, receptor-mediated signaling, angiogenesis, EMT, and metastatic behaviour. The present results strengthen and extend the previously reported cytotoxic, pro-apoptotic and anti-migratory effects of Moringa oleifera, suggesting that its biological activity also involves extensive epigenetic remodeling. These observations are particularly relevant in PCa, in which aberrant DNA methylation, histone modifications and chromatin-remodeling mechanisms contribute to tumour initiation, disease progression, lineage plasticity and treatment resistance [14,15,16,17,18,19,20,21,22].
PC3 cells represent an androgen-independent and highly aggressive experimental model with phenotypic and molecular characteristics resembling prostatic small-cell or neuroendocrine carcinoma [3,23]. Their lack of androgen-receptor and prostate-specific-antigen expression, together with high proliferative and metastatic capacity, makes them particularly suitable for investigating androgen-independent signaling networks and epigenetic mechanisms associated with advanced disease [4]. In this context, the concentration-dependent modulation of pathways related to migration, cytoskeletal dynamics, angiogenesis, and cell plasticity suggests that Moringa oleifera affects biological programmes central to the aggressive PC3 phenotype.
At 100 μg/mL, genes associated with hypermethylated DMRs were enriched in small GTPase signaling, focal adhesion, cytoskeletal organization, cell polarity, and axon-guidance-related processes. Rho-family GTPases and their downstream effectors coordinate actin polymerization, cell polarity, adhesion turnover and directional migration. Epigenetic remodeling of genes associated with these networks may therefore contribute to the reduction in motility and invasiveness observed following treatment [24]. The enrichment of axon-guidance-related pathways is also biologically relevant because EPH-Ephrin, semaphorin and related guidance systems are increasingly recognized as regulators of tumour-cell migration, tissue invasion and interactions with the surrounding microenvironment [25,26]. However, enrichment analysis identifies pathways containing DMR-associated genes rather than directly measuring pathway activity. These findings should therefore be interpreted as evidence of targeted epigenetic remodeling and not as proof of uniform transcriptional repression.
The hypomethylation profile detected at 100 μg/mL partially overlapped with the hypermethylation profile and included focal adhesion, actin-cytoskeleton regulation, Wnt signalling, axonogenesis, MAPK-family cascades and extracellular matrix organization. This bidirectional representation is not necessarily contradictory because a biological pathway comprises multiple genes, regulatory elements, and genomic regions that may undergo methylation changes in opposite directions. Moreover, promoter, enhancer, gene-body, and intergenic methylation may have different or context-dependent relationships with gene expression. The results therefore indicate coordinated, locus-specific remodeling of motility, adhesion, and developmental networks rather than uniform activation or inhibition of entire pathways.
At 200 μg/mL, the hypermethylated DMR-associated genes showed a distinct enrichment profile involving cell-cell and cell-substrate adhesion, Wnt-related processes, small GTPase signaling, and focal-adhesion regulation. KEGG enrichment included cancer-associated pathways, EGFR tyrosine-kinase-inhibitor resistance, proteoglycans in cancer, sphingolipid signaling and focal adhesion. Reactome analysis further identified RAC1 and CDC42 GTPase cycles and VEGF/VEGFR2-mediated signaling. These pathways are biologically connected to cytoskeletal dynamics, cell-matrix interactions, angiogenesis, and metastatic competence. RAC1 and CDC42 regulate cell polarity and directional movement, whereas VEGF/VEGFR2 signaling contributes to tumor-associated angiogenesis and interactions with the vascular microenvironment. Thus, although the higher concentration did not simply expand every pathway detected at 100 μg/mL, it produced a distinct remodeling profile involving several interconnected regulators of aggressive tumor behaviour.
The hypomethylated DMR-associated genes detected at 200 μg/mL were also distributed across signaling, structural and developmental networks, including Rap1, MAPK, ErbB, Hippo, VEGF, RET and NTRK signaling, focal adhesion and extracellular matrix organization. Several of these pathways have established roles in prostate cancer progression and cellular plasticity [4,20,27,28]. Consequently, it would be inappropriate to classify the hypomethylated component as exclusively non-oncogenic or biologically neutral. Without parallel transcriptomic analysis and locus-specific validation, the functional consequences of these methylation changes cannot be established. A more conservative interpretation is that Moringa oleifera induces a complex and context-dependent redistribution of DNA methylation across interconnected signaling networks.
Direct comparison between the two concentrations highlighted the concentration-dependent nature of the methylation response. The higher concentration was associated with a marked predominance of hypermethylated GO terms and with 22 hypermethylated KEGG pathways, whereas there was not significantly enriched hypomethylated KEGG pathway. The affected networks included axon guidance, focal adhesion, IgSF CAM signaling, actin-cytoskeleton regulation, MAPK signaling, endocytosis, ABC transporters, and Hedgehog signaling. Reactome analysis similarly identified hypermethylation-associated enrichment of EPH–Ephrin signaling, semaphorin-dependent axon repulsion, RHO/RAC1 GTPase cycles, ECM interactions and MET–PTK2 signaling. These findings suggest that increasing the concentration does not merely increase the number of isolated DMRs, but preferentially reshapes networks controlling adhesion, directional migration, and cell-microenvironment interactions.
In contrast, the seven hypomethylated Reactome pathways detected in the direct comparison were mainly related to RUNX3-mediated NOTCH regulation, NOTCH3 and NOTCH4 transcriptional activity, and the RHOB and RHOC GTPase cycles. NOTCH signaling exerts context-dependent effects in PCa and has been associated with tumour-cell plasticity, invasion and disease progression [29,30]. Similarly, individual RHO-family members can have distinct or even opposing functions depending on the cellular context. These findings therefore identify a restricted but biologically relevant hypomethylation component at a higher concentration. Importantly, not significantly enriched hypomethylated KEGG pathway was identified, whereas the Reactome analysis detected this small group of NOTCH- and RHO-related pathways. This difference likely reflects the distinct pathway structures, annotation depth, and gene-set composition of the databases.
The integrated GO, KEGG and Reactome analysis identified 86 candidate genes distributed across major functional modules, from which 25 hub genes were selected for the directional heat map. The occurrence of several genes in both hypermethylated and hypomethylated enriched gene sets further supports a model of context-dependent epigenetic regulation. Nevertheless, the classification shown in Figure 13 reflects the direction in which each gene occurred among the enriched DMR-associated gene sets and does not demonstrate a corresponding increase or decrease in gene expression. Integration with transcriptomic data and locus-specific methylation validation will be required to determine the functional consequences of these changes.
The methylome results are supported by the functional and molecular findings obtained in the same experimental model. Treatment with Moringa oleifera increased apoptotic cell death and reduced signaling through ERK1/2 and AKT, two major effectors of the MAPK and PI3K-AKT pathways. These cascades promote survival, proliferation, metabolic adaptation, and treatment of resistance in advanced prostate cancer. Previous independent studies have similarly shown that Moringa oleifera extracts or isolated fractions inhibit PC3-cell proliferation, induce cell-cycle arrest and apoptosis, and interfere with AKT-dependent signaling [11,31]. The reduction in NF-κB signaling further supports the capacity of the extract to interfere with pro-survival and inflammatory mechanisms. NF-κB interacts functionally with PI3K-AKT, MAPK, and cytokine pathways and can contribute to apoptosis resistance, tumor-associated inflammation, and metastatic progression [12]. Although the present study cannot establish whether NF-κB inhibition was directly mediated by methylation changes, the concordance between pathway enrichment and protein-level responses suggests that epigenetic and signaling effects may converge on related biological programmes.
Gene-expression analyses provided additional functional support. Moringa oleifera reduced the expression of mesenchymal and invasion-associated markers, including vimentin, N-cadherin, fibronectin, integrins and matrix metalloproteinases, while increasing epithelial or anti-invasive factors such as occludin and cystatins. The reduction in ALP expression was consistent with our previous observations [12] and supports the ability of Moringa oleifera to attenuate osteomimetic features associated with the aggressive phenotype of PC3 cells. Collectively, these changes indicate attenuation of EMT, extracellular matrix degradation, cell-matrix interactions, and metastatic potential. The methylation remodeling of small GTPase, focal-adhesion, cytoskeletal, MAPK, and growth-factor-signaling networks is biologically coherent with these functional effects. Nevertheless, direct correspondence between individual DMRs and expression of their associated genes remains to be established.
Our previously published study performed at 100 μg/mL demonstrated for the first time that Moringa oleifera interferes with the IGF-1/IGF1R axis, reduces ERK and AKT activation, and promotes apoptosis in PC3 cells [12]. The present findings extend those observations by showing that the extract also remodels DNA methylation across multiple biological networks. Together, the results support a concentration-dependent model in which modulation of signaling and functional responses is accompanied by increasingly distinct epigenetic changes affecting interconnected regulatory systems.
Previous findings by other authors showed that Moringa-derived compounds affect DNA methylation and gene expression in multiple cell lines, underscoring their impact on epigenomic regulation [32,33].
The mechanisms underlying these methylation changes are likely to involve multiple processes. Plant-derived bioactive compounds can influence DNA methylation, histone modifications and non-coding RNA regulation through effects on DNA methyltransferases, TET dioxygenases, histone acetyltransferases, and histone deacetylases [34,35,36]. This interpretation is particularly appropriate for Moringa oleifera, which contains a chemically heterogeneous mixture of glucosinolates, isothiocyanates, flavonoids, phenolic acids, alkaloids, and fatty acids [37,38]. Quercetin, kaempferol, and related flavonoids have been reported to modulate DNMTs, HDACs, histone marks, and regulatory non-coding RNAs in several experimental cancer models [10,11,39,40]. Isothiocyanates can similarly affect chromatin-regulatory enzymes and cancer-associated transcriptional programmes [41]. Therefore, the methylome-wide response observed here is more plausibly explained by the combined action of several constituents than by a single predominant compound.
Several limitations should be considered. First, the study was performed using a single cell line. PC3 cells are a valuable model of aggressive androgen-independent disease, but they do not reproduce the biological heterogeneity of PCa. Confirmation in additional models, including DU145 cells, androgen-responsive cells, patient-derived organoids, andi n vivo systems, will be required. Second, DMR-associated pathway enrichment does not establish direct transcriptional activation or repression. Further studies combining RNA sequencing, chromatin-accessibility, and histone-mark analyses with locus-specific methylation validation will help clarify the functional consequences of these methylation changes. Third, the extract is a complex phytochemical preparation, and its batch composition, bioavailability, and achievable in vivo concentrations remain to be established. Finally, the present findings demonstrate preclinical biological activity but do not by themselves support therapeutic use in patients.
4. Materials and Methods
4.1. Reagents
All reagents used, unless otherwise specified, were purchased from the following companies: Sigma-Aldrich Co. (St. Louis, MO, USA), GIBCO-ThermoFisher (Rome, Italy), Sial (Rome, Italy), Corning (New York, USA), and Chemicon International (Temecula, California, USA).
4.2. Preparation of Moringa oleifera Extract
The preparation of the Moringa oleifera extract was performed as previously described in our earlier study [12]. Briefly, dried leaf powder was extracted by maceration in 70% ethanol under continuous agitation at room temperature, followed by centrifugation, filtration and solvent evaporation. The dried residue was weighed and reconstituted to obtain a stock solution, which was diluted in culture medium to reach the desired experimental concentrations.
4.3. GC-MS Analysis
Chemical characterization of the extract was performed by GC-MS analysis as previously described [12]. The extract was derivatized with MSTFA and analyzed using an Agilent gas chromatography-mass spectrometry system. Compounds were identified by comparison with the NIST spectral library.
4.4. PC3 Cell Line and Culture Conditions
PC3 human prostate adenocarcinoma cells (ATCC; purchased from Experimental Zo-oprophylactic Institute of Lombardia and Emilia-Romagna, Brescia, Italy) were cultured in F-12K Nut Mix medium supplemented with 10% fetal bovine serum (FBS) and penicillin/streptomycin (1X). Cells were maintained at 37 °C with 5% CO2. Morphological changes following treatments were monitored using an inverted optical microscope.
4.5. Experimental Design
The concentrations selected for the present study were based on our previously published dose-response analysis in PC3 cells [12]. In that study, Moringa oleifera extract produced only moderate reductions in cell viability across the concentration range of 50-300 μg/mL, while preserving substantial cellular viability and biological responsiveness. These findings identified 100 and 200 μg/mL as biologically active, non-cytotoxic concentrations suitable for investigating molecular and epigenetic effects.
For functional, molecular, and genome-wide DNA methylation analyses, PC3 cells were seeded at a density of 3 × 10⁵ cells/well in 6-well plates and allowed to attach for 48-72 h. Untreated PC3 cells served as controls, whereas treated cells were exposed to Moringa oleifera extract (100 or 200 μg/mL) for an additional 24 h. Following treatment, total RNA and protein extracts were prepared as previously described [12]. In parallel, genomic DNA was isolated and subjected to genome-wide DNA methylation profiling using the Infinium MethylationEPIC v2.0 BeadChip platform (Illumina), enabling the assessment of dose-dependent epigenetic modifications across the genome.
4.6. Apoptosis Assay
Apoptosis was evaluated by flow cytometry using Annexin V-FITC/propidium iodide staining, as previously described [42]. This method allows discrimination between viable, early apoptotic, late apoptotic and necrotic cells.
4.7. Real-Time Quantitative PCR (RT-qPCR)
Gene expression analysis was performed by RT-qPCR as previously described [43]. Total RNA was extracted, reverse-transcribed into cDNA, and amplified using gene-specific primers. Relative expression levels were calculated using the ΔΔCt method with β-actin as housekeeping gene.
| mRNA | Sequences (5′–3′) | Product (bp) | GenBank Accession no. |
| ALP | Fw: CCGTGGCAACTCTATCTTTGG Rv: GCCATACAGGATGGCAGTGA |
79 | NM_00478.6 |
| c-MYC | Fw: GGCGAACACACAACGTCTTGGAG Rv: GCTCAGGACATTTCTGTTAGAAG |
298 | NM_002467.6 |
| Cathepsin B | Fw: CTACAGCGTCTCCAATAG Rv: GAAGTCCGAATACACAGA |
91 | L_16510.1 |
| Cystatin A | Fw: AAGGGGACCTACATGTTCTGG Rv: ATAGGGCAGGGCTAAAAAGG |
150 | NM_005213.4 |
| Cystatin B | Fw: GGGACAAACTACTTCATCAA Rv: GAGGGAGAGATTGGAACA |
76 | NM_000100.4 |
| Fibronectin | Fw: CGAGGAGAGTGGAAGTGTGAGAG Rv: GGGTGAGGCTGCGGTTGG |
108 | NM_212482.1 |
| Integrin a2 | Fw: GTAGTTGACAACACAAAACAAACAA Rv: AAATAAAATTTTGTTGGAATGAAGC |
150 | NM_002203.3 |
| Integrin b1 | Fw: TGCCGGGTTTCACTTTGC; Rv: GTGACATTGTCCATCATTTGGTAAA |
70 | NM_033668.1 |
| MMP2 | Fw: TGACGGTAAGGACGGACTC Rv: ATACTTCACACGGACCACTTG |
124 | NM_004530.2 |
| MMP9 | Fw: GGAGACCTGAGAACCAATC; Rv: CCGAGTGTAACCATAGCG | 72 | NM_004994.3 |
| MMP13 | Fw: TTCCCAGTGGTGGTGATGAA Rv: CATGGAGCTTGCTGCATTCT |
128 | NM_002427.2 |
| N-Cadherin | Fw: CATCATCATCCTGCTTATCCTTGT Rv: TTCTCCTCCACCTTCTTCATCA |
148 | M_34064.1 |
| Occludin | Fw: GCACCAAGCAATGACATA Rv: CAATAATGAGCATAGACAGGAT |
154 | U_49184.1 |
| Vimentin | Fw: GCTAACTACCAAGACACTATT Rv: TAGGTGGCAATCTCAATG |
134 | NM_003380.5 |
| b-actin | Fw: ACCTTCTACAATGAGCTGCG Rv: TCCATCACGATGCCAGTGGTA |
197 | NM_001101.3 |
4.8. Western Blot Analysis
Protein expression and phosphorylation levels were analyzed by Western blotting as previously reported [12,44]. Briefly, total cellular proteins were extracted, separated by SDS-PAGE and transferred onto nitrocellulose membranes. Membranes were incubated with specific primary antibodies followed by HRP-conjugated secondary antibodies, and immunoreactive bands were visualized using a chemiluminescence detection system. Immunoreactive bands were visualized using the Chemi-Doc™ XRS+ imaging system with Image Lab™ software (Bio-Rad).
4.9. MICROARRAY
DNA concentration in each sample was assayed with a Qubit fluorimeter Qubit Fluorometer 4.0 (Invitrogen Co., Carlsbad, CA), Nanodrop One (Thermo Fisher) and its quality assessed with the TapeStation 4200 (Agilent Technologies). Bisulfite converted DNA (250 ng) was used for analysis of whole-genome methylation using the Infinium MethylationEPIC v2.0 kit (Illumina, San Diego, CA, USA), which contains ~930K unique methylation sites in the most biologically significant regions of the human methylome. In brief, bisulfite converted DNA was whole-genome amplified for 20 h followed by end-point fragmentation. Fragmented DNA was precipitated, denatured and hybridised to the BeadChips for 20 h at 48 °C. The BeadChips were washed and the hybridised primers were extended and labelled before scanning the BeadChips using the Illumina iScan system. Following data generation, raw intensity files (.idat) were imported into the R statistical environment for processing. All subsequent steps, including rigorous quality control, exploratory data analysis, functional normalization and differential methylation testing, were conducted using the Bioconductor package minfi (version 1.54.1) [45]. The quality of the DNA methylation data was evaluated by calculating detection p-values for each CpG site across all samples. These values represent the confidence of the signal relative to background noise; sites with p-value less than 0.05 were considered reliable. To assess overall sample performance, the mean detection p-value per sample was calculated, where higher average values indicate a greater proportion of failed probes. To minimize technical variation within and between samples, the data were normalized using the functional normalization approach (with the “preprocessFunnorm” function). This method adjusts for both methylated and unmethylated signal intensities. Following normalization, the data were stored as a GenomicRatioSet object containing M-values (the log2 ratio of methylated to unmethylated intensities) for statistical analysis and Beta values for biological interpretation and visualization. To ensure high-quality downstream analysis and minimize the computational burden associated with multiple testing, a stringent filtering pipeline was applied to the probe set. Probes were excluded if they failed to meet the detection p-value threshold of 0.01 in one or more samples, ensuring that only reliable signals were retained. Furthermore, to prevent potential confounding effects from genetic variation, probes containing common single nucleotide polymorphisms (SNPs) at the CpG site or the single base extension site were removed. This filtering step ensures that observed methylation differences are representative of epigenetic modifications rather than underlying genetic polymorphisms. Differential methylation at individual CpG sites (Differentially Methylated Positions, DMPs) was assessed using linear models via the limma package (version 3.64.3) [46]. To identify coordinated methylation changes across neighboring CpG sites, a Differentially Methylated Region (DMR) analysis was performed using the DMRcate package (version 3.4.1) [47]. The analysis was executed on an M-value matrix annotated with the EPICv2anno.20a1.hg38 (version 1.0.0) [48] reference database. This approach enables the identification of functionally relevant genomic regions rather than isolated, independent sites, providing a more comprehensive overview of the epigenetic landscape. Over-representation analysis (ORA) was conducted to identify biological processes and pathways enriched among the genes associated with the identified DMRs. The analysis was performed using the R packages clusterProfiler (version 4.10.1) [49] and ReactomePA (version 1.54.0) [50]. Genes were mapped to Gene Ontology (GO) terms, KEGG pathways, and Reactome pathways. Statistical significance for enrichment was defined as an FDRadjusted p-value less than 0.05. Differential methylation analysis Differentially methylated positions (DMPs) between Moringa-treated and control PC3 cells were identified using linear models (limma). Separate contrasts were fitted for 100 μg/mL vs control, 200 μg/mL vs control, and 200 μg/mL vs 100 μg/mL. P-values were adjusted for multiple testing using the Benjamini–Hochberg method. CpGs with adjusted p < 0.05 were considered significant. Hypermethylated and hypomethylated CpGs were defined based on the direction of β-value changes. Gene-level annotations were obtained by mapping CpGs to the nearest gene or promoter region.
Enrichment results were further processed and compared using Python 3.11, while graphical representations were generated using GraphPad Prism version 10.6.0.
4.10. Integrated Hub Gene Analysis
To provide an integrated overview of the biological pathways affected by Moringa oleifera, genes associated with significantly enriched GO Biological Process terms, KEGG pathways and Reactome pathways (FDR-adjusted P < 0.05) were combined for each comparison (Ctrl vs 100 μg/mL MO, Ctrl vs 200 μg/mL MO and 200 μg/mL MO vs 100 μg/mL MO). Representative hub genes were then selected based on their recurrence across enriched functional categories and their relevance to prostate cancer progression. For each comparison, genes were classified according to the methylation direction of the enriched pathways in which they occurred. Genes found exclusively in hypermethylated pathways were classified as Hypermethylated, those found exclusively in hypomethylated pathways as Hypomethylated, and those occurring in both as Both. Genes absent from the integrated enrichment analysis for a given comparison were classified as Not detected. These categories were used to generate the directional heat map shown in Figure 13, while the complete list of integrated hub genes is provided in Table S1.
4.11. Statistical Analysis
RT-qPCR and Western Blotting data are presented as mean ± standard deviation (SD) from at least three independent biological experiments. Statistical analyses were performed using one-way or two-way analysis of variance (ANOVA), as appropriate, followed by Dunnett’s post hoc test for comparisons versus the corresponding unexposed control PC3 cells (Ctrl).
ANOVA was selected as a robust parametric method commonly applied in in vitro experimental studies based on independent biological replicates. Given the experimental design and sample size, normal distribution was assumed according to standard practice in cell-based assays.
Statistical analyses were conducted using GraphPad Prism (Dotmatics). Levels of significance are indicated as follows: *P < 0.05, **P < 0.01 and ***P < 0.001 vs. Ctrl.
Generative artificial intelligence (ChatGPT, OpenAI) was used during manuscript preparation to assist with language refinement, organization and clarity of the text, and with the presentation of the study findings. All experimental data, bioinformatic analyses and scientific conclusions were generated and critically evaluated by the Authors. All AI-assisted text was reviewed, verified and revised by the Authors, who take full responsibility for the final content of the manuscript.
5. Conclusions
Overall, this study shows that Moringa oleifera induces concentration-dependent changes in DNA methylation across multiple biological pathways in PC3 PCa cells. At 100 μg/mL, these changes mainly involved genes related to small GTPase signaling, focal adhesion, cytoskeletal organization and axon guidance. At 200 μg/mL, the methylation profile shifted towards pathways involving cell adhesion, Wnt signaling, RAC1/CDC42 activity and VEGF/VEGFR2-mediated angiogenesis. Direct comparison of the two concentrations showed a predominance of hypermethylation at 200 μg/mL, particularly in pathways related to focal adhesion, cytoskeletal dynamics, MAPK and EPH-Ephrin signaling, while hypomethylation was more limited and mainly involved NOTCH and RHOB/RHOC signaling.
These methylation changes occurred alongside increased apoptosis, reduced ERK/AKT and NF-κB signaling, attenuation of EMT and decreased expression of molecules associated with tumour invasion. Taken together, our findings suggest that Moringa oleifera acts as a multi-target epigenetic modulator, affecting DNA methylation across interconnected signaling networks relevant to the aggressive phenotype of PC3 cells. Further studies integrating transcriptomic and other molecular approaches, together with in vivo models, will be needed to determine the functional consequences of these methylation changes, identify the bioactive compounds involved and assess their potential translational relevance.
Supplementary Materials
The following supporting information can be downloaded at the website of this paper posted on Preprints.org, Figure S1: Chromatogram of Moringa oleifera solution; Figure S2: Reactome pathway enrichment analysis of differentially methylated regions (DMRs) in PC3 cells treated with Moringa oleifera extract (100 μg/mL) compared with untreated control cells; Figure S3: Reactome pathway enrichment analysis of differentially methylated regions (DMRs) in PC3 cells treated with Moringa oleifera extract (200 μg/mL) compared with untreated control cells; Figure S4: Reactome pathway enrichment analysis of differentially methylated regions (DMRs) in PC3 cells treated with Moringa oleifera extract at 200 μg/mL compared with 100 μg/mL; Table S1: Complete list of the 86 candidate genes identified by integration of GO, KEGG and Reactome enrichment analyses following Moringa oleifera treatment of PC3 cells.
Author Contributions
Conceptualization, F.M. and T.B.; methodology, F.M.; investigation, C.L., C.B., V.C., A.S., C.G., L.P., and M.C.; cell cultures and functional assays (Western blot), C.L., L.P., and M.C.; RT-PCR analysis, C.B.; flow cytometry analysis, A.S.; gas chromatography–mass spectrometry analysis and data interpretation, C.G.; software and data analysis, C.L., C.B., A.S., L.P., and M.C.; formal analysis, F.M. and T.B.; data curation, F.M.; visualization and final figures, F.M.; resources, C.A. and T.B.; writing original draft preparation, F.M. and T.B.; writing review and editing, F.M., C.A., and T.B.; supervision, F.M. and T.B.; project administration, F.M. and T.B.; funding acquisition, C.A,. and T.B.
Funding
This research received no external funding.
Institutional Review Board Statement
Not applicable.
Informed Consent Statement
Not applicable.
Data Availability Statement
The original contributions presented in this study are included in the article and Supplementary Materials. The raw data supporting the conclusions of this article will be made available by the Authors on request.
Conflicts of Interest
The authors declare no conflicts of interest.
Abbreviations
| AKT- Protein kinase B ALP- Alkaline phosphatase ANOVA- Analysis of variance APC- Adenomatous polyposis coli CCND2- Cyclin D2 CDH1- Cadherin 1 (E-cadherin) CpG- Cytosine-phosphate-guanine CRPC- Castration-resistant prostate cancer DMR- Differentially methylated region DMP- Differentially methylated position DNA- Deoxyribonucleic acid ECM- Extracellular matrix EMT- Epithelial-mesenchymal transition ERK- Extracellular signal-regulated kinase FBS- Fetal bovine serum FDR- False discovery rate GC-MS-Gas chromatography-mass spectrometry GO-Gene Ontology GPCR- G protein-coupled receptor GSTP1- Glutathione S-transferase Pi 1 HRP-Horseradish peroxidase IGF-1- Insulin-like growth factor 1 IGF1R- Insulin-like growth factor 1 receptor KEGG- Kyoto Encyclopedia of Genes and Genomes MAPK- Mitogen-activated protein kinase MMP- Matrix metalloproteinase MO- Moringa oleifera MSTFA- N-Methyl-N-(trimethylsilyl)trifluoroacetamide c-MYC - MYC proto-oncogene, bHLH transcription factor NF-κB - Nuclear factor kappa B NOTCH3 -Neurogenic locus notch homolog protein 3 NOTCH4 -Neurogenic locus notch homolog protein 4 ORA - Over-representation analysis PC3 - Human prostate cancer cell line PCa -Prostate cancer PI3K - Phosphoinositide 3-kinase PITX2 - Paired-like homeodomain transcription factor 2 RARB - Retinoic acid receptor beta RASSF1A - Ras association domain family member 1 isoform A RT-qPCR - Reverse transcription quantitative polymerase chain reaction RUNX3 - Runt-related transcription factor 3 SD - Standard deviation SDS-PAGE - Sodium dodecyl sulfate-polyacrylamide gel electrophoresis TGF-β - Transforming growth factor beta VEGF - Vascular endothelial growth factor VEGFR2 - Vascular endothelial growth factor receptor 2 |
References
- Bray, F.; Laversanne, M.; Sung, H.; Ferlay, J.; Siegel, R.L.; Soerjomataram, I.; Jemal, A. Global cancer statistics 2022: GLOBOCAN estimates of incidence and mortality worldwide for 36 cancers in 185 countries. CA Cancer J. Clin. 2024, 74(3), 229–263. [Google Scholar] [CrossRef] [PubMed]
- Kaighn, M.E.; Narayan, K.S.; Ohnuki, Y.; Lechner, J.F.; Jones, L.W. Establishment and characterization of a human prostatic carcinoma cell line (PC-3). Invest Urol. 1979, 17(1), 16–23. Available online: https://pubmed.ncbi.nlm.nih.gov/447482/. [PubMed]
- Tai, S.; Sun, Y.; Squires, J.M.; Zhang, H.; Oh, W.K.; Liang, C.Z.; Huang, J. PC3 is a cell line characteristic of prostatic small cell carcinoma. Prostate 2011, 71(15), 1668–1679. [Google Scholar] [CrossRef] [PubMed]
- Cham, J.; Venkateswaran, A.R.; Bhangoo, M. Targeting the PI3K–AKT–mTOR pathway in castration-resistant prostate cancer: a review article. Clin. Genitourin. Cancer 2021, 19(6), 563.e1–563.e7. [Google Scholar] [CrossRef] [PubMed]
- Kohno, M.; Pouysségur, J. Targeting the ERK signaling pathway in cancer therapy. Ann. Med. 2006, 38(3), 200–211. [Google Scholar] [CrossRef] [PubMed]
- Lamouille, S.; Xu, J.; Derynck, R. Molecular mechanisms of epithelial–mesenchymal transition. Nat. Rev. Mol. Cell Biol. 2014, 15(3), 178–196. [Google Scholar] [CrossRef] [PubMed]
- Clézardin, P.; Coleman, R.; Puppo, M.; Ottewell, P.; Bonnelye, E.; Paycha, F.; Confavreux, C.B.; Holen, I. Bone metastasis: mechanisms, therapies, and biomarkers. Physiol. Rev. 2021, 101(3), 797–855. [Google Scholar] [CrossRef] [PubMed]
- Gopalakrishnan, L.; Doriya, K.; Kumar, D.S. Moringa oleifera: a review on nutritive importance and its medicinal application. Food Sci. Hum. Wellness 2016, 5(2), 49–56. [Google Scholar] [CrossRef]
- Vergara-Jimenez, M.; Almatrafi, M.M.; Fernandez, M.L. Bioactive components in Moringa oleifera leaves protect against chronic disease. Antioxidants 2017, 6(4), 91. [Google Scholar] [CrossRef] [PubMed]
- Al-Asmari, A.K.; Albalawi, S.M.; Athar, M.T.; Khan, A.Q.; Al-Shahrani, H.; Islam, M. Moringa oleifera as an anti-cancer agent against breast and colorectal cancer cell lines. PLoS ONE 2015, 10(8), e0135814. [Google Scholar] [CrossRef] [PubMed]
- Xie, J.; Luo, F.X.; Shi, C.Y.; Jiang, W.W.; Qian, Y.Y.; Yang, M.R.; Song, S.; Dai, T.Y.; Peng, L.; Gao, X.Y.; Tao, L.; Tian, Y.; Sheng, J. Moringa oleifera alkaloids inhibited PC3 cells growth and migration through the COX-2 mediated Wnt/β-catenin signaling pathway. Front Pharmacol. 2020, 11, 523962. [Google Scholar] [CrossRef] [PubMed]
- Mancuso, F.; Lilli, C.; Bellucci, C.; Ceccarelli, V.; Stabile, A.; Gambelunghe, C.; Pugliese, L.; Cecchetti, M.; Luca, G.; Baroni, T. Antitumor Potential of Moringa oleifera Extract Against PC3 Prostate Cancer Cells Through IGF-1 Pathway Modulation. Sci. 2026, 8, 55. [Google Scholar] [CrossRef]
- Jones, P.A.; Baylin, S.B. The epigenomics of cancer. Cell 2007, 128(4), 683–92. [Google Scholar] [CrossRef] [PubMed]
- Esteller, M. Cancer epigenomics: DNA methylomes and histone-modification maps. Nat. Rev. Genet 2007, 8(4), 286–98. [Google Scholar] [CrossRef] [PubMed]
- Lam, D.; Clark, S.; Stirzaker, C.; Pidsley, R. Advances in Prognostic Methylation Biomarkers for Prostate Cancer. Cancers 2020, 12(10), 2993. [Google Scholar] [CrossRef] [PubMed]
- Nelson, W.G.; De Marzo, A.M.; Yegnasubramanian, S. Epigenetic alterations in human prostate cancers. Endocrinology 2009, 150(9), 3991–4002. [Google Scholar] [CrossRef] [PubMed]
- Yegnasubramanian, S. Prostate cancer epigenetics and its clinical implications. Asian J. Androl. 2016, 18(4), 549–58. [Google Scholar] [CrossRef] [PubMed]
- Conteduca, V.; Hess, J.; Yamada, Y.; Ku, S.Y.; Beltran, H. Epigenetics in prostate cancer: clinical implications. Transl. Androl. Urol. 2021, 10(7), 3104–3116. [Google Scholar] [CrossRef] [PubMed]
- Feinberg, A.P. The Key Role of Epigenetics in Human Disease Prevention and Mitigation. N Engl. J. Med. 2018, 378, 1323–1334. [Google Scholar] [CrossRef] [PubMed]
- Zhang, S.; Shen, T.; Zeng, Y. Epigenetic Modifications in Prostate Cancer Metastasis and Microenvironment. Cancers 2023, 15(8), 2243. [Google Scholar] [CrossRef] [PubMed]
- Henrique, R.; Ribeiro, F.R.; Fonseca, D.; Hoque, M.O.; Carvalho, A.L.; Costa, V.L.; Pinto, M.; Oliveira, J.; Teixeira, M.R.; Sidransky, D.; Jerónimo, C. High promoter methylation levels of APC predict poor prognosis in sextant biopsies from prostate cancer patients. Clin. Cancer Res. 2007, 13(20), 6122–9. [Google Scholar] [CrossRef] [PubMed]
- Weiss, G.; Cottrell, S.; Distler, J.; Schatz, P.; Kristiansen, G.; Ittmann, M.; Haefliger, C.; Lesche, R.; Hartmann, A.; Corman, J.; Wheeler, T. DNA methylation of the PITX2 gene promoter region is a strong independent prognostic marker of biochemical recurrence in patients with prostate cancer after radical prostatectomy. J. Urol. 2009, 181(4), 1678–85. [Google Scholar] [CrossRef] [PubMed]
- Franceschini, G.M.; Quaini, O.; Mizuno, K.; Orlando, F.; Ciani, Y.; Ku, S.Y.; Sigouros, M.; Rothmann, E.; Alonso, A.; Benelli, M.; Nardella, C.; Auh, J.; Freeman, D.; Hanratty, B.; Adil, M.; Elemento, O.; Tagawa, S.T.; Feng, F.Y.; Caffo, O.; Buttigliero, C.; Basso, U.; Nelson, P.S.; Corey, E.; Haffner, M.C.; Attard, G.; Aparicio, A.; Demichelis, F.; Beltran, H. Noninvasive Detection of Neuroendocrine Prostate Cancer through Targeted Cell-free DNA Methylation. Cancer Discov. 2024, 14(3), 424–445. [Google Scholar] [CrossRef] [PubMed]
- Crosas-Molist, E.; Samain, R.; Kohlhammer, L.; Orgaz, J.L.; George, S.L.; Maiques, O.; Barcelo, J.; Sanz-Moreno, V. Rho GTPase signaling in cancer progression and dissemination. Physiol. Rev. 2022, 102(1), 455–510. [Google Scholar] [CrossRef] [PubMed]
- Pasquale, E. Eph receptor signalling casts a wide net on cell behaviour. Nat. Rev. Mol. Cell Biol. Erratum in: Nat Rev Mol Cell Biol. 2005 Jul;6(7):589. 2005, 6, 462–475. [Google Scholar] [CrossRef] [PubMed]
- Kruger, R.; Aurandt, J.; Guan, K.L. Semaphorins command cells to move The Hippo Pathway: Biology and Pathophysiology. In Nat Rev Mol Cell Biol;Annu Rev Biochem.; Ma, S., Meng, Z., Chen, R., Guan, K.L., Eds.; 2005; Volume 6 88, p. 789–800 577-604. [Google Scholar] [CrossRef] [PubMed]
- Zanconato, F.; Cordenonsi, M.; Piccolo, S. YAP/TAZ at the Roots of Cancer. Cancer Cell 2016, 29(6), 783–803. [Google Scholar] [CrossRef] [PubMed]
- Bin Hafeez, B.; Adhami, V.M.; Asim, M.; Siddiqui, I.A.; Bhat, K.M.; Zhong, W.; Saleem, M.; Din, M.; Setaluri, V.; Mukhtar, H. Targeted knockdown of Notch1 inhibits invasion of human prostate cancer cells concomitant with inhibition of matrix metalloproteinase-9 and urokinase plasminogen activator. Clin. Cancer Res. 2009, 15(2), 452–9. [Google Scholar] [CrossRef] [PubMed]
- Carvalho, F.L.; Simons, B.W.; Eberhart, C.G.; Berman, D.M. Notch signaling in prostate cancer: a moving target. Prostate 2014, 74(9), 933–45. [Google Scholar] [CrossRef] [PubMed]
- Ju, J.; Gothai, S.; Hasanpourghadi, M.; Nasser, A.A.; Aziz Ibrahim, I.A.; Shahzad, N.; Pandurangan, A.K.; Muniandy, K.; Suresh Kumar, S.; Arulselvan, P. Anticancer potential of Moringa oleifera flower extract in human prostate cancer PC-3 cells via induction of apoptosis and downregulation of AKT pathway. Phcog Mag. 2018, 14, 477–81. [Google Scholar] [CrossRef]
- Wang, C.; Wu, R.; Sargsyan, D.; Zheng, M.; Li, S.; Yin, R.; Su, S.; Raskin, I.; Kong, A.N. CpG methyl-seq and RNA-seq epigenomic and transcriptomic studies on the preventive effects of Moringa isothiocyanate in mouse epidermal JB6 cells induced by the tumor promoter TPA. J. Nutr. Biochem. 2019, 68, 69–78. [Google Scholar] [CrossRef] [PubMed]
- Li, S.; Li, W.; Wu, R.; Yin, R.; Sargsyan, D.; Raskin, I.; Kong, A.N. Epigenome and transcriptome study of moringa isothiocyanate in mouse kidney mesangial cells induced by high glucose, a potential model for diabetic-induced nephropathy. AAPS J. 2019, 22(1), 8. [Google Scholar] [CrossRef] [PubMed]
- Khan, A.; Khan, A.; Khan, M.A.; Malik, Z.; Massey, S.; Parveen, R.; Mustafa, S.; Shamsi, A.; Husain, S.A. Phytocompounds targeting epigenetic modulations: an assessment in cancer. Front. Pharmacol. 2024, 14, 1273993. [Google Scholar] [CrossRef] [PubMed]
- Rajaselvi, N.D.; Jida, M.D.; Ajeeshkumar, K.K.; Nair, S.N.; John, P.; Aziz, Z.; Nisha, A.R. Antineoplastic activity of plant-derived compounds mediated through inhibition of histone deacetylase: a review. Amino Acids 2023, 55(12), 1803–1817. [Google Scholar] [CrossRef] [PubMed]
- Wu, Y.Y.; Xu, Y.M.; Lau, A.T.Y. Epigenetic effects of herbal medicine. Clin. Epigenet. 2023, 15, 85. [Google Scholar] [CrossRef] [PubMed]
- Fatima, N.; Baqri, S.S.R.; Bhattacharya, A.; Koney, N.K.-K.; Husain, K.; Abbas, A.; Ansari, R.A. Role of Flavonoids as Epigenetic Modulators in Cancer Prevention and Therapy. Front. Genet. 2021, 12, 758733. [Google Scholar] [CrossRef] [PubMed]
- Rajendran, P.; Abdelsalam, S.A.; Renu, K.; Veeraraghavan, V.; Ben Ammar, R.; Ahmed, E.A. Polyphenols as Potent Epigenetics Agents for Cancer. Int. J. Mol. Sci. 2022, 23, 11712. [Google Scholar] [CrossRef] [PubMed]
- Su, X.; Lu, G.; Ye, L.; Shi, R.; Zhu, M.; Yu, X.; Li, Z.; Jia, X.; Feng, L. Moringa oleifera Lam.: a comprehensive review on active components, health benefits and application. RSC Adv. 2023, 13(35), 24353–24384. [Google Scholar] [CrossRef] [PubMed]
- Pareek, A.; Pant, M.; Gupta, M.M.; Kashania, P.; Ratan, Y.; Jain, V.; Pareek, A.; Chuturgoon, A.A. Moringa oleifera: An Updated Comprehensive Review of Its Pharmacological Activities, Ethnomedicinal, Phytopharmaceutical Formulation, Clinical, Phytochemical, and Toxicological Aspects. Int. J. Mol. Sci. 2023, 24(3), 2098. [Google Scholar] [CrossRef] [PubMed]
- Wu, Qi; Zhou, He-Jiang; Sheng, Jun; Su, Ling-Yan; Tian, Yang. Extraction, structural properties, and bioactivities of Moringa (Moringa oleifera Lam.) isothiocyanates: A review. Food Biosci. 2024, 57, 103447. [Google Scholar] [CrossRef]
- Mancuso, F.; Arato, I.; Bellucci, C.; Lilli, C.; Eugeni, E.; Aglietti, M.C.; Stabile, A.M.; Pistilli, A.; Brancorsini, S.; Gaggia, F.; Calvitti, M.; Baroni, T.; Luca, G. Zinc restores functionality in porcine prepubertal Sertoli cells exposed to subtoxic cadmium concentration via regulating the Nrf2 signaling pathway. Front Endocrinol. 2023, 14, 962519. [Google Scholar] [CrossRef] [PubMed]
- Luca, G.; Arato, I.; Mancuso, F.; Calvitti, M.; Falabella, G.; Murdolo, G.; Basta, G.; Cameron, D. F.; Hansen, B. C.; Fallarino, F.; Baroni, T.; Aglietti, M. C.; Tortoioli, C.; Bodo, M.; Calafiore, R. Xenograft of microencapsulated Sertoli cells restores glucose homeostasis in db/db mice with spontaneous diabetes mellitus. Xenotransplantation 2016, 23, 429–439. [Google Scholar] [CrossRef] [PubMed]
- Cannarella, R.; Arato, I.; Condorelli, R.A.; Luca, G.; Barbagallo, F.; Alamo, A.; Bellucci, C.; Lilli, C.; La Vignera, S.; Calafiore, R.; Mancuso, F.; Calogero, A.E. The IGF1 Receptor Is Involved in Follicle-Stimulating Hormone Signaling in Porcine Neonatal Sertoli Cells. J. Clin. Med. 2019, 8(5), 577. [Google Scholar] [CrossRef] [PubMed]
- Aryee, M.J.; Jaffe, A.E.; Corrada-Bravo, H.; Ladd-Acosta, C.; Feinberg, A.P.; Hansen, K.D.; Irizarry, R.A. Minfi: A flexible and comprehensive Bioconductor package for the analysis of Infinium DNA Methylation microarrays. Bioinformatics 2014, 30(10), 1363–1369. [Google Scholar] [CrossRef]
- Ritchie, M.E.; Phipson, B.; Wu, D.; Hu, Y.; Law, C.W.; Shi, W.; Smyth, G.K. limma powers differential expression analyses for RNA-sequencing and microarray studies. Nucleic Acids 2015, 43(7), e47. [Google Scholar] [CrossRef]
- Peters, Timothy J.; Meyer, Braydon; Ryan, Lauren; Achinger-Kawecka, Joanna; Song, Jenny; Campbell, Elyssa M.; Qu, Wenjia; Nair, Shalima; Loi-Luu, Phuc; Stricker, Phillip; Lim, Elgene; Stirzaker, Clare; Clark, Susan J.; Pidsley, Ruth. Characterisation and reproducibility of the HumanMethylationEPIC v2.0 BeadChip for DNA methylation profiling. BMC Genom. 2024, 25, 251. [Google Scholar] [CrossRef] [PubMed]
- Gu, Z. IlluminaHumanMethylationEPICv2anno.20a1.hg38:Annotation Illumina's EPIC v2.0 methylation arrays. R package version 1.0.0, commit 702e52acb8268353bd8c753e67a2096c565f9782. 2024. Available online: https://github.com/jokergoo/IlluminaHumanMethylatio.
- Yu, G.; Wang, L.G.; Han, Y.; He, Q.Y. clusterProfiler: an R package for comparing biological themes among gene clusters. OMICS 2012, 16(5), 284–7. [Google Scholar] [CrossRef] [PubMed] [PubMed Central]
- Yu, G.; He, Q.Y. ReactomePA: an R/Bioconductor package for reactome pathway analysis and visualization. Mol. Biosyst. 2016, 12(2), 477–9. [Google Scholar] [CrossRef] [PubMed]
Figure 1.
Assessment of apoptosis (early apoptosis - late apoptosis - total apoptosis), necrosis, and viable cells. Treatment with Moringa oleifera (100 and 200 μg/mL) for 24 h induced early and late apoptosis in a dose-dependent manner, with a greater effect observed at the higher concentration. Three independent experiments were performed, and data are presented as mean ± SD. Statistical significance was determined by two-way ANOVA (***P < 0.001).
Figure 1.
Assessment of apoptosis (early apoptosis - late apoptosis - total apoptosis), necrosis, and viable cells. Treatment with Moringa oleifera (100 and 200 μg/mL) for 24 h induced early and late apoptosis in a dose-dependent manner, with a greater effect observed at the higher concentration. Three independent experiments were performed, and data are presented as mean ± SD. Statistical significance was determined by two-way ANOVA (***P < 0.001).
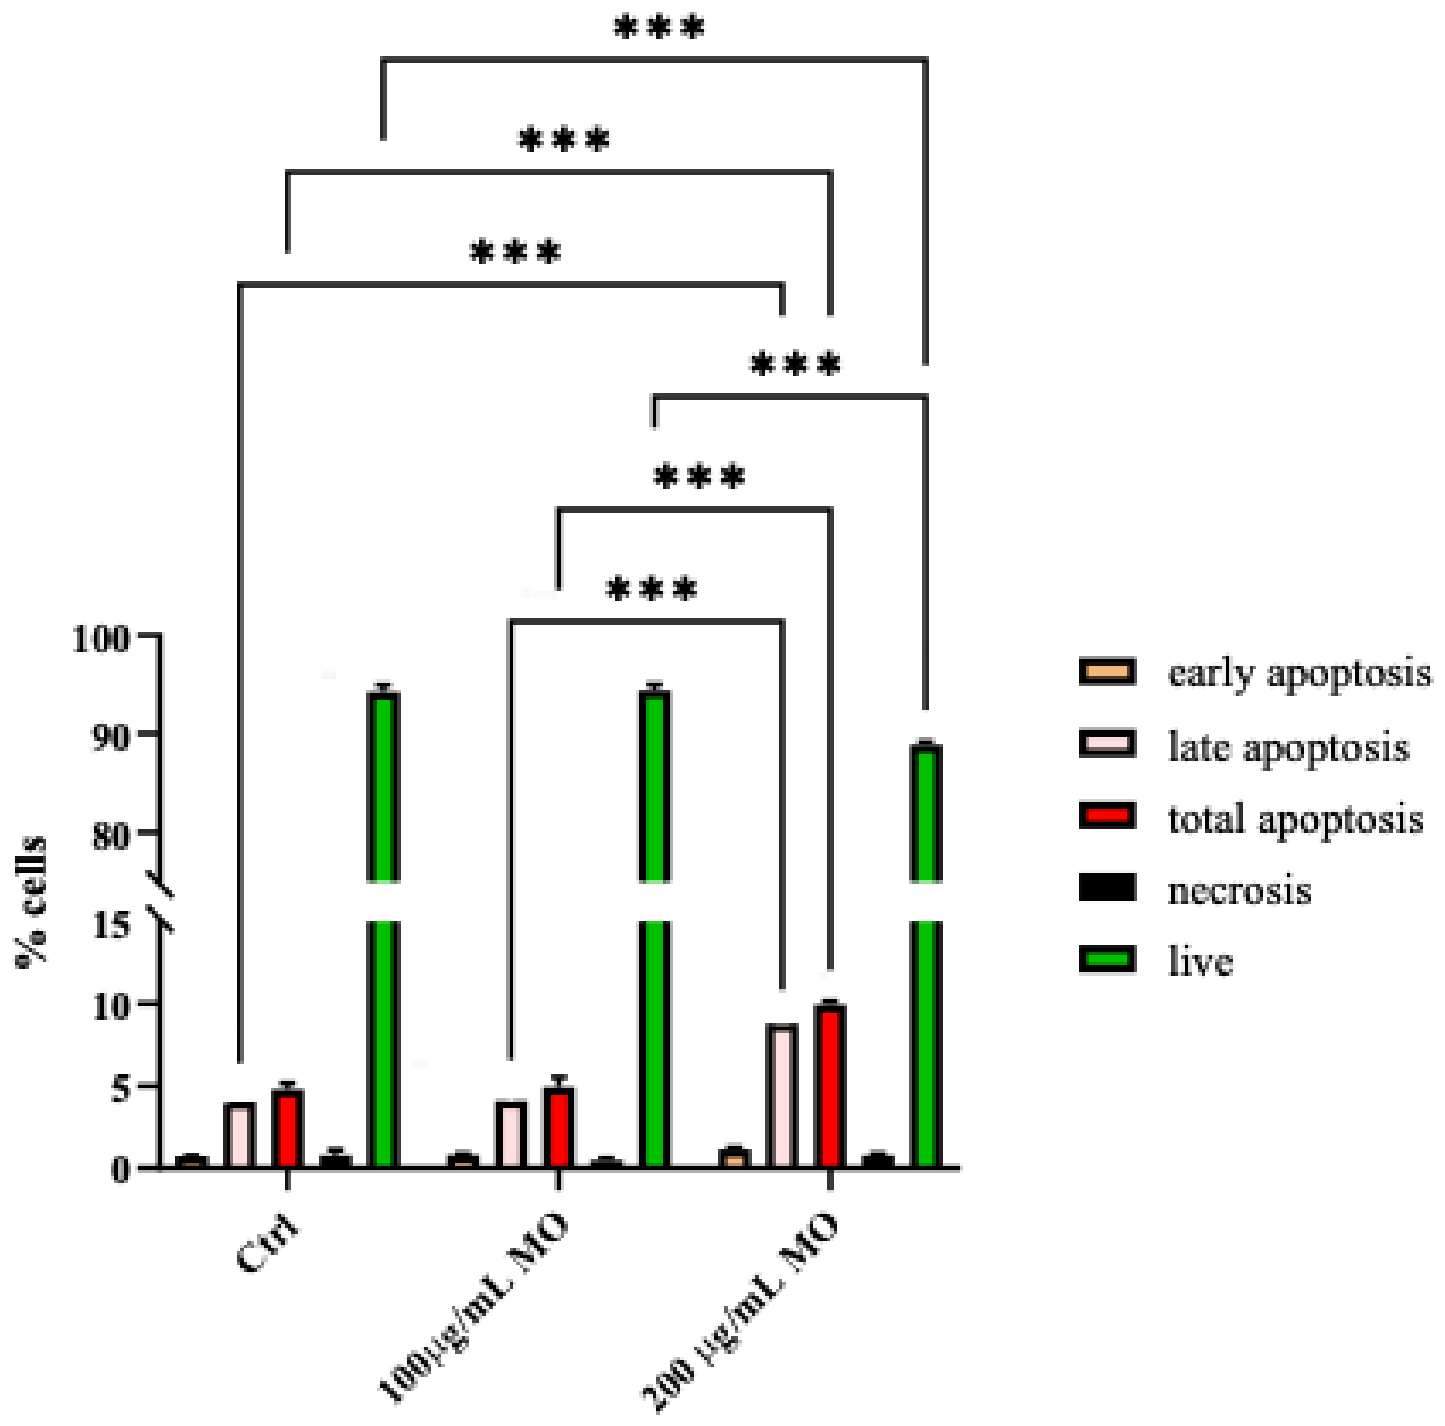
Figure 2.
Real-Time PCR and Western Blotting analysis. Gene expression of vimentin (A), N-cadherin (B), fibronectin (C), E-cadherin (D), and densitometric analysis with relative immunoblotting images (I) of vimentin (E), N-cadherin (F), fibronectin (G) and E-cadherin (H) in different culture conditions. Black vertical lines indicate non-contiguous regions of the same blot that were juxtaposed for presentation purposes. Ctrl: unexposed PC3 control cells; MO: Moringa oleifera; data represent the mean ± SD of three independent experiments, each performed in triplicate. Statistically significant differences were evaluated using the one-way ANOVA (*P < 0.05; **P < 0.01; ***P < 0.001).
Figure 2.
Real-Time PCR and Western Blotting analysis. Gene expression of vimentin (A), N-cadherin (B), fibronectin (C), E-cadherin (D), and densitometric analysis with relative immunoblotting images (I) of vimentin (E), N-cadherin (F), fibronectin (G) and E-cadherin (H) in different culture conditions. Black vertical lines indicate non-contiguous regions of the same blot that were juxtaposed for presentation purposes. Ctrl: unexposed PC3 control cells; MO: Moringa oleifera; data represent the mean ± SD of three independent experiments, each performed in triplicate. Statistically significant differences were evaluated using the one-way ANOVA (*P < 0.05; **P < 0.01; ***P < 0.001).
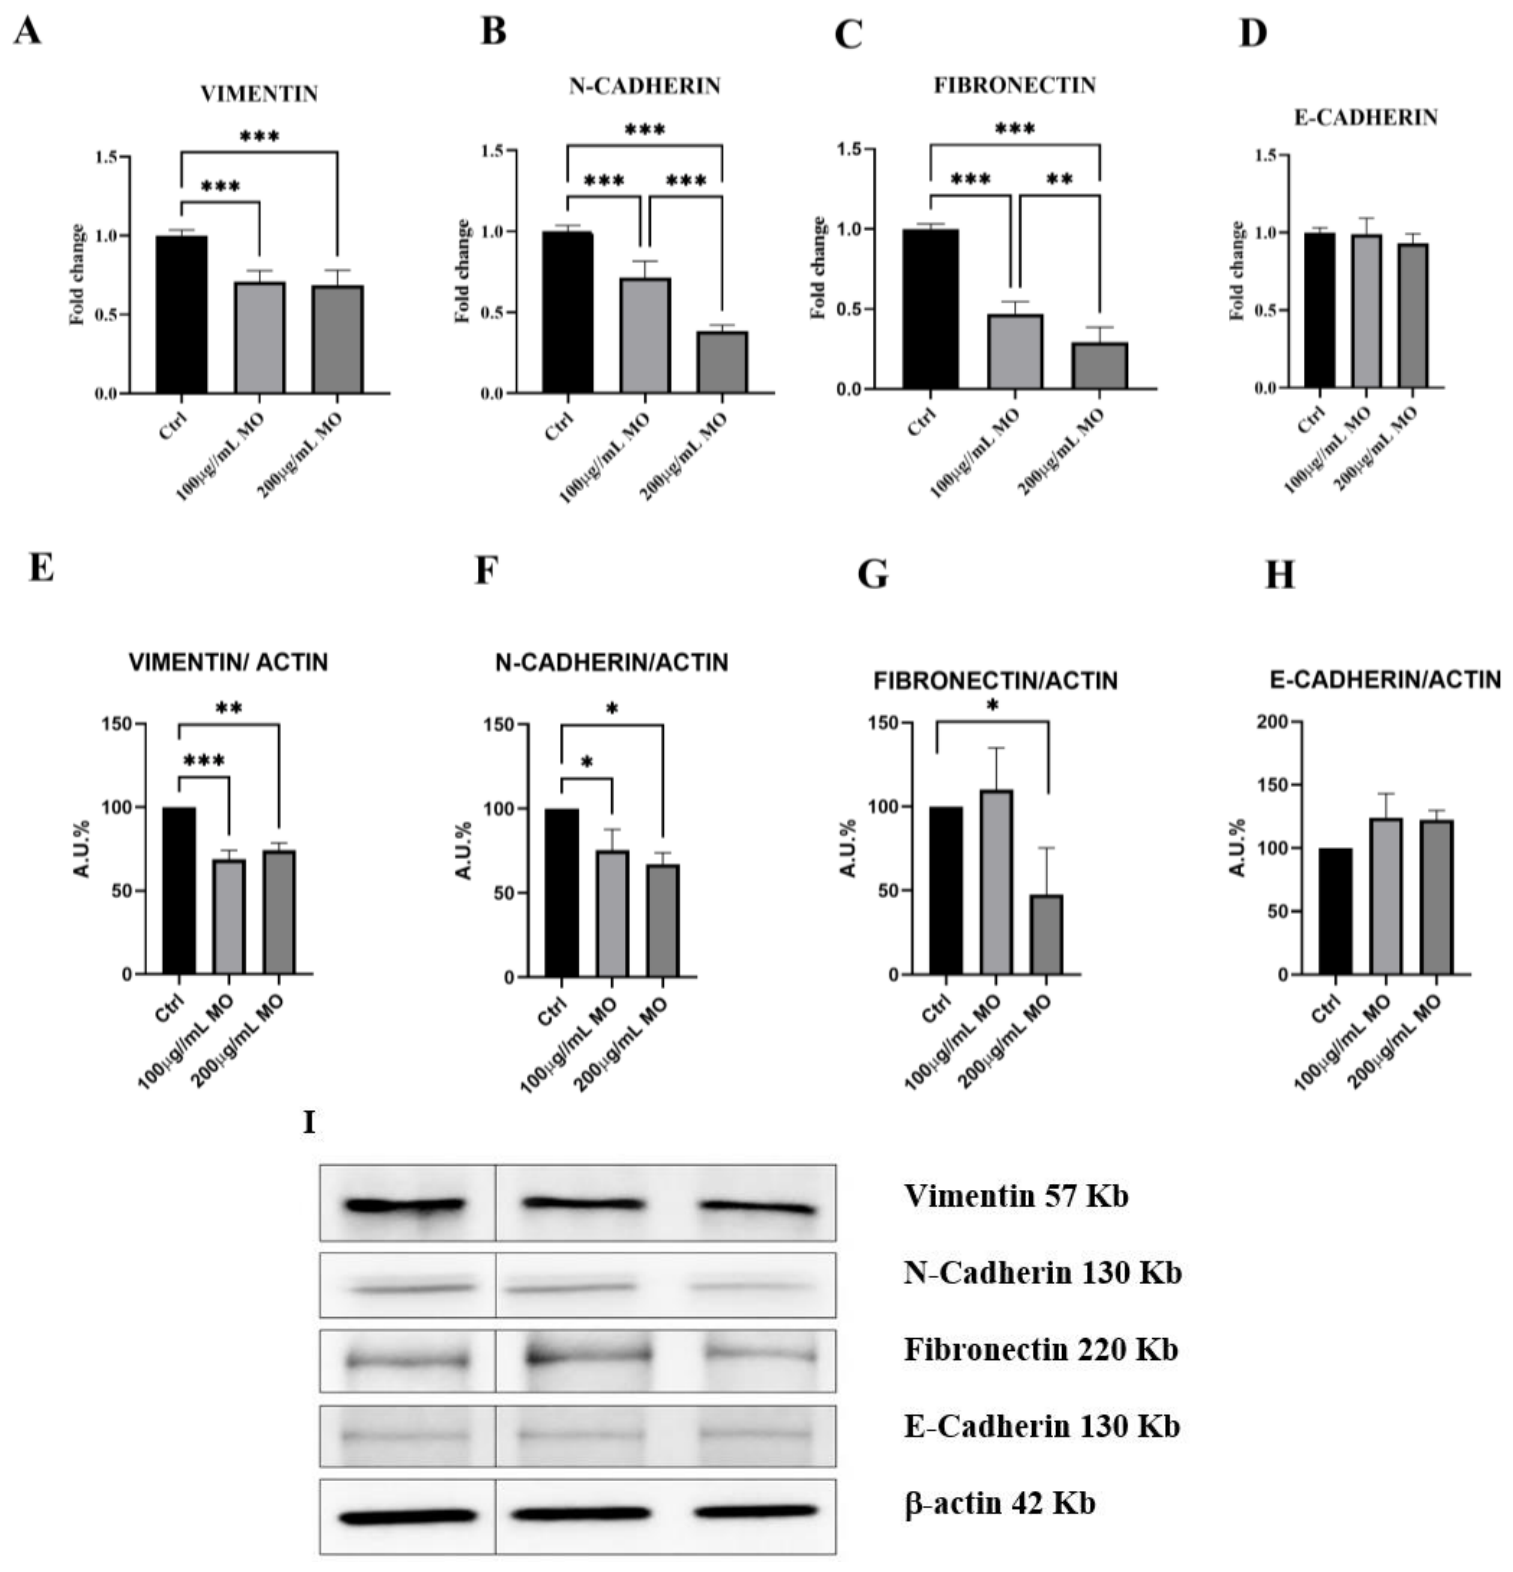
Figure 3.
Real-Time PCR. Gene expression of integrin α2 (A), integrin β1 (B), occludin (C), BAX/BCL2 ratio (D), and c-MYC (E), in different culture conditions. Ctrl: unexposed PC3 control cells; MO: Moringa oleifera; data represent the mean ± SD of three independent experiments, each performed in triplicate. Statistically significant differences were evaluated using the one-way ANOVA (**P < 0.01; ***P < 0.001).
Figure 3.
Real-Time PCR. Gene expression of integrin α2 (A), integrin β1 (B), occludin (C), BAX/BCL2 ratio (D), and c-MYC (E), in different culture conditions. Ctrl: unexposed PC3 control cells; MO: Moringa oleifera; data represent the mean ± SD of three independent experiments, each performed in triplicate. Statistically significant differences were evaluated using the one-way ANOVA (**P < 0.01; ***P < 0.001).
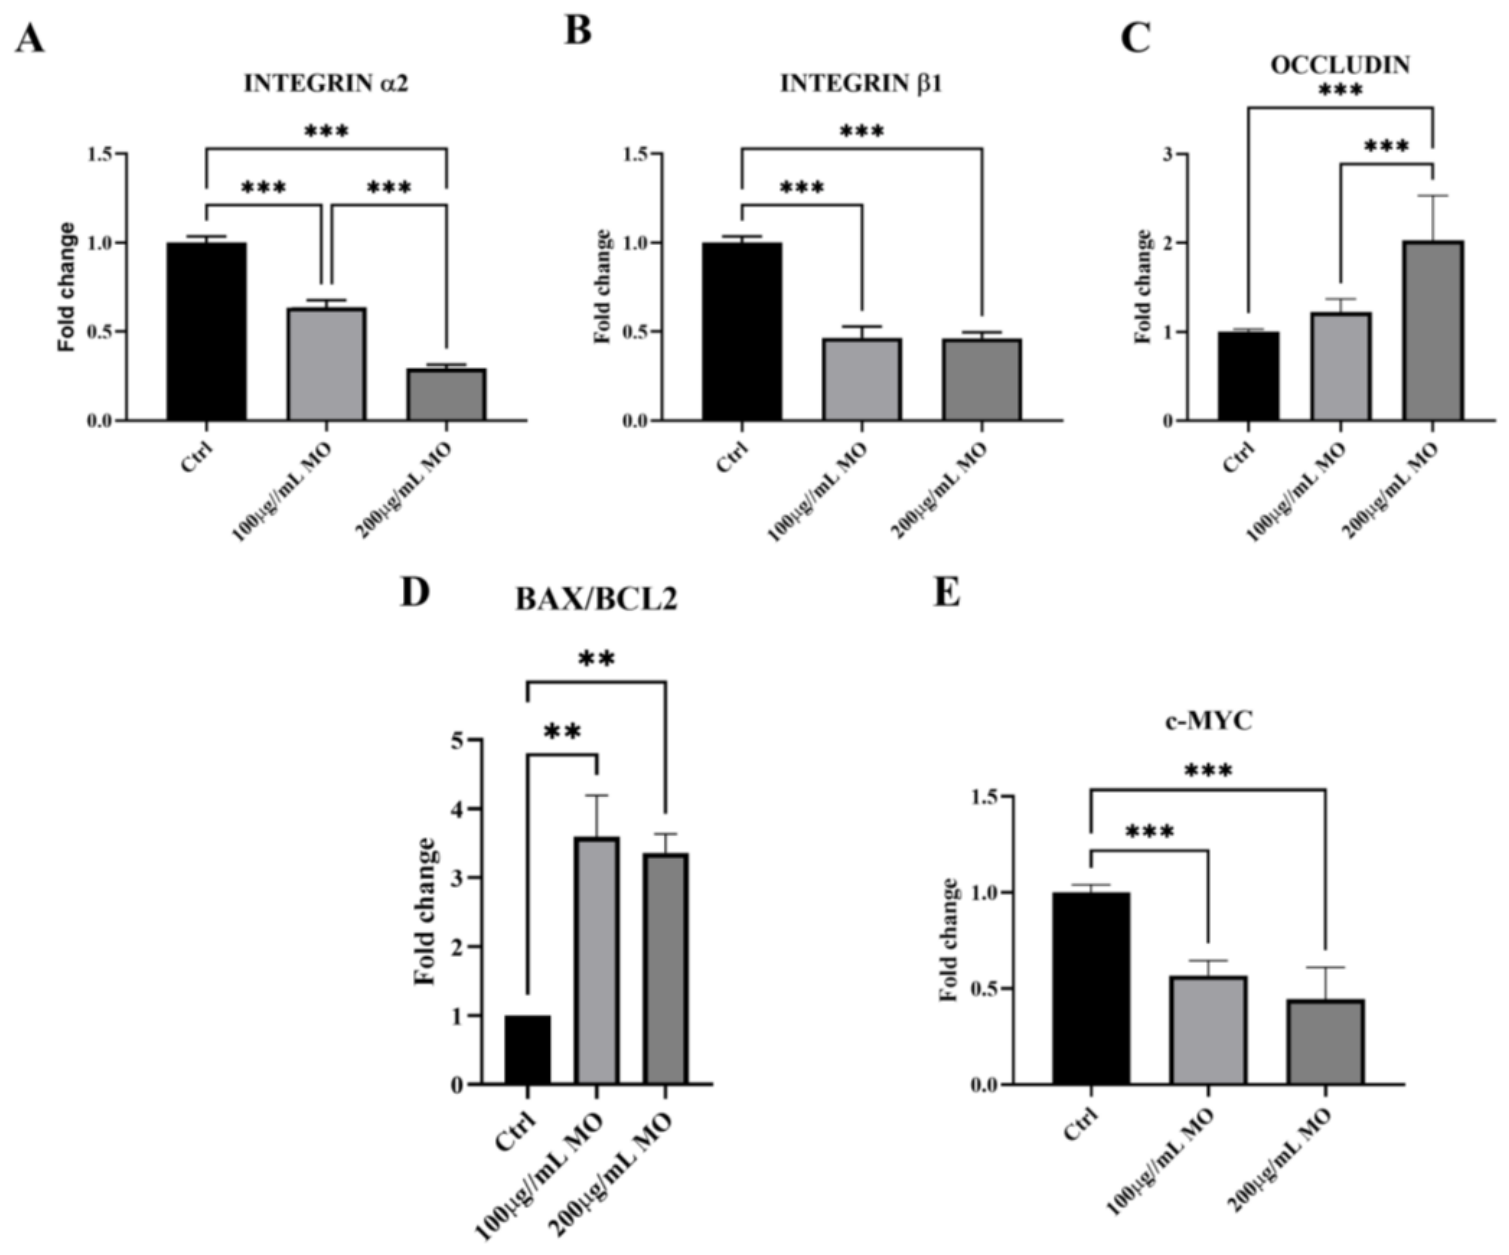
Figure 4.
Real-Time PCR. Gene expression of cystatin A (A), cystatin B (B), cathepsin D (C), cathepsin B (D), MMP2 (E), MMP9 (F), MMP13(G) and Alkaline phosphatase (ALP) (H) in different culture conditions. Ctrl: unexposed PC3 control cells; MO: Moringa oleifera; data represent the mean ± SD of three independent experiments, each performed in triplicate. Statistically significant differences were evaluated using the one-way ANOVA (*P < 0.05; **P < 0.01; ***P < 0.001).
Figure 4.
Real-Time PCR. Gene expression of cystatin A (A), cystatin B (B), cathepsin D (C), cathepsin B (D), MMP2 (E), MMP9 (F), MMP13(G) and Alkaline phosphatase (ALP) (H) in different culture conditions. Ctrl: unexposed PC3 control cells; MO: Moringa oleifera; data represent the mean ± SD of three independent experiments, each performed in triplicate. Statistically significant differences were evaluated using the one-way ANOVA (*P < 0.05; **P < 0.01; ***P < 0.001).
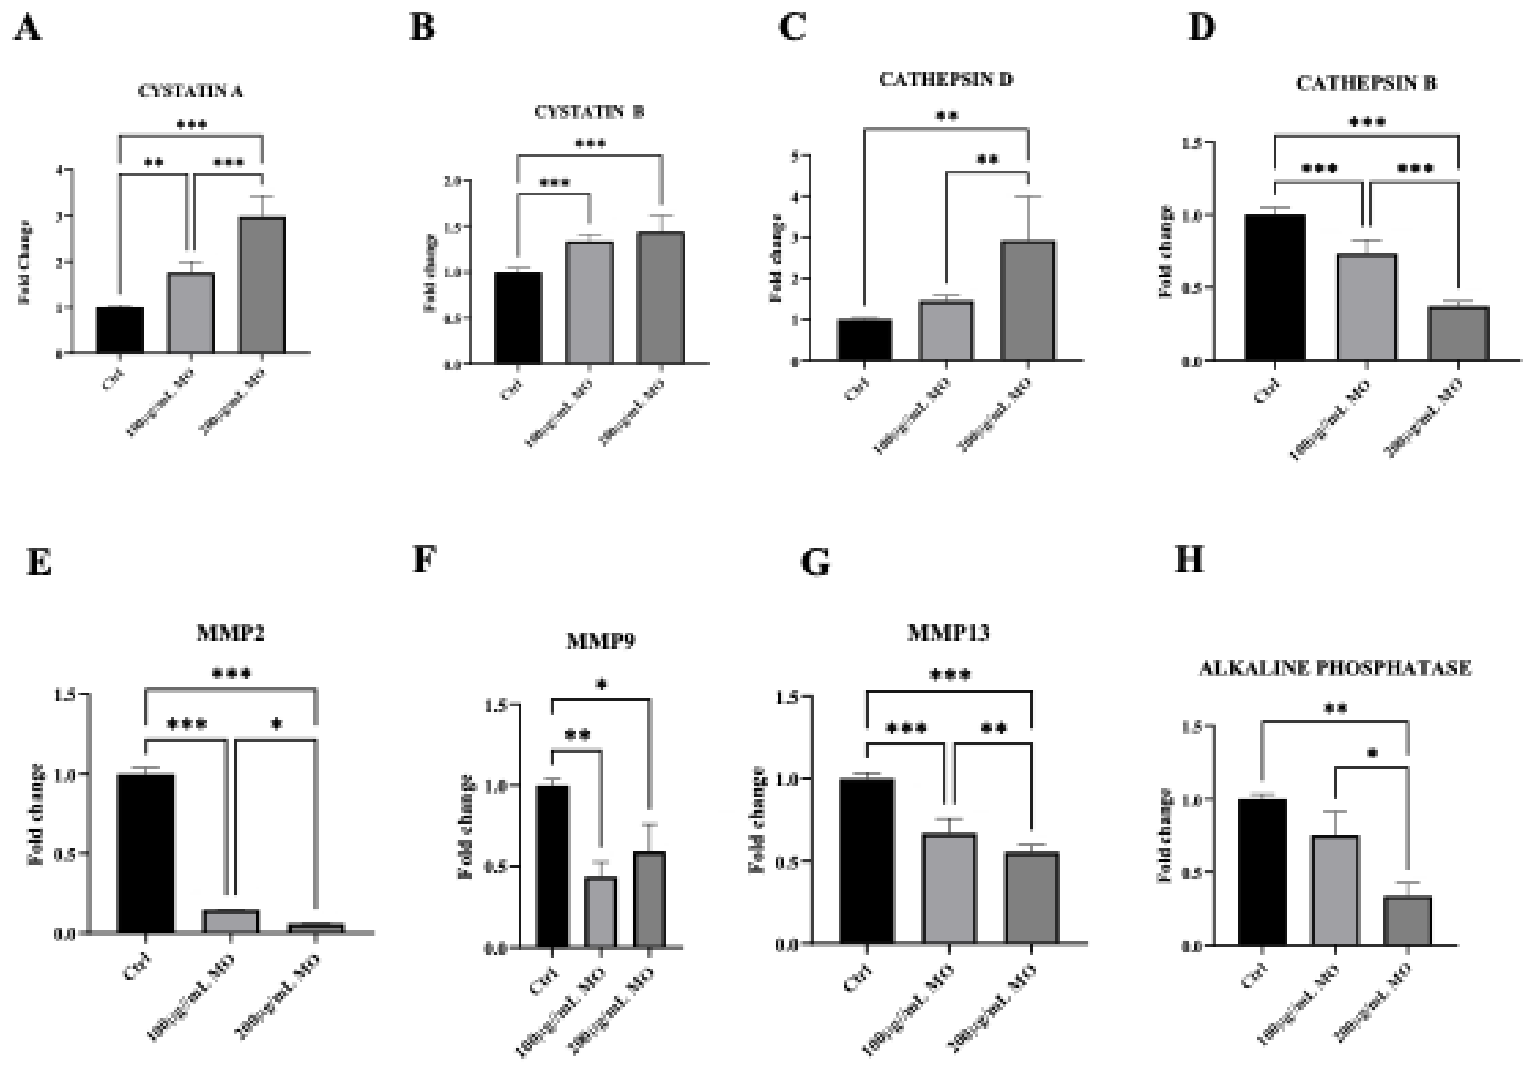
Figure 5.
Western Blotting. Densitometric analysis and immunoblotting images (D) of phospho-ERK 1/2/ERK 1/2 (A), phospho-AKT/AKT (B), phospho-NF-kB/NF-kB (C) in different culture conditions. Black vertical lines indicate non-contiguous regions of the same blot that were juxtaposed for presentation purposes. Ctrl: unexposed PC3 control cells; MO: Moringa oleifera; data represent the mean ± SD of three independent experiments, each performed in triplicate. Statistically significant differences were evaluated using the one-way ANOVA (*P < 0.05; **P < 0.01; ***P < 0.001).
Figure 5.
Western Blotting. Densitometric analysis and immunoblotting images (D) of phospho-ERK 1/2/ERK 1/2 (A), phospho-AKT/AKT (B), phospho-NF-kB/NF-kB (C) in different culture conditions. Black vertical lines indicate non-contiguous regions of the same blot that were juxtaposed for presentation purposes. Ctrl: unexposed PC3 control cells; MO: Moringa oleifera; data represent the mean ± SD of three independent experiments, each performed in triplicate. Statistically significant differences were evaluated using the one-way ANOVA (*P < 0.05; **P < 0.01; ***P < 0.001).
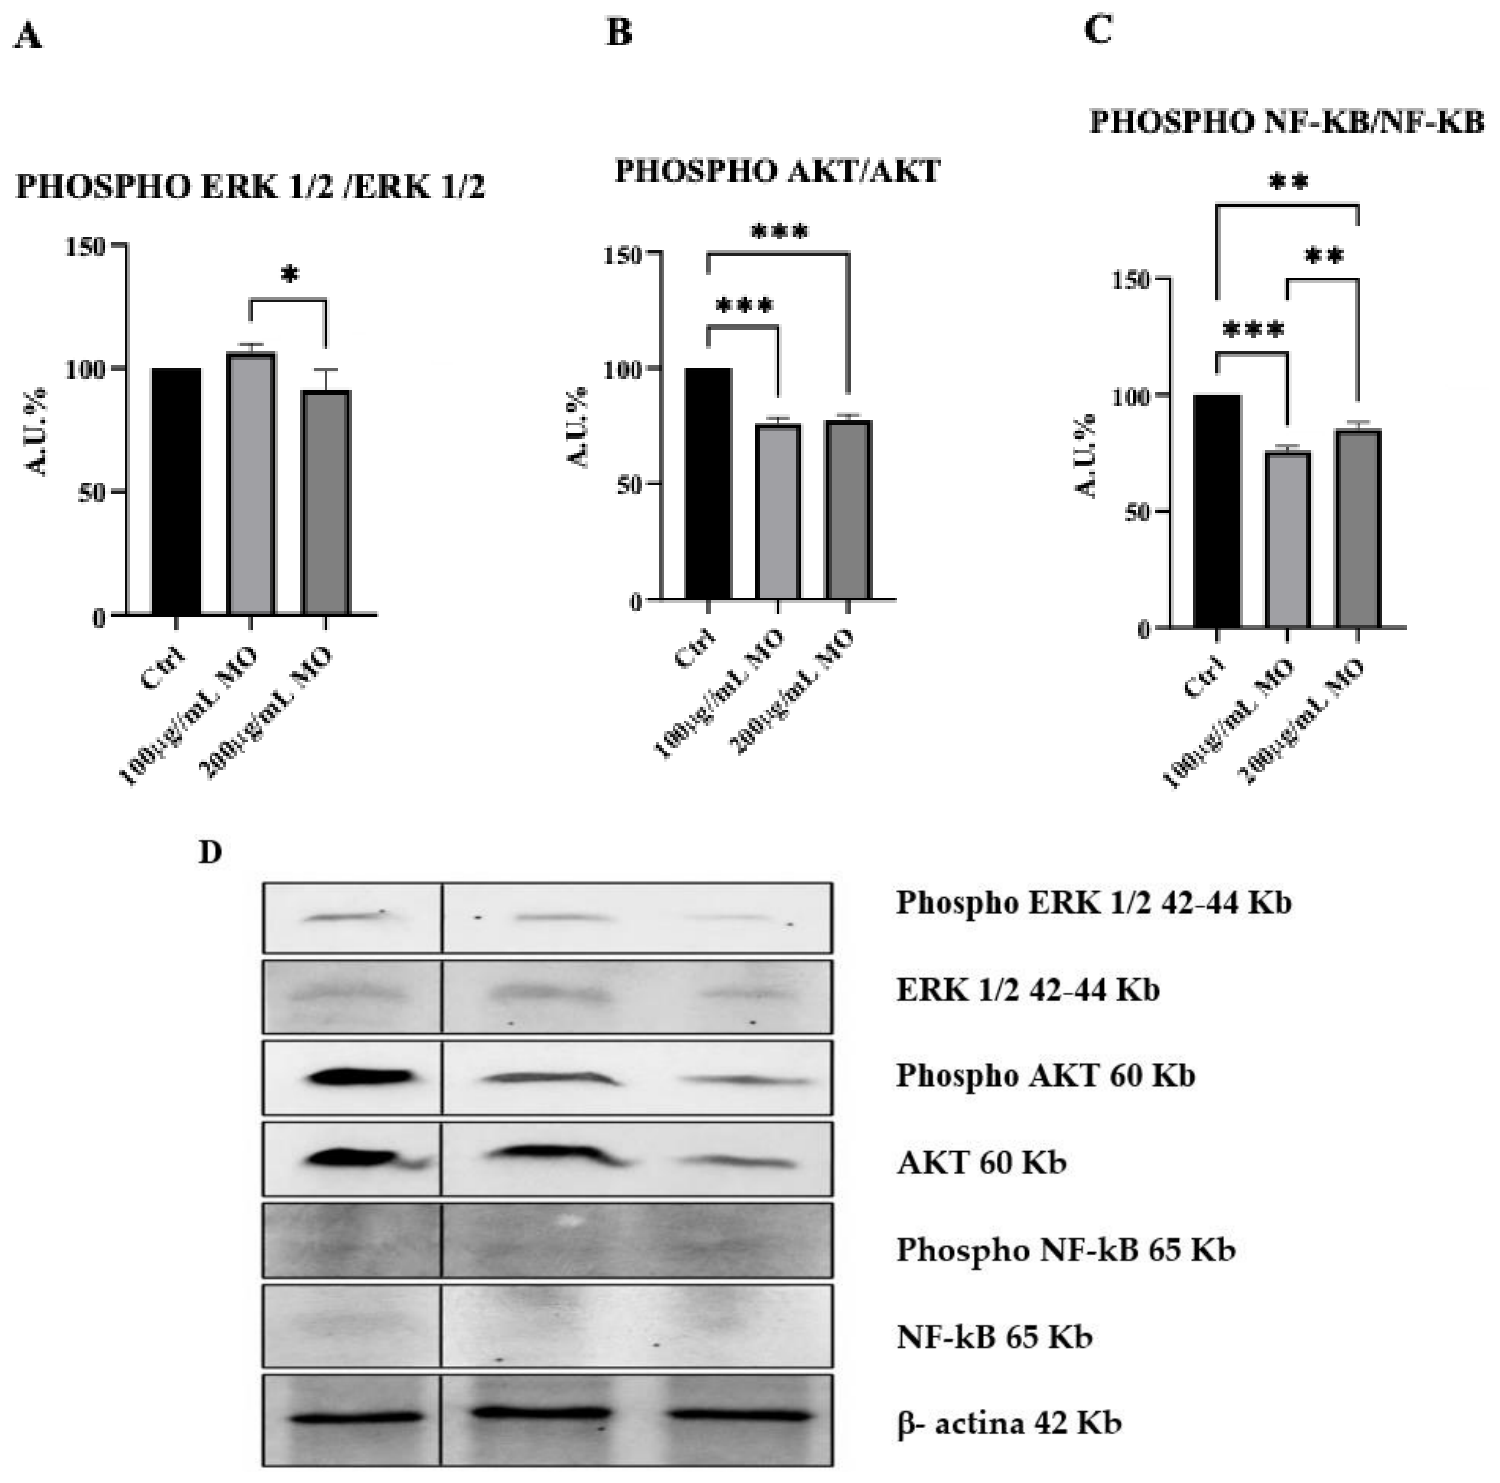
Figure 6.
Gene Ontology (GO) Biological Process enrichment analysis of differentially methylated regions in PC3 cells following treatment with Moringa oleifera extract (100 μg/mL) compared with untreated control cells. (A) Top significantly enriched GO Biological Process terms associated with hypermethylated differentially methylated regions (DMRs). (B) Top significantly enriched GO Biological Process terms associated with hypomethylated DMRs. Bars represent enrichment significance expressed as -log10(FDR-adjusted P value). GO terms are ranked according to statistical significance, with higher values indicating stronger enrichment.
Figure 6.
Gene Ontology (GO) Biological Process enrichment analysis of differentially methylated regions in PC3 cells following treatment with Moringa oleifera extract (100 μg/mL) compared with untreated control cells. (A) Top significantly enriched GO Biological Process terms associated with hypermethylated differentially methylated regions (DMRs). (B) Top significantly enriched GO Biological Process terms associated with hypomethylated DMRs. Bars represent enrichment significance expressed as -log10(FDR-adjusted P value). GO terms are ranked according to statistical significance, with higher values indicating stronger enrichment.
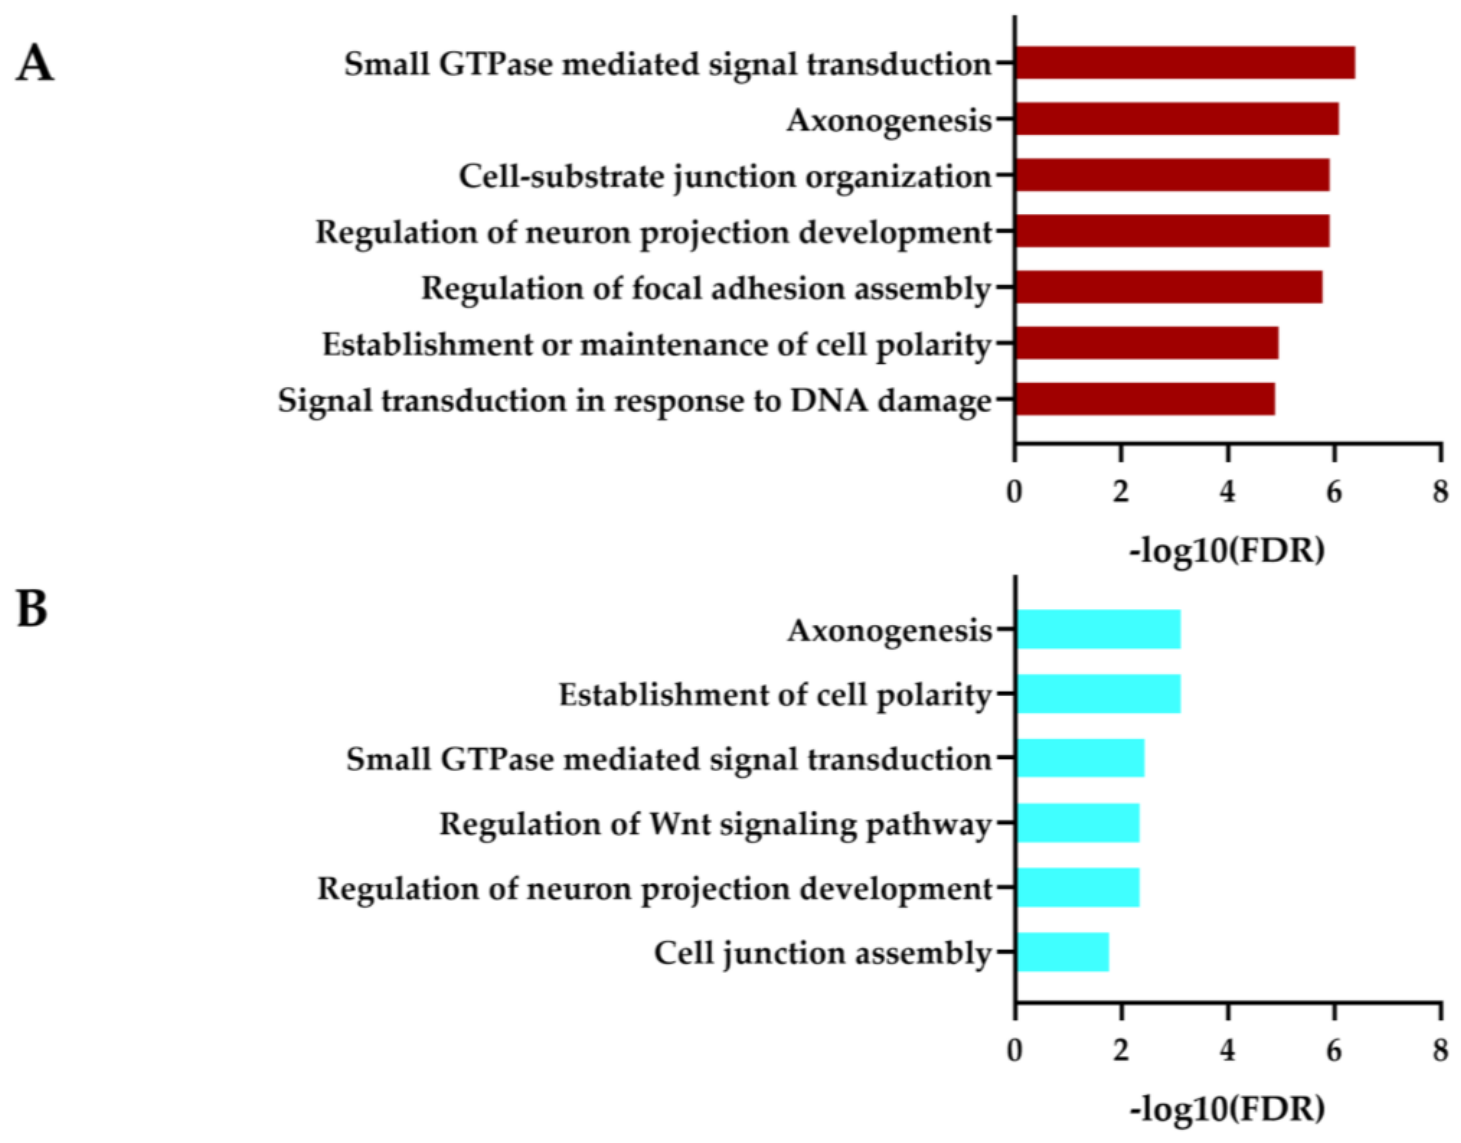
Figure 7.
Kyoto Encyclopedia of Genes and Genomes (KEGG) pathway enrichment analysis of differentially methylated regions in PC3 cells following treatment with Moringa oleifera extract (100 μg/mL) compared with untreated control cells. (A) selected significantly enriched KEGG pathways associated with hypermethylated DMRs. (B) selected significantly enriched KEGG pathways associated with hypomethylated DMRs. Bars represent enrichment significance expressed as -log10(FDR-adjusted P value). Pathways are ranked according to statistical significance.
Figure 7.
Kyoto Encyclopedia of Genes and Genomes (KEGG) pathway enrichment analysis of differentially methylated regions in PC3 cells following treatment with Moringa oleifera extract (100 μg/mL) compared with untreated control cells. (A) selected significantly enriched KEGG pathways associated with hypermethylated DMRs. (B) selected significantly enriched KEGG pathways associated with hypomethylated DMRs. Bars represent enrichment significance expressed as -log10(FDR-adjusted P value). Pathways are ranked according to statistical significance.
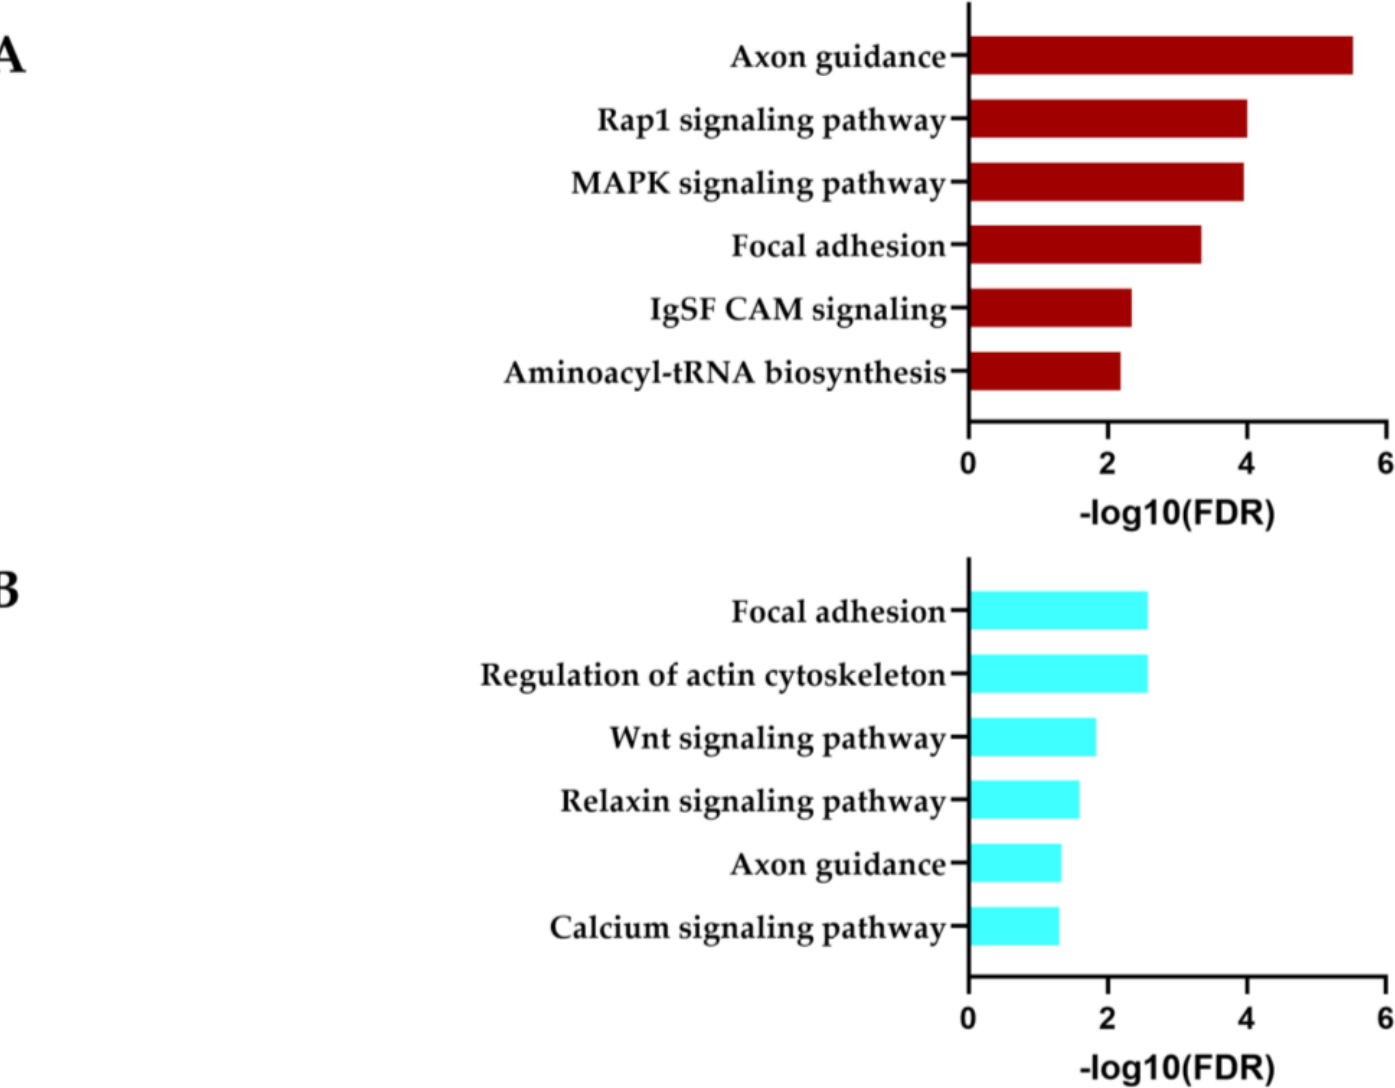
Figure 8.
Gene Ontology (GO) Biological Process enrichment analysis of differentially methylated regions in PC3 cells following treatment with Moringa oleifera extract (200 μg/mL) compared with untreated control cells. (A) Top significantly enriched GO Biological Process terms associated with hypermethylated DMRs. (B) Top significantly enriched GO Biological Process terms associated with hypomethylated DMRs. Bars represent enrichment significance expressed as -log10(FDR-adjusted P value). GO terms are ranked according to statistical significance, with higher values indicating stronger enrichment.
Figure 8.
Gene Ontology (GO) Biological Process enrichment analysis of differentially methylated regions in PC3 cells following treatment with Moringa oleifera extract (200 μg/mL) compared with untreated control cells. (A) Top significantly enriched GO Biological Process terms associated with hypermethylated DMRs. (B) Top significantly enriched GO Biological Process terms associated with hypomethylated DMRs. Bars represent enrichment significance expressed as -log10(FDR-adjusted P value). GO terms are ranked according to statistical significance, with higher values indicating stronger enrichment.
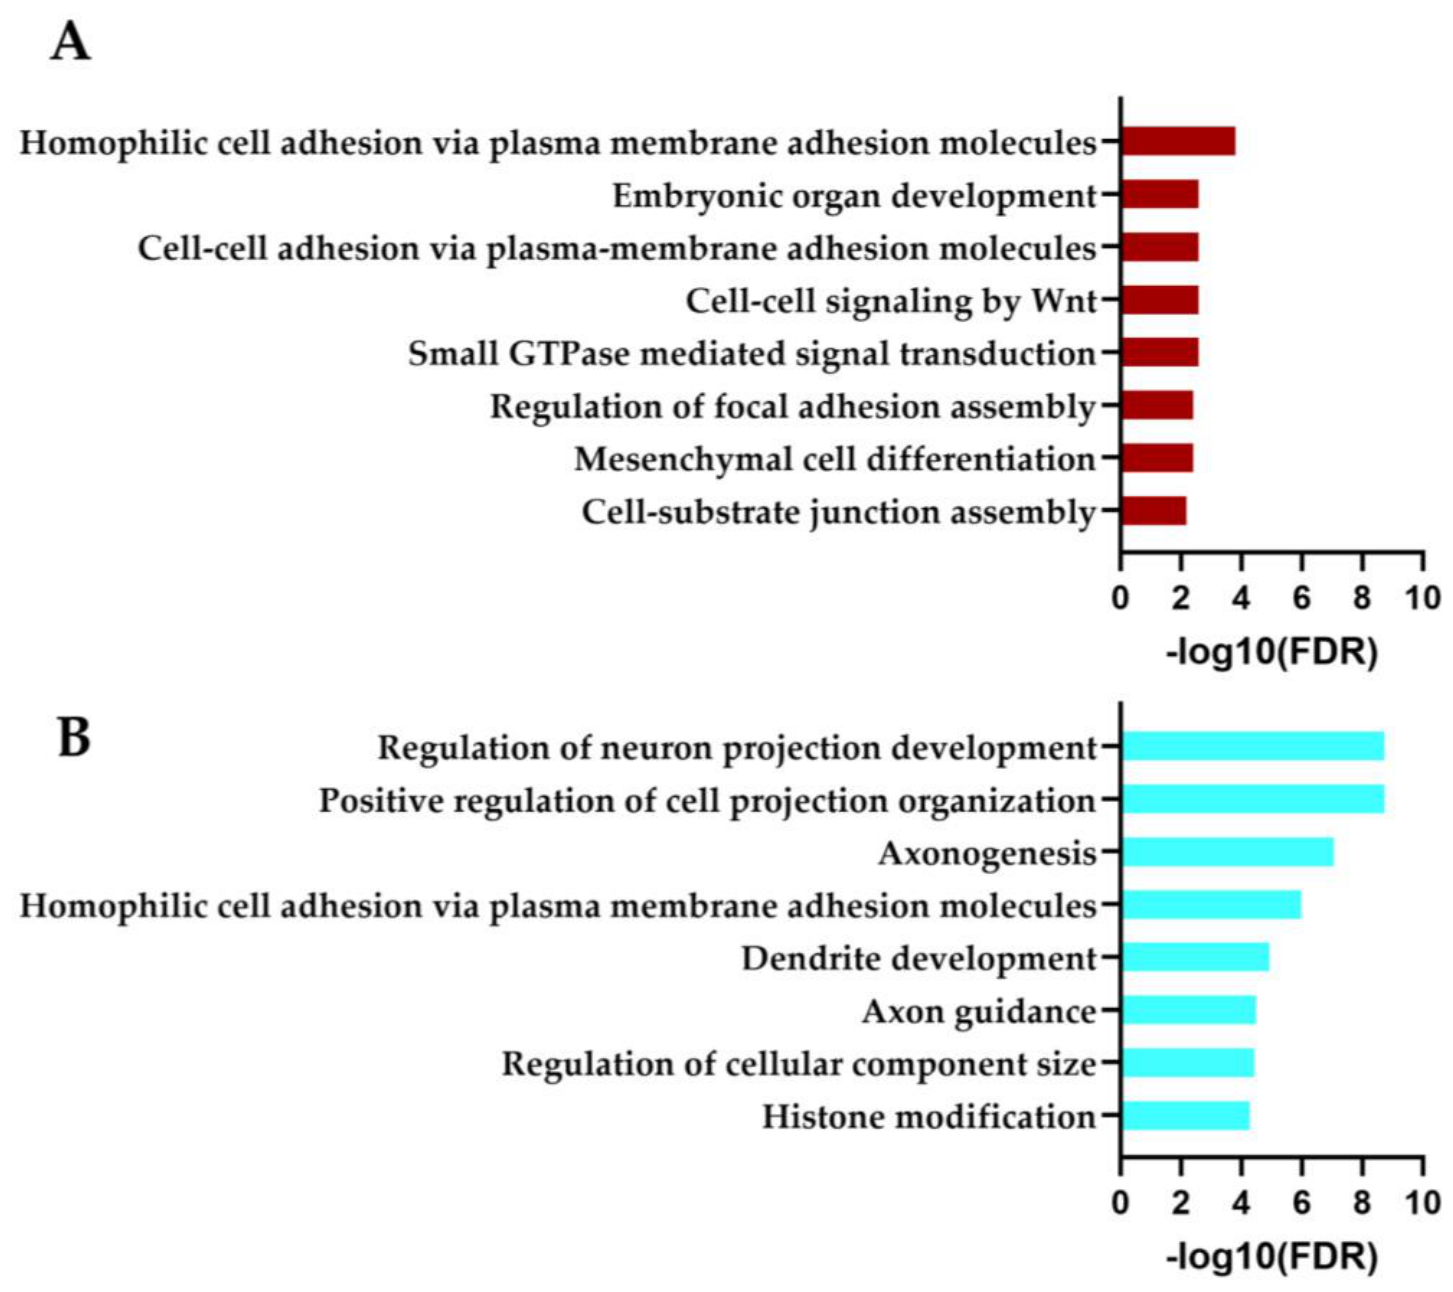
Figure 9.
Kyoto Encyclopedia of Genes and Genomes (KEGG) pathway enrichment analysis of differentially methylated regions in PC3 cells following treatment with Moringa oleifera extract (200 μg/mL) compared with untreated control cells. (A) Top significantly enriched KEGG pathways associated with hypermethylated DMRs. (B) Top significantly enriched KEGG pathways associated with hypomethylated DMRs. Bars represent enrichment significance expressed as -log10(FDR-adjusted P value). Pathways are ranked according to statistical significance.
Figure 9.
Kyoto Encyclopedia of Genes and Genomes (KEGG) pathway enrichment analysis of differentially methylated regions in PC3 cells following treatment with Moringa oleifera extract (200 μg/mL) compared with untreated control cells. (A) Top significantly enriched KEGG pathways associated with hypermethylated DMRs. (B) Top significantly enriched KEGG pathways associated with hypomethylated DMRs. Bars represent enrichment significance expressed as -log10(FDR-adjusted P value). Pathways are ranked according to statistical significance.
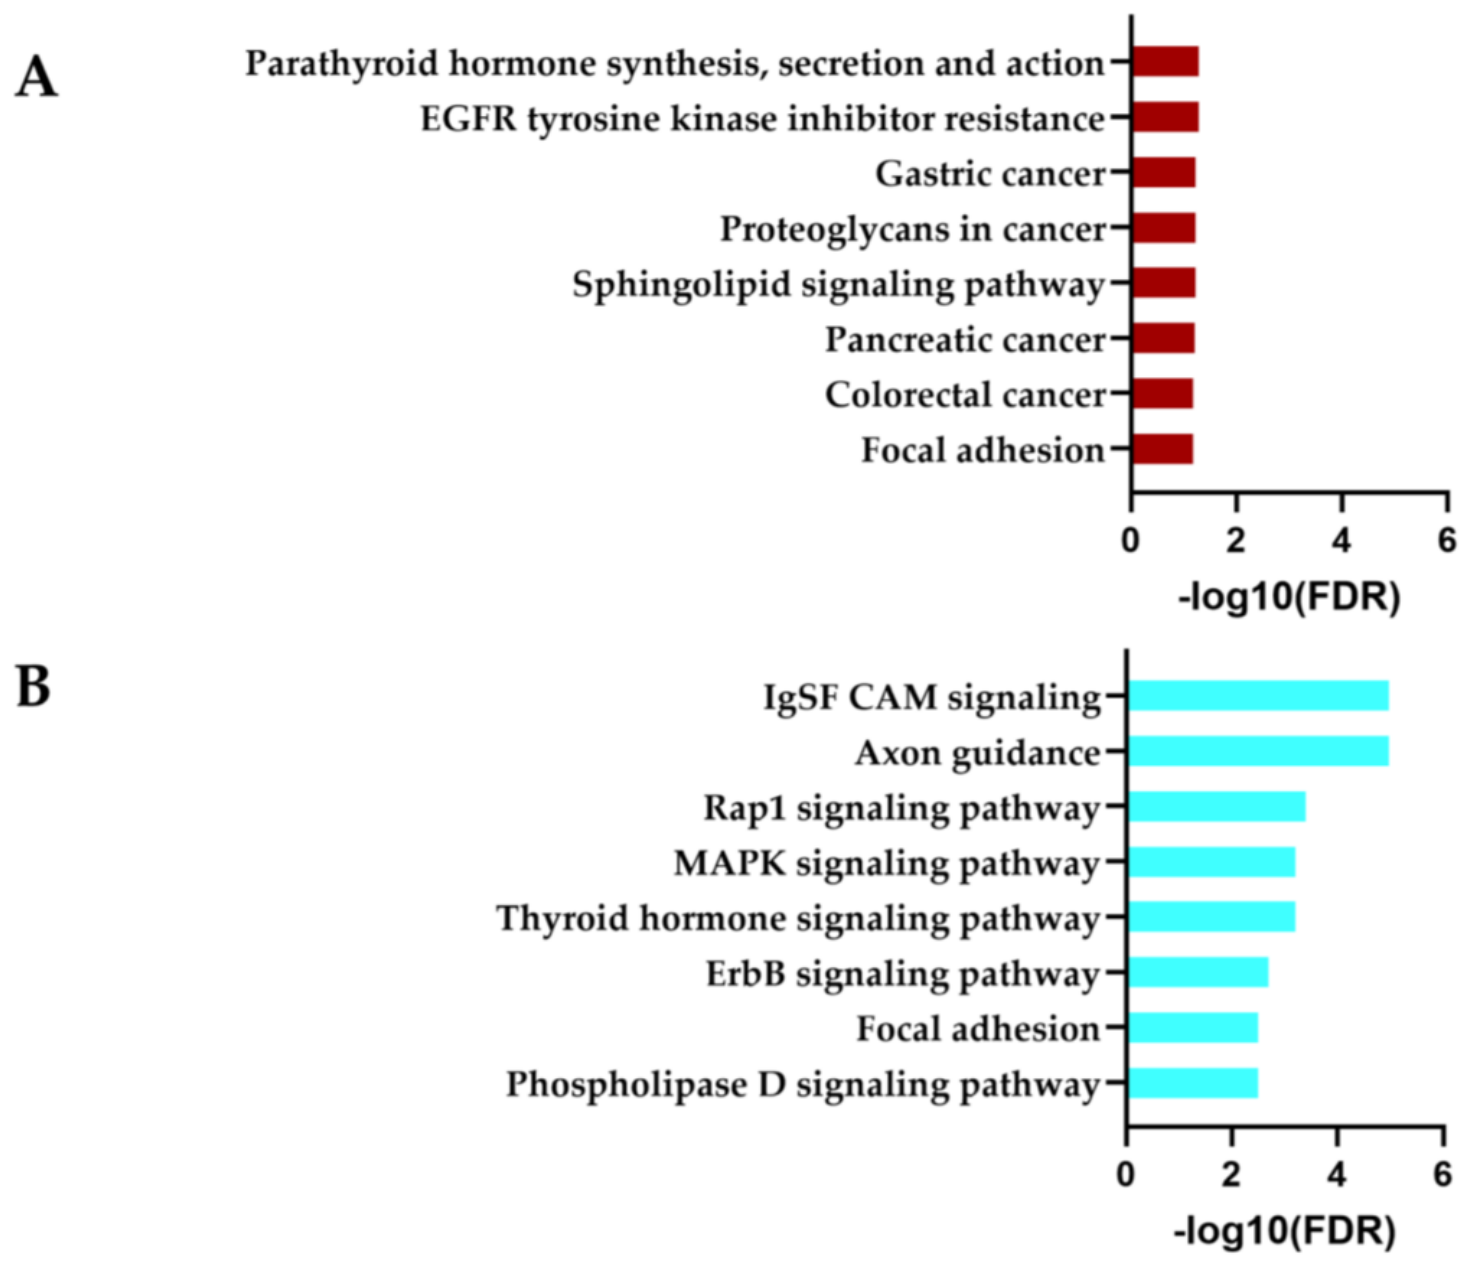
Figure 13.
Integrated directional epigenetic landscape of representative hub genes following Moringa oleifera treatment in PC3 cells. Representative hub genes selected from the integrated GO, KEGG and Reactome enrichment analyses are grouped according to their major functional modules. Each cell indicates the overall methylation direction assigned to each gene in the indicated comparison (Ctrl vs 100 μg/mL MO, Ctrk vs 200 μg/mL MO and 200 μg/mL MO vs 100 μg/mL MO) after integration of the three enrichment databases. Red indicates genes identified only among hypermethylated pathways, blue indicates genes identified only among hypomethylated pathways, white indicates genes not identified, and purple indicates genes identified in both hyper- and hypomethylated enriched pathways, indicating context-dependent epigenetic regulation. The complete list of the 86 integrated hub genes and their database-specific annotations is provided in Table S1.
Figure 13.
Integrated directional epigenetic landscape of representative hub genes following Moringa oleifera treatment in PC3 cells. Representative hub genes selected from the integrated GO, KEGG and Reactome enrichment analyses are grouped according to their major functional modules. Each cell indicates the overall methylation direction assigned to each gene in the indicated comparison (Ctrl vs 100 μg/mL MO, Ctrk vs 200 μg/mL MO and 200 μg/mL MO vs 100 μg/mL MO) after integration of the three enrichment databases. Red indicates genes identified only among hypermethylated pathways, blue indicates genes identified only among hypomethylated pathways, white indicates genes not identified, and purple indicates genes identified in both hyper- and hypomethylated enriched pathways, indicating context-dependent epigenetic regulation. The complete list of the 86 integrated hub genes and their database-specific annotations is provided in Table S1.
Disclaimer/Publisher’s Note: The statements, opinions and data contained in all publications are solely those of the individual author(s) and contributor(s) and not of MDPI and/or the editor(s). MDPI and/or the editor(s) disclaim responsibility for any injury to people or property resulting from any ideas, methods, instructions or products referred to in the content. |
© 2026 by the authors. Licensee MDPI, Basel, Switzerland. This article is an open access article distributed under the terms and conditions of the Creative Commons Attribution (CC BY) license (http://creativecommons.org/licenses/by/4.0/).
Copyright: This open access article is published under a Creative Commons CC BY 4.0 license, which permit the free download, distribution, and reuse, provided that the author and preprint are cited in any reuse.