

Submitted:
18 August 2026
Posted:
20 August 2026
You are already at the latest version
Abstract
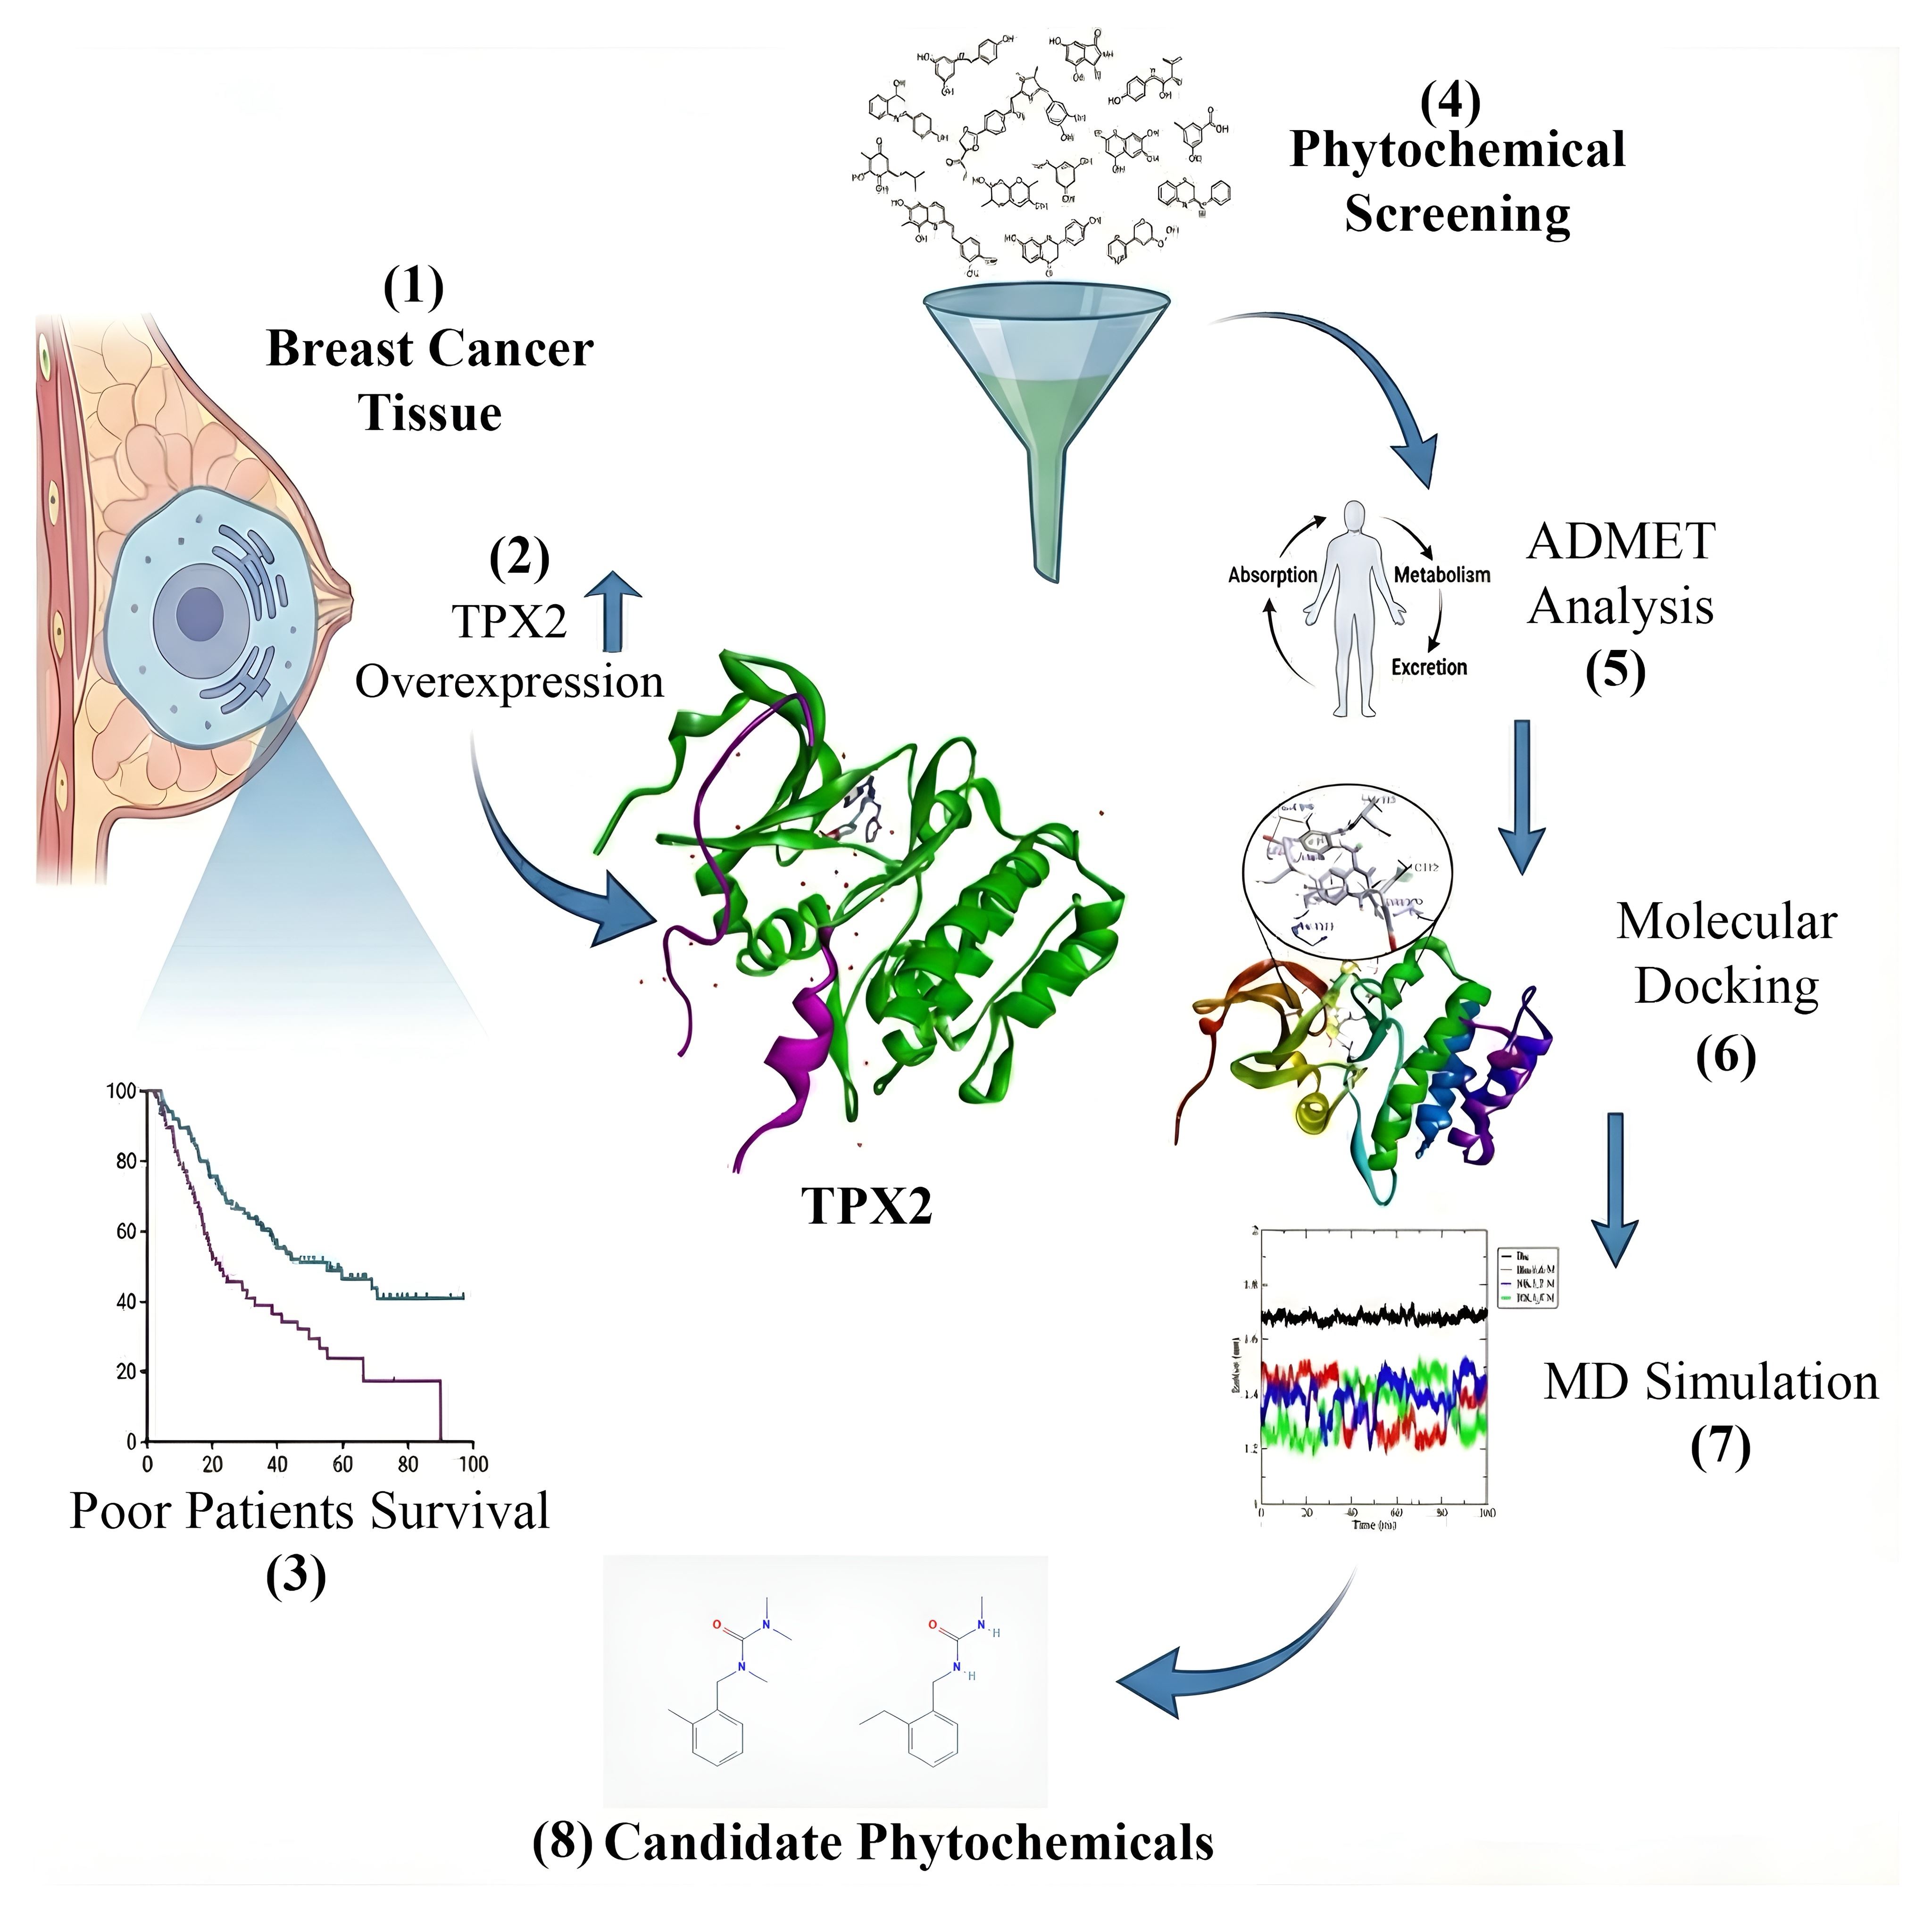
TPX2, a spindle assembly factor encoded by the TPX2 gene, plays a pivotal role in tumor progression and cellular transformation. Overexpression of TPX2 has been widely documented across multiple malignancies, including breast cancer, and is associated with poor clinical outcomes, including increased metastasis, recurrence, and poor prognosis. Functional studies using TPX2-specific siRNA have demonstrated its critical role in cancer cell proliferation, showing that TPX2 knockdown impairs key proteins involved in the G1-to-S phase transition, reduces motility, and limits cellular invasiveness. Moreover, TPX2 depletion has been shown to induce genomic instability in liver cancer cells, resulting in multinucleation and DNA damage, making it a promising therapeutic target in cancer treatment. Bioinformatic tools, including Oncomine, The Cancer Genome Atlas (TCGA), Kaplan-Meier Plotter, and Breast Cancer Gene-Expression Miner, have been employed to elucidate TPX2’s prognostic significance in breast cancer. Additionally, plant-derived secondary metabolites, which contribute to over 60% of anticancer drugs, hold promise as therapeutic agents. However, discovering viable therapeutic compounds through high-throughput screening (HTS) and computer-aided drug design (CADD) remains a challenge. CADD techniques, including pharmacoinformatic, molecular docking, and molecular dynamics (MD) simulations, and MM-PBSA (Molecular Mechanics Poisson-Boltzmann Surface Area) have been instrumental in identifying bioactive compounds. Because TPX2 itself lacks a canonical druggable pocket and acts largely through protein–protein interactions, Aurora kinase A (AURKA)—the mitotic kinase that TPX2 activates and stabilizes—was targeted as the druggable effector of the TPX2–AURKA axis. Computational screening of 61 phytochemicals against Aurora kinase A identified three candidates with high binding affinities. Pharmacokinetic evaluations revealed these compounds met Lipinski's Rule of Five, confirming their drug-likeness. In addition, in silico ADMET (absorption, distribution, metabolism, excretion, and toxicity) profiling demonstrated favorable toxicity profiles for these compounds, a critical factor in early drug development. This study underscores the potential of integrating computational approaches to identify novel therapeutic agents targeting the TPX2–Aurora A axis, providing a promising strategy for developing treatments for breast cancer and other TPX2-associated malignancies.
Keywords:
TPX2
; aurora kinase A
; breast cancer
; biomarker
; CADD
; molecular docking
; molecular dynamics
; phytochemicals
1. Introduction
Breast cancer (BC) is a biologically heterogeneous malignancy and one of the leading causes of cancer-related deaths among women worldwide [1]. Approximately 2.3 million cases in 2020 led to 685,664 deaths across the world [2]. Clinically, BC falls into hormone receptor positive, HER2 positive and triple-negative subtypes, which have their own unique molecular features and treatment options [3]. Even with the development of early detection and management, a significant number of subtypes demonstrate a high level of molecular heterogeneity and resistance to therapy. This underlines the reality of the need to act on genetic targets and precise prognostic biomarkers to enhance patient stratification and clinical outcomes [4].
TPX2 silencing removes tumorigenic and cancer-causing capacity associated with high TPX2 gene expression, as demonstrated by reduced cell proliferation and migration, induced apoptosis, diminished invasive ability, and inhibited in vitro angiogenesis; these effects are linked to the progression, recurrence, and poor prognosis of several human cancers [5]. Mechanistic investigations employing TPX2-specific shRNA have confirmed that TPX2 silencing reproduces these effects specifically in breast cancer models [6,7].
TPX2 is an important controller of mitotic spindles assembly where it interacts with microtubules to maintain the proper assembly of spindle and segregation of chromosomes during mitosis [8]. It regulates the spindle dynamics by activating, stabilizing and recruiting Aurora kinase A (AURKA) to the spindle apparatus which is critical in spindle pole maturation and bipolar spindle assembly [9]. TPX2 expression and activity are constitutively highly controlled in a cell cycle dependent fashion to ensure mitotic fidelity [10]. TPX2 is frequently overexpressed in breast cancer, and its elevated level is also associated with high tumor grade, high metastatic potential, and unfavorable clinical outcome [5]. Dysregulation of the TPX2–AURKA axis contributes to abnormal mitotic progression and oncogenic phenotypes and thus TPX2 serves as a good therapeutic target and prognostic biomarker in aggressive breast tumors [11].
Although the oncogenic and prognostic role of TPX2 in various tumors, including breast cancer, is evident, its clinical applicability has not been well investigated [12]. There are no clinically approved agents that specifically target TPX2, which indicates that it is difficult to drug mitotic spindle related proteins. TPX2 does not exhibit enzymatic activities and the conventional small-molecule inhibitors do not have canonical pockets [13,14]. It functions by means of large-scale protein to protein interactions, particularly with Aurora kinase A and therefore selective pharmacological inhibition is challenging [15]. Due to the important role of TPX2 in cell-cycle regulation, non-selective targeting causes the concern of unacceptable cytotoxicity, and specific therapeutic approaches are needed based on a circumstantial context [16]. These restrictions underscore the necessity of novel modulation methods on TPX2, particularly aggressive breast cancer subtypes.
Since TPX2 does not have a canonical enzymatic pocket, plant-based phytochemicals provide a second therapeutic option. Clinically effective antimitotic agents, which include vinca alkaloids and taxanes, have long been obtained in plants [17], as well as numerous phytochemicals, such as flavonoids and alkaloids, have the ability to affect mitosis by inhibiting tubulin or spindle-associated regulators. It is interesting to note that the Ashwagandha-derived withaferin A interrupts the TPX2-Aurora-A complex resulting in spindle collapse [18]. Fisetin stabilizes microtubules by binding β-tubulin with greater potency than paclitaxel [19] whereas berberine causes microtubule depolymerization and G2/M arrest by binding another site of tubulin [20]. A number of flavonoid compounds also cause G2/M arrest in the breast cancer cells [21]. These data provide the possibility of the phytochemicals to bind the target mitotic protein-protein interfaces and prove the computational docking and virtual screening as scalable methods to find modulators of TPX2-associated pathways [22].
The given research assesses the idea that TPX2 overexpression defines aggressive breast cancer and is a therapeutic vulnerability. Unlike previous studies that primarily describe TPX2 overexpression and prognostic relevance, this study integrates TPX2 multi-omic validation, such as expression patterns, epigenetic regulation, and prognostic interactions, is combined with a structure-directed in silico screen of a set of plant-derived small molecules predicted to inhibit Aurora kinase A, the druggable kinase effector that TPX2 activates within the TPX2–AURKA axis. To the best of our knowledge, no prior study has combined TPX2-centered bioinformatics validation with systematic phytochemical screening, molecular docking, and molecular dynamics simulations in a unified framework for breast cancer. This integrative framework will provide a basis of TPX2–Aurora A axis-directed drug discovery in aggressive breast cancer.
2. Methods
2.1. TPX2 Gene Expression in Human Malignancies
GEPIA2 [23] and GENT2 were used to compare TPX2 mRNA expression between various types of cancers and respective normal tissues [23] and [24]. The analyses of differential expression employ common parameters were used, including |log2FC| cutoff = 1 and p-value < 0.05 for differential expression analysis to have uniformity and comparability across malignancies.
2.2. TPX2 Profiling of Breast Cancer
The expression of breast cancer-specific TPX2 was measured with the UALCAN portal [25] relying on TCGA transcriptomic data. The abundance of the proteins was analyzed at the protein level using immunohistochemistry pictures of Human Protein Atlas [26]. Clinicopathological variables were correlated with expression patterns with p < 0.05 considered statistically significant and included the race of the patient, the tumor subtype, histology, and the presence or absence of TP53 mutation and were tested in UALCAN. Table 3 gives the summary of the results of these stratified analyses.
2.3. Genomic Alterations in TPX2
The interrogation of TPX2 copy number variations, mutations, and structural changes was performed using cBioPortal [27] in four breast cancer cohorts such as:(a) Breast Invasive Carcinoma (TCGA, Cell 2015),(b) Breast Invasive Carcinoma (TCGA, Firehose Legacy),(c) Breast Invasive Carcinoma (TCGA, Nature 2012), and (d) Breast Invasive Carcinoma (TCGA, PanCancer Atlas). Amplification frequencies, deep deletions, and point mutations were visualized, and mutation mapping throughout functional domains were done to provide an idea on probable structural and functional implications.
2.4. Survival Analysis
The Kaplan-Meier Plotter assessed the prognostic associations of the TPX2 expression [28,29]. Expression level has been used to group patients to evaluate overall survival (OS), first progression (FP) and post-progression survival (PPS). The model of cox proportional hazards estimated the effect of TPX2 expression and subgroups accounted tumor differentiation and other clinicopathological measures.
The Kaplan-Meier Plotter was used to assess prognostic relationships of TPX2 expression [28,29]. Patients were classified as high and low-expressions, and survival data were compared on an overall survival (OS), first progression (FP) and post-progression survival (PPS). Further subgroup analysis of OS was done based on the tumor differentiation status. Kaplan-Meier curves were used to visualize survival associations and cox proportional hazards modeling were used to estimate hazard ratios,95% confidence intervals to determine the prognostic implications of TPX2 expression. Every qualified breast cancer case was incorporated regardless of the molecular subtype and correlations with the clinicopathological variables such as tumor grade, HER2 status and clinical stage were then determined.
2.5. Protein and Ligand Preparation
The Aurora kinase A crystal structure (PDB ID: 3HA6; 2.36 Å resolution; chain A of two near-identical chains) was obtained from the Protein Data Bank (Supplementary Figure 3). Optimization was done through the use of Schrodinger Protein Preparation Wizard and structural visualization was done with the help of PyMOL v2.4.1.[30]. A library of 61 phytochemicals (Supplementary Table 1) was curated from the IMPPAT database [31] and PubChem [32]; their structures were obtained in SDF format, energy-minimized, and converted to PDBQT format for docking.
2.6. Pharmacotoxicity and Assessment
SwissADME was used to predict ADME properties based on the Lipinski rule of five that outlines the following aspects of orally bioavailable drugs: ≤500 Da, 0-10 hydrogen bond acceptors (HBAs), 0-5 hydrogen bond donors (HBDs), ≤5 (calculated logP), and 0-10 rotatable bonds [33,34,35], which considered gastrointestinal absorption, lipophilicity, BBB permeability, and solubility. PkCSM was used for toxicity profiling, which comprised mutagenicity, hepatotoxicity, skin sensitization, and acute/chronic toxicity [36].
2.7. Active Site Identification
Mapping of Aurora kinase A binding pockets was done through CASTp 3.0 [37,38,39] which identified residues that were essential in the ligand interactions and informed docking-grid generation. Docking targeted the dominant binding site (area 605.11 Ų, volume 677.34 ų; Supplementary Table 2), with a grid box centered at X = -29.65, Y = 27.72, Z = 9.54 and dimensions 52.05 × 37.35 × 31.70 Å encompassing the active pocket (Supplementary Table 3).
2.8. Molecular Docking
Structure-based virtual screening was performed in PyRx [40], which converts protein and ligand structures into AutoDock Vina-compatible formats [41]. Active-site residues in VinaWizard were covered by docking grids, and affinities of binding were estimated using AutoDock Vina. Complexes of high rank were depicted in BIOVIA Discovery Studio [42].
2.9. Molecular Dynamics Simulations
In silico validation of the highest-affinity Aurora kinase A–ligand complex (PubChem CID 23563160) was performed by molecular dynamics (MD) simulations [43]. The computations of the total potential energy of the system in the simulation were established according to bonded and non-bonded interactions, respectively as the total of force fields in the established molecular mechanics. The potential energies calculated during the simulated time are represented in equation i [44,45].
Where,
ACPYPE (v2022.3.11) was used to assign ligand parameters with the use of GAFF2 and protein parameters with Amber99SB-ILDN force field [46]. Aurora kinase A–ligand complex was solvated in a triclinic box with 1 nm buffer with explicit TIP3P water and neutralized with Cl -ions [47]. The system was then allowed to equilibrate in GROMACS v2024 under NVT and NPT ensembles (100 ps each) at a minimum energy of convergence (less than 10.0 kJ+mol-1) followed by a 100 ns production simulation.
The stability and dynamics of complex were assessed with the help of RMSD and RMSF protein backbone and ligand heavy atoms, radius of gyration, and solvent-accessible surface area. In VMD, it measured protein-ligand hydrogen bonds on geometric criteria, and estimated binding free energies on the trajectory based on MM-PBSA calculations [48,49].
3. Results
3.1. TPX2 Expression Profile Across Different Cancers
Various integrative cancer genomics platforms were interrogated to define the transcriptional topography of TPX2 in malignancies in humans. The GEPIA2 database analysis showed a significant increase in TPX2 in breast cancer when compared to the corresponding normal tissues (Figure 2A). TPX2 was also widely dysregulated in oncogenesis, focusing significantly on 23 different tumor types in which it was overexpressed in 23 tumors and underexpressed in 7 (Figure 2B). There were common patterns in the GENT2 database, showing that there was a significant increase in the expression of TPX2 in various malignancies, and the highest levels were observed in cervical and colorectal cancer. These findings were again supported by pan-cancer analysis on the UALCAN platform which showed that TPX2 was overexpressed in 22 of 24 cancer types studied and down-regulated in only two (Figure 2C). Taken together, these findings highlight the importance of TPX2 as a widely-expressed oncogenic protein in a variety of tissue settings.
On the protein level, immunohistochemical results retrieved at Human Protein Atlas showed a moderate level of staining of TPX2 in normal glandular breast tissue but strong intensity of staining and signal in tumor samples (Figure 2D-E), which indicated an increase in TPX2 protein accumulation in cancerous cells.
3.2. TPX2 Coding and Silencing Levels in Breast Cancer
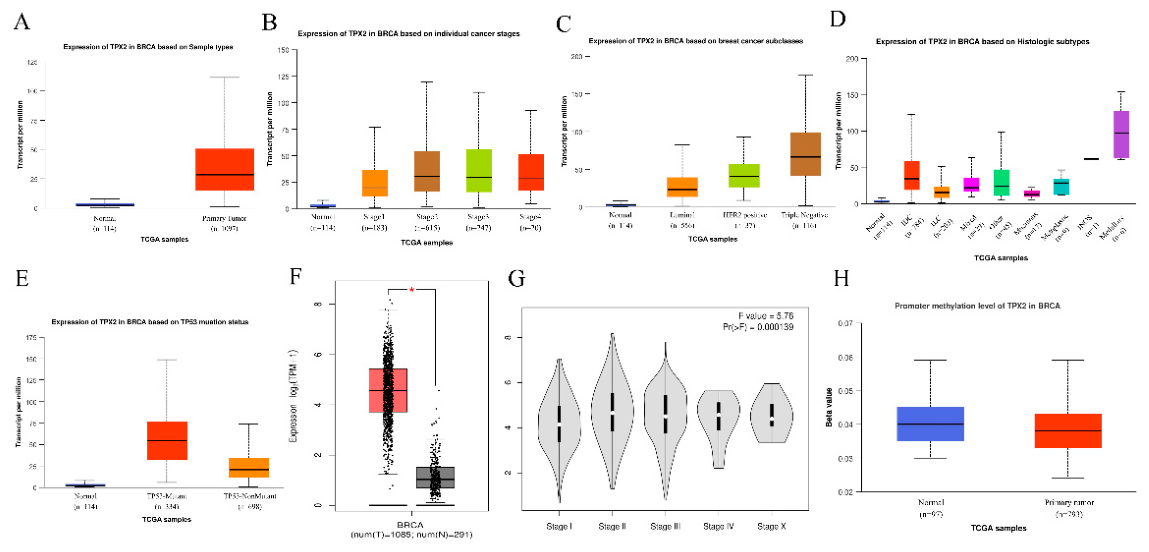
Transcriptomic analysis recorded at UALCAN revealed a very high TPX2 mRNA expression in primary breast tumors as compared to normal breast tissues (Figure 3A). Stratified analyses depicted uniform overexpression among subgroups of patients categorized on race, tumor stage, molecular subtype, histological classification and TP53 mutation (Figure 3B-E). Consistent results were obtained in GEPIA2, which supported an increase in TPX2 in tumor tissues in comparison to normal tissues (Figure 3F) and in an advancing tumor stage (Figure 3G).
The TPX2-specific analysis of DNA methylation showed that TPX2 was differentially regulated in terms of its epigenetics in breast cancer. Beta coefficients, with values between 0 (unmethylated) to 1 (fully methylated), implied that in tumor samples, mainly hypomethylated loci of TPX2 transcription were observed (Figure 3H), which was an indication of transcriptional activation. These results suggest that altered DNA methylation may be associated with TPX2 expression changes in breast cancer; however, this observation is correlative and does not establish a direct mechanistic role of epigenetic deregulation. Further experimental studies are required to clarify whether DNA methylation directly regulates TPX2 overexpression.
Figure 3.
mRNA expression profile in breast cancer. (A-E) Graphs showing expression level analysis of gene in breast cancer using a box plot. (F) Expression of TPX2 gene in breast cancer and normal tissues using the GEPIA2 database shown as a box plot. (G) In this pane, it can be drawn the expression of TPX2 gene in different cancer stages using a box plot. (H)This box plot indicates hypo-methylation pattern of TPX2 gene.
Figure 3.
mRNA expression profile in breast cancer. (A-E) Graphs showing expression level analysis of gene in breast cancer using a box plot. (F) Expression of TPX2 gene in breast cancer and normal tissues using the GEPIA2 database shown as a box plot. (G) In this pane, it can be drawn the expression of TPX2 gene in different cancer stages using a box plot. (H)This box plot indicates hypo-methylation pattern of TPX2 gene.
3.3. Survival Analysis
The Kaplan-Meier Plotter platform was used to examine TPX2 expression as a prognostic factor. The survival analyses showed that patients with a low level of TPX2 expression had a higher overall survival rate in comparison to high TPX2 levels, which had a negative clinical outcome (Supplementary Figure 2). These findings define the TPX2 expression as a negative prognostic factor in breast cancer.
3.4. Protein-Protein Interacting Network Analysis
STRING and GeneMANIA were used to generate the protein-protein interaction (PPI) networks to research the functional interactome of TPX2. The resulting networks disclosed far reaching interactions between the proteins engaging mitotic regulation, spindle assembly and cell-cycle progression (Figure 4A-B). Among the main interacting partners, who are predicted, are AURKA, KIF2C, PRC1, HMMR, DLGAP5, KIF20A, KIF11, UBE2C, KIF4A, and NUSAP1. These interactions are consistent with the established role of TPX2 in mitotic spindle organization and chromosomal segregation, supporting its involvement in proliferative signaling and tumor progression.
3.5. Molecular Docking Analysis
Initial docking against the dehydrated protein structure yielded binding affinities between -9.4 and -10.0 kcal/mol; the top-ranked compounds (Table 1) were re-docked against the hydrated protein model. The comparative analysis showed that water molecules had little effect on binding affinity, supporting the robustness of the ligand-protein interactions.
3.6. Molecular Dynamics Simulation
This transition was supported by the analysis of hydrogen bonds (Figure 6) where the formation of a stable hydrogen bond was observed after about ~32 ns when a ligand started stabilizing around Asp229. Occupancy analysis also demonstrated that Asp229 hydrogen bonded 41.33% of the simulation time, which makes it an important stabilizing residue.
Conversely, the protein backbone did not deviate significantly in conformational change during the trajectory (Supplementary Figure 4A) and the changes in RMSD were mostly confined to the range of ~0.15 nm as compared to the initial structure. The flexibility at the residue level (Supplementary Figure 4B) concentrated mostly on the truncated N- and C-terminal side, meaning that the structured core domain was maintained. Measurements of the radius of gyration (equation ii; Supplementary Figure 5) revealed no significant change in global compactness in spite of slight axis-specific rotational changes, which attested to the global structural stability.
(ii)
Where,
M = = Total mass of protein
Mass of atom i
Position vector of atom i
Center of protein by mass
Number of atoms in protein
The values of solvent-accessible surface area (SASA) ranged narrowly between 97.8 and 115.9 nm² (Supplementary Figure 6) as there were minimal surface rearrangements that were mainly due to terminal flexibility and not due to core destabilization.
MM-PBSA analysis (Figure 7) revealed an early shift in binding free energy at around 30ns, which is temporally correlated with the repositioning of the ligand, and that the shift is stabilized after the engagement of Asp229. The average binding free energy over the production run was -15.18±4.66 kJ/mol, which indicates a modestly favorable interaction; consistent with the ligand’s repositioning, this suggests that the Aurora kinase A core remained stable while the ligand pose itself was not tightly maintained over the trajectory. The ∆G of protein-ligand interaction was calculated based upon the equation iii [1].
3.7. Interpretation of the Protein-Ligand Interaction
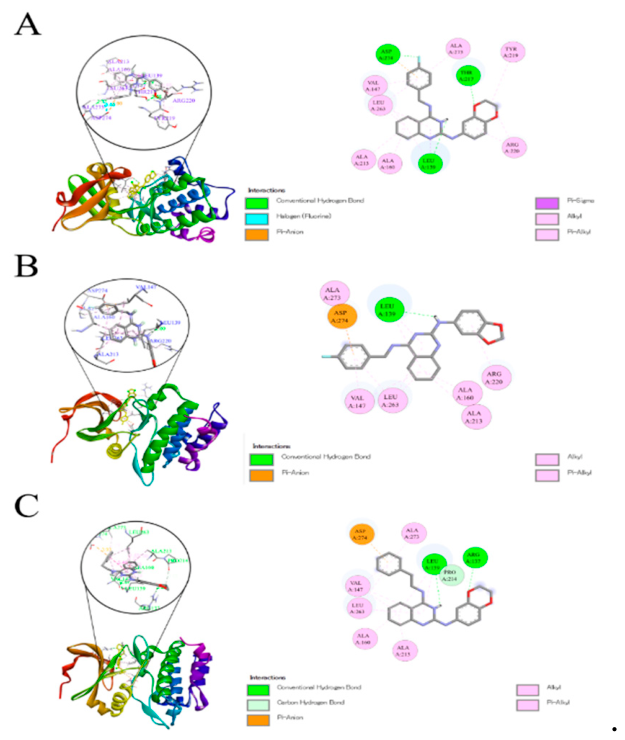
The three best phytochemicals were analyzed in detail in terms of the interactions using BIOVIA Discovery Studio Visualizer. The interaction profiles (Figure 8 and Table 2) showed that there were consistent hydrogen bonding and hydrophobic contacts during the hydrated and dehydrated docking conditions, and so the interactions were stable and not dependent on water.
3.8. Toxicity Prediction
In silico predictions of the ProTox-III server of the selected compounds showed favorable safety properties. The endpoints that were assessed were hepatotoxicity, carcinogenicity, immunotoxicity, mutagenicity, and cytotoxicity. As shown in the results, summed up in Supplementary Table 4, there is some initial evidence that the screened ligands may have drug-likeness and safety potential.
4. Discussion
In developed areas, the rates of incidence of breast cancer are significantly greater than those in the low- and middle-income ones, with the highest incidence reported in Western Europe (~89.7 cases per 100,000), and the lowest one in the regions of Africa (~20 per 100,000) [51,52]. Despite this difference, the mortality rate in high-income conditions (6-19 deaths per 100,000) is relatively lower, which is the outcome of more convenient access to early disease diagnosis, innovative treatment and the more favorable prognosis [52]. Nevertheless, breast cancer remains a leading cause of cancer-related mortality among women globally. Over the recent years, it has become widely evident that mortality has been decreasing in most Western countries, especially in younger females, which is due to population-based screening programs and the development of molecularly targeted therapy based on tumor-specific genomic and proteomic profiling [53,54].
The developing evidence incriminates aberrant overexpression of targeting protein to Xklp2 (TPX2) as an important driving force of breast cancer progression [55]. TPX2 is one of the main regulators of the assembly of the mitotic spindle and cell-cycle progression, and high levels of TPX2 correlate with an enhanced tumor growth, genomic instability and poor clinical prognoses [56]. Regularly, TPX2 overexpression is associated with decreased overall survival in breast cancer individuals, which underpins its application as a prognostic biomarker and a possible treatment goal [55,57]. Focusing on TPX2-dependent pathways may thus contribute to the new knowledge about the pathogenesis of breast cancer and shape the creation of precision-based therapeutic approaches [56]. Consistent with this dependency, our protein–protein interaction analysis identified Aurora kinase A among the most strongly connected TPX2 partners (Figure 4), providing the rationale for targeting AURKA as the druggable effector of the TPX2–AURKA axis.
Computer-aided drug design (CADD) has been used to design efficient and cost-effective platforms that would be used to investigate TPX2–Aurora A axis-targeted therapeutic strategies. By combining virtual screening, molecular docking, ADMET profiling and molecular dynamics simulations, large chemical libraries can be screened rapidly and target-specifically, accelerating lead identification [58,59]. This has been demonstrated to save up to half in the costs of drug development, underscoring its value in contemporary precision drug discovery.
A fundamental part of computer-aided drug design was used to predict ligand-receptor binding modes and affinities and screen a library of natural phytochemicals against Aurora kinase A, the druggable effector of the TPX2–AURKA axis: molecular docking. Out of 61 candidates, three compounds (CID:23563160, CID:23563159 and CID:23521219) were selected due to high predicted binding affinities (-9.4 to -10 kcal/mol). Follow-up pharmacokinetic profiling reported good ADME characteristics, including high gastrointestinal absorption, no predicted blood-brain barrier permeability, and moderate lipophilicity (consensus log P < 5). Every candidate satisfied Lipinski’s rule of five, supporting their oral drug-likeness [60]. Molecular dynamics of the lead complex further showed that, although the initial docked pose relaxed and the principal contact migrated from Leu139 to Asp229, the ligand was retained within the catalytic cleft over the 100 ns trajectory, indicating adaptive re-accommodation rather than dissociation.
Toxicity is a leading reason that drug candidates fail in late-stage development, accounting for approximately 20% of failures [61]. In response to this, in silico toxicity profiling was conducted to determine mutagenicity, organ toxicity and systemic safety of the compounds of interest. All the candidates in the Ames mutagenicity assay [62] were negative and had no risk of skin sensitization or hepatotoxicity predicted [63]. Predictions of acute and chronic toxicity also showed satisfactory safety profiles, and hence may be suitable in future downstream development.
Although TPX2 has been demonstrated as an oncogenic target, it is an undrugged target. In this case, we screen three natural phytochemicals that have the possibility of inhibiting Aurora kinase A, the effector kinase activated by TPX2, thus disrupting the TPX2–AURKA axis and inhibiting tumor progression. The prioritization of these candidates was based on an integrated computational pipeline that included the molecular docking, ADMET profiling, molecular dynamics simulations and MM-PBSA calculations. We also acknowledge two limitations. First, the phytochemicals were docked into the catalytic pocket of Aurora kinase A and are therefore predicted to act as inhibitors of the kinase downstream of the TPX2–AURKA axis, rather than as direct disruptors of the TPX2–Aurora A binding interface. Second, the study lacks experimental validation. Future in vitro and in vivo studies are essential to confirm the biological activity of the identified compounds and their interaction with Aurora kinase A
5. Conclusion
This paper defines TPX2 as a well-overexpressed protein in breast cancer and a predictor of poor clinical outcome, which highlights its dual role as a prognostic biomarker and a therapeutic vulnerability. Integrative multi-omics interrogation in combination with survival modeling showed a consistent association between increased TPX2 levels and decreased overall survival, which underpins its role in disease progression and clinical aggressiveness.
With the help of a structure-directed computational model, we have screened phytochemical libraries in an orderly way to find potential Aurora kinase A inhibitors acting on the TPX2–AURKA axis. Sequential molecular docking, pharmacokinetic and toxicity profiling together with molecular dynamics simulations led to three natural compounds with high binding affinity and favorable ADMET profiles; molecular dynamics of the lead compound (CID 23563160) showed that the Aurora kinase A core remained stable, although the ligand repositioned within the catalytic cleft. Such results suggest natural derived small molecules as potential lead compounds for further investigation into the rational generation of TPX2–Aurora A axis-targeted therapeutics.
Altogether, our findings offer a translational framework on how to treat TPX2 in aggressive breast cancer subtypes, especially those are resistant to available treatments. Though experimental validation of cellular and in vivo models is indispensable, this study provides an exploratory computational framework, and the proposed compounds require further experimental validation before being considered as therapeutic agents
Supplementary Materials
The following supporting information can be downloaded at the website of this paper posted on Preprints.org.
Author Contributions
F.A.N., M.I. and S.A.Z. conceptualized, method structuralized, research analyzed and wrote the main manuscript. M.M.U.S. and R.A.J. help to visualization of figures. M.A., F.M.J., M.K.M.U., S.S. and M.J.I. supervised the research, revised and finalized the draft manuscript. .
Funding
This study received partial funding from ATF-HEAT project under UGC and Bangladesh.
Institutional Review Board Statement
Not applicable (this study did not involve humans or animals).
Informed Consent Statement
Not applicable.
Data Availability Statement
All data analyzed in this study were obtained from publicly available databases (GEPIA2, GENT2, UALCAN, cBioPortal, Kaplan–Meier Plotter, IMPPAT, PubChem, and the RCSB Protein Data Bank); all other data are contained within the article and its Supplementary Materials.
Conflicts of Interest
The authors declare no conflict of interest.
References
- M. Zou et al., “Knockdown of CAVEOLIN-1 sensitizes human basal-like triple-negative breast cancer cells to radiation,” Cellular Physiology and Biochemistry, vol. 44, no. 2, pp. 778–791, 2017.
- G. Edwards and A. Richards, “Breast Cancer,” in Treatment of Cancer, Boca Raton: CRC Press, 2025, pp. 91–121. doi: . [CrossRef]
- Ananthula et al., “Abstract P4-07-21: Neo-adjuvant chemotherapy in various breast cancer subtypes in the 21st century,” Cancer Res., vol. 83, no. 5_Supplement, pp. P4-07-21-P4-07–21, Mar. 2023. [CrossRef]
- Toss and M. Cristofanilli, “Molecular characterization and targeted therapeutic approaches in breast cancer,” Breast Cancer Research, vol. 17, no. 1, p. 60, Apr. 2015. [CrossRef]
- D. R. Matson et al., “High nuclear TPX2 expression correlates with TP53 mutation and poor clinical behavior in a large breast cancer cohort, but is not an independent predictor of chromosomal instability,” BMC Cancer, vol. 21, no. 1, p. 186, Dec. 2021. [CrossRef]
- M. Chen et al., “Targeting TPX2 suppresses proliferation and promotes apoptosis via repression of the PI3k/AKT/P21 signaling pathway and activation of p53 pathway in breast cancer,” Biochem. Biophys. Res. Commun., vol. 507, no. 1–4, pp. 74–82, Dec. 2018. [CrossRef]
- T. Wang, F. Zhang, and P. Zhang, “Role of the TPX2/NCOA5 axis in regulating proliferation, migration, invasion and angiogenesis of breast cancer cells,” Exp. Ther. Med., vol. 25, no. 6, p. 304, May 2023. [CrossRef]
- T. A. Reid et al., “Suppression of microtubule assembly kinetics by the mitotic protein TPX2,” J. Cell Sci., vol. 129, no. 7, pp. 1319–1328, Apr. 2016. [CrossRef]
- T. A. Kufer, H. H. W. Silljé, R. Körner, O. J. Gruss, P. Meraldi, and E. A. Nigg, “Human TPX2 is required for targeting Aurora-A kinase to the spindle,” J. Cell Biol., vol. 158, no. 4, pp. 617–623, Aug. 2002. [CrossRef]
- T. Wittmann, M. Wilm, E. Karsenti, and I. Vernos, “Tpx2, a Novel Xenopus Map Involved in Spindle Pole Organization,” J. Cell Biol., vol. 149, no. 7, pp. 1405–1418, Jun. 2000. [CrossRef]
- F. Polverino, A. Mastrangelo, and G. Guarguaglini, “Contribution of AurkA/TPX2 Overexpression to Chromosomal Imbalances and Cancer,” Cells, vol. 13, no. 16, p. 1397, Aug. 2024. [CrossRef]
- T. Shao, X. Jiang, G. Bao, C. Li, and C. Guo, “Comprehensive Analysis of the Oncogenic Role of Targeting Protein for Xklp2 (TPX2) in Human Malignancies,” Dis. Markers, vol. 2022, pp. 1–13, Oct. 2022. [CrossRef]
- F. Abdel-Magid, “Allosteric Modulators: An Emerging Concept in Drug Discovery,” ACS Med. Chem. Lett., vol. 6, no. 2, pp. 104–107, Feb. 2015. [CrossRef]
- P. A. Eyers and J. L. Maller, “Regulation of Xenopus Aurora A Activation by TPX2,” Journal of Biological Chemistry, vol. 279, no. 10, pp. 9008–9015, Mar. 2004. [CrossRef]
- M. Giubettini et al., “Control of Aurora-A stability through interaction with TPX2,” J. Cell Sci., vol. 124, no. 1, pp. 113–122, Jan. 2011. [CrossRef]
- Perez de Castro and M. Malumbres, “Mitotic Stress and Chromosomal Instability in Cancer: The Case for TPX2,” Genes Cancer, vol. 3, no. 11–12, pp. 721–730, Nov. 2012. [CrossRef]
- R. K. Paier et al., “Natural products as new antimitotic compounds for anticancer drug development,” Clinics, vol. 73, p. e813s, 2018. [CrossRef]
- Grover et al., “Ashwagandha Derived Withanone Targets TPX2-Aurora A Complex: Computational and Experimental Evidence to its Anticancer Activity,” PLoS One, vol. 7, no. 1, p. e30890, Jan. 2012. [CrossRef]
- E. Mukhtar, V. M. Adhami, M. Sechi, and H. Mukhtar, “Dietary flavonoid fisetin binds to β-tubulin and disrupts microtubule dynamics in prostate cancer cells,” Cancer Lett., vol. 367, no. 2, pp. 173–183, Oct. 2015. [CrossRef]
- Raghav, S. M. Ashraf, L. Mohan, and K. Rathinasamy, “Berberine Induces Toxicity in HeLa Cells through Perturbation of Microtubule Polymerization by Binding to Tubulin at a Unique Site,” Biochemistry, vol. 56, no. 20, pp. 2594–2611, May 2017. [CrossRef]
- H.-W. Zhang et al., “Flavonoids inhibit cell proliferation and induce apoptosis and autophagy through downregulation of PI3Kγ mediated PI3K/AKT/mTOR/p70S6K/ULK signaling pathway in human breast cancer cells,” Sci. Rep., vol. 8, no. 1, p. 11255, Jul. 2018. [CrossRef]
- Gan, X. Jia, S. Fan, S. Wang, W. Jing, and X. Wei, “Virtual screening and molecular dynamics simulation to identify potential SARS-CoV-2 3CLpro inhibitors from a natural product compounds library,” Acta Virol., vol. 67, Dec. 2023. [CrossRef]
- Z. Tang, B. Kang, C. Li, T. Chen, and Z. Zhang, “GEPIA2: an enhanced web server for large-scale expression profiling and interactive analysis,” Nucleic Acids Res., vol. 47, no. W1, pp. W556–W560, 2019.
- S.-J. Park, B.-H. Yoon, S.-K. Kim, and S.-Y. Kim, “GENT2: an updated gene expression database for normal and tumor tissues,” BMC Med. Genomics, vol. 12, no. Suppl 5, p. 101, 2019.
- S. Chandrashekar et al., “UALCAN: a portal for facilitating tumor subgroup gene expression and survival analyses,” Neoplasia, vol. 19, no. 8, pp. 649–658, 2017.
- R. Edgar, M. Domrachev, and A. E. Lash, “Gene Expression Omnibus: NCBI gene expression and hybridization array data repository,” Nucleic Acids Res., vol. 30, no. 1, pp. 207–210, 2002.
- Gao et al., “Integrative analysis of complex cancer genomics and clinical profiles using the cBioPortal,” Sci. Signal., vol. 6, no. 269, pp. pl1–pl1, 2013.
- M. K. Goel, P. Khanna, and J. Kishore, “Understanding survival analysis: Kaplan-Meier estimate,” Int. J. Ayurveda Res., vol. 1, no. 4, p. 274, 2010.
- M. Szász et al., “Cross-validation of survival associated biomarkers in gastric cancer using transcriptomic data of 1,065 patients,” Oncotarget, vol. 7, no. 31, p. 49322, 2016.
- M. A. Lill and M. L. Danielson, “Computer-aided drug design platform using PyMOL,” J. Comput. Aided. Mol. Des., vol. 25, pp. 13–19, 2011.
- M. Goldman et al., “The UCSC Xena platform for public and private cancer genomics data visualization and interpretation. bioRxiv, 326470,” 2019.
- S. Kim et al., “PubChem in 2021: new data content and improved web interfaces,” Nucleic Acids Res., vol. 49, no. D1, pp. D1388–D1395, 2021.
- C. A. Lipinski, F. Lombardo, B. W. Dominy, and P. J. Feeney, “Experimental and computational approaches to estimate solubility and permeability in drug discovery and development settings,” Adv. Drug Deliv. Rev., vol. 64, pp. 4–17, 2012.
- C. Palleria et al., “Pharmacokinetic drug-drug interaction and their implication in clinical management,” J. Res. Med. Sci., vol. 18, no. 7, p. 601, 2013.
- Daina, O. Michielin, and V. Zoete, “SwissADME: a free web tool to evaluate pharmacokinetics, drug-likeness and medicinal chemistry friendliness of small molecules,” Sci. Rep., vol. 7, no. 1, p. 42717, 2017.
- D. E. V Pires, T. L. Blundell, and D. B. Ascher, “pkCSM: predicting small-molecule pharmacokinetic and toxicity properties using graph-based signatures,” J. Med. Chem., vol. 58, no. 9, pp. 4066–4072, 2015.
- M. A. Bhuiyan et al., “Discovery of Potential Compounds Against Nipah Virus: A Molecular Docking and Dynamics Simulation Approaches,” 2022.
- Ahammad et al., “Pharmacoinformatics and molecular dynamics simulation-based phytochemical screening of neem plant (Azadiractha indica) against human cancer by targeting MCM7 protein,” Brief. Bioinform., vol. 22, no. 5, p. bbab098, 2021.
- W. Tian, C. Chen, X. Lei, J. Zhao, and J. Liang, “CASTp 3.0: computed atlas of surface topography of proteins,” Nucleic Acids Res., vol. 46, no. W1, pp. W363–W367, 2018.
- S. Dallakyan and A. J. Olson, “Small-molecule library screening by docking with PyRx,” Chemical biology: methods and protocols, pp. 243–250, 2015.
- Ahammad and F. A. A. Fuad, “The in silico identification of potent natural bioactive anti-dengue agents by targeting the human hexokinase 2 enzyme,” in Proceedings of the 5th International Electronic Conference on Medicinal Chemistry, Basel, Switzerland, 2019, pp. 1–30.
- T. A. Bouback et al., “Pharmacophore-based virtual screening, quantum mechanics calculations, and molecular dynamics simulation approaches identified potential natural antiviral drug candidates against MERS-CoV S1-NTD,” Molecules, vol. 26, no. 16, p. 4961, 2021.
- D. Frenkel and B. Smit, Understanding molecular simulation: from algorithms to applications. Elsevier, 2023.
- V. Hornak, R. Abel, A. Okur, B. Strockbine, A. Roitberg, and C. Simmerling, “Comparison of multiple Amber force fields and development of improved protein backbone parameters,” Proteins: Structure, Function, and Bioinformatics, vol. 65, no. 3, pp. 712–725, 2006.
- Lindorff-Larsen et al., “Improved side-chain torsion potentials for the Amber ff99SB protein force field,” Proteins: Structure, Function, and Bioinformatics, vol. 78, no. 8, pp. 1950–1958, 2010.
- X. He, V. H. Man, W. Yang, T.-S. Lee, and J. Wang, “A fast and high-quality charge model for the next generation general AMBER force field,” J. Chem. Phys., vol. 153, no. 11, 2020.
- P. Mark and L. Nilsson, “Structure and dynamics of the TIP3P, SPC, and SPC/E water models at 298 K,” Journal of Physical Chemistry A, vol. 105, no. 43, pp. 9954–9960, Nov. 2001. [CrossRef]
- W. Humphrey, A. Dalke, and K. Schulten, “VMD: visual molecular dynamics,” J. Mol. Graph., vol. 14, no. 1, pp. 33–38, 1996.
- F. Eisenhaber, P. Lijnzaad, P. Argos, C. Sander, and M. Scharf, “The double cubic lattice method: Efficient approaches to numerical integration of surface area and volume and to dot surface contouring of molecular assemblies,” J. Comput. Chem., vol. 16, no. 3, pp. 273–284, 1995.
- Gohlke and D. A. Case, “Converging free energy estimates: MM-PB (GB) SA studies on the protein–protein complex Ras–Raf,” J. Comput. Chem., vol. 25, no. 2, pp. 238–250, 2004.
- R. L. Siegel, K. D. Miller, N. S. Wagle, and A. Jemal, “Cancer statistics, 2023.,” CA Cancer J. Clin., vol. 73, no. 1, 2023.
- Sung et al., “Global cancer statistics 2020: GLOBOCAN estimates of incidence and mortality worldwide for 36 cancers in 185 countries,” CA Cancer J. Clin., vol. 71, no. 3, pp. 209–249, 2021.
- E. B. C. T. C. Group, “Effects of chemotherapy and hormonal therapy for early breast cancer on recurrence and 15-year survival: an overview of the randomised trials,” The Lancet, vol. 365, no. 9472, pp. 1687–1717, 2005.
- J. Higgins and J. Baselga, “Targeted therapies for breast cancer,” J. Clin. Invest., vol. 121, no. 10, pp. 3797–3803, 2011.
- Gu, J. Zhang, H. Chen, and S. Wang, “TPX2 promotes glioma cell proliferation and invasion via activation of the AKT signaling pathway,” Oncol. Lett., vol. 12, no. 6, pp. 5015–5022, 2016.
- G. Neumayer, C. Belzil, O. J. Gruss, and M. D. Nguyen, “TPX2: of spindle assembly, DNA damage response, and cancer,” Cellular and Molecular Life Sciences, vol. 71, no. 16, pp. 3027–3047, 2014.
- X. Yang et al., “TPX2 overexpression in medullary thyroid carcinoma mediates TT cell proliferation,” Pathology & Oncology Research, vol. 20, no. 3, pp. 641–648, 2014.
- E. Lionta, G. Spyrou, D. K Vassilatis, and Z. Cournia, “Structure-based virtual screening for drug discovery: principles, applications and recent advances,” Curr. Top. Med. Chem., vol. 14, no. 16, pp. 1923–1938, 2014.
- P. Hughes, S. Rees, S. B. Kalindjian, and K. L. Philpott, “Principles of early drug discovery,” Br. J. Pharmacol., vol. 162, no. 6, pp. 1239–1249, 2011.
- C. A. Lipinski, F. Lombardo, B. W. Dominy, and P. J. Feeney, “Experimental and computational approaches to estimate solubility and permeability in drug discovery and development settings,” Adv. Drug Deliv. Rev., vol. 64, pp. 4–17, 2012.
- Kola and J. Landis, “Can the pharmaceutical industry reduce attrition rates?,” Nat. Rev. Drug Discov., vol. 3, no. 8, pp. 711–716, 2004.
- D. E. V Pires, T. L. Blundell, and D. B. Ascher, “pkCSM: predicting small-molecule pharmacokinetic and toxicity properties using graph-based signatures,” J. Med. Chem., vol. 58, no. 9, pp. 4066–4072, 2015.
- for E. C. and Development, “Guidance document for the reporting of defined approaches and individual information sources to be used within integrated approaches to testing and assessment (IATA) for skin sensitisation,” OECD Environment, Health and Safety Publications: Series on Testing & Assessment, No. 256, 2016.
Figure 2.
(A) Expression of TPX2 mRNA in different cancers and their healthy tissue using GEPIA2. The GEPIA2 server, where mRNA expression is dot plotted with 33 different types of cancer tissue and normal tissue. Here, each dot expresses a sample dataset and the abbreviations: BRCA= BReast CAncer gene (Tumor Sample =1085 & Normal Sample= 291). (B) The GENT2, server where the blue box represents normal tissue and the red box represents cancer tissue, and the dataset represents of TPX2 mRNA expression. The box represents the media. (The reader is directed to the article’s online version for an explanation of the color references in this figure legend.) (Cancer Sample= 5574 and Normal Sample = 475). (C) Expression of TPX2 across various TCGA cancer data with tumor (red) and normal samples (Blue) was depicted as boxplots. The top and bottom quartiles, which represent the upper and lower bounds of the average expression, are shown by the dashed lines and values within the box. Figure (D-E) Using immunohistochemistry data, representative protein expression of TPX2 in normal tissue (glandular cell) and breast cancer (tumor cell). Here, normalized transcripts per million (nTPM).
Figure 2.
(A) Expression of TPX2 mRNA in different cancers and their healthy tissue using GEPIA2. The GEPIA2 server, where mRNA expression is dot plotted with 33 different types of cancer tissue and normal tissue. Here, each dot expresses a sample dataset and the abbreviations: BRCA= BReast CAncer gene (Tumor Sample =1085 & Normal Sample= 291). (B) The GENT2, server where the blue box represents normal tissue and the red box represents cancer tissue, and the dataset represents of TPX2 mRNA expression. The box represents the media. (The reader is directed to the article’s online version for an explanation of the color references in this figure legend.) (Cancer Sample= 5574 and Normal Sample = 475). (C) Expression of TPX2 across various TCGA cancer data with tumor (red) and normal samples (Blue) was depicted as boxplots. The top and bottom quartiles, which represent the upper and lower bounds of the average expression, are shown by the dashed lines and values within the box. Figure (D-E) Using immunohistochemistry data, representative protein expression of TPX2 in normal tissue (glandular cell) and breast cancer (tumor cell). Here, normalized transcripts per million (nTPM).
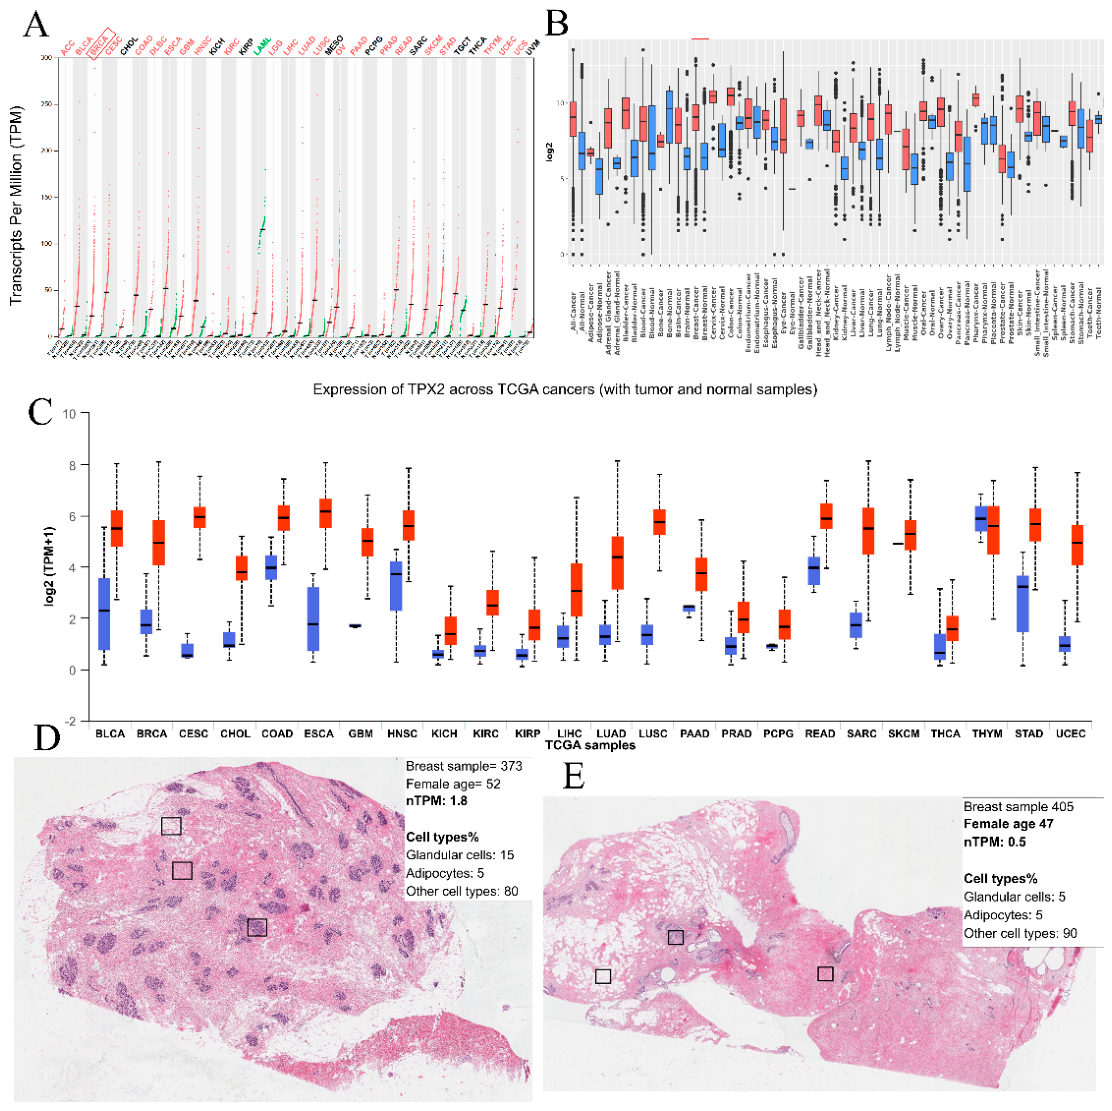
Figure 4.
Interaction and co-occurrence of functional protein partners of TPX2. (A, B) Predicted protein–protein interaction networks of TPX2 derived from the GeneMANIA and STRING databases. The depicted circles represent nodes. Anticipated functional partners are presented after the evaluation of co-expression, co-localization, genetic relationships, pathways, physical interactions, and projected common protein domains.
Figure 4.
Interaction and co-occurrence of functional protein partners of TPX2. (A, B) Predicted protein–protein interaction networks of TPX2 derived from the GeneMANIA and STRING databases. The depicted circles represent nodes. Anticipated functional partners are presented after the evaluation of co-expression, co-localization, genetic relationships, pathways, physical interactions, and projected common protein domains.
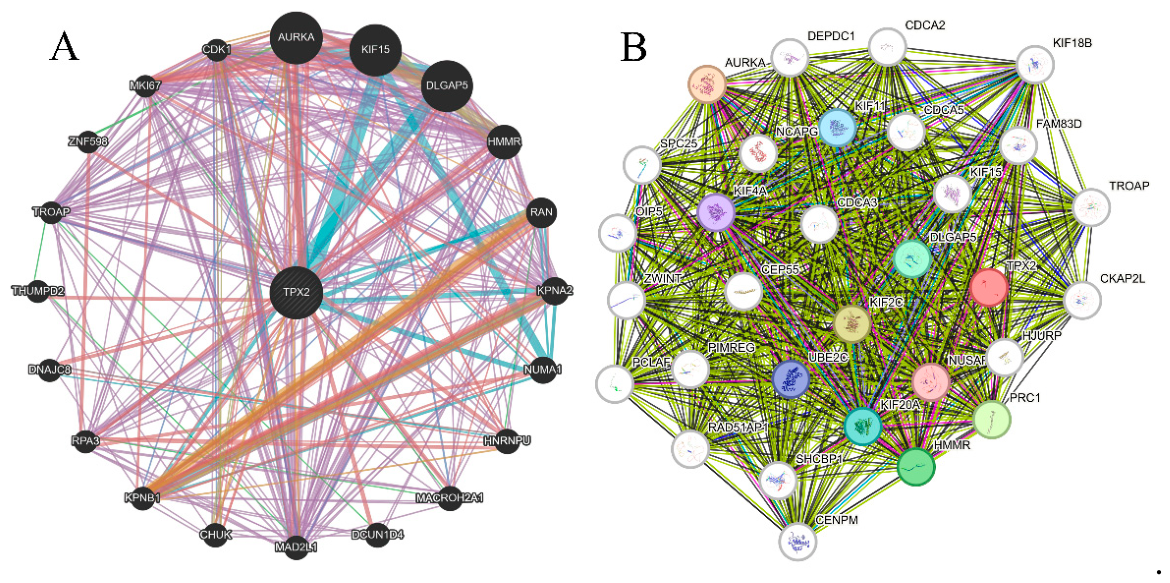
Figure 5.
RMSD of ligand heavy atoms with respect to protein backbone. A. The RMSD of ligand reveals that ligand is changing binding position from around Leu139 (B) to Asp229 (C).
Figure 5.
RMSD of ligand heavy atoms with respect to protein backbone. A. The RMSD of ligand reveals that ligand is changing binding position from around Leu139 (B) to Asp229 (C).
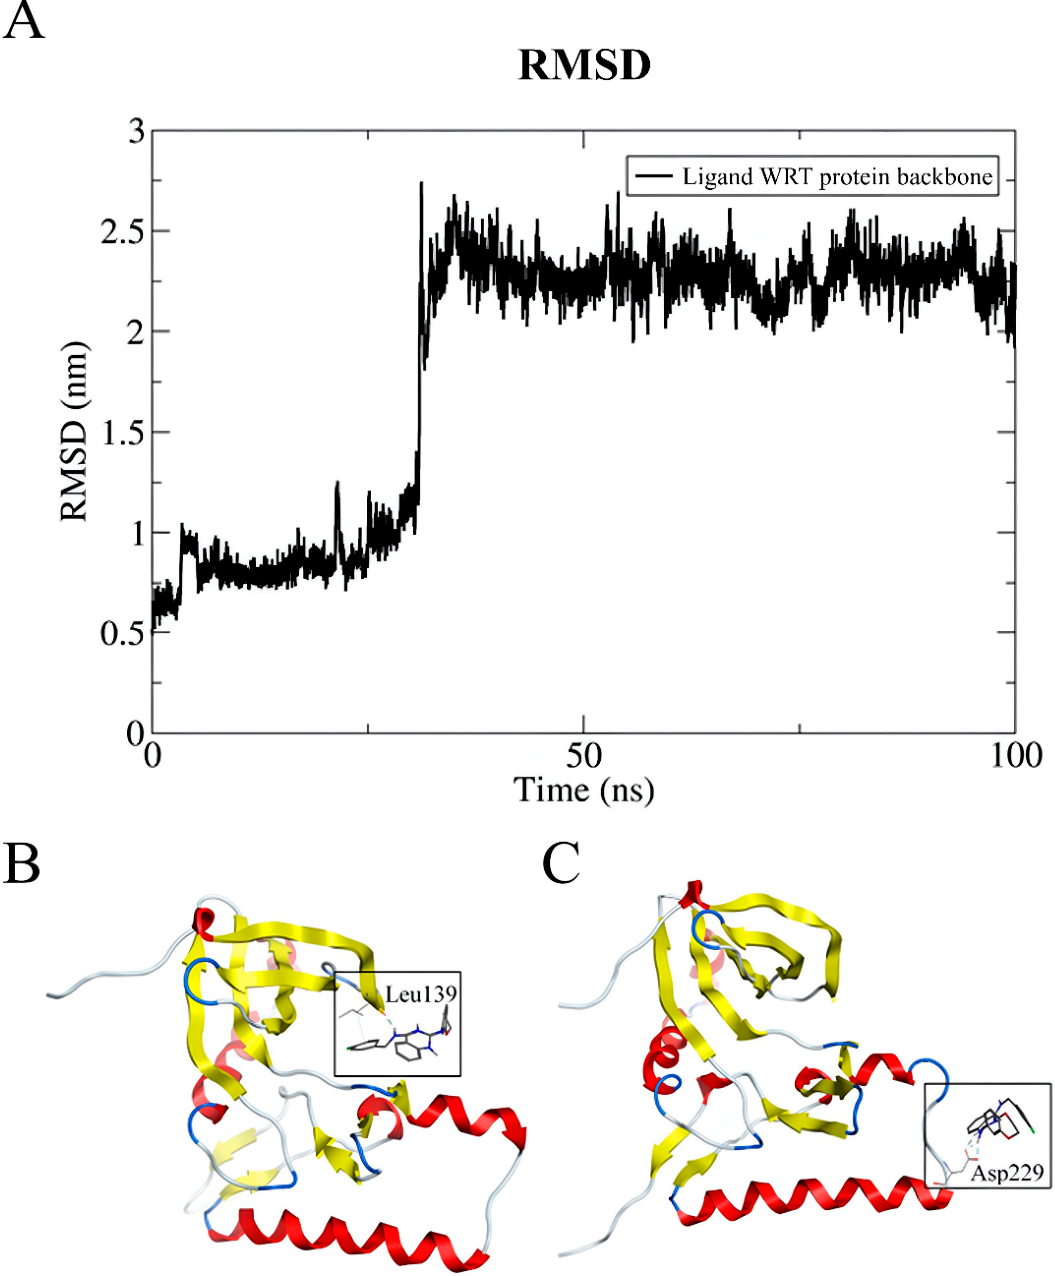
Figure 6.
Represents the hydrogen bonds between protein and ligand molecule during MD simulation. A. Represents the number of hydrogen bonds between protein and ligand molecules at each step in MD simulation. B. Represents the percentage of simulation runtime that each residue contributed to hydrogen bond interaction with ligand.
Figure 6.
Represents the hydrogen bonds between protein and ligand molecule during MD simulation. A. Represents the number of hydrogen bonds between protein and ligand molecules at each step in MD simulation. B. Represents the percentage of simulation runtime that each residue contributed to hydrogen bond interaction with ligand.
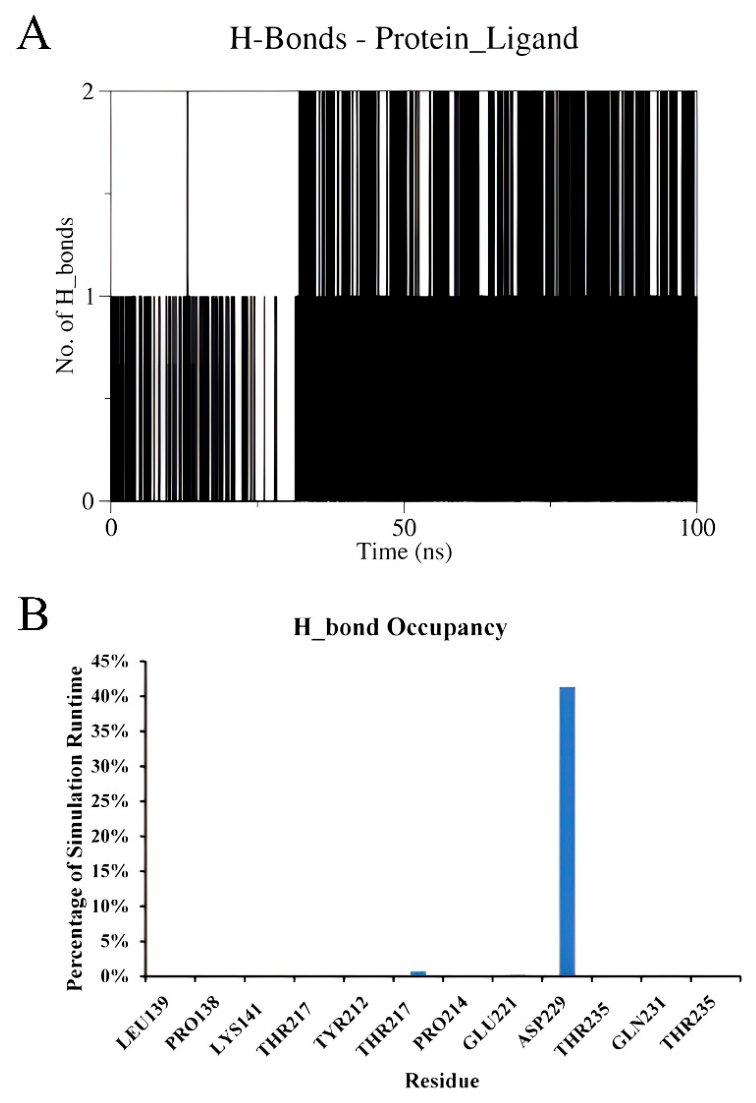
Figure 7.
Interaction energy of protein and ligand calculated by MM-PBSA as a function of time. .
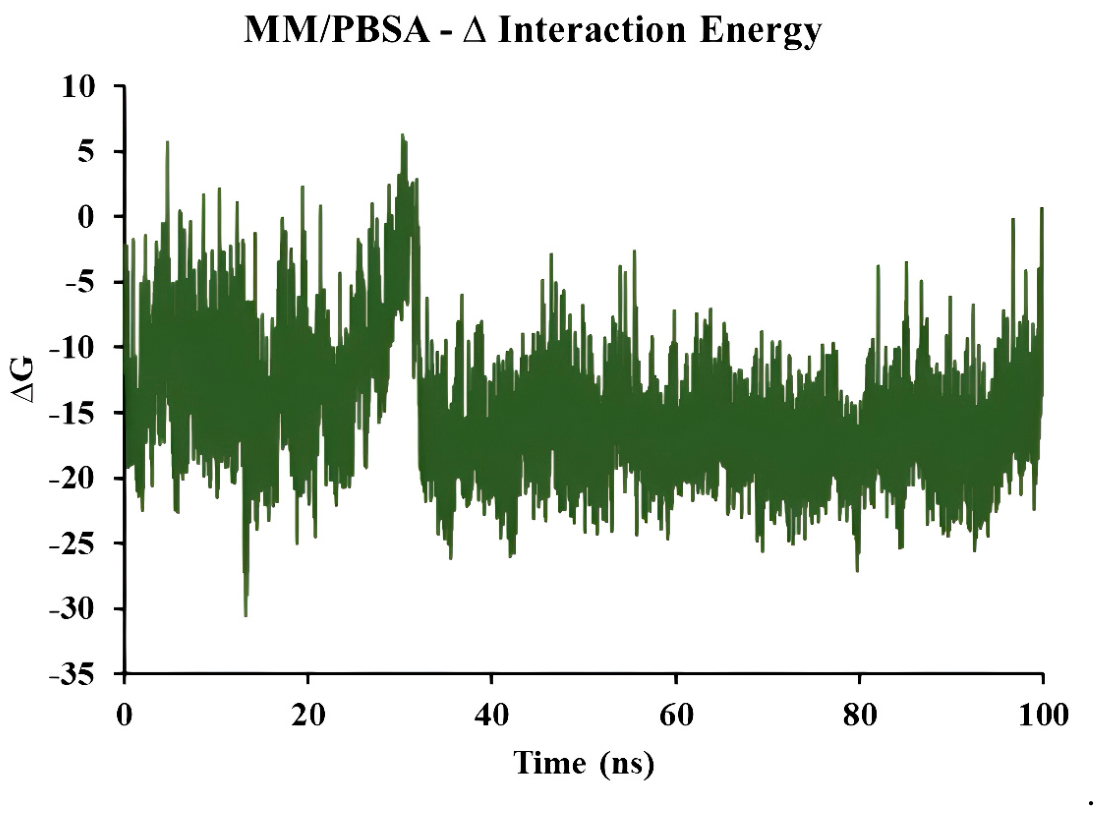
Figure 8.
Protein-Ligand Interaction with 3d and 2d structure of A) CID:23563160. B) 23563159. and C) CID:23521219.
Figure 8.
Protein-Ligand Interaction with 3d and 2d structure of A) CID:23563160. B) 23563159. and C) CID:23521219.
Disclaimer/Publisher’s Note: The statements, opinions and data contained in all publications are solely those of the individual author(s) and contributor(s) and not of MDPI and/or the editor(s). MDPI and/or the editor(s) disclaim responsibility for any injury to people or property resulting from any ideas, methods, instructions or products referred to in the content. |
© 2026 by the authors. Licensee MDPI, Basel, Switzerland. This article is an open access article distributed under the terms and conditions of the Creative Commons Attribution (CC BY) license (http://creativecommons.org/licenses/by/4.0/).
Copyright: This open access article is published under a Creative Commons CC BY 4.0 license, which permit the free download, distribution, and reuse, provided that the author and preprint are cited in any reuse.