

Submitted:
17 August 2026
Posted:
20 August 2026
You are already at the latest version
Abstract
Hand-arm-vibration (HAV) exposure harms the health of drill-operators. To find associated effects of HAV on workers’ skin and core body temperature, this study was conducted on 100 drill-operators, following ISO-5349 guidelines. Root-mean-square (rms) and time-weighted-frequency of HAV were calculated. Ingestible thermometric pills were used for core-body temperature measure-ments. Electronic thermometers were used for monitoring of skin temperature. 73.2% workers had white-finger-syndrome, and 90% reported tingling in right hand. The mean value for the frequency-weighted rms acceleration was 7.07 m/s², with standard deviation (SD) of 0.24 m/s². For vibration dose value, the mean value was 3.99 m/s2 with SD 0.52. Multivariate analysis of pre- and post-shift measurements of core-body and skin temperature proves effect of vi-bration exposure on skin temperature (reduces) and core body temperature (in-creases). Core body temperature rose from 37°C (98.6°F) to 38.5°C (101.3°F). Skin temperature dropped to ~34.0°C from ~36.4°C. Having established a rela-tion between HAV exposure and changes in physiological temperature of human body, the study adds a new dimension for the intervention to safe drill operators of all industries.
Keywords:
hand-arm-vibration-exposure
; drill operators
; vibration dose value
; skin and core body temperature
1. Introduction
The construction industry causes ergonomic disorders, at large. Since it involves performance of tasks both manually and mechanically, exposure to musculoskeletal disorders (MSD) and vibration are very common [1]. The exposure to vibration can be either whole-body-vibration (WBV) or hand-arm-vibration (HAV). Both are interlinked and have associated effects of MSDs, heart health, rise in core body and skin temperatures, and high blood pressure [2]. In construction activities, HAV is the most prevailing ergonomic disorder, induced by vibratory tools. Common among these tools are chipping hammers, jack hammers, and drill machines [2]. Without use of these tools, constructional activities cannot be completed. This paper presents a study on workers’ exposure to HAV from drill operations, and the associated effects on core body temperature and skin temperature.
The human body is a homoeothermic body which gets thermo-signals (through homeocutaneous signals) from skin to stabilize core body temperature [3]. Skin is an important organ for thermoregulation. The temperature of skin depends upon the level of blood circulation and the functioning of autonomic nervous system [4]. Exposure to Hand-Arm-Vibration tools is found to be associated with fluctuation in skin temperature, hence with core body temperature. Some studies find no effect of HAV on skin temperature [5], whereas some establish a strong association [6], and some rule out any possibility of this kind of effect [7]. Likewise, the HAV exposure can also be a reason of change in skin and core-body temperature. Some studies find the role of ambient environment in causing a rise in body temperature of HAV exposed workers [8]. However, no significant studies were found focusing on the role of HAV exposure in destabilizing skin temperature. Hence this study is focused on measuring the level of HAV exposure and its impact on skin and core body temperatures. Increased core body and skin temperatures lead to other health issues (e.g., skin rashes, poor digestion, dehydration, heat stroke, over sweating etc.).
To assess hand-arm-vibration exposure, the International Organization for Standardization, 2001 offers two methods; ISO 5349:2001 parts 1 and 2. ISO 5349:2001 part 1 encodes a detailed method to obtain daily exposure action values (EAVs) and exposure limit values (ELVs). In this part 1, the vibration energy is measured as acceleration in meters per second squared (m s−2) and expressed as the root mean square (RMS). As described in ISO 5349.2001 part 1, the vibration exposure is calculated as a time weighted average over an 8 hour working day. Another method by ISO is 5349 part 2. It describes a method for measurement in the holistic environment of workplace. This method for exposure measurements typically focuses on work steps under certain conditions and measures the different levels of effective exposure during the standard working hours. It guides to fix a measurement meter on the tool handle (on handle of drill machine in our case), using a firm attachment with studded clamps or glue and the tool handle should be held in a firm grip by the operator during measurement. Hand-attached accelerometers are discouraged to use because of the measurement inaccuracy owing to a possible loose hand attachment.
For the measurement of hand-arm-vibration (HAV) exposure, measurements are taken along all three axes (i.e., x-axis, y-axis, and z-axis) [9]. Exposure is monitored as A (8), and is calculated as from the root-mean-square value of weighted acceleration in three axes. Formulae are available to standardize the measurements to an 8h/day shift. Steps are mentioned in the methodology section. Since the drill machines inflict shocks at highly dangerous levels making the operators’ health more vulnerable, the calculation of vibration dose value (VDV) is also helpful to assess the risk prevailing among drill operators [10]. From the guidelines 5349-1, the limit values are of two types. First, the exposure limit value (ELV) is 5 m/s2 [11]. It is the measurement of intensity (magnitude) of vibration, hence expressed as acceleration in meters per second squared. Second, the exposure action value (EAV) is 2.5m/s2 [11]. It is the value at which action to restrict exposure is required. The American Conference of Governmental Industrial Hygienists (ACGIH) holds the similar standard values for both ELV and EAV.
Research Questions
- What is the prevailing level of exposure to HAV among drill machine operators in the construction industry?
- What are the immediate responses of skin and core body temperatures fluctuations for workers exposed to hand-arm-vibration.
2. Methodology
2.1. Selection of Participants
This experimental study was initiated by a walk-through survey to analyze general working conditions, risk of vibration exposure, willingness to participate in study, and to frame inclusion/exclusion criterion. To set an equal baseline for the study, we included only workers having experience of drill operation between 5 to 10 years, maximum age 35, residing on construction sites, no diagnosis/symptoms of kidney, neurotic, acoustic, visionary, skin or cardiorespiratory disorders.
Approval of the Study from Bioethical Committee
These study protocols were approved by Bioethics Committee of University of the Punjab, Pakistan, with reference number 489/BEC/PU, dated 24 October 2021. Complying with the guidelines of the committee, informed consent from workers to participate in the study was obtained before the formal start of study.
Following the selected inclusion/exclusion criteria guidelines, a total of 100 drill machine operators were selected from 10 commercial building construction sites (plazas and residential apartment buildings). We have recorded the duly signed consent forms of all these workers.
2.2. Measurement of Vibrational Exposure Conditions
Measurement Setup
We carried out vibration measurements on drill operators, using Atlas Copco BBC16W jackleg drill machine. The specifications of this drill machine, as described by the manufacturer, are that it has a vibration magnitude of 16.6 m s−2, an impact frequency of 39 Hz, and a weight of 28.5 kg (Atlas Copco, 2017–2019). During the measurements, its rod length was 160 cm and a tapered chisel drill bit of 24 mm diameter. A total of 23 measurement cycles of 15 second duration were performed with six consecutive measurement cycles on each worker. For each worker, vibration measurements were taken every 15 seconds for a total of 23 measurements over the 6-hour average work shift. The sum of all these measurements was calculated by obtaining root mean square value (RMSV). The 15-s measurement duration is used in many studies and recommended to ensure uninterrupted drilling during each measurement cycle. During the measurements, we asked each worker to drill a horizontal hole in a wall with a jackleg drill machine. This is their routine work task and requires no guidelines on how to perform it. All workers drilled holes in the same area on the same rock face.
We arranged this quasi-experimental study in which workers were asked to perform the drilling task in vertical and horizontal drilling orientation. For HAV exposure measurements, we used a six-channel vibration meter, Svantek 106 (Svantek, Warszawa, Poland). The selected accelerometer met all requirements of ISO 8041-1:2017 (International Organization for Standardization, 2017) and was calibrated before use, according to the manufacturer’s protocol. The accelerometer was of the triaxial accelerometer type which measure in three axes simultaneously (x, y, and z axes). The sum RMS value from the three axes was calculated by the software program Supervisor (Svantek, Warszawa, Poland). The accelerometer was fixed firmly to the handle of the drill machine with help of heavy-duty tape in x-axis for horizontal measurements and y-axis for vertical measurements. To eschew any chance of unwanted movement between handle and accelerometer during work performance, the attachment of the tool was checked by applying manual pressure in all directions.
Operators’ exposure to HAV was measured in compliance with ISO 5349-1 guidelines which suggest that the effect of multidirectional vibration should be calculated by evaluating vector sum of the three (x,y,z) orthogonal axes [12]. Thus, frequency-weighted root mean square (rms) acceleration (A (8) for 8-hours) was measured along three orthogonal axes and compared with the ISO-guidelines 5349-1Health Guidance Caution Zone (HGCZ). The frequency-weighted rms acceleration values (aw) in three orthogonal axis were obtained with help of equation 1- given as under;
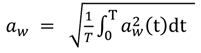
Here aw = frequency-weighted rms acceleration in m s-2, aw (t) = frequency-weighted rms acceleration at time t in m s-2, T = measurement duration for 23 measurements.
According to BS6472: 1992 standard, the formula for VDV (vibration dose value) is
Also, another way to calculate estimated vibration dose value (VDV)s for a given time period (i.e., 8 hrs/day) is by using the following (3) equation.:
where eVDV is the VDV estimate in [m/s1.75], a(rms) is the RMS acceleration (denoted also with ahv), in [m/s2], t is the total exposure time, in [s].
eVDV =1.4× a(rms)×t 0.25 s
Calculation of A(8)
The exposure value of rms -A(8) was calculated using equation 2.
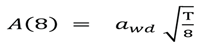
Here A(8) = daily frequency-weighted rms acceleration in m s-2, awd = frequency-weighted rms acceleration along dominant axis in m s-2, aw = frequency-weighted rms acceleration in m s-2, T = measurement duration.
2.3. Monitoring of Rise in Core Body Temperature
To monitor rise in core body temperature, we provided ingestible thermometric pill (Vital- senseTM, Respironics, Bend, Oregon) to the participants, to be taken 2 hours before starting the shift. This pill is a 1.6 gram, 23 mm long, and 8.6 mm in diameter medical-grade capsule. Its utility and validity are reported by many studies Since these pills measures core temperature every 15 seconds, we fixed a sensor electronic module (SEM) to the waist of each worker, to keep record of every reading from the pill. A Sensor Electronic Module (Model EQ-02-SEM-012, manufactured by AD Instruments, New South Wales, Australia) is a small (78 mm × 53 mm × 10 mm) safe and water-resistant device weighing 38 grams. It was strapped to the body and recorded readings of core body temperature from start to end of the shift, as recommended in several other studies.
2.3.1. Rise in Heart Rate and Blood Pressure
To monitor the physiological response to vibration exposure, we calculated fluctuation in participants’ heart rate and blood pressure. We took readings before the start of shift and at the end of shift, using a portable digital meter (GALA X model TD-3124). For measurement, the meter’s cuff (filled with air) was placed on the left arm of each worker, and values were displayed on its screen.
2.3.2. Measurement of Skin Temperature
Electronic thermometers (The BRAUN IRT-3020 thermometer) were used for monitoring of skin temperature on the forehead surface only. The only objective was to measure immediate (soon after starting the task performance) effect of vibration on skin temperature. This is the first limitation of our study that we could not monitor temperature fluctuation in various parts of the body, relying on studies [4,13,14] which endorse that only forehead temperature monitoring is sufficient for assessment of the entire body’s temperature response. Also, another limitation in this connection is we could not take environmental temperature into account.
2.4. Use of Self-Administered Questionnaire
To collect data on workers’ demographic traits, self-reporting on musculoskeletal disorders, and other heat related illnesses, we used a general questionnaire. Before starting to get answers from workers, we measured height and weight of each worker and coded in his respective questionnaire.
2.5. Statistical Analysis
We used the statistical package for social science version 25 IBM, for analysis of data obtained. We drew tables, charts and graphs of the analyzed results depending upon the nature of variables (continuous/categorical). For independent variables, we performed Bivariate Logistic Regression Analysis (BLRA) and obtained respective crude odd ratios (CORs). Then, depending upon the results obtained, we performed MNOVA for only significant variables. For the association between independent and dependent variables, we calculated odd ratios and adjusted odd ratios with CI 95%. The p-value was set equal to α, where α < 0.05, for the determination of significance.
3. Results
3.1. Respondents’ Basic Anthropogenic and Occupational Factors
The mean value of age was 27 years depicting a young workforce. Their BMI was moderate, 23.59 (kg/m2). During their 8-hour work shift, workers spent 6 hours on the drill operation.
Workers were asked about nature of work they usually perform after shift, with options of heavy = 1, light = 0. The majority response was light hence the mean value obtained was 0.
To check the prevalence of Hand-Arm-Vibration syndromes among drill operators, we calculated the percentage of workers reporting different symptoms related to HAV exposure (Table 1). The highest reporting was for the discomfort in upper back (98.7% of workers). And the least reported was for the loose hand grip (60.6% workers).
From Table 2, we get the mean and median values for the frequency-weighted rms acceleration. These are 7.07 m/s² and 1.15 m/s², respectively. Such large difference between the mean and median is because a few high values significantly raised the mean. Whereas, the SD of 0.24 m/s² suggests that there is relatively little variation in these measurements, meaning most workers have similar exposure levels. For Vibration Dose Value (VDV), the mean is 3.99 m/s2 and median is 3.23 m/s2. The SD for VDV is larger than that of rms, highlighting considerable variation in level of exposure drill operators.
3.2. Effect of Vibration Exposure on Workers’ Skin and Core Body Temperature
Figure 1A represents the relationship between HAV exposure (values obtained from vibration meter) and the changes in skin temperature (values obtained from electronic thermometer) before and after drill operation shift.
The graphical lines in figure 1-A illustrate the relationship between: pre-shift skin temperature (blue line) and post-shift skin temperature (red line), and vibration exposure (green line). Time points T1 to T23 are time spots of vibration measurement (with duration of 15 seconds, as described in the methodology section). Pre-shift skin temperature is the skin temperature before the start of the drill operation. Post-shift skin temperature is the skin temperature after exposure to vibration by operating the drill machine. The graph shows pre-shift skin temperature decreases gradually with vibration exposure, indicating that the skin temperature drops after exposure to vibration. Vibration exposure is the independent variable, and the graph shows a clear inverse relationship between vibration exposure and post-shift skin temperature. Skin temperature drops from ~36.4 °C to ~34.0 °C.
Figure 1B describes the effect of HAV exposure on core body and skin temperature among drill machine operators. Here the image shows a graph that plots temperature (in degrees Celsius) over time points (of vibration measurements) labeled as T1 onwards to T23. The temperature data shows both increasing and decreasing fluctuations throughout the time intervals. The temperature fluctuates between approximately 34.4 °C and 36.8°C. The y-axis marks this range, indicating the temperature variation over time. There is a linear trend line with the equation y = 0.0093x + 35.629y = 0.0093x + 35.629y = 0.0093x + 35.629, which suggests a slight overall increase in temperature over the time points (x). The slope of the line (0.0093) indicates a gradual increase in temperature, although the actual data points show significant fluctuations around this line. Pre-shift core body temperature (blue line) remains stable at 37 °C (98.6 °F). No significant changes are observed. Post-shift core body temperature (red line): increases gradually with vibration exposure. Temperature rises from 37 °C (98.6 °F) to 38.5°C (101.3 °F).
3.3. MANOVA Analysis of the Relationship Between Vibration Exposure for Change in Skin Temperature and Core Body Temperature
MANOVA (Multivariate Analysis of Variance) is a statistical technique used to examine the relationship between multiple dependent variables and one or more independent variables. In this case, the MANOVA analysis examine the effect of vibration exposure on both skin temperature and core body temperature. For the analysis, dependent variables are Skin Temperature (ST) and Core Body Temperature (CBT), whereas the independent variable is Vibration Exposure (VE). The analysis (Table 3) reveals a significant multivariate effect of vibration exposure on both skin temperature and core body temperature (p < 0.001). As a univariate effect, vibration exposure has a significant effect on skin temperature (p < 0.01). Also, vibration exposure has a significant effect on core body temperature (p < 0.001). No significant interaction effects were found between vibration exposure and skin temperature or core body temperature.
The graphs in Figure 2 illustrates the results of a MANOVA (Multivariate Analysis of Variance) analysis on the effect of vibration exposure on skin temperature and core body temperature. Vibration exposure is along x-axis, and change in skin and core body temperature is along y-axis. Skin temperature (red line) increases gradually with vibration exposure rises from 34 °C to 34.4 °C (90 °F to 93 °F). Core body temperature (green line) increases more steeply with vibration exposure rises from 37 °C to 39 °C (98.6 °F to 102.2 °F). Effects of vibration exposure on skin temperature and core body temperature are independent of each other.
In pre-shift vs. post-shift comparison (Table 4), the average core body temperature before the shift is 98.202 °F, while after the shift, it increases to 100.804 °F. This indicates a significant rise in core body temperature during the shift, with the post-shift temperature being approximately 2.6 °F higher than the pre-shift temperature. The standard errors are 1.642 before the shift and 1.490 after the shift, suggesting that the measurements are relatively consistent within each period. The 95% confidence intervals for the pre-shift (94.933 to 101.471) and post-shift (100.508 to 101.100) temperatures show that we can be 95% confident that the true mean temperatures lie within these intervals. The intervals for the post-shift temperature are narrower, reflecting more precise estimation.
Again, in Table 4, the mean stress level before the shift is 97.889 with a very high standard error of 15.092, indicating considerable variability and less precision in these measurements. In contrast, the stress level after the shift is 97.804 with a much lower standard error of 1.86, suggesting that measurements are more precise and consistent post-shift. The wide confidence interval for stress before the shift versus the narrow interval after the shift suggests that stress levels are more variable before the shift and more consistent after the shift. This might imply that the stress measurement is more stable or uniform during the shift period.
There is variability in core body temperature across different levels of vibration exposure. For instance, at lower vibration exposure levels (5.00, 5.20), the core body temperature is relatively stable and close to 98.500 °F, while at higher vibration exposure levels (6.00), it drops significantly to 92.427 °F. The standard errors and confidence intervals vary across the different vibration levels. Lower vibration exposure levels show higher standard errors and wider confidence intervals, indicating greater variability and less precision. Higher vibration levels tend to have lower standard errors and narrower confidence intervals, though the temperature measurements themselves vary widely.
4. Discussion
Based on the research questions, we collected data to analyze prevalence of HAV exposure and the associated health effects among drill operators in the construction industry. Various demographic and occupational information were extracted from the data obtained. The mean and standard deviation for each variable depicted the central tendency and variability within this sample. The mean age of the workers was 27 years, with a standard deviation of 6.12 years. This suggests that the workforce is relatively young, with most individuals between 21 and 33 years old. The low variability in age indicates a fairly homogeneous group in terms of this characteristic. Mean value of Body Mass Index (BMI) was 23.59 kg/m², which is within the normal weight range according to World Health Organization (WHO) standards [15]. Also, the standard deviation of 3.15 for BMI indicates that most workers' BMI values were close to the mean, though there may be some variation in body composition.
Among other occupational factors, the average observed shift duration is 8 hours per day, with a standard deviation of 1.55 hours. This suggests that while the standard workday is 8 hours, some workers may work slightly longer or shorter shifts. However, there is considerable variability in factors such as work experience, drill operating duration, break duration, and travel time, which could reflect differences in job roles, work practices, or living conditions. Understanding these variations is important to incorporate their possible role in prompting level of HAV exposure, and the subsequent health effects. But, the study has a limitation that it could not incorporate the role of these factors in prompting HAV-induced health effects. This study’s main focus has been to find level of exposure to HAV and the associated effect on core body and skin temperature.
The data on participants’ self-reported symptoms was analyzed to find prevalence of HAV induced health effects. A significant portion of the workforce, 73.2%, is affected by visible white fingers, a condition often linked to Hand-Arm Vibration Syndrome (HAVS). This condition arises from prolonged exposure to vibrating tools, such as drills or jackhammers, leading to reduced blood circulation in the fingers [16,17]. The fact that 89.4% of workers report chronic numbness in their right hand is alarming. Chronic numbness is often a symptom of nerve damage or compression, which can result from repetitive motions or prolonged use of vibrating equipment [18].
This high percentage indicates that nearly all workers are experiencing some form of nerve-related issue, which could significantly impact their ability to perform tasks that require fine motor skills or sustained hand strength. For workers’ reporting a loose hand grip, there is a clear indication that hand strength is being compromised [19]. This could be a result of chronic conditions such as nerve damage, muscular strain, or reduced blood flow, all of which can diminish grip strength [20]. A weak hand grip not only affects the workers' ability to perform their job effectively but also increases the risk of accidents, as it impairs their ability to hold tools securely. Almost all of the workers (98.7%) reported pain in the upper limbs. It is particularly concerning and suggests that almost every worker is experiencing some form of musculoskeletal discomfort, likely due to the repetitive and strenuous nature of their work.
The data on level of HAV exposure is analyzed vis-à-vis two critical parameters for evaluating vibration exposure: frequency-weighted rms acceleration and vibration dose value (VDV). Both parameters are used to assess the level of exposure to vibrations (Picu, 2019) and its potential risk to workers' health (Duarte, 2018). High values in these measurements suggest that workers are exposed to vibrations that exceed permissible levels, which could lead to health issues such as Hand-Arm Vibration Syndrome (HAVS) (Bozkurt, 2014). Also, the data suggest that while some workers may be exposed to vibration levels near the permissible threshold, others experience significantly higher levels, which could lead to a greater risk of developing vibration-related injuries.
Likewise, the effect of vibration exposure on skin temperature is also analyzed using MANOVA in Figure 2. In the graph, the trend line equation suggests a slow overall increase in temperature, but the fluctuations and decreases seen in the actual data points are significant (Su, 2014, Dong, 2021) particularly towards the later stages of the graph. As vibration exposure increases, pre-shift skin temperature rises. After exposure to vibration, post-shift skin temperature decreases. The decrease in post-shift skin temperature is more pronounced with higher vibration exposure. This graph suggests that vibration exposure has a significant impact on skin temperatures, causing a decrease in temperature after exposure. The exact reasons for this phenomenon require further investigation, but possible explanations include vibration-induced blood flow changes, nerve stimulation affecting temperature regulation and thermal stress response to vibration exposure.
The second image presents another graph of temperature (in degrees Celsius) over the same time points (T1 through T23), but with a different visual representation compared to the first graph. This graph illustrates the relationship between vibration exposure and its effects on core body temperature, showing a clear increase in post-shift core body temperature as vibration exposure rises, while pre-shift core body temperature remains stable. The increase trend in core body temperature with increasing vibration exposure could suggest that higher vibration exposure might be associated with reduced core body temperature, potentially due to different physiological responses or measurement errors. However, the variability in core body temperature across different vibration levels indicates that more research might be needed to understand the relationship fully. The data indicate a notable increase in core body temperature from before to after the shift, with more precise measurements post-shift. Stress levels are more variable before the shift and become more consistent afterward. Vibration exposure shows considerable variability in its impact on core body temperature, with higher exposure levels associated with lower temperatures but with substantial variability. Further analysis could involve investigating the causal relationships between vibration exposure and core body temperature, considering potential confounding variables, and exploring more detailed mechanisms behind these observations. Overall, the MANOVA analysis provides strong evidence that vibration exposure is associated with changes in both skin temperature and core body temperature, highlighting the importance of considering the effects of vibration on the human body.
4.1. Strength of the Study
This research is among the rare studies finding association between hand arm vibration exposure (HAVE) and the fluctuation in skin and core-body temperature of the drill operators.
4.2. Limitations of the Study
The study could not incorporate the whole-body vibration exposure (WBVE) for hand arm vibration exposure. Also, the study does not take into account environmental factors and general physiological (metabolism rate) of workers for the role in rising skin and core-body temperature.
5. Conclusions
The current research provides a significant occupational health challenge among drill operators in construction of buildings. There is a high percentage experiencing conditions indicative of serious health issues induced by HAV exposure. The majority of workers were being exposed to HAV beyond limits permissible by ISO 5349 guidelines. The high mean and maximum values in both the frequency-weighted rms acceleration and VDV indicate that a significant portion of the workforce is subjected to vibration levels that are well above the permissible limits. This poses a serious risk to their health, particularly for developing conditions such as HAVS. Also, triggered by this vibration, there is a decline in skin temperature and a rise in core body temperature. In MANOVA analysis, there is a visible shift in values of both skin and core body temperature, measured before start of shift and at the end of the shift of sampled participants. The common prevalence of symptoms such as visible white fingers, chronic numbness, and upper limb discomfort suggests that current work practices may not be sufficient to protect workers from the physical demands of their jobs. All of the workers reported discomfort either in the upper or lower limb. Although this discomfort ranged from mild irritation to severe pain, it is alarming. It can potentially lead to chronic conditions if not addressed. The high prevalence of upper limb discomfort highlights the need for ergonomic interventions or modifications to work practices to reduce strain on these areas. Interventions such as ergonomic assessments, tool redesign, vibration reduction measures, and enhanced worker training on proper techniques and break schedules could help mitigate these risks. Addressing these health concerns is critical for improving worker safety, reducing the likelihood of long-term disabilities, and maintaining workforce productivity. The data highlights the need for immediate intervention to reduce vibration exposure among workers. To mitigate these risks, it is essential to implement measures such as improved tool design, better maintenance of equipment, and stricter adherence to exposure limits. Regular monitoring and assessment of vibration levels should also be conducted to ensure worker safety and prevent long-term health issues.
Author Contributions
Madiha Ijaz made the conceptual design of the study, went to the area of study to collect data, and drafted the manuscript; Muhammad Akram ensured the collection of data to be in compliance with international standards. Sajid Rashid Ahmad supervised the conceptual design and drafting of the results. Kamran Mirza helped in data collection and statistical analysis. Steven M Thygerson helped in calculation of data obtained and the final drafting of the manuscript. All authors contributed to data analyses by application of different statistical models.
Funding
This research received no external funding.
Institutional Review Board Statement
These study protocols were approved by Bioethics Committee of University of the Punjab, Pakistan, with reference number 489/BEC/PU, dated 24 October 2021.
Informed Consent Statement
All authors willingly give their consent for publication this manuscript along with the entire data and content.
Data Availability Statement
It is to confirm that all the data supporting findings of this study is available only in this article, and or can be accessed by requesting the journal publishing it.
Acknowledgments
The authors are grateful for the workers who participated in the study, and to the managers of studied construction sites for facilitating these research activities successfully.
Conflicts of Interest
All authors declare that they have no competing interests for this research titled “An observational study on prevalence of Hand-Arm-Vibration exposure and the associated health effects on core body and skin temperatures amongst drill operators”.
References
- Hong, X.; Lee, Y. Prevalence of musculoskeletal symptoms among construction workers. International Conference on Man-Machine-Environment System Engineering, 2022; Springer. [Google Scholar]
- Singh, K.J.; Palei, S.K. N.C.J.J.o.V. Karmakar, and Control, Role of contributing factors on health risks of whole-body vibration exposure of heavy equipment and vehicle operators: a critical review. 2024, 30(11-12), 2338–2355. [Google Scholar] [CrossRef]
- Charkoudian, N. Skin blood flow in adult human thermoregulation: how it works, when it does not, and why. In in Mayo clinic proceedings; Elsevier, 2003. [Google Scholar]
- Romanovsky, A.A. J.A.p., Skin temperature: its role in thermoregulation. 2014, 210(3), 498–507. [Google Scholar] [CrossRef] [PubMed]
- Cochrane, D.J.; et al. Comparing muscle temperature during static and dynamic squatting with and without whole-body vibration. 2010, 30(4), 223–229. [Google Scholar] [CrossRef] [PubMed]
- Games, K.J.J.S. j.o.m. Sefton, and s.i. sports, Whole-body vibration influences lower extremity circulatory and neurological function. 2013, 23(4), 516–523. [Google Scholar] [PubMed]
- Seixas, A.; Vardasca, R.; Gabriel, J. The effect of different vibration frequencies in the skin temperature in healthy subjects. In 2014 IEEE International Symposium on Medical Measurements and Applications (MeMeA); IEEE, 2014. [Google Scholar]
- Xiao, B.; et al. Cold water immersion test (10 C, 10 min) for diagnosing vibration-induced white finger among a group of polishers in a subtropical environment. Int. Arch. Occup. Environ. Health 2019, 92(6), 865–872. [Google Scholar] [CrossRef] [PubMed]
- Brocal, F.; González, C.; Sebastián, M.J.S.s. Practical methodology for estimating occupational exposure to hand-arm vibrations according to CEN/TR 15350: 2013. 2018, 103, 197–206. [Google Scholar] [CrossRef]
- Johannisson, P. H. Lindell, Definition and Quantification of Shock/Impact/Transient Vibrations. arXiv 2022, arXiv:2211.08999. [Google Scholar]
- Clemm, T.; et al. Dose–response relationship between hand–arm vibration exposure and vibrotactile thresholds among roadworkers. Occup. Environ. Med. 2020, 77(3), 188–193. [Google Scholar] [CrossRef] [PubMed]
- Shaikh, A.M.; Mandal, B.B.; Mangalavalli, S.M.J.S.S. Causative and risk factors of musculoskeletal disorders among mine workers: A systematic review and meta-analysis. 2022, 155, 105868. [Google Scholar] [CrossRef]
- Kistemaker, J.; E. Den Hartog, H.J. J.o.m.e. Daanen, and technology, Reliability of an infrared forehead skin thermometer for core temperature measurements. 2006, 30(4), 252–261. [Google Scholar] [PubMed]
- Wang, D.; et al. Observations of upper-extremity skin temperature and corresponding overall-body thermal sensations and comfort. 2007, 42(12), 3933–3943. [Google Scholar] [CrossRef]
- Aune, D.; et al. BMI and all cause mortality: systematic review and non-linear dose-response meta-analysis of 230 cohort studies with 3.74 million deaths among 30.3 million participants. 2016. [Google Scholar] [CrossRef] [PubMed]
- Chowdhry, R. V.J.C.M.R. Sethi, and Practice, Hand arm vibration syndrome in dentistry: A review. 2017, 7(6), 235–239. [Google Scholar]
- Kgabi, M. The relationship of Hand-arm vibration and white finger syndrome among railway maintenance team in Gauteng Province, South Africa; University of Johannesburg (South Africa), 2020. [Google Scholar]
- Aarhus, L.; Veiersted, K.; Nordby, K.; Bast-Pettersen, R.J.O.M. Neurosensory component of hand–arm vibration syndrome: a 22-year follow-up study. 2019, 69(3), 215–218. [Google Scholar] [CrossRef] [PubMed]
- Qamruddin, A.A.; et al. Prevalence of hand-arm vibration syndrome among tyre shop workers in Kelantan, Malaysia. 2019, 61(6), 498–507. [Google Scholar] [CrossRef] [PubMed]
- Jackson, J.A.; et al. Occupational biomechanical risk factors for surgically treated ulnar nerve entrapment in a prospective study of male construction workers. 2019, 45(1), 63–72. [Google Scholar] [CrossRef] [PubMed]
Figure 1.
(A) Measurement of Skin Temperature; (B) Measurement of core body temperature.
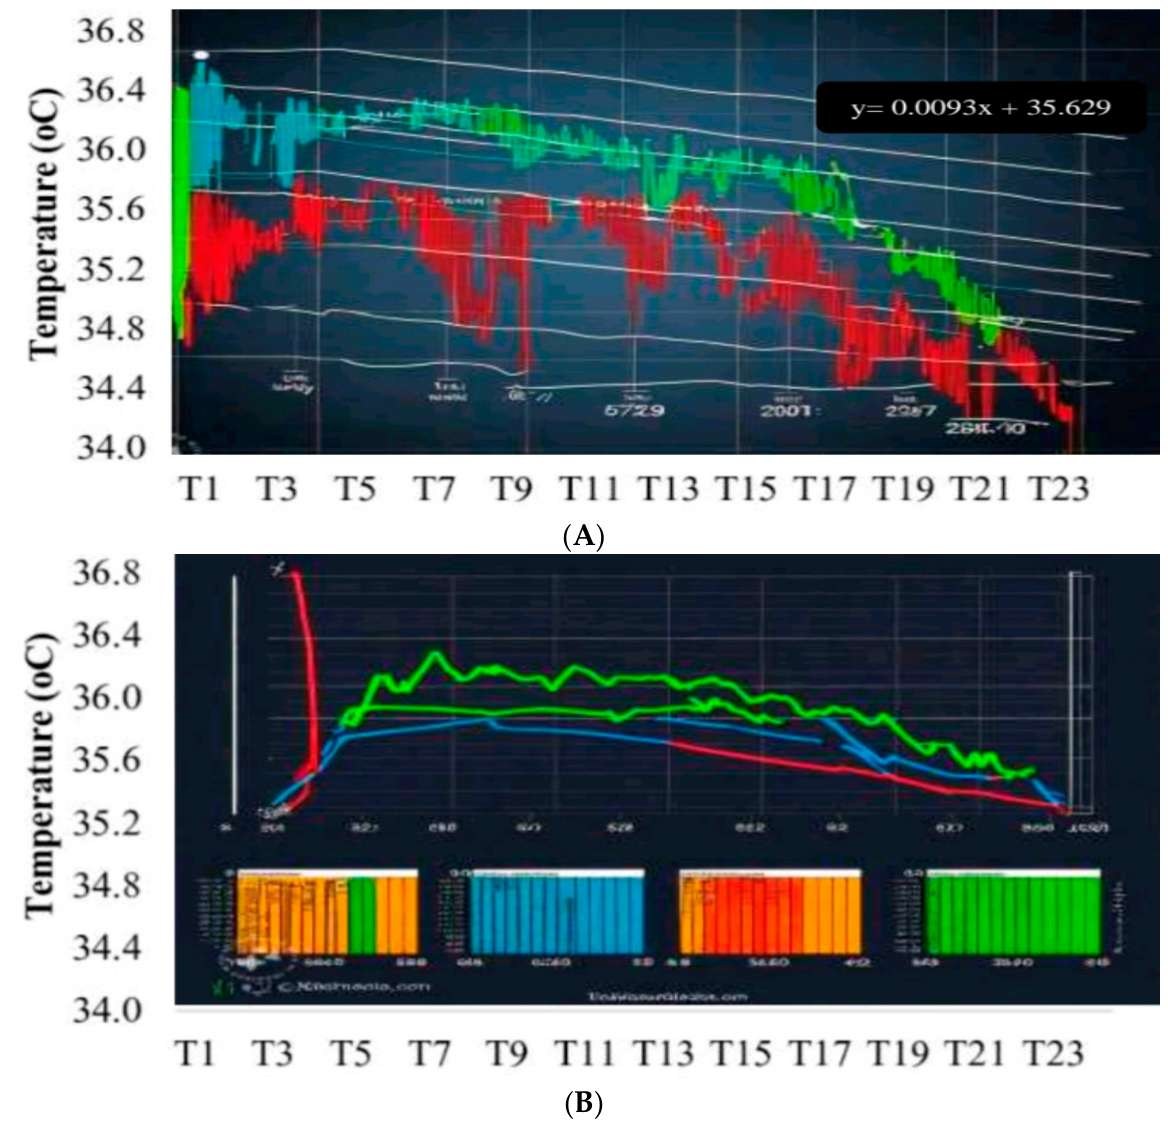
Figure 2.
Relationship between vibration exposure for change in skin temperature and core body temperature.
Figure 2.
Relationship between vibration exposure for change in skin temperature and core body temperature.
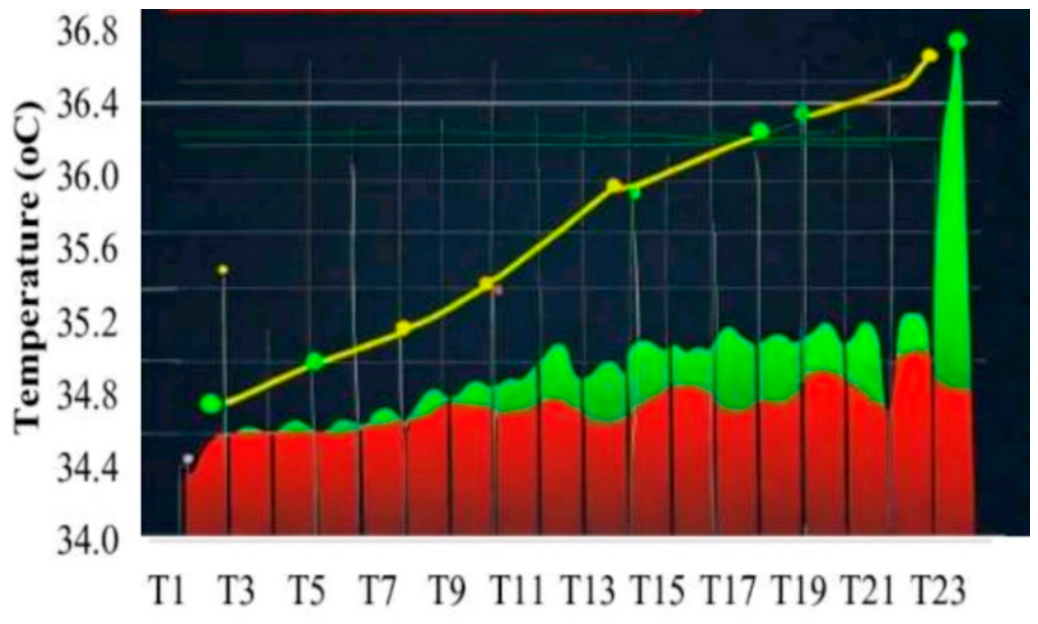

Table 1.
Fundamental characteristics of workers’ personal and occupational traits.
| Mean of Personal Factors | Percentage of Occupational Factors | ||
| Variable | Mean (±Standard Deviation) | Variable | Percentage |
| Age | 27 (±6.12) | Workers with visible white fingers | 73.2 % |
| Height (m) | 1.7 (±0.96) | Workers with chronic numbness of right hand | 89.4% |
| Weight (kg) | 71 (±8.16) | Workers with painful tingling in right hand | 90% |
| BMI (kg/m2) | 23.59 (±3.15) | Workers with loose hand grip | 60.6% |
| Shift duration/day | 8 (±1.55) | Workers reporting discomfort in upper limb | 98.7% |
| Work Experience (years) | 6 (±5.17) | Workers reporting pain in neck | 77% |
| Nature of work after shift | 0 (±0.44) | Workers reporting pain in upper back | 83% |
| Duration of drill operating (hour) | 6 (1±.76) | Workers reporting pain in shoulder | 77% |
| Work break duration (minutes/shift) | 30 (±22.18) | Workers reporting pain in lower back | 49% |
| Travel time to the work site (minutes) | 10 (±8.11) | Workers feeling jerks in right upper limb | 87% |
Table 2.
Calculation of the values obtained from vibration meter.
| Parameter | Frequency-weighted rms acceleration, m s-2 | Vibration dose value, m s-1.75 | |||||||
| Measurements above permissible level (N = 82) |
Mean Median SD Minimum |
7.07 1.15 0.24 1.23 |
1.79 1.06 0.17 0.77 |
2.35 1.88 0.38 1.93 |
2.02 1.88 0.38 1.80 |
3.99 3.23 0.62 2.25 |
2.90 2.67 0.52 2.45 |
5.95 5.35 1.04 3.82 |
18.21 16.84 3.11 11.64 |
| Maximum | 2.11 | 1.91 | 2.55 | 2.66 | 5.03 | 5.07 | 8.01 | 24.07 | |
Table 3.
The test between-subject effects relationship between HAV and fluctuation in skin and core body temperature.
Table 3.
The test between-subject effects relationship between HAV and fluctuation in skin and core body temperature.
| Source | Dependent Variables | Sum of Squares | Df | Mean Square | F | Sig |
| Corrected Model | Core Body Temp. (before shift) | 463.145 a | 21 | 22.055 | 226 | 1.000 |
| CB after Shift | 23.735 b | 21 | 1.130 | 1.411 | 1.39 | |
| ST before Shift | 39084.619 c | 21 | 1851.172 | 226 | 1.000 | |
| ST after Shift | 20.448 d | 21 | 0.974 | 0.782 | 0.732 | |
| Intercept | Core Body Temp. (before shift) | 348667.330 | 1 | 348667.330 | 3577.099 | < .001 |
| CB after Shift | 367390.66 | 1 | 367390.66 | 458637.459 | < .001 | |
| ST before Shift | 346452.568 | 1 | 346452.568 | 42.071 | < .001 | |
| ST after Shift | 345847.794 | 1 | 345847.794 | 277873.680 | < .001 | |
| Q6 | Core Body Temp. (before shift) | 463.145 | 21 | 22.055 | 226 | 1.000 |
| CB after Shift | 23.735 | 21 | 1.130 | 1.411 | 1.39 | |
| ST before Shift | 39084.619 | 21 | 1851.172 | 226 | 1.000 | |
| ST after Shift | 20.448 | 21 | 0.974 | 0.782 | 0.732 | |
| Error | Core Body Temp. (before shift) | 7602.824 | 78 | 97.472 | ||
| CB after Shift | 62.842 | 78 | 0.801 | |||
| ST before Shift | 642323.091 | 78 | 8234.911 | |||
| ST after Shift | 97.081 | 78 | 1.245 | |||
| Total | Core Body Temp. (before shift) | 959607.690 | 100 | |||
| CB after Shift | 1015605.970 | 100 | ||||
| ST before Shift | 1758229.000 | 100 | ||||
| ST after Shift | 9614119.340 | 100 |
Table 4.
The estimated marginal means for dependent (pre-shift and post-shift skin temperature) and independent (variable exposure) means.
Table 4.
The estimated marginal means for dependent (pre-shift and post-shift skin temperature) and independent (variable exposure) means.
| Grand Mean | |||||
| Dependent Variable | Mean | Standard Errors | 95% Confidence Level | ||
| Lower Bound | Upper Bound | ||||
| Before shift core body temp (OC). | 98.2 | 1.642 | 94.933 | 101.471 | |
| After shift core body temp (OC). | 100.804 | 1.49 | 100.508 | 101.100 | |
| Before shift skin temperature (OC) | 97.889 | 15.092 | 67.844 | 127.935 | |
| After shift skin temperature (OC) | 97.804 | 186 | 97.432 | 98.175 | |
| Vibration exposure | |||||
|
Independent Variables |
Vibration Exposure |
Mean | Standard Mean | 95% Confidence Level | |
| Lower Bound | Upper Bound | ||||
| Core body temperature | 5.00 | 98.500 | 9.873 | 78.845 | 118.115 |
| 5.20 | 98.200 | 6.981 | 84.302 | 112.098 | |
| 5.40 | 98.400 | 9.873 | 78.745 | 118.005 | |
| 5.50 | 98.467 | 3.291 | 91.915 | 105.055 | |
| 5.60 | 98.500 | 9.873 | 78.845 | 118.155 | |
| 5.80 | 98.600 | 9.873 | 78.945 | 118.255 | |
| 5.90 | 98.362 | 3.491 | 91.413 | 105.312 | |
| 6.00 | 92.427 | 2.549 | 87.352 | 97.502 | |
| 6,20 | 98.500 | 6.981 | 84.602 | 112.398 | |
| 6.30 | 98.500 | 9.873 | 78.845 | 118.155 | |
| 6.40 | 98.400 | 9.873 | 78.745 | 118.055 | |
| 6.50 | 98.512 | 2.468 | 93.599 | 103.426 | |
Disclaimer/Publisher’s Note: The statements, opinions and data contained in all publications are solely those of the individual author(s) and contributor(s) and not of MDPI and/or the editor(s). MDPI and/or the editor(s) disclaim responsibility for any injury to people or property resulting from any ideas, methods, instructions or products referred to in the content. |
© 2026 by the authors. Licensee MDPI, Basel, Switzerland. This article is an open access article distributed under the terms and conditions of the Creative Commons Attribution (CC BY) license (http://creativecommons.org/licenses/by/4.0/).
Copyright: This open access article is published under a Creative Commons CC BY 4.0 license, which permit the free download, distribution, and reuse, provided that the author and preprint are cited in any reuse.