
Submitted:
18 August 2026
Posted:
20 August 2026
You are already at the latest version
Abstract
Magnetic Resonance Imaging (MRI) is a well-established technique used in medical applications and bio-based research. It has also been used to study wood and composite materials of various types. We have employed MRI to study soy adhesives in water-soaked plywood composites in an attempt to gain insight into the sensitivity of soy adhesive bond-lines exposed to moisture. Various MRI data acquisition sequences were used to show how water interacts and migrates within the soy adhesives and to quantify the presence of water at the bond-line of the plywood samples. The data from MRI was combined with cyclic testing data of plywood to help understand how soy adhesives can be modified to reduce their moisture sensitivity. MRI of plywood bond-lines made with chemically modified soy adhesives shows that moisture ingress can be reduced dramatically. Cyclic water soak/drying testing of plywood made with chemically modified soy adhesives shows that the reduction in moisture sensitivity results in dramatic improvements in bond-line durability.
Keywords:
soy adhesives
; magnetic resonance imaging
; moisture resistance
; plywood
1. Introduction
Magnetic Resonance Imaging (MRI) is a nuclear magnetic resonance (NMR) characterization technique that relies mostly on the detection of water either within the human body or within a material. More specifically, each hydrogen atom in water has a nucleus that consists of a single proton. These protons are very sensitive to the resonance effects of external magnetic fields that the atomic nuclei of water experience in these magnetic fields. [1,2,3] The protons within the water molecules behave like tiny magnets. When placed in a strong magnetic field, these protons align with the direction of the field. The MRI instrument uses radiofrequency pulses that knocks the aligned proton nuclei out of their equilibrium position with the magnetic field. When the radiofrequency pulse is turned off, the protons return to their original alignment. As they do so, they emit faint radio signals. Electronic receiver coils in the MRI instrument detects these emitted signals. The data is processed to construct detailed images of the water within the material (or person) based on the signal from the protons within the water. The contrast in MRI images depends on how quickly the hydrogen nuclei from water return to equilibrium and emit signals. MRI scans can be tailored to highlight specific types of water, either bound or restricted mobility water or mobile water, by adjusting the timing and strength of the radiofrequency pulses. The spin-lattice relaxation time (T1) and the spin-spin relaxation time (T2) are commonly used to create diffusion-weighted images, each providing unique information about the water within the material (or person). Free or mobile water molecules rapidly tumble and are inefficient at transferring energy to the surrounding lattice. This means they take a long time to realign their magnetization with the main magnetic field, resulting in a long T1 value. Water molecules that are bound (hydrogen bonded) to larger macromolecules, such as proteins or wood, take on the slower motion characteristics of these macromolecules. This slower motion of bound water makes it more efficient at relaxing, meaning it transfers energy to the lattice more effectively and recovers its longitudinal magnetization more quickly, leading to a shorter T1 time. This difference in T1 times is why bound water appear bright on T1 weighted images, as the bound water molecules recover signal faster than mobile (free) water. Likewise, bound water will have short T2 relaxation times compared to mobile water. Because of the restricted motion of the bound water, rapid spin-spin dephasing of the MRI signal occurs, and bound water appears darker in T2 weighted images. These differences in contrast are used to define the state of water within a structure (or a person) and give rise to the images we observe.
In material science, MRI has been employed to non-destructively investigate the internal structure and composition of various materials. One of the first examples of this was to obtain cross-sectional images of three poly(vinyl alcohol) (PVOH) stabilized poly(vinyl acetate) (PVAc) emulsions in glue-lines between a wood block and a ceramic tile. [4] There have also been numerous papers and reviews related to the use of MRI to study the moisture in wood. [5,6,7,8] One specific example used MRI to study diseased wood. MRI revealed pathological anatomical features of coast live oak trees (Quercus agrifolia) that were naturally infected with Phytophthora ramorum. In this study Infected areas were compared to healthy sections of the wood. Various infected tissues were revealed and the depth of infection into the xylem could be estimated by T1 and T2 images. [9] A more recent illustration of MRI used in wood composites was to study mass timber. This work established that MRI can be useful to support mass timber moisture durability studies. MRI allowed identification of features such as joints, growth rings, and layers in pine/ spruce cross laminated timber (CLT) samples to slightly less than 1 mm resolution. [10]
Within this paper we describe how we utilized MRI to study the association of water with soy adhesive bond-lines in plywood. Soy adhesives are of great interest to wood composite manufacturers, as a sustainable alternative to conventional petroleum-based adhesives. However, since the patenting of these adhesives for use in wood composites in 2007, the technology has changed very little, and market growth has been minimal because of the poor moisture resistance of soy-based adhesives. To overcome the moisture-resistance problem, it would be helpful to understand more about the mechanism of how water affects the compositional chemistry of soy adhesives and how this chemistry in turn influences adhesion at the bondline. With a better understanding of the reasons for moisture-induced adhesive failures, it should become possible to test and develop chemistry-specific solutions to overcome the moisture resistance problem.
We have previously reported on the chemical changes occurring within the soy adhesive bond-lines of wood composites when they are exposed to moisture. [11,12] That work described the chemistry of the water-soluble components within the bulk adhesive and the migration of these components into the wood and at the wood-adhesive interface. The presence of these water-soluble components at the interface results in a weak boundary layer which is susceptible to moisture. The data presented within will describe how water migrates and associates with the soy adhesive at the plywood interface.
2. Materials and Methods
Soy adhesives were prepared, as previously described from a dispersion of 200/70 (mesh/PDI) soy flour in water at a 38 percent total solids concentration. [11,12] 200 mesh is the particle size of the soy particles, which equates to an average particle size of 74 microns; and PDI is the Protein Dispersity Index for the soy flour, which relates to how well the soy flour disperses in water. One of the adhesive samples was prepared using a 30 percent solids polyamideamine-epichlorohydrin (PAE) resin as a crosslinker for the adhesive. The concentration of the PAE solids in the adhesive was 4 percent; thus, the final 38 percent solids adhesive consisted of 96/4 w/w soy-flour components and PAE components. This sample was labeled 67-3. A second adhesive was prepared having a 38 percent soy solids composition without PAE; thus, consisted of 100 percent soy flour solids and was labeled 67-4.
Another soy adhesive dispersion was prepared using magnesium oxide (MgO) as an ionic crosslinker. MgO has been shown to be an alternative to PAE as a crosslinker for soy adhesives. [13] This adhesive was also composed of 200/70 soy flour and the ratio of MgO to soy was a 5/1. The total adhesive solids concentration for this adhesive was also 38 percent.
Surface treated soy meal (STSM) was prepared using a proprietary hydrophobe chemistry which was dry blended onto ground soy meal having a 325 mesh (45 micron) particle size. The surface treated soy meal was post treated at 80 oC for 2 hours. The surface treated soy meal was substituted into some of the Soy/MgO adhesives, replacing one percent or two percent of the 200/70 soy flour for the STSM. The objective of surface treating the soy meal is to render it hydrophobic and use it as an additive for soy adhesives to assist in moisture resistance and bond-line durability.
Three-layer plywood samples were prepared using 0.125-inch-thick yellow poplar (Liriodendron tulipifera). The plywood specimens were prepared using the Soy/PAE or Soy/MgO adhesives. Thirty grams of the wet soy-based dispersions were applied to the loose face of a 30.48 cm x 30.48 cm (12” x 12”) poplar veneer. A second poplar veneer was then placed on top of the of the adhesive, loose-face to loose-face, with the grain direction perpendicular to the bottom veneer layer. Another 30 grams of adhesive was applied to the top surface of the second veneer and a third veneer, loose-face down, placed on top of the adhesive layer with the grain perpendicular to the second layer veneer. The multilayered assemblies were then pressed at 130 oC for 4 minutes while under a pressure of 1.03 MPa (153 PSI).
Some of the Soy/MgO plywood samples were sent to an external laboratory for ANSI/HPVA EF 2020 cyclic testing. [14] The testing procedure subjects hardwood plywood samples to rigorous, repeated wetting and drying to accelerate bond-line stress. The residual wood from the cutting of the EF 2020 samples was sent back to the Polymer Synergies lab for imaging studies.
Samples for imaging studies were cut from the 3-layer plywood sample residuals from the ANSI/HPVA EF 2020 cyclic testing. The imaging samples were 10 mm x 10 mm cubes or 10 mm diameter cored cylinders.
The MRI imaging studies were conducted at the University of Florida’s National Magnet Laboratory in Gainesville, Florida, using a Bruker 750 MHz (17.6 Tesla) Solution / Solid State NMR & Preclinical MRI equipped with a Bruker NEO console. MR images were acquired with Paravision 360 3.5. The plywood samples were soaked for 24 hrs. prior to imaging. The samples were then removed from water, placed in a stoppered test tube and placed in the imaging coil in the magnet. Several MRI pulse sequences were tested to determine the best methods for imaging the water-soaked plywood samples. Due to the short T2 relaxation time of the water contained within the samples, a ZTE (Zero Echo Time) sequence. [15,16] This sequence allows for the water content of the wood and adhesive to be measured in a single 3D image. The images were acquired with a resolution of 128 × 128 × 128 voxels, over a 20 mm cubic volume, leading to an isotropic voxel size of 0.156 mm. A repetition time of 0.76 ms, and a flip angle of a very low excitation angle of 4° were used. With 32 averages per scan, the total scan time was 21 minutes. The acquisition bandwidth was optimized to minimize artifacts caused by the rapid ZTE sequence. Image slices were extracted in postprocessing from the center of the samples to analyze water distribution within them, and its changes over time, as well as to visualize the adhesive/wood interfaces. 3D images and movies were produced using Paravision software to further visualize the wood and adhesive layers. Additional MR images using FLASH, a low flip angle gradient echo technique were also acquired.[17] An echo time of 0.6 ms, repetition time of 70 ms, and excitation angle of 20° were used. An in-plane resolution of 0.156 mm was used with a slice thickness of 2.5 mm. 8 scans were used, with a total acquisition time of 1 minute. These were primarily used to confirm positioning of the sample, as they could only detect residual surface water or heavily hydrated adhesive layers.
3. Results and Discussion
Figure 1 below shows the bright signal from bound water at the adhesive bond-lines.
In the image we observe that the water signal associated with the adhesive or the water- soluble components of the PAE/Soy adhesive penetrate deeply into the wood, approximately 1 mm. This is consistent with our previous findings reported for the Soy/PAE adhesive where we discuss the penetration of the adhesive or water-soluble components of the adhesive penetrating into the wood to create a diffusion interphase. [11] We can say that the water is tightly bound to the soy adhesive components, resulting in the bright bond-line signal. The wood also contains water because the samples were soaked and fully saturated, but the water within the wood structure is more mobile and under the conditions of the experiment, are not seen due to the T1 and T2 weighting of the experiment. That is, the experiment was designed to observe bound water. In this image we also observe the grain pattern of the top and bottom layers, which are parallel to each other and the difference in the image for the middle veneer.
Figure 2 is an image of a plywood sample made with the neat soy adhesive not containing any PAE crosslinker (Sample 67-4). This sample was imaged using the same conditions as used to image Figure 1.
In Figure 2 we observe that the thickness of the adhesive bond-line appears smaller than that of the Soy/PAE adhesive bond-line seen in Figure 1. Since the signals we observe at the bond-line are associated with bound water, the difference we are seeing may be associated with the hydrophilicity of the adhesives. We have shown that PAE is very hygroscopic and plasticizes the soy adhesive. [11,12] It is possible that the presence of PAE allows for deeper penetration of the soy adhesive components, due to its greater hydrophilicity and greater mobility of the soy adhesive due to PAE as compared to the neat adhesive that does not contain PAE.
The image in Figure 2 also shows a difference in the direction of penetration of the soy adhesive. The adhesive appears to preferentially exhibit signal on the surface of the veneer where the adhesive was applied. In Figure 1 the adhesive signal seems to go into both veneers in contact with the adhesive. In Figure 2 the neat soy adhesive without PAE does not appear to penetrate the veneer above the adhesive. This can be observed as a dark line above the bright signal. We speculated that again; this may be due to the difference in hydrophilicity and mechanical properties of the two adhesives. We also considered the possibility that the neat soy adhesive is starting to delaminate. If delamination is occurring the water at the delaminated surface would be mobile water and not seen under the conditions used in the experiment. After the experiment was complete the second explanation proved to be correct, the sample had delaminated, with the top veneer being more delaminated than the bottom veneer, but both bondlines had some degree of delamination.
Another experiment was conducted in which we took sample 67-3 (Plywood made with Soy/PAE adhesive) removed it from the water and sealed the sample in a glass vial. The sample was then imaged over an eight-hour period to see if we could observe any change in the intensity of the MRI signal form the sample.
Figure 3.
is a plot of the change in MRI signal intensity of the plywood sample out of water as a function of time as compared to the initial signal intensity of the image in water.
Figure 3.
is a plot of the change in MRI signal intensity of the plywood sample out of water as a function of time as compared to the initial signal intensity of the image in water.
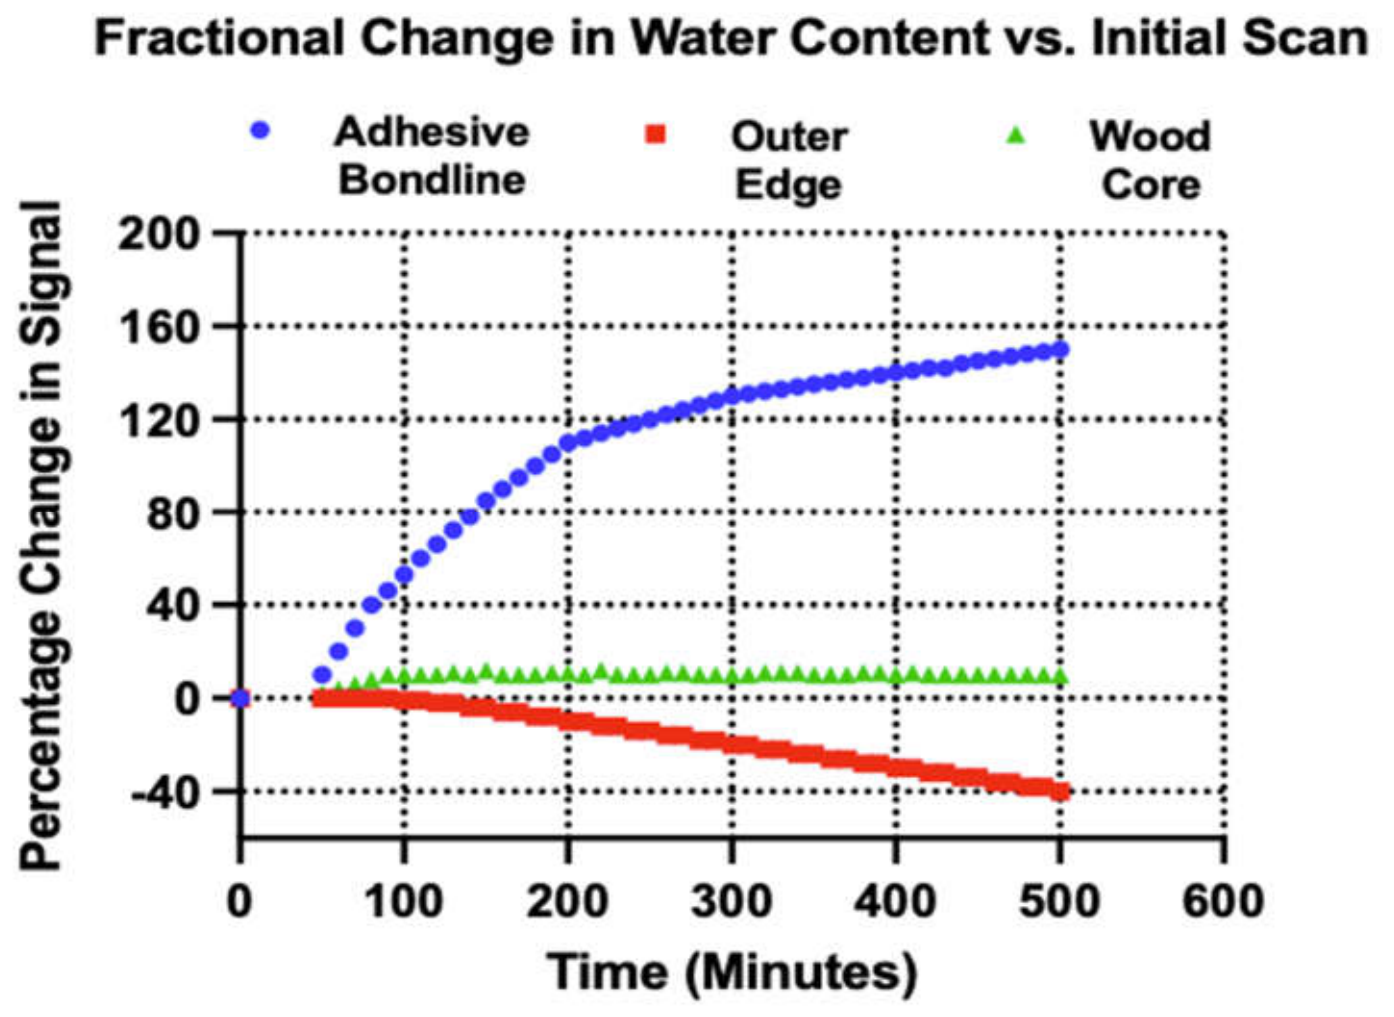
In this experiment the signal intensity was measured every ten minutes as the sample sat out of water in a sealed tube. Signals were measured at the outer edge of the plywood sample, in the center of the plywood veneer and at the soy adhesive interface. From the graph we observe that the MRI signal at the outer edge of the plywood sample decreases slightly as a function of time. The MRI signal from the plywood veneer center (core) does not change over time. The MRI signal for the Soy/PAE adhesive bond-line increases greatly oven time. This experiment may indicate that moisture is migrating and concentrating at the Soy/PAE adhesive bond-line. Another possible explanation is that the signal from the bound water in the soy adhesive bond-line is changing due to differences in the mobility of the bound water. Either way, the data suggests that water preferentially is associated with the soy adhesive when the sample is removed from the water.
In a follow-up series of experiments, we made plywood with soy adhesive cross-linked with magnesium oxide. Two of the plywood adhesives in this experiment had some of the 200/70 soy flour substituted with surface treated soy meal (STSM). Sample 346-2 was a plywood sample made with a neat Soy/MgO adhesive that did not contain any STSM. Sample 364-3 was a plywood sample made with a soy adhesive that had 1 % of the 200/70 soy flour substituted with 1 % STSM. Sample 364-4 was a plywood sample that had 2 % of the 200/70 soy flour substituted with 2 % STSM. The reason that the adhesive composition was made with the MgO crosslinker is that previous studies in our laboratory showed that the STSM’s performed better with the MgO crosslinker as compared to the PAE crosslinker.
In addition, a plywood sample was made using a moisture cured polyurethane adhesive (MCPU) known to impart strong, water resistant bonds between wood veneers. This sample was labeled 346-1. The MR-image below is for this MCPU plywood sample (346-1), which had been soaked in water for 24 hrs.
The image in Figure 4 is much different than the 2D slice images seen in Figure 1 and Figure 2. Instead of a bright bondline associated with bound water the bondline in this image are dark. The darkness of the bondlines is because the MCPU adhesive is impermeable to water and moisture resistant. As such no signal from bound water can be seen in the adhesive layer. This sample was made as a control to help define the amount of moisture resistance in the following images that contained STSM.
Figure 5 below compares plywood samples soaked in water for 24 hours. The Soy/MGO control sample (346-2) has bright, homogeneous bondlines due to appreciable signal coming from bound water associated with the soy adhesive. This is similar to what was observed for the PAE crosslinked soy adhesive seen in Figure 1. The sample containing 1% STSM substituted for 1 % of the 200/70 Soy flour used in the adhesive mixture (346-3) has much less signal at the bondlines as compared to the control. We do observe some signal from bound water within the bondline, but it is not homogeneous and much diminished compared to the MgO control. In the sample containing 2% STSM substituted for the 200/70 soy flour in the adhesive mixture (346-4) we observe signal from the edge of the bondline but very little signal at the center of the bondline, which is dark.
The Zero Time Echo (ZTE) images were reprocessed and the data presented in three-dimensional (3D) format. In these images the red color indicates high water signal within the sample. Figure 6 shows the 3D images of sample 346-2, the Soy/MgO control, from two different perspectives.
From the images in Figure 6 we can observe the two bondlines of the plywood sample have a high signal from the bound water at the bondlines. We can measure the water signal intensity across the sample and plot the signal intensity in atomic unite (au) verses position across the sample to show in graphic form that the signal is highest at the bondlines (Figure 6C).
Using the same rendering technique as shown in Figure 6 we can compare the plywood samples made with adhesives containing 1% and 2 % STSM substituted for the 200/70 soy flour. This data can be seen in Figure 7 and Figure 8.
Figure 7 shows that the incorporation of 1% STSM dramatically reduces the amount of water at the soy-adhesive bondline of this plywood sample as compared to the control sample seen in Figure 6. The signal is further diminished in Sample 346-4, Figure 8, where the Soy/MgO adhesive had 2% STSM substituted for 2 % of the soy flour in the adhesive.
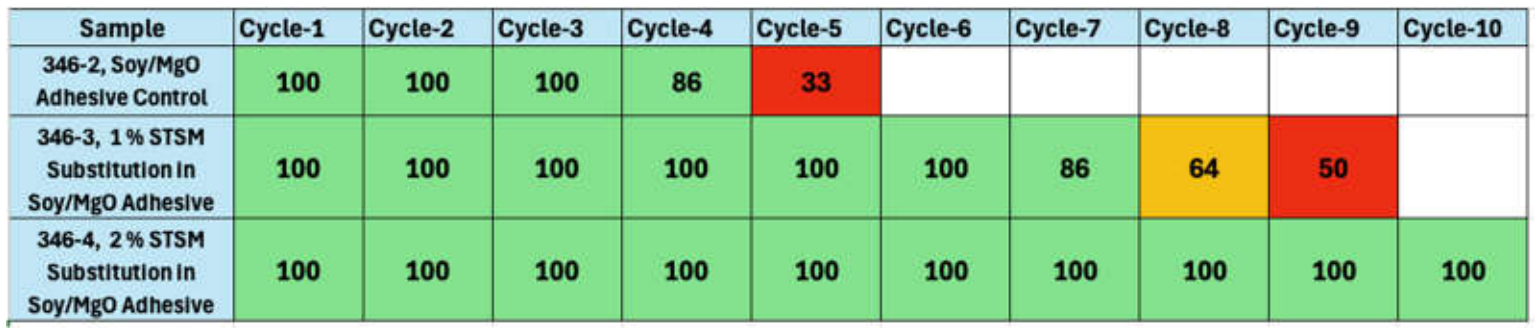
The plywood samples from which imaging samples 346-2,3, and 4 were obtained were tested using ANSI/HPVA EF 2020 Section4.2, three-cycle soak test to determine bond durability. The ANSI/HPVA 2020 test is a standardized method developed by the American National Standards Institute (ANSI) in collaboration with the Hardwood Plywood & Veneer Association (HPVA) to evaluate the performance of hardwood plywood and veneer products. This test is conducted by cutting 6 samples having dimensions of 127 mm by 50.8 mm (5 inches by 2 inches) from each plywood sample. The samples are then submerged in 24°C (75 ºF) water for 4 hours and then dried at a temperature between 49 and 52°C (120 and 125°F) for 19 hours. Specimens are evaluated for delamination after each cycle. Delamination is defined as separation of two plies that is greater than 50.8 mm (2 inches) in continuous length, over 6.4 mm (0.25 inches) deep at any point, and 0.08 mm (0.003 inches) wide. 95% of specimens must pass the first cycle and 85% must pass the third cycle. This test primarily assesses the adhesive bond quality and the moisture resistance of the bond. The data below summarizes the performance of the plywood samples bonded with soy adhesives containing 1% and 2% STSM substituted for soy flour in the adhesive compared to the Soy/MgO control.
The data in Figure 9 shows that the Soy/MgO Control sample (346-2) exhibited strong initial bond performance, maintaining 100% bond integrity through the third cycle. However, bond strength declined in the forth cycle and the sample failed by the fifth cycle. In contrast, Sample 346-3, containing 1 % STSM substituted for 1 % Soy Flour in the adhesive formulation, performed much better. A decrease in the percentage of samples passing was not observed until the seventh cycle and failure occurred in the ninth cycle. Sample 346-4, containing 2% STSM substituted for 2 % of the Soy Flour used in the adhesive, remained at 100% passing through ten soak/dry cycles. This data is consistent with the imaging data shown in Figure 6, Figure 7 and Figure 8. The lack of water ingress into the bondline seen in Figure 7 and Figure 8 seems to correlate with bondline durability and moisture resistance of the soy adhesive when exposed to water.
One hypothesis is that the substitution of the STSM is providing greater hydrophobicity to the bulk adhesive bondline and creates a tortious path making it harder for water to interact with the water soluble components of the soy adhesive. As we have previously reported water-soluble components within the soy adhesive become susceptible to moisture ingress and to dissolution, leading to the formation of a weak boundary layer. [11] The water-soluble components have been previously reported to consist of a variety of polypeptides and carbohydrates. [11,18] These water-soluble components undergo partitioning during hot-pressing of the plywood and become concentrated at the adhesive-wood interface. This weak boundary layer leads to stress concentrations at the wood/adhesive interface and delamination occurs. It is possible that the tortuous path created by the hydrophobic STSM slows the water ingress and slows the dissolution of these components.
4. Conclusions
Using MRI to study moisture ingress at an adhesive bondline offers several positive implications that include the ability to non-destructively visualize where the moisture is, to qualitatively and quantitively measure the amount of water, and to quantify the molecular dynamics of the moisture within the composite bondline. In addition, it is possible to visualize and calculate diffusion kinetics of moisture into or out of the bondline. It is further possible that this form of non-destructive testing can be correlated to bond-strength and moisture resistance of the bondline.
MRI of soy adhesive bondlines within plywood composites provides insight into moisture induced degradation of soy adhesive bonds. The incorporation of hydrophobically treated soy meal as an additive to the soy adhesive resulted in much lower moisture observed at the bondlines and positively contributed to the bondline durability as observed in the three-cycle soak testing.
Acknowledgements
The authors would like to thank the United Soybean Board for funding this research (Project #25-101-D-C-1A and Project #25-101-D-C-1B ). We also acknowledge the University of Florida, McKnight Brain Institute at the National High Magnetic Field Laboratory’s Advanced Magnetic Resonance Imaging and Spectroscopy (AMRIS) Facility. The facility is supported by National Science Foundation Cooperative Agreement DMR- 1644779 and the State of Florida.
References
- Ishida, H. Characterization of Composite Materials, (Materials Characterization Series), 1st ed.; Momentum Press: Buchanan, NY, USA, 2009; p. 277. [Google Scholar]
- Brown, R.W.; Cheng, Y.C.N.; Haacke, E.M.; Thompson, M.R.; Venkatesan, R. Magnetic Resonance Imaging: Physical Principles and Sequence Design, 1st ed.; John Wiley & Sons: Hoboken, NJ, USA, 2014; p. 914. [Google Scholar]
- Callaghan, P.T. Principles of Nuclear Magnetic Resonance Microscopy, 1st ed.; Oxford University Press Inc.: New York, NY, USA, 1991; p. 516. [Google Scholar]
- Nieminen, Antti O.K.; Liu, Juwhan; Koenig, Jack L. J. Adhes. Sci. Technol. 1989, 3(1), 455–462.
- Olson, J. R.; Chang, S. J. Can. J. For. Res. 1990, 20, 586–591.
- Hall, L. D.; Rajanayagam, V.; Stewart, W. A.; Steiner, P. R. Can. J. For. Res. 1986, 16(2), 423–426.
- Bucur, V. Nuclear magnetic resonance. In Nondestructive Characterization and Imaging of Wood; Springer-Verlag: Berlin, 2003; pp. 215–279. [Google Scholar]
- Stenstrom, S.; Bonazzi, C.; Foucat, L. Magnetic resonance imaging for determination of moisture profiles and drying curves. In Modern Drying Technology: Experimental Techniques; Tsotsas, E., Mujumdar, A. S., Eds.; Wiley-VCH Verlag GmbH & Co. KGaA: Weinheim, Germany, 2009; pp. 91–142. [Google Scholar]
- Florance, Edwin R. Conference Paper presented at the Sudden Oak Death Second Science Symposium: The State of Our Knowledge, January 18-21, 2005, Monterey, California. Lewis & Clark College, 0615 SW Palatine Hill Rd.: Portland, OR. [CrossRef]
- Lekoa, J.; Richmana, Russell; Schumacher, Christopher. Constr. Build. Mater. 2025, 489.
- Marcinko, Joseph; Parker, Anthony. For. Prod. J. 2024, Vol. 74(No. 2). [CrossRef]
- Parker, Anthony; Marcinko, Joseph. Express Polym. Lett. 2026, Vol.20(No.6), 594–616. [CrossRef]
- Jang, Yonghwan; Li, Kaichang. J. Am. Oil Chem. Soc. 2015, 92, 431–438.
- American National Standards Institute. ANSI-HPVA-HP-1-2020 Standard for Hardwood and Decorative Plywood. Available online: https://www.ansi.org.
- Weiger, Markus; Pruessmann, Klass P. MRI with Zero Echo Time. eMagRes 2012, Vol.1(No. 2), 311–321. [Google Scholar]
- Madio, David P.; Lowe, Irving J. Ultra-fast imaging using low flip angles and fids. Magn. Reson. Med. 1995, Vol. 34(No. 4), 525–529. [Google Scholar] [CrossRef] [PubMed]
- Haase, A.; Frahm, J.; Matthaei, D.; Hanicke, W.; Merboldt, K.-D. FLASH imaging: rapid NMR imaging using low flip angle pulses. J. Magn. Reson. 1986, 67(2), 258–266. [Google Scholar] [CrossRef]
- Frihart, C. R.; Birkeland, M. J. Soy properties and soy wood adhesives. In Soy-based chemicals and materials’; Brentin, R. P., Ed.; American Chemical Society: Washington, DC, 2014; Vol. 1178, pp. 167–192. [Google Scholar]
Figure 1.
is a two-dimensional (2D) cross sectional image of a plywood sample made with PAE crosslinked adhesive (Sample 67-3). The sample was soaked in water for 24 hours prior to imaging.
Figure 1.
is a two-dimensional (2D) cross sectional image of a plywood sample made with PAE crosslinked adhesive (Sample 67-3). The sample was soaked in water for 24 hours prior to imaging.
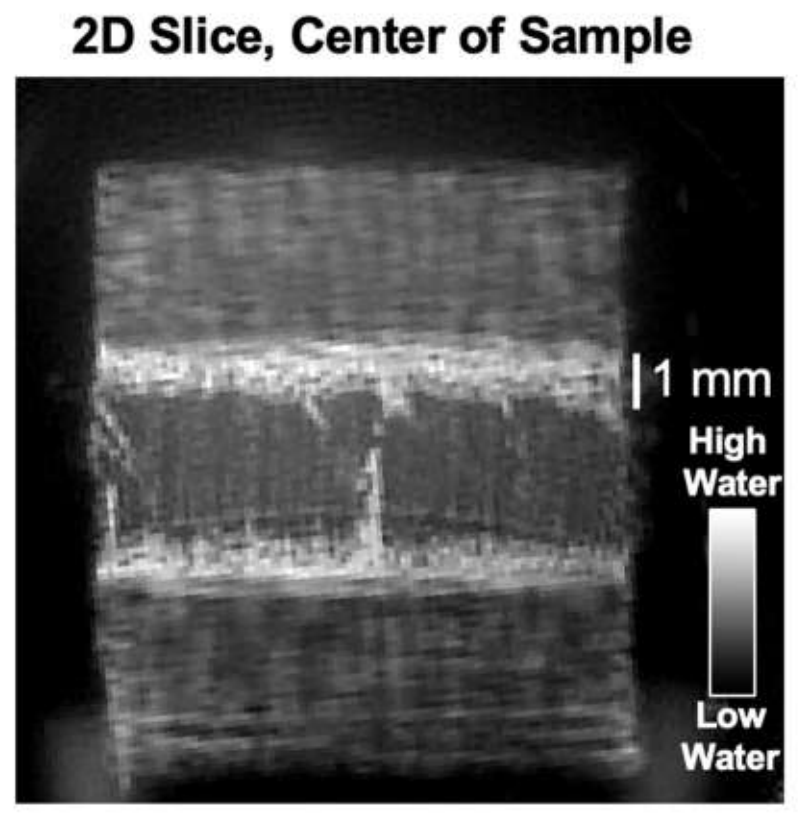
Figure 2.
is a two-dimensional (2D) cross sectional image of a plywood sample made with neat soy adhesive (no PAE crosslinker) (Sample 67-4). The sample was soaked in water for 24 hours prior to imaging.
Figure 2.
is a two-dimensional (2D) cross sectional image of a plywood sample made with neat soy adhesive (no PAE crosslinker) (Sample 67-4). The sample was soaked in water for 24 hours prior to imaging.
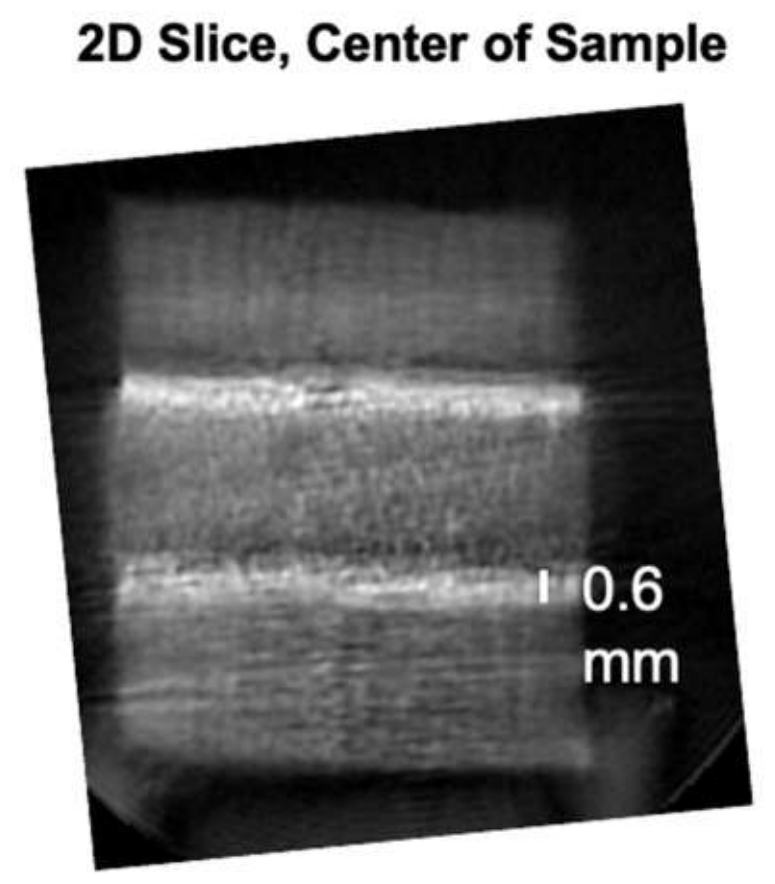
Figure 4.
is a two-dimensional (2D) cross sectional image of a plywood sample made with moisture cured polyurethane adhesive which was soaked in water for 24 hours prior to imaging.
Figure 4.
is a two-dimensional (2D) cross sectional image of a plywood sample made with moisture cured polyurethane adhesive which was soaked in water for 24 hours prior to imaging.
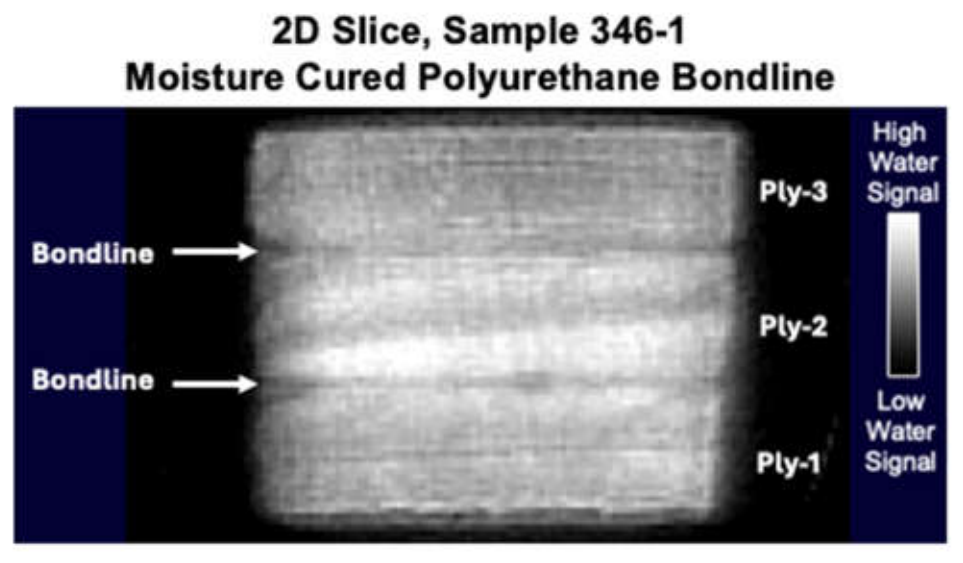
Figure 5.
contains two-dimensional (2D) cross sectional images of a plywood samples made with Soy/MgO adhesives containing Surface Treated Soy Meal. The samples were soaked in water for 24 hours prior to imaging.
Figure 5.
contains two-dimensional (2D) cross sectional images of a plywood samples made with Soy/MgO adhesives containing Surface Treated Soy Meal. The samples were soaked in water for 24 hours prior to imaging.
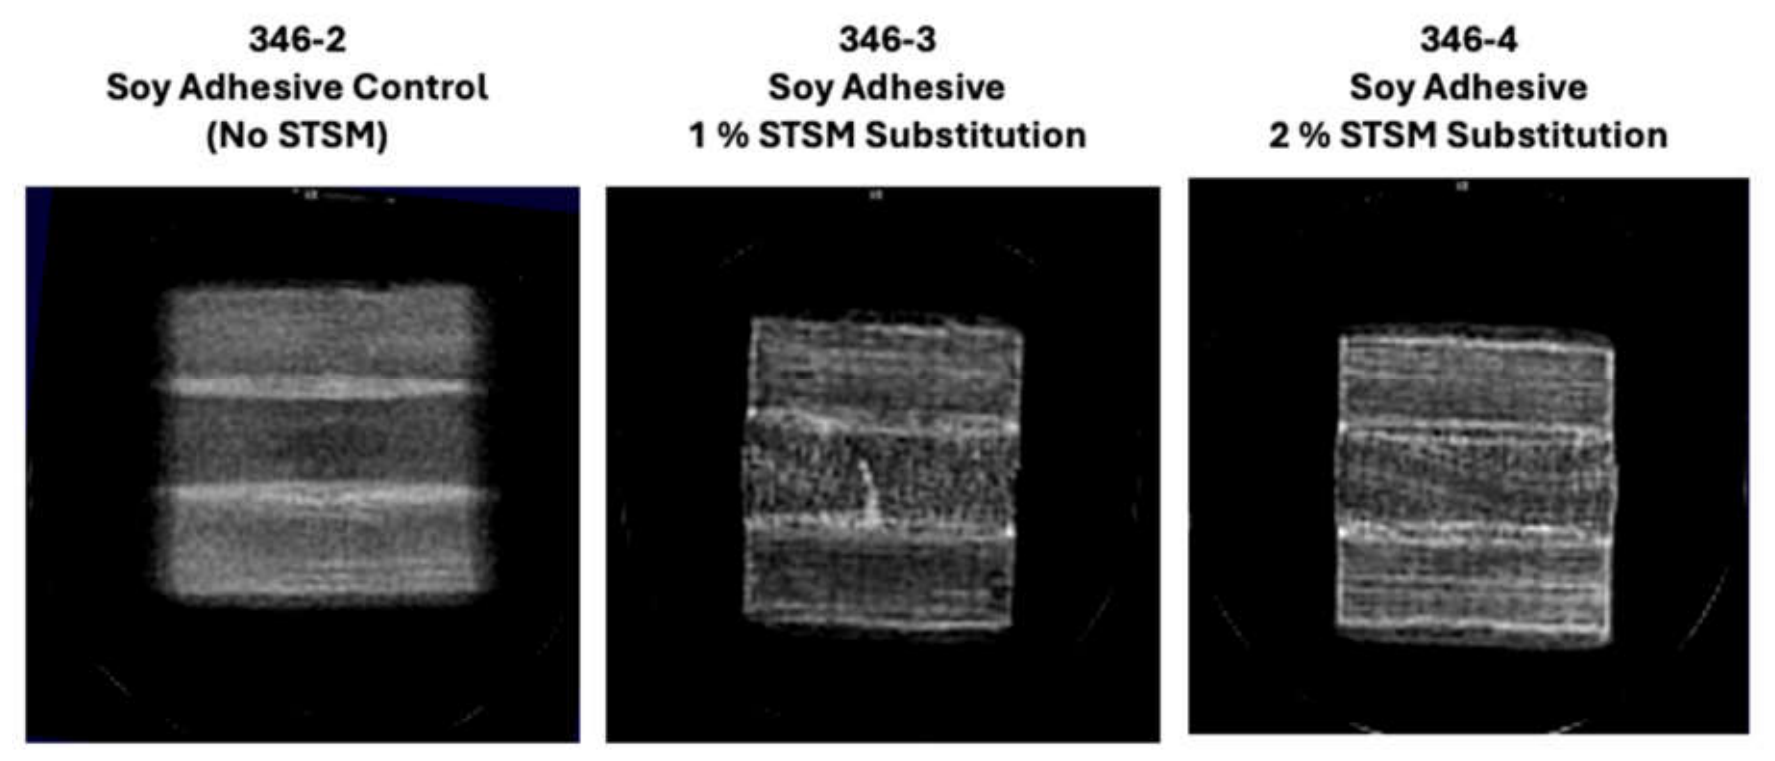
Figure 6.
Three-dimensional (3D) images and Signal Intensity Profile across the sample for plywood sample 346-2 made with the Soy/MgO control adhesive that did not contain STSM.
Figure 6.
Three-dimensional (3D) images and Signal Intensity Profile across the sample for plywood sample 346-2 made with the Soy/MgO control adhesive that did not contain STSM.
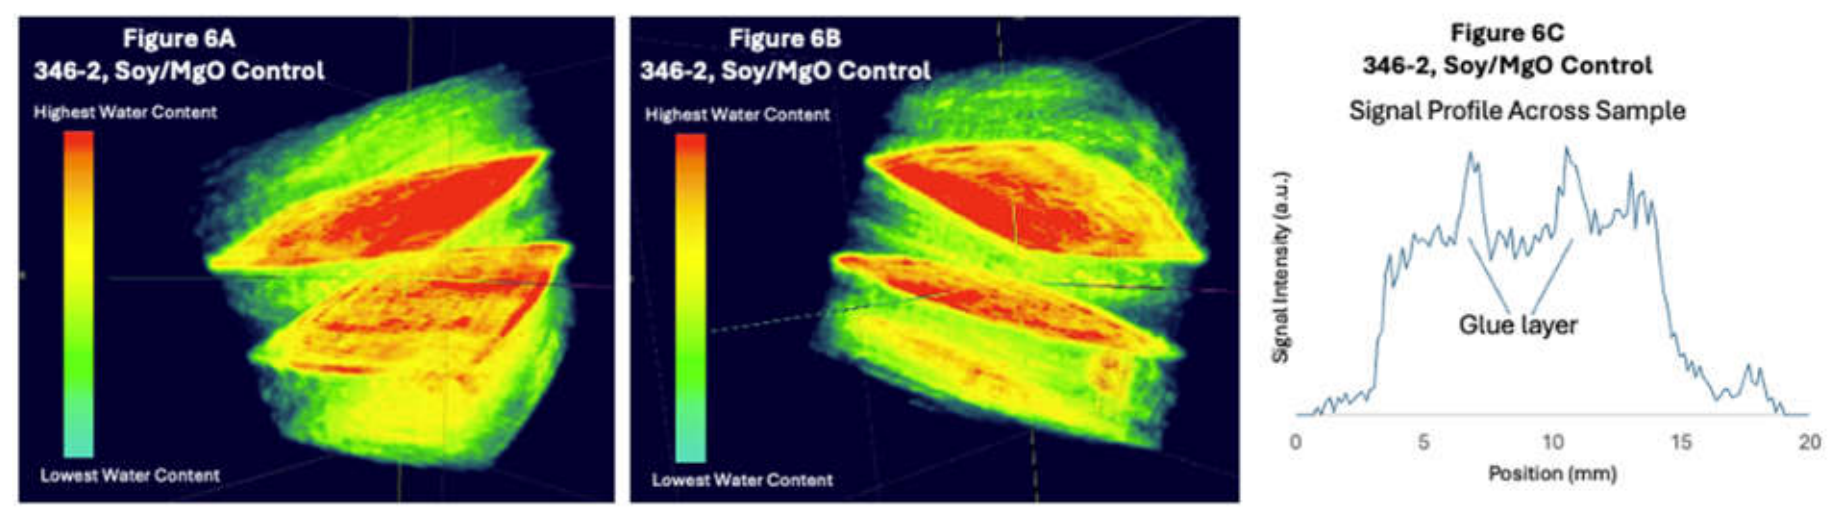
Figure 7.
Three-dimensional (3D) images and Signal Intensity Profile across the sample for plywood sample 346-3 made with the Soy/MgO adhesive that contained 1% STSM.
Figure 7.
Three-dimensional (3D) images and Signal Intensity Profile across the sample for plywood sample 346-3 made with the Soy/MgO adhesive that contained 1% STSM.
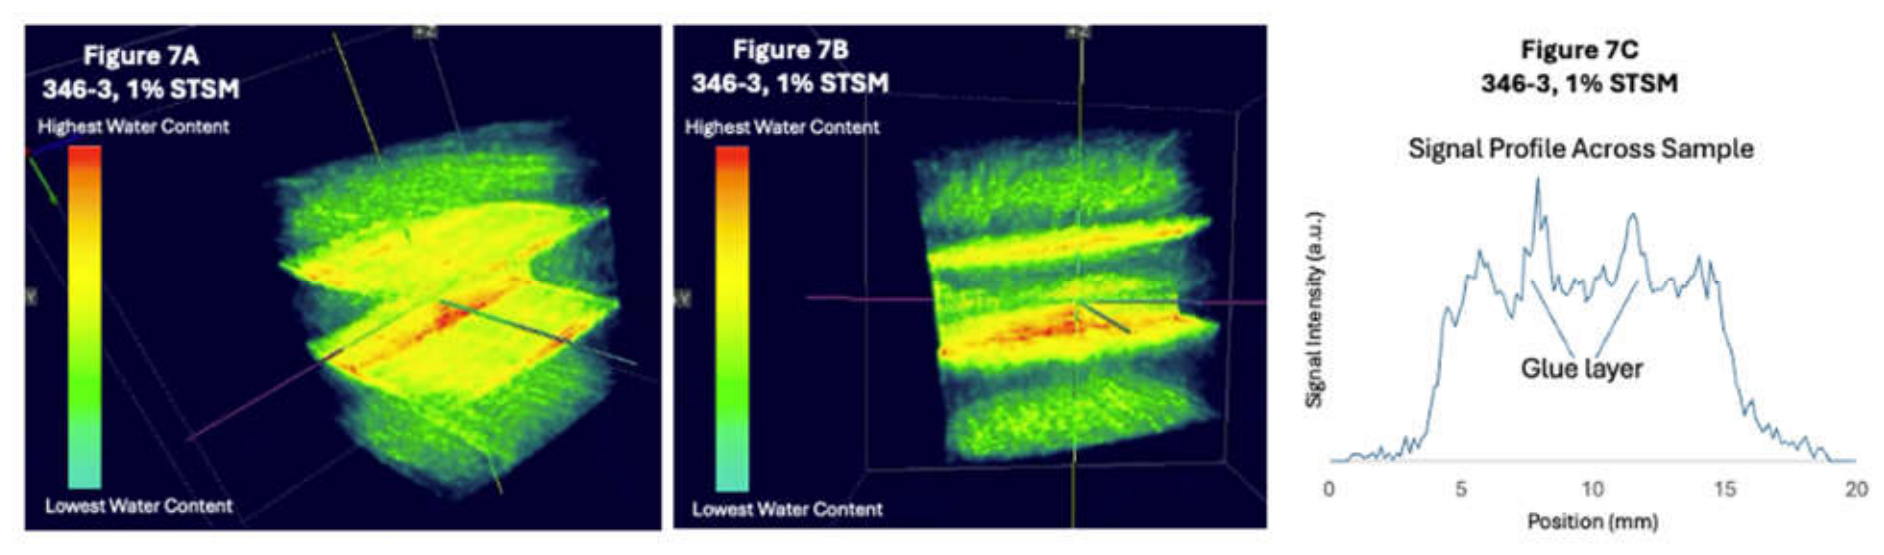
Figure 8.
Three-dimensional (3D) images and Signal Intensity Profile across the sample for plywood sample 346-4 made with the Soy/MgO adhesive that contained 2% STSM.
Figure 8.
Three-dimensional (3D) images and Signal Intensity Profile across the sample for plywood sample 346-4 made with the Soy/MgO adhesive that contained 2% STSM.
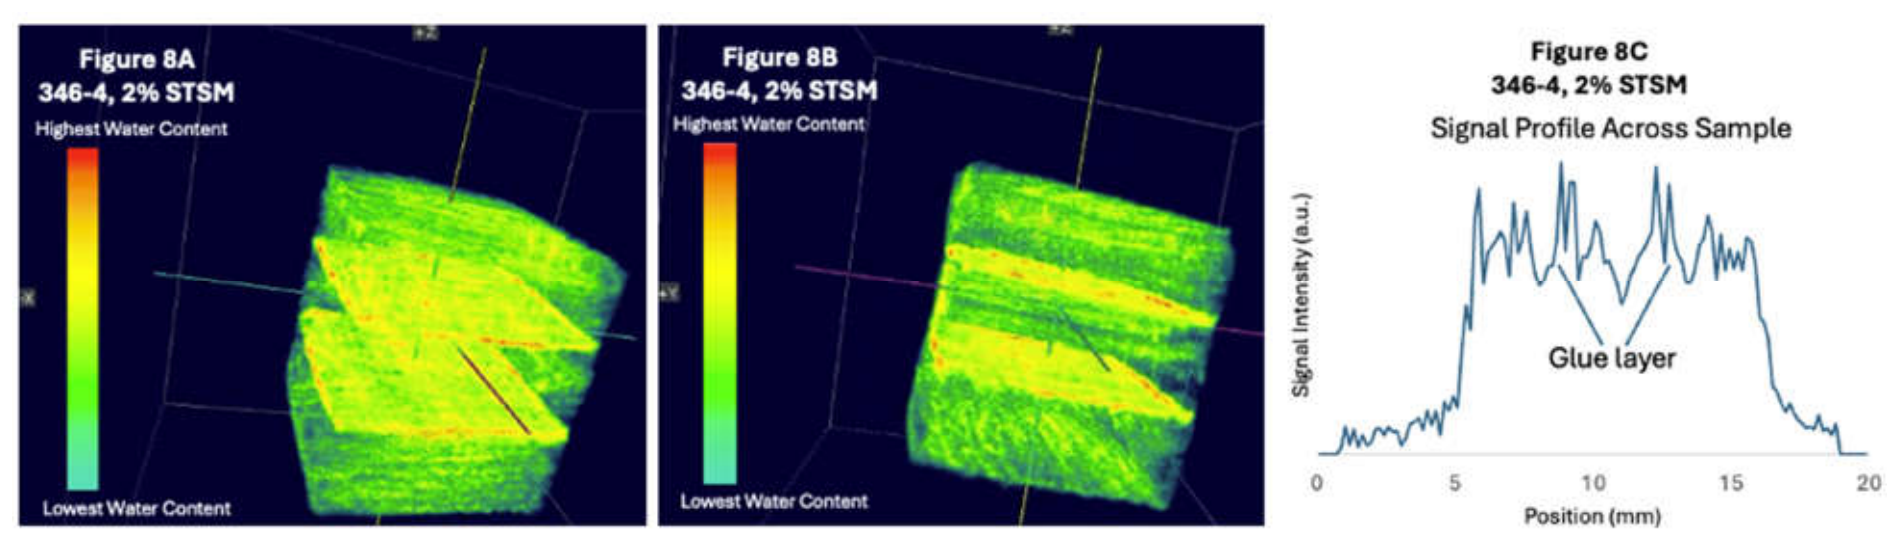
Figure 9.
3-Cycle Soak data of plywood samples 346-2, 3, and 4 obtained from ANSI/HPVA 2020 testing. The numbers represent the percentage of plywood samples that pass the soak/dry cyclic test. Green represents passing, yellow represents marginal, and red represents failure.
Figure 9.
3-Cycle Soak data of plywood samples 346-2, 3, and 4 obtained from ANSI/HPVA 2020 testing. The numbers represent the percentage of plywood samples that pass the soak/dry cyclic test. Green represents passing, yellow represents marginal, and red represents failure.
Disclaimer/Publisher’s Note: The statements, opinions and data contained in all publications are solely those of the individual author(s) and contributor(s) and not of MDPI and/or the editor(s). MDPI and/or the editor(s) disclaim responsibility for any injury to people or property resulting from any ideas, methods, instructions or products referred to in the content. |
© 2026 by the authors. Licensee MDPI, Basel, Switzerland. This article is an open access article distributed under the terms and conditions of the Creative Commons Attribution (CC BY) license (http://creativecommons.org/licenses/by/4.0/).
Copyright: This open access article is published under a Creative Commons CC BY 4.0 license, which permit the free download, distribution, and reuse, provided that the author and preprint are cited in any reuse.