

Submitted:
19 August 2026
Posted:
19 August 2026
You are already at the latest version
Abstract
This article examines seasonal population redistribution across 3,214 mobility areas in Spain on four dates in 2021. Five non-redundant indicators capture resident retention, outbound mobility, inbound pressure, and the diversity of mobility connections. Horn's parallel analysis retained two principal components, which together explained 77.58% of the variance: connected resident dispersal and receiving connectivity. A repeated-measures multivariate test revealed a large joint seasonal effect, F(15, 3194) = 1630.85, p < 0.001, partial eta-squared = 0.885. K-means clustering of complete 20-variable trajectories identified 1,606 connected-emitting areas and 1,603 seasonal-receiving areas. The classification was highly stable under subsampling (mean adjusted Rand index = 0.971), although the clusters were only moderately separated (silhouette = 0.247). Area fixed-effects models showed that the association between heritage concentration and both components varied by date. In a partial redundancy analysis, heritage concentration accounted for an additional 0.69% of trajectory variance after resident population and autonomous community were controlled (999-permutation p = 0.001). The conclusion remained unchanged after rank transformation, exclusion of sparse heritage-score extremes, and winsorization of the outcomes. Heritage concentration matters, but it is not the main driver of seasonal reception. By distinguishing connectivity, population emission, and temporary receiving pressure, the framework supports more targeted regional tourism planning.
Keywords:
heritage tourism
; seasonal mobility
; mobile-phone data
; population pressure
; principal component analysis
; territorial clustering
; sustainable tourism planning
; Spain
1. Introduction
Tourism alters the number and composition of people present in a destination. At peak times, temporary arrivals can exceed the registered resident population in some places, while other areas lose residents to travel. These shifts affect transport, public services, housing, heritage conservation, and the territorial distribution of tourism benefits [13,14,15]. Annual arrival statistics capture overall volume but often hide this redistribution because they treat destinations as fixed containers rather than nodes in a seasonal mobility system [5,12].
This problem is particularly important in heritage tourism. Architectural and cultural assets can attract visitors, shape destination image, reinforce local identity, and contribute to regional resilience, including in rural and peripheral areas [2,16,17,18,19,20,30]. Heritage alone, however, does not guarantee balanced tourism development. Evidence linking cultural assets to inbound demand and regional outcomes remains mixed [19,21,27,28]. Accessible destinations may face recurring peaks, whereas heritage-rich places with weaker tourism systems may function mainly as origins of travel. Sustainable planning therefore needs indicators that separate attraction, retention, outward mobility, and temporary population pressure instead of relying on visitor totals alone [14,18].
Mobile-phone positioning data help address this measurement gap by recording population presence at fine temporal and territorial scales [3,4,5,6]. Studies at national and destination levels have used these data to identify seasonal tourism spaces, reconstruct destination networks, and uncover spatial interactions that accommodation statistics cannot capture [5,6,9,10]. More recent work combining mobile traces with points of interest and geographic information has shown their value for segmenting visitor movement and informing destination management [37]. Research in official statistics also supports their use in estimating the population present at different times [38]. Even so, mobile data do not reliably identify travel motives and may diverge from onsite GPS observations [7,8,39]. Their clearest contribution is to show where people are present and how populations enter and leave an area.
Our earlier article, Heritage Tourism in Spain: Territorial Differentiation in Tourism Intensity and Cultural Heritage Concentration, developed indicators of internal and external tourism intensity, heritage tourism density, and heritage concentration for 3,214 Spanish areas [1]. One-way analyses revealed provincial differences, but they did not examine how the mobility variables operated together or whether their relationships changed across seasonal dates. The present research moves beyond that design by using the original date-specific records in a longitudinal multivariate analysis. Its focus is population redistribution rather than tourism expenditure.
The article contributes in three ways. It first establishes a non-redundant measurement framework that excludes indicators linked by exact accounting identities from the same multivariate model. It then identifies the main mobility dimensions and classifies areas according to their four-date trajectories. Finally, it tests whether heritage concentration adds explanatory information once population size and regional context are taken into account, and translates the resulting profiles into differentiated planning priorities. The analysis is associative and diagnostic; it does not claim that heritage causes the observed mobility patterns.
2. Literature Review and Conceptual Framework
2.1. Heritage-Led Regional Development and Territorial Imbalance
Cultural heritage can reinforce destination identity, diversify local economies, and support place-based development [16,17,19,26]. These benefits depend on governance, accessibility, interpretation, local participation, and the capacity to reconcile tourism use with conservation [17,18,26]. For this reason, current indicator frameworks combine economic, social, cultural, and management dimensions rather than treating monument counts as outcomes in their own right [16,17,18]. A critical review similarly calls for explicit tests of reliability and validity, the inclusion of governance measures, and longitudinal monitoring of cultural-tourism sustainability indicators [40].
Tourism geography reflects simultaneous forces of agglomeration and dispersion. Concentrated attractions, transport connections and service economies draw visitors toward established destinations, whereas preferences for authenticity and less crowded experiences may distribute demand toward smaller places [9,12,15]. This tension matters for regional policy: concentration can improve visibility and economic efficiency but can also intensify seasonal pressure [14,15], while dispersion can extend benefits if peripheral destinations have adequate accessibility and management capacity [17,26].
Heritage concentration is best understood as an enabling territorial resource rather than a sufficient explanation of tourism reception. Heritage and tourism may strengthen regional resilience, but their effects vary between domestic and inbound markets and depend on the surrounding economic structure [19,20]. A heritage-rich area may have diverse travel connections while remaining a net population emitter. Conversely, strong seasonal attraction may reflect coastal, recreational, or metropolitan functions that have little to do with architectural heritage [12]. These configurations can only be separated through a multivariate approach.
2.2. Seasonal Mobility, Ambient Population and Tourism Pressure
The resident population is an incomplete denominator for planning destinations whose effective population changes sharply. Ambient-population approaches measure the people present in an area at a given time and thereby improve the assessment of pressure on infrastructure and public space [13]. In tourism settings, the ratio of non-residents staying in an area to its resident population is especially informative because it expresses visitor presence relative to local service and residential capacity [13,14,15].
Seasonality is not limited to variation in arrivals. It also changes resident retention, the diversity of destinations reached by residents, the origins from which non-residents arrive and the net balance between population gained and lost. Passive mobile data can capture complex seasonal tourism mobilities in coastal settings [3,6], while European typologies show that coastal, urban, mountain and rural regions exhibit distinct intensity and seasonality profiles [12]. Accessibility can also redistribute demand toward lower seasons, as Spanish high-speed rail evidence demonstrates [22]. At the national scale, the same logic can reveal whether territories follow common trajectories or separate into distinctive receiving and emitting profiles.
The pressure indicator must be interpreted carefully. A high inbound-pressure ratio signals potential demand on local systems, but it does not by itself demonstrate overtourism or harm. Overtourism is multidimensional, sensitive to spatial scale, and shaped by wider urban and regional systems rather than visitor numbers alone [14,15,29]. Assessing adverse effects requires additional evidence on capacity, housing, congestion, environmental conditions, and resident perceptions [14,29]. Accordingly, this article treats inbound pressure as an exposure indicator, not as a normative threshold.
2.3. Multivariate Territorial Profiles
Mobility indicators are correlated and some are algebraically dependent. Principal component analysis (PCA) is useful for summarizing non-redundant indicators into interpretable dimensions while retaining most of their variance [23]. Clustering can then identify areas with similar seasonal trajectories without imposing administrative boundaries; comparable trajectory and regional-typology studies demonstrate the planning value of data-driven classification [10,11,12]. The silhouette coefficient evaluates the compactness and separation of the resulting groups [24].
Combining dimension reduction and trajectory clustering serves two different purposes. PCA explains how indicators covary across all area-date observations; trajectory clustering classifies complete four-date paths. The first reveals the structure of mobility, while the second produces planning-relevant territorial types. Heritage concentration can subsequently be examined as an external attribute rather than included mechanically in the clustering solution.
2.4. Heritage Concentration as a Contextual Multivariate Predictor
Heritage resources can make destinations more distinctive, reinforce place identity, and motivate travel, but their mobility effects emerge within a broader territorial system [16,17,18,19,20,21]. Accessibility, accommodation, metropolitan functions, coastal amenities, complementary attractions, and governance all influence whether cultural assets generate visits and locally retained benefits [17,18,19,20,26,27,28]. Heritage concentration may therefore contribute to the combined pattern of seasonal retention, emission, reception, and connectivity without dominating any single mobility indicator.
Recent evidence supports this conditional view. Research in peripheral European regions shows that cultural assets do not become coherent tourism products without transport links, destination-management capacity, and sustained networks of local actors [34]. Other empirical work describes the relationship between heritage tourism and local prosperity as contested rather than automatic [35]. Unequal access can also direct visitors towards already prominent heritage spaces [36]. In this framework, heritage is an enabling resource whose effects depend on territorial capabilities.
Testing this argument requires a conditional multivariate model. Bivariate correlations cannot establish whether heritage contributes information beyond population scale and stable regional differences. Partial redundancy analysis addresses this question by estimating the additional variance associated with one contextual predictor after the specified covariates have been removed from an entire response matrix [33]. Because mobility has many non-heritage determinants, we expected the incremental contribution to be detectable but modest.
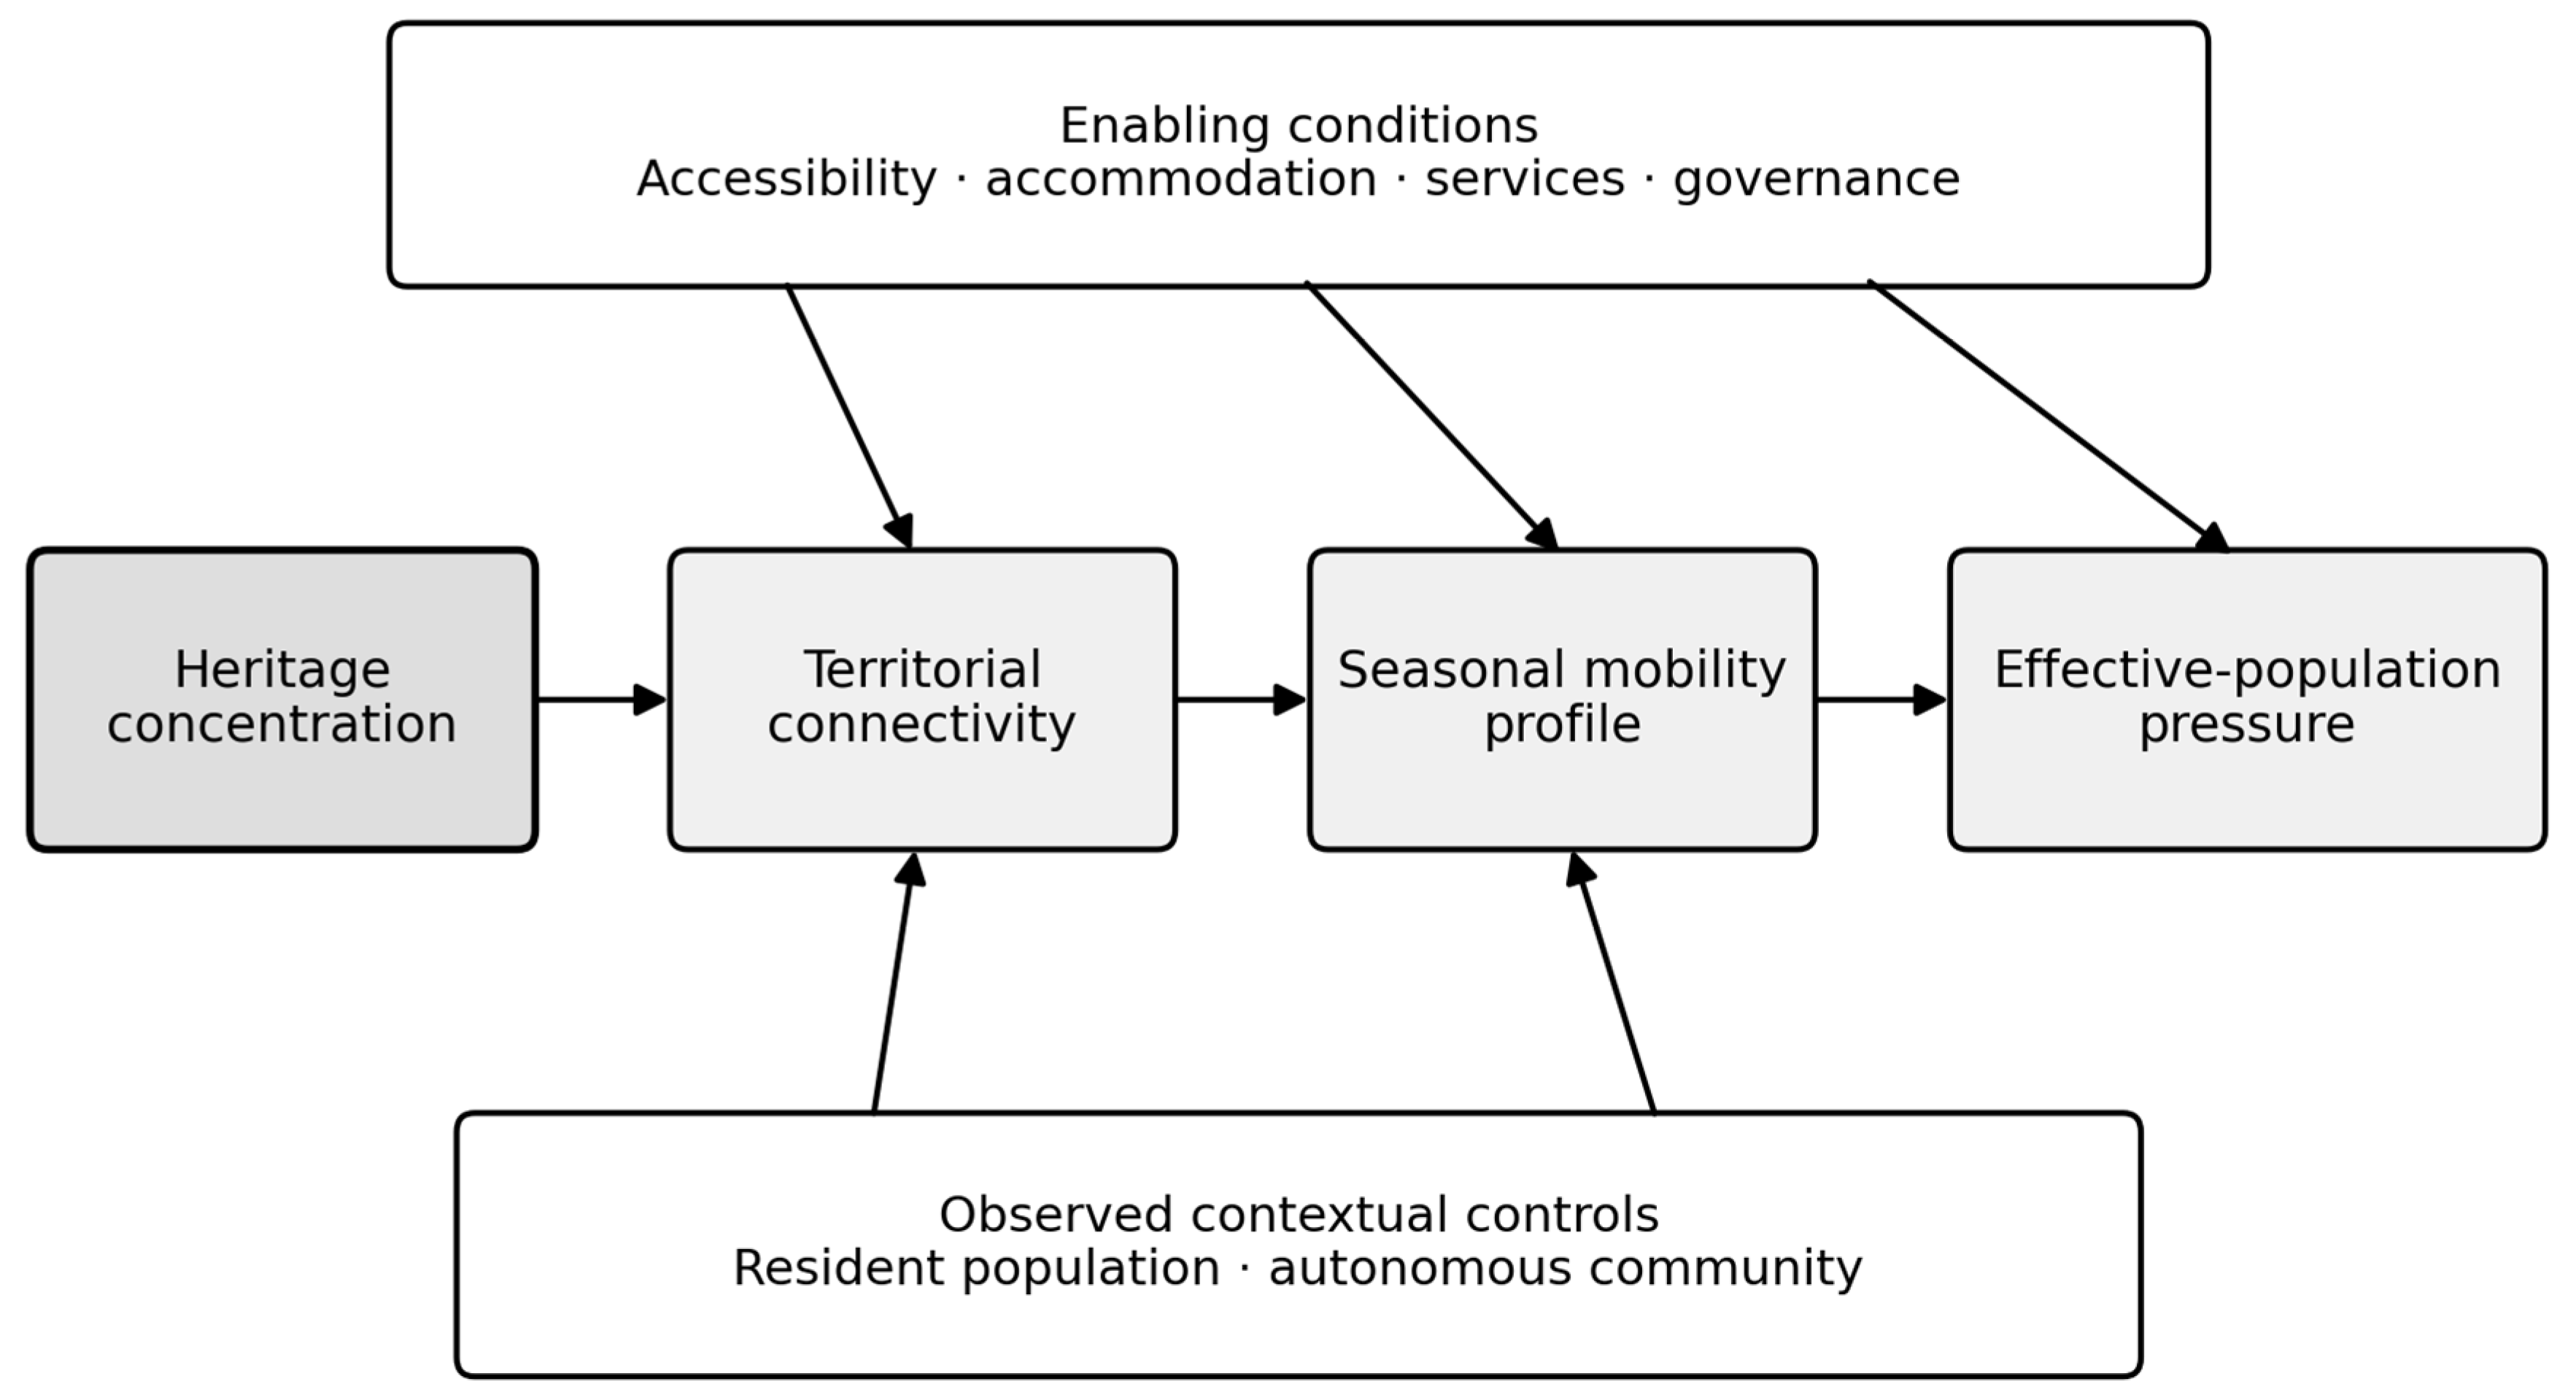
Figure 1.
Conceptual framework linking heritage concentration to seasonal population redistribution. Solid arrows represent the proposed enabling pathway; upper and lower boxes identify unobserved enabling conditions and observed contextual controls, respectively.
Figure 1.
Conceptual framework linking heritage concentration to seasonal population redistribution. Solid arrows represent the proposed enabling pathway; upper and lower boxes identify unobserved enabling conditions and observed contextual controls, respectively.
2.5. Research Questions and Hypotheses
RQ1. Which latent dimensions organize seasonal mobility across Spanish territorial areas?
RQ2. Do areas form distinct trajectories of inbound pressure and net population balance?
RQ3. How is heritage concentration associated with mobility connectivity and seasonal territorial profiles?
RQ4. Does heritage concentration explain incremental multivariate trajectory variance after population and regional controls?
H1. Seasonal mobility indicators will be represented by a small number of interpretable multivariate dimensions related to resident mobility, receiving pressure and territorial connectivity.
H2. Spanish mobility areas will separate into empirically distinct seasonal receiving and emitting profiles.
H3. Heritage concentration will be positively associated with mobility connectivity, measured by destination and origin diversity.
H4. The association between heritage concentration and population redistribution will vary across seasonal dates.
H5. After controlling for resident population and autonomous community, heritage concentration will explain a statistically significant but modest incremental share of the complete multivariate seasonal mobility trajectory.
3. Materials and Methods
3.1. Research Design and Data Source
We used a quantitative, observational, longitudinal design. Data were drawn from the Spanish National Statistics Institute's Experimental Statistics, which are based on aggregated and anonymized mobile-phone positioning [25]. The unit of analysis was the INE mobility area. The balanced panel comprised 3,214 areas observed on 17 July, 15 August, 21 November, and 25 December 2021, for a total of 12,856 area-date observations.
The four dates capture contrasting high- and lower-mobility periods within the same year. They are repeated seasonal snapshots rather than a continuous monthly series. The workbook also contained a sheet labelled as an annual average, but an audit showed that its population totals aggregated the four date-specific records. We therefore did not treat it as a fifth observation; only the time-invariant Heritage Concentration score was linked from that sheet.
The analysis concerns territorial aggregates, not identifiable individuals. The public dataset contains no personal identifiers and the study did not involve recruitment, intervention or contact with human participants.
3.2. Measures
The mobility workbook contains several exact accounting identities: B = C + D, F = C + E, the non-retention percentage equals 100 minus resident retention, and the total-population ratio equals 100 plus the net-balance percentage. Including all derived variables in a PCA or regression would create deterministic multicollinearity. The multivariate input was therefore restricted to five conceptually distinct measures: retention, outbound mobility, inbound pressure, destination diversity and origin diversity.
Inbound pressure, destination diversity, and origin diversity were transformed using log(1+x) because their distributions were positively skewed. Entries recorded as fewer than five in the origin-diversity field were assigned the midpoint value of 2.5; this affected only six records. The Heritage Concentration score was concentrated between 5 and 8, with six areas scoring 3 and five scoring 9. We therefore treated it as an ordinal-continuous contextual attribute rather than dividing the sample into seven highly unequal categories.

Table 1.
Analytical variables and operational definitions.
| Construct | Operationalization | Role |
|---|---|---|
| Resident retention | 100 × resident population staying in its area (C) / resident population (A) | PCA; descriptive |
| Outbound mobility | 100 × residents found staying in another area (D) / A | PCA; descriptive |
| Inbound pressure | 100 × non-residents staying in the area (E) / A | PCA; trajectory clustering |
| Net population balance | 100 × [total population staying in area (F) − A] / A | Trajectory clustering |
| Destination diversity | Number of distinct overnight-stay areas used by residents | PCA; heritage association |
| Origin diversity | Number of distinct residence areas supplying people staying in the area | PCA; heritage association |
| Heritage concentration | Standardized expert/AI-assisted ordinal score from 1 (minimum) to 10 (maximum) | External territorial attribute |
Notes: A, C, D, E and F follow the labels in the INE-derived workbook. Heritage scores observed in this sample ranged from 3 to 9.
3.3. Heritage Concentration Score
The Heritage Concentration (CP) measure was carried over from the earlier study to maintain continuity in territorial measurement. Each mobility area received a score from 1 to 10 based on four standardized criteria: the number of historical sites and monuments, their historical and cultural significance, the diversity of architectural expressions, and national or international recognition. A consistent AI-assisted protocol generated the initial classifications, which were then reviewed by the authors for coherence.
The score is not an official INE variable and is used here as a contextual territorial attribute. To make its construction auditable, the supplementary materials document the source inventory, scoring rules, classification protocol, model version, and human-review decisions. The results concern associations with this constructed index and should not be interpreted as causal effects of heritage.
3.4. Statistical Analysis
We began by calculating descriptive means for each date. PCA was applied to standardized values of the five non-redundant indicators; inbound pressure and both diversity counts were transformed using log(1+x). The Kaiser-Meyer-Olkin (KMO) statistic and Bartlett's test of sphericity were used to assess sampling adequacy [31]. We retained components through Horn's parallel analysis, based on 250 random normal datasets and the 95th-percentile eigenvalue criterion [32]. Because PCA is a dimension-reduction method rather than a common-factor model, a low KMO was treated as a constraint on latent interpretation, not as a reason to reject descriptive data compression.
Joint seasonal change within areas was evaluated with a repeated-measures multivariate procedure. For each of the five standardized outcomes, we calculated three Helmert contrasts across July, August, November, and December, producing a 15-dimensional contrast vector for every area. A one-sample Hotelling T-squared test determined whether the mean vector differed from zero; the statistic was then converted to F and partial eta-squared.
All analyses were run in Python 3. Data management used pandas, numerical operations used NumPy, correlations used SciPy, and standardization, PCA, k-means estimation, and silhouette diagnostics used scikit-learn. Exact package versions are recorded in the archived reproducibility environment.
Complete four-date trajectories were represented by 20 standardized values: retention, outbound mobility, log inbound pressure, log destination diversity, and log origin diversity at each date. We estimated k-means solutions from k = 2 to k = 8 with 50 random initializations and compared them using the silhouette, Calinski-Harabasz, and Davies-Bouldin indices. Stability was evaluated through 12 repeated 80% subsamples and the adjusted Rand index (ARI). We assigned descriptive profile names only after inspecting the seasonal centroids.
Area fixed-effects models then related the two retained component scores to date and date-by-heritage interactions. November was the reference date, and standard errors were clustered by area. This specification controls for observed and unobserved territorial characteristics that remain constant across the four dates. A partial redundancy analysis subsequently estimated the incremental multivariate variance associated with heritage concentration after log resident population and autonomous community were controlled [33]. Significance was assessed with 999 Freedman-Lane residual permutations. This model provided the confirmatory test of H5; Spearman correlations served as descriptive complements.
Robustness analyses addressed three plausible sources of sensitivity. PCA was repeated after omitting each indicator in turn to determine whether the retained dimensionality depended on one variable. The partial RDA was repeated with rank-transformed heritage, after excluding the 11 areas in the sparse extreme categories 3 and 9, and after winsorizing every trajectory outcome at the 1st and 99th percentiles. Finally, the two-cluster solution was re-estimated with winsorized trajectories and compared with the primary assignment using ARI. All analyses used a fixed random seed of 42.
4. Results
4.1. Seasonal Redistribution of Population
Population redistribution was greatest in August. Resident retention fell to 59.14%, outbound mobility rose to 37.26%, and mean non-resident presence was equivalent to 49.14% of the resident population. The average area gained 8.28% of its resident population on balance. November showed the reverse pattern: higher retention, fewer connections, and a mean net loss of 5.40%. A single annual average would conceal these planning-relevant contrasts.
Table 2.
National mean mobility indicators by observation date.
| Date | Retention (%) | Outbound (%) | Inbound pressure (%) | Net balance (%) | Destinations | Origins |
|---|---|---|---|---|---|---|
| 17 July 2021 | 62.41 | 34.33 | 40.79 | 3.20 | 22.71 | 22.72 |
| 15 August 2021 | 59.14 | 37.26 | 49.14 | 8.28 | 26.56 | 26.56 |
| 21 November 2021 | 64.90 | 28.77 | 29.70 | −5.40 | 16.86 | 16.89 |
| 25 December 2021 | 63.61 | 30.76 | 31.92 | −4.47 | 18.60 | 18.60 |
Notes: Values are unweighted means across 3,214 mobility areas. Percentages use resident population as denominator.
Destination and origin diversity moved in parallel at the national level, increasing from approximately 22.7 connections in July to 26.6 in August and falling below 17 in November. The results indicate that seasonal pressure involved both larger population volumes and a broader geography of connections.
4.2. Component Structure and Multivariate Seasonality
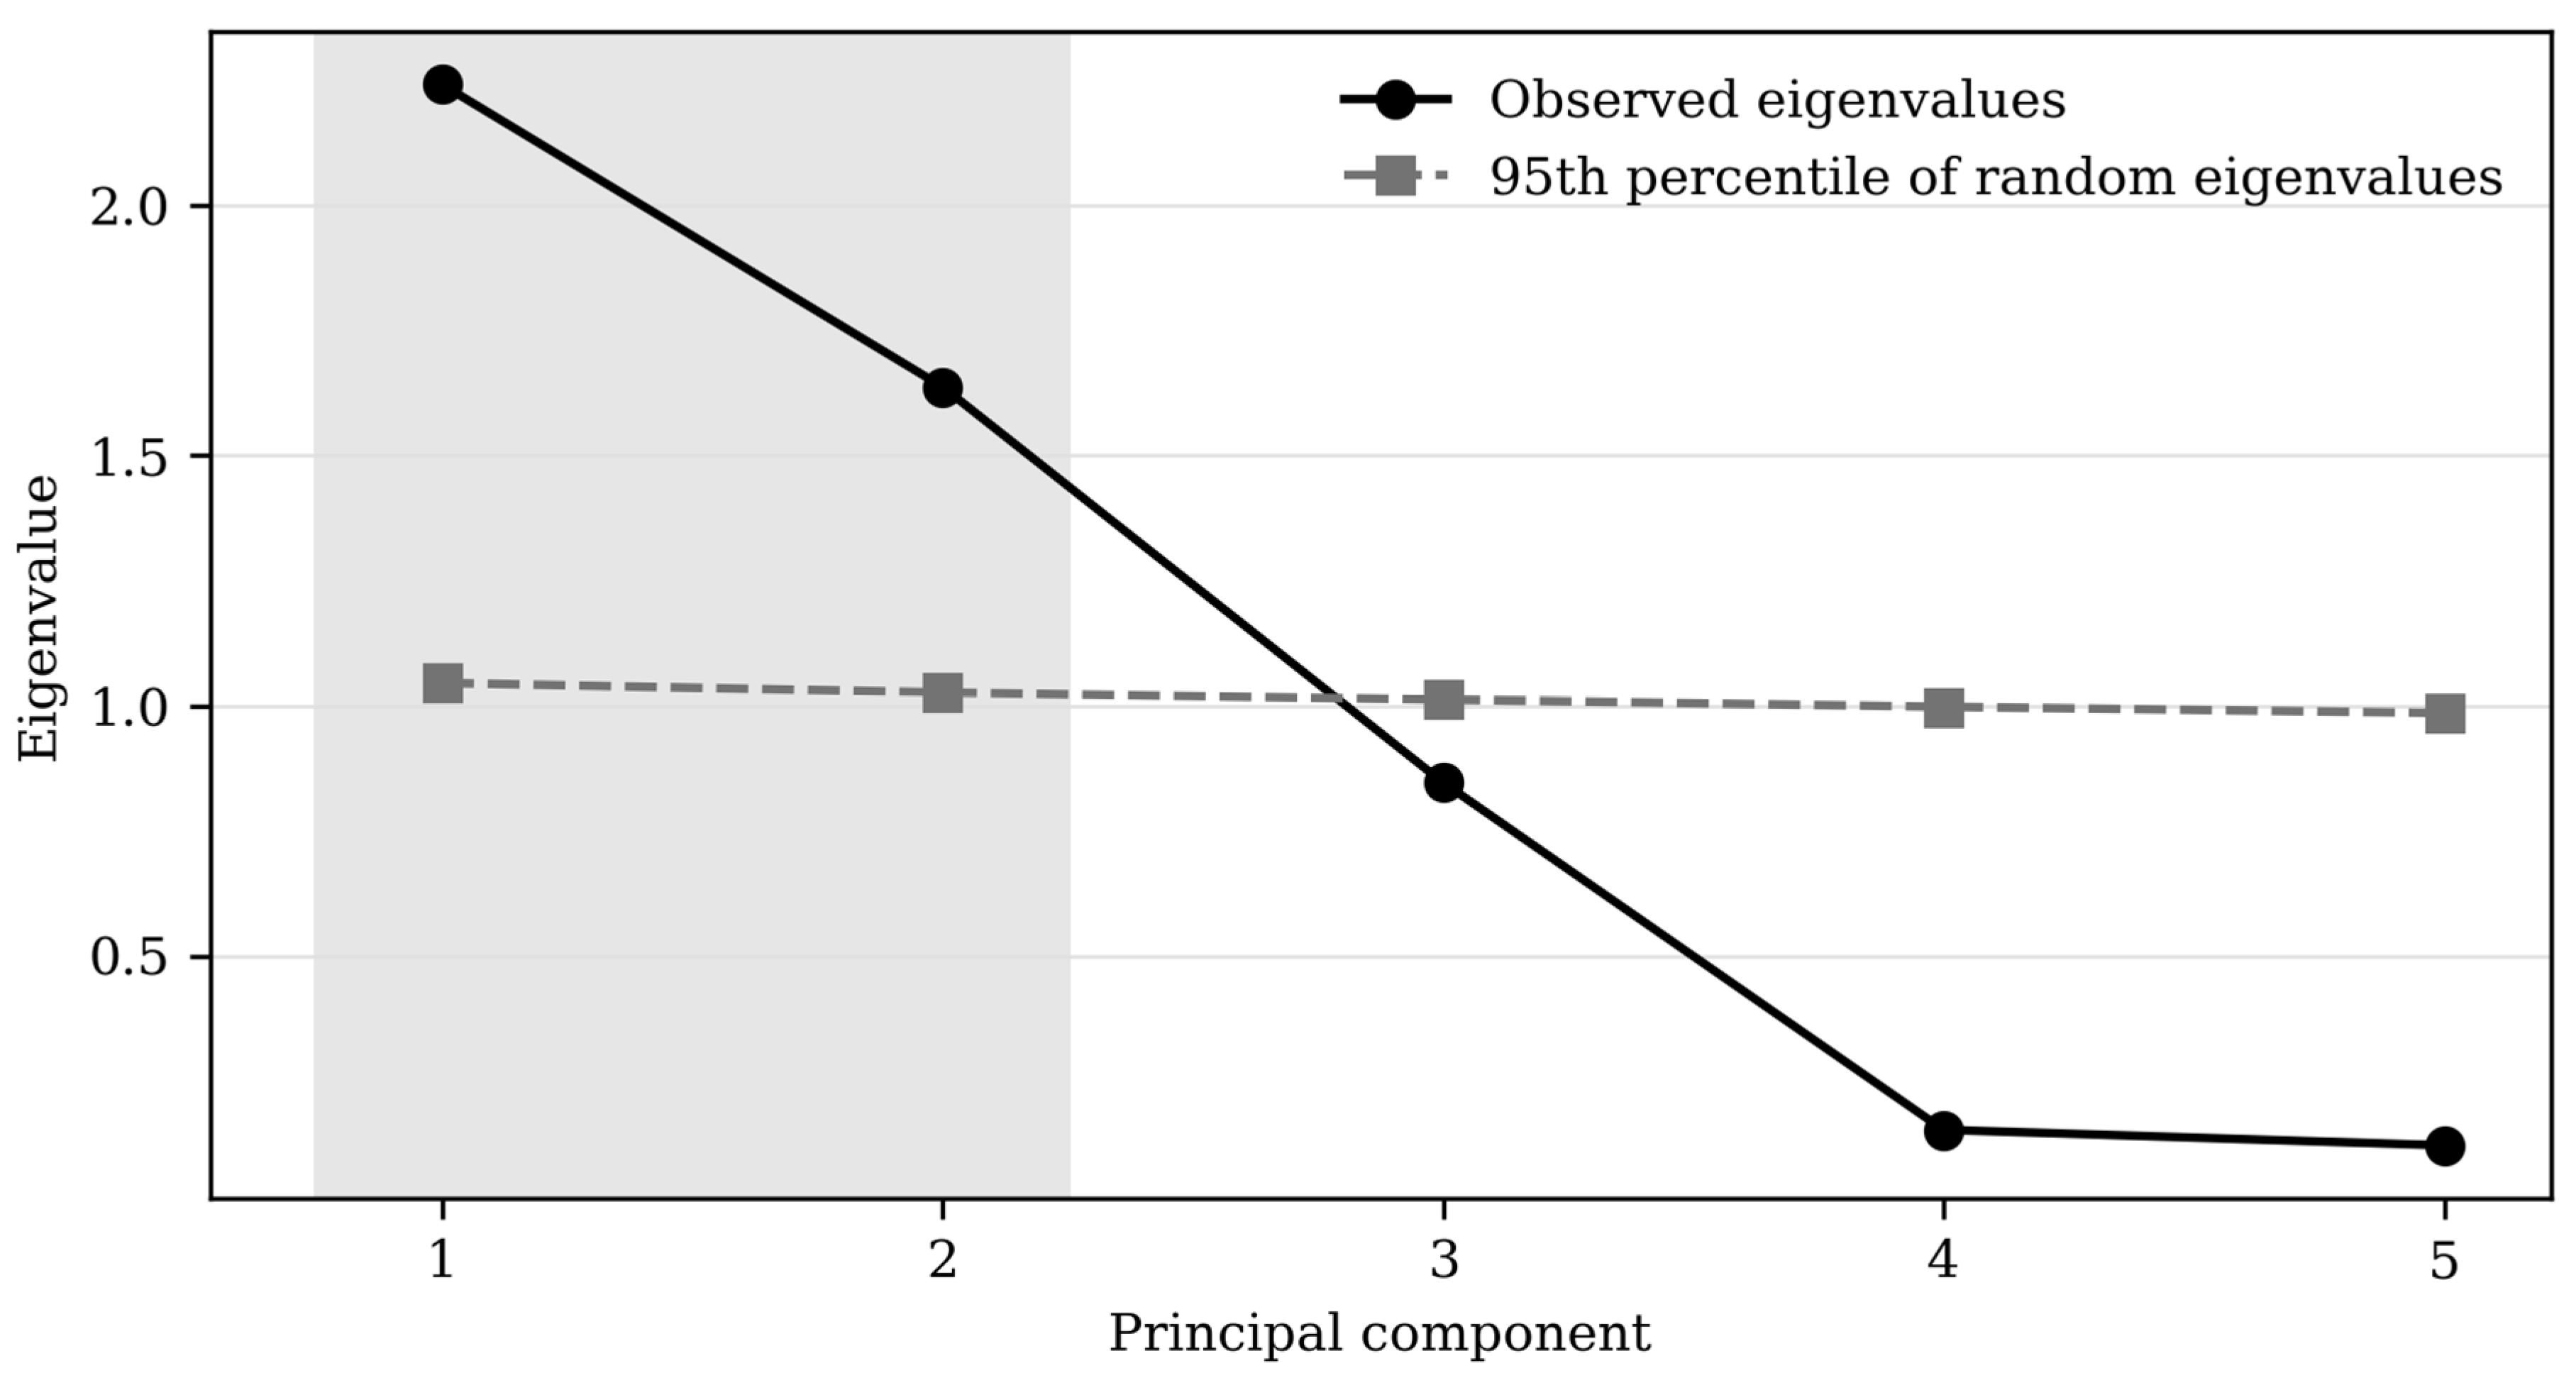
Bartlett's test rejected the hypothesis of an identity correlation matrix, chi-squared(10) = 36,601.68, p < 0.001, although overall sampling adequacy was low (KMO = 0.423). We therefore use PCA as a descriptive summary of heterogeneous mobility indicators, not as evidence of a common latent construct. Horn's parallel analysis retained two components that together explained 77.58% of the variance. PC1 contrasted outbound mobility and destination diversity with resident retention and inbound pressure; we interpret it as connected resident dispersal. PC2 loaded most strongly on origin diversity, destination diversity, and inbound pressure, and represents receiving connectivity. H1 was thus supported with this qualification.
Table 3.
PCA loadings and parallel-analysis decision.
| Indicator | PC1 | PC2 | Communality |
|---|---|---|---|
| Resident retention | −0.599 | −0.043 | 0.806 |
| Outbound mobility | 0.601 | 0.132 | 0.839 |
| Inbound pressure (log) | −0.351 | 0.439 | 0.592 |
| Destination diversity (log) | 0.353 | 0.509 | 0.704 |
| Origin diversity (log) | −0.180 | 0.727 | 0.938 |
| Variance explained (%) | 44.84 | 32.74 | |
| Cumulative variance (%) | 44.84 | 77.58 |
Notes: All variables were standardized. Horn parallel analysis retained PC1 and PC2 because their eigenvalues (2.242 and 1.637) exceeded the simulated 95th percentiles (1.045 and 1.026). Component signs are arbitrary.
The repeated-measures multivariate test demonstrated a large joint seasonal change across the five indicators: Hotelling T-squared = 24,569.93, F(15, 3194) = 1,630.85, p < 0.001, partial eta-squared = 0.885 (n = 3,209 areas). Seasonality therefore affected the mobility system as a coordinated multivariate configuration, not merely individual averages.
Figure 2.
Horn parallel analysis. Components were retained when their observed eigenvalues exceeded the simulated 95th-percentile eigenvalues.
Figure 2.
Horn parallel analysis. Components were retained when their observed eigenvalues exceeded the simulated 95th-percentile eigenvalues.
4.3. Validated Seasonal Trajectory Profiles
The two-profile solution was highly stable (mean bootstrap ARI = 0.971; fifth percentile = 0.939), although the silhouette value of 0.247 shows that the territorial types overlap. Connected-emitting areas combined greater destination diversity and outbound mobility with negative net balances on all four dates. Their mean heritage score was higher (M = 6.64, SD = 1.04) than that of seasonal-receiving areas (M = 6.13, SD = 1.20), a standardized difference of approximately 0.46.
Table 4.
Internal validation and stability of candidate trajectory solutions.
| k | Silhouette | Calinski-Harabasz | Davies-Bouldin | Mean bootstrap ARI |
|---|---|---|---|---|
| 2 | 0.247 | 1148.7 | 1.552 | 0.971 |
| 3 | 0.244 | 1085.2 | 1.377 | 0.983 |
| 4 | 0.228 | 1022.8 | 1.379 | 0.979 |
| 5 | 0.194 | 889.3 | 1.453 | 0.726 |
| 6 | 0.189 | 816.5 | 1.472 | 0.856 |
| 7 | 0.189 | 767.8 | 1.371 | 0.758 |
| 8 | 0.182 | 741.7 | 1.381 | 0.915 |
Notes: ARI is the adjusted Rand index across 12 repeated 80% subsamples. Higher silhouette, Calinski-Harabasz and ARI, and lower Davies-Bouldin, indicate stronger solutions. The two-cluster solution maximized silhouette and Calinski-Harabasz and was retained for parsimony.
Table 5.
Mean seasonal trajectories by validated territorial profile.
| Profile | Date | Retention (%) | Outbound (%) | Inbound pressure (%) | Net balance (%) | Destinations | Origins |
|---|---|---|---|---|---|---|---|
| Connected emitting (n=1,606) | July | 54.5 | 42.0 | 31.3 | −14.2 | 36.2 | 22.7 |
| August | 49.2 | 45.1 | 30.4 | −20.5 | 43.1 | 21.5 | |
| November | 62.9 | 32.3 | 30.0 | −7.1 | 24.4 | 22.8 | |
| December | 60.7 | 36.0 | 32.3 | −7.0 | 27.6 | 25.3 | |
| Seasonal receiving (n=1,603) | July | 70.4 | 26.6 | 50.4 | 20.7 | 9.2 | 22.8 |
| August | 69.2 | 29.4 | 68.0 | 37.2 | 10.0 | 31.7 | |
| November | 66.9 | 25.2 | 29.5 | −3.6 | 9.4 | 10.9 | |
| December | 66.5 | 25.5 | 31.5 | −1.9 | 9.6 | 11.9 |
Notes: Profiles are based on five non-redundant indicators across four dates. Five areas were excluded because at least one origin-diversity value was unavailable.
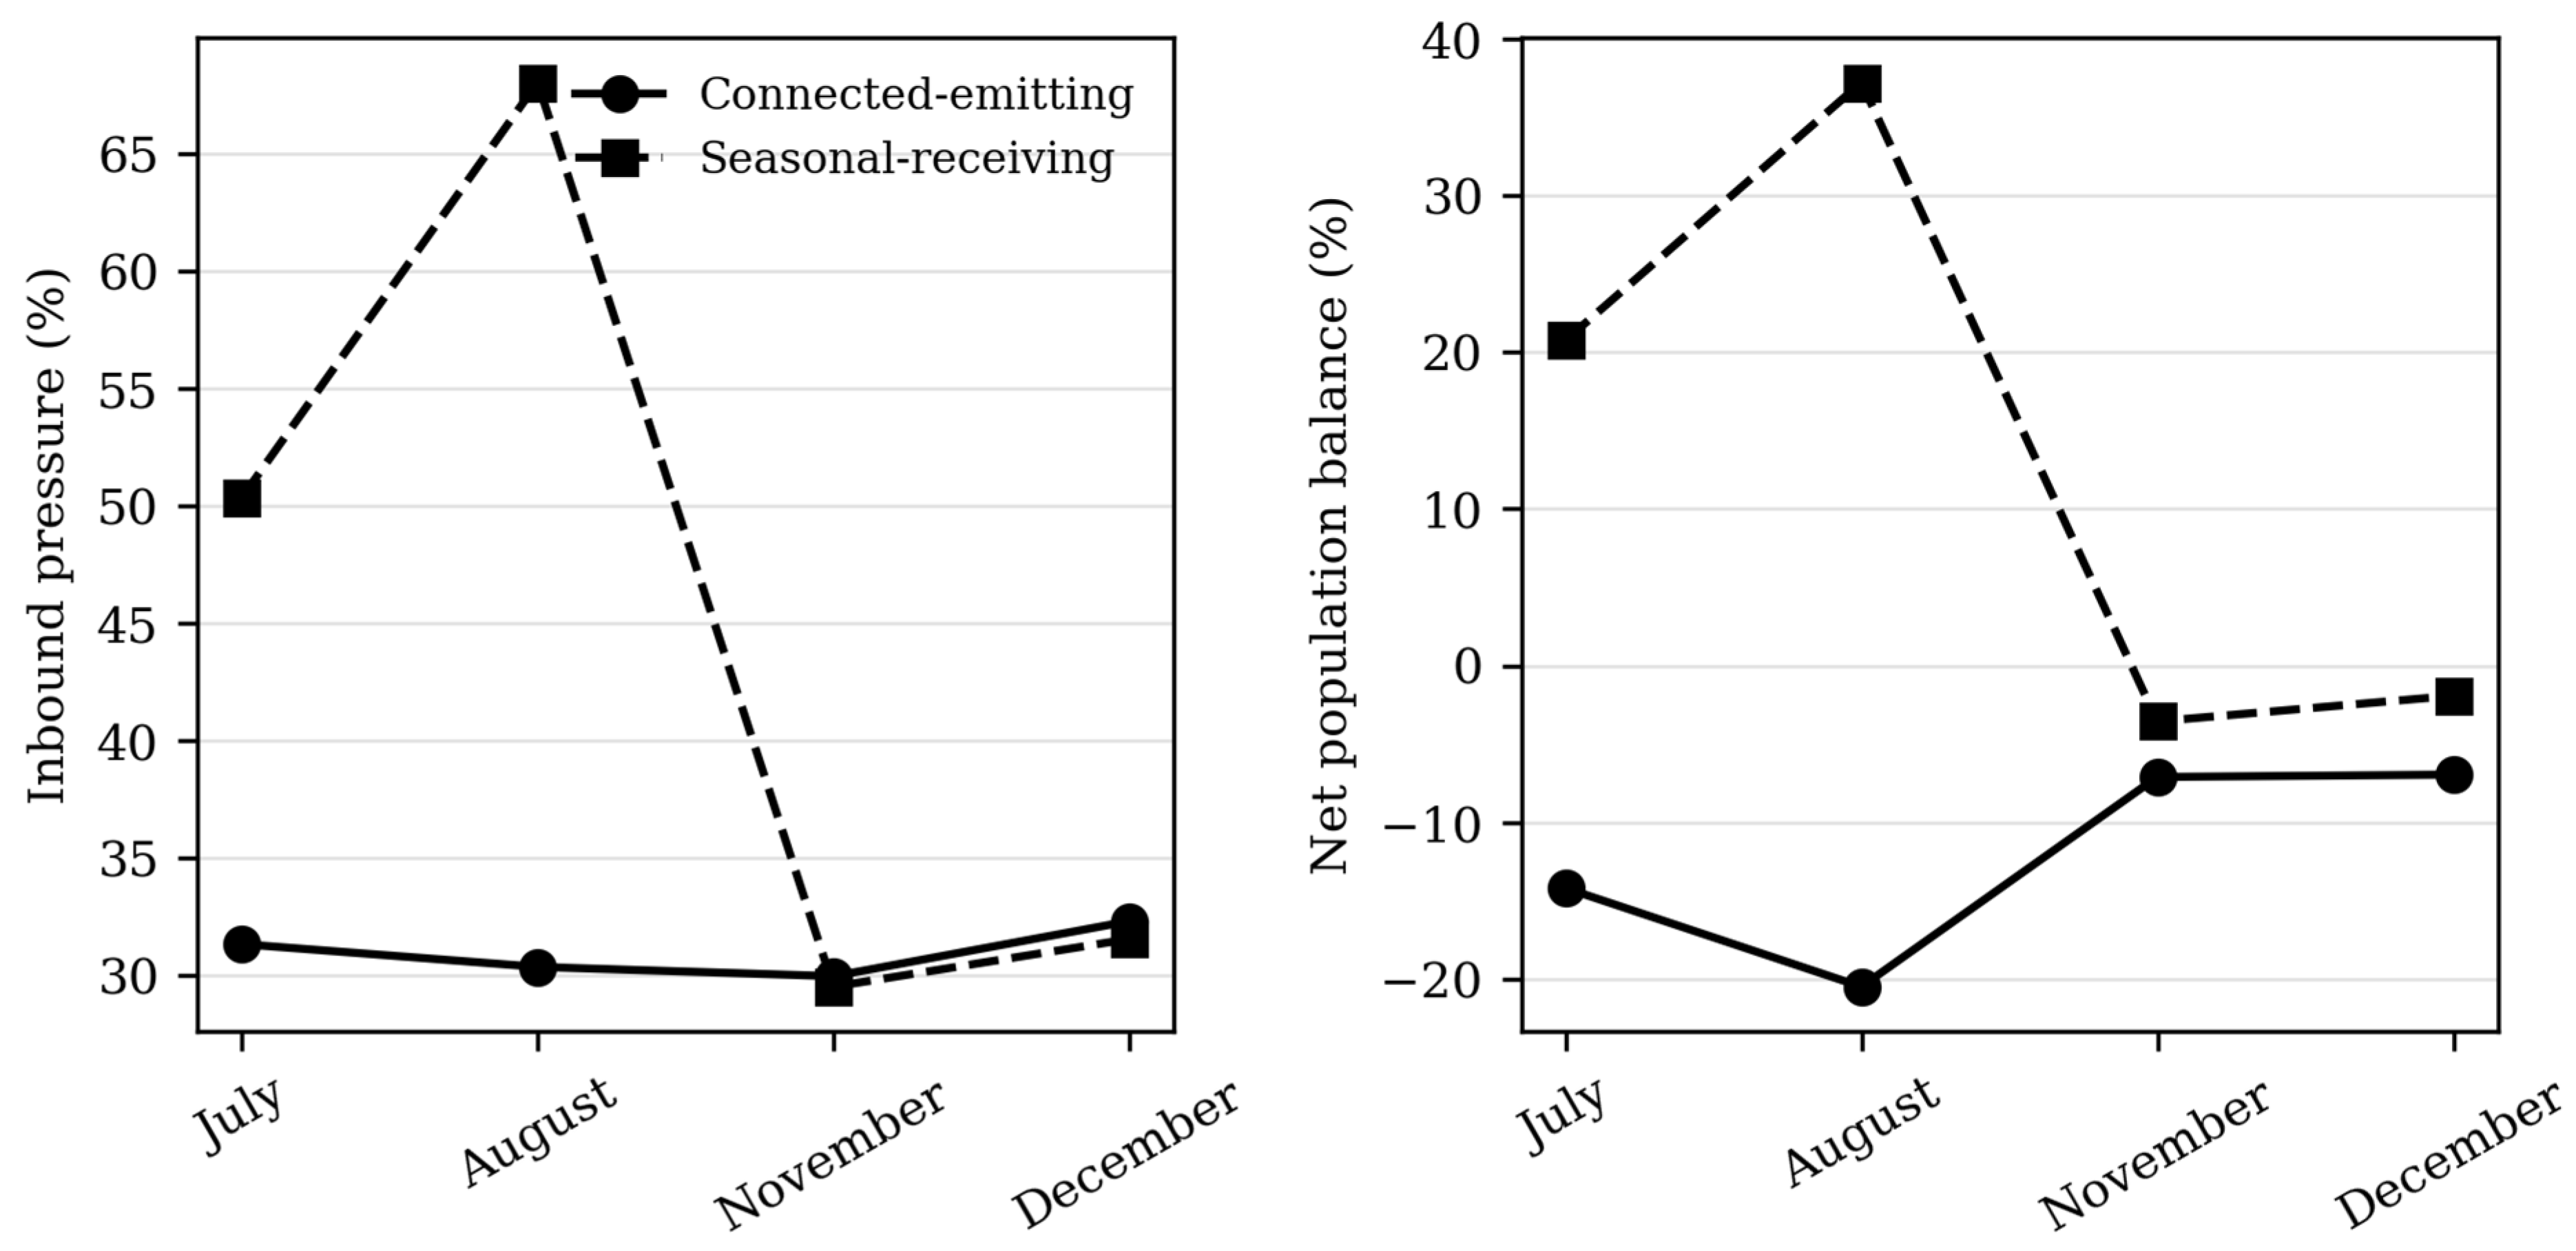
The seasonal-receiving profile combined stronger resident retention with positive net balances in July and August. Its inbound pressure increased from 50.4% in July to 68.0% in August, while the connected-emitting profile fell to a net balance of −20.5% in August. Both profiles approached modest negative balances in November and December. H2 was supported, but the improved five-indicator trajectories show that receiving and emitting roles are not synonymous with high and low connectivity.
Figure 3.
Mean inbound-pressure and net-population-balance trajectories for the validated territorial profiles.
Figure 3.
Mean inbound-pressure and net-population-balance trajectories for the validated territorial profiles.
4.4. Heritage Concentration, Seasonal Moderation and Multivariate Effect
Heritage concentration was positively associated with destination diversity at all four dates (rho = 0.189-0.235), supporting the most consistent part of H3. The association with origin diversity was smaller and changed from near zero in summer to 0.163 in December. Heritage-rich areas therefore appeared more connected as origins of resident travel, but not uniformly more diverse as receivers.
Table 6.
Area fixed-effects estimates for date-by-heritage interactions.
| Outcome | Interaction vs. November | Coefficient | Clustered SE | 95% CI | p-value |
|---|---|---|---|---|---|
| PC1: connected resident dispersal | July × heritage | 0.296 | 0.023 | [0.251, 0.341] | <0.001 |
| August × heritage | 0.419 | 0.030 | [0.361, 0.477] | <0.001 | |
| December × heritage | 0.084 | 0.009 | [0.066, 0.102] | <0.001 | |
| PC2: receiving connectivity | July × heritage | −0.047 | 0.011 | [−0.068, −0.026] | <0.001 |
| August × heritage | −0.149 | 0.015 | [−0.178, −0.120] | <0.001 | |
| December × heritage | 0.042 | 0.009 | [0.025, 0.059] | <0.001 |
Notes: November is the reference date. Models include area fixed effects; standard errors are clustered by area. Positive PC1 scores indicate more outbound mobility and destination diversity with lower retention. Positive PC2 scores indicate greater receiving connectivity.
Table 7.
Spearman correlations between heritage concentration and mobility indicators.
| Indicator | July | August | November | December |
|---|---|---|---|---|
| Resident retention | −0.189 | −0.222 | 0.036 | −0.015 |
| Outbound mobility | 0.205 | 0.211 | 0.102 | 0.180 |
| Inbound pressure | −0.130 | −0.186 | −0.033 | −0.030 |
| Net population balance | −0.184 | −0.216 | −0.008 | −0.039 |
| Destination diversity | 0.233 | 0.235 | 0.189 | 0.212 |
| Origin diversity | 0.055 | −0.042 | 0.141 | 0.163 |
Notes: Coefficients describe monotonic bivariate association; they are not causal effects and are not adjusted for population, accessibility, coastality or accommodation capacity.
The fixed-effects models strengthened H4: compared with November, heritage concentration had a more positive relationship with PC1 in July, August and December, especially August (b = 0.419, p < 0.001), while its association with PC2 became more negative in July and August. Thus, within the same areas, higher heritage concentration was linked more strongly to connected resident dispersal during summer, not to stronger receiving connectivity.
The results support H5. After log resident population and autonomous community were controlled, heritage concentration accounted for an additional 0.69% of variance in the complete multivariate trajectory (partial RDA pseudo-F = 31.82, 999-permutation p = 0.001). The effect is statistically reliable but small, as hypothesized. Heritage is therefore one element of a broader system of accessibility, accommodation, services, and territorial functions rather than a dominant explanation of seasonal reception.
4.5. Robustness and Hypothesis Evaluation
The H5 result was robust to alternative treatments of both the heritage score and the outcomes. Incremental explained variance ranged from 0.64% to 0.70%, and all four 999-permutation tests yielded p = 0.001. Excluding the 11 areas in the sparse extreme heritage categories slightly increased the estimate. Winsorization also left the two-profile classification virtually unchanged (ARI = 0.981).
Table 8.
Sensitivity of the partial RDA and trajectory classification.
| Specification | Incremental R2 (%) | Pseudo-F | Permutation p | N / agreement |
|---|---|---|---|---|
| Primary continuous heritage | 0.686 | 31.82 | 0.001 | 3,209 areas |
| Rank-transformed heritage | 0.644 | 29.87 | 0.001 | 3,209 areas |
| Exclude heritage scores 3 and 9 | 0.696 | 32.22 | 0.001 | 3,198 areas |
| Winsorized outcomes (1st/99th pct.) | 0.691 | 32.36 | 0.001 | 3,209 areas |
| Winsorized trajectory clustering | — | — | — | ARI = 0.981 |
Notes: Each partial RDA controls log resident population and autonomous community and uses 999 Freedman-Lane permutations. ARI compares the primary and winsorized two-profile assignments.
Table 9.
Integrated evaluation of the research hypotheses.
| Hypothesis | Primary evidence | Decision |
|---|---|---|
| H1 | Two parallel-analysis components; 77.58% explained; low KMO | Supported with qualification |
| H2 | Two stable trajectories; mean bootstrap ARI = 0.971 | Supported |
| H3 | Heritage correlated consistently with destination diversity, but not uniformly with origin diversity | Partially supported |
| H4 | All date-by-heritage interactions significant in area fixed-effects models | Supported |
| H5 | Partial RDA incremental R2 = 0.69%; pseudo-F = 31.82; p = 0.001 | Supported |
Notes: Decisions refer to the directional and substantive content of each hypothesis, not statistical significance alone.
Leave-one-indicator-out PCA retained two components in five of the six specifications, with retained variance between 77.58% and 87.75%. Omitting origin diversity yielded one component and KMO = 0.588, demonstrating that origin diversity creates the second receiving-connectivity dimension. Omitting inbound pressure or destination diversity raised KMO above 0.52 but preserved two components. The low full-model KMO therefore reflects multidimensional heterogeneity rather than an unstable extraction; the descriptive, non-latent interpretation remains warranted.
5. Discussion
5.1. Main Theoretical Implications
These findings recast heritage tourism as a process of seasonal population redistribution rather than a static measure of destination intensity. Two dimensions organized the data: connected resident dispersal and receiving connectivity. Their large joint seasonal effect shows that they change together across dates. An area may be highly connected without being a net receiver, or it may receive a large temporary population while retaining many residents. Annual arrivals and heritage counts alone cannot distinguish these patterns [5,12,16].
The two-profile solution offers a concise national typology. Connected-emitting and seasonal-receiving areas were identified from complete five-indicator trajectories, rather than from inbound pressure and net balance alone. The modest silhouette confirms that the profiles overlap, while the high bootstrap ARI shows that the assignments are reproducible under subsampling. This pattern is consistent with studies in which passive mobile data reveal tourism spaces that expand and contract seasonally [3,4,6] and destinations that occupy different positions in mobility networks [9,10].
Heritage concentration exhibited its most stable relationship with destination diversity, not with receiving pressure. One interpretation is that heritage-rich territories occupy central positions within cultural and urban mobility networks and generate outward travel as well as attraction. Another is that the CP score partly captures urban and institutional concentration. Both interpretations are compatible with evidence that heritage effects depend on the wider regional system and differ across tourism markets [19,20,21,27,28]. Because the study is observational and lacks accessibility and accommodation controls, these explanations remain alternatives rather than tested mechanisms.
Support for H5 was statistically clear but substantively modest. Heritage concentration added 0.69% to explained variance in the complete seasonal trajectory after population and autonomous-community effects were partialled out (pseudo-F = 31.82, p = 0.001). The estimate remained stable after rank transformation, exclusion of sparse score extremes, and outcome winsorization. Heritage is therefore relevant to territorial mobility, but asset concentration alone does not create a receiving destination. The result fits a resource-capability interpretation: heritage generates mobility through accessibility, accommodation, complementary services, governance, and market integration [17,18,19,20,26,27,28,34,35,36]. Because unmeasured spatial and tourism-system characteristics may still contribute to the association, the finding is not causal.
The findings refine the preceding paper [1]. Provincial ANOVA identified where indicators differed; the present multivariate analysis identifies how mobility variables combine and which trajectories cross provincial boundaries. Administrative comparisons remain useful for governance, but data-driven profiles reveal functionally similar territories that may require comparable planning responses despite being located in different regions [12].
5.2. Implications for Sustainable Rural and Regional Tourism Planning
For the 1,603 seasonal-receiving areas, the central management issue is temporary capacity. Planning should integrate tourism, transport, water, waste, emergency services, public space and heritage conservation using effective-population scenarios rather than resident population alone [13,14,15]. Their mean inbound pressure rose to 68.0% in August and their net population balance to 37.2%.
For predominantly emitting areas, the policy question is different. A negative net balance does not necessarily indicate failure, but heritage-led regional strategies should examine why cultural resources do not translate into retention or external attraction. Accessibility, product development, digital visibility, accommodation, intermunicipal itineraries and local business participation may determine whether heritage produces locally retained benefits [17,18,19,20,26].
The profiles should not be ranked as successful and unsuccessful destinations. High reception can create revenue and employment but also pressure; lower reception can protect local systems but may signal unrealized development opportunities. Sustainable planning requires matching policy to the profile: pressure management and temporal dispersion for receiving areas; capability building, network integration and benefit retention for heritage-rich emitting areas.
At the regional level, mobile indicators could support an early-warning dashboard. Authorities could monitor inbound pressure, net balance and connection diversity during holidays, compare them with accommodation and infrastructure capacity, and target field assessment where pressure repeatedly exceeds local baselines. Such a system would complement, not replace, resident surveys and environmental indicators [5,7,8].
5.3. Methodological Contribution
Methodologically, the analysis follows a reproducible sequence: audit accounting identities, construct scale-free indicators, summarize non-redundant dimensions, classify complete seasonal trajectories, and evaluate heritage as an external attribute. This sequence avoids treating deterministic transformations of the same counts as independent evidence, a common source of redundancy in multivariate tourism analysis.
The analytical layers are complementary rather than interchangeable. Parallel analysis prevented retaining components solely to maximize cumulative variance; the repeated-measures test evaluated joint temporal change; clustering preserved each area's complete four-date path; fixed effects isolated within-area seasonal moderation; and partial redundancy analysis quantified the small incremental contribution of heritage. The two profiles remain a parsimonious first layer, and subprofiles may emerge when coastality, rurality, metropolitan status and accommodation capacity are added.
6. Limitations and Future Research
Temporal coverage is the first limitation. Four dates reveal meaningful seasonal contrasts, but they do not form a continuous time series and cannot measure duration, weekly cycles, or year-to-year stability. Future research should incorporate several observations per month over multiple years, including the period after pandemic recovery.
Second, mobile-phone statistics measure presence and movement but not travel purpose. Non-residents include people whose trips may not be motivated by heritage, while residents travelling elsewhere cannot automatically be classified as tourists. The results therefore concern tourism-relevant mobility pressure, not individually verified heritage tourists [5,7,8].
Third, the Heritage Concentration score is a constructed index with few observations at its extremes. The supplementary documentation makes the AI-assisted classification and author-review procedure transparent, but independent validation against official heritage inventories is still needed. Future work could compare the ordinal score with counts and densities of nationally listed assets and UNESCO-recognized sites.
Fourth, the present models do not control for accommodation supply, rurality, coastal location, second homes, accessibility, income or metropolitan functions. These factors may explain the negative summer correlations between heritage and inbound pressure. The next analytical stage should estimate multilevel or spatial panel models with area-level repeated observations and province or region effects.
Fifth, no geographic coordinates or spatial weights were available in the workbook used for this analysis. Linking the area codes to official geometries would enable global and local Moran statistics, spatial lag/error models and geographically weighted diagnostics. Such extensions are necessary before making claims about spillovers or spatial dependence.
Cluster assignments remain descriptive and sample-dependent. Although subsampling and winsorization produced stable classifications in this dataset, external validation is still needed using overnight stays, accommodation occupancy, tourism expenditure, and measures of infrastructure pressure.
7. Conclusions
Seasonal tourism in Spain involves population redistribution, not simply changes in visitor totals. Across 3,214 mobility areas, two components explained 77.58% of the five-indicator structure, and the repeated-measures analysis showed a large coordinated seasonal shift. Complete trajectories distinguished 1,606 connected-emitting areas from 1,603 seasonal-receiving areas. The classification was highly stable, although the profiles were moderately separated.
Heritage concentration moderated seasonal component scores, and the confirmatory partial redundancy analysis supported H5: it explained a statistically significant but modest 0.69% additional share of complete multivariate trajectory variance after population and regional controls. This distinction is central for sustainable regional development: heritage is a territorial resource whose tourism effects depend on accessibility, services, accommodation, urban functions and governance. Planning should combine heritage measures with dynamic effective-population indicators and adapt interventions to each mobility profile.
Compared with the earlier provincial analysis, this framework reveals how mobility indicators combine and how seasonal trajectories extend across administrative boundaries. With spatial, accessibility, and capacity data added, it could help identify both destinations that need pressure-management measures and heritage-rich territories that remain weakly connected to tourism benefits.
Supplementary Materials
The Supplementary Materials include the cleaned area-date panel, variable dictionary, complete PCA output, k-means validation statistics, cluster assignments, analysis code, and documentation of the Heritage Concentration scoring and validation protocol.
Author Contributions
Conceptualization, A.-R.G.-P. and M.R.-V.; methodology, A.-R.G.-P.; formal analysis, A.-R.G.-P.; investigation, A.-R.G.-P.; data curation, A.-R.G.-P.; writing—original draft preparation, A.-R.G.-P.; writing—review and editing, A.-R.G.-P. and M.R.-V.; supervision, M.R.-V. All authors have read and agreed to the published version of the manuscript.
Funding
This research received no external funding.
Institutional Review Board Statement
Ethical review was not required because the study used publicly available, aggregated and anonymized territorial statistics and involved no intervention or identifiable human participants.
Informed Consent Statement
Not applicable.
Data Availability Statement
The source mobility statistics are publicly available from the Experimental Statistics of the Spanish National Statistics Institute (INE). The cleaned area-date panel, analysis code, and documentation of the Heritage Concentration scoring protocol accompany the submission as Supplementary Materials and may also be deposited in an open repository. Use of the original source data remains subject to INE terms.
Conflicts of Interest
The authors declare no conflict of interest.
Use of Artificial Intelligence
An AI-assisted procedure supported the initial classification of the Heritage Concentration score, followed by author review. Generative AI was also used for language editing and drafting support. The authors verified the analyses, interpretations, citations, and final wording and remain fully responsible for the manuscript.
References
- Garzón-Paredes, A.-R. Heritage tourism in Spain: Territorial differentiation in tourism intensity and cultural heritage concentration. Tour. Hosp. 2026, 7, 216. [Google Scholar] [CrossRef]
- Royo-Vela, M.; Garzón-Paredes, A.-R. Effects of heritage on destination image. J. Herit. Tour. 2023. [Google Scholar] [CrossRef]
- Ahas, R.; Aasa, A.; Mark, Ü.; Pae, T.; Kull, A. Seasonal tourism spaces in Estonia: Case study with mobile positioning data. Tour. Manag. 2007, 28, 898–910. [Google Scholar] [CrossRef]
- Ahas, R.; Aasa, A.; Roose, A.; Mark, Ü.; Silm, S. Evaluating passive mobile positioning data for tourism surveys: An Estonian case study. Tour. Manag. 2008, 29, 469–486. [Google Scholar] [CrossRef]
- Saluveer, E.; Raun, J.; Tiru, M.; Altin, L.; Kroon, J.; Snitsarenko, T.; Aasa, A.; Silm, S. Methodological framework for producing national tourism statistics from mobile positioning data. Ann. Tour. Res. 2020, 81, 102895. [Google Scholar] [CrossRef]
- Zaragozí, B.; Trilles, S.; Gutiérrez, A.; Navarro-Carrión, J.T. Passive mobile data for studying seasonal tourism mobilities: An application in a Mediterranean coastal destination. ISPRS Int. J. Geo-Inf. 2021, 10, 98. [Google Scholar] [CrossRef]
- Grassini, L.; Dugheri, G. Mobile phone data and tourism statistics: A broken promise? Natl. Account. Rev. 2021, 3, 50–68. [Google Scholar] [CrossRef]
- Schmücker, D.; Reif, J. Measuring tourism with big data? Empirical insights from comparing passive GPS data and passive mobile data. Ann. Tour. Res. Empir. Insights 2022, 3, 100061. [Google Scholar] [CrossRef]
- Xu, Y.; Li, J.; Belyi, A.; Park, S. Characterizing destination networks through mobility traces of international tourists: A case study using a nationwide mobile positioning dataset. Tour. Manag. 2021, 82, 104195. [Google Scholar] [CrossRef]
- Park, S.; Xu, Y.; Jiang, L.; Chen, Z.; Huang, S. Spatial structures of tourism destinations: A trajectory data mining approach leveraging mobile big data. Ann. Tour. Res. 2020, 84, 102973. [Google Scholar] [CrossRef]
- Zheng, W.; Li, M.; Lin, Z.; Zhang, Y. Leveraging tourist trajectory data for effective destination planning and management: A new heuristic approach. Tour. Manag. 2022, 89, 104437. [Google Scholar] [CrossRef]
- Batista e Silva, F.; Barranco, R.; Proietti, P.; Pigaiani, C.; Lavalle, C. A new European regional tourism typology based on hotel location patterns and geographical criteria. Ann. Tour. Res. 2021, 89, 103077. [Google Scholar] [CrossRef]
- Valente, R.; Medina-Ariza, J. Mobility, nonstationary density, and robbery distribution in the tourist metropolis. Eur. J. Crim. Policy Res. 2024, 30, 85–107. [Google Scholar] [CrossRef] [PubMed]
- Koens, K.; Postma, A.; Papp, B. Is overtourism overused? Understanding the impact of tourism in a city context. Sustainability 2018, 10, 4384. [Google Scholar] [CrossRef]
- Back, A.; Lundmark, L.; Zachrisson, A. Bridging (over)tourism geographies: Proposing a systems approach in overtourism research. Tour. Geogr. 2025, 27, 293–312. [Google Scholar] [CrossRef]
- Jelinčić, D.A. Indicators for cultural and creative industries’ impact assessment on cultural heritage and tourism. Sustainability 2021, 13, 7732. [Google Scholar] [CrossRef]
- Egusquiza, A.; Zubiaga, M.; Gandini, A.; de Luca, C.; Tondelli, S. Systemic innovation areas for heritage-led rural regeneration. Sustainability 2021, 13, 5069. [Google Scholar] [CrossRef]
- Zubiaga, M.; Sopelana, A.; Gandini, A.; Aliaga, H.M.; Kalvet, T. Sustainable cultural tourism: Proposal for a comparative indicator-based framework in European destinations. Sustainability 2024, 16, 2062. [Google Scholar] [CrossRef]
- Muštra, V.; Škrabić Perić, B.; Pivčević, S. Cultural heritage sites, tourism and regional economic resilience. Pap. Reg. Sci. 2023, 102, 465–482. [Google Scholar] [CrossRef]
- Romão, J. Tourism, smart specialisation, growth, and resilience. Ann. Tour. Res. 2020, 84, 102995. [Google Scholar] [CrossRef] [PubMed]
- Vergori, A.S.; Arima, S. Cultural and non-cultural tourism: Evidence from Italian experience. Tour. Manag. 2020, 78, 104058. [Google Scholar] [CrossRef]
- Boto-García, D.; Pérez, L. The effect of high-speed rail connectivity and accessibility on tourism seasonality. J. Transp. Geogr. 2023, 107, 103546. [Google Scholar] [CrossRef]
- Jolliffe, I.T.; Cadima, J. Principal component analysis: A review and recent developments. Philos. Trans. R. Soc. A 2016, 374, 20150202. [Google Scholar] [CrossRef] [PubMed]
- Rousseeuw, P.J. Silhouettes: A graphical aid to the interpretation and validation of cluster analysis. J. Comput. Appl. Math. 1987, 20, 53–65. [Google Scholar] [CrossRef]
- National Statistics Institute of Spain (INE). Experimental statistics: Mobility studies based on mobile-phone positioning. Madrid, Spain. 2021. Available online: https://www.ine.es/experimental/movilidad/experimental_em4.htm (accessed on 10 August 2026).
- UNESCO. Smart cultural tourism as a driver of sustainable development of European regions: SmartCulTour. Paris, France, 2023. Available online: https://www.unesco.org/en/articles/smart-cultural-tourism-driver-sustainable-development-european-regions-smartcultour (accessed on 10 August 2026).
- Noonan, D.S.; Rizzo, I. Economics of cultural tourism: Issues and perspectives. J. Cult. Econ. 2017, 41, 95–107. [Google Scholar] [CrossRef]
- Kumar, S.; Kumar, D.; Nicolau, J.L. How does culture influence a country’s travel and tourism competitiveness? Tour. Manag. 2024, 100, 104822. [Google Scholar] [CrossRef]
- Gössling, S.; McCabe, S.; Chen, N. A socio-psychological conceptualisation of overtourism. Ann. Tour. Res. 2020, 84, 102976. [Google Scholar] [CrossRef] [PubMed]
- Kalvet, T.; Olesk, M.; Tiits, M. Report on cultural tourism leading to sustainable economic and social development; European Commission: Brussels, Belgium, 2020. [Google Scholar]
- Kaiser, H.F. An index of factorial simplicity. Psychometrika 1974, 39, 31–36. [Google Scholar] [CrossRef]
- Horn, J.L. A rationale and test for the number of factors in factor analysis. Psychometrika 1965, 30, 179–185. [Google Scholar] [CrossRef] [PubMed]
- Legendre, P.; Anderson, M.J. Distance-based redundancy analysis: Testing multispecies responses in multifactorial ecological experiments. Ecol. Monogr. 1999, 69, 1–24. [Google Scholar] [CrossRef]
- Harfst, J.; Syrbe, R.-U.; Kern, C.; Wirth, P.; Sandriester, J.; Pstrocka-Rak, M.; Dolzblasz, S. Cultural tourism and governance in peripheral regions. Int. J. Tour. Res. 2024, 26, e2733. [Google Scholar] [CrossRef]
- Cerisola, S.; Panzera, E. Heritage tourism and local prosperity: An empirical investigation of their controversial relationship. Tour. Econ. 2025, 31. [Google Scholar] [CrossRef]
- Wan, Y.K.P. Tourist accessibility of heritage spaces through the lens of spatial justice. Curr. Issues Tour. 2024, 27, 636–652. [Google Scholar] [CrossRef]
- Novais, M.A.; Del Papa, B.; Han, Q.; Mohan, K.; Vásárhelyi, O.; Wang, Y.; Zejnilovic, L. Investigating patterns of tourist movement using multiple data sources. J. Vacat. Mark. 2026, 32. [Google Scholar] [CrossRef]
- Suarez Castillo, M.; Sémécurbe, F.; Ziemlicki, C.; Tao, H.X.; Seimandi, T. Temporally consistent present population from mobile network signaling data for official statistics. J. Off. Stat. 2023, 39. [Google Scholar] [CrossRef]
- Parkinson, C.; Pan, B.; Morris, S.A.; Rice, W.L.; Taff, B.D.; Chi, G.; Newman, P. A comparison of tourists’ spatial–temporal behaviors between location-based service data and onsite GPS tracks. Sustainability 2025, 17, 391. [Google Scholar] [CrossRef]
- Spencer, D.M.; Sargeant, E.L. The use of indicators to measure the sustainability of tourism at cultural heritage sites: A critical review. Tour. Recreat. Res. 2024, 49. [Google Scholar] [CrossRef]
Disclaimer/Publisher’s Note: The statements, opinions and data contained in all publications are solely those of the individual author(s) and contributor(s) and not of MDPI and/or the editor(s). MDPI and/or the editor(s) disclaim responsibility for any injury to people or property resulting from any ideas, methods, instructions or products referred to in the content. |
© 2026 by the authors. Licensee MDPI, Basel, Switzerland. This article is an open access article distributed under the terms and conditions of the Creative Commons Attribution (CC BY) license (http://creativecommons.org/licenses/by/4.0/).
Copyright: This open access article is published under a Creative Commons CC BY 4.0 license, which permit the free download, distribution, and reuse, provided that the author and preprint are cited in any reuse.