

Submitted:
18 August 2026
Posted:
19 August 2026
You are already at the latest version
Abstract
Drought events are expected to induce both immediate and delayed effects on tree functioning, yet the persistence and dynamics of these legacy effects remain poorly understood. In an experimental set-up, European beech (Fagus sylvatica L.) saplings have been subjected to two consecutive water-withholding treatments during the 2022 growing season, in a factorial design, resulting in five drought severity categories. We monitored these categories over the following three years to assess drought legacy effects on phenology and growth. In the first post-drought year, bud burst proceeded more slowly in all drought categories, with the plants exposed to severe summer drought displaying the longest duration. No to minor differences between drought categories and control plants were observed in timing of autumn leaf senescence in the first post-drought year and in the following bud burst, suggesting recovery in these phenological responses. Unexpectedly, differences re-emerged in autumn leaf senescence in the second post-drought year, when all drought categories displayed delayed senescence. This differentiation persisted into the following spring, with delayed bud burst in four drought categories, and two severe spring-drought categories maintaining delayed senescence in the third post-drought year. Diameter and height growth were strongly reduced in the first year following drought. Although growth differences largely disappeared in the second post-drought year, two severe summer-drought categories exhibited enhanced diameter growth in the third year, indicating compensatory growth. Together, these results demonstrate that drought legacy effects in F. sylvatica are dynamically expressed over multiple years, and that such temporal variability complicates predictions of long-term forest responses to increasingly frequent episodic drought events under climate change.
Keywords:
after effect
; European beech
; water withholding
; compensation growth
; phenology
; bud burst
; autumn leaf senescence
; leaf chlorophyll content
; stress memory
1. Introduction
Climate change is predicted to increase the frequency, duration, and intensity of drought events across Europe, representing a major threat to the functioning and resilience of temperate forests [1,2]. Climate projections suggest that extreme droughts will become more frequent under ongoing warming, intensifying water limitation during the growing season and exposing forest ecosystems to unprecedented stress (Intergovernmental Panel on Climate Change [3]. In woody plants, drought induces a cascade of physiological responses beginning with stomatal closure and reduced photosynthesis, and progressing towards increased risk of hydraulic failure, decreased carbon assimilation, depletion of non-structural carbohydrate reserves, embolism, vascular damage and ultimately tree death [4,5,6,7]. Accordingly, drought events are consistently associated with reduced tree growth [8,9]. Tree-ring studies have documented pronounced growth reductions in trees following severe drought events, with legacy effects persisting for several years [10,11]. In natural forest conditions, drought responses are further shaped by stand structure, species mixtures, soil properties and microclimate [12,13,14,15,16]. Altered physiology and reduced radial growth are typical legacy effects of drought in temperate tree species, but the magnitude and duration can vary strongly with species, drought severity and environment and site conditions [17,18]. The legacy effects are thought to be driven by underlying stress memory mechanisms operating at the physiological and molecular level. Epigenomic modifications, including changes in DNA methylation, histone marks, and regulatory small RNAs, have been proposed as key mechanisms underlying drought stress memory in plants [19,20].
The timing of the leaf phenophases bud burst and autumn senescence are generally positively correlated [21,22], a phenomenon that has been attributed to the leaf longevity constraint, which limits variation in the time span between bud burst and leaf senescence [23]. Drought during the growing season can disturb this correlation, often by advancing autumn senescence [24,25]. In a rain exclusion experiment on a young beech plantation, drought advanced leaf senescence (and delayed the subsequent bud burst) [26]. Earlier leaf senescence shortens the growing season and may, in severe cases, increase the risk on tree mortality [27]. However, while less severe drought during the growing season can advance autumn leaf senescence, a delay of this phenophase can be triggered by severe drought and these two contrasting responses have been observed in one and the same experiment, for Fagus sylvatica [28], Prunus spinosa [29] and Cornus sanguinea [30].
F. sylvatica, a dominant and economically highly valued forest tree species in many areas in Europe, has received particular attention in drought studies as the tree species is considered relatively sensitive to drought due to its shallow rooting system and comparably vulnerable hydraulic system [reviewed by [31]]. Controlled experiments with potted saplings provide valuable insights into the mechanistic basis of drought responses and their carry-over effects. As these experiments are typically performed in uniform environmental conditions, the disentanglement of direct drought effects from confounding environmental variability is facilitated [32,33]. The present study investigates the legacy effects of an experimental drought treatment on potted beech saplings, with a particular focus on leaf phenology (bud burst and leaf senescence) and growth (diameter and height increment). We hypothesised that drought effects would clearly influence the leaf phenophases and growth variables up to one post-drought year and would gradually diminish thereafter. This work aims to improve our understanding of how drought exposure can shape the subsequent performance of beech.
2. Results
This section may be divided by subheadings. It should provide a concise and precise description of the experimental results, their interpretation, as well as the experimental conclusions that can be drawn.
2.1. Leaf Phenology and Chlorophyll Content Index
In the spring of 2023, bud burst was clearly affected by the drought treatments in the previous year (Figure 1). All drought categories were characterised by a significant interaction term between day and treatment (Table 1) signifying a slower bud burst process compared to the double controls. Different magnitudes of the estimates of the interaction terms are visualised in Figure S1. The duration of the bud burst process for the category of saplings that developed mild symptoms during the spring drought treatment in 2022 and that displayed an earlier autumn leaf senescence in this year, was closest to the double controls (Figure 1, Figure S1). Saplings that developed severe symptoms during the spring drought (D>50-C and D>50-D) resprouted during the post-drought recovery and both categories were characterised by a slower bud burst process than the mild drought category (less steep line in Figure 1, Figure S1). Saplings that developed severe leaf desiccation in the summer drought (C-D and D<50-D) did not resprout in the post-drought recovery and they displayed the largest duration of bud burst in 2023 (largest estimates for the interaction terms between treatment and day in Table 1, Figure 1, Figure S1). The slowest bud burst of the severe summer drought categories (C-D and D<50-D) was followed by a higher chlorophyll content index, compared to the double controls, during the 2023 growing season (Table 2, Figure 1).
Although the timing of autumn leaf senescence in 2022 differed among drought categories, with one category senescing earlier and the others later than the double controls, autumn leaf senescence in 2023 no longer showed any significant differences between the double controls and the different drought categories (Table 1, Figure 1).
In the spring of 2024, two years after the drought treatment, only one drought category (C-D) showed a (slightly) slower bud burst process than the double controls (significant interaction term between day and treatment with p-value = 0,02 in Table 1, Figure 1). The other categories did not differ from the double controls. During the growing season of 2024, several drought categories displayed chlorophyll content index trajectories that differed from the double controls (Table 2, Figure 1). Three out of four severe drought categories (D<50-D, D>50-C and D>50-D) reached their maximum values later (Figure 1).
In the following autumn, all the drought categories displayed a significantly delayed leaf senescence relative to the double controls (Table 1), with the category representing the minor leaf desiccation (D<50-C) being less delayed than the other categories (the two severe spring droughts D>50-C and D>50-D and the two severe summer droughts C-D and D<50-D) (Figure 1).
In the spring of 2025, three years after the drought treatment, bud burst was delayed in the four more severe drought categories (C-D, D<50-D, D>50-C and D>50-D) (Table 1, Figure 1). In the 2025 growing season, leaf chlorophyll content index no longer differed among the drought categories (Table 2, Figure 1), whereas in the autumn, leaf senescence was still delayed for the severe spring drought categories (D>50-C and D>50-D) (Table 1, Figure 1).
The phenological responses in the three post-drought years are summarised in Figure 2.
2.2. Growth
In 2023, strong effects of the drought stress experienced in the preceding year were observed for both height and radial increment in all the severe spring and summer drought categories (D>50-C, D>50-D, C-D and D<50-D) (Table 3, Figure 3). The category with mild stress symptoms (D<50-C) showed a significant although relatively modest reduction in height increment and no reduction in radial increment (Table 3, Figure 3). In 2024, two years after the drought treatments, increments in both height and diameter in nearly all categories did not differ significantly from the double controls (Table 3, Figure 3). Only the D<50-D category grew a little less in height than the double controls in this year (significant treatment with p-value = 0.042 in Table 3, Figure 3). Three years after the drought treatments, this category showed a significantly higher increment for height instead (Table 3, Figure 3). For the radial growth in this year (2025), the two severe summer drought categories (C-D and D<50-D) were characterised by a diameter increment being significantly higher than the double controls (Table 3, Figure 3).
The growth responses in the three post-drought years are summarised in Figure 4.
3. Discussion
3.1. Phenological Legacy Effects
In the year of the drought treatments (2022), the category with mild symptoms in the spring drought showed an advanced autumn leaf senescence, the severe spring drought categories (D>50-C and D>50-D) resprouted after rewatering and the foliage stayed longer green into autumn, whereas the severe summer drought categories (C-D and D<50-D) did not resprout after rewatering [28]. In spring 2023, bud burst developed more slowly in all drought categories compared to the double controls, with the mild symptoms category in the spring drought showing a relatively small increase in duration, the severe spring drought categories an intermediate increase and the severe summer drought categories showing the longest duration. These results corroborate the reported finding that in F. sylvatica, drought-induced reductions in carbon availability are linked with weaker buds [34]. The variable increase in bud burst duration among the different drought categories suggests that longer bud burst durations are indicative of more severe stress conditions during the drought. This interpretation is consistent with the higher chlorophyll content index during the growing season of 2023 in the categories with longest bud burst duration (severe summer drought).
As leaf senescence in 2023 and the following bud burst in 2024 did not express the drought categories anymore, except for a small effect for C-D in bud burst 2024 (p-value = 0,02 for the interaction term Day:C-D in Table 1), it was tempting to conclude that the effect of the drought treatments in 2022 on leaf phenology had faded away by early 2024. Strikingly, however, timing of autumn leaf senescence two years after the drought treatments separated all the drought categories significantly from the double controls. Whereas the mild-drought category had shown advanced senescence in the drought year and no difference in timing of leaf senescence in 2023, it displayed delayed senescence in 2024. The more severe drought categories that were already delayed in 2022 were again delayed in 2024. In the year of the drought treatments, the delay of autumn senescence was interpreted as a strategy to extend carbon gain through photosynthesis, replenish depleted reserves, and repair damaged [35] Because this strategy may increase the risk of early-autumn frost injury, it may reflect the severity of drought-induced impairment and even represent a last opportunity for survival [30,36].
The re-emergence of drought legacy effects in autumn senescence, after phenological differences had temporarily faded and height and radial growth had recovered, remains difficult to explain. It can be hypothesized that drought legacy effects in the leaf phenophases of beech last several years and become more clearly expressed under favorable growing conditions, while being masked in a more stressful environment. In our experiment, this would signify that 2023 was a more stressful year for the saplings compared to 2024. As European beech is a shade-tolerant species [37], it may be vulnerable to elevated solar radiation and the associated heat stress, particularly when drought limits transpirational cooling [38]. During the growing season (April to September), the saplings experienced on average 15% more solar radiation in 2023 compared to 2024 (Figure 5). Specifically, May and June were characterised by higher solar radiation and June by higher temperatures in 2023 (Figure 5).
The legacy effects that we observed may therefore be a longer-term stress memory mechanism that can be associated with epigenetic modifications [19,40]. The weaker expression of stress memory under more adverse growing conditions may be related to the finding that population differentiation in growth traits (genetic effects) in provenance trials planted on favorable sites is enhanced, whereas on harsher sites the growth differences among provenances are minimized [41,42]. In a common garden of Prunus spinosa, the population differentiation in autumn leaf senescence due to different climates at the home sites of the provenances (genetic effects), was likewise reduced under drought stress [29]. In our experiment, the delayed leaf senescence for the mild drought category in 2024, while being advanced in the year of the drought (2022), suggests that the longer-term stress memory may favour extended carbon gain during autumn above protection against putative new drought events by an earlier senescence.
3.2. Growth Responses
Drought reduces growth by limiting photosynthesis [31] and severe drought increases the post-drought carbon cost required to restore normal functionality in woody plants [43]. In our experiment, as expected, growth in the year after the drought treatment was strongly diminished for all severe drought categories, with no clear distinction between the spring (D>50-C and D>50-D) and the summer drought categories (C-D and D<50-D). Nevertheless, the severe summer drought plants (C-D and D<50-D), that did not resprout after the drought treatment in 2022, showed a higher chlorophyll content index than the controls during the growing season of 2023, which was not the case for the severe spring drought categories (that did display post-drought resprouting in 2022). Post-drought recovery has previously been associated with higher photosynthetic activity in F. sylvatica, interpreted as a need to replenish carbohydrate reserves and support regeneration and growth [44,45]. A post-drought growth reduction concurring with an elevated photosynthetic activity can be explained as carbon resources being allocated away from radial growth and toward recovery processes [18]. Our results support the uncoupling of growth and photosynthesis in the post-drought year with the higher chlorophyll content index in the year after the drought being related to the timing of the drought event in the year of the drought, because this timing determined whether plants resprouted in the drought year itself or not. Likely, for the spring drought plants, reserve replenishment was already taking a start after resprouting and during the delayed leaf senescence in the autumn of the drought year, whereas it only took place in the year after the drought treatment for the summer drought plants, which could explain why only the summer drought plants displayed a higher chlorophyll content index in the post-drought year.
Two years after the drought, radial and height growth returned to the level of the control plants for most drought categories, consistent with reports that beech growth can be strongly reduced by drought but can also recover relatively quickly [9,46]. Similar as in the first year after the drought, the chlorophyll content index during the growing season was higher for the summer drought category D<50-D. Surprisingly, in this second year, the chlorophyll content index was also higher for the spring drought categories (D>50-C and D>50-D), which had not differed from the controls in the first year after the drought. This elevated chlorophyll content index in the second year may be linked to the same stress-memory process that also underlays the delayed senescence observed in all drought categories this year.
Three years after the drought we observed a growth pattern consistent with compensation growth, a phenomenon defined as accelerated growth following a period of resource limitation or stress [47] and which has been widely observed across organisms including woody species [48,49,50,51]. For European beech, for instance, compensation growth has already been described after heat stress [52]. Our results again indicate a separation between spring-drought plants, which recovered by resprouting immediately after the drought, and summer-drought plants, which did not resprout, because only the summer-drought categories (C-D and D<50-D) showed compensatory radial growth. For height growth only the category D<50-D exceeded the controls. These findings suggest that the stress memory imprinted in the year of the drought depended not only on the severity of the experienced stress, as the mild stress category did not display compensation growth, but also on the timing of it in the growing season. This observation can be related to compensatory growth in grassland research, with grasslands subjected to summer drought tending to become primed for greater compensatory growth in the following year when compared to grasslands experiencing drought earlier in the growing season [53].
4. Materials and Methods
4.1. Experimental Set-Up
The drought experiment was conducted in 2022 on 281 potted Fagus sylvatica saplings, as described previously [28]. In short, saplings originating from seeds collected in 2016 germinated in 2017 and were subsequently maintained in containers in a common garden setting. A drought experiment was performed during the 2022 growing season, consisting of two consecutive water-withholding treatments (factorial design): in spring (23 May–15 June) and in summer (8 August–12 September) (Figure 6). At that moment, plants were in 5-litre containers filled with standard nursery potting soil, without additional fertiliser. The experiment was carried out in greenhouse conditions. During the drought treatments, irrigation was withheld, whereas control plants were watered regularly by experienced greenhouse staff.
Following the spring treatment, drought treated saplings were classified into two groups based on the developed visual drought stress symptoms: less and more than 50% of the leaves desiccated (D<50 and D>50) (Figure 6). At the end of the second treatment, this resulted in 6 categories of plants: control - control (C-C, n=71), control - drought (C-D, n=67), drought with less than 50% of leaves desiccated - control (D<50-C, n=46), drought with less than 50% of leaves desiccated - drought (D<50-D, n=43), drought with more than 50% of leaves desiccated - control (D>50-C, n=26) and drought with more than 50% of leaves desiccated - drought (D>50-D, n=28) (Figure 1). Plants in the category D>50 resprouted after the first drought period and both categories D>50-C and D>50-D are further on called the severe spring drought categories. Plants in the categories C-D and D<50-D lost their foliage in the second drought period and did not resprout afterward (Figure 6). These two categories are further on called the severe summer drought categories. Plants in the category D>50-D had not yet developed any leaf desiccation symptoms when the second drought period ended (Figure 6). In total, only 7 plants died off.
During the winter of 2022, plants remained in the greenhouse. In early spring of 2023 plants were transferred to a larger pot (7-litre) and placed, randomly and intermixed, on a container field at the Research Institute of Nature and Forest in Geraardsbergen, Belgium. In the winters of 2023 and 2024, plants were transferred to larger pots, 10-litre and 15-litre respectively. At each transfer, plants were individually and randomly intermingled on the container field. During the growing seasons plants were well watered by experienced technicians.
4.2. Measurements and Observations
In 2023, 2024 and 2025, phenological observations of spring bud burst and autumn leaf senescence were performed using two scoring protocols following previous studies [28,52]. For bud burst, the scores were: 1, winter buds; 2, first green parts of the leaves protruding from the buds; 3, leaves in the process of unfolding; 4, leaves unfolded; 5, leaves enlarged and mature. For leaf senescence: 1, green leaves; 2, light green leaves; 3, yellowing leaves; 4, yellow leaves turning brown; 5, brown leaves, beginning to fall. Days of observation are indicated in Table 4.
During each growing season, leaf chlorophyll content index (using CCM-200, Opti-Sciences, Inc., Hudson, NH, USA) was measured at regular intervals on a representative, damage free and mature leaf on a representative short shoot in the centre of the young crown of each plant. The CCM-200 instrument measures optical absorbance at 653 nm (chlorophyll) and 931 nm (near infra-red). The relative chlorophyll content is the ratio of optical transmission at 931 nm to optical transmission at 653 nm [54].
Each winter, height and diameter at 5 cm above soil level were measured. Annual increments of growth were calculated by subtracting height/diameter recorded in the preceding winter from the corresponding height/diameter measured in the given winter.
4.3. Statistical Analysis
All statistical analyses were performed with the open-source statistical software R version 4.5.1 [55]. Although the double controls and the different drought categories of saplings were not equal in number of plants, the applied modelling techniques can handle unbalanced datasets [56]. The phenological observations were modelled with cumulative logistic regression, whereas the chlorophyll content index measurements and the height and diameter increments were modelled applying linear regression. When a model involved repeated measurements on the same saplings, mixed-effects modelling was applied with a unique plant identifier included as a random effect.
Cumulative logistic regression models were fitted for the two phenophases spring bud burst and autumn leaf senescence, for each year (2023 till 2025). The probability (p) was modelled that the phenophase had reached a given score level or a lower one (i.e., maximum score level) on a given day. An interaction between the day of observation (Day) and drought treatment category in 2022 (Tre, categorical variable with 6 levels: C-C, C-D, D<50-C, D<50-D, D>50-C and D>50-D) allowed the phenological phase to develop quicker or slower in the different drought categories. Height of the plants (Hei), measured in the winter preceding the bud burst or measured in the winter following the leaf senescence, was included as a covariate (6 models).
log(p/(1-p)) = β0 - β1Day - β2Tre - β3Day.Tre - β4Hei
Linear regression models were applied for the chlorophyll content index measurements (Chl) for each year, from 2023 till 2025. Hei is the height at the winter preceding the analysed growth year. A polynomial of the second degree for the variable Day allowed the modelled chlorophyll content index to vary in a non-linear way between the three measurement time points (3 models).
Chl = β0 + β1Day + β2 Day2 + β3Tre + β4Day.Tre + β5Day2.Tre + β6Hei
Linear regression models were fitted for height and diameter increments (Inc) in each studied year (2023 till 2025). Hei or Dia is the height or diameter at the winter preceding the analysed growth year (6 models).
Inc = β0 - β1Tre - β2Hei/Dia
5. Conclusions
Our study demonstrates that drought legacy effects in European beech extend beyond the year of stress exposure and can persist across multiple growing seasons, affecting both phenology and growth recovery. Remarkably, we found evidence that legacy effects can re-emerge after having seemingly disappeared, suggesting that drought-induced stress memories may remain latent and become expressed under environmental conditions that allow their manifestation. The magnitude and expression of these legacy effects depended not only on drought severity and subsequent environmental conditions, but also on the timing of the drought event within the growing season. Our findings further reveal a temporal decoupling between photosynthetic recovery and biomass accumulation, highlighting that restoration of physiological activity does not necessarily translate immediately into growth recovery, and that growth may subsequently exceed control levels through compensatory responses. These delayed and context-dependent legacy effects should be considered when predicting forest responses to increasing drought frequency under climate change. Understanding how drought timing, severity, and environmental context shape long-term stress memory will become more important for assessing the resilience and adaptive capacity of temperate tree species.
Supplementary Materials
The following supporting information can be downloaded at the website of this paper posted on Preprints.org, Figure S1:Bud burst in the spring of 2023 according to the different transitions in score levels. (a) from 1 to 2, (b) from 2 to 3, (c) from 3 to 4, (d) from 4 to 5. Drought categories are summarised in Figure 6.
Author Contributions
Conceptualization, K.V., S.V. and S.B.; methodology, K.V., S.V., M.S., St.M. and S.Mo.; formal analysis, K.V., S.V., S.Ma., M.S., St.M., S.Mo. and S.B.; writing—original draft preparation, K.V., S.V. and S.Ma.; writing—review and editing, K.V., S.V., S.Ma. and S.B.; supervision, K.V. and S.B. All authors have read and agreed to the published version of the manuscript.
Funding
This research received no external funding.
Data Availability Statement
10.5281/zenodo.21852413.
Acknowledgments
We like to thank all the students, over the three years, that helped with observing and measuring the saplings described in this study.
Conflicts of Interest
The authors declare no conflicts of interest.
References
- Allen, C.D.; Macalady, A.K.; Chenchouni, H.; Bachelet, D.; McDowell, N.; Vennetier, M.; Kitzberger, T.; Rigling, A.; Breshears, D.D.; Hogg, E.H.; et al. A Global Overview of Drought and Heat-Induced Tree Mortality Reveals Emerging Climate Change Risks for Forests. For. Ecol. Manag. 2010, 259, 660–684. [Google Scholar] [CrossRef]
- Senf, C.; Pflugmacher, D.; Zhiqiang, Y.; Sebald, J.; Knorn, J.; Neumann, M.; Hostert, P.; Seidl, R. Canopy Mortality Has Doubled in Europe’s Temperate Forests over the Last Three Decades. Nat. Commun. 2018, 9, 4978. [Google Scholar] [CrossRef] [PubMed]
- Intergovernmental Panel on Climate Change Climate Change 2022 – Impacts, Adaptation and Vulnerability: Working Group II Contribution to the Sixth Assessment Report of the Intergovernmental Panel on Climate Change; Cambridge University Press: Cambridge, 2023.
- McDowell, N.G. Mechanisms Linking Drought, Hydraulics, Carbon Metabolism, and Vegetation Mortality1[W]. Plant Physiol. 2011, 155, 1051–1059. [Google Scholar] [CrossRef] [PubMed]
- Klein, T.; Vitasse, Y.; Hoch, G. Coordination between Growth, Phenology and Carbon Storage in Three Coexisting Deciduous Tree Species in a Temperate Forest. Tree Physiol. 2016, 36, 847–855. [Google Scholar] [CrossRef] [PubMed]
- Gessler, A.; Schaub, M.; McDowell, N.G. The Role of Nutrients in Drought-induced Tree Mortality and Recovery. New Phytol. 2017, 214, 513–520. [Google Scholar] [CrossRef] [PubMed]
- Wang, X.; Schönbeck, L.; Gessler, A.; Yang, Y.; Rigling, A.; Yu, D.; He, P.; Li, M. The Effects of Previous Summer Drought and Fertilization on Winter Non-Structural Carbon Reserves and Spring Leaf Development of Downy Oak Saplings. Front. Plant Sci. 2022, 13. [Google Scholar] [CrossRef] [PubMed]
- Anderegg, W.R.L.; Kane, J.M.; Anderegg, L.D.L. Consequences of Widespread Tree Mortality Triggered by Drought and Temperature Stress. Nat. Clim. Change 2013, 3, 30–36. [Google Scholar] [CrossRef]
- Vanoni, M.; Bugmann, H.; Nötzli, M.; Bigler, C. Quantifying the Effects of Drought on Abrupt Growth Decreases of Major Tree Species in Switzerland. Ecol. Evol. 2016, 6, 3555–3570. [Google Scholar] [CrossRef] [PubMed]
- Babst, F.; Poulter, B.; Trouet, V.; Tan, K.; Neuwirth, B.; Wilson, R.; Carrer, M.; Grabner, M.; Tegel, W.; Levanic, T.; et al. Site- and Species-Specific Responses of Forest Growth to Climate across the European Continent. Glob. Ecol. Biogeogr. 2013, 22, 706–717. [Google Scholar] [CrossRef]
- Anderegg, W.R.L.; Schwalm, C.; Biondi, F.; Camarero, J.J.; Koch, G.; Litvak, M.; Ogle, K.; Shaw, J.D.; Shevliakova, E.; Williams, A.P.; et al. FOREST ECOLOGY. Pervasive Drought Legacies in Forest Ecosystems and Their Implications for Carbon Cycle Models. Science 2015, 349, 528–532. [Google Scholar] [CrossRef] [PubMed]
- Grossiord, C.; Granier, A.; Ratcliffe, S.; Bouriaud, O.; Bruelheide, H.; Chećko, E.; Forrester, D.I.; Dawud, S.M.; Finér, L.; Pollastrini, M.; et al. Tree Diversity Does Not Always Improve Resistance of Forest Ecosystems to Drought. Proc. Natl. Acad. Sci. 2014, 111, 14812–14815. [Google Scholar] [CrossRef] [PubMed]
- De Frenne, P.; Lenoir, J.; Luoto, M.; Scheffers, B.R.; Zellweger, F.; Aalto, J.; Ashcroft, M.B.; Christiansen, D.M.; Decocq, G.; De Pauw, K.; et al. Forest Microclimates and Climate Change: Importance, Drivers and Future Research Agenda. Glob. Change Biol. 2021, 27, 2279–2297. [Google Scholar] [CrossRef] [PubMed]
- Pretzsch, H.; del Río, M.; Grote, R.; Klemmt, H.-J.; Ordóñez, C.; Oviedo, F.B. Tracing Drought Effects from the Tree to the Stand Growth in Temperate and Mediterranean Forests: Insights and Consequences for Forest Ecology and Management. Eur. J. For. Res. 2022, 141, 727–751. [Google Scholar] [CrossRef]
- Unterholzner, L.; Stolz, J.; van der Maaten-Theunissen, M.; Liepe, K.; van der Maaten, E. Site Conditions Rather than Provenance Drive Tree Growth, Climate Sensitivity and Drought Responses in European Beech in Germany. For. Ecol. Manag. 2024, 572, 122308. [Google Scholar] [CrossRef]
- Schnabel, F.; Beugnon, R.; Yang, B.; Richter, R.; Eisenhauer, N.; Huang, Y.; Liu, X.; Wirth, C.; Cesarz, S.; Fichtner, A.; et al. Tree Diversity Increases Forest Temperature Buffering via Enhancing Canopy Density and Structural Diversity. Ecol. Lett. 2025, 28, e70096. [Google Scholar] [CrossRef] [PubMed]
- Zweifel, R.; Zimmermann, L.; Zeugin, F.; Newbery, D.M. Intra-Annual Radial Growth and Water Relations of Trees: Implications towards a Growth Mechanism. J. Exp. Bot. 2006, 57, 1445–1459. [Google Scholar] [CrossRef] [PubMed]
- Kannenberg, S.A.; Novick, K.A.; Alexander, M.R.; Maxwell, J.T.; Moore, D.J.P.; Phillips, R.P.; Anderegg, W.R.L. Linking Drought Legacy Effects across Scales: From Leaves to Tree Rings to Ecosystems. Glob. Change Biol. 2019, 25, 2978–2992. [Google Scholar] [CrossRef] [PubMed]
- Lämke, J.; Bäurle, I. Epigenetic and Chromatin-Based Mechanisms in Environmental Stress Adaptation and Stress Memory in Plants. Genome Biol. 2017, 18, 124. [Google Scholar] [CrossRef] [PubMed]
- Jacques, C.; Salon, C.; Barnard, R.L.; Vernoud, V.; Prudent, M. Drought Stress Memory at the Plant Cycle Level: A Review. Plants 2021, 10, 1873. [Google Scholar] [CrossRef] [PubMed]
- Keenan, T.F.; Richardson, A.D. The Timing of Autumn Senescence Is Affected by the Timing of Spring Phenology: Implications for Predictive Models. Glob. Chang Biol. 2015, 21, 2634–2641. [Google Scholar] [CrossRef] [PubMed]
- Melaas, E.K.; Friedl, M.A.; Richardson, A.D. Multiscale Modeling of Spring Phenology across Deciduous Forests in the Eastern United States. Glob. Change Biol. 2016, 22, 792–805. [Google Scholar] [CrossRef] [PubMed]
- Marqués, L.; Hufkens, K.; Bigler, C.; Crowther, T.W.; Zohner, C.M.; Stocker, B.D. Acclimation of Phenology Relieves Leaf Longevity Constraints in Deciduous Forests. Nat. Ecol. Evol. 2023, 7, 198–204. [Google Scholar] [CrossRef] [PubMed]
- Wu, C.; Peng, J.; Ciais, P.; Peñuelas, J.; Wang, H.; Beguería, S.; Andrew Black, T.; Jassal, R.S.; Zhang, X.; Yuan, W.; et al. Increased Drought Effects on the Phenology of Autumn Leaf Senescence. Nat. Clim. Chang. 2022, 12, 943–949. [Google Scholar] [CrossRef]
- Wang, S.; Murphy, B.K.; Perkins, N.; Ensminger, I. Early Autumn: Drought Accelerates Leaf Senescence in Temperate Tree Species. Physiol. Plant. 2025, 177, e70700. [Google Scholar] [CrossRef] [PubMed]
- Massonnet, C.; Chuste, P.-A.; Levillain, J.; Gérémia, F.; E Silva, D.; Maillard, P.; Dreyer, E.; Dupouey, J.-L.; Bréda, N. Leafy Season Length Is Reduced by a Prolonged Soil Water Deficit but Not by Repeated Defoliation in Beech Trees (Fagus Sylvatica L.): Comparison of Response among Regional Populations Grown in a Common Garden. Agric. For. Meteorol. 2021, 297, 108228. [Google Scholar] [CrossRef]
- Frei, E.R.; Gossner, M.M.; Vitasse, Y.; Queloz, V.; Dubach, V.; Gessler, A.; Ginzler, C.; Hagedorn, F.; Meusburger, K.; Moor, M.; et al. European Beech Dieback after Premature Leaf Senescence during the 2018 Drought in Northern Switzerland. Plant Biol. 2022, 24, 1132–1145. [Google Scholar] [CrossRef] [PubMed]
- Vander Mijnsbrugge, K.; Bollen, M.; Moreels, S.; Notivol Paino, E.; Vandekerkhove, K.; De Keersmaeker, L.; Thomaes, A.; Verdonck, S.; Vanhellemont, M. Timing of Drought and Severity of Induced Leaf Desiccation Affect Recovery, Growth and Autumnal Leaf Senescence in Fagus Sylvatica L. Saplings. Forests 2025, 16, 5. [Google Scholar] [CrossRef]
- Vander Mijnsbrugge, K.; Moreels, S.; Moreels, S.; Buisset, D.; Vancampenhout, K.; Notivol Paino, E. Influence of Summer Drought on Post-Drought Resprouting and Leaf Senescence in Prunus Spinosa L. Growing in a Common Garden. Plants 2025, 14, 1132. [Google Scholar] [CrossRef] [PubMed]
- Vander Mijnsbrugge, K.; Vandepitte, J.; Moreels, S.; Mihaila, V.-V.; De Ligne, L.; Notivol, E.; Van Acker, J.; Van den Bulcke, J. Timing of Autumnal Leaf Senescence in a Common Shrub Species Depends on the Level of Preceding Summer Drought Symptoms. Environ. Exp. Bot. 2023, 216, 105539. [Google Scholar] [CrossRef]
- Leuschner, C. Drought Response of European Beech (Fagus Sylvatica L.)—A Review. Perspect. Plant Ecol. Evol. Syst. 2020, 47, 125576. [Google Scholar] [CrossRef]
- Grossiord, C.; Sevanto, S.; Limousin, J.-M.; Meir, P.; Mencuccini, M.; Pangle, R.E.; Pockman, W.T.; Salmon, Y.; Zweifel, R.; McDowell, N.G. Manipulative Experiments Demonstrate How Long-Term Soil Moisture Changes Alter Controls of Plant Water Use. Environ. Exp. Bot. 2018, 152, 19–27. [Google Scholar] [CrossRef]
- Hartmann, H.; Moura, C.F.; Anderegg, W.R.L.; Ruehr, N.K.; Salmon, Y.; Allen, C.D.; Arndt, S.K.; Breshears, D.D.; Davi, H.; Galbraith, D.; et al. Research Frontiers for Improving Our Understanding of Drought-Induced Tree and Forest Mortality. New Phytol. 2018, 218, 15–28. [Google Scholar] [CrossRef] [PubMed]
- Thomas, F.M.; Schunck, L.; Zisakos, A. Legacy Effects in Buds and Leaves of European Beech Saplings (Fagus Sylvatica) after Severe Drought. Plants 2023, 12, 568. [Google Scholar] [CrossRef] [PubMed]
- Naschitz, S.; Naor, A.; Wolf, S.; Goldschmidt, E.E. The Effects of Temperature and Drought on Autumnal Senescence and Leaf Shed in Apple under Warm, East Mediterranean Climate. Trees 2014, 28, 879–890. [Google Scholar] [CrossRef]
- Estiarte, M.; Peñuelas, J. Alteration of the Phenology of Leaf Senescence and Fall in Winter Deciduous Species by Climate Change: Effects on Nutrient Proficiency. Glob. Change Biol. 2015, 21, 1005–1017. [Google Scholar] [CrossRef] [PubMed]
- Desotgiu, R.; Cascio, C.; Pollastrini, M.; Gerosa, G.; Marzuoli, R.; Bussotti, F. Short and Long Term Photosynthetic Adjustments in Sun and Shade Leaves of Fagus Sylvatica L., Investigated by Fluorescence Transient (FT) Analysis. Plant Biosyst.-An. Int. J. Deal. With All. Asp. Plant Biol. 2012, 146, 206–216. [Google Scholar] [CrossRef]
- Einhorn, K.S.; Rosenqvist, E.; Leverenz, J.W. Photoinhibition in Seedlings of Fraxinus and Fagus under Natural Light Conditions: Implications for Forest Regeneration? Oecologia 2004, 140, 241–251. [Google Scholar] [CrossRef] [PubMed]
- Royal Meteorological Institute of Belgium Meteorological Observations from the Uccle Station, Belgium 2026.
- Miryeganeh, M.; Armitage, D.W. Epigenetic Responses of Trees to Environmental Stress in the Context of Climate Change. Biol. Rev. 2025, 100, 131–148. [Google Scholar] [CrossRef] [PubMed]
- Matyas, C. Modeling Climate Change Effects with Provenance Test Data. Tree Physiol. 1994, 14, 797–804. [Google Scholar] [CrossRef] [PubMed]
- Klisz, M.; Buras, A.; Sass-Klaassen, U.; Puchałka, R.; Koprowski, M.; Ukalska, J. Limitations at the Limit? Diminishing of Genetic Effects in Norway Spruce Provenance Trials. Front Plant Sci. 2019, 10, 306. [Google Scholar] [CrossRef] [PubMed]
- Ruehr, N.K.; Grote, R.; Mayr, S.; Arneth, A. Beyond the Extreme: Recovery of Carbon and Water Relations in Woody Plants Following Heat and Drought Stress. Tree Physiol. 2019, 39, 1285–1299. [Google Scholar] [CrossRef] [PubMed]
- Arend, M.; Sever, K.; Pflug, E.; Gessler, A.; Schaub, M. Seasonal Photosynthetic Response of European Beech to Severe Summer Drought: Limitation, Recovery and Post-Drought Stimulation. Agric. For. Meteorol. 2016, 220, 83–89. [Google Scholar] [CrossRef]
- Pflug, E.E.; Buchmann, N.; Siegwolf, R.T.W.; Schaub, M.; Rigling, A.; Arend, M. Resilient Leaf Physiological Response of European Beech (Fagus Sylvatica L.) to Summer Drought and Drought Release. Front. Plant Sci. 2018, 9. [Google Scholar] [CrossRef] [PubMed]
- Vanhellemont, M.; Sousa-Silva, R.; Maes, S.L.; Van den Bulcke, J.; Hertzog, L.; De Groote, S.R.E.; Van Acker, J.; Bonte, D.; Martel, A.; Lens, L.; et al. Distinct Growth Responses to Drought for Oak and Beech in Temperate Mixed Forests. Sci. Total Env. 2019, 650, 3017–3026. [Google Scholar] [CrossRef] [PubMed]
- Mangel, M.; Munch, S.B. A Life-History Perspective on Short- and Long-Term Consequences of Compensatory Growth. Am. Nat. 2005, 166, E155-176. [Google Scholar] [CrossRef] [PubMed]
- Turcsán, A.; Steppe, K.; Sárközi, E.; Erdélyi, É.; Missoorten, M.; Mees, G.; Mijnsbrugge, K.V. Early Summer Drought Stress During the First Growing Year Stimulates Extra Shoot Growth in Oak Seedlings (Quercus Petraea). Front. Plant Sci. 2016, 7. [Google Scholar] [CrossRef] [PubMed]
- Seidel, H.; Matiu, M.; Menzel, A. Compensatory Growth of Scots Pine Seedlings Mitigates Impacts of Multiple Droughts Within and Across Years. Front Plant Sci. 2019, 10, 519. [Google Scholar] [CrossRef] [PubMed]
- Lv, P.; Rademacher, T.; Huang, X.; Zhang, B.; Zhang, X. Prolonged Drought Duration, Not Intensity, Reduces Growth Recovery and Prevents Compensatory Growth of Oak Trees. Agric. For. Meteorol. 2022, 326, 109183. [Google Scholar] [CrossRef]
- Zhou, H.; Hou, L.; Lv, X.; Yang, G.; Wang, Y.; Wang, X. Compensatory Growth as a Response to Post-Drought in Grassland. Front. Plant Sci. 2022, 13. [Google Scholar] [CrossRef] [PubMed]
- Vander Mijnsbrugge, K.; Malanguis, J.M.; Moreels, S.; Lauwers, A.; Thomaes, A.; De Keersmaeker, L.; Vandekerkhove, K. Growth Recovery and Phenological Responses of Juvenile Beech (Fagus Sylvatica L.) Exposed to Spring Warming and Late Spring Frost. Forests 2021, 12, 1604. [Google Scholar] [CrossRef]
- Denton, E.M.; Dietrich, J.D.; Smith, M.D.; Knapp, A.K. Drought Timing Differentially Affects Above- and Belowground Productivity in a Mesic Grassland. Plant Ecol. 2017, 218, 317–328. [Google Scholar] [CrossRef]
- Kamarianakis, Z.; Panagiotakis, S. Design and Implementation of a Low-Cost Chlorophyll Content Meter. Sensors 2023, 23, 2699. [Google Scholar] [CrossRef] [PubMed]
- R Core Team R: A Language and Environment for Statistical Computing 2025.
- Zuur, A.F.; Ieno, E.N.; Walker, N.; Saveliev, A.A.; Smith, G.M. Mixed Effects Models and Extensions in Ecology with R; Statistics for Biology and Health; Springer: New York, NY, 2009; ISBN 978-0-387-87457-9. [Google Scholar]
Figure 1.
Modelled bud burst, leaf chlorophyll content index and autumn leaf senescence for the double controls (C-C) and the different drought categories in the three post-drought years, 2023 till 2025. The two phenophases were modelled using cumulative logistic regression, whereas chlorophyll content index was modelled applying linear regression. Drought categories are summarised in the Materials and Methods section (Figure 6) Drought categories significantly differing from the double controls are indicated in colour, not significantly differing drought categories are indicated in grey.
Figure 1.
Modelled bud burst, leaf chlorophyll content index and autumn leaf senescence for the double controls (C-C) and the different drought categories in the three post-drought years, 2023 till 2025. The two phenophases were modelled using cumulative logistic regression, whereas chlorophyll content index was modelled applying linear regression. Drought categories are summarised in the Materials and Methods section (Figure 6) Drought categories significantly differing from the double controls are indicated in colour, not significantly differing drought categories are indicated in grey.
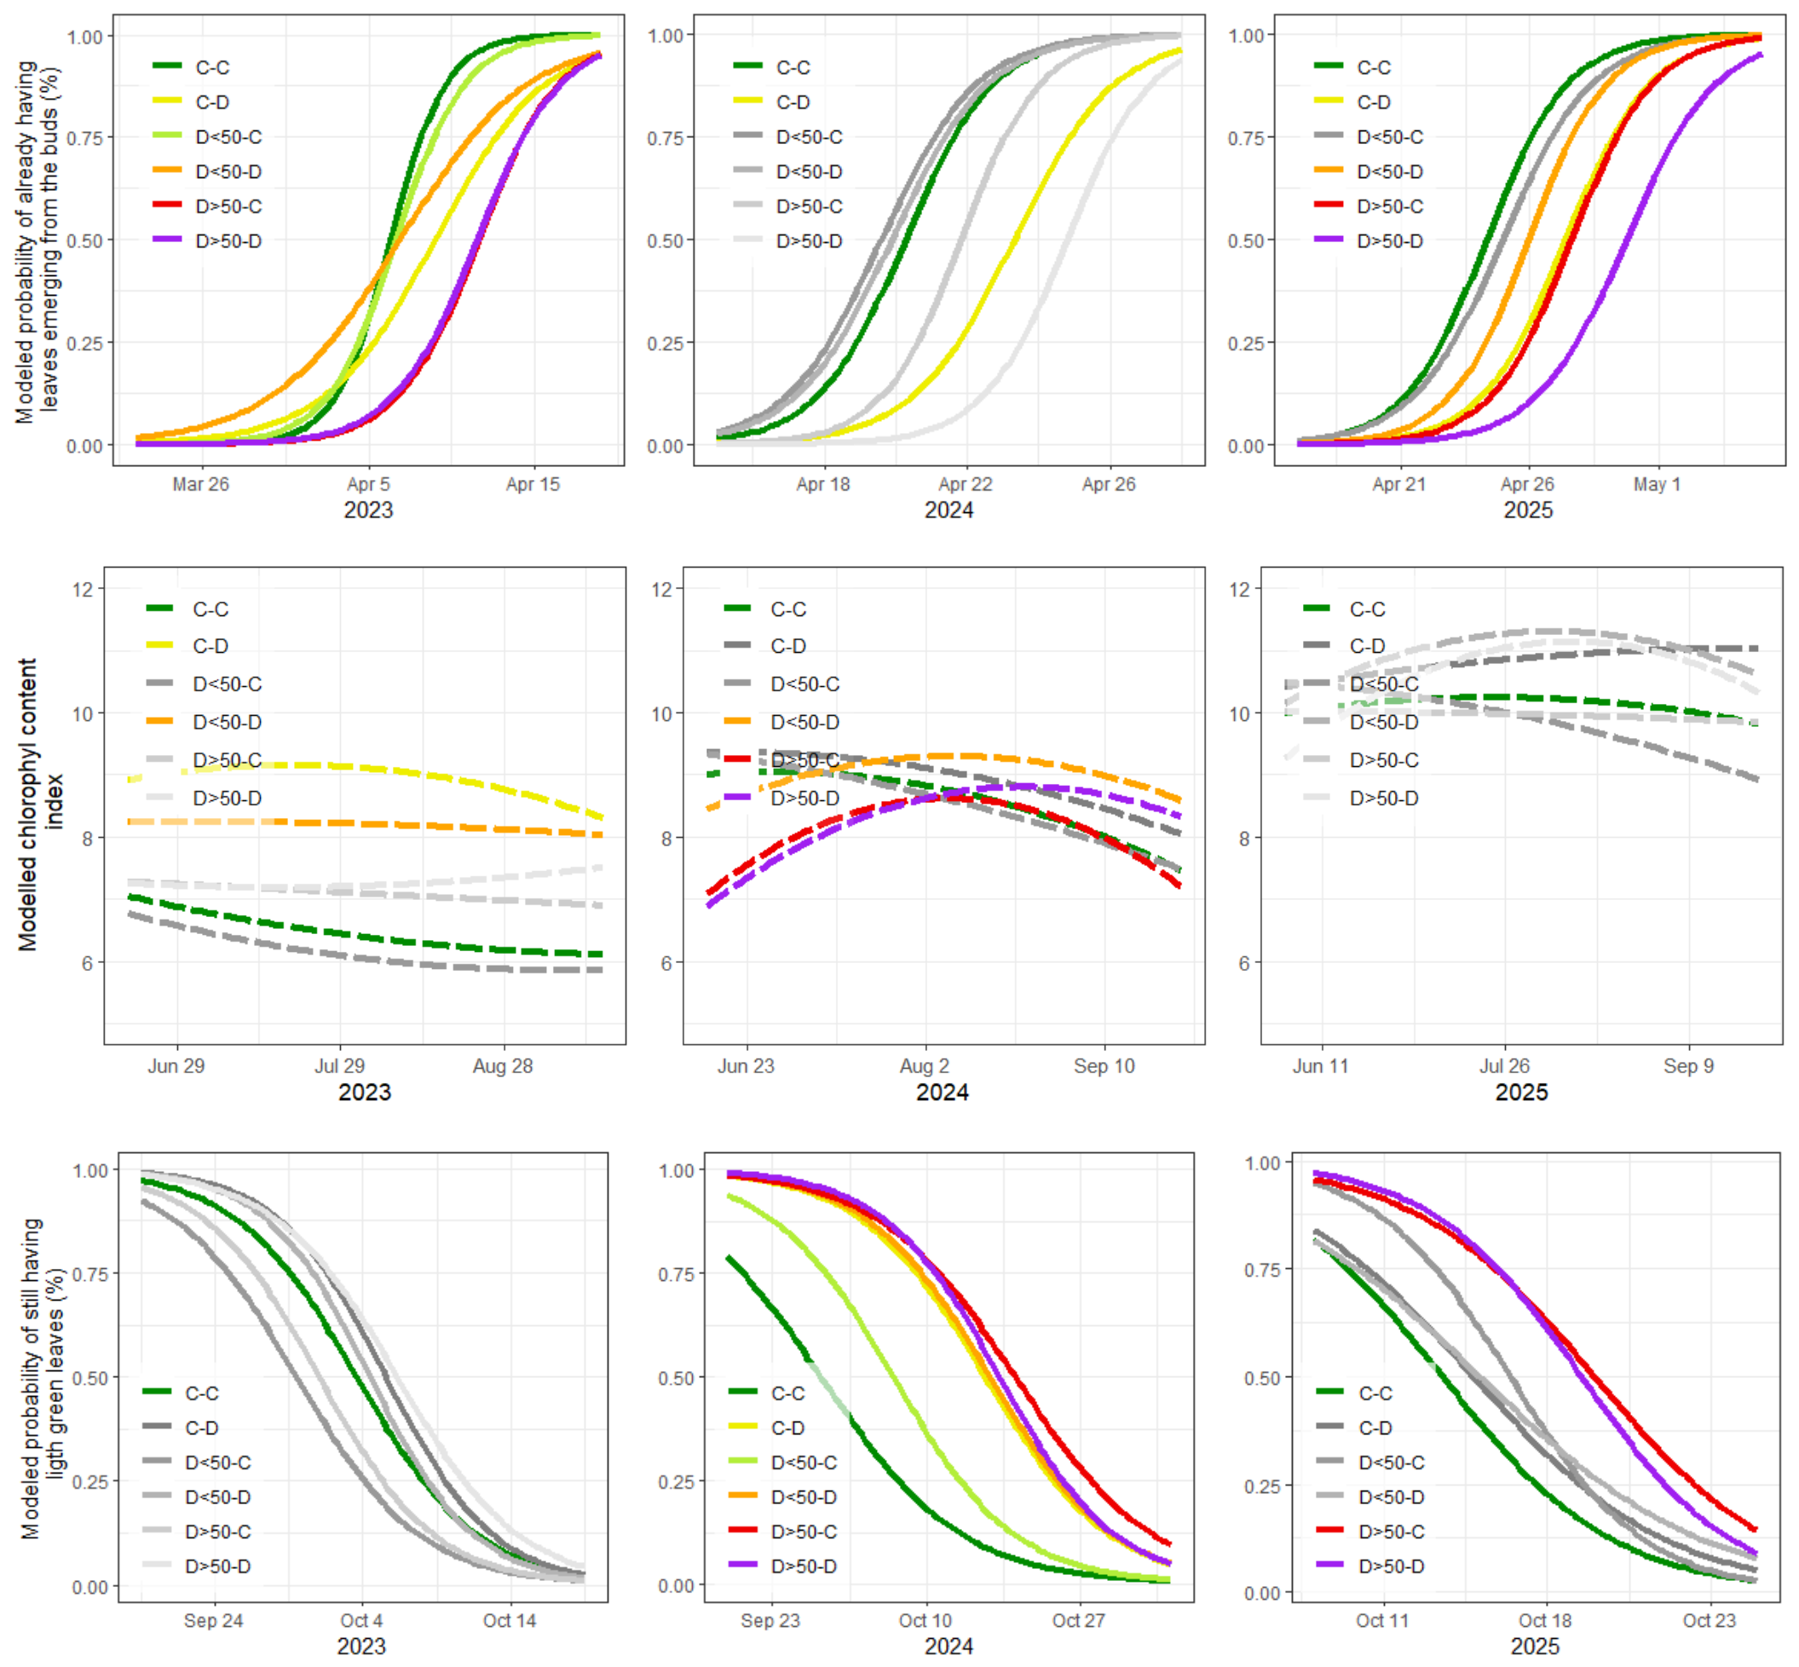
Figure 2.
Schematic representation of the phenological responses in the post-drought years 2023 till 2025. The different drought categories were compared to the double controls, with = indicating no significant difference with C-C. The responses in the year of the drought (2022) were published previously and are indicated in blue. -: no foliage thus no leaf senescence scoring, bb: spring bud burst, se: autumn leaf senescence. Drought categories are summarised in Figure 6.
Figure 2.
Schematic representation of the phenological responses in the post-drought years 2023 till 2025. The different drought categories were compared to the double controls, with = indicating no significant difference with C-C. The responses in the year of the drought (2022) were published previously and are indicated in blue. -: no foliage thus no leaf senescence scoring, bb: spring bud burst, se: autumn leaf senescence. Drought categories are summarised in Figure 6.
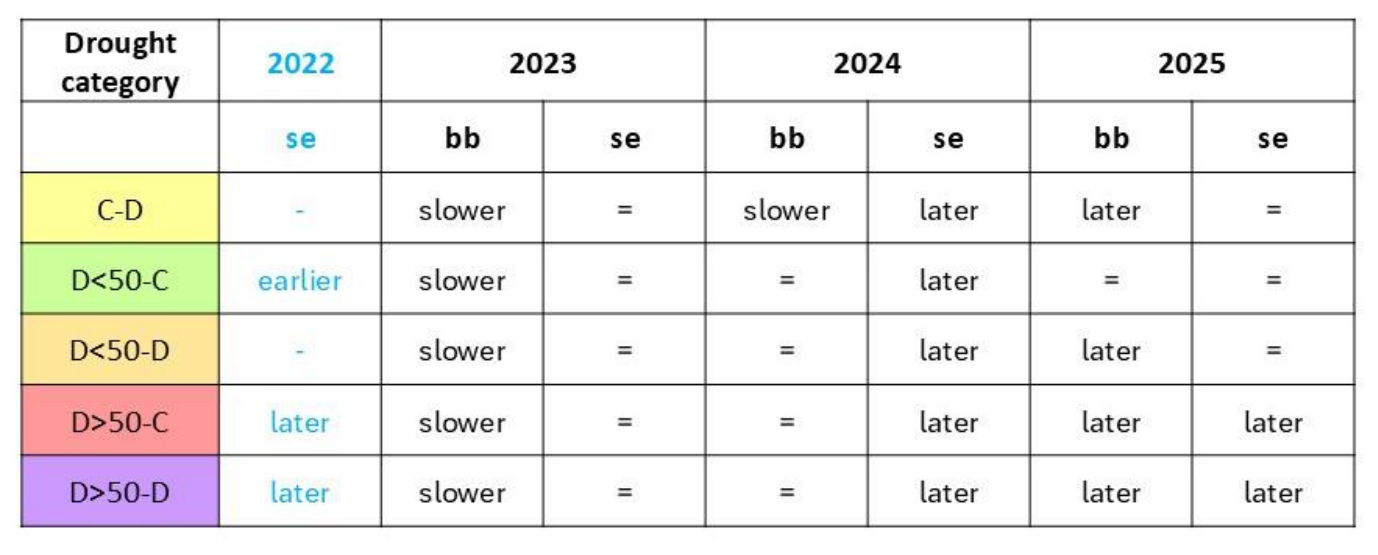
Figure 3.
Modelled height and diameter increment for the controls (C-C) and the different drought categories, in 2023 till 2025. The double controls are the standard to which the different drought categories are compared to. Drought categories are summarised in Figure 6. Drought categories significantly differing from the double controls are indicated in colour, not significantly differing drought categories are indicated in grey.
Figure 3.
Modelled height and diameter increment for the controls (C-C) and the different drought categories, in 2023 till 2025. The double controls are the standard to which the different drought categories are compared to. Drought categories are summarised in Figure 6. Drought categories significantly differing from the double controls are indicated in colour, not significantly differing drought categories are indicated in grey.
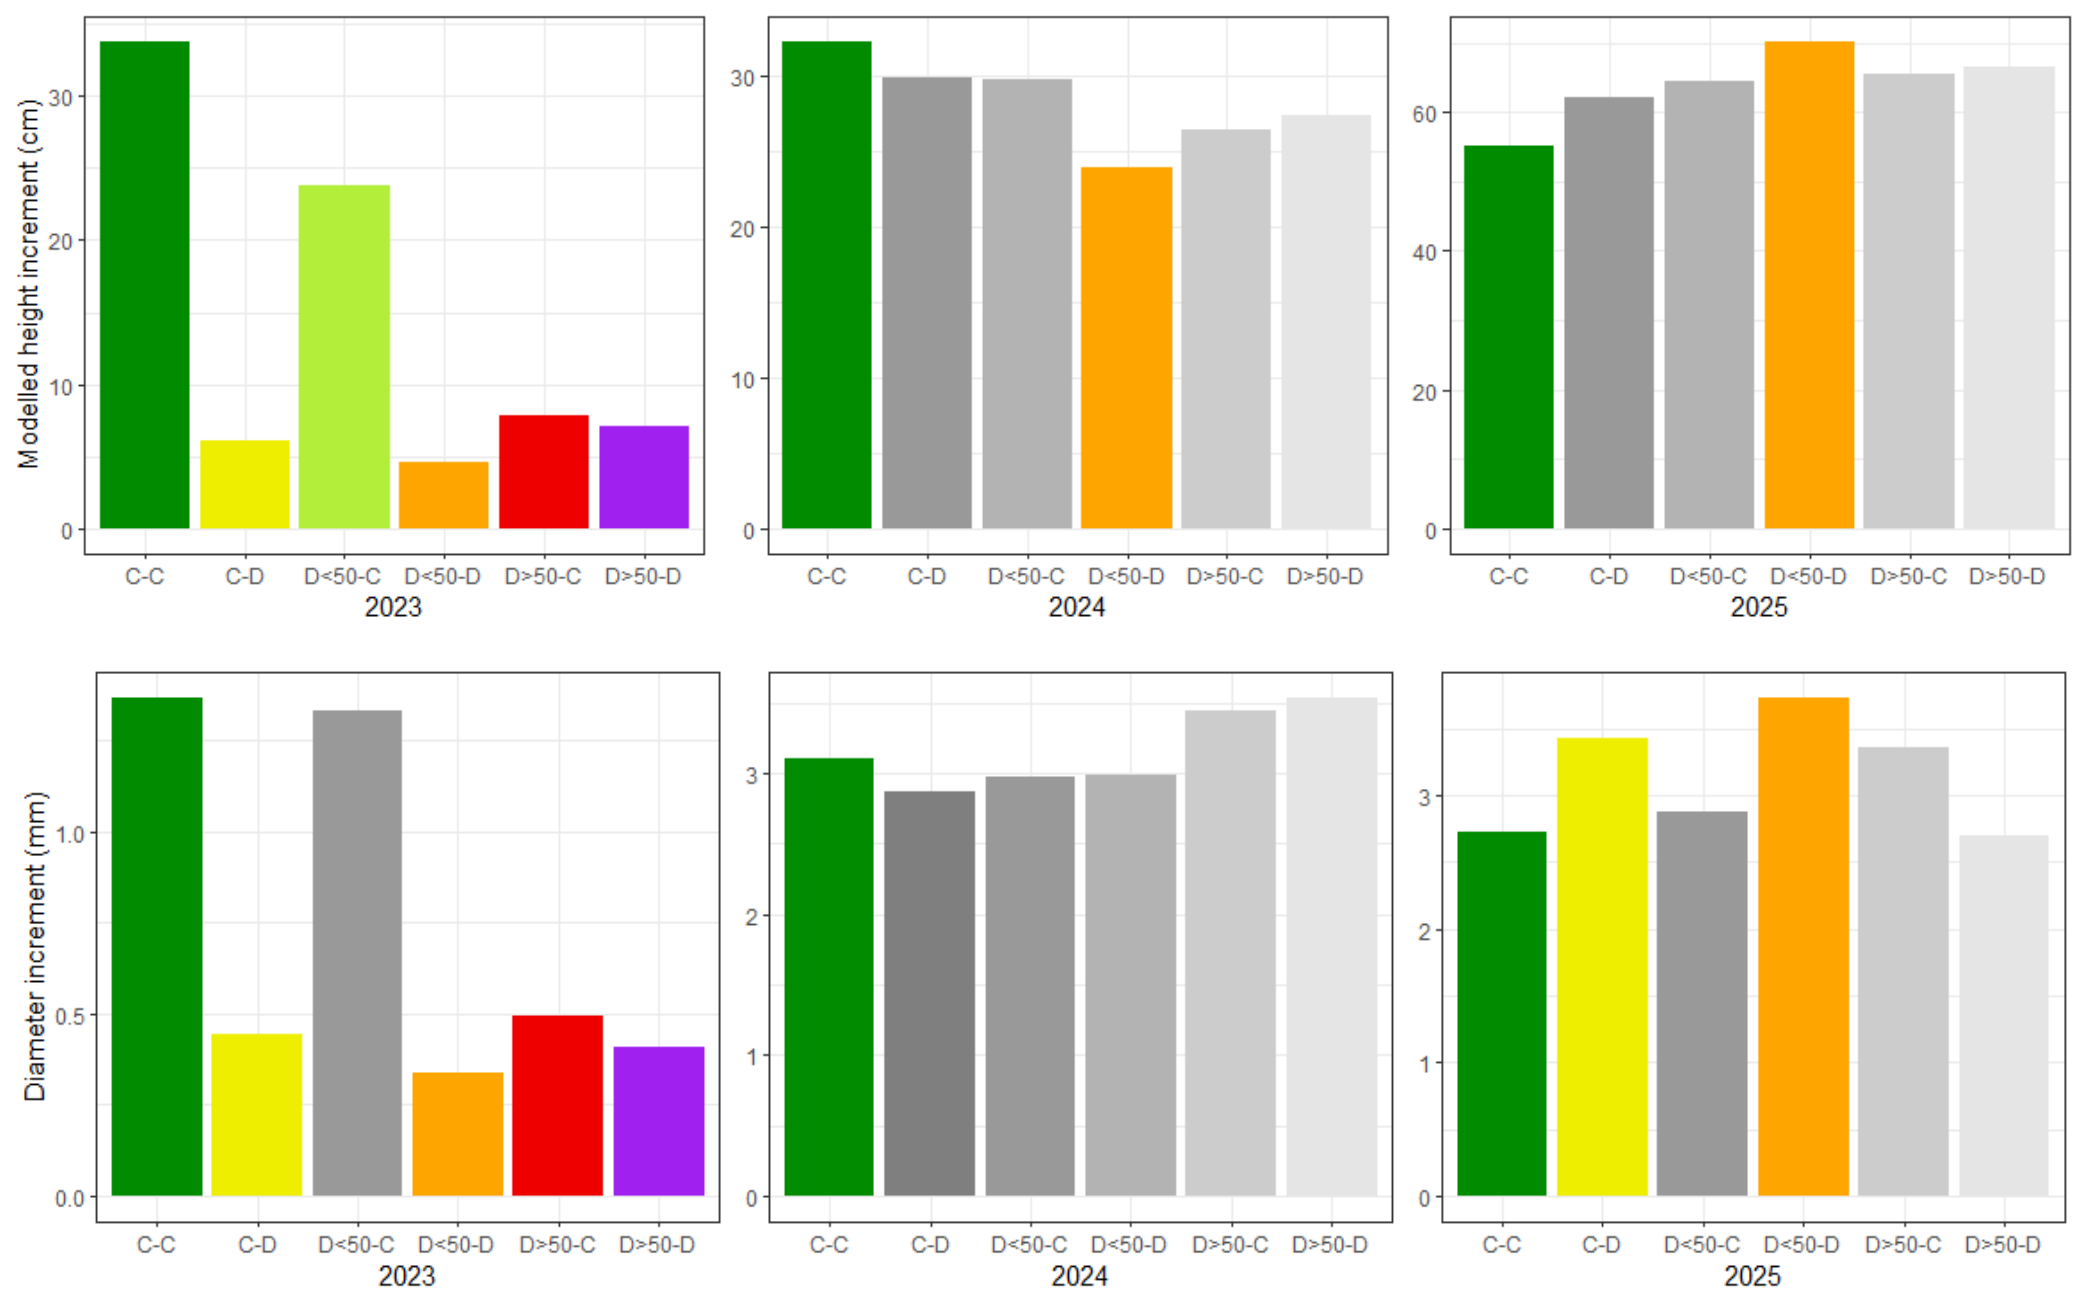
Figure 4.
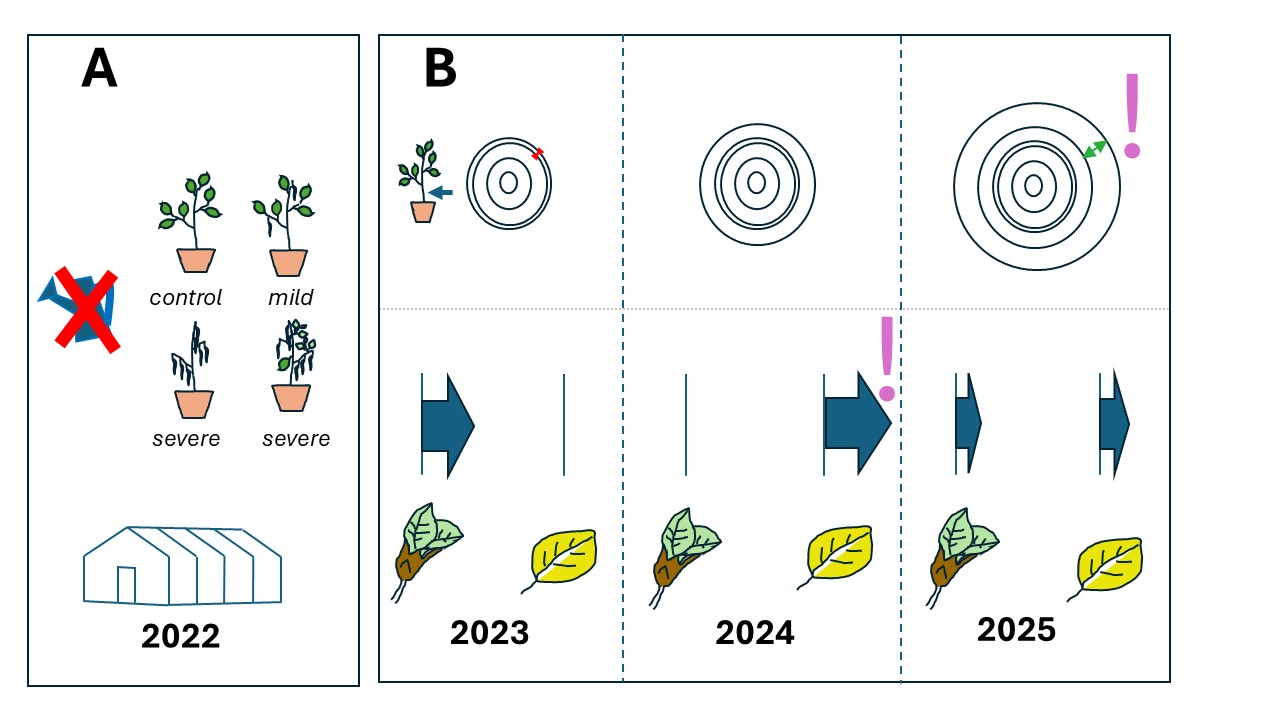
Schematic representation of the growth responses in the post-drought years 2023 till 2025. The different drought categories are compared to the double controls (C-C), with = indicating no significant difference from C-C. Drought categories are summarised in Figure 6.
Figure 4.
Schematic representation of the growth responses in the post-drought years 2023 till 2025. The different drought categories are compared to the double controls (C-C), with = indicating no significant difference from C-C. Drought categories are summarised in Figure 6.
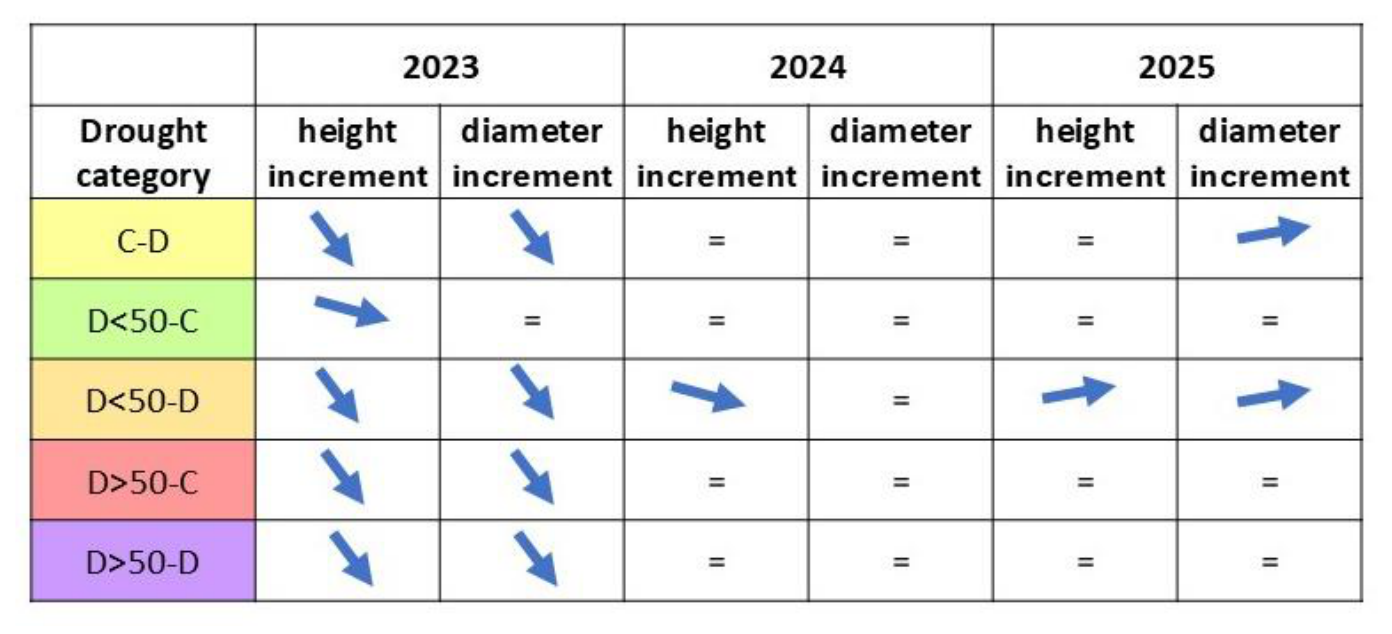
Figure 5.
Mean monthly temperature and monthly sunshine duration for the three studied post-drought years 2023 till 2025, in Uccle, Belgium (50 km distance from container field in Geraardsbergen, Belgium). Data source: Royal Meteorological Institute of Belgium, Open Data platform [39].
Figure 5.
Mean monthly temperature and monthly sunshine duration for the three studied post-drought years 2023 till 2025, in Uccle, Belgium (50 km distance from container field in Geraardsbergen, Belgium). Data source: Royal Meteorological Institute of Belgium, Open Data platform [39].
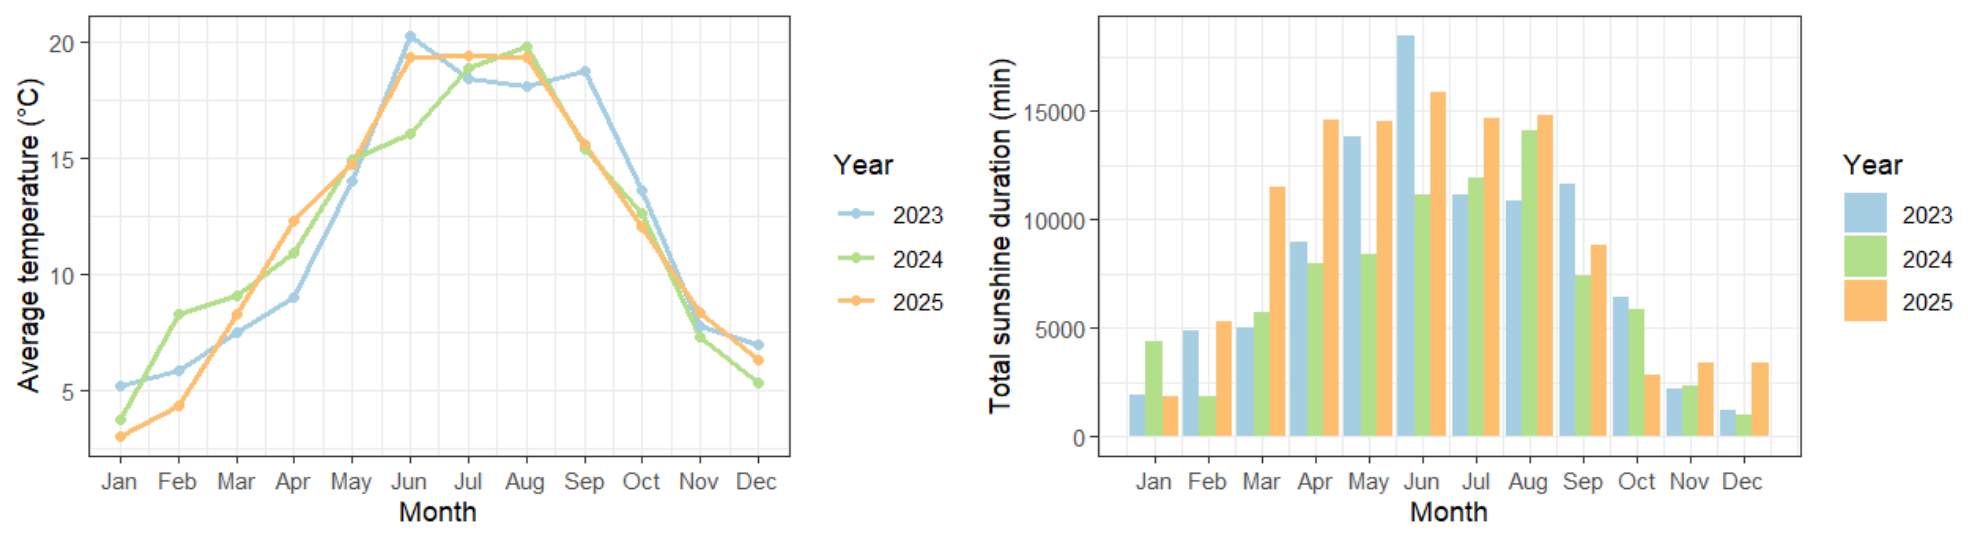
Figure 6.
Schematic representation of the drought treatments in 2022. C: control, D: drought treatment with D<50 and D>50: less or more than 50% of the leaves desiccated in the spring drought treatment. Based on the timing of the drought and the severity of the developed symptoms, saplings were categorized in 6 groups.
Figure 6.
Schematic representation of the drought treatments in 2022. C: control, D: drought treatment with D<50 and D>50: less or more than 50% of the leaves desiccated in the spring drought treatment. Based on the timing of the drought and the severity of the developed symptoms, saplings were categorized in 6 groups.
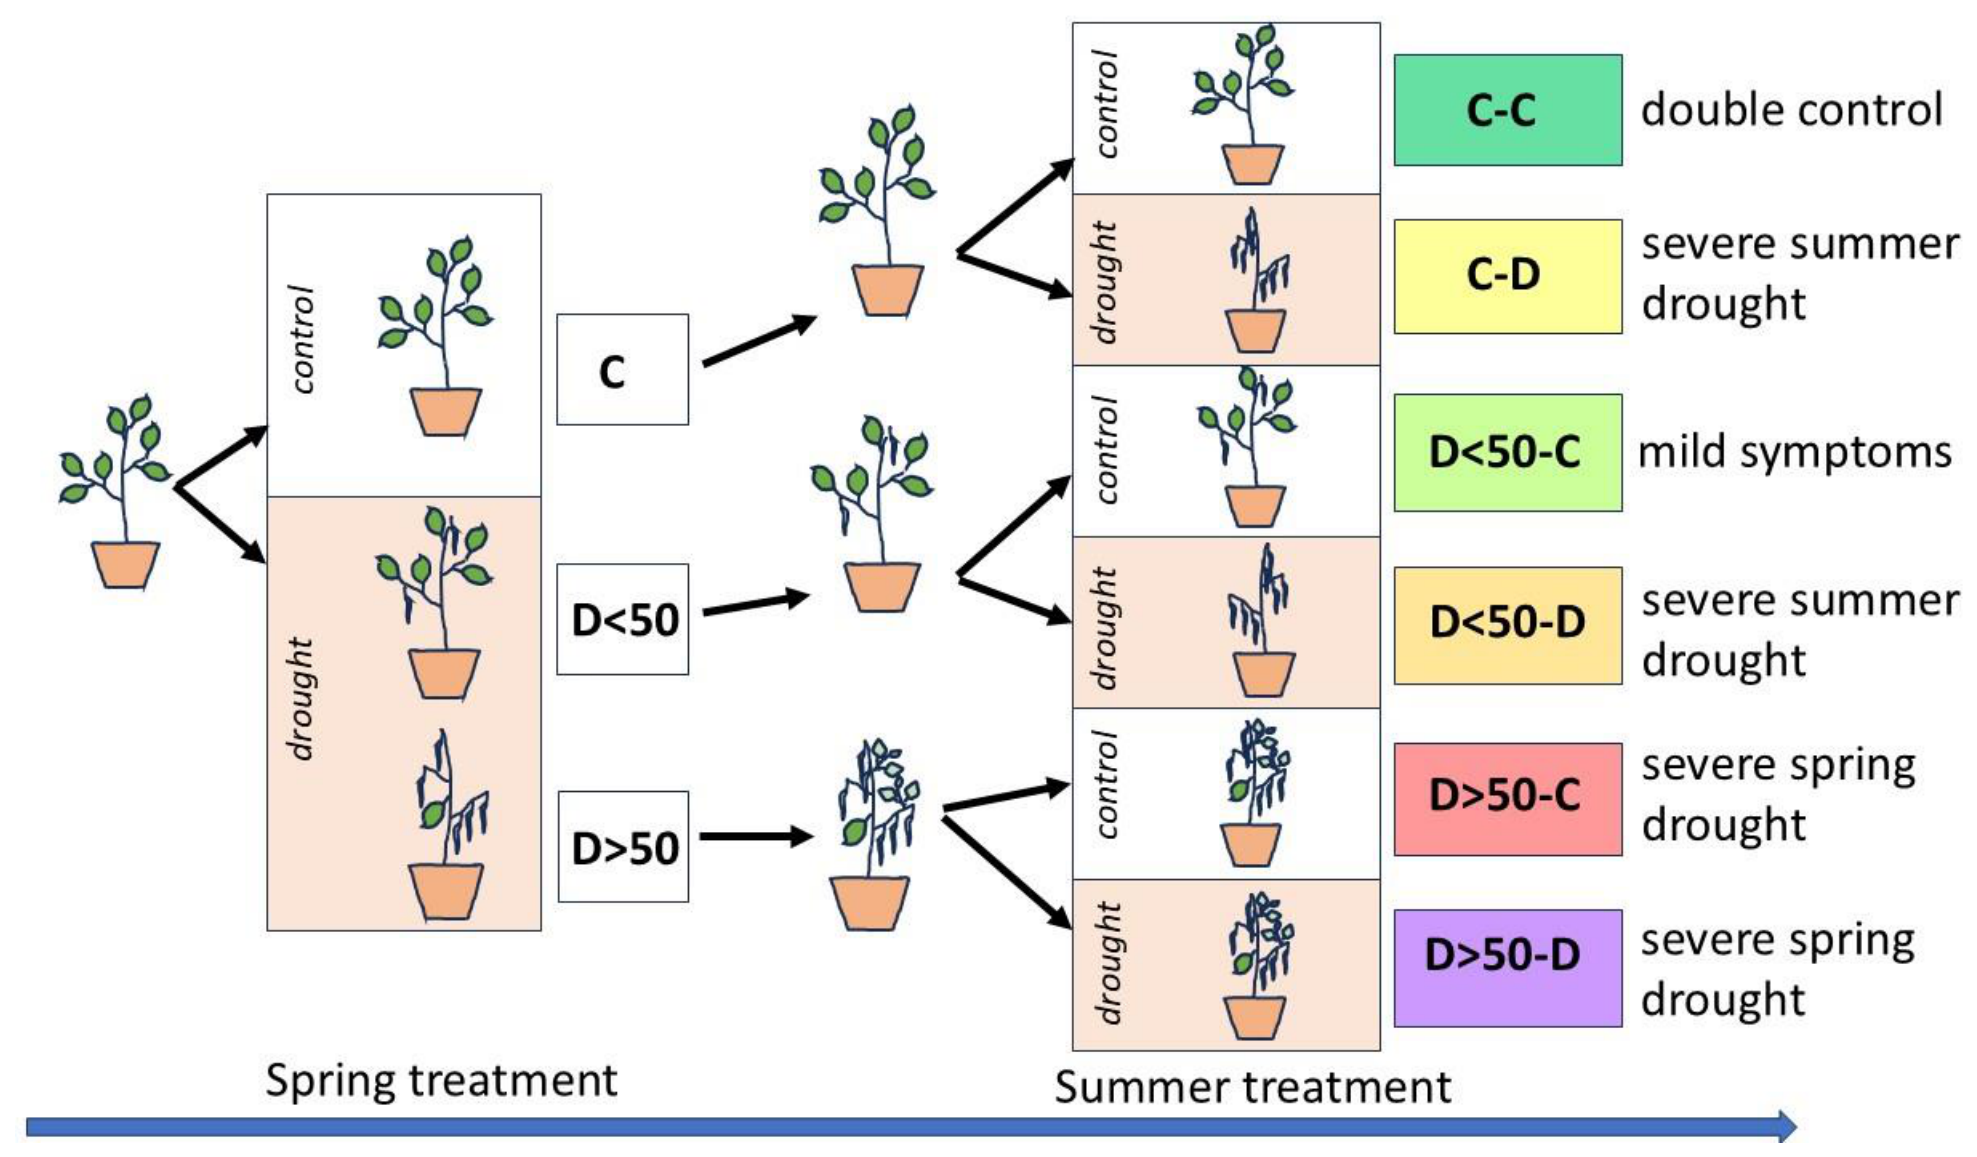

Table 1.
Test statistics for the modelling of bud burst and leaf senescence in the years 2023 till 2025. The different drought categories (C-D, D<50-C, D<50-D, D>50-C and D>50-D) were compared to the standard double controls. For bud burst, plant height (Hei) at the beginning of the growing season was included as a covariate, whereas for leaf senescence, plant height at the end of the growing. Drought categories are summarised in Figure 6.
Table 1.
Test statistics for the modelling of bud burst and leaf senescence in the years 2023 till 2025. The different drought categories (C-D, D<50-C, D<50-D, D>50-C and D>50-D) were compared to the standard double controls. For bud burst, plant height (Hei) at the beginning of the growing season was included as a covariate, whereas for leaf senescence, plant height at the end of the growing. Drought categories are summarised in Figure 6.
| bud burst | leaf senescence | ||||||||
| Year | Variable | Estimate | Std. error | z-value | p-value | Estimate | Std,Error | z-value | p-value |
| 2023 | Day | -0,60 | 0,04 | -14,51 | <0,001*** | 0,24 | 0,03 | 9,37 | <0,001*** |
| C-D | -4,15 | 0,73 | -5,72 | <0,001*** | -0,85 | 0,65 | -1,31 | 0,191 | |
| D<50-C | -1,79 | 0,79 | -2,25 | 0,024* | 1,01 | 0,63 | 1,61 | 0,108 | |
| D<50-D | -5,48 | 0,74 | -7,41 | <0,001*** | -0,64 | 0,71 | -0,90 | 0,367 | |
| D>50-C | -0,94 | 1,17 | -0,80 | 0,422 | 0,53 | 0,80 | 0,66 | 0,508 | |
| D>50-D | -1,28 | 1,12 | -1,14 | 0,253 | -0,66 | 0,81 | -0,82 | 0,415 | |
| Hei22/Hei23 | -0,01 | 0,01 | -1,49 | 0,137 | 0,05 | 0,01 | 5,03 | <0,001*** | |
| C-D : Day | 0,30 | 0,04 | 8,28 | <0,001*** | 0,03 | 0,02 | 1,82 | 0,069 | |
| D<50-C : Day | 0,12 | 0,04 | 3,36 | <0,001*** | 0,00 | 0,02 | -0,21 | 0,835 | |
| D<50-D : Day | 0,34 | 0,04 | 9,18 | <0,001*** | 0,04 | 0,02 | 1,94 | 0,053 | |
| D>50-C : Day | 0,19 | 0,05 | 3,70 | <0,001*** | 0,01 | 0,02 | 0,59 | 0,557 | |
| D>50-D : Day | 0,20 | 0,05 | 4,09 | <0,001*** | 0,00 | 0,02 | -0,03 | 0,976 | |
| 2024 | Day | -0,81 | 0,06 | -14,49 | <0,001*** | 0,13 | 0,01 | 13,15 | <0,001*** |
| C-D | 0,86 | 1,70 | 0,50 | 0,615 | -2,74 | 0,51 | -5,43 | <0,001*** | |
| D<50-C | -1,27 | 1,64 | -0,77 | 0,440 | -1,31 | 0,52 | -2,54 | 0,011* | |
| D<50-D | -1,14 | 1,85 | -0,62 | 0,537 | -2,84 | 0,58 | -4,91 | <0,001*** | |
| D>50-C | 2,48 | 2,19 | 1,13 | 0,258 | -2,83 | 0,66 | -4,30 | <0,001*** | |
| D>50-D | 4,29 | 2,24 | 1,92 | 0,055 | -3,26 | 0,66 | -4,92 | <0,001*** | |
| Hei23/Hei24 | 0,03 | 0,23 | 0,12 | 0,903 | -0,01 | 0,01 | -1,06 | 0,291 | |
| C-D : Day | 0,11 | 0,05 | 2,33 | 0,020* | 0,02 | 0,01 | 1,59 | 0,113 | |
| D<50-C : Day | 0,06 | 0,05 | 1,32 | 0,187 | 0,02 | 0,01 | 1,63 | 0,103 | |
| D<50-D : Day | 0,07 | 0,05 | 1,44 | 0,149 | 0,02 | 0,01 | 1,48 | 0,138 | |
| D>50-C : Day | -0,09 | 0,07 | -1,30 | 0,192 | 0,00 | 0,01 | 0,23 | 0,817 | |
| D>50-D : Day | -0,04 | 0,07 | -0,57 | 0,568 | 0,03 | 0,01 | 1,97 | 0,049* | |
| 2025 | Day | -0,64 | 0,00 | -352,63 | <0,001*** | 0,27 | 0,03 | 8,06 | <0,001*** |
| C-D | 1,66 | 0,00 | 710,33 | <0,001*** | -0,31 | 0,52 | -0,59 | 0,556 | |
| D<50-C | -0,13 | 0,57 | -0,23 | 0,819 | -1,04 | 0,56 | -1,85 | 0,065 | |
| D<50-D | 1,25 | 0,62 | 2,02 | 0,043* | -0,30 | 0,58 | -0,52 | 0,605 | |
| D>50-C | 2,13 | 0,93 | 2,30 | 0,021* | -1,67 | 0,69 | -2,42 | 0,015* | |
| D>50-D | 2,59 | 0,89 | 2,92 | 0,004** | -1,85 | 0,68 | -2,74 | 0,006** | |
| Hei24/Hei25 | 0,21 | 0,00 | 118,85 | <0,001*** | 0,00 | 0,00 | -0,91 | 0,364 | |
| C-D : Day | 0,03 | 0,00 | 13,98 | <0,001*** | -0,03 | 0,04 | -0,75 | 0,451 | |
| D<50-C : Day | 0,06 | 0,03 | 1,86 | 0,063 | 0,07 | 0,04 | 1,64 | 0,101 | |
| D<50-D : Day | -0,02 | 0,04 | -0,62 | 0,536 | -0,06 | 0,05 | -1,40 | 0,162 | |
| D>50-C : Day | 0,00 | 0,05 | -0,07 | 0,949 | -0,01 | 0,05 | -0,27 | 0,784 | |
| D>50-D : Day | 0,06 | 0,05 | 1,27 | 0,204 | 0,04 | 0,05 | 0,67 | 0,500 | |
*** p < 0.001; ** p < 0.01; * p < 0.05.
Table 2.
Statistics of the modelling of the chlorophyll content index in the years 2023 till 2025. The different drought categories (C-D, D<50-C, D<50-D, D>50-C and D>50-D) are compared to the standard double controls. Hei is height at the beginning of the growing season. A quadratic effect of Day was included in the models. Drought categories are summarised in Figure 6.
Table 2.
Statistics of the modelling of the chlorophyll content index in the years 2023 till 2025. The different drought categories (C-D, D<50-C, D<50-D, D>50-C and D>50-D) are compared to the standard double controls. Hei is height at the beginning of the growing season. A quadratic effect of Day was included in the models. Drought categories are summarised in Figure 6.
| Year | Variable | Value | Std. error | DF | t-value | p-value |
| 2023 | (Intercept) | 11,09 | 0,74 | 548 | 14,98 | <0,001*** |
| C-D | 2,49 | 0,41 | 274 | 6,07 | <0,001*** | |
| D<50-C | -0,32 | 0,45 | 274 | -0,71 | 0,481 | |
| D<50-D | 1,73 | 0,46 | 274 | 3,75 | <0,001*** | |
| D>50-C | 0,64 | 0,55 | 274 | 1,17 | 0,245 | |
| D>50-D | 0,82 | 0,54 | 274 | 1,51 | 0,131 | |
| Day | -6,67 | 2,60 | 548 | -2,57 | 0,011* | |
| Day2 | 1,42 | 2,60 | 548 | 0,55 | 0,584 | |
| Hei22 | -0,06 | 0,01 | 274 | -7,42 | <0,001*** | |
| C-D : Day | 2,34 | 3,74 | 548 | 0,63 | 0,531 | |
| D<50-C : Day | 0,27 | 4,14 | 548 | 0,07 | 0,948 | |
| D<50-D : Day | 5,16 | 4,25 | 548 | 1,21 | 0,225 | |
| D>50-C : Day | 3,94 | 5,01 | 548 | 0,79 | 0,433 | |
| D>50-D : Day | 8,47 | 4,88 | 548 | 1,74 | 0,083 | |
| C-D : Day2 | -5,11 | 3,73 | 548 | -1,37 | 0,172 | |
| D<50-C : Day2 | 0,63 | 4,15 | 548 | 0,15 | 0,879 | |
| D<50-D : Day2 | -1,94 | 4,24 | 548 | -0,46 | 0,647 | |
| D>50-C : Day2 | -1,42 | 5,02 | 548 | -0,28 | 0,777 | |
| D>50-D : Day2 | -0,19 | 4,89 | 548 | -0,04 | 0,969 | |
| 2024 | (Intercept) | 11,77 | 0,99 | 545 | 11,92 | <0,001*** |
| C-D | 0,35 | 0,53 | 272 | 0,67 | 0,505 | |
| D<50-C | -0,04 | 0,51 | 272 | -0,08 | 0,939 | |
| D<50-D | 0,44 | 0,58 | 272 | 0,76 | 0,447 | |
| D>50-C | -0,47 | 0,66 | 272 | -0,72 | 0,475 | |
| D>50-D | -0,27 | 0,66 | 272 | -0,41 | 0,682 | |
| Day | -10,99 | 2,84 | 545 | -3,87 | <0,001*** | |
| Day2 | -3,94 | 2,83 | 545 | -1,39 | 0,165 | |
| Hei23 | -0,03 | 0,01 | 272 | -4,25 | <0,001*** | |
| C-D : Day | 1,54 | 4,08 | 545 | 0,38 | 0,706 | |
| D<50-C : Day | -2,25 | 4,54 | 545 | -0,50 | 0,621 | |
| D<50-D : Day | 12,06 | 4,61 | 545 | 2,62 | 0,009** | |
| D>50-C : Day | 11,88 | 5,46 | 545 | 2,18 | 0,030* | |
| D>50-D : Day | 21,36 | 5,32 | 545 | 4,02 | <0,001*** | |
| C-D : Day2 | 1,31 | 4,07 | 545 | 0,32 | 0,748 | |
| D<50-C : Day2 | 2,41 | 4,54 | 545 | 0,53 | 0,596 | |
| D<50-D : Day2 | -1,92 | 4,60 | 545 | -0,42 | 0,677 | |
| D>50-C : Day2 | -7,10 | 5,46 | 545 | -1,30 | 0,194 | |
| D>50-D : Day2 | -4,14 | 5,32 | 545 | -0,78 | 0,436 | |
| 2025 | (Intercept) | 13,10 | 0,95 | 544 | 13,76 | <0,001*** |
| C-D | 0,70 | 0,48 | 271 | 1,45 | 0,147 | |
| D<50-C | -0,26 | 0,49 | 271 | -0,53 | 0,596 | |
| D<50-D | 0,86 | 0,55 | 271 | 1,56 | 0,120 | |
| D>50-C | -0,17 | 0,62 | 271 | -0,27 | 0,790 | |
| D>50-D | 0,52 | 0,62 | 271 | 0,84 | 0,399 | |
| Day | -1,20 | 3,65 | 544 | -0,33 | 0,742 | |
| Day2 | -2,50 | 3,65 | 544 | -0,69 | 0,494 | |
| Hei24 | -0,02 | 0,01 | 271 | -3,94 | <0,001*** | |
| C-D : Day | 5,66 | 5,22 | 544 | 1,08 | 0,279 | |
| D<50-C : Day | -10,00 | 5,78 | 544 | -1,73 | 0,084 | |
| D<50-D : Day | 4,45 | 5,90 | 544 | 0,75 | 0,451 | |
| D>50-C : Day | -0,07 | 6,98 | 544 | -0,01 | 0,992 | |
| D>50-D : Day | 8,81 | 6,80 | 544 | 1,30 | 0,196 | |
| C-D : Day2 | 1,40 | 5,22 | 544 | 0,27 | 0,788 | |
| D<50-C : Day2 | 0,66 | 5,80 | 544 | 0,11 | 0,910 | |
| D<50-D : Day2 | -4,32 | 5,89 | 544 | -0,73 | 0,464 | |
| D>50-C : Day2 | 2,20 | 6,97 | 544 | 0,32 | 0,753 | |
| D>50-D : Day2 | -7,17 | 6,79 | 544 | -1,06 | 0,291 |
*** p < 0.001; ** p < 0.01; * p < 0.05.
Table 3.
Test statistics for the modelling of the height and diameter increments in the years 2023 till 2025. The different drought categories (C-D, D<50-C, D<50-D, D>50-C and D>50-D) were compared to the standard double controls. For height and diameter increment, plant height (Hei) and diameter (Dia) at the beginning of the growing season were included as covariates, respectively.
Table 3.
Test statistics for the modelling of the height and diameter increments in the years 2023 till 2025. The different drought categories (C-D, D<50-C, D<50-D, D>50-C and D>50-D) were compared to the standard double controls. For height and diameter increment, plant height (Hei) and diameter (Dia) at the beginning of the growing season were included as covariates, respectively.
| Height increment | Diameter increment | ||||||||
| Year | Variable | Estimate | Std. error | t-value | p-value | Estimate | Std. error | t-value | p-value |
| 2023 | (Intercept) | 40,39 | 3,71 | 10,89 | <0,001*** | 3,58 | 0,44 | 8,05 | <0,001*** |
| tr5C-D | -27,68 | 2,06 | -13,42 | <0,001*** | -0,92 | 0,13 | -7,10 | <0,001*** | |
| tr5D1:3-C | -9,96 | 2,24 | -4,46 | <0,001*** | -0,04 | 0,14 | -0,25 | 0,805 | |
| tr5D1:3-D | -29,15 | 2,31 | -12,64 | <0,001*** | -1,03 | 0,15 | -7,04 | <0,001*** | |
| tr5D4:6-C | -25,99 | 2,73 | -9,51 | <0,001*** | -0,88 | 0,18 | -4,96 | <0,001*** | |
| tr5D4:6-D | -26,71 | 2,70 | -9,89 | <0,001*** | -0,96 | 0,17 | -5,59 | <0,001*** | |
| Hei22/Dia22 | -0,08 | 0,04 | -2,10 | 0,036* | -0,18 | 0,04 | -5,02 | <0,001*** | |
| 2024 | (Intercept) | 44,54 | 6,96 | 6,40 | <0,001*** | 2,47 | 0,73 | 3,36 | <0,001*** |
| tr5C-D | -2,38 | 3,76 | -0,63 | 0,527 | -0,23 | 0,20 | -1,18 | 0,238 | |
| tr5D1:3-C | -2,56 | 3,58 | -0,71 | 0,476 | -0,13 | 0,22 | -0,62 | 0,537 | |
| tr5D1:3-D | -8,41 | 4,12 | -2,04 | 0,042* | -0,13 | 0,23 | -0,55 | 0,586 | |
| tr5D4:6-C | -5,89 | 4,66 | -1,26 | 0,208 | 0,33 | 0,26 | 1,27 | 0,204 | |
| tr5D4:6-D | -4,89 | 4,69 | -1,04 | 0,299 | 0,43 | 0,25 | 1,70 | 0,091 | |
| Hei23/Dia23 | -0,12 | 0,05 | -2,34 | 0,020* | 0,05 | 0,05 | 0,92 | 0,359 | |
| 2025 | (Intercept) | 49,39 | 10,75 | 4,60 | <0,001*** | 5,25 | 1,06 | 4,96 | <0,001*** |
| tr5C-D | 6,91 | 5,43 | 1,27 | 0,205 | 0,71 | 0,32 | 2,24 | 0,026* | |
| tr5D1:3-C | 9,35 | 5,53 | 1,69 | 0,092 | 0,15 | 0,35 | 0,44 | 0,657 | |
| tr5D1:3-D | 15,10 | 6,21 | 2,43 | 0,016* | 1,01 | 0,36 | 2,80 | 0,006** | |
| tr5D4:6-C | 10,34 | 7,05 | 1,47 | 0,143 | 0,63 | 0,42 | 1,52 | 0,130 | |
| tr5D4:6-D | 11,37 | 6,98 | 1,63 | 0,104 | -0,02 | 0,41 | -0,06 | 0,956 | |
| Hei24/Dia24 | 0,04 | 0,07 | 0,67 | 0,501 | -0,16 | 0,06 | -2,51 | 0,013* | |
*** p < 0.001; ** p < 0.01; * p < 0.05.
Table 4.
Days of observation for the phenophases bud burst and leaf senescence, and of the measurements of leaf chlorophyll content index, in the years 2023 till 2025.
Table 4.
Days of observation for the phenophases bud burst and leaf senescence, and of the measurements of leaf chlorophyll content index, in the years 2023 till 2025.
| Year | Bud burst | Chlorophyll content index | Leaf senescence |
| 2023 | 18 and 24 April, 2 and 16 May | 19 June, 1 August and 15 September | 25 September, 30 October and 20 November |
| 2024 | 8, 15, 22 and 29 April | 13 June, 2 Agusut and 27 September | 23 September, 15 October and 12 November |
| 2025 | 17, 22 and 28 April, 5 May | 2 June, 28 July and 25 September | 13 October and 27 October |
Disclaimer/Publisher’s Note: The statements, opinions and data contained in all publications are solely those of the individual author(s) and contributor(s) and not of MDPI and/or the editor(s). MDPI and/or the editor(s) disclaim responsibility for any injury to people or property resulting from any ideas, methods, instructions or products referred to in the content. |
© 2026 by the authors. Licensee MDPI, Basel, Switzerland. This article is an open access article distributed under the terms and conditions of the Creative Commons Attribution (CC BY) license (http://creativecommons.org/licenses/by/4.0/).
Copyright: This open access article is published under a Creative Commons CC BY 4.0 license, which permit the free download, distribution, and reuse, provided that the author and preprint are cited in any reuse.