
Submitted:
18 August 2026
Posted:
19 August 2026
You are already at the latest version
Abstract
The growing global demand for particleboards has generated large quantities of waste in recent years. This waste mainly arises from manufacturing processes, furniture industry offcuts, and end-of-life disposal. In response to waste management challenges, recycling and reuse technologies have advanced significantly. In this context, this study evaluates the feasibility of producing new particleboards using recycled particles obtained from laminated particleboard waste treated with oxalic acid hydrolysis. Three-layer panels were manufactured with varying proportions of recycled particles (0%, 25%, 50%, 75%, and 100%) in the core layer. Their average density, vertical density profile, physical and mechanical properties, as well as their formaldehyde emissions, were assessed. The results showed that the inclusion of recycled particles did not significantly impact the average density or the vertical density profiles of the panels. Thickness swelling and water absorption after 24 h immersion were similar across all panels, indicating good dimensional stability. Internal bond (IB) strength showed no consistent trend with increasing recycled particle content, and panels with 75% recycled particles achieved the highest IB strength (0.48 MPa). In contrast, bending properties decreased when the proportion of recycled particles exceeded 25%. All panels satisfied the requirements of the LD-2 Grade for low-density particleboards specified by the ANSI A208.1-2022 standard. Although formaldehyde emissions increased in panels with more than 25% recycled particles, they remained within acceptable limits up to 75% recycled material. These findings indicate that particleboards can incorporate up to 75% recycled particles in the core, while maintaining physical and mechanical properties comparable to those of the control panels.
Keywords:
wood-based panels
; particleboard waste
; urea-formaldehyde removal
; particle size
; mechanical properties
; dimensional stability
; formaldehyde emissions
; nitrogen content
; circular economy
1. Introduction
Particleboards are engineered composite materials manufactured by a hot-pressing process. This process involves bonding wood particles of varying sizes with synthetic resins, most commonly urea–formaldehyde (UF). Particleboards typically consist of three layers: two outer layers made of fine particles that provide a smooth surface and finish, and a core layer composed of coarse, large particles that contribute to the panel’s structural integrity and help reduce its overall weight. Particleboards are widely used in furniture manufacturing, construction, and interior architecture, and are sometimes also employed for packaging and panelling applications [1,2,3].
Particleboard production has steadily increased in recent years due to growing global demand. In 2024, annual production reached a record high, exceeding 122 million m³, an increase of about 18% over the previous five-year average [4]. As a result, the amount of wood panel waste generated from manufacturing processes, furniture industry offcuts, and especially end-of-life disposal is expected to continue increasing in the coming years. Most of this waste is either incinerated or disposed of in landfills, where synthetic resins and melamine-based laminates constitute the main contaminants [5,6,7]. These practices are environmentally unsustainable and have prompted growing interest in strategies focused on reuse, recycling, and improved waste management [8]. However, recycling wood-based panels remains challenging due to the presence of both physical and chemical contaminants. Common recycling approaches for wood-based panels include chemical treatments to weaken adhesive–wood bonds, thermo-hydrolytic processes for degrading cured adhesives, and mechanical techniques to individualize wood particles and fibers. The primary goal of all these treatments is to recover the maximum amount of usable particles while minimizing damage, thereby enabling their reuse as raw material in the manufacture of new panels.
Previous studies have shown that particleboard can be recycled into suitable raw materials for producing new panels with acceptable physical and chemical properties [9,10,11]. Most research has focused on hydrothermal treatments for particle recycling, with variations in processing conditions such as temperature and reaction time. This approach is justified by the high susceptibility of UF adhesives to hydrolysis. Lykidis and Grigoriou [9] applied hydrothermal treatment to commercial particleboard and then manufactured new panels using the recovered material. Panels treated hydrothermally at 150 °C for 10 min exhibited the best mechanical performance. In a similar study, Bütün Buschalsky and Mai [12] applied a thermo-hydrolytic treatment to medium-density fiberboard (MDF) in an autoclave at 95 °C, with reaction times of 20-30 min. This process successfully removed approximately 70% of the cured UF resin originally present in the panels. New MDF panels made entirely from recycled fibers showed that formaldehyde emissions remained comparable to those of the original panels, while their mechanical properties were not adversely affected.
Mechanical recycling methods, in contrast, are generally considered less suitable. These processes often damage particles, do not remove cured adhesives, and significantly alter particle geometry, thereby increasing the proportion of fine particles [13]. Wronka and Kowaluk [10] evaluated the influence of multiple mechanical recycling cycles of particleboards on the mechanical properties of new panels. Their results showed a decline in the panels’ mechanical performance that was both unprofitable and unacceptable. However, Ihnát et al. [14] reported that an optimized mechanical disintegration method can yield a particle composition suitable for manufacturing surface layers in new particleboards.
Using acidic solutions for the hydrolysis of wood-based panels shows better kinetic efficiency than aqueous methods, speeding up the breakdown of cured UF resin under relatively mild conditions [15]. However, the application of acid hydrolysis to particleboard has been less studied, with most research focusing on MDF panels [15,16]. Nuryawan et al. [11] investigated the use of hydrochloric acid (HCl) to recycle UF-bonded particleboards and found that hydrolysis reduced nitrogen content compared to non-hydrolyzed reference panels. The greatest reduction (approximately 40%) was achieved with a 1 N HCl solution. Similarly, Rodríguez et al. [17] reported that oxalic acid hydrolysis removes cured UF resin from particleboard waste approximately twice as fast as water-based methods, while producing recycled particles suitable for new panel production. Their study also showed that treatment with 1% oxalic acid for 30 min can decrease formaldehyde emissions by up to 90%.
In this context, this study aimed to evaluate the feasibility of producing new particleboards from laminated, UF-bonded particleboard waste treated by oxalic acid hydrolysis. The evaluation focused on assessing the physical and mechanical properties and formaldehyde emissions of the panels manufactured with varying proportions of recycled particles in the core layer.
2. Materials and Methods
2.1. Materials
Particleboard waste (15 mm thickness), bonded with UF adhesive and overlaid with melamine-impregnated paper, was obtained from AIM Éco-Centre, Saint-Augustin, QC, Canada. The panels were cut into 25 cm x 25 cm pieces and milled into particles. Industrial wood particles were supplied by Tafisa Canada (Lac-Mégantic, QC, Canada). Oxalic acid (≥ 99% purity) used for hydrolysis was purchased from Sigma-Aldrich (St. Louis, MO, USA). The UF resin (70% solid content) used for particleboard production was supplied by Hexion Canada Inc. (St-Romuald, QC, Canada).
2.2. Particle Recycling by Acid Hydrolysis
Recycled particles were obtained by subjecting milled particleboard waste (raw particles) to acid hydrolysis. The treatment was carried out using a Scientific Prevacuum Sterilizer, model SV-120 from STERIS® Amsco® Century™ (Mentor, OH, USA) at 122 °C for 30 min with a 1% oxalic acid solution, following the procedure reported by Rodríguez et al. [17]. The chamber pressure was maintained at 124.1 ± 1 kPa. For each batch, 2 kg of raw particles were hydrolyzed in 15 L of oxalic acid solution, the capacity of the sterilizer. The process was repeated as needed to obtain sufficient recycled particles for the manufacture of new panels. Following hydrolysis, the particles were filtered through Whatman® Grade 1 filter paper, thoroughly washed with distilled water, dried at 103 °C, and stored until used in panel manufacturing.
2.3. Hot-Water Treatment
Before panel production, both untreated raw particles and those treated with oxalic acid underwent a hot-water treatment to remove the melamine paper overlay and further eliminate cured UF from the recycled material. The particles were boiled in water for 30 min. Four material conditions were defined: (1) untreated raw particles, (2) hot-water treated particles (HWTP), (3) oxalic acid-treated particles (OATP) and (4) oxalic acid-treated particles that received hot water pretreatment (HWTP + OATP). The hot-water treatment failed to remove the melamine paper overlay. Nonetheless, the four particle types were retained for subsequent characterization of their physicochemical properties, and the best treatment was selected to produce recycled particles for panel manufacturing.
2.4. Physicochemical Characterization of Recycled Particles
The effectiveness of hot-water and acid hydrolysis treatments was evaluated by analyzing particle size distribution (granulometry), nitrogen content, and chemical functional groups.
Particle size distribution was determined using 150 g of oven-dried particles of each particle type. Samples were analyzed using a RO-TAP RX-29 sieve shaker (Mentor, OH, USA). The samples were sieved for 15 min and separated into five size fractions using 12 (1.68 mm), 20 (0.84 mm), 35 (0.50 mm), and 48 (0.30 mm) mesh screens, along with a pan to collect particles smaller than 0.30 mm. All measurements were performed in triplicate. The mass of particles retained in each fraction was expressed as a percentage to determine the particle size distribution.
The nitrogen content of particles was determined using a Perkin-Elmer 2410 Series II nitrogen analyzer (Shelton, CT, USA). Before analysis, samples were ground to a particle size ≤ 1.05 mm using a Retsch ZM100 ultra-centrifugal grinder mill (Haan, Germany). Approximately 30 mg of each ground sample was analyzed for nitrogen content. Since nitrogen content is directly related to the amount of cured UF adhesive in the particles, this measurement provides a reliable indication of adhesive removal after acid hydrolysis and hot-water treatments. Each particle condition was analyzed in triplicate to ensure reproducibility.
Chemical changes were further evaluated using Fourier transform infrared (FTIR) spectroscopy using a Bruker Invenio-R spectrometer (Billerica, MA, USA) equipped with a single-reflection attenuated total reflectance (ATR) accessory. Spectra were collected over the range of 400–4000 cm⁻¹ at a resolution of 4 cm⁻¹. For each measurement, 2–5 mg of sample (sufficient to fully cover the ATR crystal surface) was pressed against the crystal to ensure proper contact. Each spectrum was recorded with 64 scans to enhance signal quality.
2.5. Particleboard Manufacturing
Three-layer particleboards were produced with a target density of 630 kg/m³ and nominal dimensions of 550 mm x 450 mm x 10 mm (length x width x thickness). Each panel consisted of two surface layers of fine particles and a core layer of coarse particles. The surface-to-core layer mass ratio was set to 35:65. Recycled particles were used exclusively in the core layer, while the surface layers were made from industrial particles provided by the industrial partner. Five different panel types were manufactured by varying the proportion of recycled particles in the core layer: 0% (control), 25%, 50%, 75%, and 100%. Each treatment was replicated three times, resulting in a total of 15 panels.
The panels were bonded with UF resin in a rotary drum blender. The resin was conditioned to 30 °C and adjusted to pH 7 using a 25% (v/v) ammonium chloride solution as a catalyst. Resin content was set at 12% for the surface layers and 10% for the core layer. Additionally, the wax content (58% solids) was 1% in the surface layers and 0.5% in the core layer. All percentages were based on the wood particles oven-dry weight.
Mats were formed in a wooden mold and hot-pressed at 190 °C for 240 s using a Dieffenbacher hot press (Dieffenbacher North America, Windsor, ON, Canada). The panels were conditioned at 20 °C and 65% relative humidity until they reached a constant weight.
2.6. Vertical Density Profile Measurement and Physical and Mechanical Properties Evaluation
The manufactured panels were cut according to the layout shown in Figure 1, removing approximately 50 mm from each panel edge. Panel density and vertical density profile were measured using a QDP-01X densitometer (Quintek Measurement Systems Inc., Knoxville, TN, USA). Physical and mechanical properties were evaluated in accordance with ASTM D1037-12 (2020) [18]. The evaluated physical properties included 24-h thickness swelling (TS) and 24-h water absorption (WA). Mechanical properties included internal bond (IB) strength, modulus of rupture (MOR), and modulus of elasticity (MOE) in static bending. All mechanical tests were performed using a universal testing machine (MTS QTest-5, Eden Prairie, MN, USA) with a capacity of 5 kN. The results were compared with the requirements specified in the ANSI A208.1-2022 standard [19].
2.7. Determination of Formaldehyde Emissions
Formaldehyde emissions from the panels were measured in accordance with Method 3 described in UNE-EN ISO 12460-3:2024 [20]. Specimens measuring 400 mm x 50 mm (length x width) were prepared, with three replicates per treatment, in accordance with the specified emitting surface area requirements. Before testing, specimen edges were sealed with aluminum tape to prevent edge emissions, ensuring that only the surfaces contributed to emissions.
Measurements were performed using a GA300-4 gas analysis test apparatus (IMALPAL Group, San Damaso, MO, Italy). This apparatus consisted of four independent test chambers connected to an air supply, a heating unit, an airflow control unit, and gas-wash bottles for formaldehyde collection. An overview of the apparatus is shown in Figure 2. During the test, each specimen was placed in a closed chamber maintained under controlled temperature, pressure, and airflow conditions. The sample was exposed to a continuous flow of heated, low-humidity air that carried the emitted formaldehyde through the system for 4 h. The outgoing airstream passed through a series of gas-wash bottles containing distilled water, in which the released formaldehyde was absorbed. The formaldehyde concentration absorbed in the solution was subsequently quantified by photometric analysis. The formaldehyde release was calculated from the total solution collected in each gas wash bottle and expressed as milligrams of formaldehyde per square meter of panel surface per hour (mg/(m2.h)).
2.8. Statistical Analysis
All analyses were conducted using R (version 4.3.2) [21]. An analysis of variance (ANOVA) was conducted to assess significant differences among treatments. The evaluated properties were density, TS, WA, IB strength, bending MOE, bending MOR, and formaldehyde emissions. The assumptions of normality and homoscedasticity were satisfied for all properties. When required, a Tukey post hoc test identified significant differences among treatments.
3. Results and Discussion
3.1. Granulometry of Recycled Particles
Figure 3 presents the particle size distribution of the recycled particles treated under different conditions. The untreated raw particles and those from the hot-water treatment (HWTP) exhibited a higher proportion of coarse material retained on the 12-mesh sieve (approximately 40–43%), corresponding to particle sizes of 1.68 mm or larger. This is mainly due to numerous agglomerates that remained bonded by adhesive even after milling. In contrast, the hydrolyzed particles (OATP and HWTP + OATP) exhibited a lower proportion of coarse material retained on the 12-mesh sieve. Instead, the 20-mesh sieve (0.84 mm) accounted for the highest fraction (approximately 40–42%), indicating improved individualization of the recycled particles. However, a considerable amount of fines (< 0.30 mm) was also generated (approximately 15–16%), which is undesirable for panel manufacturing. It may adversely affect bonding performance due to increased adhesive demand associated with their higher specific surface area [22]. The hot-water treatment prior to acid hydrolysis (HWTP + OATP) did not significantly affect the particle size distribution of the recycled material. Based on these granulometric analyses, particles treated solely with oxalic acid (OATP) retained on the 12- and 20-mesh sieves were selected for the manufacture of new panels.
3.2. Chemical Characteristics of Recycled Particles
Figure 4 presents the nitrogen content of recycled particles treated with hot water and acid hydrolysis. The nitrogen content of the untreated raw particles was 3.8%, reflecting the presence of cured UF resin. Hot-water treatment alone (HWTP) reduced the nitrogen content to approximately 2.2%, indicating a limited removal of nitrogen-containing compounds. In contrast, oxalic acid-treated particles (OATP) exhibited a substantial decrease in nitrogen content to 0.58%, corresponding to an 84.7% decrease relative to untreated raw particles. This result demonstrates the high efficiency of oxalic acid hydrolysis in degrading and removing cured UF resin. These results are consistent with those reported in a previous study [17]. The combined treatment (HWTP + OATP) further reduced the nitrogen content to approximately 0.4%, representing an 89.2% reduction; however, this additional reduction compared with acid treatment alone was relatively modest. These results indicate that oxalic acid is the main contributor to adhesive removal, while the hot-water pretreatment provides only a minor additional effect. The significant reduction in nitrogen content in the OATP confirms that most of the cured adhesive was removed, thereby rendering it suitable for reuse in the manufacture of new panels.
Figure 5 presents the FTIR spectra of recycled particles under different treatment conditions, highlighting changes in functional groups before and after hydrolysis. Attention was given to bands associated with UF resin. The absorption band at approximately 1650 cm⁻¹ corresponds to the carbonyl (C=O) group, associated with amides and primary amines [23]. The intensity of this peak decreased with increasing hydrolysis severity, from OATP to HWTP + OATP, indicating the degradation and removal of cured UF adhesive from recovered particles. The most pronounced decrease occurred in particles subjected to the combined HWTP + OATP treatment. Similarly, the band at around 1230 cm⁻¹, attributed to C–N stretching in aromatic amines [24], showed a decreasing trend. This decrease is particularly notable in particles treated through oxalic acid hydrolysis (OATP and HWTP + OATP), indicating that oxalic acid treatment is more selective than hot-water treatment in reducing UF resin functional groups. These chemical analyses support the selection of particles treated solely with oxalic acid (OATP) for the manufacture of new panels.
3.3. Panel Density
Table 1 presents the ANOVA F-values for the effect of recycled particle proportion on all evaluated properties. Figure 6a shows the average density for each panel type, ranging from approximately 627 kg/m³ (100% recycled particles) to 634 kg/m³ (25% recycled particles). These densities classify the resulting panels as low-density particleboards (LD Grade; less than 640 kg/m3), according to ANSI A208.1-2022 [19]. Panel density was not influenced by the proportion of recycled particles in the core layer, and no statistically significant differences were found between treatments. The target panel density was set at 630 kg/m³. This value was selected based on the availability of recycled material obtained for panel manufacturing.
Figure 6b shows the vertical density profiles for all panel types. Each vertical density profile represents the mean of 30 individual measurements for every treatment group. All treatments exhibited a typical particleboard profile, characterized by higher surface densities and a gradual decrease toward the core. Only minor variations were observed among treatments. The vertical density profile provides insight into the expected mechanical performance of the panels. More pronounced U-shaped profiles are generally associated with improved mechanical properties, particularly in static bending. Based on these profiles, panels from all treatments, regardless of the recycled particle proportion, are expected to exhibit mechanical performance similar to that of the control.
3.4. Thickness Swelling and Water Absorption
Figure 7 presents the results for TS and WA after 24 h of immersion across all panel types. No significant differences were observed between treatments and the control for TS (Table 1). Panels containing recycled particles, regardless of their proportion, showed performance similar to that of the control. Mean TS values ranged from 14.5% in panels with 75% recycled particles to 16.3% in those with 50% recycled particles in the core layer. The TS values obtained in this study indicate improved dimensional stability compared with those reported by Fu et al. [25]. In their study, single-layer particleboards made with thermo-hydro recycled particles and containing 100% recycled material showed TS values between 17% and 19%. Similarly, Lykidis and Grigoriou [26] manufactured panels from fresh wood particles that were subsequently recycled to produce new panels. They applied hydrothermal recycling under four different conditions, manufactured new recycled panels, and obtained TS values ranging from 26% to 59%, which are considerably higher than those observed in our study.
Statistical analysis indicated significant differences in mean WA across treatments (Table 1). The highest mean WA was observed in the panel with 25% recycled particles, at 50.1%, although it was not statistically different from the control panels and those with 50% and 100% recycled particles. By contrast, panels with 75% recycled particles exhibited the lowest WA among all treatments, at 42.5% (Figure 7).
Panels with 75% recycled particles in the core demonstrated improved performance compared with those developed by Iždinský et al. [27]. These authors produced particleboard from recycled particles derived from mixed wood product waste (hardboards, MDF panels, old furniture, and recycled faulty particleboards) in varying proportions. At 50% recycled particle content, they reported WA values of approximately 62% after 24 h of immersion. In contrast, Wronka and Kowaluk [10] mechanically recycled particleboard waste using milling processes to manufacture new panels. They obtained a WA value of about 36% after 24 h of immersion, which is 15.5% lower than the value reported for panels with 75% recycled particles in our study.
3.3. Internal Bond Strength
The IB strength of particleboards across all treatments is presented in Figure 8. All panels met the minimum requirement of 0.14 MPa for low-density particleboard (LD-2 Grade) specified in ANSI A208.1-2022 [19]. Moreover, they also exceeded the higher threshold of 0.31 MPa required for M-0 Grade medium-density particleboard (640-800 kg/m³) and reached the required value for M-2 Grade (0.40 MPa) [19]. The ANOVA results revealed significant differences among treatments (Table 1); however, no clear trend was observed. Panels with 75% recycled particles in the core exhibited the highest IB strength, reaching 0.48 MPa, which was 54% higher than the standard’s minimum requirement for M-0 Grade panels. In contrast, control panels and those with 50% or 100% recycled particles in the core showed the lowest IB strength values. Panels composed entirely of recycled particles in the core had an IB of 0.40 MPa, representing a 20% decrease compared to those with 75% recycled particles. Meanwhile, panels with 25% recycled particles fell within the medium range between the best-performing treatment (75% recycled particles) and the less-performing treatments (control, 50% and 100% recycled particles). The IB variation among treatments is probably due to uncontrolled factors, i.e., unequal adhesive distribution in the particles during resin application. Overall, these results indicate that increasing the proportion of recycled particles in the core layer does not substantially affect IB strength.
The IB values in our study are higher than those reported by Luo et al. [28], who manufactured panels with varying proportions of recycled particles from particleboard waste. In their study, panels with 30–50% recycled particles, 10% UF resin, and a target density of 700 kg/m3 exhibited IB values ranging from 0.21 to 0.36 MPa. Similarly, Czarnecki et al. [29] produced 700 kg/m3 particleboards from recycled three-layer UF-bonded particleboard waste (raw and laminated). The resin content was 8% in the core layer and 12% in the surface layers. In their study, IB values did not exceed 0.36 MPa across all recycled particle proportions (10–60% in the core layer).
3.4. Static Bending Properties
The bending MOE and MOR of particleboards across all treatments are presented in Figure 9. Statistical analysis revealed significant differences among treatments (Table 1). Both bending MOE and MOR decreased as the proportion of recycled particles increased. For bending MOE, control panels and those with 25% recycled particles had the highest MOE values and were significantly different from other treatments (Figure 9a). Among the panels containing recycled particles, those with 25% recycled particles exhibited the highest MOE (1811 MPa), which was 8.3% lower than that of control panels (1975 MPa). Panels with 100% recycled particles in the core layer exhibited the lowest MOE (1347 MPa) but were not different from panels with 50% or 75% recycled particles. As shown in Figure 9a, all panel types far exceed the minimum MOE values for LD-2 Grade (500 MPa) specified in ANSI A208.1-2022 [19] for low-density particleboards. Furthermore, nearly all panel types met the minimum requirement of 1380 MPa for M-0 Grade medium-density particleboard [19]. The only exception was for panels with a core layer made entirely of recycled particles. However, the MOE value for these panels was only slightly below the M-0 Grade threshold. None of the panels manufactured from recycled particles met the minimum MOE requirement established for M-2 Grade according to the standard (2000 MPa).
The bending MOR showed a similar trend to MOE, decreasing as the proportion of recycled particles in the core layer increased. The control panels demonstrated superior bending MOR values, surpassing the minimum standard requirements for both LD-2 and M-0 Grades (Figure 9b). Among the panels containing recycled material, those with 25% recycled particles achieved the highest MOR of 7.47 MPa. This represents a 13% reduction compared to the control panels, although it was not significantly different. Additionally, there is a 35% increase over the panels with 100% recycled particles, which had the lowest MOR at 4.84 MPa. Overall, all panel types largely exceeded the minimum MOR values (2.8 MPa) for LD-2 Grade low-density particleboards. However, none of the panels containing recycled particles met the minimum MOR requirements of 7.6 MPa for M-0 and 13.0 MPa for M-2 Grade medium-density particleboard [19].
The bending MOE and MOR of the panels produced in our study were considerably lower than those reported by Ranjan et al. [30], although their panels had a higher density (~800-900 kg/m3). They produced single-layer particleboards from 100% particleboard waste with 10-12% resin content, achieving MOE values of 2191-2728 MPa and MOR values of 16.8-20.8 MPa. It is important to remember that the average panel density in the current study ranged from 627 kg/m³ (100% recycled particles) to 634 kg/m³ (25% recycled particles). This primarily explains the lower bending properties observed. In contrast, the MOR value reported by Iždinský et al. [31] for particleboards made from 100% recycled thermally modified wood (6.5 MPa) is comparable to our results. Furthermore, panels containing 25% and 50% recycled particles exhibited MOE values consistent with those reported by Fu et al. [25], which ranged from 1450 to 1910 MPa for panels produced with 100% recycled particles.
3.5. Formaldehyde Emissions
Formaldehyde emissions from the panels range from 2.9 to 3.6 mg/m².h, as shown in Figure 10. The control panels had the lowest formaldehyde emissions at 2.9 mg/m2.h. Among panels containing recycled material, those with 25% recycled particles in the core layer had the lowest emissions, at 3.1 mg/m².h, which was 6.9% higher than those of the control panels but statistically similar. In contrast, panels with cores composed entirely of recycled particles exhibited the highest emissions, representing a 24% increase relative to the control. The overall trend indicates that formaldehyde emissions increase with the proportion of recycled particles in the panel. This behavior can be attributed to the presence of residual UF adhesive in recycled particles. Although acid hydrolysis removes a significant portion of the cured UF adhesive, as shown by nitrogen content analysis (see Figure 4), it does not completely remove it. Consequently, a higher content of recycled particles leads to greater accumulation of residual UF adhesive, thereby increasing formaldehyde emissions.
In North America, formaldehyde emissions from wood-based panels are typically evaluated using chamber methods, including ASTM E1333 [32] (large-chamber) and ASTM D6007 [33] (small-chamber). Both methods quantify formaldehyde concentration in the air, expressed in parts per million (ppm). Regulatory limits are defined by the U.S. Environmental Protection Agency (EPA) under the Toxic Substances Control Act (TSCA) Title VI, as well as the Canadian Formaldehyde Emissions from Composite Wood Products Regulations (CANFER). According to these standards, formaldehyde emissions from particleboards, measured using chamber methods such as ASTM E1333 (CARB II), must not exceed 0.09 ppm [34,35]. By contrast, the method used in this study, EN ISO 12460-3 (gas analysis method), does not measure air concentration. Instead, it determines the surface emission rate (mg/m2.h). As a result, direct comparison with North American regulatory limits is not possible due to the differences in measurement approaches and units. For comparison, the European standard EN 13986 [36] classifies formaldehyde emissions from wood-based panels into E1 and E2 classes. When using the gas analysis method, the E1 classification corresponds to an emission rate of ≤ 3.5 mg/m².h [37]. This indicates that panels within this range do not pose a significant risk to human health or the environment. Based on this criterion, all panel types evaluated in our study, except those with 100% recycled particles in the core, met the E1 requirements of the European standard EN 13986 [36]. The emission values obtained in our study are higher than those reported by Salem et al. [38]. Using the same measurement method, they found formaldehyde emissions ranging from 0.96 to 2.52 mg/m².h in industrial veneered particleboards.
The results indicate that manufacturing particleboards with satisfactory physical and mechanical properties from laminated, UF-bonded particleboard waste is feasible. Among the evaluated properties, bending MOR was the most affected across all treatments. Nevertheless, the remaining properties met the minimum requirements of the ANSI A208.1-2022 [19] standard for low-density particleboard grades and even for superior grades such as medium-density particleboard (M-0 Grade). Regarding the M-2 Grade, only the IB strength of the panels met the specified requirements. This outcome is notable because the average panel densities obtained in this study fall within the standard’s low-density classification. Improved performance, especially in static bending, might be possible at higher densities. The findings demonstrate that up to 75% of recycled particles obtained from oxalic acid hydrolysis can be incorporated in the core layer without significantly compromising panel quality.
4. Conclusions
The suitability of recycled particles from laminated UF-bonded particleboard waste for the manufacture of new particleboard was assessed. The recycled particles were produced through oxalic acid hydrolysis. The main findings are summarized as follows:
- Oxalic acid treatment effectively separates wood particles. The hydrolysis process significantly reduces the cured UF adhesive content while preserving the original particle size distribution.
- Up to 75% recycled particles can be incorporated in the core layer of low-density particleboard without significantly affecting the physical and mechanical properties of the panels.
- Higher panel densities may further enhance performance. In particular, panels manufactured with 100% recycled particles could achieve improved mechanical performance, especially in static bending. For these compositions, all other evaluated properties met the minimum requirements for the M-0 Grade of the ANSI A208.1-2022 standard for medium-density particleboard.
- Residual adhesive found in the recycled particles increases formaldehyde emissions compared to control panels. However, emission levels remain within acceptable limits. It is also important to note that these emissions tend to decrease over time as the panels age.
In conclusion, the results underscore the need to develop effective methods for recovering wood-based composite waste for reuse in panel production. This approach supports the development of more sustainable particleboards, with the potential to completely replace both core and surface layers with recycled materials.
Author Contributions
Conceptualization, methodology, validation, writing-review and editing, G.R., R.G., and A.C.; writing-original draft preparation, visualization, formal analysis, investigation, data curation, G.R.; resources, supervision, project administration, funding acquisition, A.C. All authors have read and agreed to the published version of the manuscript.
Funding
The study was conducted as part of the Wood-Based Composite Panel Research Consortium (Corepan-Bois) at Université Laval. We gratefully acknowledge funding from the Natural Sciences and Engineering Research Council of Canada (NSERC) [ALLRP 571660–21], the Ministère des Ressources naturelles et des Forêts (MRNF), the Quebec Forest Industry Council (CIFQ) [PIP-2019–12], Arbec Forest Products Inc., FPInnovations, Tafisa Canada, Uniboard Canada, and SACOPAN.
Data Availability Statement
The data presented in this article are available upon reasonable request from the corresponding authors.
Acknowledgments
The authors would like to thank Paul Desauniers and Jérémy Winninger for their technical support, particularly for training in the use of the equipment and for conducting chemical analyses. The authors would also like to thank the Corepan-Bois student, Rolando Montenegro, for their invaluable help in the statistical analysis.
Conflicts of Interest
The authors declare no conflicts of interest. The funders had no role in the design of the study; in the collection, analysis, or interpretation of data; or in the writing of the manuscript. The partners reviewed the manuscript and approved it for publication.
Abbreviations
The following abbreviations are used in this manuscript:
| ANOVA | Analysis of variance |
| ATR | Attenuated total reflectance |
| FTIR | Fourier transform infrared |
| HCl | Hydrochloric acid |
| HWTP | Hot water-treated particles |
| IB | Internal bond strength |
| MDF | Medium-density fiberboard |
| MOE | Modulus of elasticity |
| MOR | Modulus of rupture |
| OATP | Oxalic acid-treated particles |
| TS | Thickness swelling |
| UF | Urea-formaldehyde |
| WA | Water absorption |
References
- Andrade, P.I.; Araújo, S.D.O.; Neiva, D.M.; Vital, B.R.; Oliveira Carneiro, A. de C.; Gominho, J.; Pereira, H. Strength Properties and Dimensional Stability of Particleboards with Different Proportions of Thermally Treated Recycled Pine Particles. Holzforschung 2016, 70, 467–474. [Google Scholar] [CrossRef]
- Lao, W.L.; Chang, L. Comparative Life Cycle Assessment of Medium Density Fiberboard and Particleboard: A Case Study in China. Ind. Crops Prod. 2023, 205, 117443. [Google Scholar] [CrossRef]
- Donini, G.; Crociati, L.; Molari, L.; Ferrante, M.; Conidi, G.; Zambelli, P. Mechanical Characterization of Mixed Particleboard Panels Made of Recycled Wood and Arundo Donax. Ind. Crop. Prod. 2025, 224. [Google Scholar] [CrossRef]
- FAO FAO STAT, Forestry Production and Trade, Food and Agriculture Organization of the United Nations. Available online: https://www.fao.org/faostat/en/#data/FO (accessed on 10 January 2026).
- Shi, L.; Hu, C.; Zhang, W.; Lin, X. Effect of Hot-Pressing and Hydrothermal Parameters on Recycled Wood Particles and Particleboards. Wood Mater. Sci. Eng. 2023, 1–8. [Google Scholar] [CrossRef]
- Gibier, M.; Sadeghisadeghabad, M.; Girods, P.; Zoulalian, A.; Rogaume, Y. Furniture Wood Waste Depollution through Hydrolysis under Pressurized Water Steam: Experimental Work and Kinetic Modelization. J. Hazard. Mater. 2022, 436, 129126. [Google Scholar] [CrossRef] [PubMed]
- Garcia, R.; Calvez, I.; Koubaa, A.; Landry, V.; Cloutier, A. Sustainability, Circularity, and Innovation in Wood-Based Panel Manufacturing in the 2020s: Opportunities and Challenges. Curr. For. Rep. 2024, 420–441. [Google Scholar] [CrossRef] [PubMed]
- Schild, A.; Cool, J.; Barbu, M.; Smith, G.D. Feasibility of Substituting Core Layer Strands in Randomly OSB with Contaminated Waste Wood Particles. Wood Mater. Sci. Eng. 2021, 16, 170–177. [Google Scholar] [CrossRef]
- Lykidis, C.; Grigoriou, A. Quality Characteristics of Hydrothermally Recycled Particleboards Using Various Wood Recovery Parameters. Int. Wood Prod. J. 2011, 2, 38–43. [Google Scholar] [CrossRef]
- Wronka, A.; Kowaluk, G. The Influence of Multiple Mechanical Recycling of Particleboards on Their Selected Mechanical and Physical Properties. Materials 2022, 15, 1–18. [Google Scholar] [CrossRef] [PubMed]
- Nuryawan, A.; Rahmawaty; Tambun, K.D.; Risnasari, I.; Masruchin, N. Hydrolysis of Particleboard Bonded with Urea-Formaldehyde Resin for Recycling. Heliyon 2020, 6, e03936. [Google Scholar] [CrossRef] [PubMed]
- Bütün Buschalsky, F.Y.; Mai, C. Repeated Thermo-Hydrolytic Disintegration of Medium Density Fibreboards (MDF) for the Production of New MDF. Eur. J. Wood Wood Prod. 2021, 79, 1451–1459. [Google Scholar] [CrossRef]
- Wan, H.; Wang, X.-M.; Barry, A.; Shen, J. Recycling Wood Composite Panels: Characterizing Recycled Materials. BioResources 2014, 9, 7554–7565. [Google Scholar] [CrossRef]
- Ihnát, V.; Lübke, H.; Russ, A. Waste agglomerated wood materials as a secondary raw material for chipboards and fibreboards part I. Preparation and characterization of wood chips in terms of their reuse. Wood Res. 2017, 62, 45–56. [Google Scholar]
- Lubis, M.A.R.; Hong, M.K.; Park, B.D. Hydrolytic Removal of Cured Urea–Formaldehyde Resins in Medium-Density Fiberboard for Recycling. J. Wood Chem. Technol. 2018, 76, 1515–1526. [Google Scholar] [CrossRef]
- Olgun, Ç.; Ateş, S.; Uzer, E. Effects of Medium Density Fiberboards ( MDF ) Recycling Methods on Fiber Dimensions and Some Reconstructed Board Properties. Drv. Ind. 2023, 74, 61–69. [Google Scholar] [CrossRef]
- Rodríguez, G.E.; Garcia, R.; Cloutier, A. Recycling Particleboard by Acid Hydrolysis: Effects on the Physical, Thermal, and Chemical Characteristics of Recycled Wood Particles. Fibers 2025, 13. [Google Scholar] [CrossRef]
- ASTM D1037 - 12; Standard Test Methods for Evaluating Properties of Wood-Base Fiber and Particle Panel Materials. ASTM Int., 2020; pp. 1–31. [CrossRef]
- ANSI A208.1; Particleboard. Am. Natl. Stand., 2022.
- UNE Spanish Standard UNE-EN ISO 12460-3; Wood-Based Panels Determination of Formaldehyde Release Part 3 : Gas Analysis Method. 2024.
- R Core Team R: A Language and Environment for Statistical Computing. R Found. Stat. Comput. 2024. [CrossRef]
- Wan Abdul Rahman, W.M.N.; Md Yatim, A.A.; Mat Zlan, A.A.; Kasim, J.; Mohd Yunus, N.Y. Effects of the Resin Content and Particle Size on the Properties of Particleboard Made of Neolamarckia and Leucaena Particles. BioResources 2019, 14, 6079–6087. [Google Scholar] [CrossRef]
- Savov, V.; Antov, P.; Panchev, C.; Adly, M.; Lubis, R.; Lee, S.H.; Taghiyari, H.R.; Todorova, M.; Petrin, S. Effect of Hydrolysis Regime on the Properties of Fibers Obtained from Recycling Medium-Density Fiberboards. Fibers 2023, 11. [Google Scholar] [CrossRef]
- Hong, M.; Rahandi Lubis, M.A.; Park, B.; Sohn, C.H.; Roh, J. Effects of Surface Laminate Type and Recycled Fiber Content on Properties of Three-Layer Medium Density Fiberboard. Wood Mater. Sci. Eng. 2020, 15, 163–171. [Google Scholar] [CrossRef]
- Fu, Q.; Zhuang, B.; Wang, X.-M.; Cloutier, A.; Roussière, F.; Bouffard, J.-F. Thermo-Hydrolytic Recycling of Urea-Formaldehyde Resin-Bonded Laminated Particleboards. BioResources 2022, 17, 6847–6859. [Google Scholar] [CrossRef]
- Lykidis, C.; Grigoriou, A. Hydrothermal Recycling of Waste and Performance of the Recycled Wooden Particleboards. Waste Manag. 2008, 28, 57–63. [Google Scholar] [CrossRef] [PubMed]
- Iždinský, J.; Vidholdová, Z.; Reinprecht, L. Particleboards from Recycled Wood. Forests 2020, 11, 1–16. [Google Scholar] [CrossRef]
- Luo, P.; Yang, C.; He, Y.; Wang, T. Use of Scrap Particleboard to Produce Recycled Particleboard. BioResources 2024, 19, 3837–3844. [Google Scholar] [CrossRef]
- Czarnecki, R.; Dziurka, D.; Łęcka, J. THE USE OF RECYCLED BOARDS AS THE SUBSTITUTE FOR PARTICLES IN THE CENTRE LAYER OF PARTICLEBOARDS. Electron. J. Pol. Agric. Univ. 2003, 6. [Google Scholar]
- Ranjan, M.; Murali, G.; Mamatha, B.S.; Prakash, V.; Ramkumar, V.R.; Uthappa, A.R.; Dixit, S. Sustainable Alternatives in Particleboard Production: The Role of Leveraging Recycled and Renewable Materials. Results Eng. 2025, 27. [Google Scholar] [CrossRef]
- Iždinský, J.; Vidholdová, Z.; Reinprecht, L. Particleboards from Recycled Thermally Modified Wood. Forests 2021, 12, 1–15. [Google Scholar] [CrossRef]
- ASTM E1333-22; Standard Test Method for Determining Formaldehyde Concentrations in Air and Emission Rates from Wood Products Using a Large Chamber. ASTM Int., 2022.
- ASTM D6007 - 22; Standard Test Method for Determining Formaldehyde Concentrations in Air from Wood Products Using a Small-Scale Chamber. ASTM Int., 2022.
- Government of Canada Formaldehyde Emissions from Composite Wood Products Regulations: SOR/2021-148. Canada Gazette, Part II, Volume 155, Number 14. Available online: https://gazette.gc.ca/rp-pr/p2/2021/2021-07-07/html/sor-dors148-eng.html (accessed on 21 June 2026).
- Government of Canada Formaldehyde Emissions from Composite Wood Products Regulations Factsheet. Available online: https://www.canada.ca/en/environment-climate-change/services/canadian-environmental-protection-act-registry/publications/formaldehyde-emissions-composite-wood-products-regulations.html (accessed on 21 June 2026).
- EN 13986:2004+A1:2015; Wood-Based Panels for Use in Construction - Characteristics, Evaluation of Conformity and Marking. European Committee for Standardization (CEN), 2015.
- Almeida, M.L.; Gonçalves, F.D.; Martins, J.M.; Magalhães, F.D.; Ramos, R.M.; Carvalho, L.H. Addressing Formaldehyde Emissions in Wood-Based Panels: Evaluation of Production Processes, Measurement Strategies, and Novel Solutions. J. Adhes. 2025, 101, 1252–1274. [Google Scholar] [CrossRef]
- Salem, M.Z.M.; Böhm, M.; Barcík, Š.; Beránková, J. Formaldehyde Emission from Wood-Based Panels Bonded with Different Formaldehyde-Based Resins. Drv. Ind. 2011, 62, 177–183. [Google Scholar] [CrossRef]
Figure 1.
Cutting layout for panel samples used to test physical and mechanical properties and formaldehyde emissions. Sample dimensions: internal bond (IB) strength: 50 mm x 50 mm; bending modulus of elasticity (MOE) / modulus of rupture (MOR): 290 mm x 75 mm; thickness swelling (TS) and water absorption (WA): 150 mm x 150 mm; and formaldehyde emissions: 400 mm x 50 mm.
Figure 1.
Cutting layout for panel samples used to test physical and mechanical properties and formaldehyde emissions. Sample dimensions: internal bond (IB) strength: 50 mm x 50 mm; bending modulus of elasticity (MOE) / modulus of rupture (MOR): 290 mm x 75 mm; thickness swelling (TS) and water absorption (WA): 150 mm x 150 mm; and formaldehyde emissions: 400 mm x 50 mm.
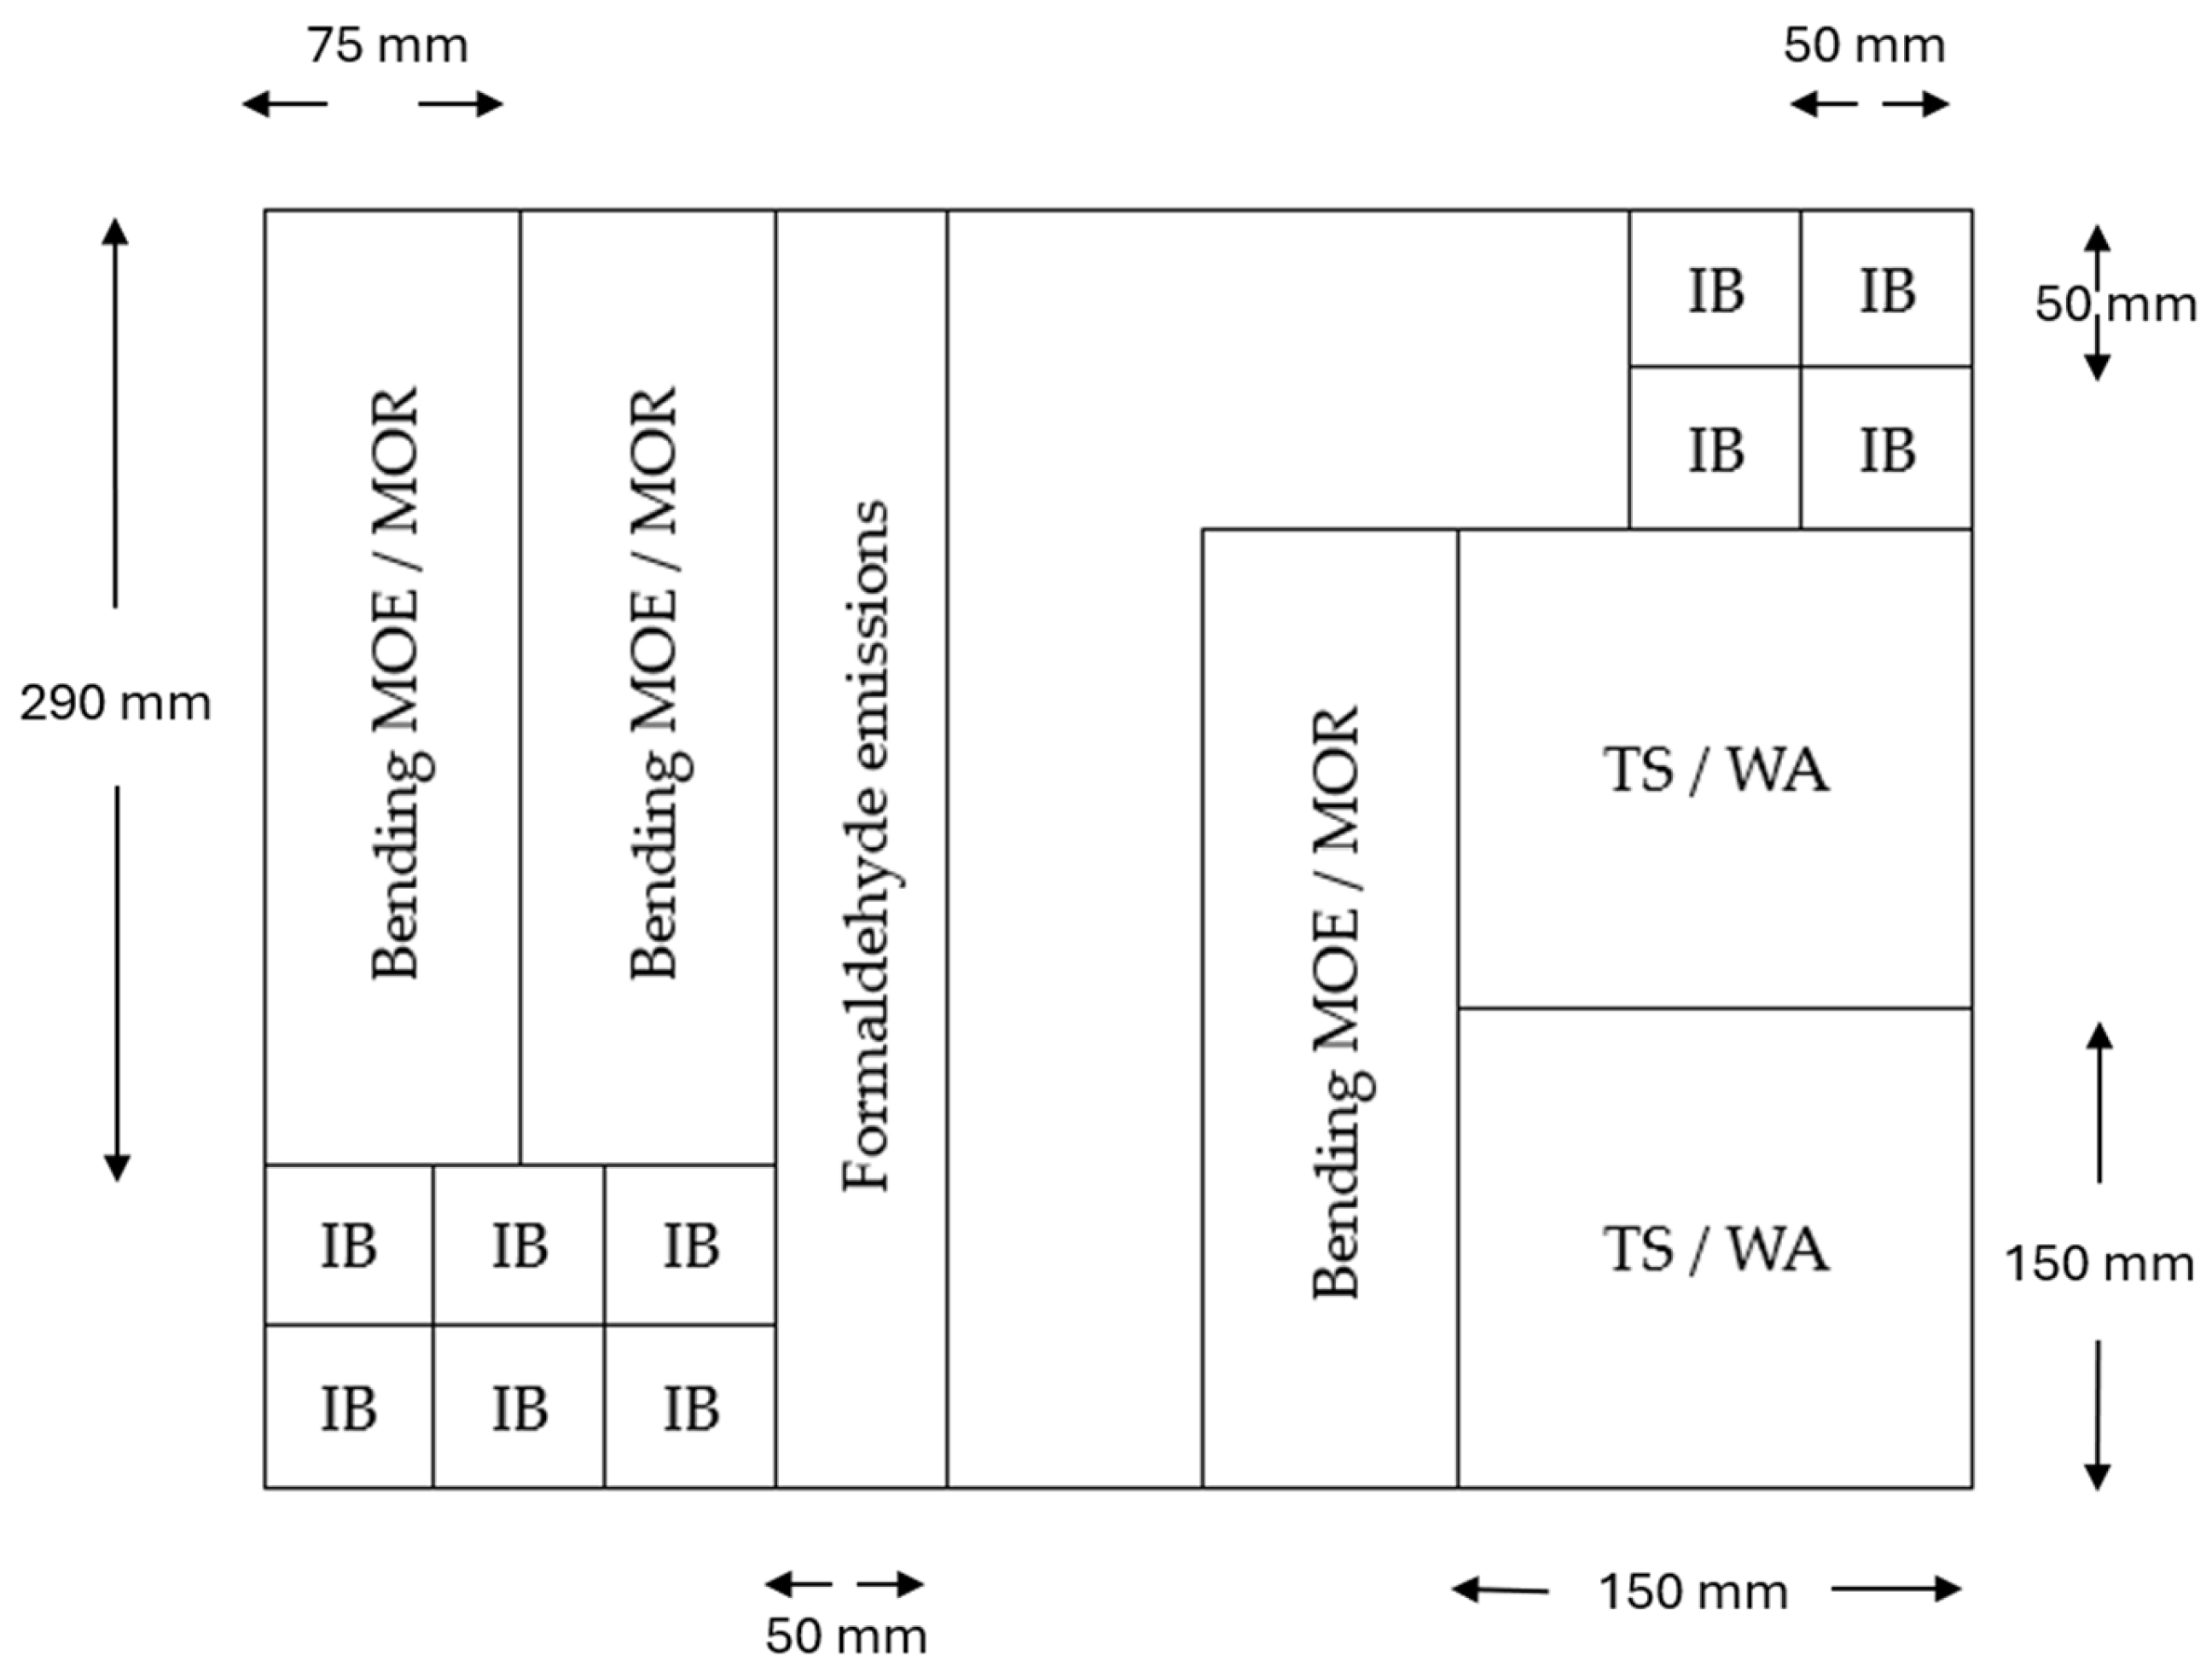
Figure 2.
Overview of the GA300-4 gas analysis apparatus used to measure formaldehyde emissions from particleboards. (a) General view of the system, showing four test chambers connected to gas wash bottles. (b) Detailed view of the gas wash bottles used to collect formaldehyde.
Figure 2.
Overview of the GA300-4 gas analysis apparatus used to measure formaldehyde emissions from particleboards. (a) General view of the system, showing four test chambers connected to gas wash bottles. (b) Detailed view of the gas wash bottles used to collect formaldehyde.
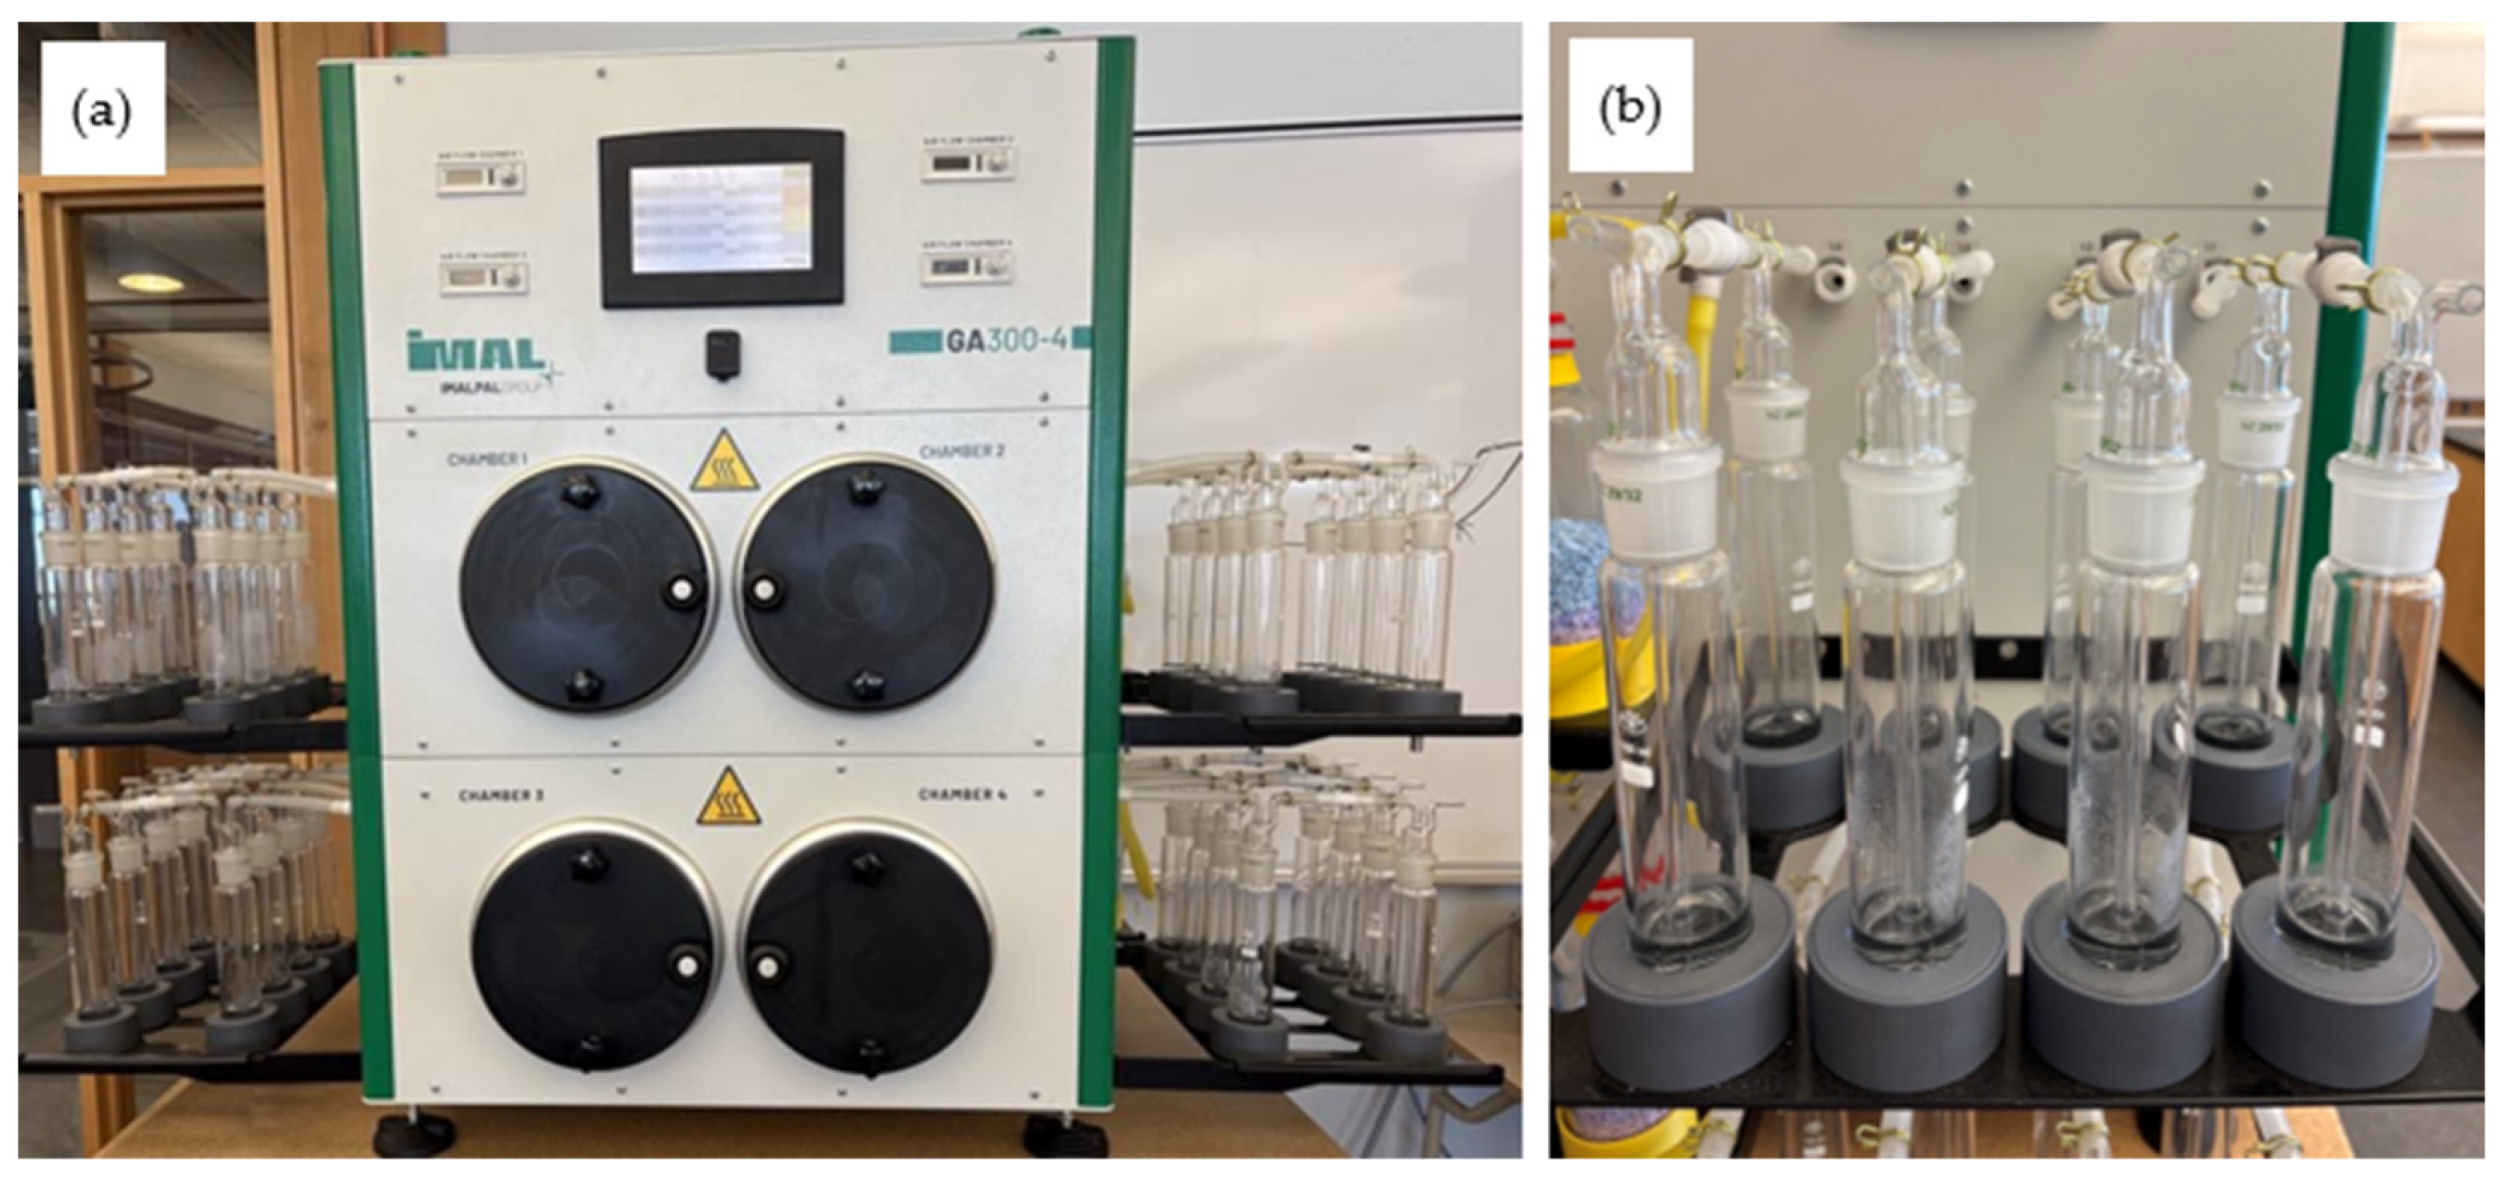
Figure 3.
Particle size distributions of recycled particles under different treatment conditions: untreated raw particles, hot-water-treated particles (HWTP), oxalic acid-treated particles (OATP), and particles subjected to combined hot-water and oxalic acid treatments (HWTP + OATP).
Figure 3.
Particle size distributions of recycled particles under different treatment conditions: untreated raw particles, hot-water-treated particles (HWTP), oxalic acid-treated particles (OATP), and particles subjected to combined hot-water and oxalic acid treatments (HWTP + OATP).
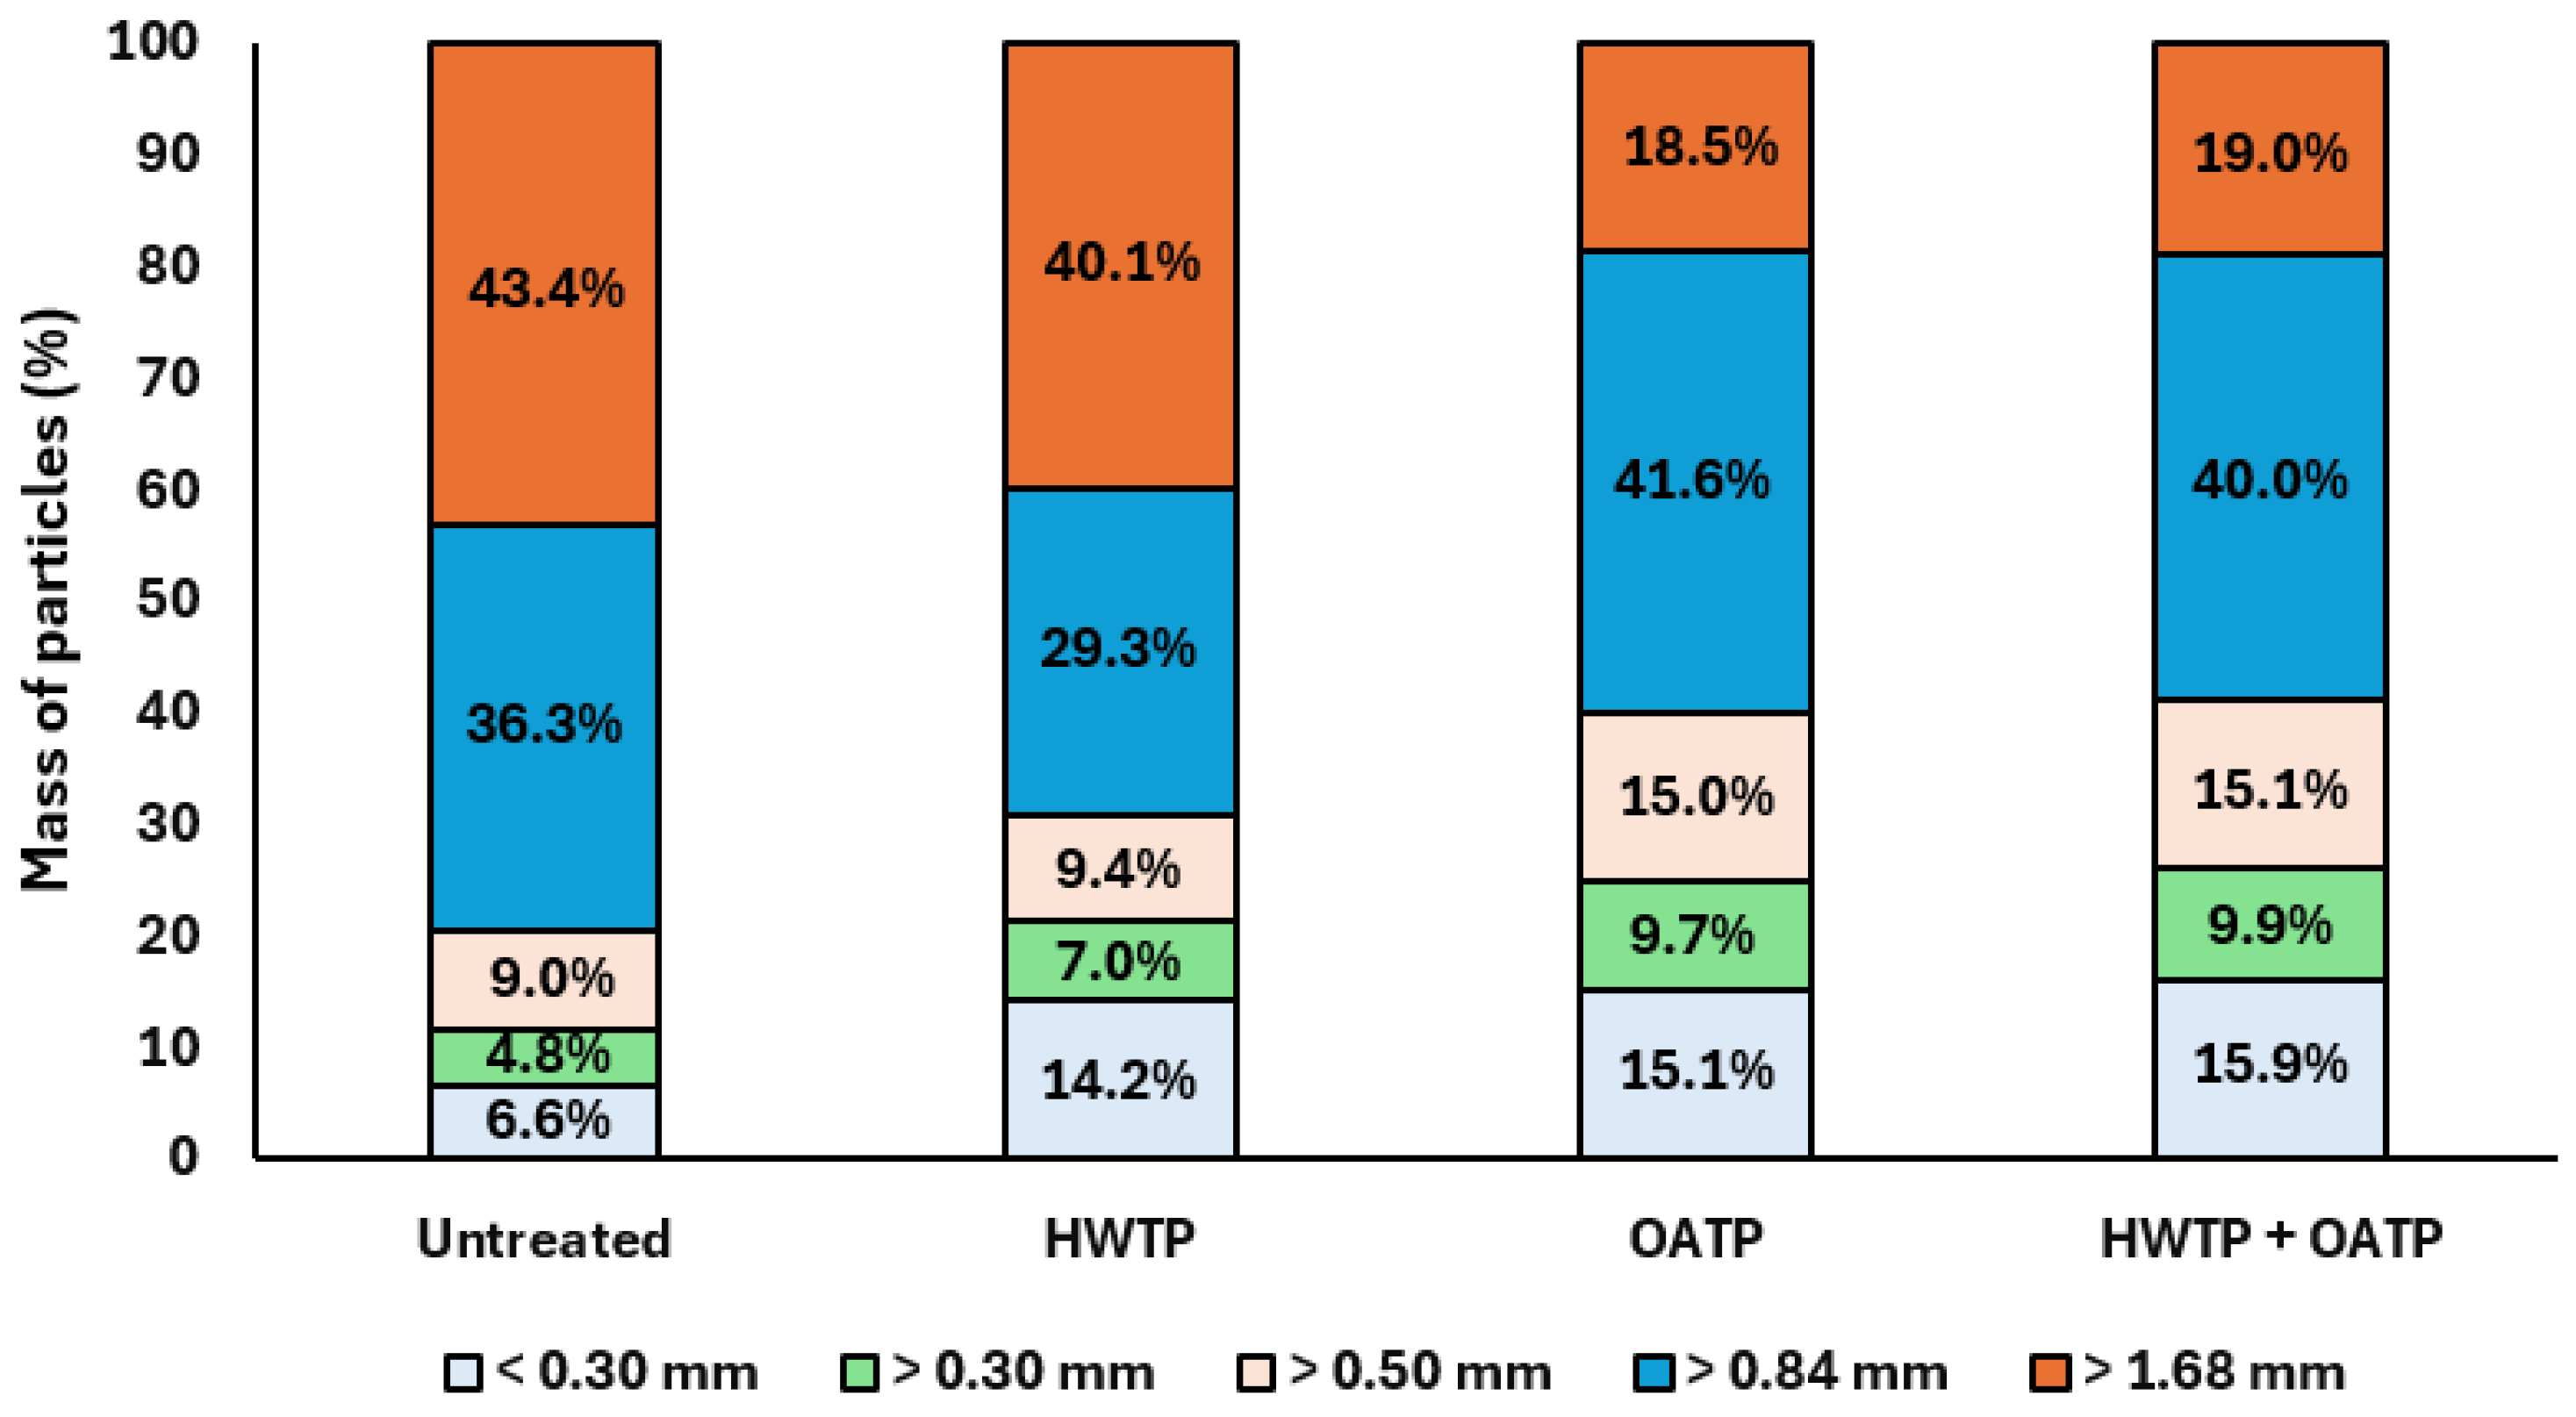
Figure 4.
Nitrogen contents of recycled particles under various treatment conditions: untreated raw particles, hot-water-treated particles (HWTP), oxalic acid-treated particles (OATP), and particles subjected to combined hot-water and oxalic acid treatments (HWTP + OATP).
Figure 4.
Nitrogen contents of recycled particles under various treatment conditions: untreated raw particles, hot-water-treated particles (HWTP), oxalic acid-treated particles (OATP), and particles subjected to combined hot-water and oxalic acid treatments (HWTP + OATP).
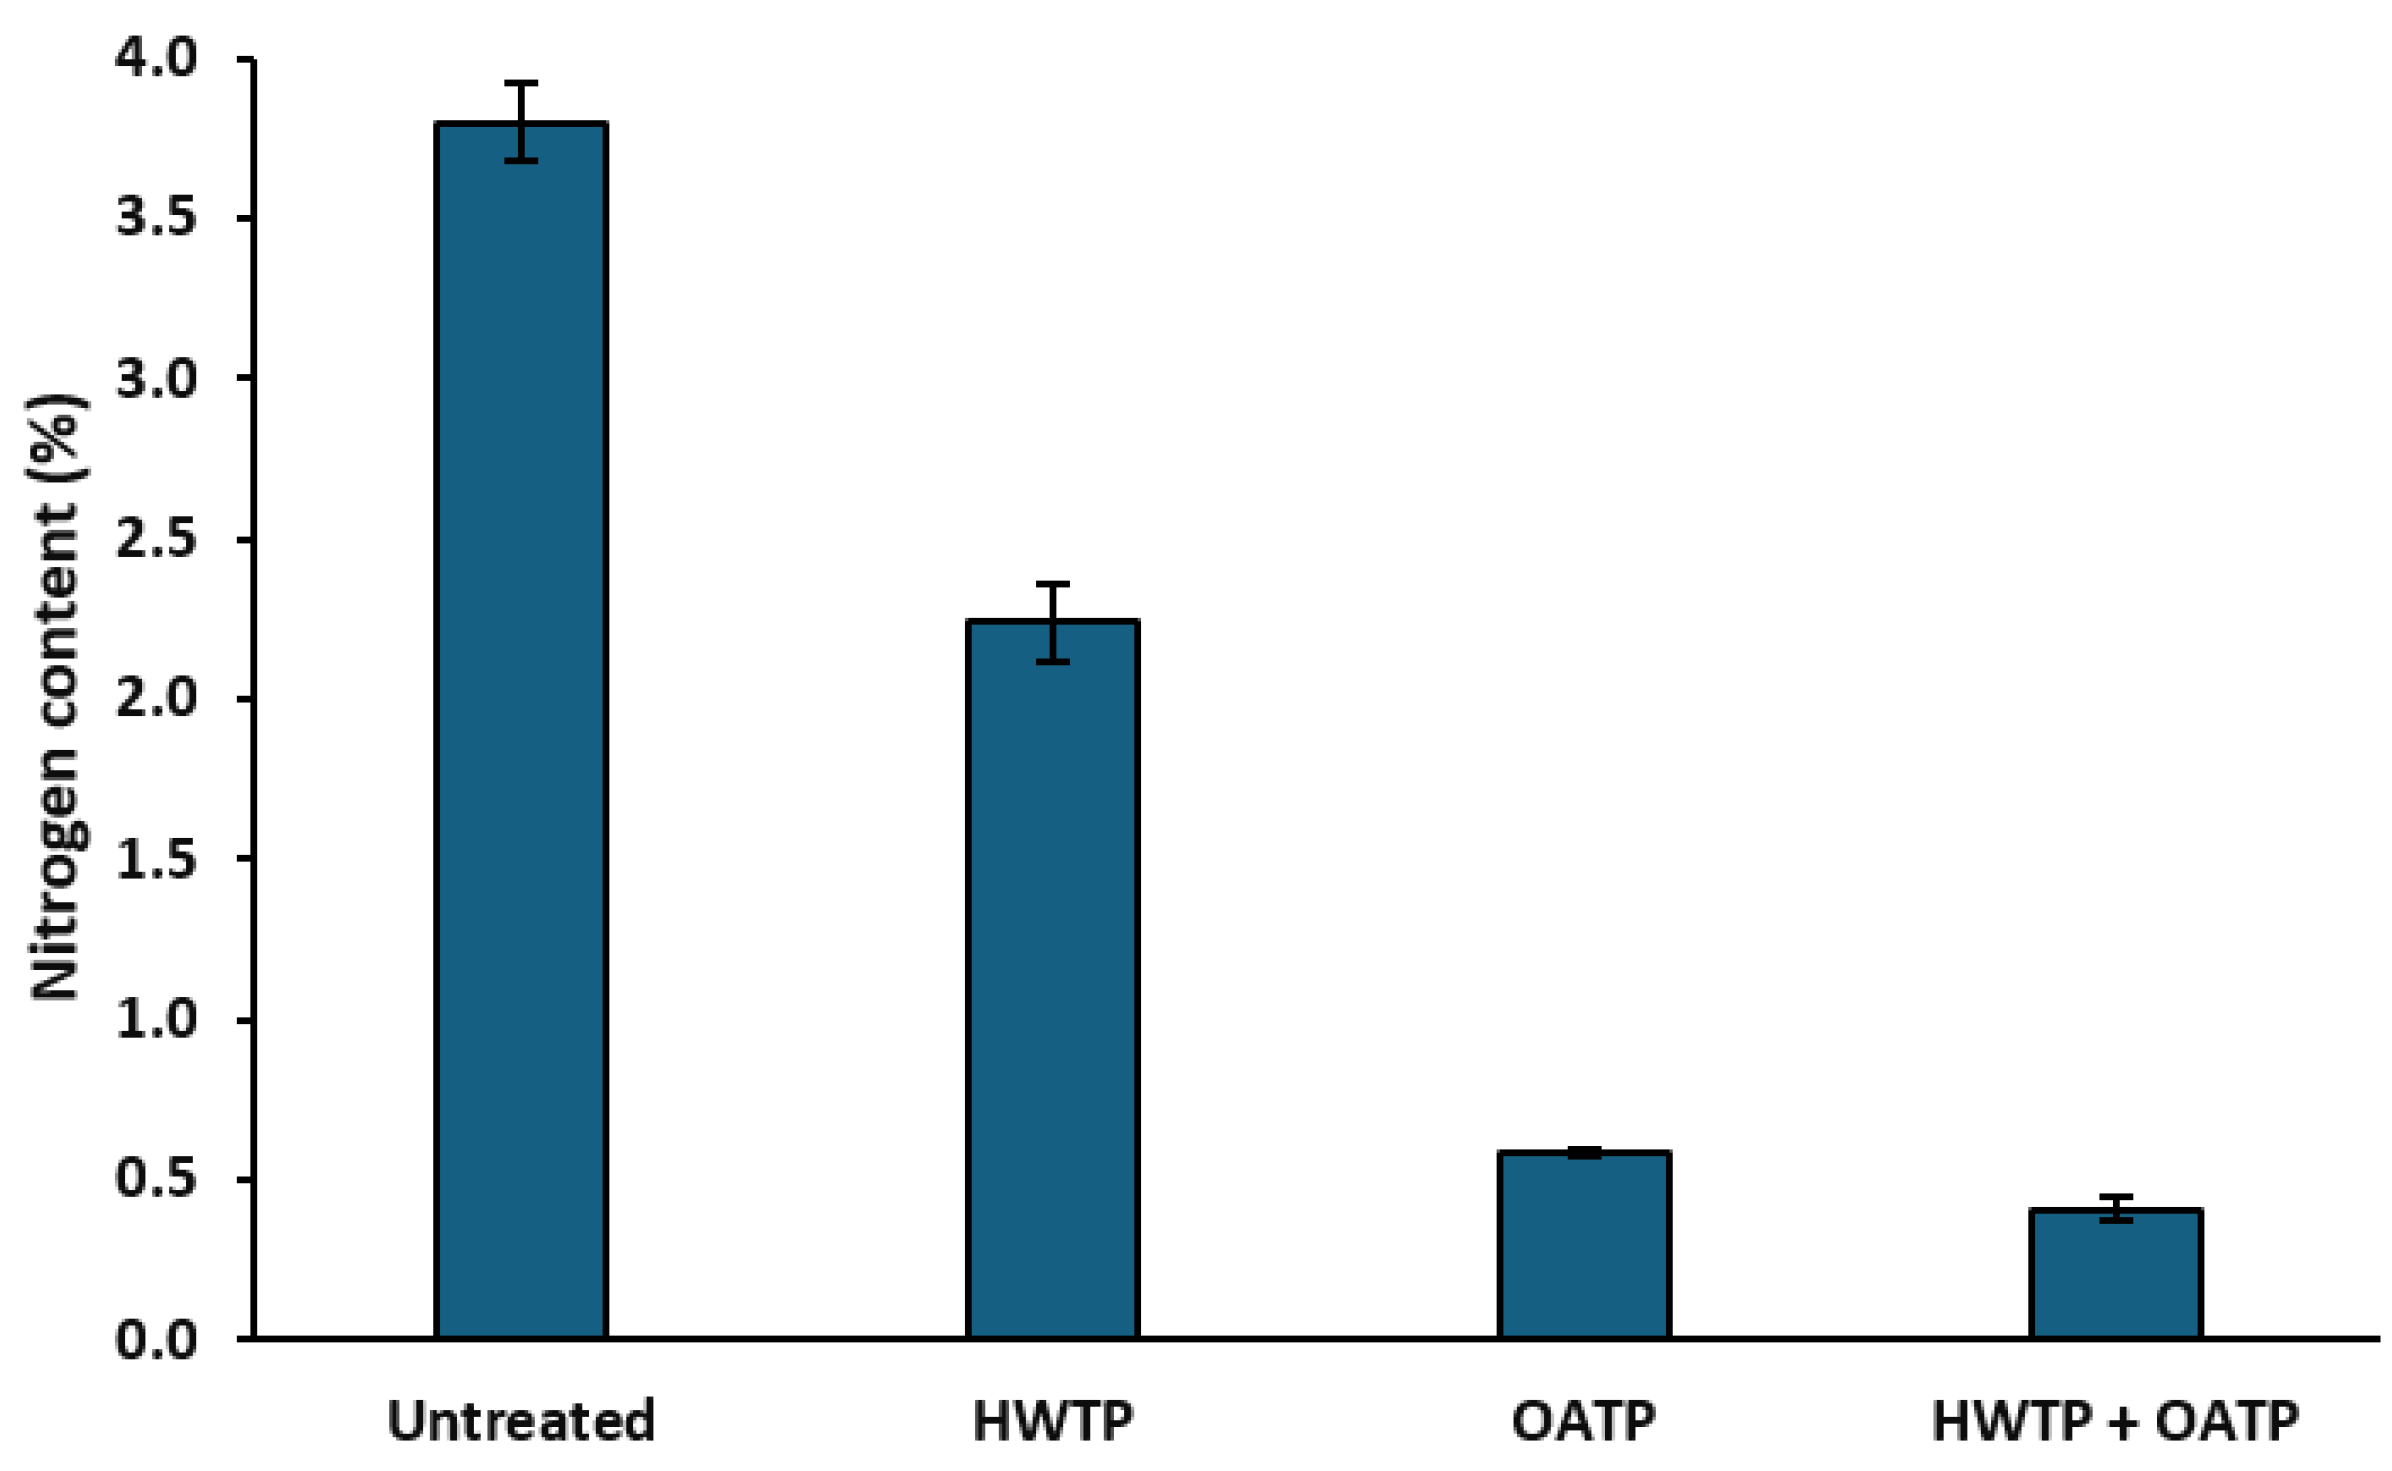
Figure 5.
FT-IR spectra of recycled particles under different treatment conditions: untreated raw particles, hot-water-treated particles (HWTP), oxalic acid-treated particles (OATP), and particles subjected to combined hot-water and oxalic acid treatments (HWTP + OATP).
Figure 5.
FT-IR spectra of recycled particles under different treatment conditions: untreated raw particles, hot-water-treated particles (HWTP), oxalic acid-treated particles (OATP), and particles subjected to combined hot-water and oxalic acid treatments (HWTP + OATP).
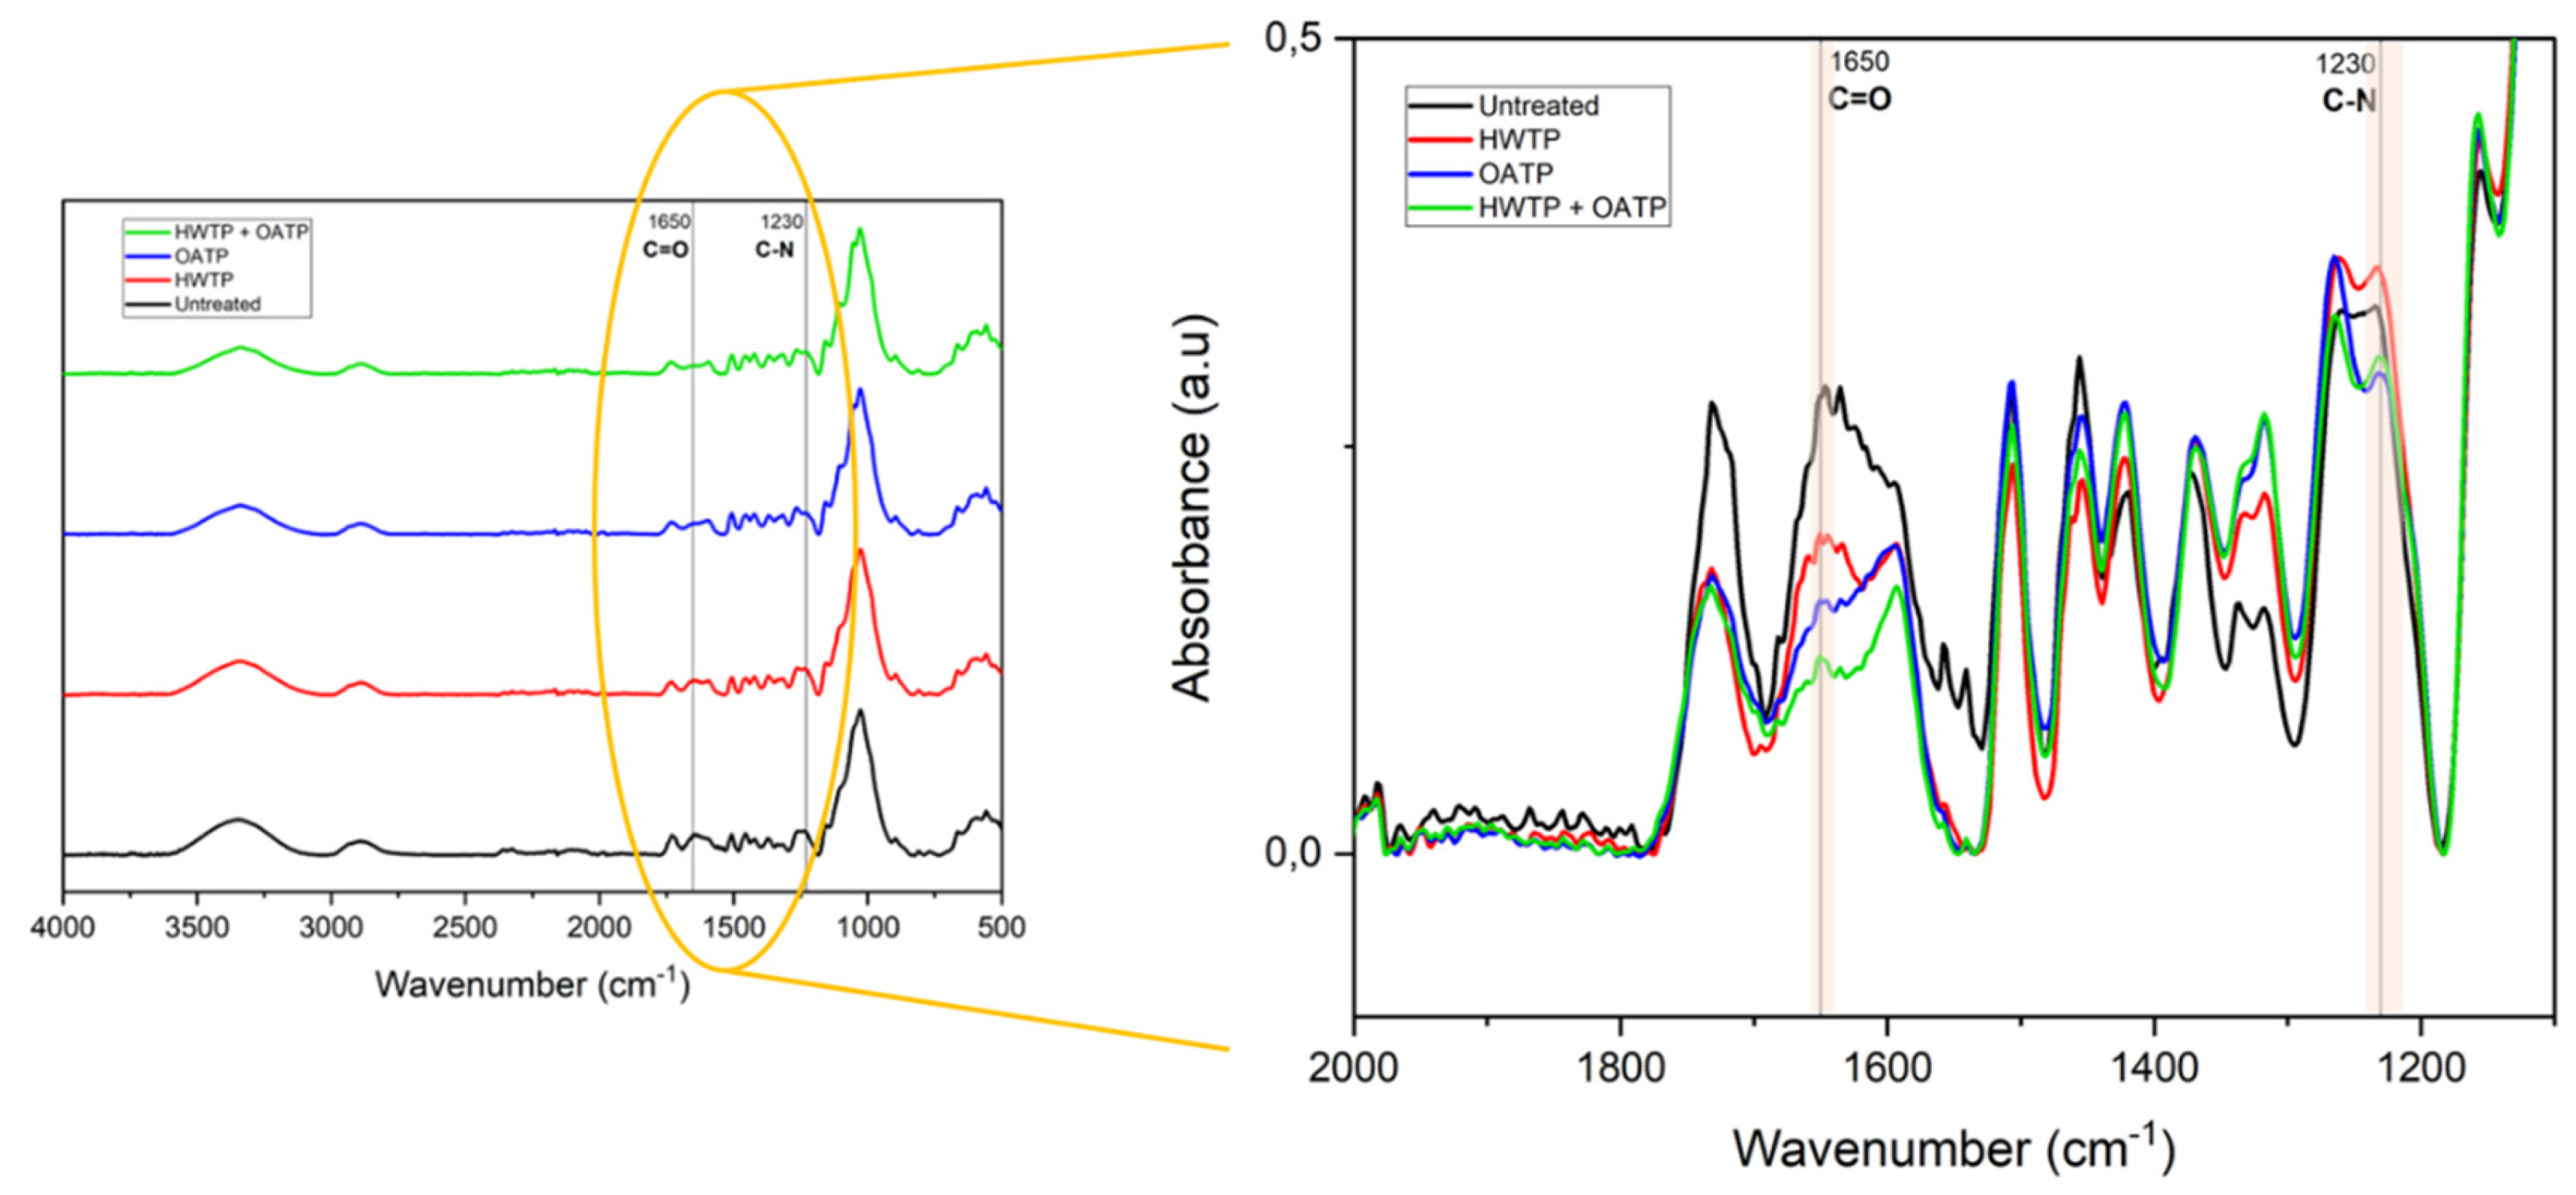
Figure 6.
(a) Average density and (b) vertical density profiles of particleboards manufactured with increasing proportions of recycled particles in the core layer. Error bars indicate standard deviations.
Figure 6.
(a) Average density and (b) vertical density profiles of particleboards manufactured with increasing proportions of recycled particles in the core layer. Error bars indicate standard deviations.
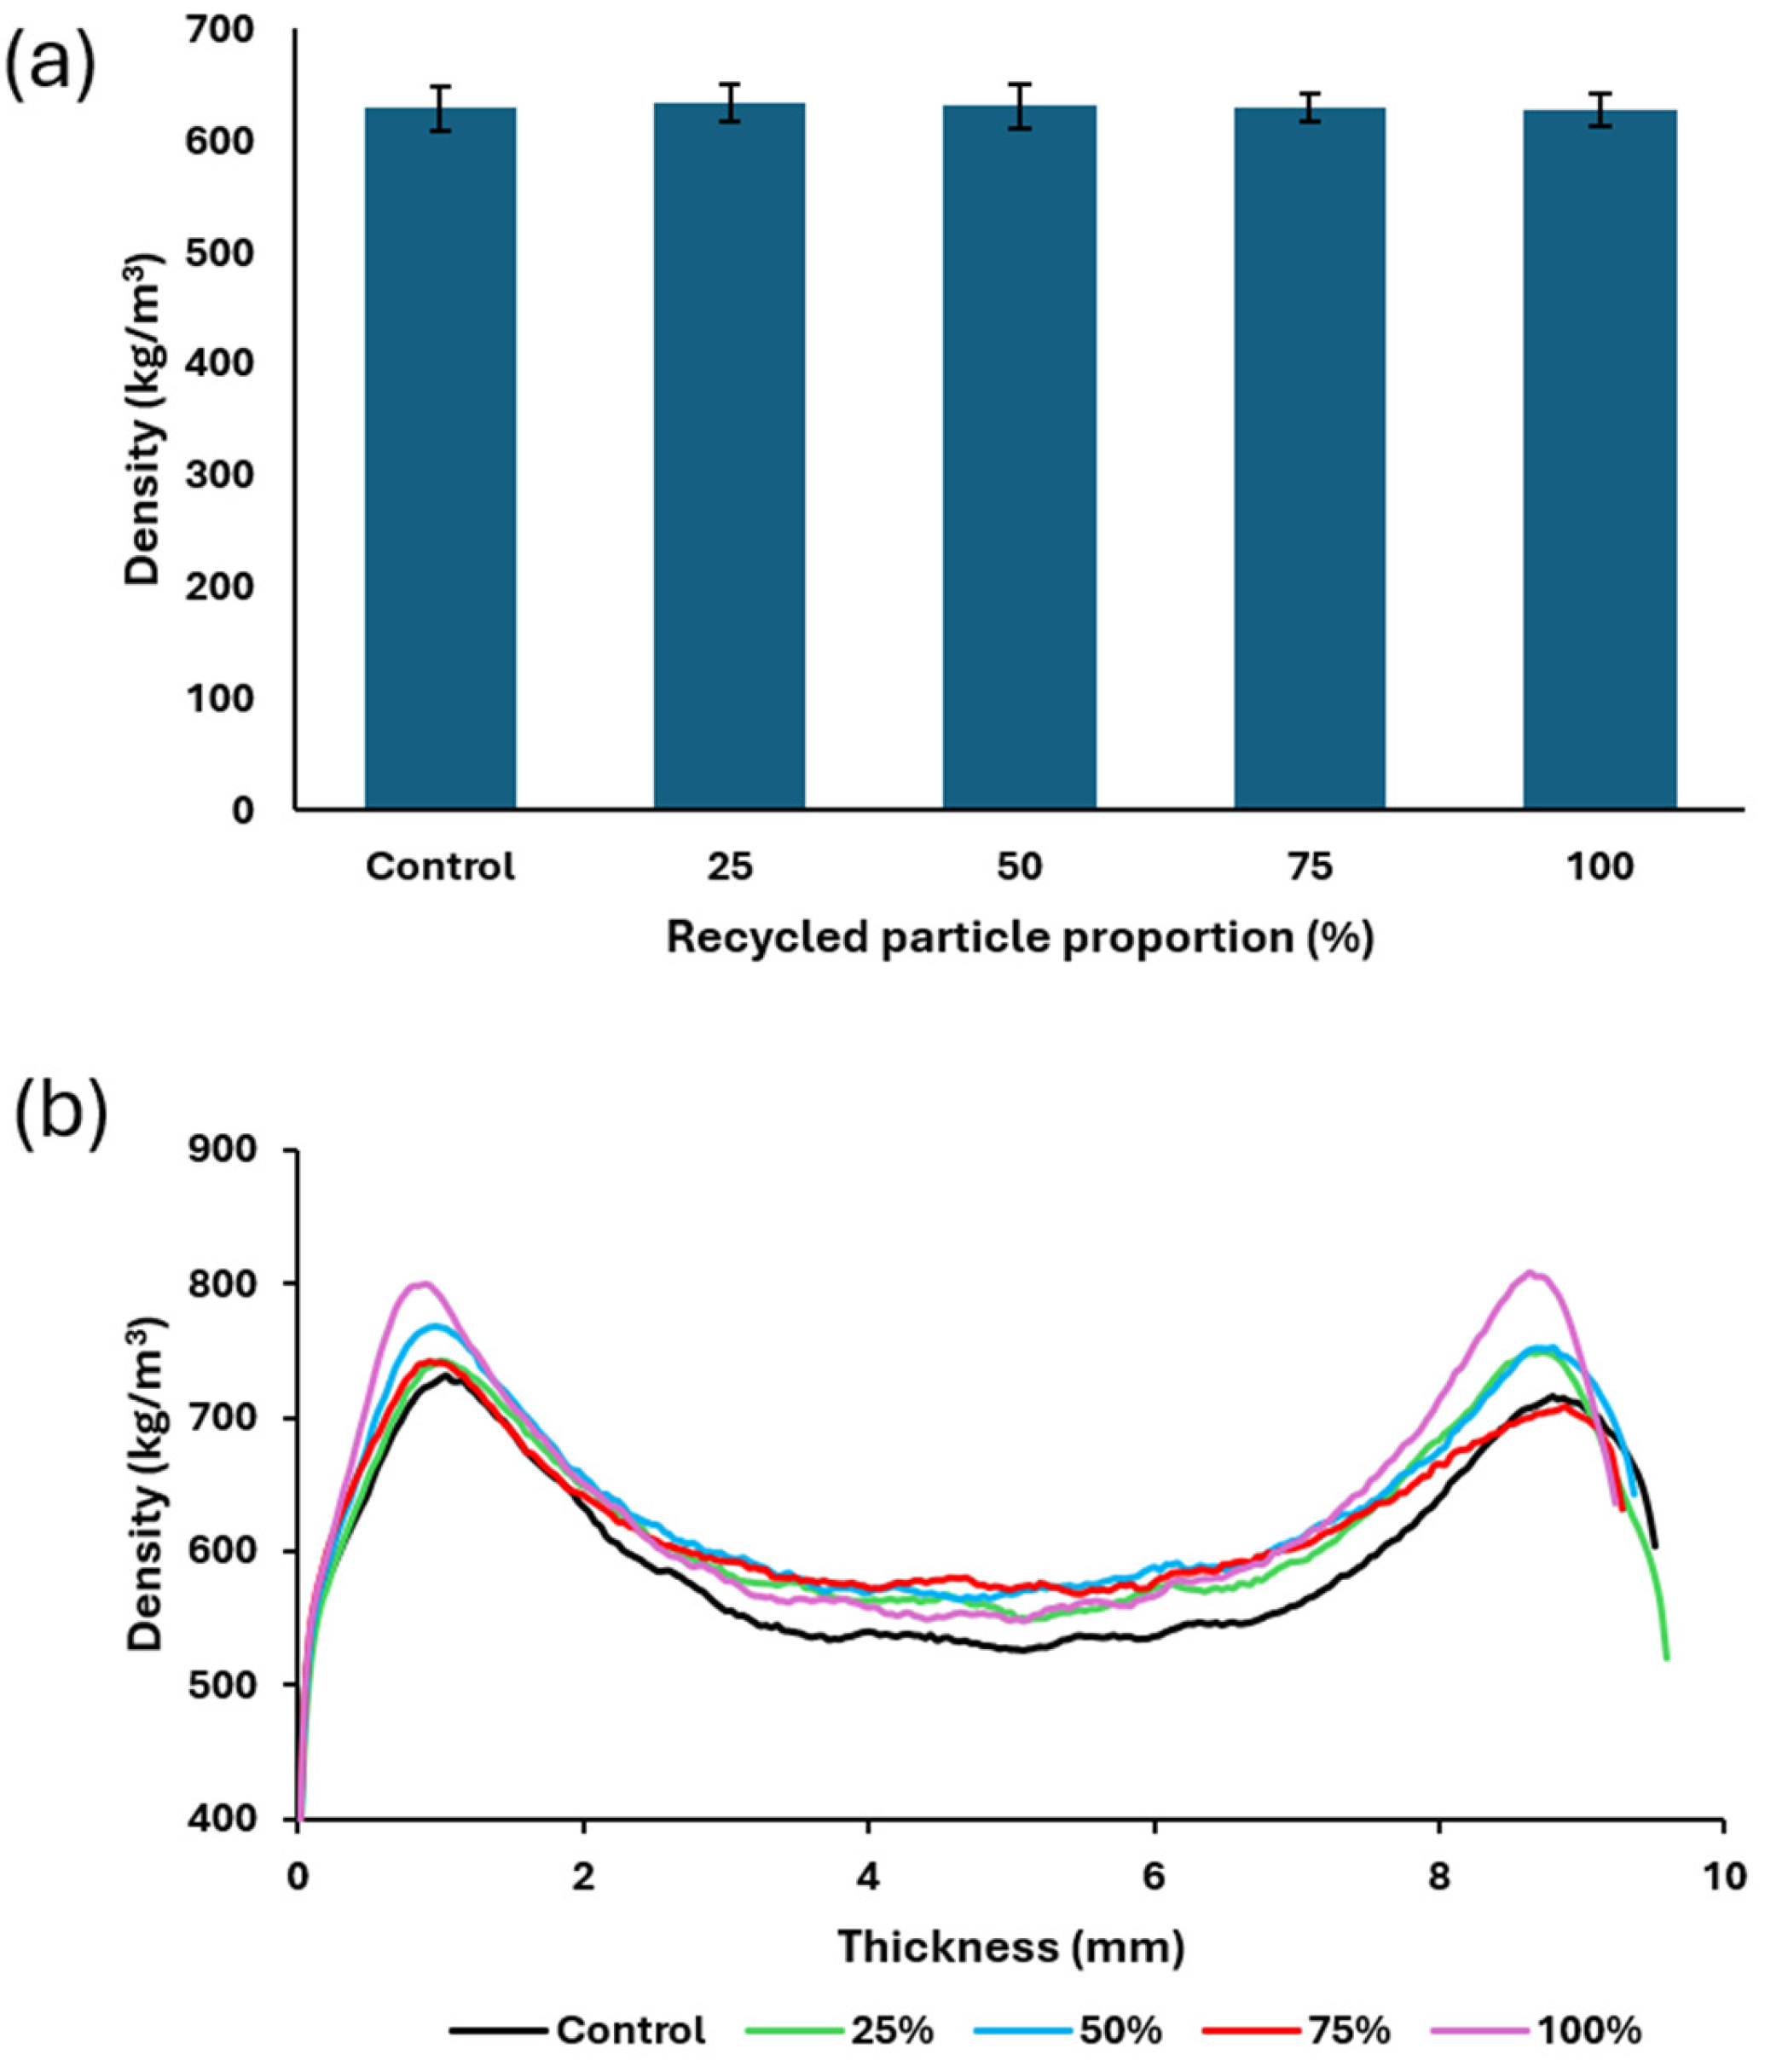
Figure 7.
Thickness swelling (TS) and water absorption (WA) after 24 h of water immersion for particleboards manufactured with increasing proportions of recycled particles in the core layer. Error bars indicate standard deviations. Mean values followed by the same letter are not statistically different according to Tukey’s test.
Figure 7.
Thickness swelling (TS) and water absorption (WA) after 24 h of water immersion for particleboards manufactured with increasing proportions of recycled particles in the core layer. Error bars indicate standard deviations. Mean values followed by the same letter are not statistically different according to Tukey’s test.
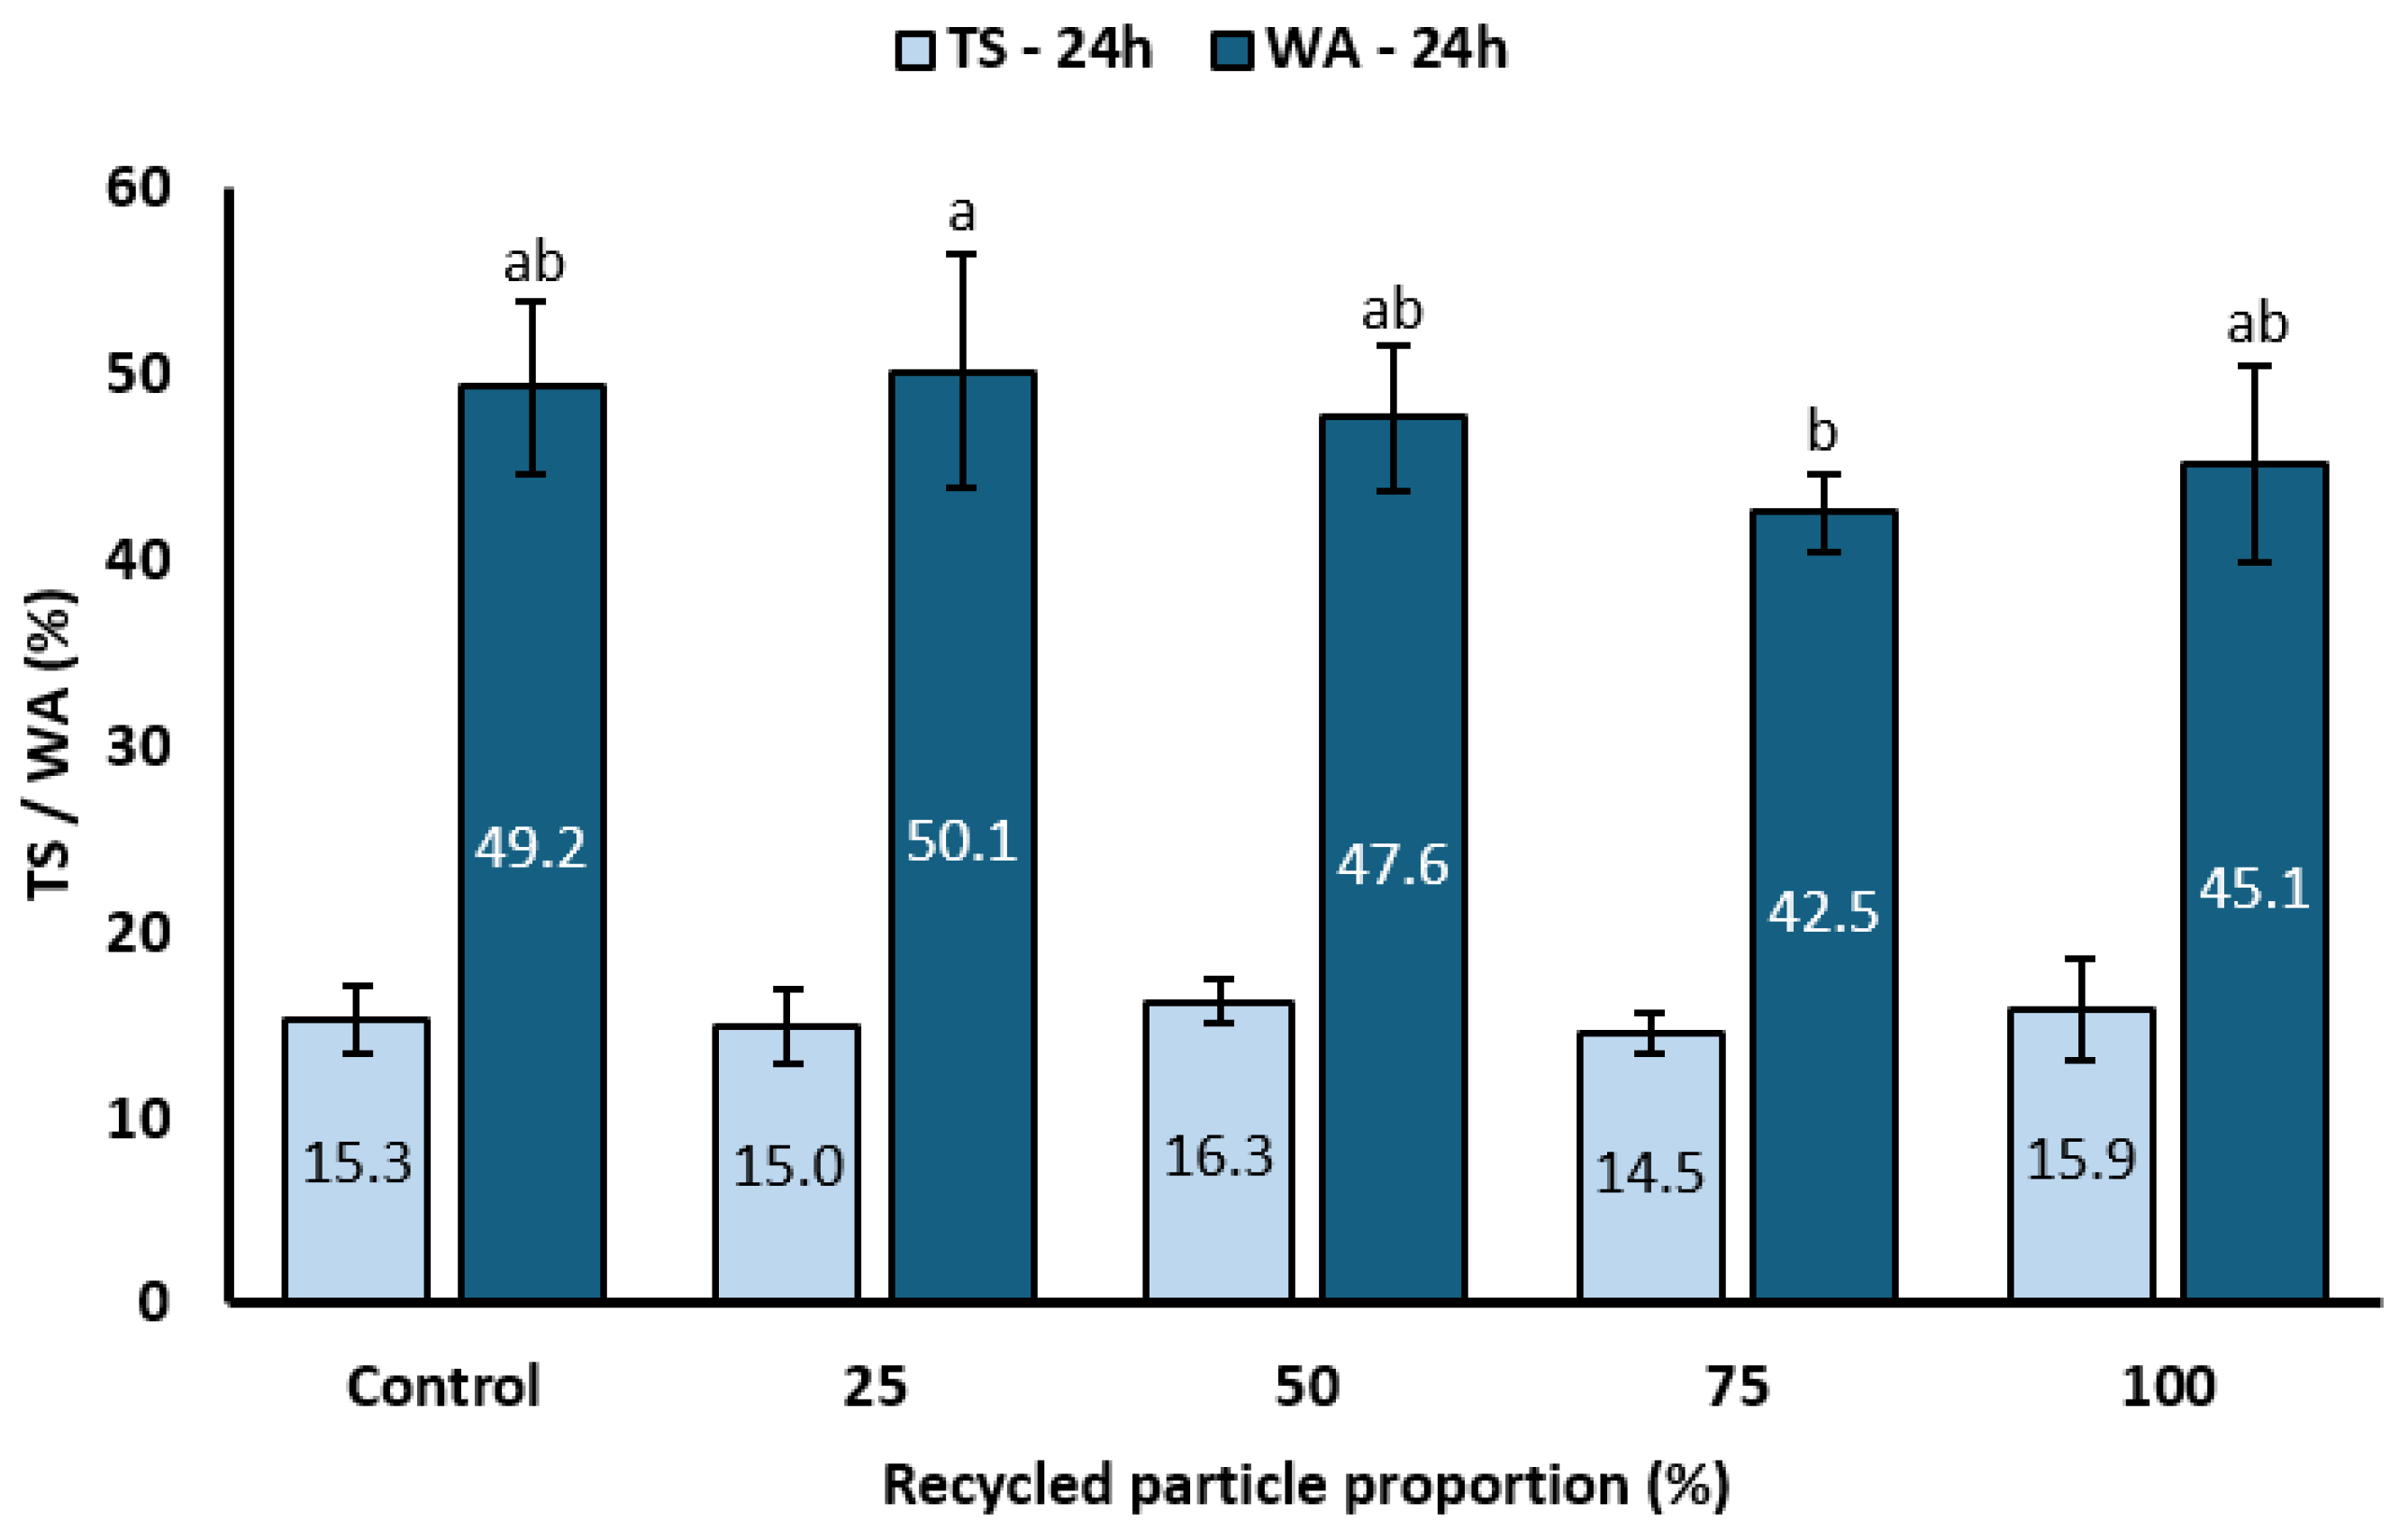
Figure 8.
Internal bond (IB) strength of particleboards manufactured with increasing proportions of recycled particles in the core layer. Error bars indicate standard deviations. Mean values followed by the same letter are not statistically different according to Tukey’s test. Dashed lines indicate the minimum IB value required by ANSI A208.1-2022 [19] for LD-2, M-0 and M-2 Grades.
Figure 8.
Internal bond (IB) strength of particleboards manufactured with increasing proportions of recycled particles in the core layer. Error bars indicate standard deviations. Mean values followed by the same letter are not statistically different according to Tukey’s test. Dashed lines indicate the minimum IB value required by ANSI A208.1-2022 [19] for LD-2, M-0 and M-2 Grades.
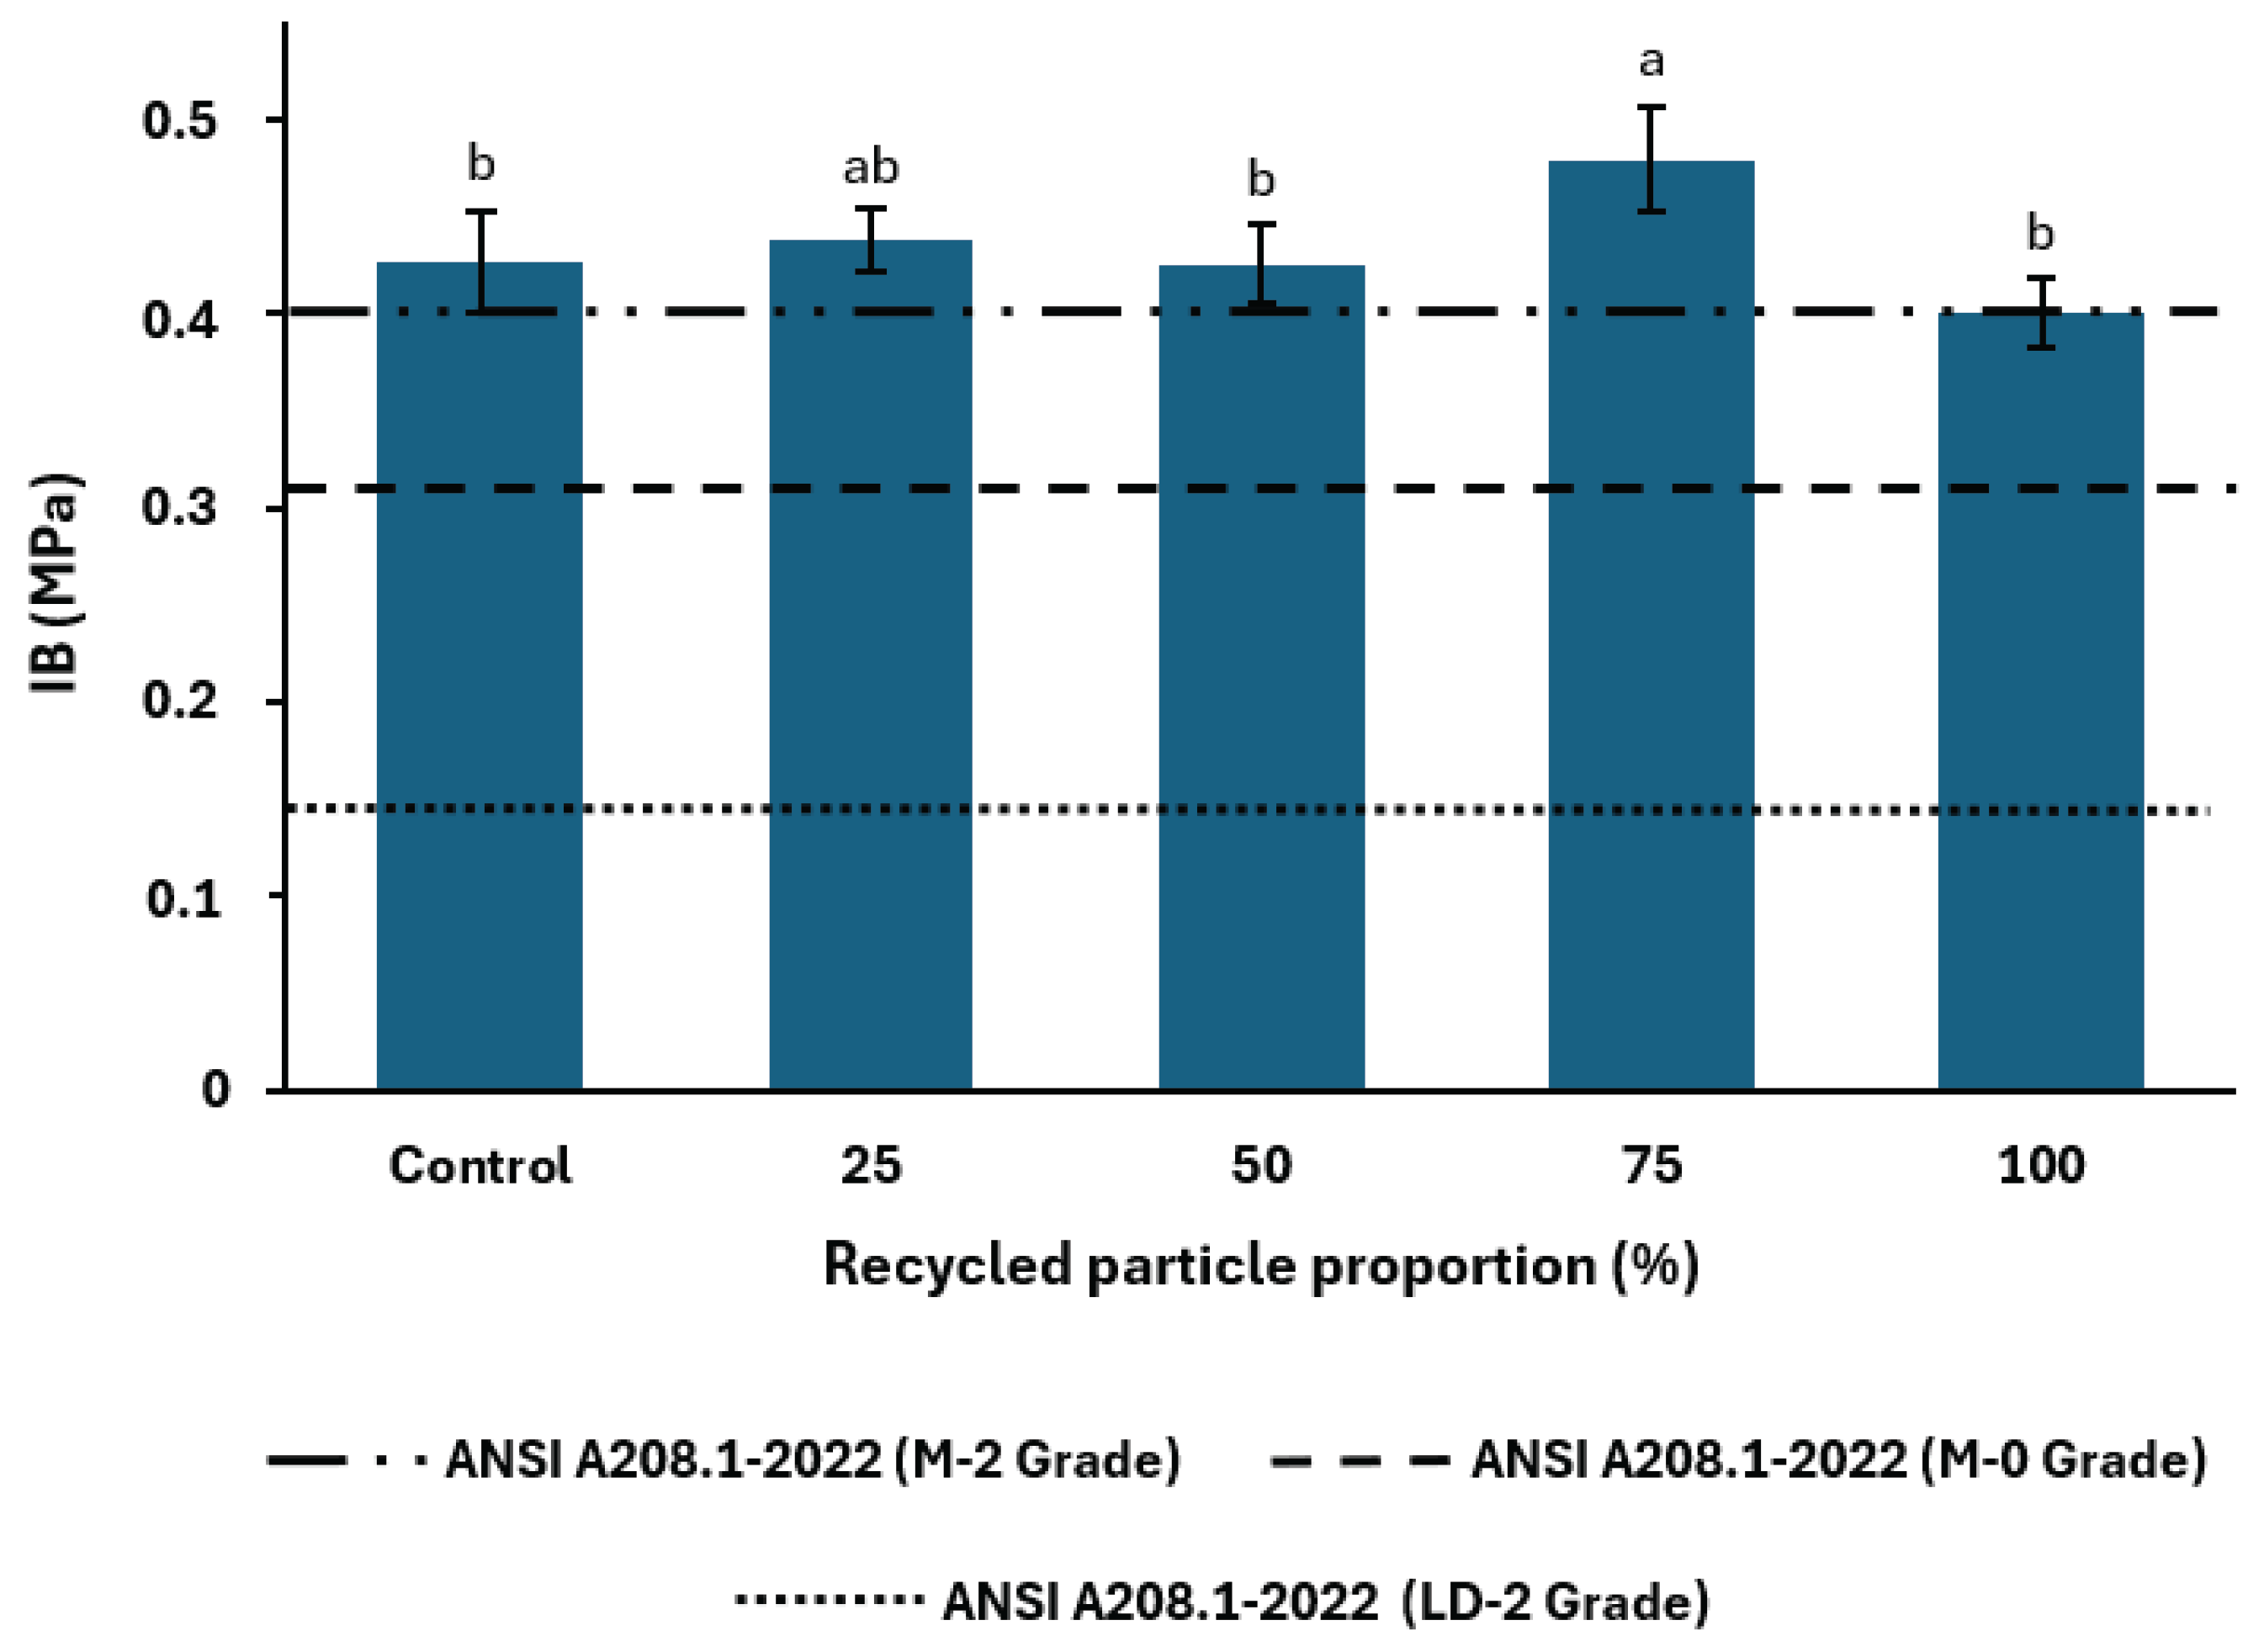
Figure 9.
Bending MOE and MOR of particleboards manufactured with increasing proportions of recycled particles in the core layer. Error bars indicate standard deviations. Mean values followed by the same letter are not statistically different according to Tukey’s test. Dashed lines indicate the minimum values required by ANSI A208.1-2022 [19] for LD-2, M-0 and M-2 Grades.
Figure 9.
Bending MOE and MOR of particleboards manufactured with increasing proportions of recycled particles in the core layer. Error bars indicate standard deviations. Mean values followed by the same letter are not statistically different according to Tukey’s test. Dashed lines indicate the minimum values required by ANSI A208.1-2022 [19] for LD-2, M-0 and M-2 Grades.
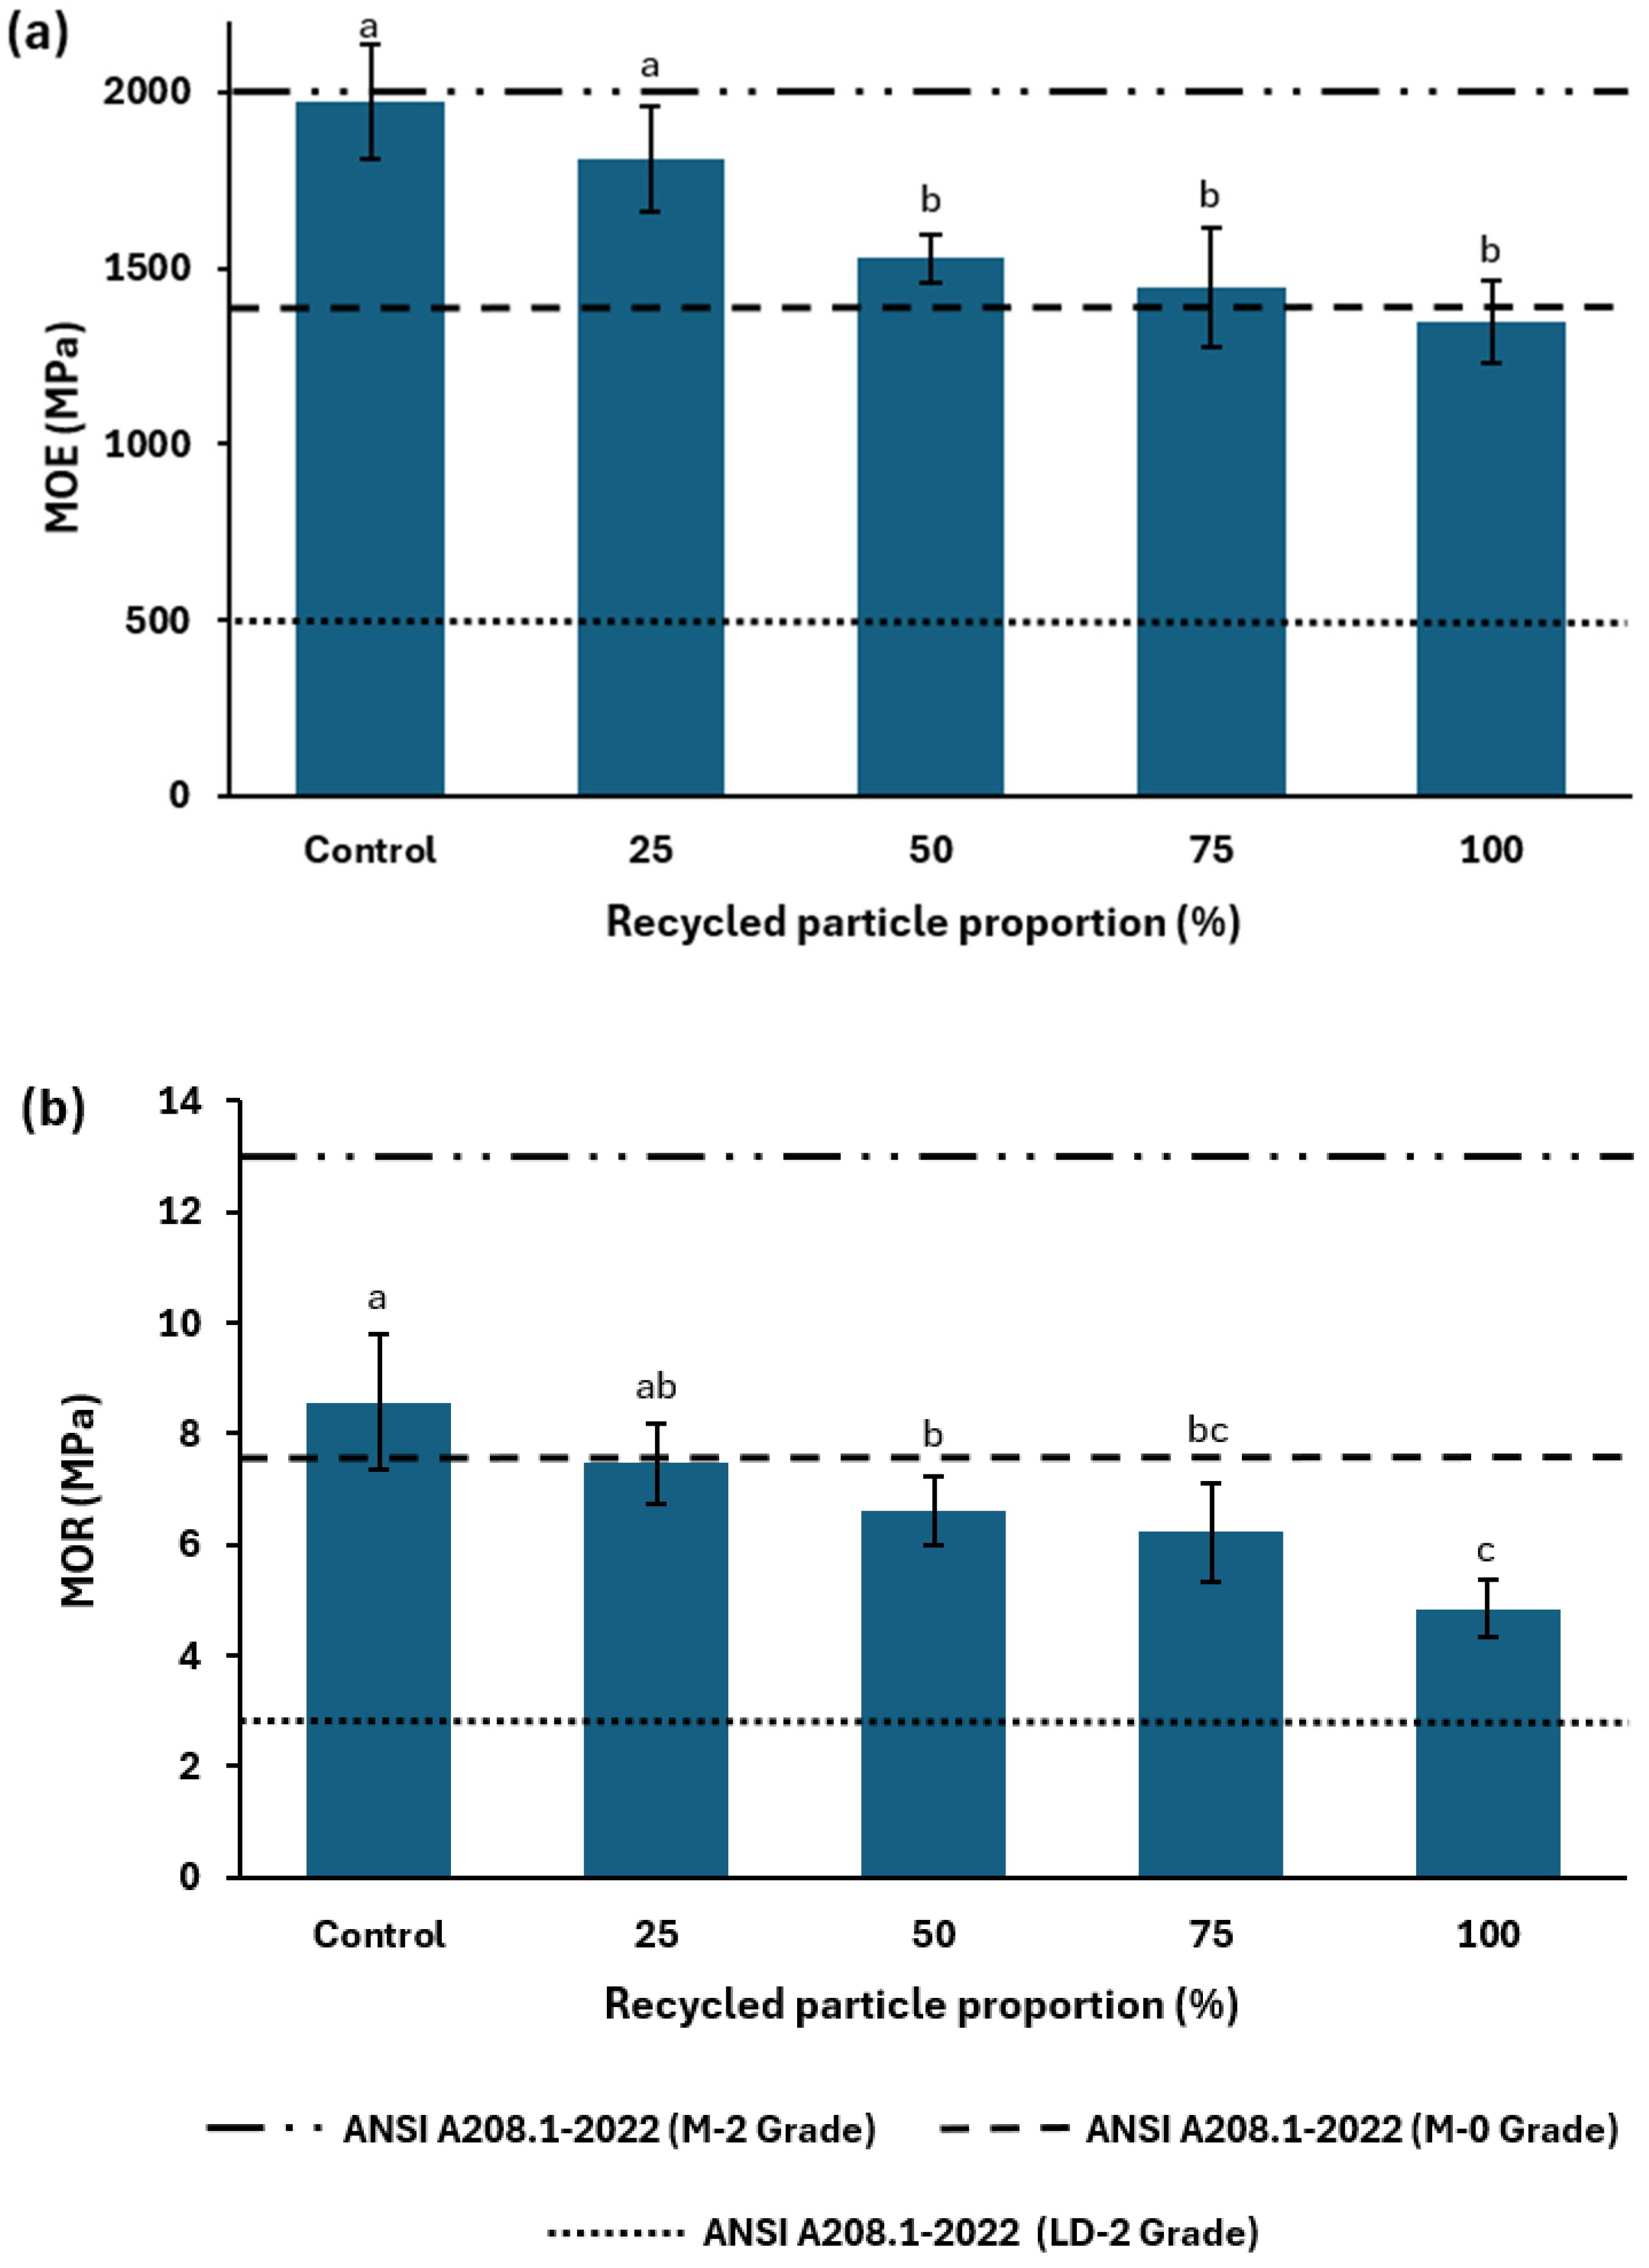
Figure 10.
Formaldehyde emissions from particleboards manufactured with increasing proportions of recycled particles in the core layer. Error bars indicate standard deviations. Mean values followed by the same letter are not statistically different according to Tukey’s test.
Figure 10.
Formaldehyde emissions from particleboards manufactured with increasing proportions of recycled particles in the core layer. Error bars indicate standard deviations. Mean values followed by the same letter are not statistically different according to Tukey’s test.
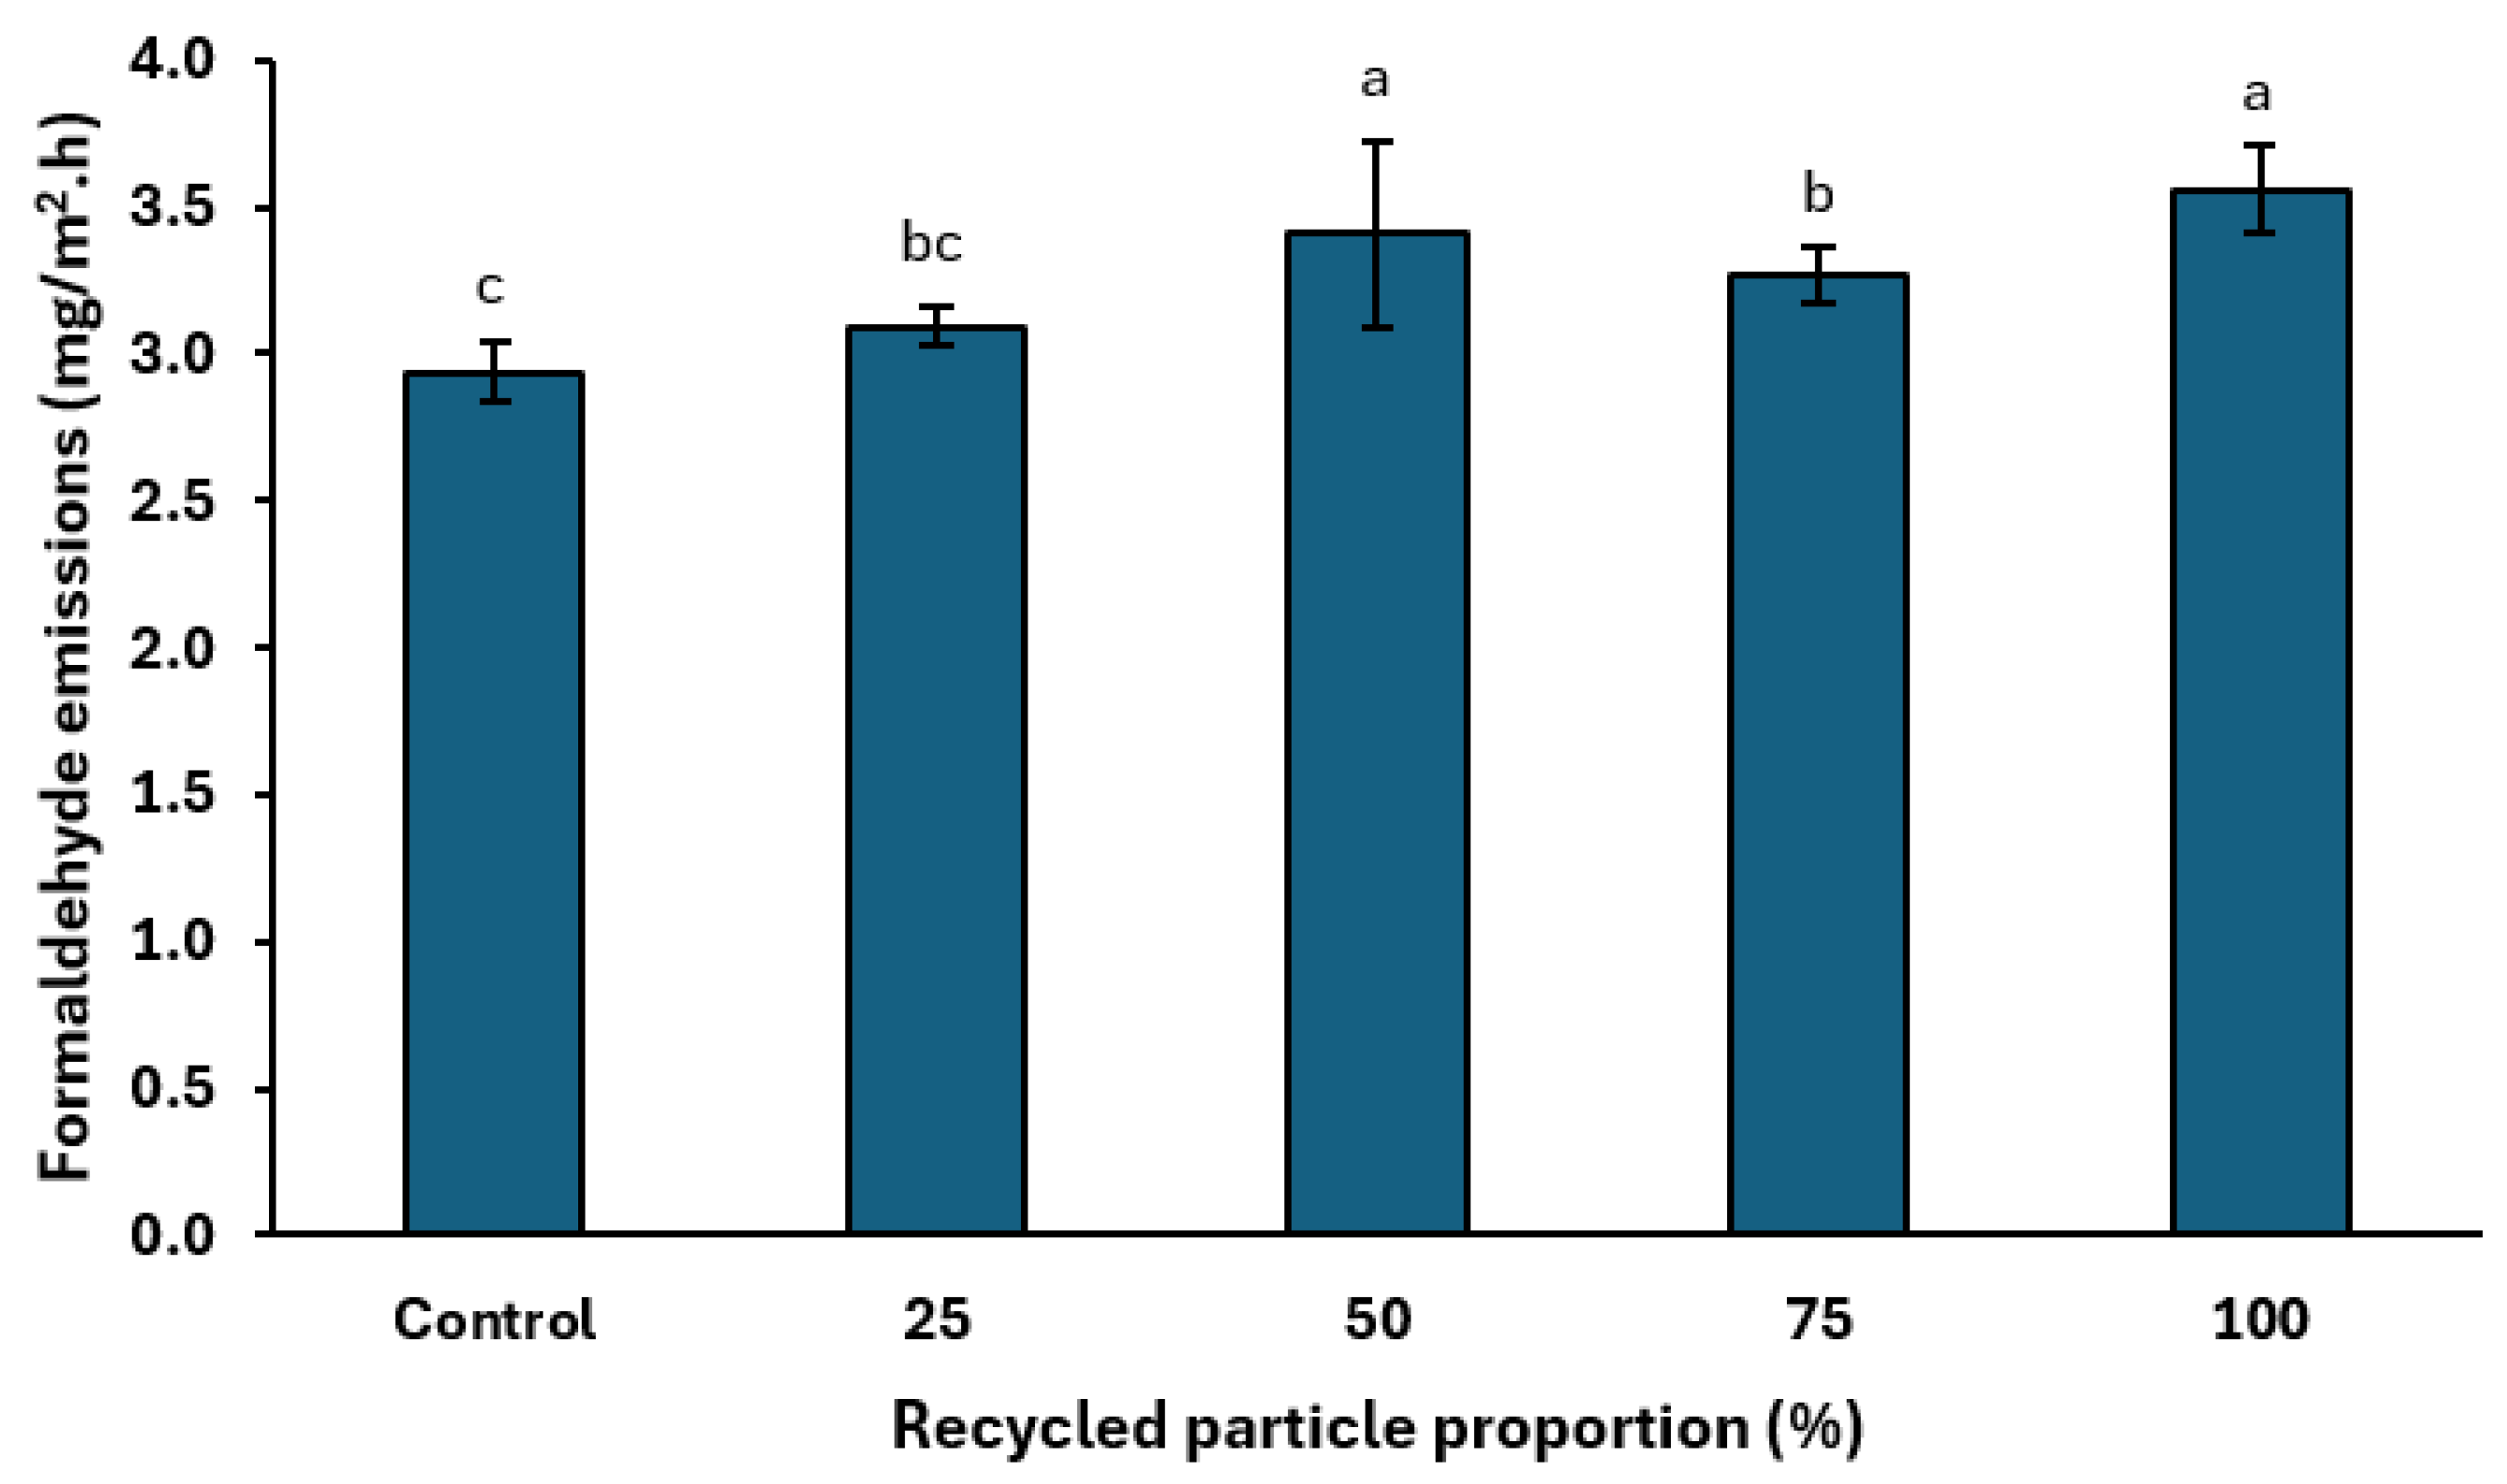

Table 1.
F-values from ANOVA assessing the effects of recycled particle proportion on the physical and mechanical properties and formaldehyde emissions of particleboards.
Table 1.
F-values from ANOVA assessing the effects of recycled particle proportion on the physical and mechanical properties and formaldehyde emissions of particleboards.
| Average Density | TS | WA | MOE | MOR | IB | Formaldehyde Emissions | |
|---|---|---|---|---|---|---|---|
| F-value | 0.09 NS | 2.85 NS | 2.95* | 18.27* | 14.41* | 7.38* | 20.7* |
| p-value | 0.99 | 0.90 | < 0.001 | < 0.001 | < 0.001 | < 0.001 | < 0.001 |
NS Not significant. * Significant at 0.05% probability level.
Disclaimer/Publisher’s Note: The statements, opinions and data contained in all publications are solely those of the individual author(s) and contributor(s) and not of MDPI and/or the editor(s). MDPI and/or the editor(s) disclaim responsibility for any injury to people or property resulting from any ideas, methods, instructions or products referred to in the content. |
© 2026 by the authors. Licensee MDPI, Basel, Switzerland. This article is an open access article distributed under the terms and conditions of the Creative Commons Attribution (CC BY) license (http://creativecommons.org/licenses/by/4.0/).
Copyright: This open access article is published under a Creative Commons CC BY 4.0 license, which permit the free download, distribution, and reuse, provided that the author and preprint are cited in any reuse.