

Submitted:
18 August 2026
Posted:
19 August 2026
You are already at the latest version
Abstract
Background/Objectives: Machine-learning (ML) models have been proposed to improve prediction of delayed graft function (DGF) and graft survival after kidney transplantation. Whether they provide better predictive performance than conventional regression remains uncertain. We systematically reviewed prediction models for both outcomes and assessed the quality of the supporting evidence.
Methods: We conducted a systematic review and meta-analysis of models predicting DGF and graft survival after kidney transplantation. Model discrimination was pooled using random-effects meta-analysis. Risk of bias was assessed using PROBAST. ML and conventional regression models were compared when sufficient data were available.
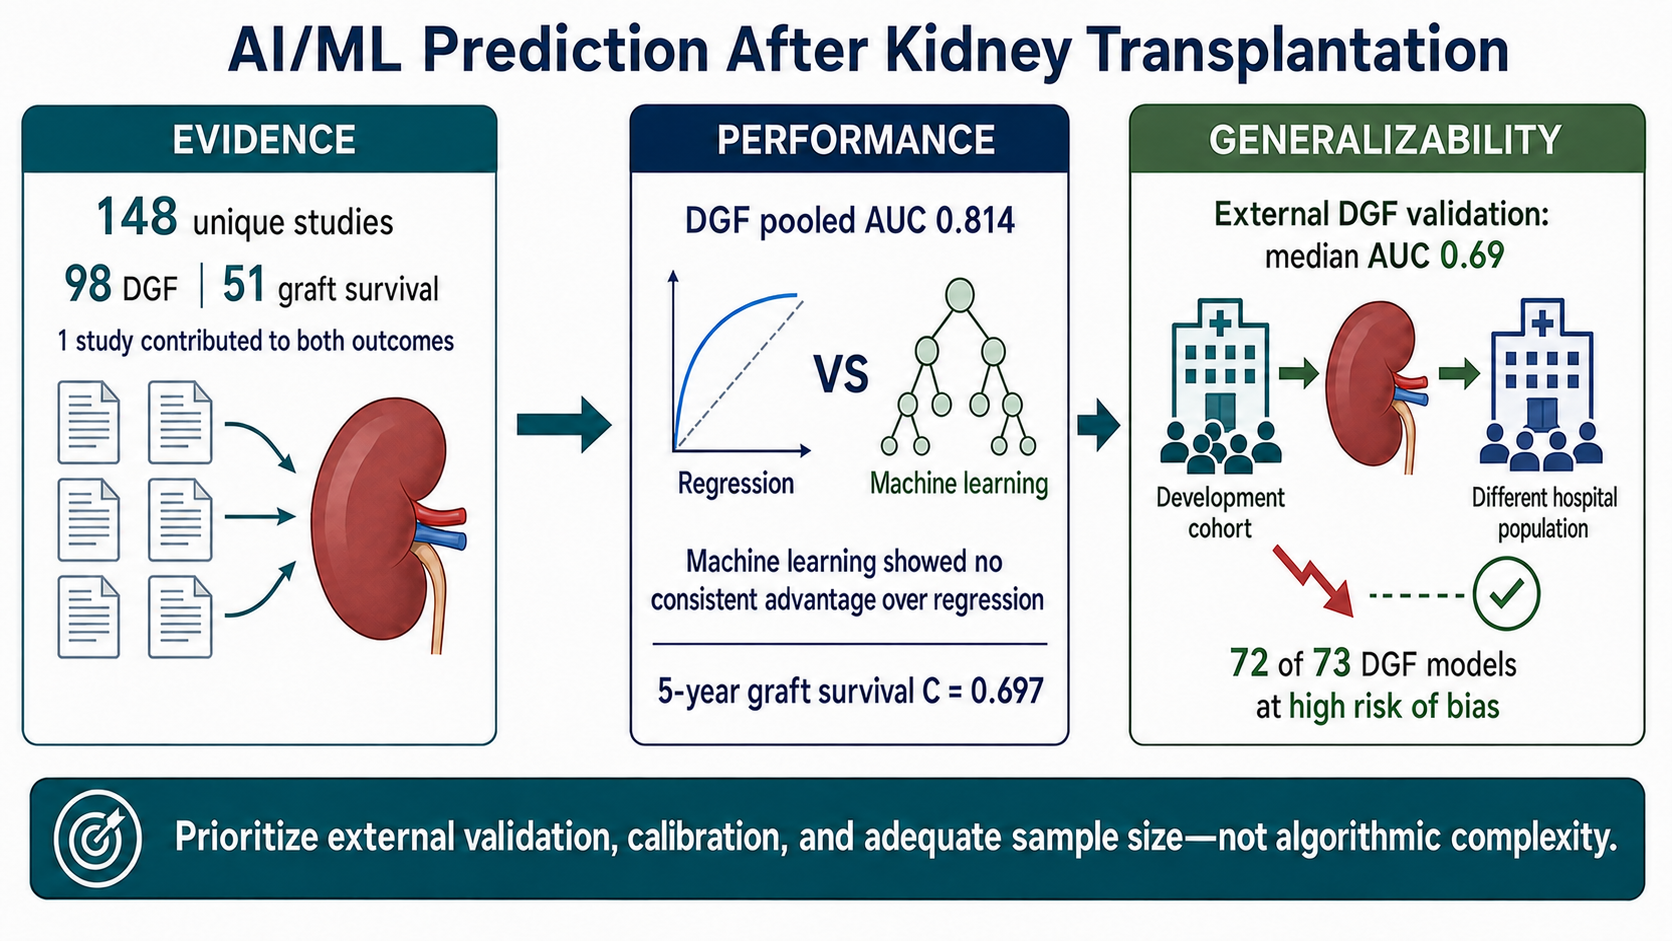
Results: The review included 148 unique studies: 98 addressing DGF and 51 addressing graft survival, with one study contributing to both outcomes. Seventy-three DGF model estimates reported a development AUC or C-statistic. The primary meta-analysis included 16 estimates from 16 studies and produced a pooled DGF AUC of 0.814 (95% CI, 0.782–0.843). Reporting was incomplete: 57 of 73 models did not report confidence intervals, 70 lacked independent external validation, and 63 did not report calibration. ML models did not consistently outperform conventional regression. Registry-based graft-survival models had pooled C-statistics of 0.697 at 5 years and 0.723 at 10 years. Five external-validation estimates of clinical DGF models from three cohorts had a median AUC of 0.69. In a network meta-analysis limited to three graft-survival studies, conventional regression ranked highest.
Conclusions: Current evidence does not demonstrate that ML provides better or more generalizable prediction of DGF or graft survival than conventional regression. The evidence is limited by incomplete reporting, infrequent calibration, high risk of bias, and limited external validation. Future studies should prioritize rigorous design, calibration, independent validation, and complete reporting over increasing model complexity.
Keywords:
kidney transplantation
; delayed graft function
; graft survival
; machine learning
; prediction model
; network meta-analysis
; external validation
; PROBAST
1. Introduction
Kidney transplantation is the preferred treatment for end-stage kidney disease. However, predicting delayed graft function (DGF) and long-term graft survival remains difficult. DGF, usually defined as dialysis within the first week after transplantation, occurs in 21%–31% of extended-criteria donor transplants and is associated with higher risks of graft loss and acute rejection. [1,2] Reliable prediction could support donor selection, recipient counseling, and early postoperative care.
Over the past decade, numerous artificial intelligence (AI) and machine-learning (ML) models have been developed to predict DGF and graft survival after kidney transplantation.[3] These approaches are often assumed to improve prediction by capturing complex relationships that may not be identified by conventional regression models. However, this advantage has not been consistently demonstrated in clinical prediction research.[4]
The available evidence is difficult to interpret. Many studies do not report confidence intervals, calibration, or performance in an independent patient population. These limitations increase the risk that a model will appear accurate in its original study but perform poorly when used elsewhere.[5] PROBAST is recommended for assessing risk of bias, while TRIPOD+AI guides transparent reporting of ML prediction-model studies. [6,7] However, these frameworks have not been consistently applied in the published literature.
Previous reviews have mainly examined graft survival and have not evaluated DGF and graft survival together.[8] It therefore remains unclear whether machine learning offers a meaningful advantage over conventional regression in kidney transplantation.
We conducted a systematic review and meta-analysis of conventional regression and ML models developed to predict DGF and graft survival after kidney transplantation. We aimed to compare model performance, assess the quality of the evidence, and determine whether ML performs better than conventional regression. The review followed PRISMA 2020 and its extension for network meta-analysis.[9,10]
2. Materials and Methods
2.1. Protocol and Reporting
2.2. Eligibility Criteria
We included studies that developed or tested models predicting DGF, graft survival, or graft failure after kidney transplantation. Studies that did not report an AUC, C-statistic, or c-index were included in the descriptive review but not the meta-analysis. The primary meta-analysis included only results with reported uncertainty; results with estimated uncertainty were examined separately in sensitivity analyses. We excluded studies without a prediction model, studies of non-kidney-transplant populations, univariable analyses, conference abstracts, reviews, editorials, and animal studies.
2.3. Search and Study Selection
We searched PubMed/MEDLINE, Embase, Web of Science, Scopus, and Semantic Scholar. Records were deduplicated using DOI and PMID matching. Conference abstracts and other ineligible publication types were removed before screening. Complete search strategies are provided in Supplementary Table S1.
Records were screened against predefined eligibility criteria. DGF titles and abstracts were screened independently by two reviewers, with disagreements resolved by consensus. Seven DGF records initially excluded during title and abstract screening were subsequently reconsidered; the final screening counts reflect their adjudicated eligibility. Full text was reviewed for borderline records and for every study included in a pooled analysis. A formal full-text retrieval log was not maintained.
We extracted information on study population, model type, outcome definition, sample size, model performance, uncertainty estimates, calibration, and external validation.
2.4. Risk-of-Bias Assessment
We used PROBAST to assess the study population, predictors, outcomes, and statistical analysis. We examined sample size, model overfitting, predictor selection, external validation, calibration, use of information collected after the start of the outcome period, and completeness of reporting. Failure to report confidence intervals was recorded as a reporting limitation.[6]
2.5. Statistical Analysis
Model discrimination was pooled using random-effects meta-analysis on the logit scale and then converted back to the AUC or C-statistic scale. The primary analysis included only model estimates reported with confidence intervals. Heterogeneity was summarized using I2 and 95% prediction intervals.
For models reporting an AUC without a confidence interval, standard errors were estimated using the Hanley–McNeil method and an assumed DGF event rate of 20%. When performance was evaluated in a validation or test set, the size of that evaluation set—not the development cohort—was used to estimate uncertainty. These estimates were included only in sensitivity analyses.
DGF models were analyzed overall and by model class. Graft-survival models were analyzed separately at 1, 2, 3, 5, 7, and 10 years. We examined the association between reported DGF performance and study size using meta-regression. Funnel-plot asymmetry was assessed using Egger’s test.
For studies that evaluated machine-learning and conventional regression models in the same cohort, we calculated the difference in discrimination between the best-performing machine-learning model and the regression model. Positive values favored machine learning. This difference was regressed on the base-10 logarithm of sample size using HC1 heteroskedasticity-robust standard errors. Robustness was assessed by repeating the analysis after removing one study at a time. Mean differences were also summarized descriptively for studies with fewer than 1,000, 1,000–9,999, and at least 10,000 patients. These category-specific means were unweighted and were not treated as pooled estimates.
Network meta-analysis was restricted to studies that compared multiple model classes in the same cohort and reported confidence intervals. No DGF study met these requirements; therefore, network meta-analysis was not performed for DGF. Exploratory analyses using estimated standard errors are summarized in the Supplement but were not used for inference.
2.6. Software
Analyses were performed using Python 3.13 and R 4.5.1.
3. Results
3.1. Study Selection
The PubMed/MEDLINE searches identified 487 records: 380 for DGF and 107 for graft survival. After seven graft-survival records were removed or reclassified, 480 records underwent title and abstract screening. Of these, 273 were excluded, and 207 reports were assessed for eligibility. Sixty-five reports were excluded after eligibility assessment, leaving 142 studies from PubMed/MEDLINE. Additional searches of Embase, Web of Science, Scopus, and Semantic Scholar identified seven additional graft-survival studies. Overall, 148 unique studies were included: 98 in the DGF arm and 51 in the graft-survival arm. One study contributed to both arms and was counted once in the total (Table 1 and Figure 1).
3.2. Prediction of Delayed Graft Function
Across the 73 DGF models, the median development AUC was 0.798 (IQR, 0.735–0.863). Performance was higher in single center than in registry or multicenter models (median AUC, 0.814 vs 0.728; Figure 2, Table 2, and Supplementary Table S5).
Sixteen model estimates reported confidence intervals and were included in the primary meta-analysis. The pooled AUC was 0.814 (95% CI, 0.782–0.843; 95% prediction interval, 0.687–0.898; Table 2 and Figure 3).
Five additional estimates with calculated uncertainty were added in the sensitivity analysis, producing a pooled AUC of 0.800 (95% CI, 0.776–0.822; 95% prediction interval, 0.709–0.868; Table 2, Figure 3, and Supplementary Table S5).
In the sensitivity analysis, pooled AUCs were 0.789 for conventional regression, 0.783 for biomarker-based models, and 0.838 for machine-learning models. Differences among model classes were not statistically significant (Table 2 and Supplementary Table S5).
3.2.1. Relationship Between Performance and Study Size
Large registry studies including approximately 76,000–98,000 recipients reported AUCs of 0.72–0.75, whereas some smaller single-center studies reported AUCs of 0.90–0.99.[12,13] The association between development sample size and reported AUC was not statistically significant (p=0.13).
Among the 16 models reporting confidence intervals, Egger’s test did not detect funnel-plot asymmetry (intercept, 0.96; p=0.29; Figure 4). When five additional models with estimated standard errors were included, the intercept was 2.01 (p=0.006). Because these standard errors were calculated partly from sample size, the sensitivity result was not independent of study size.
3.2.2. External Validation of DGF Models
Independent external validation was uncommon. Five clinical-model performance estimates were available from three independent cohorts, with AUCs ranging from 0.51 to 0.76 and a median of 0.69 (Table 2 and Table 3). This was lower than the pooled development AUC of 0.814.
Some established models performed poorly in independent populations. The Jeldres and Chapal models had external-validation AUCs of 0.54 and 0.51, respectively.[14] Four externally evaluated biomarker or gene-expression models reported AUCs of 0.70–0.88, but these estimates came from small cohorts.
3.3. Prediction of Graft Survival
Registry-based models showed moderate ability to predict graft survival. The pooled C-statistics were 0.762 at 1 year, 0.744 at 2 years, 0.717 at 3 years, 0.697 at 5 years, 0.743 at 7 years, and 0.723 at 10 years (Table 2). Results varied considerably across studies at most follow-up periods. At 5 years, the 95% prediction interval ranged from 0.625 to 0.760.
At 5 years, six registry-based models reported C-statistics ranging from 0.645 to 0.760, with a pooled estimate of 0.697. Three single-center models reported higher values of 0.727, 0.897, and 0.904 (Figure 5). The two highest estimates came from relatively small cohorts of 278 and 378 recipients. [15,16]
Five additional models reported a single overall or time-varying C-statistic rather than results at specific follow-up periods and were analyzed separately. The largest externally validated model included 13,608 recipients from 18 centers and reported an overall C-statistic of 0.857 (95% CI, 0.847–0.866), with values ranging from 0.820 to 0.868 across three continents.[17] The remaining models reported C-statistics ranging from 0.661 to 0.965, including several high estimates from small single-center cohorts.
3.4. Comparison of Machine Learning with Conventional Regression
Seventeen studies compared machine-learning and conventional regression models in the same patient population (Figure 6 and Supplementary Table S6). For each study, the difference in discrimination was calculated by subtracting the AUC or C-statistic of the regression model from that of the best-performing machine-learning model. Positive values favored machine learning.
The mean difference was +0.110 among seven studies with fewer than 1,000 patients, +0.018 among five studies with 1,000–9,999 patients, and +0.014 among five studies with at least 10,000 patients. These values were unweighted descriptive means.
The difference decreased by 0.038 for each tenfold increase in sample size (Figure 6). In leave-one-study-out analyses, the slope remained negative and ranged from −0.030 to −0.048. The corresponding p-values ranged from 0.007 to 0.078, with five of the 17 analyses exceeding 0.05 (Supplementary Table S6).
3.5. Network Meta-Analysis
No DGF study reported confidence intervals for multiple model classes evaluated in the same patient population. Therefore, network meta-analysis was not performed for DGF.
The graft-survival network included three studies, eight model estimates, and four model classes. [18,19,20] Conventional regression had the highest P-score at 0.99. Compared with regression, tree-based models had a logit C-statistic difference of −0.19 (95% CI, −0.34 to −0.04), corresponding to an approximate absolute C-statistic difference of −0.037. The difference was −0.15 for deep learning (95% CI, −0.30 to 0.01) and −0.95 for support-vector machines (95% CI, −1.26 to −0.65) (Table 4 and Figure 7).
Tree-based models were evaluated in all three studies. Deep learning and support-vector machines were each represented by one study. Exploratory sensitivity analyses using estimated standard errors for models without reported confidence intervals produced different rankings and substantial inconsistency (Supplementary Tables S3–S4). These sensitivity analyses were not used to determine comparative model performance.
3.6. Risk of Bias
Among the 73 DGF models reporting a development AUC, 70 (96%) did not undergo independent external validation, 57 (78%) did not report a confidence interval, and 63 (86%) did not report calibration. Sixty-three models (86%) were developed in single-center cohorts. At least 18 models used data-driven predictor selection, cutoff selection, or configuration searches, and at least nine included predictors measured after the outcome window had begun (Table 5).
PROBAST classified 72 of 73 models (99%) as having a high overall risk of bias. One model was rated unclear, and none was rated low risk. The analysis domain accounted for most high-risk judgments, with 72 models rated high risk. High-risk judgments were also assigned to 31 models in the outcome domain, 22 in the predictor domain, and eight in the participant domain (Table 6, Supplementary Table S7, and Supplementary Figure S1).
One pediatric study selected its reported model from 97 machine-learning configurations and reported an AUC of 1.00 in the training data and 0.905 during internal validation.[21] Another study used a postoperative day-1 biomarker to predict DGF defined within 72 hours; therefore, the predictor was measured after the outcome window had begun.[22]
4. Discussion
This review evaluated prediction models for two clinically important outcomes after kidney transplantation: delayed graft function (DGF) and graft survival. Across both outcomes, machine-learning models did not consistently outperform conventional regression models. This does not establish that the two approaches perform equally. Rather, the available evidence is insufficient to determine whether either approach is superior because confidence intervals, calibration, and independent external validation were frequently missing.
Our findings are consistent with those of Truchot and colleagues, who found no advantage of machine learning over conventional regression in a large multicenter cohort.[18] Across 17 studies that compared both approaches in the same patient population, the reported advantage of machine learning decreased as cohort size increased. However, this association was sensitive to the removal of individual studies and should be considered exploratory. Network meta-analysis ranked conventional regression highest, but it included only three graft-survival studies. Deep learning and support-vector machines were each represented by one study, and the analysis did not account for correlations among models evaluated in the same patients. Therefore, network meta-analysis cannot establish the superiority of any model class.
Reported performance differed according to study setting. Single-center models had a median development AUC of 0.814, compared with 0.728 for registry or multicenter models. Nine single-center models reported AUCs of 0.90–0.99, whereas two large registry studies reported AUCs of approximately 0.72–0.75 in held-out data. [12,13] Although the association between sample size and reported AUC was not statistically significant, these findings suggest that high development performance in a small cohort may not be reproduced in larger or more diverse populations.
Independent external validation of DGF models was uncommon. Five clinical-model estimates were identified from three independent validation cohorts, with AUCs ranging from 0.51 to 0.76 and a median of 0.69.[14,23,24] Three estimates came from the same Belgian cohort, in which the Irish, Jeldres, and Chapal models had AUCs of 0.69, 0.54, and 0.51, respectively.[14] Thus, these five estimates should not be interpreted as five independent validations. Nevertheless, the results demonstrate that performance measured during model development may decrease when a model is applied to a different patient population.
Registry-based graft-survival models generally reported C-statistics between 0.70 and 0.76 across follow-up periods. Some small single-center studies reported substantially higher values. By contrast, a model externally validated in 13,608 recipients from 18 centers achieved an overall C-statistic of 0.857 and showed similar performance across three continents.[17] External evaluations of established regression-based tools, including the Kidney Failure Risk Equation and iBox, reported C-statistics of approximately 0.81–0.85.[25,26] However, these models predicted different outcomes and were evaluated in different settings, so their performance estimates should not be compared directly.
Risk-of-bias findings further limit confidence in the reported performance. Seventy-two of the 73 DGF models were judged to be at high overall risk of bias, driven mainly by the analysis domain. Only 16 models reported confidence intervals, 10 reported calibrations, and three underwent independent external validation. These limitations affected conventional regression and machine-learning models alike. The central problem is therefore not limited to a particular model class; it is the lack of rigorous development, reporting, and validation across the field.
Taken together, our findings indicate that model quality depends more on study design and validation than on algorithmic complexity. A complex model developed in a small cohort may learn patterns specific to that population and perform less well elsewhere. Conversely, a conventional model developed in a large cohort and validated independently may provide more reliable predictions. Greater complexity should not, by itself, be considered evidence of greater clinical value.
4.1. Clinical Implications
Clinicians and transplant programs should examine how a model was developed and evaluated before considering its use. Current evidence does not support replacing an externally validated clinical model with a machine-learning model solely because the latter uses a more complex method. The practical strengths and limitations of the major model families are summarized in Figure 8. Although complex models can capture interactions automatically, their clinical usefulness also depends on interpretability, calibration, resistance to overfitting, and performance in independent populations. Representative predictor domains are shown in Figure 8.
Predictor variables used by representative kidney-transplant prediction models, by domain, with external-validation status. The best-validated tools (KFRE, iBox) use the fewest, most focused variables; the broad machine-learning models draw on the same donor/recipient/cold-ischemia/immunology domains — more flexible mathematics, not richer data. Predictor sets are taken from the source publications.
Before clinical adoption, a model should be externally validated in a population similar to the intended users. Its calibration should be reported, its predictors should be available at the intended time of use, and it should provide a meaningful improvement over existing approaches. A practical checklist for evaluating prediction models is provided in Table 7.
4.2. Limitations
This review has several limitations. First, only 16 of the 73 DGF models reporting an AUC also reported a confidence interval. Restricting the primary meta-analysis to these estimates may have favored studies with better reporting practices. For five additional models, standard errors were calculated using the Hanley–McNeil method, an assumed DGF event rate of 20%, and the sample size of the dataset in which performance was evaluated. Results from this sensitivity analysis should therefore be interpreted separately from the primary analysis.
Second, calibration and independent external validation were uncommon. Several model estimates were obtained from the same validation cohorts and were therefore not independent. Some registry studies also used overlapping national datasets, which may have included some of the same recipients.
Third, definitions of outcomes, follow-up periods, patient populations, predictors, and validation methods differed across studies. This variation contributed to substantial heterogeneity, particularly in the graft-survival analyses.
Fourth, the network meta-analysis was exploratory and included only three graft-survival studies. Some model classes were represented by a single study, and correlations among models evaluated in the same patients were not incorporated. No DGF study reported sufficient information to support a confidence-interval–based network meta-analysis.
Finally, the analyses were based on published summary measures rather than individual participant data. Discrimination could not be recalculated using uniform outcome definitions or time points. The review protocol was completed before screening but was not prospectively registered, and full text was not available for every potentially eligible report.
5. Conclusions
Current evidence does not demonstrate that machine-learning models provide better or more generalizable prediction of DGF or graft survival than conventional regression models. However, the evidence is limited by incomplete reporting, infrequent calibration, high risk of bias, and a lack of independent external validation. Future studies should prioritize rigorous validation, transparent reporting, and clinically meaningful comparisons with existing models before claiming improved performance.
Supplementary Materials
The following supporting information can be downloaded at the website of this paper posted on Preprints.org, Table S1: Complete database search strategies and search yields; Table S2: Model-level data for the primary DGF meta-analysis; Table S3: Sensitivity network meta-analysis using estimated standard errors; Table S4: Additional sensitivity analyses of model-class comparisons; Table S5: Characteristics and discrimination estimates of DGF prediction models; Table S6: Within-study comparisons of machine-learning and conventional regression models, including leave-one-study-out analyses; Table S7: Study-level PROBAST risk-of-bias assessments; Table S8: Screening decisions and reasons for exclusion; Figure S1: PROBAST risk-of-bias assessment of 73 DGF prediction models.
Author Contributions
S.G. conceived the review and designed the study. P.G. designed and performed the search, screening, extraction and statistical analysis, and drafted the manuscript. D.W. and R.G. contributed to interpretation and critically revised the manuscript for important intellectual content. All authors reviewed the analysis outputs against the manuscript and approved the final version, and all agreed to be accountable for the integrity of the work.
Funding
This work received no specific grant from any funding agency in the public, commercial, or not-for-profit sectors.
Institutional Review Board Statement
This study is a systematic review and meta-analysis of published, aggregate data. It did not involve human participants, identifiable individual data, or animals, and institutional review board approval and informed consent were therefore not required.
Data Availability Statement
The discrimination estimate extracted for every included model, with the source PMID for each, is provided in Supplementary Tables S2–S5. The screening log, the full extraction records, and the analysis code (Python 3.13 and R 4.5.1) are available from the corresponding author on reasonable request.
Acknowledgments
During the preparation of this manuscript/study, the author(s) used Copilot for the purposes of generating a graphical abstract. The authors have reviewed and edited the output and take full responsibility for the content of this publication.
Conflicts of Interest
R.G serves as the guest editor of the special issue “Kidney Transplantation: From Donor Selection to Recipient Outcomes”. The rest of the authors declare no conflicts of interest.:
References
- Skaudickas, D.; Lenčiauskas, P.; Skaudickas, A.; Bura, A. Delayed graft function after renal transplantation. Open Med. (Wars) 2025, 20(1), 20251140. [Google Scholar] [CrossRef] [PubMed]
- Yarlagadda, S.G.; Coca, S.G.; Formica, R.N.; Poggio, E.D.; Parikh, C.R. Association between delayed graft function and allograft and patient survival: a systematic review and meta-analysis. Nephrol. Dial. Transplant. 2009, 24(3), 1039–1047. [Google Scholar] [CrossRef] [PubMed]
- Naqvi, S.A.A.; Tennankore, K.; Vinson, A.; Roy, P.C.; Abidi, S.S.R. Predicting kidney graft survival using machine learning methods: prediction model development and feature significance analysis study. J. Med. Internet Res. 2021, 23(8), e26843. [Google Scholar] [CrossRef] [PubMed]
- Christodoulou, E.; Ma, J.; Collins, G.S.; Steyerberg, E.W.; Verbakel, J.Y.; Van Calster, B. A systematic review shows no performance benefit of machine learning over logistic regression for clinical prediction models. J. Clin. Epidemiol. 2019, 110, 12–22. [Google Scholar] [CrossRef] [PubMed]
- Andaur Navarro, C.L.; Damen, J.A.A.; Takada, T.; et al. Risk of bias in studies on prediction models developed using supervised machine learning techniques: systematic review. BMJ 2021, 375, n2281. [Google Scholar] [CrossRef] [PubMed]
- Moons, K.G.M.; Wolff, R.F.; Riley, R.D.; et al. PROBAST: a tool to assess risk of bias and applicability of prediction model studies: explanation and elaboration. Ann. Intern Med. 2019, 170(1), W1–W33. [Google Scholar] [CrossRef] [PubMed]
- Collins, G.S.; Moons, K.G.M.; Dhiman, P.; et al. TRIPOD+AI statement: updated guidance for reporting clinical prediction models that use regression or machine learning methods. BMJ 2024, 385, e078378. [Google Scholar] [CrossRef] [PubMed]
- Ravindhran, B.; Chandak, P.; Schafer, N.; et al. Machine learning models in predicting graft survival in kidney transplantation: meta-analysis. BJS Open 2023, 7(2), zrad011. [Google Scholar] [CrossRef] [PubMed]
- Page, M.J.; McKenzie, J.E.; Bossuyt, P.M.; et al. The PRISMA 2020 statement: an updated guideline for reporting systematic reviews. BMJ 2021, 372, n71. [Google Scholar] [CrossRef] [PubMed]
- Hutton, B.; Salanti, G.; Caldwell, D.M.; et al. The PRISMA extension statement for reporting of systematic reviews incorporating network meta-analyses of health care interventions: checklist and explanations. Ann. Intern Med. 2015, 162(11), 777–784. [Google Scholar] [CrossRef] [PubMed]
- Moons, K.G.M.; de Groot, J.A.H.; Bouwmeester, W.; et al. Critical appraisal and data extraction for systematic reviews of prediction modelling studies: the CHARMS checklist. PLoS Med. 2014, 11(10), e1001744. [Google Scholar] [CrossRef] [PubMed]
- Bae, S.; Massie, A.B.; Caffo, B.S.; Jackson, K.R.; Segev, D.L. Machine learning to predict transplant outcomes: helpful or hype? A national cohort study. Transpl. Int. 2020, 33(11), 1472–1480. [Google Scholar] [CrossRef] [PubMed]
- Potluri, V.S.; Rubin, J.; Zee, J.; et al. Assessing deceased-donor kidneys through posttransplant survival prediction algorithms. Am. J. Kidney Dis. 2026, 87(1), 18–30. [Google Scholar] [CrossRef] [PubMed]
- Michalak, M.; Wouters, K.; Fransen, E.; et al. Prediction of delayed graft function using different scoring algorithms: a single-center experience. World J. Transplant. 2017, 7(5), 260–268. [Google Scholar] [CrossRef] [PubMed]
- Hamidi, O.; Poorolajal, J.; Farhadian, M.; Tapak, L. Identifying important risk factors for survival in kidney graft failure patients using random survival forests. Iran. J. Public Health 2016, 45(1), 27–33. [Google Scholar] [PubMed]
- Mulugeta, G.; Zewotir, T.; Tegegne, A.S.; Muleta, M.B.; Juhar, L.H. Developing clinical prognostic models to predict graft survival after renal transplantation: comparison of statistical and machine learning models. BMC Med. Inf. Decis. Mak. 2025, 25(1), 54. [Google Scholar] [CrossRef] [PubMed]
- Raynaud, M.; Aubert, O.; Divard, G.; et al. Dynamic prediction of renal survival among deeply phenotyped kidney transplant recipients using artificial intelligence: an observational, international, multicohort study. Lancet Digit Health 2021, 3(12), e795–e805. [Google Scholar] [CrossRef] [PubMed]
- Truchot, A.; Raynaud, M.; Kamar, N.; et al. Machine learning does not outperform traditional statistical modelling for kidney allograft failure prediction. Kidney Int. 2023, 103(5), 936–948. [Google Scholar] [CrossRef] [PubMed]
- Yin, S.; Li, X.; Liang, C.; et al. Evaluation of early donor renal function recovery after living-donor nephrectomy as a predictor of allograft failure after kidney transplantation: a longitudinal cohort and machine learning study. eClinicalMedicine 2025, 84, 103278. [Google Scholar] [CrossRef] [PubMed]
- Tang, H.; Poynton, M.R.; Hurdle, J.F.; Baird, B.C.; Koford, J.K.; Goldfarb-Rumyantzev, A.S. Predicting three-year kidney graft survival in recipients with systemic lupus erythematosus. ASAIO J. 2011, 57(4), 300–309. [Google Scholar] [CrossRef] [PubMed]
- Liu, X.Y.; Feng, R.T.; Feng, W.X.; et al. An integrated machine learning model enhances delayed graft function prediction in pediatric renal transplantation from deceased donors. BMC Med. 2024, 22(1), 407. [Google Scholar] [CrossRef] [PubMed]
- Li, Y.; Wang, B.; Wang, L.; et al. Postoperative day 1 serum cystatin C level predicts postoperative delayed graft function after kidney transplantation. Front Med. 2022, 9, 863962. [Google Scholar] [CrossRef] [PubMed]
- Kers, J.; Peters-Sengers, H.; Heemskerk, M.B.A.; et al. Prediction models for delayed graft function: external validation on the Dutch Prospective Renal Transplantation Registry. Nephrol. Dial. Transplant. 2018, 33(7), 1259–1268. [Google Scholar] [CrossRef] [PubMed]
- Zhang, H.; Zheng, L.; Qin, S.; et al. Evaluation of predictive models for delayed graft function of deceased kidney transplantation. Oncotarget 2018, 9(2), 1735–1744. [Google Scholar] [CrossRef] [PubMed]
- Chu, C.D.; Ku, E.; Fallahzadeh, M.K.; McCulloch, C.E.; Tuot, D.S. The Kidney Failure Risk Equation for prediction of allograft loss in kidney transplant recipients. Kidney Med. 2020, 2(6), 753–761.e1. [Google Scholar] [CrossRef] [PubMed]
- Rampersad, C. Unboxing iBox: a critical appraisal of its measurement properties for predicting kidney allograft failure. Kidney Med. 2026, 8(1), 101180. [Google Scholar] [CrossRef] [PubMed]
- Gosset, C.; Barbosa, S.; Destere, A.; et al. Maximum cold ischemia duration for a kidney allograft: a prediction model for allograft failure at the time of organ allocation. eClinicalMedicine 2025, 85, 103322. [Google Scholar] [CrossRef] [PubMed]
Figure 1.
PRISMA 2020 flow diagram showing study identification, screening, and inclusion.
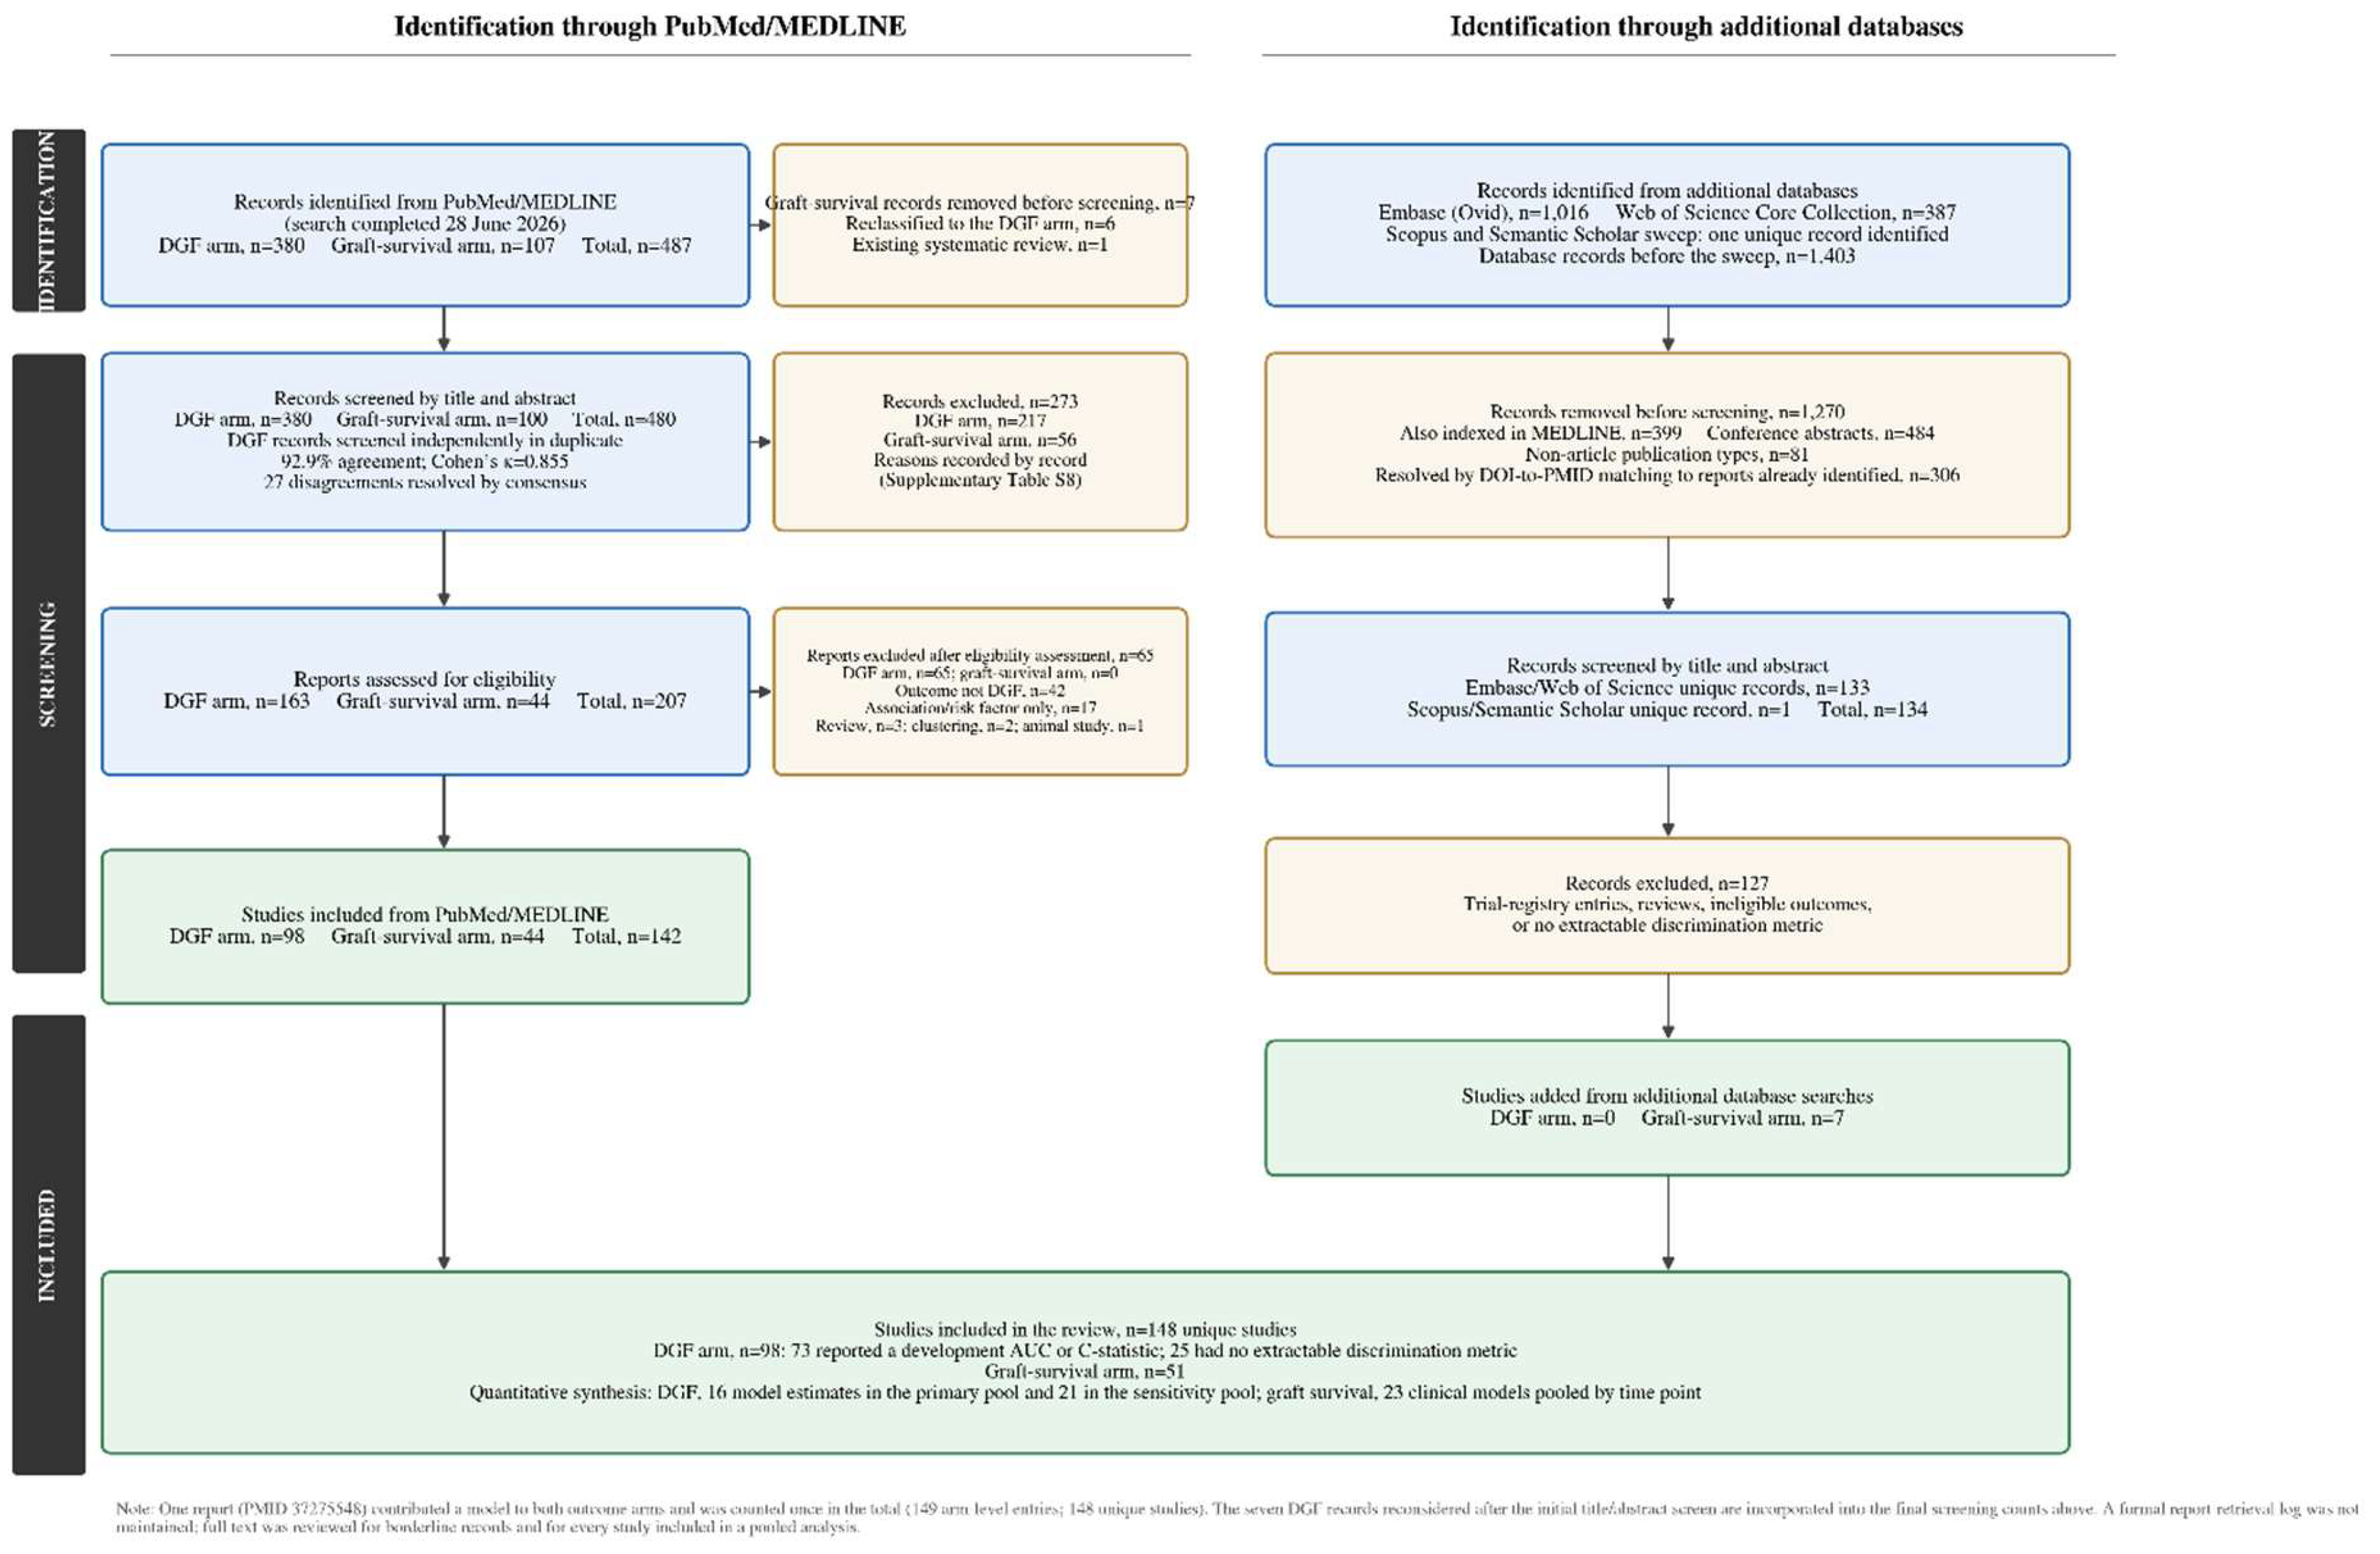
Figure 2.
Reported development AUCs for 73 models predicting delayed graft function, grouped by model class.
Figure 2.
Reported development AUCs for 73 models predicting delayed graft function, grouped by model class.
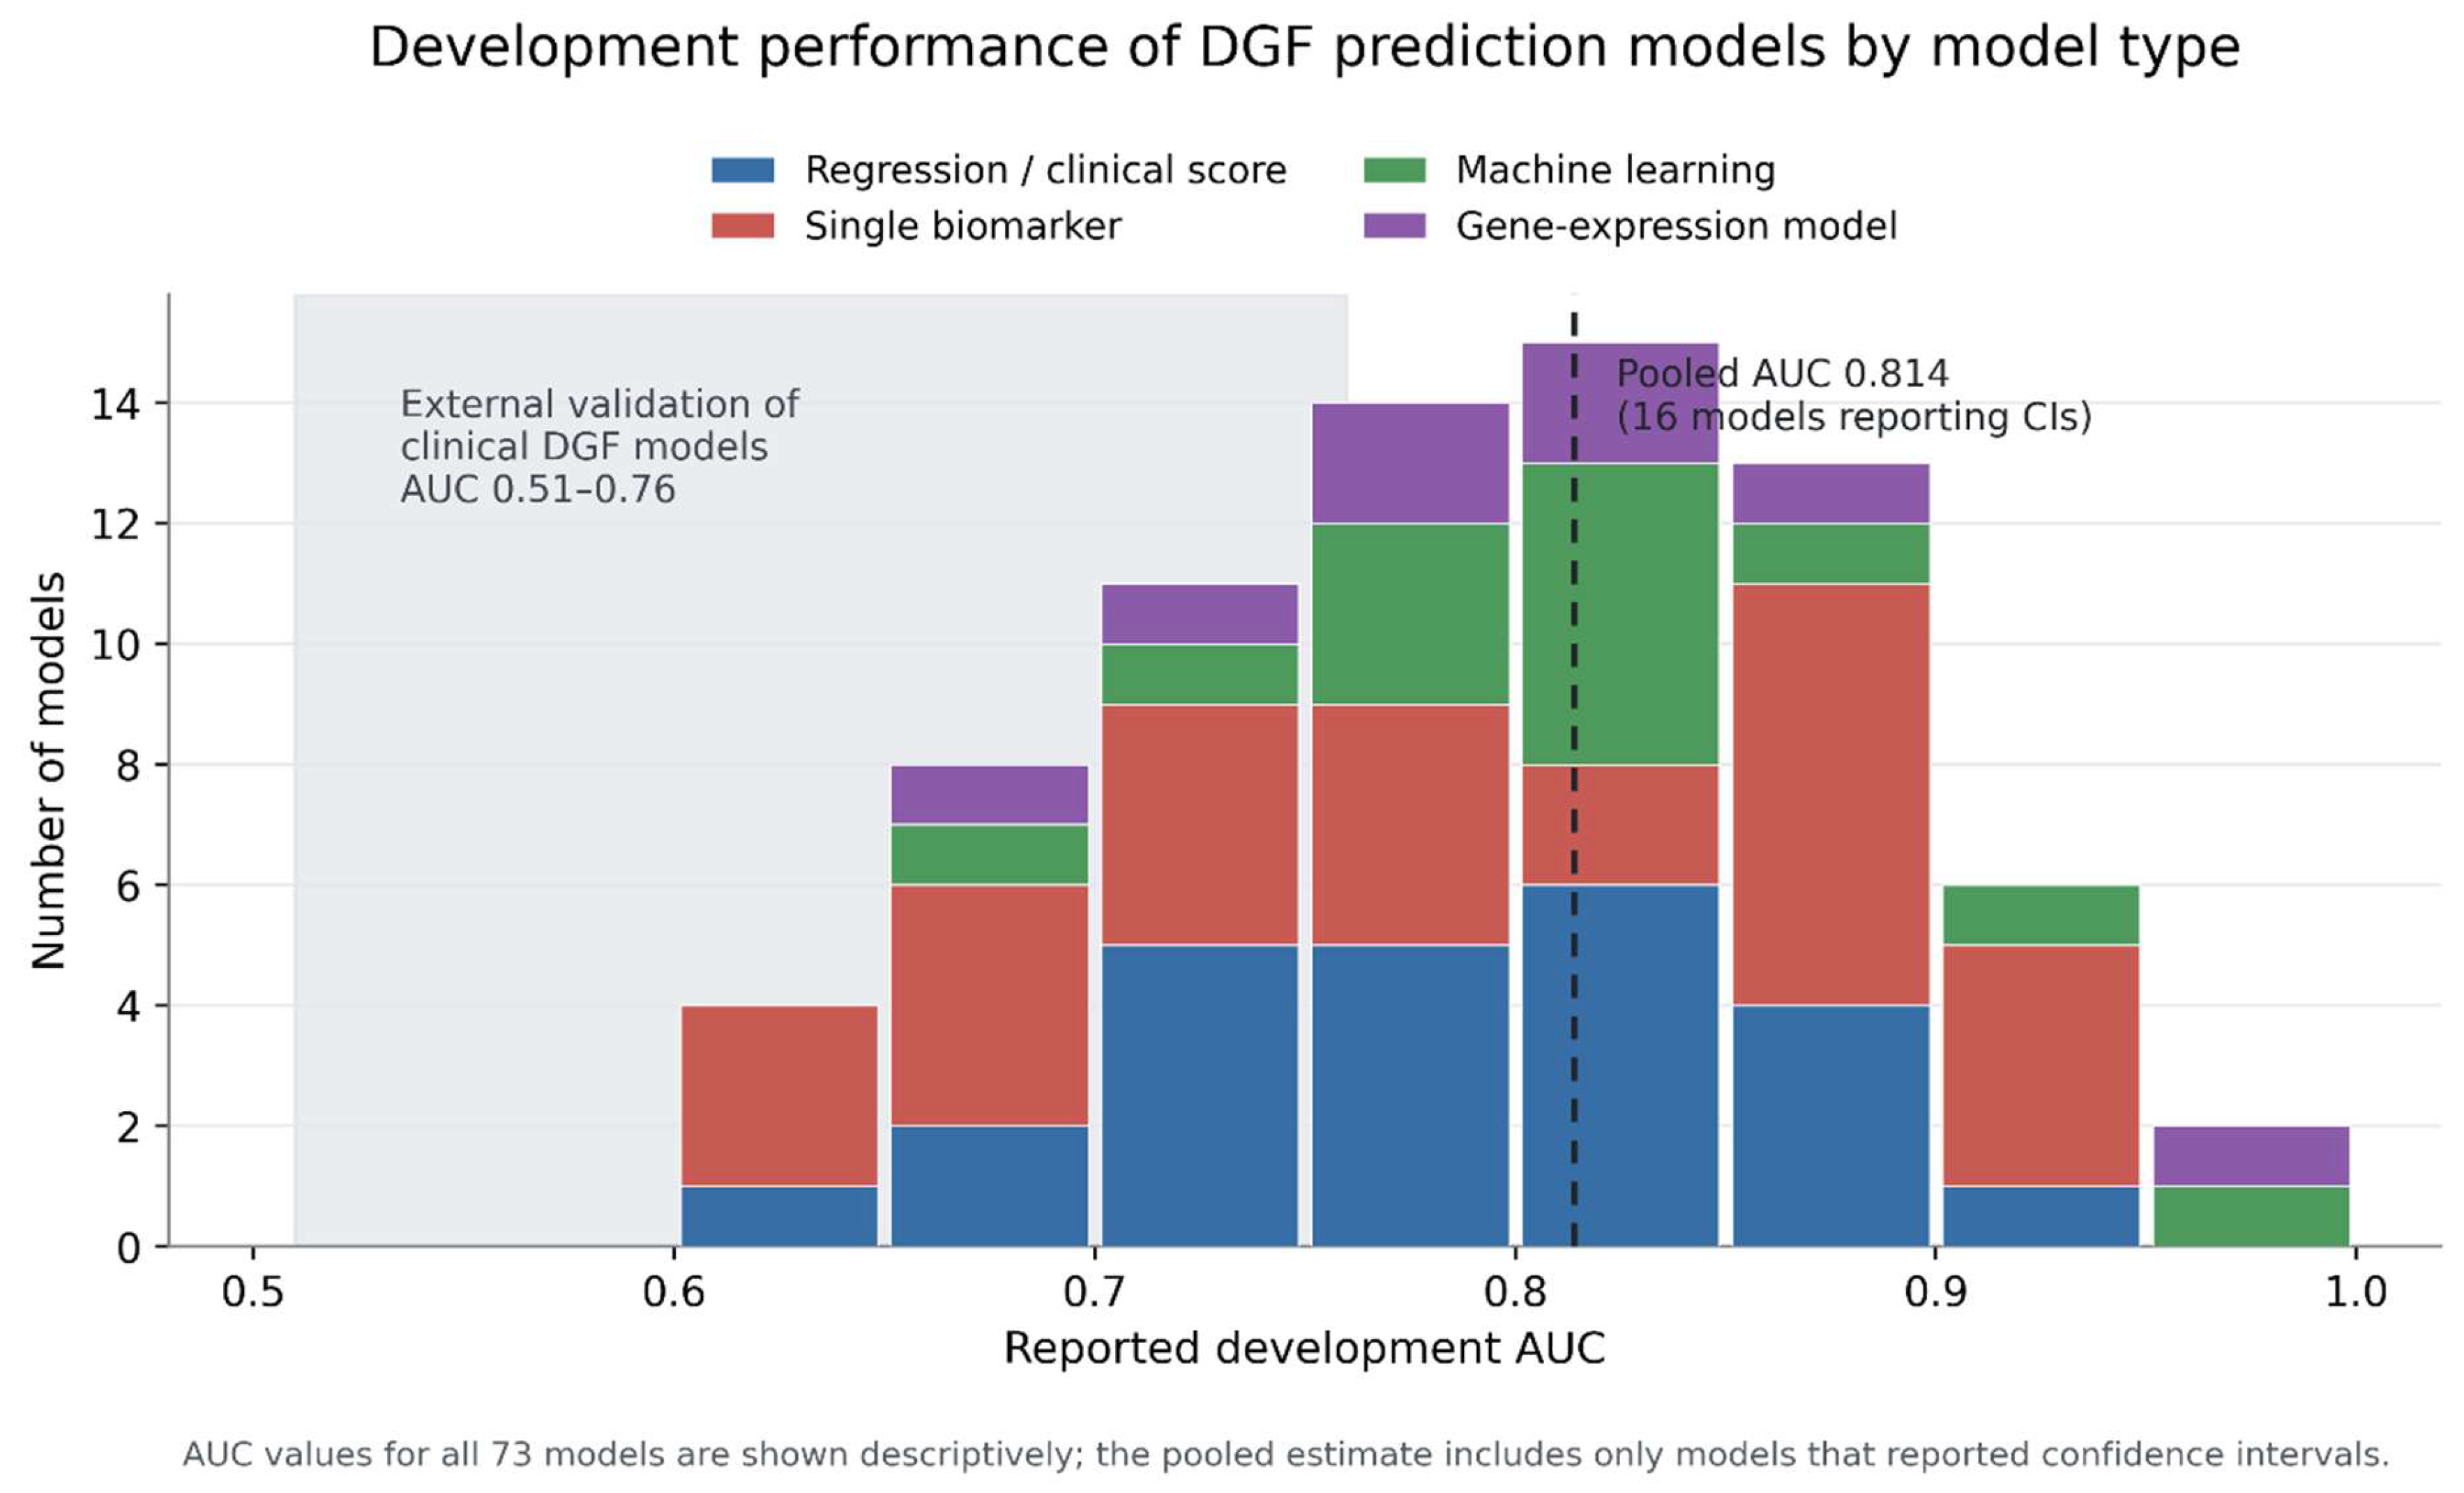
Figure 3.
Random-effects meta-analysis of DGF model discrimination.
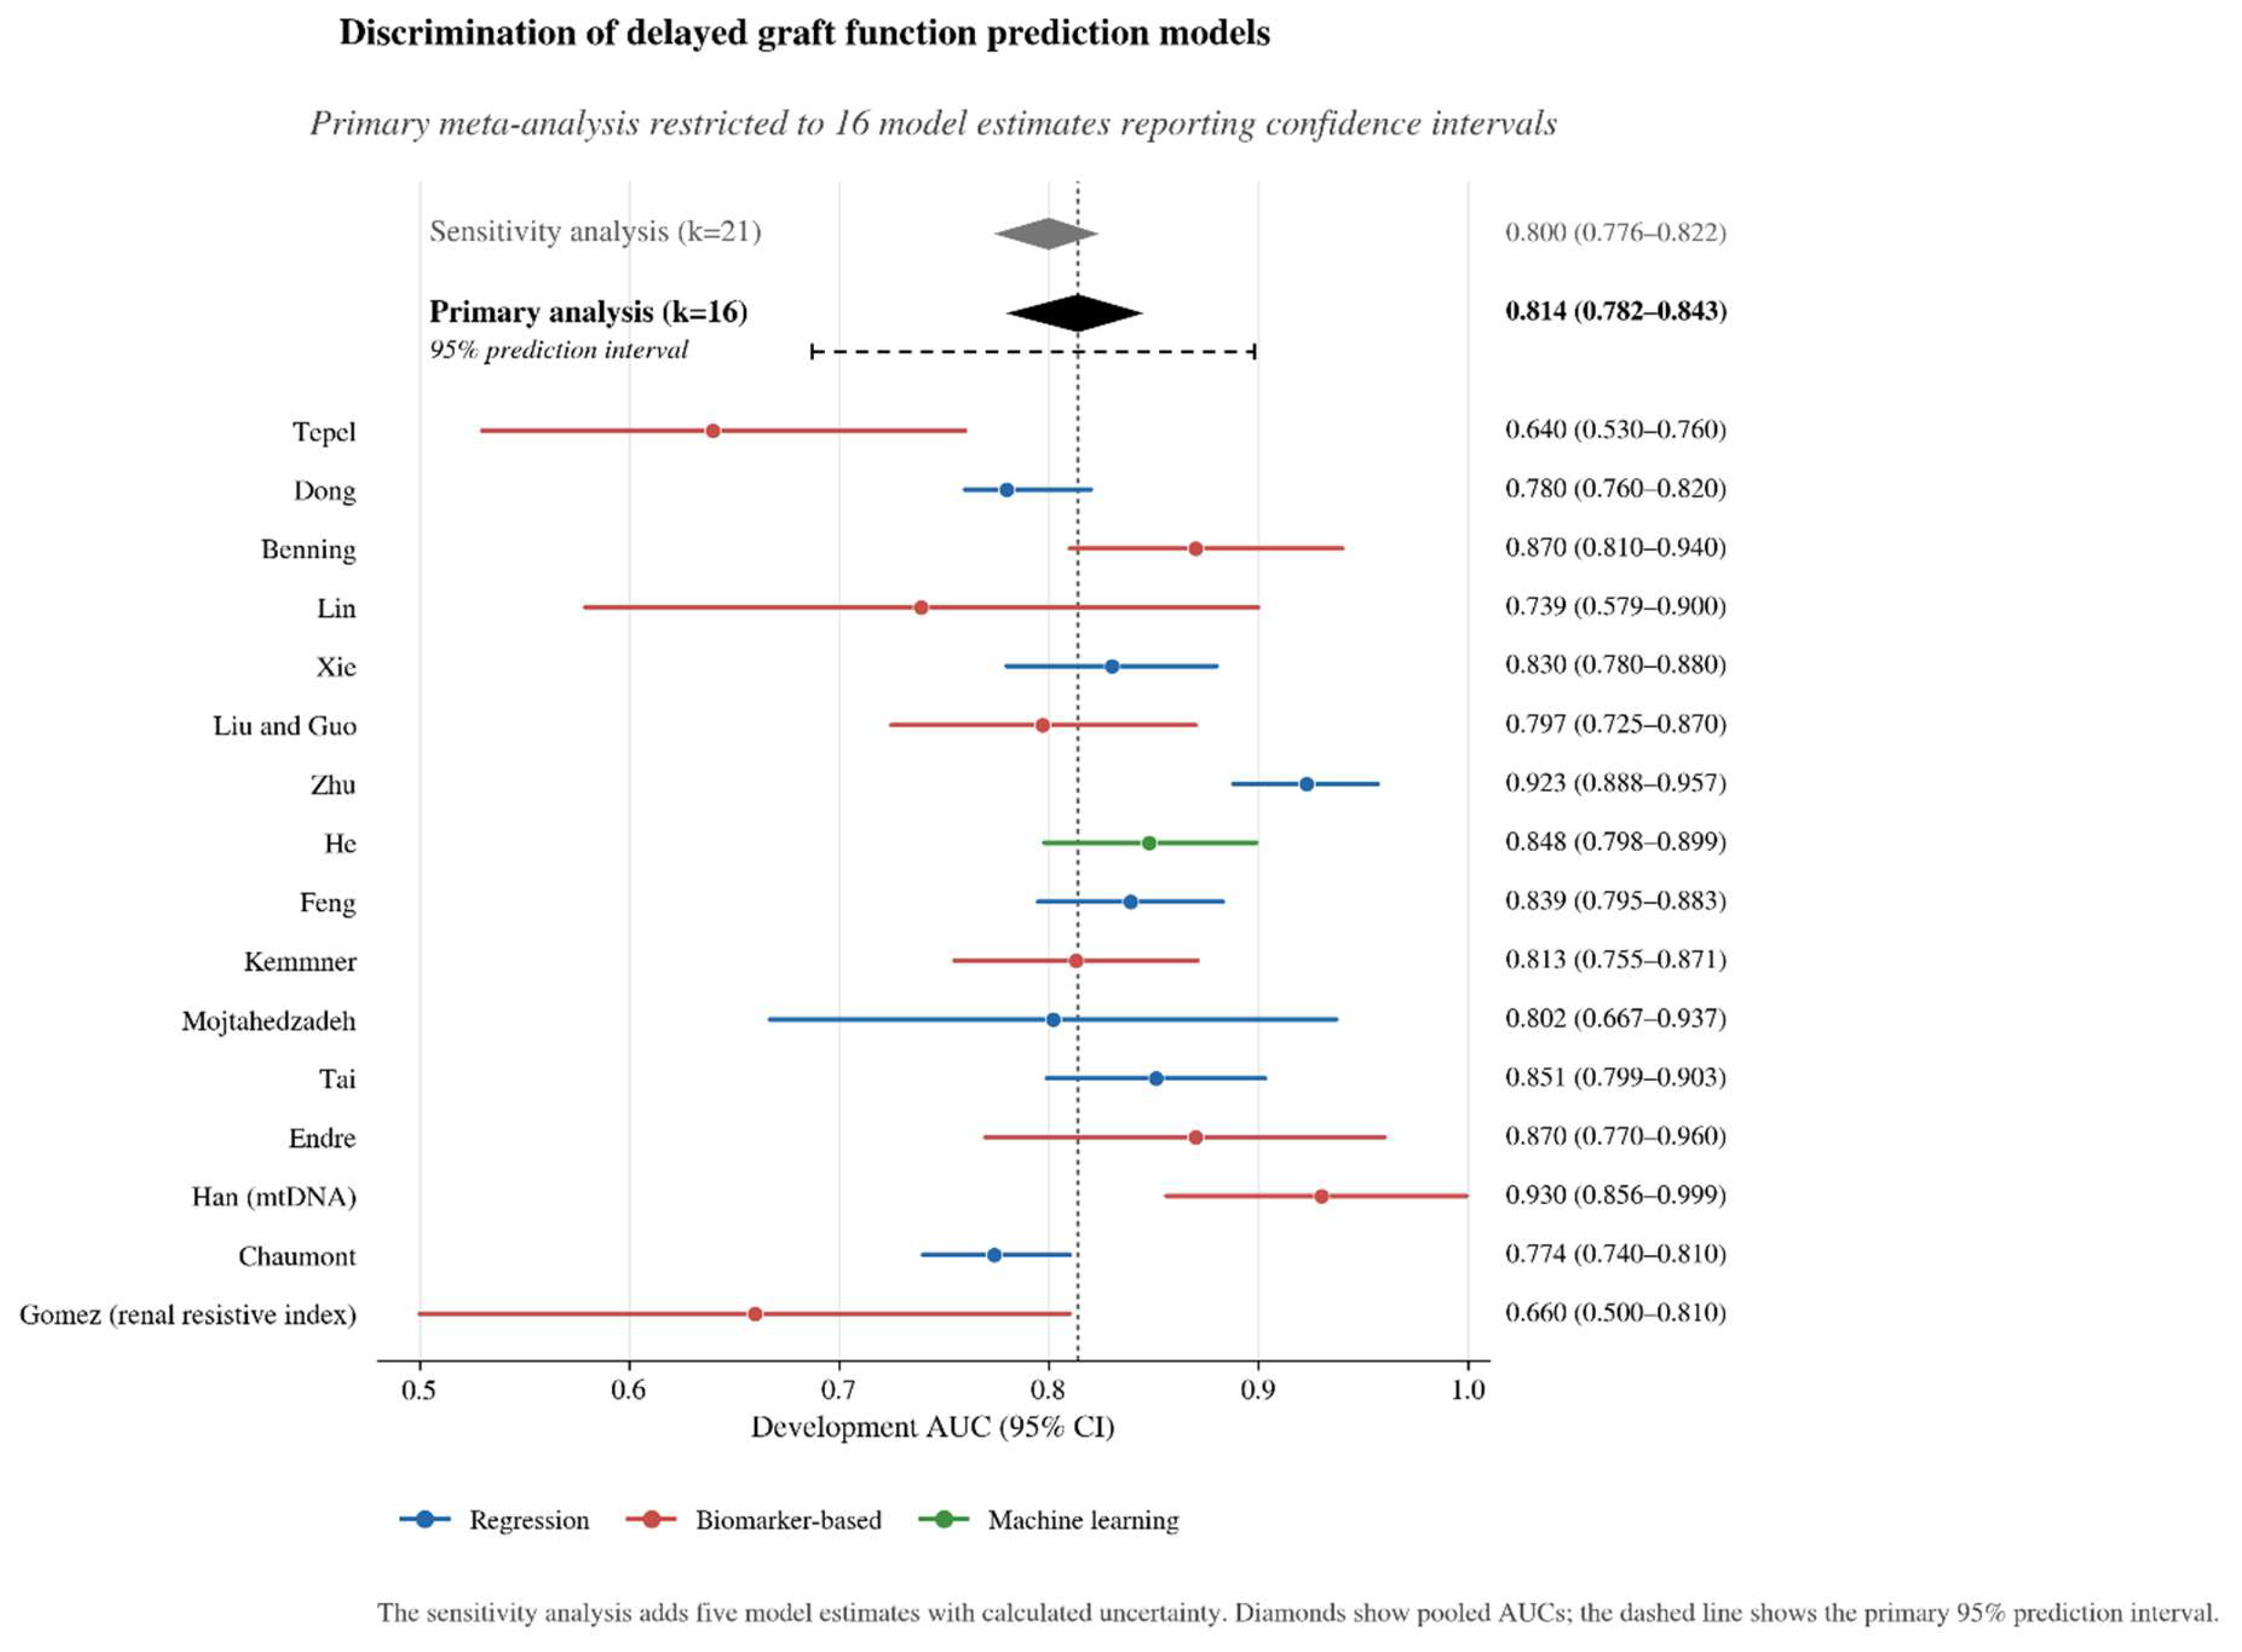
Figure 4.
Funnel plot of development AUCs for DGF prediction models. Filled circles represent 16 model estimates reporting confidence intervals and included in the primary Egger analysis. Open circles represent five additional estimates with calculated standard errors included only in the sensitivity analysis. The dashed line indicates the primary pooled AUC of 0.814. Egger’s intercept was 0.96 (p=0.29) in the primary analysis and 2.01 (p=0.006) in the sensitivity analysis.
Figure 4.
Funnel plot of development AUCs for DGF prediction models. Filled circles represent 16 model estimates reporting confidence intervals and included in the primary Egger analysis. Open circles represent five additional estimates with calculated standard errors included only in the sensitivity analysis. The dashed line indicates the primary pooled AUC of 0.814. Egger’s intercept was 0.96 (p=0.29) in the primary analysis and 2.01 (p=0.006) in the sensitivity analysis.
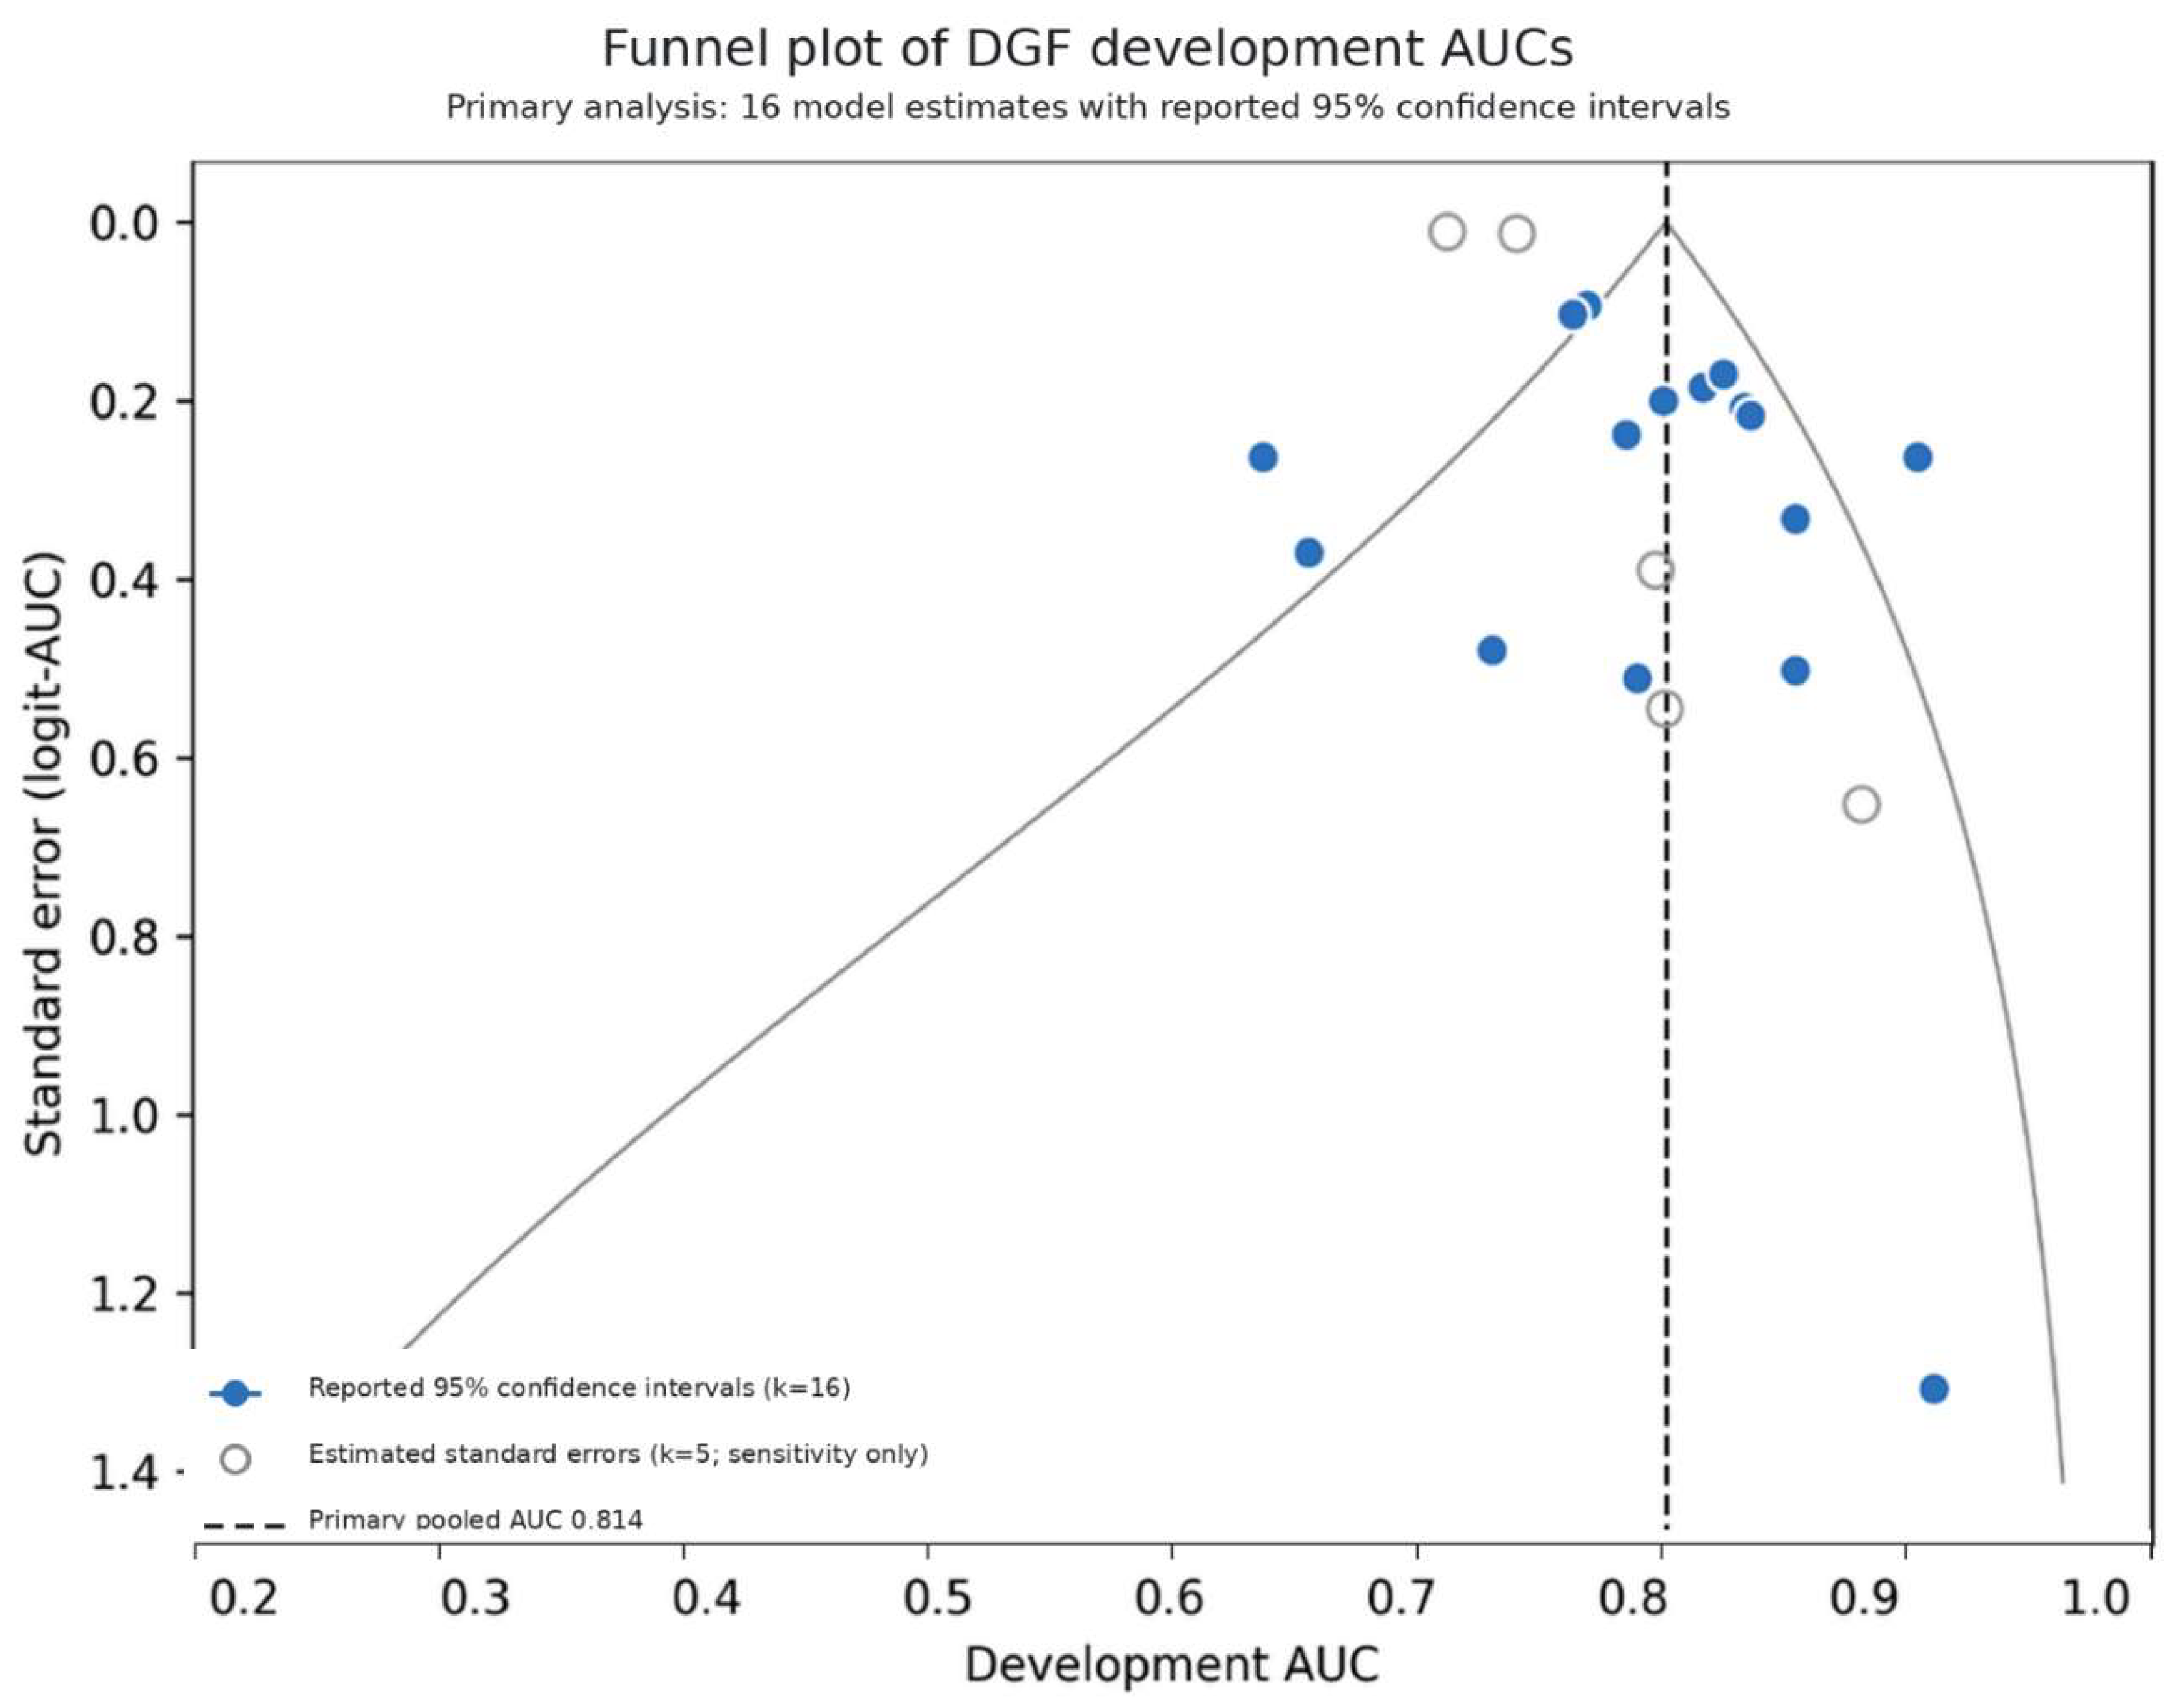
Figure 5.
Five-year graft-survival discrimination by study setting. Six registry-based models reported C-statistics ranging from 0.645 to 0.760. Their pooled C-statistic was 0.697 (95% CI, 0.677–0.716), indicated by the dashed line. Three single-center models reported C-statistics of 0.727, 0.897, and 0.904.
Figure 5.
Five-year graft-survival discrimination by study setting. Six registry-based models reported C-statistics ranging from 0.645 to 0.760. Their pooled C-statistic was 0.697 (95% CI, 0.677–0.716), indicated by the dashed line. Three single-center models reported C-statistics of 0.727, 0.897, and 0.904.
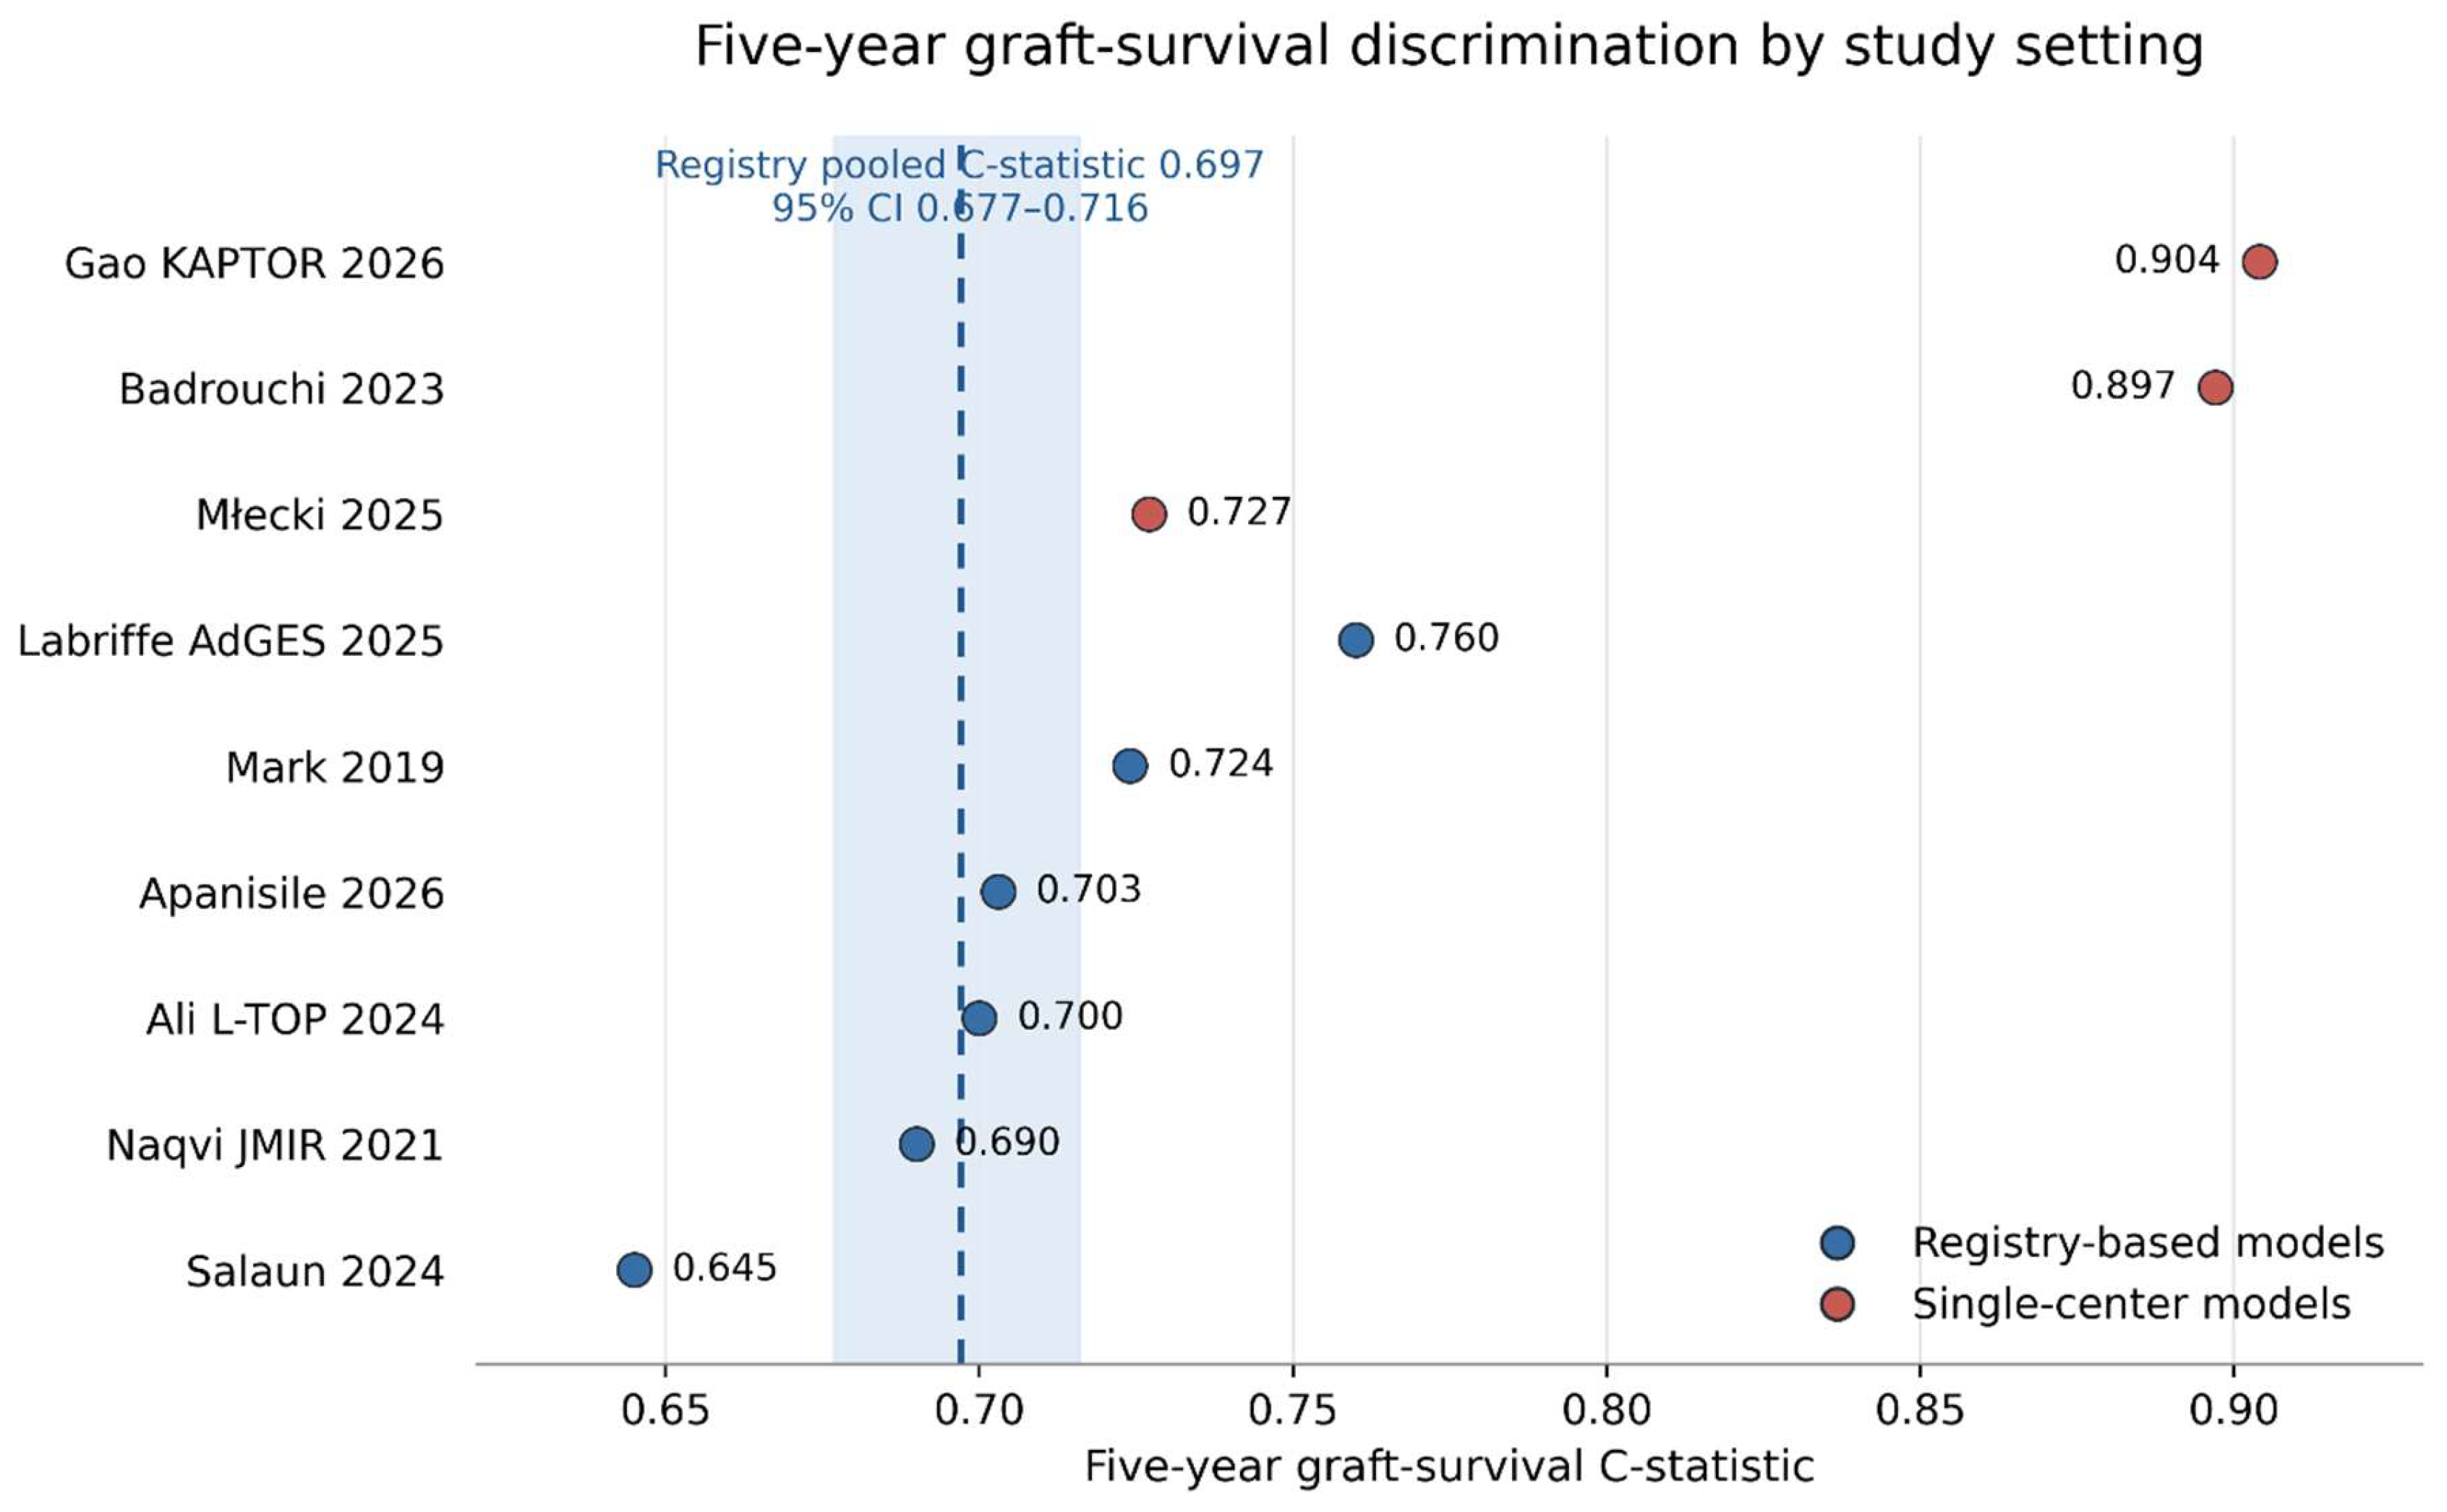
Figure 6.
Relationship between study size and the difference in discrimination between machine-learning and conventional regression models.
Figure 6.
Relationship between study size and the difference in discrimination between machine-learning and conventional regression models.
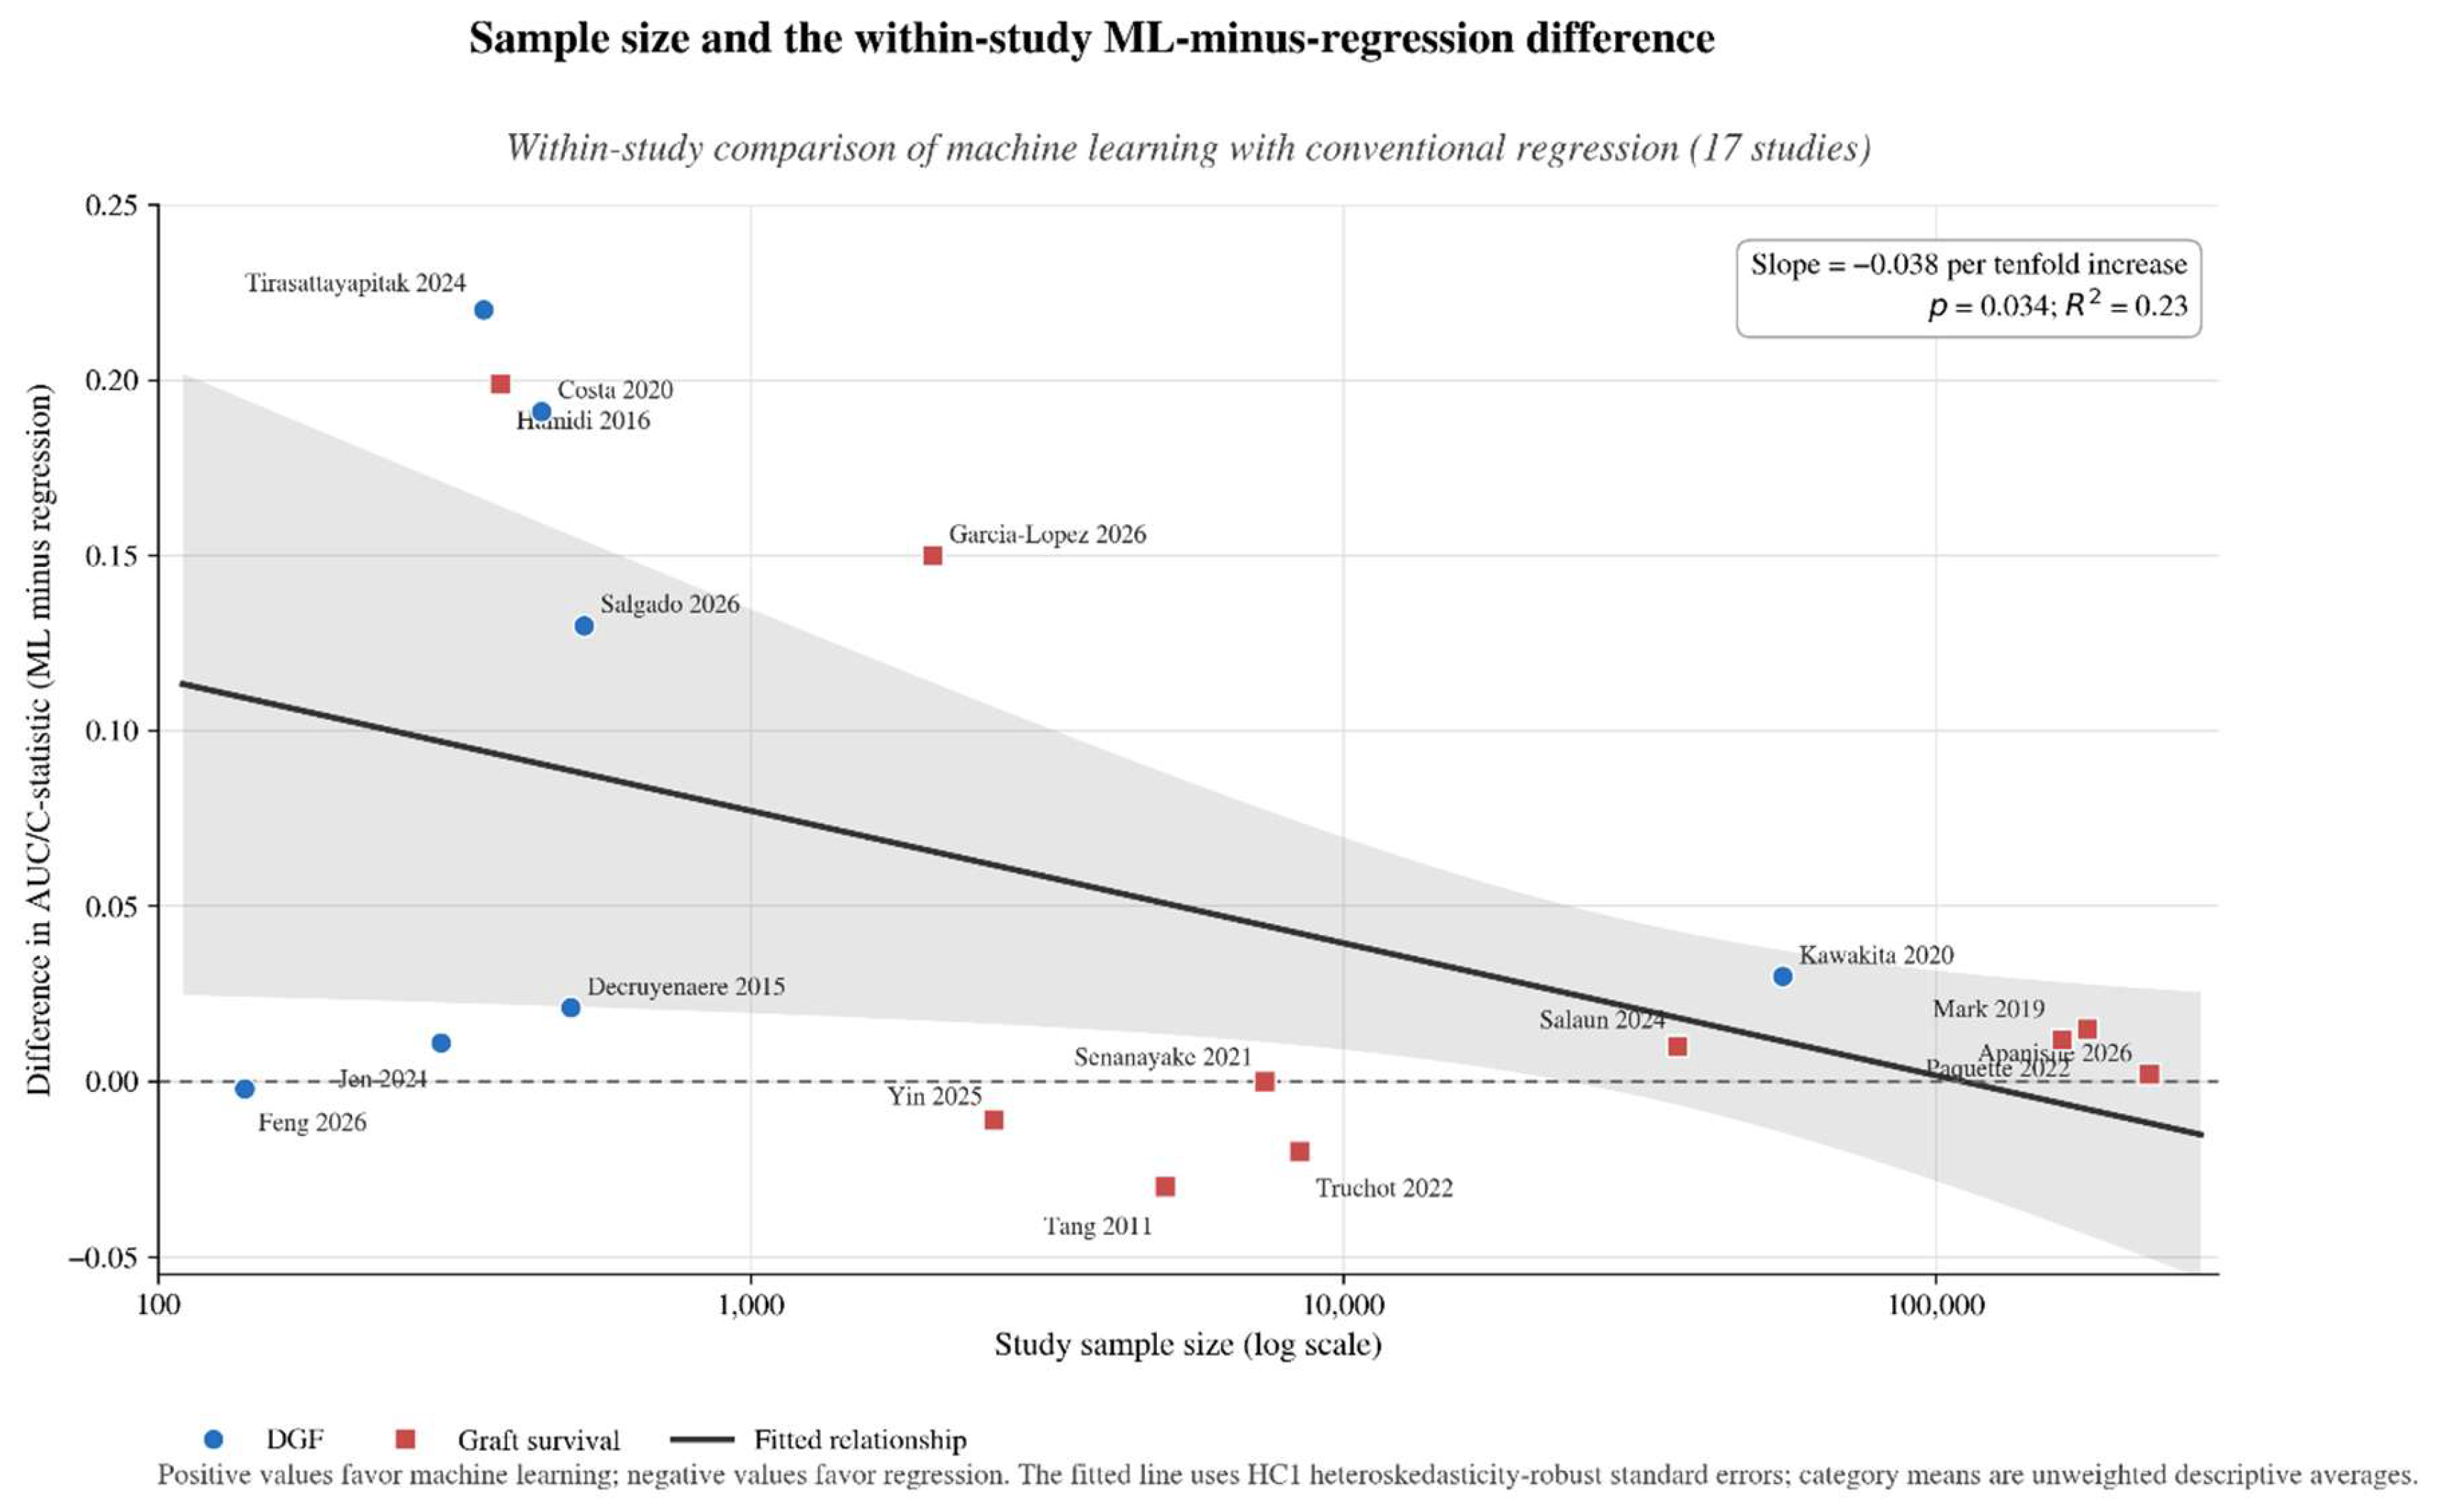
Figure 7.
Exploratory Network Meta-analysis of Graft-Survival Prediction Models.
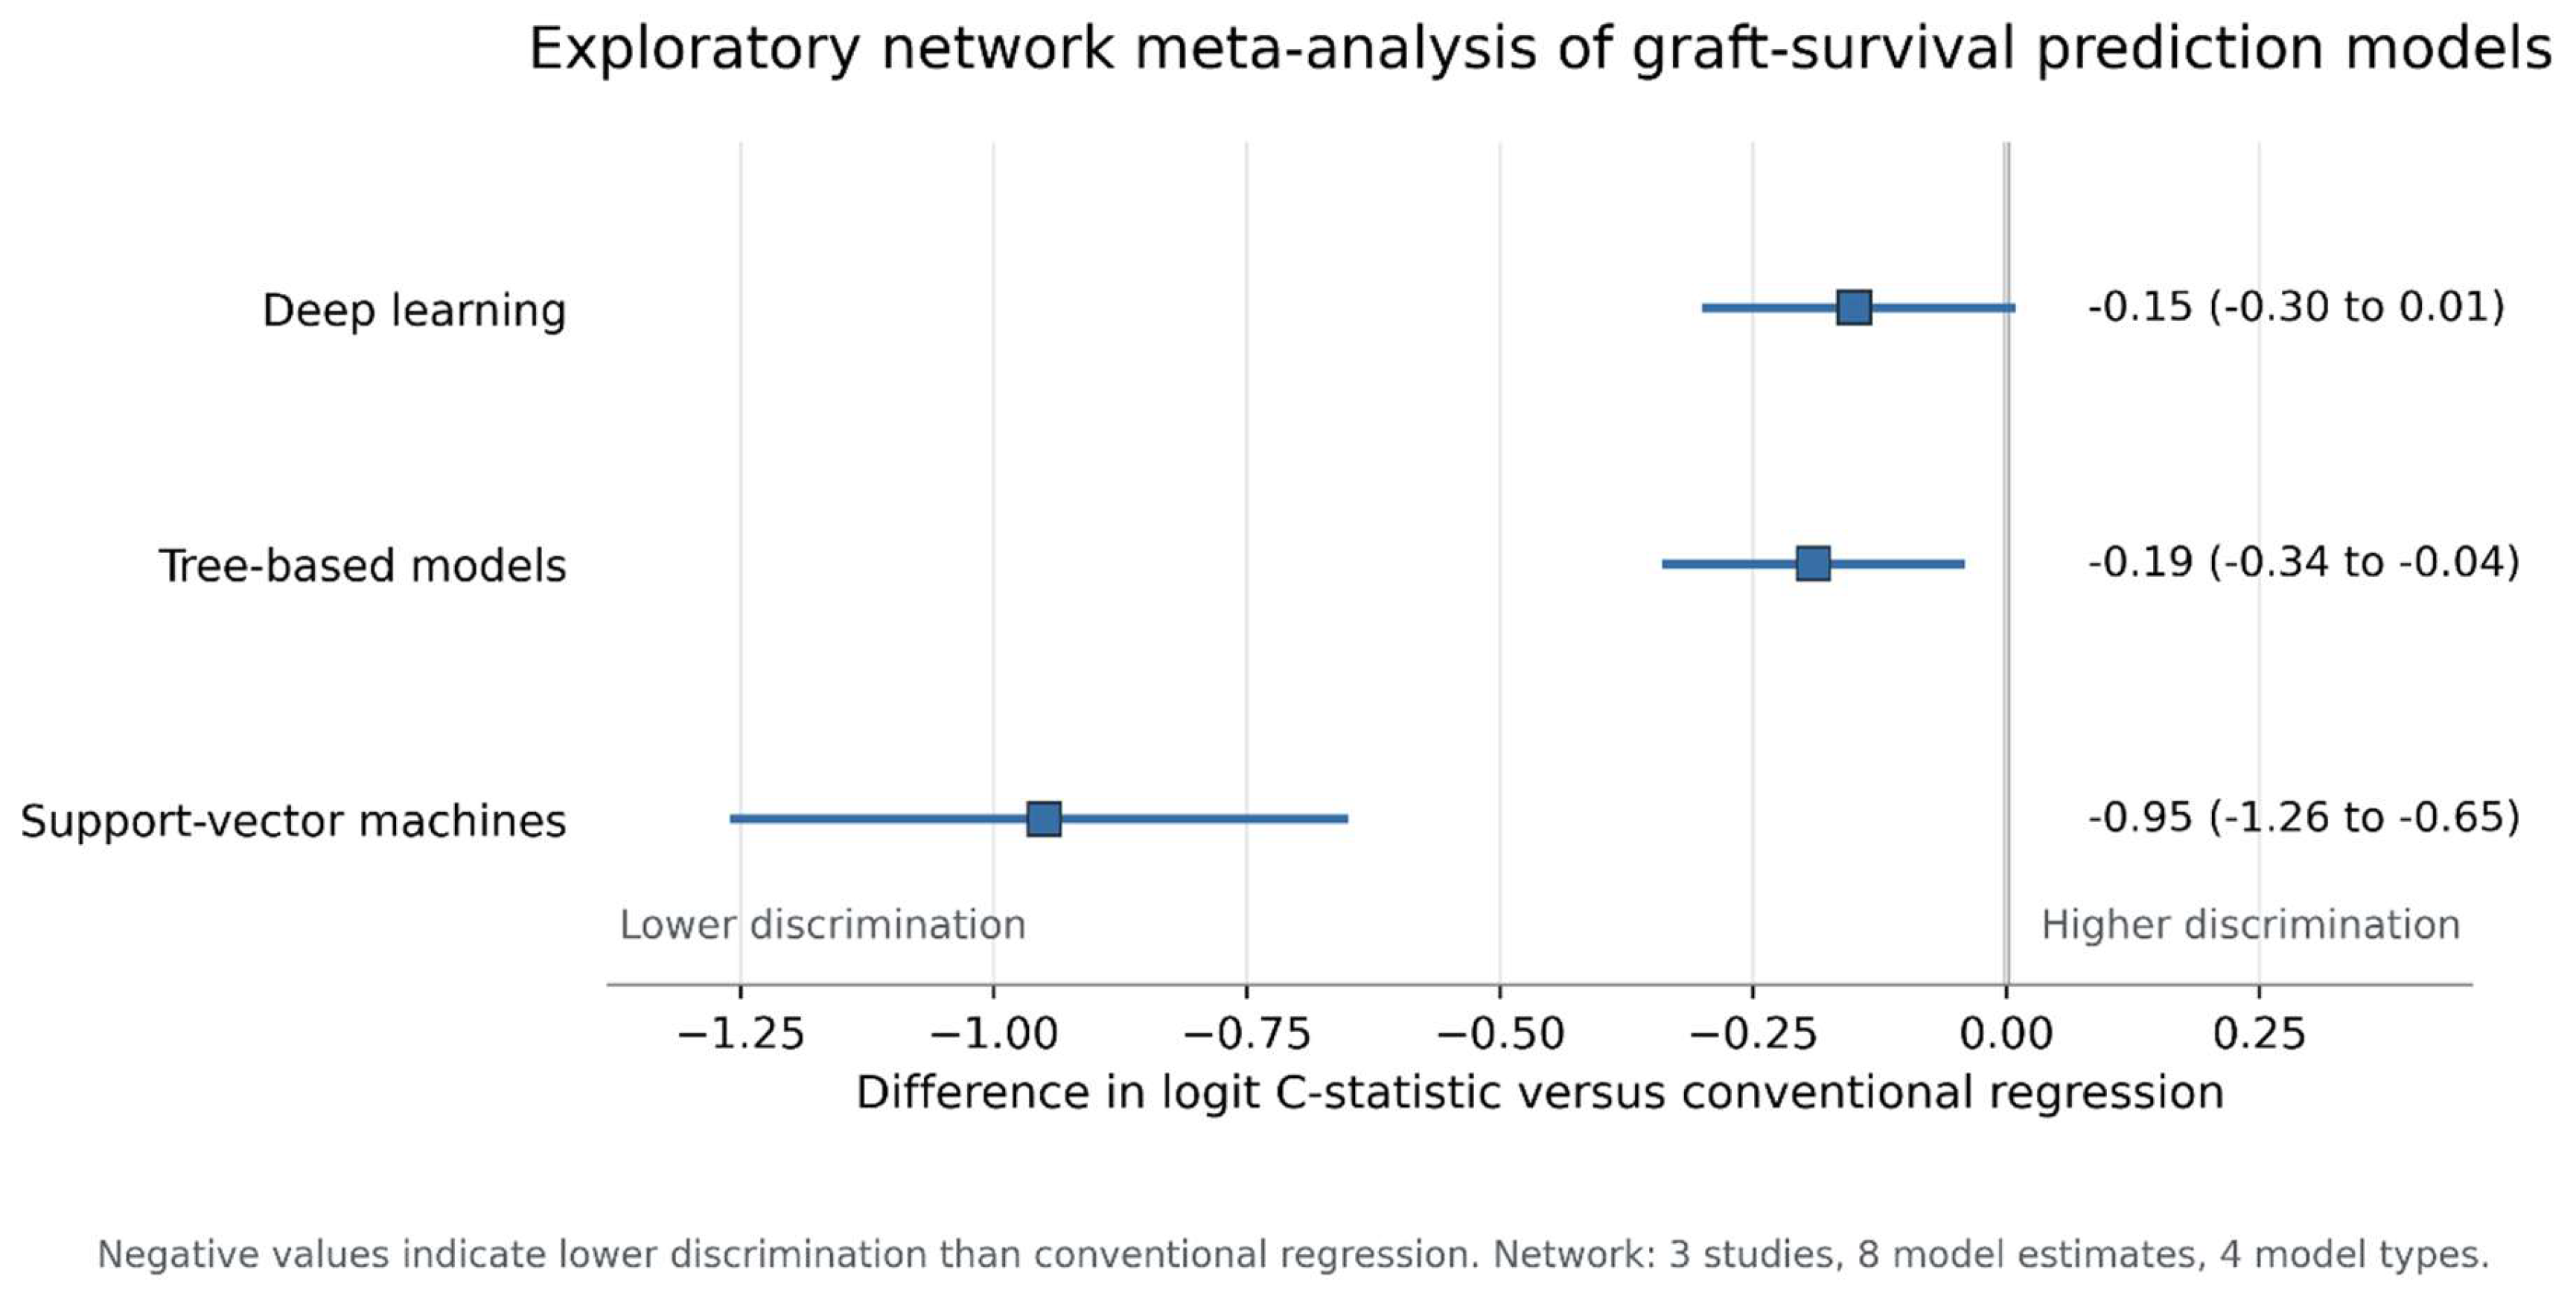
Figure 8.
A clinician’s guide to AI/ML model families in kidney-transplant prediction.
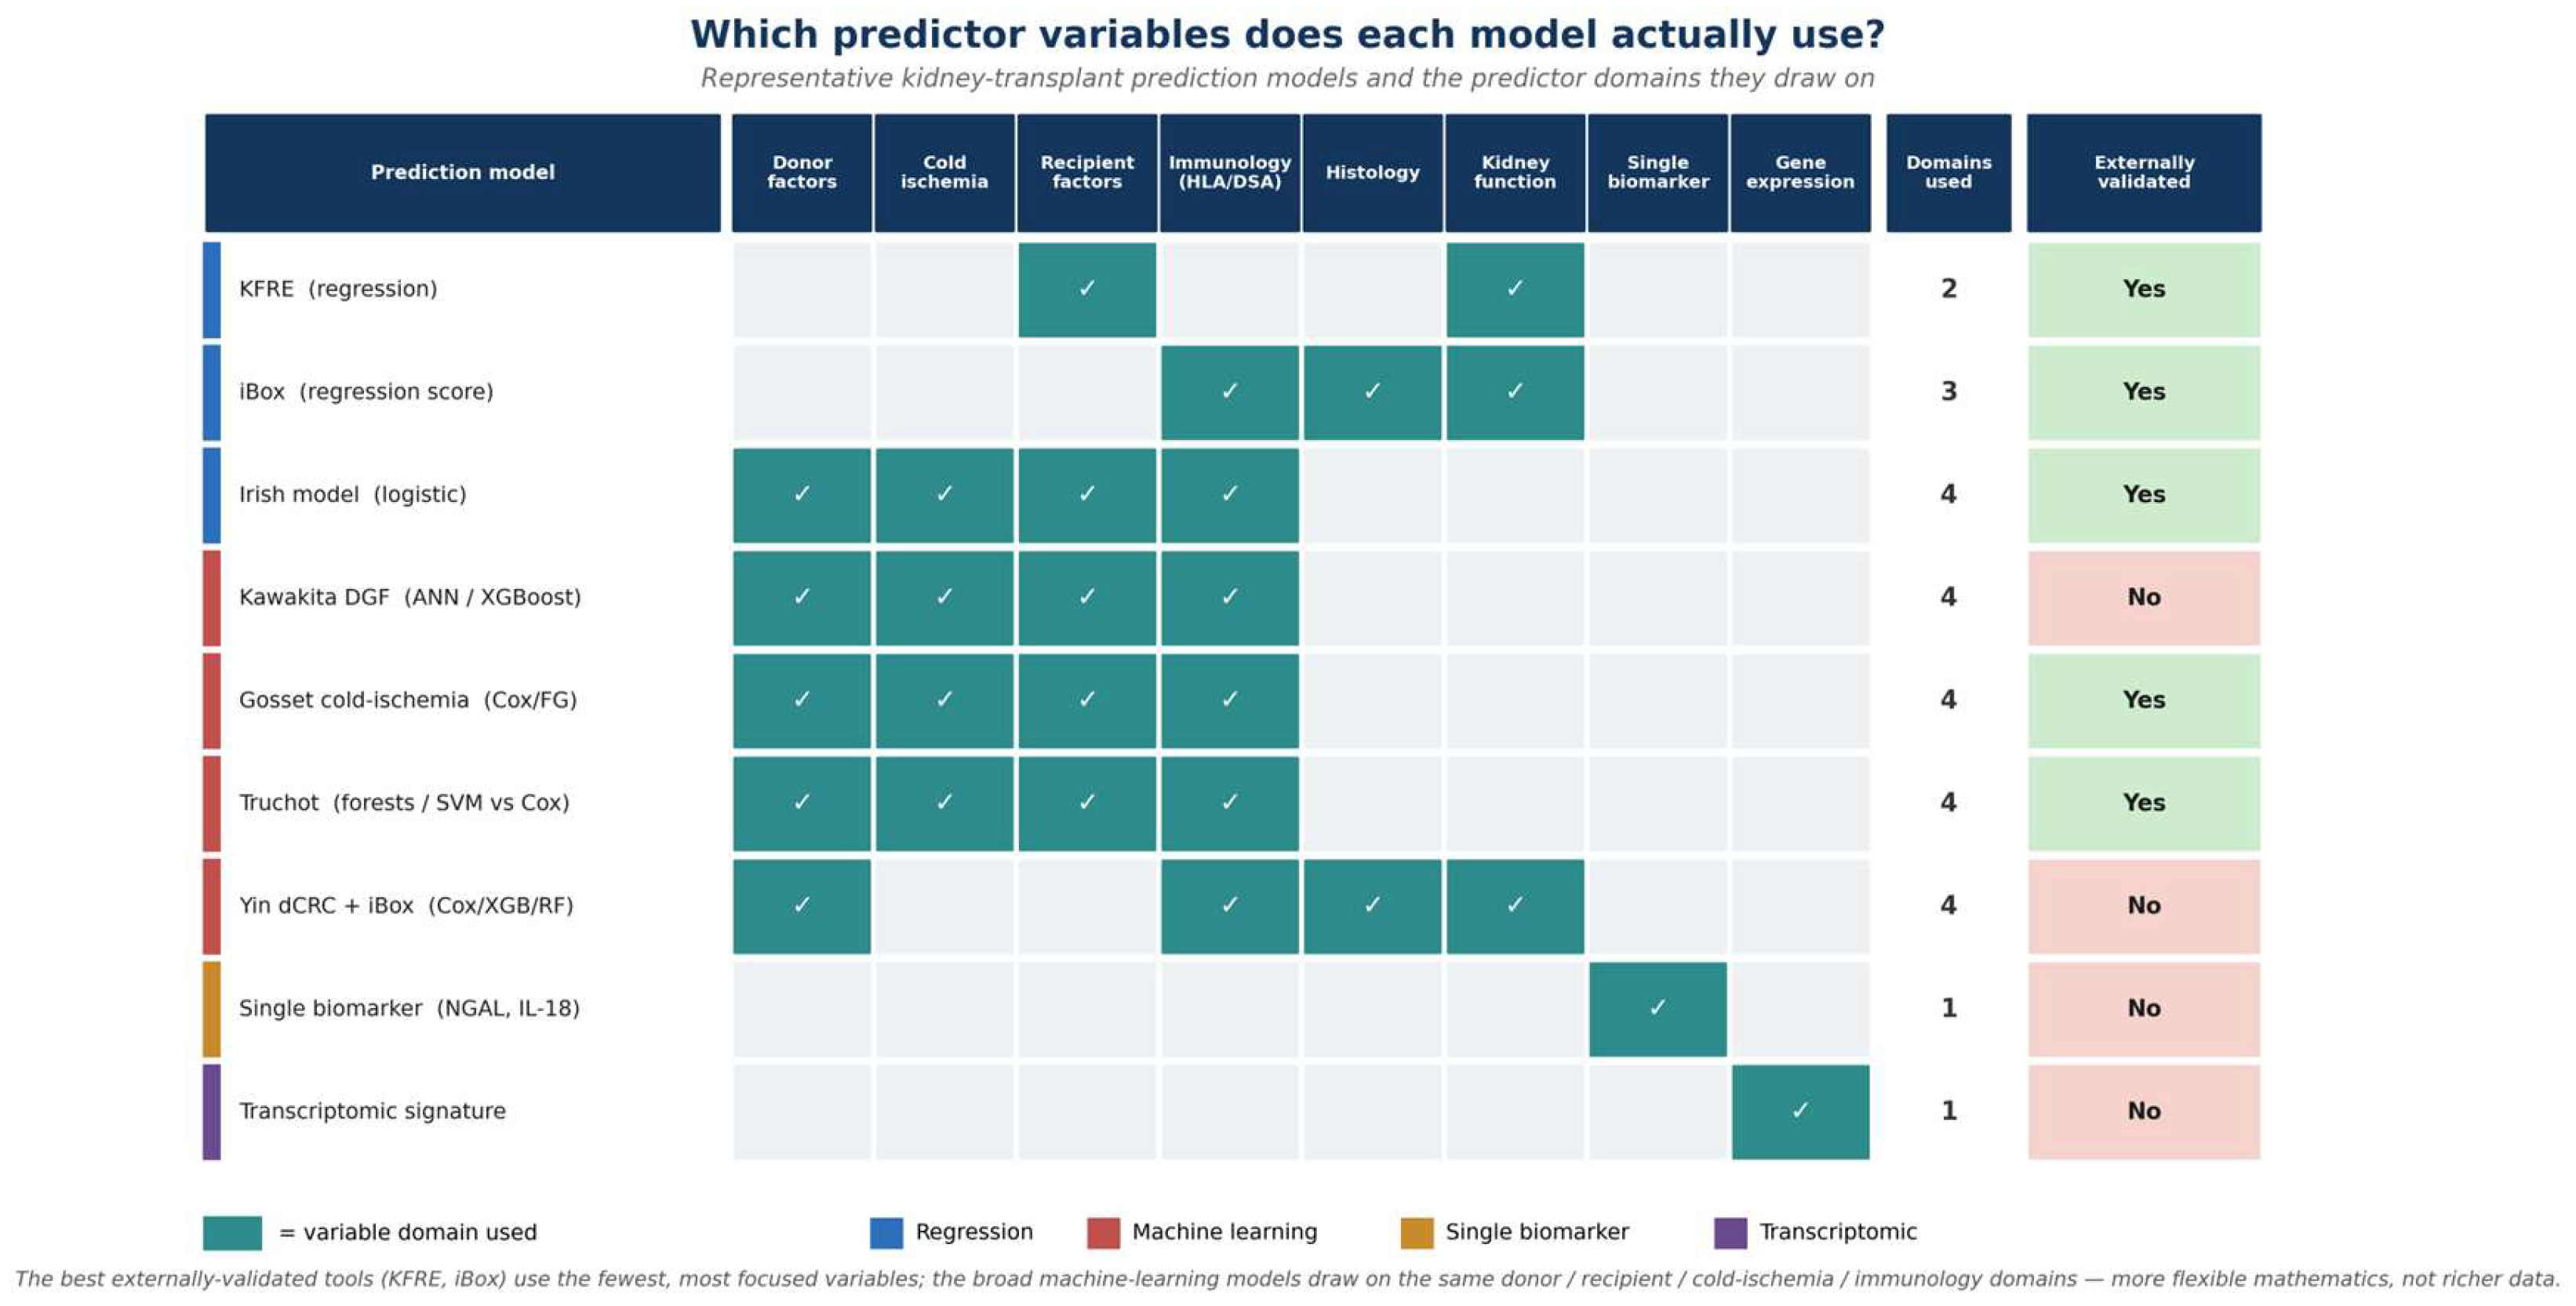

Table 1.
Summary of evidence by outcome.
| Evidence | Delayed graft function | Graft survival |
|---|---|---|
| PubMed/MEDLINE records identified | 380 | 107 |
| PubMed/MEDLINE records screened | 380 | 100 |
| Unique additional-database records screened* | 37 | 97 |
| Studies included | 98 | 51 |
| Model estimates with an available AUC or C-statistic | 73 | 40 |
| Model estimates included in the primary pooled analysis | 16 | 23† |
| Model estimates included after estimating missing uncertainty | 21 | — |
| Studies included in the model-type network analysis | None | 3 studies; 8 estimates; 4 model classes |
| External-validation estimates | 9‡ | 6 |
Table 2.
Summary of model discrimination for delayed graft function and graft survival.
| Outcome and analysis | k | Discrimination (95% CI) | (I^2) | 95% prediction interval |
|---|---|---|---|---|
| Delayed graft function | ||||
| Primary meta-analysis: estimates reporting a CI | 16 | AUC 0.814 (0.782–0.843) | 69% | 0.687–0.898 |
| Sensitivity analysis: five additional estimates with calculated uncertainty | 21 | AUC 0.800 (0.776–0.822) | 86% | 0.709–0.868 |
| Conventional regression* | 10 | AUC 0.789 (0.767–0.810) | 94.5% | — |
| Biomarker-based models* | 8 | AUC 0.783 (0.712–0.840) | 59.4% | — |
| Machine-learning models* | 3 | AUC 0.838 (0.786–0.879) | 0% | — |
| Single-center development models† | 63 | Median AUC 0.814 | — | — |
| Registry or multicenter development models† | 10 | Median AUC 0.728 | — | — |
| External validation of clinical models‡ | 5 | AUC range 0.51–0.76; median 0.69 | — | — |
| External validation of biomarker or transcriptomic models§ | 4 | AUC range 0.70–0.88; median 0.82 | — | — |
| Graft survival: registry-based models | ||||
| 1 year | 6 | C-statistic 0.762 (0.698–0.816) | 100% | 0.491–0.914 |
| 2 years | 3 | C-statistic 0.744 (0.722–0.765) | 15% | 0.530–0.883 |
| 3 years | 3 | C-statistic 0.717 (0.686–0.746) | 98% | 0.271–0.945 |
| 5 years | 6 | C-statistic 0.697 (0.677–0.716) | 98% | 0.625–0.760 |
| 7 years | 4 | C-statistic 0.743 (0.731–0.755) | 36% | 0.701–0.782 |
| 10 years | 6 | C-statistic 0.723 (0.690–0.753) | 99% | 0.592–0.824 |
| Graft survival: single-center models | ||||
| 5 years† | 3 | C-statistic range 0.727–0.904; median 0.897 | — | — |
Table 3.
External validation estimates of clinical prediction tools.
| Prediction tool and validation cohort | Outcome | External AUC/C-statistic | Reference |
| Delayed graft function models | |||
| Irish 2010 model—Belgian cohort | DGF | 0.69 | [14] |
| Jeldres nomogram—same Belgian cohort | DGF | 0.54 | [14] |
| Chapal model—same Belgian cohort | DGF | 0.51 | [14] |
| Irish 2010 model—Netherlands multicenter cohort (Kers) | DGF | 0.76 | [23] |
| Irish 2010 model—Chinese single-center cohort (Zhang) | DGF | 0.74 | [24] |
| Graft-survival or graft-failure models | |||
| Kidney Failure Risk Equation—FAVORIT cohort | Graft loss | 0.81–0.85 | [25] |
| iBox—external appraisal | Graft failure | Approximately 0.81 | [26] |
| Maximum cold-ischemia model—external validation cohort | Allograft failure | 0.66 | [27] |
Table 4.
Exploratory network meta-analysis of model types for graft-survival prediction.
| Model type | Studies, k | Difference in logit C-statistic versus regression (95% CI) | p value | Approximate difference in C-statistic* | P-score |
| Conventional regression | 3 | Reference | — | — | 0.99 |
| Deep learning | 1 | −0.15 (−0.30 to 0.01) | 0.066 | −0.028 | 0.59 |
| Tree-based models | 3 | −0.19 (−0.34 to −0.04) | 0.013 | −0.037 | 0.43 |
| Support-vector machines | 1 | −0.95 (−1.26 to −0.65) | <0.001 | −0.214 | 0.00 |
Table 5.
Methodological and reporting characteristics of DGF prediction models reporting a development AUC.
Table 5.
Methodological and reporting characteristics of DGF prediction models reporting a development AUC.
| Characteristic | Models, n/N (%) |
|---|---|
| Developed in a single-center cohort | 63/73 (86%) |
| Developed in a registry or multicenter cohort | 10/73 (14%) |
| Reported a 95% CI for the AUC | 16/73 (22%) |
| Did not report a 95% CI for the AUC | 57/73 (78%) |
| Underwent independent external validation | 3/73 (4%) |
| Did not undergo independent external validation | 70/73 (96%) |
| Reported calibration in any form | 10/73 (14%) |
| Did not report calibration | 63/73 (86%) |
| Used data-driven predictor, cutoff, or model-configuration selection | At least 18/73 (25%) |
| Included a predictor measured after the outcome window began | At least 9/73 (12%) |
Table 6.
PROBAST risk-of-bias assessment of 73 DGF prediction models.
| PROBAST domain | Low risk, n (%) | Unclear risk, n (%) | High risk, n (%) |
|---|---|---|---|
| Participants | 8 (11%) | 57 (78%) | 8 (11%) |
| Predictors | 5 (7%) | 46 (63%) | 22 (30%) |
| Outcome | 17 (23%) | 25 (34%) | 31 (42%) |
| Analysis | 1 (1%) | 0 | 72 (99%) |
| Overall | 0 | 1 (1%) | 72 (99%) |
Table 7.
Questions to Ask Before Using a Kidney-Transplant Prediction Model.
| Question | Why it matters |
|---|---|
| Was the model externally validated? | Performance should be tested in patients who were not used to develop the model, preferably at different centers. |
| Was calibration reported? | A model may rank patients correctly but still overestimate or underestimate actual risk. |
| Was the development cohort sufficiently large? | Small cohorts increase the risk of overfitting and unstable performance estimates. |
| Were the predictors available at the intended time of use? | A model should not use information collected after the outcome period has begun. |
| Did the model improve on an existing validated approach? | Greater complexity is useful only if it improves prediction, calibration, or clinical decision-making. |
Disclaimer/Publisher’s Note: The statements, opinions and data contained in all publications are solely those of the individual author(s) and contributor(s) and not of MDPI and/or the editor(s). MDPI and/or the editor(s) disclaim responsibility for any injury to people or property resulting from any ideas, methods, instructions or products referred to in the content. |
© 2026 by the authors. Licensee MDPI, Basel, Switzerland. This article is an open access article distributed under the terms and conditions of the Creative Commons Attribution (CC BY) license (http://creativecommons.org/licenses/by/4.0/).
Copyright: This open access article is published under a Creative Commons CC BY 4.0 license, which permit the free download, distribution, and reuse, provided that the author and preprint are cited in any reuse.