

Submitted:
18 August 2026
Posted:
19 August 2026
You are already at the latest version
Abstract
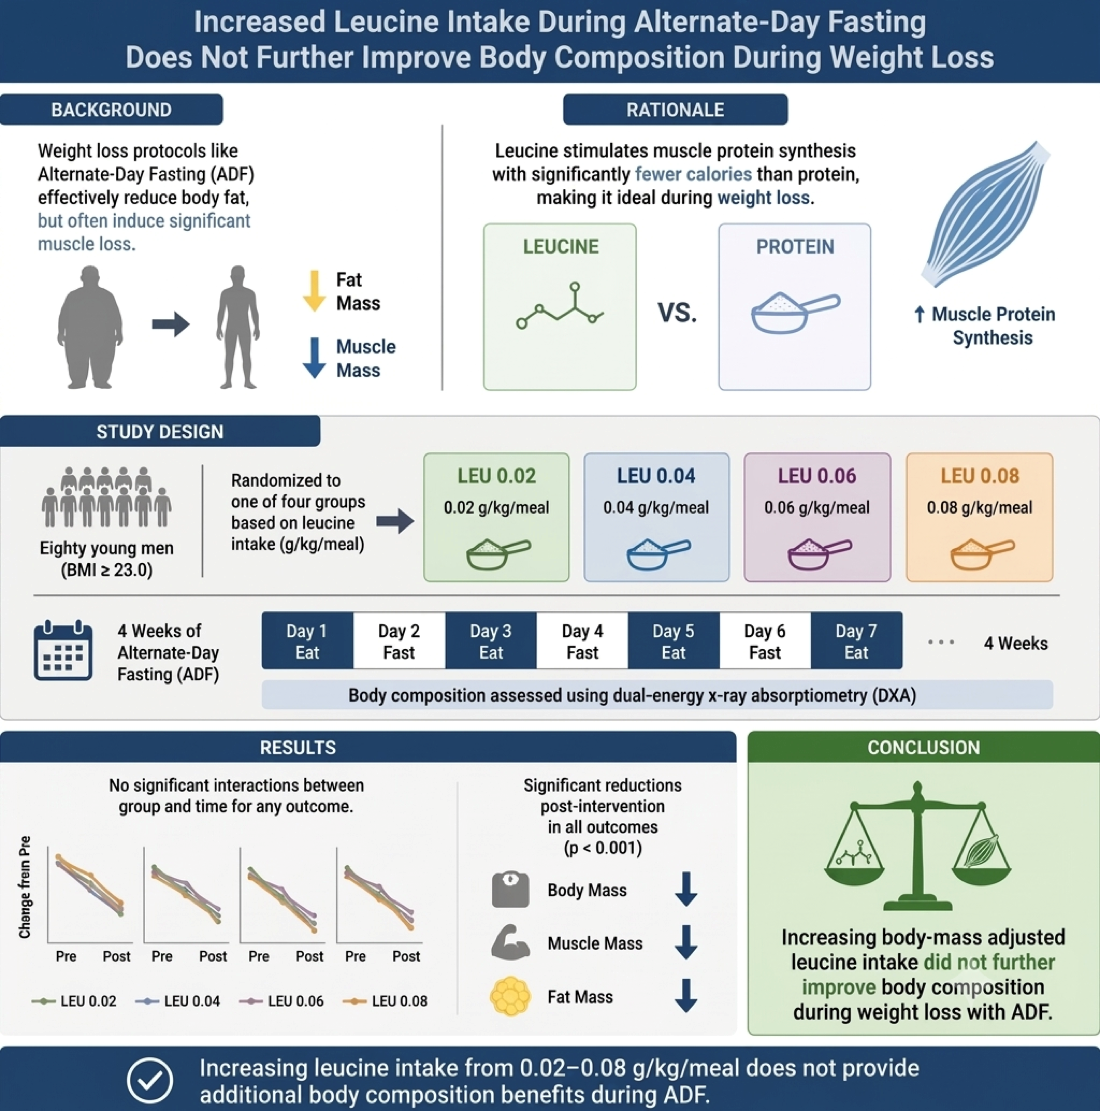
Background: Obesity is a global public health crisis. While weight loss protocols like alternate-day fasting (ADF) effectively reduce body mass, they often cause significant muscle loss. Research suggests that leucine may better preserve muscle than protein, stimulating muscle protein synthesis with far fewer calories than protein, making it ideal during weight loss. However, the optimal dose for leucine is unclear. Objective: This study investigates how body-mass-adjusted leucine intake affects body composition and health biomarkers during ADF. By controlling total dietary, protein, and leucine intake, this study aimed to identify an optimal dose-response relationship. Methods: Eighty young men (BMI ≥ 23.0 kg/m2) were randomly assigned to one of four groups based on leucine intake (0.02, 0.04, 0.06, and 0.08 g/kg/meal). They underwent four weeks of ADF, alternating between feeding and fasting days (125% and 25% of caloric needs, respectively). Body composition was assessed using dual-energy x-ray absorptiometry. Health biomarkers—resting blood pressure, lipid profile, fasting blood glucose, insulin, and insulin resistance—were also assessed. Results: There were no significant interaction effects for any body composition or health measure (p > 0.05), except for HDL cholesterol (p = 0.028). There were significant main effects of time (p < 0.05) with reductions in all body composition measures and other biomarkers, except for bone mineral density (p = 0.992). Conclusions: ADF is safe and effective for weight loss, cardiovascular and diabetic health in young men. Increasing body-mass-adjusted leucine intake failed to further improve body composition, muscle preservation, or health markers.
Keywords:
leucine
; alternate-day fasting
; intermittent fasting
; weight loss
; muscle preservation
; skeletal muscle
; body composition
; fat mass
; HOMA-IR
; insulin
1. Introduction
Overweight and obesity are rapidly growing public health concerns, affecting more than 2.5 billion and almost one billion people worldwide, respectively [1]. As major risk factors for chronic health conditions such as diabetes, heart disease, and cancer [2], their rising prevalence necessitates an urgent need for effective prevention and management strategies. Various weight loss diets, such as the increasingly popular alternate-day fasting (ADF) protocol, can help address overweight and obesity [3,4,5,6]. However, weight loss by diet alone is often accompanied by significant muscle loss [5], including ADF-induced weight loss [6], which is concerning given the importance of skeletal muscle for metabolic functions and health.
To attenuate the muscle loss associated with diet-induced weight loss, dietary and supplemental protein interventions have been explored, but findings are generally inconclusive [7,8,9,10]. In our recent paper comparing four weeks of ADF with and without protein supplementation provided on fasting days [11], we found that 25 g of whey protein supplementation on fasting days was insufficient to attenuate muscle loss associated with ADF-induced weight loss.
More recently, leucine, an essential amino acid, has been suggested to be even more important than protein in improving muscular outcomes [12,13,14,15,16,17], due to its pronounced effects on promoting muscle protein synthesis (MPS) and decreasing muscle protein breakdown [18,19]. Indeed, studies have shown that 1.9-4.2 g of leucine in one sitting may be sufficient to maximize MPS [20,21,22,23], compared to 20-40 g of protein [24]. This is particularly beneficial for individuals trying to preserve muscle while losing weight, since only 10% of the calories are consumed in the form of leucine relative to protein for the same MPS stimulatory effect. However, the optimal leucine dose for effective muscle preservation during weight loss remains to be determined, and no study has investigated the dose-response effect of body-mass-adjusted leucine intake on body composition during weight loss. The current recommended dietary allowance (RDA) for leucine — 0.042 g/kg body mass/day (henceforth denoted as g/kg/day) — represents the minimum amount needed to avoid deficiency, and may not be adequate to preserve muscle during periods of increased anabolic needs, such as exercise, ageing, and weight loss [25].
For these reasons, the main objective of this study is to examine the effects of different amounts of body-mass-adjusted leucine intake on body composition during weight loss, and to determine whether it is possible to lose weight without significant muscle loss through increased leucine consumption, while controlling for the entire diet (food was provided for the entire intervention) as well as protein and leucine intakes across the intervention period. The optimal dose and dose-response of leucine to preserve muscle during weight loss will be examined. Secondarily, the effects of leucine intake on health biomarkers during weight loss will be investigated, as the health effects of intermittent fasting are less clear. We hypothesized that muscle preservation would improve with increasing leucine intake in a dose-response manner, and that higher intake would also improve health biomarkers during short-term ADF.
2. Materials and Methods
2.1. Study Design
In this four-arm, parallel, double-blind randomized controlled trial, 92 young men (21-35 years; body mass index [BMI] ≥ 23.0 kg/m2, the Asian cut-off for higher cardiovascular risks) were recruited to undergo four weeks (28 days) of ADF (Figure 1). A dose-response design was used to establish superiority of higher dose levels over the lowest effective dose. Participants were randomly assigned to one of four groups based on body-mass-adjusted leucine dose (1:1:1:1): 0.02, 0.04, 0.06, or 0.08 g/kg/meal. Protein provided was standardized at 1-1.2 g/kg/day on feeding days for all groups as a control, and to prevent high protein intake from masking leucine's effects. All food for the entire intervention period was provided, with the diet fully controlled and monitored. These doses were determined by considering the recommended daily amount and the absolute amounts of leucine used in previous studies, and by working out the corresponding body-mass-adjusted values. In ADF, participants alternated between feeding days (3 meals) and fasting days (1 meal), averaging 2 meals/day. The lowest dose (0.02 g/kg/meal) served as the active control, closely approximating the leucine RDA of 0.042 g/kg/day. The highest daily leucine intake of 0.24 g/kg/day is also within the upper limit of safe intake for leucine (0.50 g/kg/day) [26]. Minimization with no random element was used to balance the groups for baseline body mass, age, physical activity level, and daily energy expenditure, which are key factors that affect weight loss. Allocation concealment was achieved through two approaches: minimization was managed by a research team member who excluded herself from participant recruitment and assessments, and all other team members and participants had no prior knowledge of or access to the allocation algorithm. Given the number of factors to be balanced, no readily available software could perform the minimization, so this was performed manually using an Excel spreadsheet. The allocation that produced the smallest differences in the mean and SD of each variable was assigned. The allocation was disclosed only to the team members in charge of menu planning and food packing, who were also not involved in participant recruitment or assessments. All other team members and the participants were blinded to the group allocation. This single-site study was conducted at Nanyang Technological University (NTU), and ethics approval was obtained from the NTU Institutional Review Board (IRB 2019-07-039) on 17 February 2020. No changes were made to the methods or outcome measures after trial commencement (NCT07583875; https://clinicaltrials.gov).
2.2. Participant Screening
Participants were screened according to the following inclusion criteria: 1) male, 2) 21-35 years old, 3) non-smoker (including other tobacco products such as shisha), and 4) BMI of at least 23.0 kg/m2. Additionally, participants were excluded if they: 1) were not able to follow the physical activity and dietary requirements; 2) had previously failed an exercise stress test; 3) had an existing medical condition that could be worsened by fasting; 4) were on long-term prescriptions for cardiovascular, respiratory, hepatic, renal, or musculoskeletal conditions; 5) had any other long-term prescriptions, such as traditional Chinese medicine, that could affect any outcome measures of this study; 6) had dietary restrictions, known allergies, or intolerance to common food items such as dairy or soy products; and 7) had an electrical or metal implant within the body, including pacemakers and joint replacements. All eligible participants proceeded to sign informed consent before their inclusion into the study.
2.3. ADF Protocol
The ADF program lasted continuously for 28 days, alternating every 24 hours between fasting and feeding days, with each day starting at midnight. A small meal consisting of approximately 25% of participants’ daily energy requirements was provided on fasting days and consumed between 12-2 PM, to standardize the total duration of fasting and feeding throughout the four weeks. On feeding days, participants consumed approximately 125% of their daily energy requirements, which was calculated weekly. They were allowed to consume these meals at any time throughout the 24-hour feeding day. All meals to be consumed throughout the entire four-week duration were provided to participants, who were not allowed to consume any other calorie-containing food or beverages, supplements, herbs, traditional Chinese medicine, or other alternative medicine not provided by this study. During the 4-week ADF, participants were permitted to consume zero-calorie beverages (including sugar-free black coffee and black tea) and plain water ad libitum but were required to abstain from caffeine for at least 24 hours prior to each laboratory visit when outcome measurements were taken. The food and beverages provided included frozen main meals, dried fruits, energy bars, soy milk, milk and other dairy products (i.e., cheese, yogurt, etc.), canned food (such as canned tuna), bread loaves, and cereal. To make it hard for participants to guess their allocation, protein (Myprotein Impact Whey Protein), leucine (Myprotein L-Leucine), and carbohydrate (Glucolin® Glucose) supplements were provided in powdered form in dark sealed pouches, with the leucine packed together with either of the other two supplements. Meals were prepared and packed by the research team to minimize the need for food preparation and to enhance convenience for the participants. Any leftover food and meal items were weighed and logged, and, at minimum, participants were required to finish all supplements provided for each meal.
2.4. Laboratory Sessions
Participants were required to visit the laboratory (Human Bioenergetics Laboratory, Physical Education and Sports Science, National Institute of Education, NTU, Singapore) on 6 occasions over the course of 5-6 weeks. They were instructed to maintain consistent physical activity levels and log them daily, to not start a new exercise program, and to refrain from high levels of physical activity for the entire duration of the study. In addition, participants had to refrain from intentional physical activity and exercise in the 48 hours preceding each weekly laboratory session, refrain from food and beverages containing alcohol and/or caffeine in the 24 hours preceding each session, and fast for at least 10 hours overnight (plain water was permitted) before each session. To ensure consistency in diurnal and circadian variations, participants visited the laboratory around the same time of day (± 1 hour) as much as possible, such that assessments could be administered around the same time for every laboratory session.
At the first laboratory session (Figure 2), participants provided informed consent, were screened for eligibility (screening questionnaire pertaining to inclusion and exclusion criteria, and BMI measurement), and underwent baseline measurements of anthropometry, body composition, health biomarkers (health assessments and venous blood sampling), and physical activity level (using the Global Physical Activity Questionnaire [GPAQ] [27] for the past week). The relevant baseline measurements were used in the minimization to allocate participants and in the calculation of daily energy expenditure (DEE) for planning week 1 ADF meals. DEE was calculated by summing resting metabolic rate (RMR) and daily physical activity energy expenditure (PAEE), and was adjusted weekly. PAEE was estimated using GPAQ or daily physical activity log, while RMR was calculated using the Mifflin-St Jeor equation for males [28]:
RMR= [10 × body mass (kg)] + [6.25 × height (cm)] – [5 × age (y)] + 5
From this point onward, participants completed daily physical activity logs. At the second session, anthropometry was remeasured and used, together with the daily physical activity logs over the past week, to calculate DEE for week 2 ADF meals. Participants also collected their week 1 food and began ADF within 10 days of session 1, logging their physical activity, food intake, and sleep patterns daily from day 1 of ADF. Participants returned to the laboratory for sessions 3 to 6 at 1, 2, 3, and 4 weeks after the start of ADF, respectively. During these sessions, anthropometry was measured and health assessments were conducted weekly. Body composition and venous blood sampling, similar to session 1, were also performed at session 6. Similarly, anthropometry from sessions 3 and 4, and the daily physical activity logs from the preceding week were used to calculate DEE for weeks 3 and 4 ADF meals, respectively. Participants collected their food for the week during sessions 3 to 5.
2.4.1. Anthropometry
Body height (m) and weight (kg) were measured at each session using the ID1Plus electronic weighing scale (Mettler Toledo, Singapore) and a seca 242 stadiometer (seca GmbH & Co., KG, Hamburg, Germany). BMI was calculated as weight divided by height squared (kg/m2).
2.4.2. Body Composition
Body composition was assessed before the start and after the end of the 4-week protocol (i.e., sessions 1 and 6) using dual-energy X-ray absorptiometry (DXA) with the Lunar Prodigy (GE Lunar Corporation Inc., Madison, Wisconsin, U.S.A.). Measurements obtained included total and regional fat and lean mass (kg), total fat mass index (kg/m2), total and regional lean mass indexes (kg/m2), percentage body fat (%), bone mineral content (kg), and bone mineral density (g/cm2).
2.4.3. Health Assessments
Fasting blood sugar (mmol/L), resting blood pressure (mmHg) and resting heart rate (bpm) were measured at sessions 1 and 3 to 6. For fasting blood glucose (FG), a small drop of blood was obtained via finger-prick using the ACCU-CHEK Safe-T-Pro Plus lancet (Roche Diabetes Care GmbH, Mannheim, Germany) and analyzed using the ACCU-CHEK Guide blood glucose meter (Roche Diabetes Care GmbH, Mannheim, Germany). Resting systolic blood pressure (SBP) and diastolic blood pressure (DBP), and heart rate were assessed using the OMRON HEM-7320 blood pressure monitor (OMRON Healthcare Co. Ltd., Kyoto, Japan).
2.4.4. Venous Blood Sampling
At sessions 1 and 6, blood samples were taken from an antecubital vein using a 22G needle and collected into a gold-top serum separation vacutainer for serum samples. Tubes were inverted 5 times and kept at room temperature for 30 minutes before centrifugation for 10 min at 2000g at room temperature with slow acceleration and no brake. The blood samples were analyzed by Innoquest Diagnostics Pte Ltd on the day of sample collection, to assess lipid (i.e., cholesterol and triglycerides [mmol/L]) and diabetic profiles (insulin [mU/L], Homeostasis Model Assessment of Insulin Resistance [HOMA-IR] and glycated hemoglobin [HbA1c, %]).
2.4.5. Physical Activity Level and PAEE
GPAQ assessed participants’ physical activity level for the week (MET·min/week), while daily physical activity logs were analyzed to derive metabolic equivalents (MET·min) according to GPAQ criteria. Due to fluctuations in daily physical activity, meal planning was based on the average daily physical activity over a week, calculated as either the GPAQ value or the sum of daily log values for the week, divided by 7. PAEE was then obtained by converting MET·min to kcal.
2.4.6. Daily Online Logs
Participants were required to maintain daily logs pertaining to physical activity, food intake including documentation of any leftover food items, and sleep patterns. These logs were analyzed to calculate overall energy balance, and determine the contributions and confounding effects of diet, physical activity and sleep, if any, to the results of this study, as well as the compliance of the participants. The logs were completed online, allowing for close monitoring and timely reminders to log daily rather than rely on recall.
2.5. Sample Size Calculation
Lean mass is the most important primary outcome measure in this study. A large effect size (0.40) has been reported for lean mass when comparing different protein intakes combined with resistance training during calorie restriction, determined using Cohen’s f [29]. Considering the anabolic potential of resistance training, and the other outcome measures, a conservative small-to-moderate effect size was estimated for this study (i.e., dietary intervention alone). Using G*Power (version 3.1.9.7) for an effect size of 0.20-0.25, α = 0.05, power = 0.8, groups = 4 and correlation = 0.5, a sample size of 12-19 per group was required from the a priori power analyses for the mixed repeated measures ANOVA (interaction and within-subjects main effects). Finally, with a 10% buffer for dropouts, a total sample size of 100 was proposed for this study.
2.6. Statistical Analysis
Primary outcomes for body composition were body mass, fat mass, lean mass, appendicular lean mass (ALM), BMI, fat mass index (FMI), lean mass index (LMI), ALM index (ALMI), percentage body fat (PBF), and trunk fat mass; primary health biomarkers were SBP, DBP, FG, insulin, HOMA-IR, HbA1c, total cholesterol (TC), high-density lipoprotein cholesterol (HDL-C), low-density lipoprotein cholesterol (LDL-C), TC/HDL ratio, and triglycerides (TG). Secondary body composition measures were android fat mass (fat around the stomach and mid-section), gynoid fat mass (fat around the hips), bone mineral content (BMC), and bone mineral density (BMD). Only data from participants who completed the study were analyzed, and all their data were used.
SPSS version 29.0 (Statistical Package for the Social Sciences, Chicago, IL, USA) was used for data analysis. For continuous data, given 1) the number of variables, 2) complexity arising from some variables satisfying the assumption of normality at some time-points but not others, and 3) the complexity of the inferential statistical tests (the nonparametric tests are not tests of medians), the decision was made to display mean (SD) to represent the central tendency and spread of the data distributions, while categorical variables were presented as number (%). Data for inferential statistics were presented as mean [95% CI]. Differences in pre- (session 1) and post-intervention (session 6) outcome measures were analyzed using a 4 (group) x 2 (pre- and post-intervention) generalized estimating equation (GEE) with robust estimator, normal distribution with either a log or identity link function, and exchangeable correlation matrix. Models were selected first according to the smallest goodness of fit, followed by the smallest covariance of parameter estimates. A significant interaction effect was followed by simple effects tests. A significant main effect of group was followed by Tukey’s post-hoc test for homogeneous variances between groups, or Games-Howell post-hoc test for non-homogeneous variances between groups. For differences in baseline measures, potential confounders, and key dietary measures, due to non-normality of data but similar SDs, Welch ANOVA was performed, given its robustness and the equal sample size across groups. Significance level was set at p ≤ 0.05, and effect sizes were calculated and interpreted using Cohen’s thresholds (i.e., 0.2, small; 0.5, medium; 0.8, large).
3. Results
A total of N = 92 participants were recruited for this study. After accounting for 12 dropouts (7 withdrew after enrolment but before the start of the program due to personal reasons unrelated to the study; 5 withdrew after starting the program [1 was too tired from the ADF protocol to keep up with school and his own routine; 1 did not like the supplements provided; 1 fell ill due to reasons unrelated to the study; 2 could not cope with work commitments]), a total of N = 80 participants completed the study and were included in the analyses. Participant characteristics are displayed in Table 1. Participants were enrolled from August 2020 to January 2021, and data collection was completed in February 2021. The program was well tolerated, with no adverse events reported; as such, the planned non-systematic analysis of adverse events (harms) was not required. This was expected, given that the maximum leucine dose was well within the upper safety limit, leucine is an essential amino acid, and ADF has been shown to be safe and well tolerated.
Compliance with the program was high overall. Compliance rates were 97.3 (7.0)%, for fasting-day meal timing (12-2 PM; 98.8% of participants had a compliance rate of ≥ 75%), 85.2 (20.8)%, for meals without leftovers (78.8% of participants had a compliance rate ≥ 75%), and 96.2 (6.1)% for energy consumed versus given (98.8 % of participants had a compliance rate of ≥ 75%).
3.1. Baseline Characteristics
Participants were randomized by minimization for baseline body mass, age, physical activity level, and DEE (Table 2). There was no significant difference between groups at baseline for body mass [F(3, 42) = 0.07, p = 0.977], age [F(3, 42) = 1.104, p = 0.358], physical activity level [F(3, 42) = 0.156, p = 0.925], or DEE [F(3, 42) = 0.034, p = 0.992].
3.2. Potential Confounders
Average sleep duration, total physical activity and total time spent on resistance exercise (excluding rest) across the four weeks are presented in Table 3. There was no significant difference between groups for average sleep duration [F(3, 42) = 2.807, p = 0.051], total physical activity [F(3, 42) = 0.15, p = 0.929] or total resistance exercise time [F(3, 39) = 0.447, p = 0.721].
3.3. Diet Analyses
Data for diet given and consumed (i.e., given minus leftovers) are presented in Table 4. For all groups, leucine doses provided were in accordance with what was planned: 0.02, 0.04, 0.06 and 0.08 g/kg/day on fasting days; 0.06, 0.12, 0.18 and 0.24 g/kg/day on feeding days; and 0.04, 0.08, 0.12 and 0.16 g/kg/day when averaged across all days.
For the diet consumed, differences in energy (kcal/kg/day), protein (g/kg/day) and leucine (g/kg/day) intake were analyzed. There was no significant difference between groups for feeding day energy intake [F(3, 41) = 0.977, p = 0.413]. Although protein provided to all groups was between 1-1.2 g/kg/day on feeding days as planned, there were significant differences between groups for feeding day protein intake [F(3, 42) = 34.871, p < 0.001]. Post-hoc analyses showed that feeding day protein intake was higher (p < 0.001) in all other groups (1.16-1.21 g/kg/day) compared to the active control group (0.98 g/kg/day). As intended, feeding day leucine intake differed significantly between groups [F(3, 41) = 8163.5, p < 0.001]. Post-hoc analyses confirmed that all pairwise comparisons were significantly different (p < 0.001).
For fasting days, there was no significant difference between groups for energy intake [F(3, 42) = 0.172, p = 0.915]. Fasting day protein [F(3, 42) = 132.01, p < 0.001] and leucine [F(3, 41) = 2968, p < 0.001] intakes were significantly different between groups. Post-hoc analyses showed significant differences (p < 0.001) in fasting day protein and leucine intake for all pairwise comparisons.
On average, the overall energy intake was not significantly different between groups [F(3, 41) = 0.85, p = 0.474] while overall protein [F(3, 42) = 99.903, p < 0.001] and overall leucine [F(3, 41) = 11910, p < 0.001] intakes were significantly different between groups. Post-hoc analyses showed significant differences in overall protein (p < 0.01) and leucine (p < 0.001) intakes for all pairwise comparisons.
The results indicate that the intervention successfully achieved the intended leucine intake of 0.02, 0.04, 0.06, and 0.08 g/kg/meal for the respective groups, with no significant difference in energy intake between groups.
3.4. Body Composition
Time × group interaction effect was not significant for any of the body composition measures (p = 0.144-0.989). Main effects of time were significant for all measures of body composition, with a reduction post-ADF (p < 0.001; Table 5), except BMD (p = 0.992). Figure 3 illustrates the pre-post changes in body composition for each group. There were no significant main effects of group (p = 0.138-0.961) for any body composition measure.
3.5. Health Markers
Health characteristics are presented in Table 6. For the 0.04 group, one pre-ADF venous blood sample was missing due to an unsuccessful blood draw. Additionally, the laboratory did not analyze the pre-ADF lipid profile for one participant each in the 0.02 and 0.04 groups. Missing data were handled using GEE. There were no significant interaction effects for any of the health measures (p = 0.249–0.953), except for HDL-C (p = 0.028). Simple effects of time (pre-post) were tested at different levels of group for HDL-C, using an adjusted α value of 0.05/4 = 0.0125. Reductions in HDL-C post-ADF were significant for the 0.02 group (mean difference = -0.08 mmol/L, 95% CI [-0.13, -0.02], p = 0.004, d = -0.37) and the 0.08 group (mean difference = -0.21 mmol/L, 95% CI [-0.27, -0.14], p < 0.001, d = -0.67).
Main effects of time were significant for the other health measures except TC/HDL-C ratio (p = 0.132). ADF reduced SBP (-3.76 mmHg, 95% CI [-5.21, -2.32], p < 0.001, d = -0.48), DBP (-2.23 mmHg, 95% CI [-3.53, -0.94], p < 0.001, d = -0.28), FG (-0.25 mmol/L, 95% CI [-0.35, -0.16], p < 0.001, d = -0.63), insulin (-3.60 mU/L, 95% CI [-4.47, -2.75], p < 0.001, d = -0.93), HOMA-IR (-0.91, 95% CI [-1.13, -0.69], p < 0.001, d = -0.93), HbA1c (-0.04 percentage points (pp), 95% CI [-0.07, -0.00], p = 0.028, d = -0.15), TC (-0.50 mmol/L, 95% CI [-0.62, -0.38], p < 0.001, d = -0.59), HDL-C (-0.12 mmol/L, 95% CI [-0.16, -0.08], p < 0.001, d = -0.42), LDL-C (-0.34 mmol/L, 95% CI [-0.44, -0.25], p < 0.001, d = -0.43), and TG (-0.12 mmol/L, 95% CI [-0.20, -0.03], p = 0.004, d = -0.25).
Main effects of group were significant for TC (p = 0.006), HDL-C (p = 0.014), LDL-C (p = 0.006), and TC/HDL-C ratio (p = 0.003). Post-hoc comparisons between 0.02 and each other group showed significant differences in HDL between 0.02 and the 0.06 (p = 0.017) and 0.08 (p = 0.004) groups, and in TC/HDL ratio between 0.02 and 0.06 groups (p = 0.003).
4. Discussion
To our knowledge, this is the first study to investigate the body-mass-adjusted dose-response of leucine intake on muscle preservation and health markers during short-term ADF-induced weight loss in young men. To control for physical activity and sleep, participants maintained daily logs for analyses. Furthermore, participants were assigned to groups using a minimization process for baseline body mass, age, activity level, and energy expenditure. Crucially, the leucine doses consumed (i.e., 0.04, 0.08, 0.12, and 0.16 g/kg/day) aligned with the study design, even after accounting for dietary leftovers.
All body composition measures declined significantly post-ADF except BMD. Body mass decreased by 4.7 kg (5.8%; ~1.2 kg/week), consistent with the 3.5–5.6 kg losses reported in previous 22-28-day ADF studies [30,31,32], and within recommended rates for safe (0.5-1 kg/week [33]) and meaningful (5-10% during the initial 6 months [34]) weight loss. Only 2 of 80 participants (one each in the 0.04 and 0.08 groups) did not lose weight. In summary, short-term, diet-controlled ADF effectively induced meaningful weight loss in normal-weight to obese (BMI ≥ 23.0 kg/m²) young men. Notably, fat mass accounted for the majority of the reduction (2.8 kg; 59.0%), while lean mass loss (1.9 kg; 40.2%) was within the range (0.4-2.5 kg or 25–42%) reported in the weight-loss literature [6,35,36]. Aside from the two participants who gained both body and lean mass, only four lost body mass but gained lean mass (one each in the 0.02 and 0.08 groups; two in the 0.06 group).
It was unexpected that there were no significant interaction effects on muscle preservation, and that all muscle mass indicators decreased post-intervention across the groups. Leucine intake did differ substantially across groups (Table 4): the active control received approximately the RDA (0.04 g/kg/day on average) [25], while the other groups received approximately 2, 3, and 4 × the RDA (0.08, 0.12, and 0.16 g/kg/day, respectively). Intake was also adequate: the two highest-dose groups exceeded weight-loss leucine recommendations (0.12 g/kg/day) [37], and all groups except the active control met or exceeded the 1.9–4.2 g dose shown to maximize MPS (fasting-day averages: 3.5, 4.7, and 6.4 g/meal vs. 1.8 g/meal for the active control), as intended.
A plausible reason for the lack of an interaction effect may be that, while the leucine intake per meal was sufficient, the total daily intake on fasting days (one meal) remained below the recommended 0.12 g/kg/day. Excess leucine intakes on feeding days may not offset the fasting day deficit since excess amino acids are not stored. Future studies could explore higher leucine doses on fasting days, though this may offer limited benefit given leucine's short-lived effect on MPS.
This short-lived effect could also explain the lack of an interaction effect. Leucine stimulates MPS for only 2–3 hours, after which MPS rapidly returns to baseline, regardless of continued amino acid availability [20,21,22,23,38]. Furthermore, although leucine is the central driver of MPS via the mTOR pathway [12,13,14,15,16,17,18,19], and low leucine doses can elicit MPS responses comparable to those induced by large protein doses, this effect has not been studied beyond 5 h [12,13]. Multiple leucine doses may thus be required to sustain MPS [10], which is precluded on fasting days.
Average protein intake on fasting days may also have been insufficient. For inactive individuals losing weight, 1–1.2 g/kg/day of protein is recommended to limit muscle loss, with higher amounts for active individuals, particularly those doing resistance exercise [5,39,40]. Notably, under resting conditions, 3 g of leucine can offset suboptimal whey protein (25% of standard; 6.25 g versus 25 g) to match MPS in young men [12,13]. All groups met or exceeded the protein or leucine requirements on feeding days. On fasting days, all groups, including the active control (25 g [0.32 g/kg] protein; 1.8 g leucine), met or exceeded the per-meal dose needed to maximize MPS. However, all fell short of the protein RDA of 0.80 g/kg/day by nature of the ADF protocol. This shortfall was likely not offset by leucine's short-lived MPS effect (3.5-6.4 g of intake in the other groups). Providing more protein—the 0.08 group already consumed 52 g (0.65 g/kg), which is ≥ 2x the standard dose—is also unlikely to help, since excess protein is not stored. A recent meta-analysis [41] found no significant lean mass reduction post-ADF, attributing this to protein intake of 15-37% of calories maintained even on fasting days across included studies; our participants had 14-16% on feeding days and 21-42% on fasting days.
Another possibility is that our young, healthy participants had such a robust MPS response to any leucine or protein intake that all doses elicited similar muscle preservation—consistent with Xu et al.’s [38] postulation that leucine supplementation may hold more clinical value for those with underlying conditions or malnourishment than for healthy populations.
Lastly, a critical factor is the absence of structured resistance exercise (RE), which—more potent than protein alone [5,42]—is normally paired with a high-protein diet to preserve lean mass during weight loss [5,39,43]. We intentionally omitted RE to isolate the effect of dietary leucine, since combining exercise and dietary changes can be challenging for overweight and obese individuals. Participant logs showed no significant between-group differences in physical activity or RE time (Table 3), with average RE totaling just 2.2 h (33 min/week)—likely too little to preserve muscle mass.
Similarly, all groups showed significant decreases in fat mass indicators, with no interaction effects. Notably, measures of abdominal obesity (trunk and android fat)—surrogates for visceral fat [44]—declined significantly, consistent with meta-analyses showing ADF reduced waist circumference [4,41,45,46,47]. This notable finding suggests important health benefits, as visceral adiposity is linked to metabolic syndrome, insulin resistance, and diabetes [48]. The effects of leucine on adipose tissue, and the doses required in humans, are less clear. In mostly rodent studies, leucine supplementation has been shown to benefit subcutaneous and visceral adipose tissue by promoting fatty acid oxidation, reducing inflammation, and improving lipid metabolism and mitochondrial function [49,50]. The lack of an interaction effect on fat mass indicators may reflect challenges translating animal findings to humans, as well as the insufficient fasting-day leucine intake and short-lived action discussed earlier.
Regarding bone health, the intervention caused a statistically significant but minuscule loss of BMC (MD = −42 g, d = −0.1), with no significant interactions. Although calorie deficits and undernutrition can impair bone health [32,51], BMD—the clinically relevant variable for diagnosing osteopenia and osteoporosis—remained unchanged, indicating that this short-term ADF protocol is safe for bone health.
Post-intervention, significant reductions (no interaction effect) occurred in SBP, DBP, FG, insulin, HOMA-IR, HbA1c, TC, LDL-C, and TG, indicating that short-term ADF improves cardiovascular and diabetic health regardless of leucine intake. This aligns with meta-analyses (ADF vs. control, or pre-post ADF), which showed consistent reductions in SBP [4,6,46,47], DBP [4,6,46,47], and TC [4,6,41,47]. TC reduction is typically mediated by LDL-C reduction [6,47], though one meta-analysis found TC reduction without significant LDL-C or HDL-C changes [4], and another found no LDL-C change (TC was not assessed) [46]. TG reduction post-ADF has been reported in meta-analyses [4,6], with no change found in one [47]. Nonetheless, these improvements likely stemmed from weight loss alone, consistent with previous reviews of weight loss studies [34,52,53]. In an earlier study with similar participant criteria [11], we found no significant change in SBP and DBP after 4 weeks of free-living ADF, likely due to smaller weight loss (2.4 kg [2.9%] vs. 4.7 kg [5.8%]), as BP changes are more modest and variable below 5% weight loss [34].
Post-weight-loss changes in HDL-C are paradoxical: while increases are expected after 5-8 kg of weight loss [34], declines are also common, particularly with diet-only interventions, as fat mass declines [54]. Consistent with this, meta-analyses have reported either no change [4,6] or reduced HDL-C [47] post-ADF. We found significant HDL-C reductions only in the 0.02 and 0.08 groups (non-significant declines in the other two), likely reflecting fat mass loss rather than a direct leucine effect, as leucine has no known impact on HDL-C.
Reductions in FG, insulin, HOMA-IR, and HbA1c in this study are noteworthy. Meta-analyses of diabetics and nondiabetics consistently found no changes in FG, insulin, HOMA-IR, and HbA1c [4,6,41,45,46,47], with only one reporting trivial declines in FG and HOMA-IR [4]. Similarly, our previous study [11] found no significant FG decrease (other diabetic markers not assessed). Given the consistency across meta-analyses, this was unlikely due to lower weight loss alone, especially since both studies involved non-diabetic participants. Despite FG for all participants in this study being within the normal range (<6.1 mmol/L), it still decreased significantly from 5.36 to 5.11 mmol/L post-ADF. This 0.25 mmol/L drop is not clinically meaningful but contributed to the decline in HOMA-IR. Insulin dipped by 38.7%, and HOMA-IR fell 40.4% from 2.25 (mild insulin resistance) to 1.34 (normal insulin sensitivity). HbA1c fell 0.04 pp, a change that was not clinically meaningful, highlighting the value of HOMA-IR as a more sensitive index of metabolic improvements.
The lack of interaction effects precludes leucine as a cause of these metabolic improvements. However, leucine has been shown to stabilize blood glucose [37] and enhance lipid metabolism [55], and its effects may have been overshadowed by those of weight loss and fasting alone [56,57]. Leucine’s benefits may also be more apparent in individuals with severe insulin and glycemic dysfunction, as Yang et al. [58] found that leucine improved insulin function and glycemic control in patients with diabetes. Alternatively, leucine’s benefits may plateau at low doses, producing a ceiling effect that masks dose-dependent differences. Regardless, leucine's effects on metabolic markers during weight loss warrant further investigation.
This study's primary limitation is the recruitment of only young men, which may limit generalizability to women or the elderly. Food variety was restricted, potentially causing diet boredom among the participants. However, this was important as it ensured that the calculated leucine intakes were as accurate as possible. While per meal leucine and protein intakes were adequate, by design of the ADF protocol, the daily leucine and protein intakes on fasting days were suboptimal for muscle maintenance during weight loss. Although resistance training is a potent anabolic stimulus, it was not restricted during the study for better ecological validity; instead, physical activity was monitored via daily online logs and analyzed. Finally, maintaining full dietary and physical activity compliance over four weeks is challenging, though the research team endeavored to provide daily reminders to encourage accurate and timely online logging.
5. Conclusions
This is the first study to investigate the effects of leucine dose and total daily leucine intake scaled to body mass during short-term weight loss. The findings suggest that alternate-day fasting is a safe, tolerable, and effective weight loss strategy with high adherence rates among young men. It also confers significant benefits in terms of cardiovascular and diabetic health.
Increasing leucine intake during weight loss did not improve body composition, whether preserving muscle, or enhancing total weight loss or body fat loss. While some meta-analyses reported no lean mass reduction post-ADF [41,45,46], one meta-analysis found lean mass loss [6] — a finding consistent with our own original studies, both current and previous [11]. Given this, combining RE with ADF—alongside adequate protein and leucine intake—may better preserve muscle. ADF's advantages over other weight-loss strategies are reviewed elsewhere [4,41,45,46,47] and beyond this study’s scope.
Similarly, higher leucine intakes also did not further improve other health markers. However, the improvements observed in FG, insulin, HOMA-IR, and HbA1c warrant further investigation into leucine's metabolic effects during weight loss.
Author Contributions
Conceptualization, B.W.J.P., Y.Y. and B.K.C.; methodology B.W.J.P., Y.Y. and B.K.C.; formal analysis, B.W.J.P. and Y.Y.; investigation, B.W.J.P., Y.Y., J.P.Y.T. and P.S.C.L.; resources, B.W.J.P. and Y.Y.; data curation, B.W.J.P. and Y.Y.; writing—original draft preparation, B.W.J.P.; writing—review and editing, B.W.J.P., Y.Y., J.P.Y.T., P.S.C.L. and B.K.C.; visualization, B.W.J.P. and Y.Y.; supervision, B.W.J.P. and Y.Y.; project administration, B.W.J.P., Y.Y. and J.P.Y.T.; funding acquisition, Y.Y. All authors have read and agreed to the published version of the manuscript.
Funding
This research was funded by the Ministry of Education, Singapore, Academic Research Fund Tier 1 2018-T1-002-131 and RG32/22 (direct monetary support).
Institutional Review Board Statement
The study was conducted in accordance with the Declaration of Helsinki, and approved by the Institutional Review Board of Nanyang Technological University (IRB 2019-07-039, 2020-02-17).
Informed Consent Statement
Informed consent was obtained from all subjects involved in the study.
Data Availability Statement
De-identified data analyzed in the manuscript are available via https://doi.org/10.25340/R4/5VBYVT.
Acknowledgments
The first author (B.W.J.P.) would like to thank the National Institute of Education (NIE), Nanyang Technological University (NTU), for providing him with the prestigious Nanyang President’s Graduate Scholarship (NPGS) in support of his PhD journey. The authors thank Conway (NTU) for her advice on the grant writing, and physicians Lee Phong Ching and Sonali Ganguly (Singapore General Hospital) for their work as medical consultants for this study. The authors graciously acknowledge all the participants for their time and effort in completing the 4-week ADF protocol, as well as students who contributed to the project as research assistants or as part of their Final Year and URECA Projects, including: Lee Yi Shin, Muhammad Nabil bin Bohari, Na Qi En Brandon, Low Seow Ting, Bhanu D/O Krishnasamy, Claire Marie Tay En Xin, Goh Khee, Leslie Chen Kai Lin, Neo Xi, and Muhammad Nur Shahril Iskandar. Gemini AI (Google) and Claude AI (Anthropic) were used only for language editing, not content generation. The authors reviewed and edited all output and take full responsibility for the content of this publication.
Conflicts of Interest
The authors declare no conflicts of interest. The funders had no role in the design of the study; in the collection, analyses, or interpretation of data; in the writing of the manuscript; or in the decision to publish the results.
Abbreviations
The following abbreviations are used in this manuscript:
| ADF | Alternate-day fasting |
| MPS | Muscle protein synthesis |
| RDA | Recommended dietary allowance |
| BMI | body mass index |
| NTU | Nanyang Technological University |
| IRB | Institutional review board |
| GPAQ | Global physical activity questionnaire |
| DEE | Daily energy expenditure |
| RMR | Resting metabolic rate |
| PAEE | Physical activity energy expenditure |
| DXA | Dual X-ray absorptiometry |
| FG | Fasting glucose |
| SBP | Systolic blood pressure |
| DBP | Diastolic blood pressure |
| HOMA-IR | Homeostasis Model Assessment of Insulin Index |
| HbA1c | Glycated hemoglobin |
| MET | Metabolic equivalents |
| GEE | Generalized estimating equation |
| ALM | Appendicular lean mass |
| FMI | Fat mass index |
| LMI | Lean mass index |
| ALMI | Appendicular lean mass index |
| PBF | Percentage body fat |
| TC | Total cholesterol |
| HDL-C | High-density lipoprotein cholesterol |
| LDL-C | Low-density lipoprotein cholesterol |
| TG | Triglycerides |
| BMC | Bone mineral content |
| BMD | Bone mineral density |
| RE | Resistance exercise |
References
- Worldwide trends in underweight and obesity from 1990 to 2022: a pooled analysis of 3663 population-representative studies with 222 million children, adolescents, and adults. Lancet 2024, 403, 1027–1050. [CrossRef] [PubMed]
- Wang, Y.C.; McPherson, K.; Marsh, T.; Gortmaker, S.L.; Brown, M. Health and economic burden of the projected obesity trends in the USA and the UK. Lancet 2011, 378, 815–825. [Google Scholar] [CrossRef] [PubMed]
- Varady, K.A.; Bhutani, S.; Klempel, M.C.; Kroeger, C.M.; Trepanowski, J.F.; Haus, J.M.; Hoddy, K.K.; Calvo, Y. Alternate day fasting for weight loss in normal weight and overweight subjects: a randomized controlled trial. Nutr. J. 2013, 12, 146. [Google Scholar] [CrossRef] [PubMed]
- Semnani-Azad, Z.; Khan, T.A.; Chiavaroli, L.; Chen, V.; Bhatt, H.A.; Chen, A.; Chiang, N.; Oguntala, J.; Kabisch, S.; Lau, D.C.; et al. Intermittent fasting strategies and their effects on body weight and other cardiometabolic risk factors: systematic review and network meta-analysis of randomised clinical trials. BMJ 2025, 389, e082007. [Google Scholar] [CrossRef] [PubMed]
- Aragon, A.A.; Schoenfeld, B.J.; Wildman, R.; Kleiner, S.; VanDusseldorp, T.; Taylor, L.; Earnest, C.P.; Arciero, P.J.; Wilborn, C.; Kalman, D.S.; et al. International society of sports nutrition position stand: diets and body composition. J. Int. Soc. Sports Nutr. 2017, 14, 16. [Google Scholar] [CrossRef] [PubMed]
- Cui, Y.; Cai, T.; Zhou, Z.; Mu, Y.; Lu, Y.; Gao, Z.; Wu, J.; Zhang, Y. Health Effects of Alternate-Day Fasting in Adults: A Systematic Review and Meta-Analysis. Front Nutr. 2020, 7, 586036. [Google Scholar] [CrossRef] [PubMed]
- Westerterp-Plantenga, M.S.; Lemmens, S.G.; Westerterp, K.R. Dietary protein - its role in satiety, energetics, weight loss and health. Br. J. Nutr. 2012, 108 Suppl 2, S105–112. [Google Scholar] [CrossRef] [PubMed]
- Wycherley, T.P.; Moran, L.J.; Clifton, P.M.; Noakes, M.; Brinkworth, G.D. Effects of energy-restricted high-protein, low-fat compared with standard-protein, low-fat diets: a meta-analysis of randomized controlled trials. Am. J. Clin. Nutr. 2012, 96, 1281–1298. [Google Scholar] [CrossRef] [PubMed]
- Soenen, S.; Bonomi, A.G.; Lemmens, S.G.T.; Scholte, J.; Thijssen, M.A.M.A.; van Berkum, F.; Westerterp-Plantenga, M.S. Relatively high-protein or ‘low-carb’ energy-restricted diets for body weight loss and body weight maintenance? Physiol. Behav. 2012, 107, 374–380. [Google Scholar] [CrossRef] [PubMed]
- Backx, E.M.P.; Tieland, M.; Borgonjen-van den Berg, K.J.; Claessen, P.R.; van Loon, L.J.C.; de Groot, L.C.P.G.M. Protein intake and lean body mass preservation during energy intake restriction in overweight older adults. Int. J. Obes. 2016, 40, 299–304. [Google Scholar] [CrossRef] [PubMed]
- Pang, B.W.J.; Yang, Y.; Rashiqah, N.; Huang, C.B.; Sim, D.W. Effects of Four Weeks of Alternate-Day Fasting with or Without Protein Supplementation-A Randomized Controlled Trial. Nutrients 2025, 17. [Google Scholar] [CrossRef] [PubMed]
- Churchward-Venne, T.A.; Breen, L.; Di Donato, D.M.; Hector, A.J.; Mitchell, C.J.; Moore, D.R.; Stellingwerff, T.; Breuille, D.; Offord, E.A.; Baker, S.K.; et al. Leucine supplementation of a low-protein mixed macronutrient beverage enhances myofibrillar protein synthesis in young men: a double-blind, randomized trial. Am. J. Clin. Nutr. 2014, 99, 276–286. [Google Scholar] [CrossRef] [PubMed]
- Churchward-Venne, T.A.; Burd, N.A.; Mitchell, C.J.; West, D.W.; Philp, A.; Marcotte, G.R.; Baker, S.K.; Baar, K.; Phillips, S.M. Supplementation of a suboptimal protein dose with leucine or essential amino acids: effects on myofibrillar protein synthesis at rest and following resistance exercise in men. J. Physiol. 2012, 590, 2751–2765. [Google Scholar] [CrossRef] [PubMed]
- Devries, M.C.; McGlory, C.; Bolster, D.R.; Kamil, A.; Rahn, M.; Harkness, L.; Baker, S.K.; Phillips, S.M. Leucine, Not Total Protein, Content of a Supplement Is the Primary Determinant of Muscle Protein Anabolic Responses in Healthy Older Women. J. Nutr. 2018, 148, 1088–1095. [Google Scholar] [CrossRef] [PubMed]
- Devries, M.C.; McGlory, C.; Bolster, D.R.; Kamil, A.; Rahn, M.; Harkness, L.; Baker, S.K.; Phillips, S.M. Protein leucine content is a determinant of shorter- and longer-term muscle protein synthetic responses at rest and following resistance exercise in healthy older women: a randomized, controlled trial. Am. J. Clin. Nutr. 2018, 107, 217–226. [Google Scholar] [CrossRef] [PubMed]
- Katsanos, C.S.; Kobayashi, H.; Sheffield-Moore, M.; Aarsland, A.; Wolfe, R.R. A high proportion of leucine is required for optimal stimulation of the rate of muscle protein synthesis by essential amino acids in the elderly. Am. J. Physiol. Endocrinol. Metab. 2006, 291, E381–387. [Google Scholar] [CrossRef] [PubMed]
- Reidy, P.T.; Rasmussen, B.B. Role of Ingested Amino Acids and Protein in the Promotion of Resistance Exercise-Induced Muscle Protein Anabolism. J. Nutr. 2016, 146, 155–183. [Google Scholar] [CrossRef] [PubMed]
- Dickinson, J.M.; Volpi, E.; Rasmussen, B.B. Exercise and nutrition to target protein synthesis impairments in aging skeletal muscle. Exerc Sport Sci. Rev. 2013, 41, 216–223. [Google Scholar] [CrossRef] [PubMed]
- Zanchi, N.E.; Nicastro, H.; Lancha, A.H., Jr. Potential antiproteolytic effects of L-leucine: observations of in vitro and in vivo studies. Nutr. Metab. 2008, 5, 20–20. [Google Scholar] [CrossRef] [PubMed]
- Ham, D.J.; Caldow, M.K.; Lynch, G.S.; Koopman, R. Leucine as a treatment for muscle wasting: a critical review. Clin. Nutr. 2014, 33, 937–945. [Google Scholar] [CrossRef] [PubMed]
- Norton, L.; Wilson, G. Optimal protein intake to maximize muscle protein synthesis Examinations of optimal meal protein intake and frequency for athletes. Agro Food Ind. Hi-Tech 2009, 20, 54–57. [Google Scholar]
- Paddon-Jones, D.; Sheffield-Moore, M.; Zhang, X.J.; Volpi, E.; Wolf, S.E.; Aarsland, A.; Ferrando, A.A.; Wolfe, R.R. Amino acid ingestion improves muscle protein synthesis in the young and elderly. Am. J. Physiol. Endocrinol. Metab. 2004, 286, E321–328. [Google Scholar] [CrossRef] [PubMed]
- Tipton, K.D.; Ferrando, A.A.; Phillips, S.M.; Doyle, D., Jr.; Wolfe, R.R. Postexercise net protein synthesis in human muscle from orally administered amino acids. Am. J. Physiol. 1999, 276, E628–634. [Google Scholar] [CrossRef] [PubMed]
- Yang, Y.; Breen, L.; Burd, N.A.; Hector, A.J.; Churchward-Venne, T.A.; Josse, A.R.; Tarnopolsky, M.A.; Phillips, S.M. Resistance exercise enhances myofibrillar protein synthesis with graded intakes of whey protein in older men. Br. J. Nutr. 2012, 108, 1780–1788. [Google Scholar] [CrossRef] [PubMed]
- Medicine, I.o. Dietary Reference Intakes for Energy, Carbohydrate, Fiber, Fat, Fatty Acids, Cholesterol, Protein, and Amino Acids; The National Academies Press: Washington, DC, 2005. [Google Scholar] [CrossRef] [PubMed]
- Elango, R.; Chapman, K.; Rafii, M.; Ball, R.O.; Pencharz, P.B. Determination of the tolerable upper intake level of leucine in acute dietary studies in young men. Am. J. Clin. Nutr. 2012, 96, 759–767. [Google Scholar] [CrossRef] [PubMed]
- Armstrong, T.; Bull, F. Development of the World Health Organization Global Physical Activity Questionnaire (GPAQ). J. Public Health 2006, 14, 66–70. [Google Scholar] [CrossRef]
- Mifflin, M.D.; St Jeor, S.T.; Hill, L.A.; Scott, B.J.; Daugherty, S.A.; Koh, Y.O. A new predictive equation for resting energy expenditure in healthy individuals. Am. J. Clin. Nutr. 1990, 51, 241–247. [Google Scholar] [CrossRef] [PubMed]
- Longland, T.M.; Oikawa, S.Y.; Mitchell, C.J.; Devries, M.C.; Phillips, S.M. Higher compared with lower dietary protein during an energy deficit combined with intense exercise promotes greater lean mass gain and fat mass loss: a randomized trial. Am. J. Clin. Nutr. 2016, 103, 738–746. [Google Scholar] [CrossRef] [PubMed]
- Heilbronn, L.K.; Smith, S.R.; Martin, C.K.; Anton, S.D.; Ravussin, E. Alternate-day fasting in nonobese subjects: effects on body weight, body composition, and energy metabolism. Am. J. Clin. Nutr. 2005a, 81, 69–73. [Google Scholar] [CrossRef] [PubMed]
- Klempel, M.C.; Bhutani, S.; Fitzgibbon, M.; Freels, S.; Varady, K.A. Dietary and physical activity adaptations to alternate day modified fasting: implications for optimal weight loss. Nutr. J. 2010, 9, 35–35. [Google Scholar] [CrossRef] [PubMed]
- Stekovic, S.; Hofer, S.J.; Tripolt, N.; Aon, M.A.; Royer, P.; Pein, L.; Stadler, J.T.; Pendl, T.; Prietl, B.; Url, J.; et al. Alternate Day Fasting Improves Physiological and Molecular Markers of Aging in Healthy, Non-obese Humans. Cell Metab. 2019, 30, 462–476.e466. [Google Scholar] [CrossRef] [PubMed]
- Finkler, E.; Heymsfield, S.B.; St-Onge, M.P. Rate of weight loss can be predicted by patient characteristics and intervention strategies. J. Acad. Nutr. Diet. 2012, 112, 75–80. [Google Scholar] [CrossRef] [PubMed]
- Jensen, M.D.; Ryan, D.H.; Apovian, C.M.; Ard, J.D.; Comuzzie, A.G.; Donato, K.A.; Hu, F.B.; Hubbard, V.S.; Jakicic, J.M.; Kushner, R.F.; et al. 2013 AHA/ACC/TOS Guideline for the Management of Overweight and Obesity in Adults. Circ 2014, 129, S102–S138. [Google Scholar] [CrossRef] [PubMed]
- Alhamdan, B.A.; Garcia-Alvarez, A.; Alzahrnai, A.H.; Karanxha, J.; Stretchberry, D.R.; Contrera, K.J.; Utria, A.F.; Cheskin, L.J. Alternate-day versus daily energy restriction diets: which is more effective for weight loss? A systematic review and meta-analysis. Obes. Sci. Pract. 2016, 2, 293–302. [Google Scholar] [CrossRef] [PubMed]
- Davis, C.S.; Clarke, R.E.; Coulter, S.N.; Rounsefell, K.N.; Walker, R.E.; Rauch, C.E.; Huggins, C.E.; Ryan, L. Intermittent energy restriction and weight loss: a systematic review. Eur. J. Clin. Nutr. 2016, 70, 292–299. [Google Scholar] [CrossRef] [PubMed]
- Layman, D.K. The role of leucine in weight loss diets and glucose homeostasis. J. Nutr. 2003, 133, 261s–267s. [Google Scholar] [CrossRef] [PubMed]
- Xu, Z.R.; Tan, Z.J.; Zhang, Q.; Gui, Q.F.; Yang, Y.M. The effectiveness of leucine on muscle protein synthesis, lean body mass and leg lean mass accretion in older people: a systematic review and meta-analysis. Br. J. Nutr. 2015, 113, 25–34. [Google Scholar] [CrossRef] [PubMed]
- Cava, E.; Yeat, N.C.; Mittendorfer, B. Preserving Healthy Muscle during Weight Loss. Adv. Nutr. 2017, 8, 511–519. [Google Scholar] [CrossRef] [PubMed]
- Kokura, Y.; Ueshima, J.; Saino, Y.; Maeda, K. Enhanced protein intake on maintaining muscle mass, strength, and physical function in adults with overweight/obesity: A systematic review and meta-analysis. Clin. Nutr. ESPEN 2024, 63, 417–426. [Google Scholar] [CrossRef] [PubMed]
- Park, J.; Seo, Y.G.; Paek, Y.J.; Song, H.J.; Park, K.H.; Noh, H.M. Effect of alternate-day fasting on obesity and cardiometabolic risk: A systematic review and meta-analysis. Metab 2020, 111, 154336. [Google Scholar] [CrossRef] [PubMed]
- Morton, R.W.; Murphy, K.T.; McKellar, S.R.; Schoenfeld, B.J.; Henselmans, M.; Helms, E.; Aragon, A.A.; Devries, M.C.; Banfield, L.; Krieger, J.W.; et al. A systematic review, meta-analysis and meta-regression of the effect of protein supplementation on resistance training-induced gains in muscle mass and strength in healthy adults. Br. J. Sports Med. 2018, 52, 376–384. [Google Scholar] [CrossRef] [PubMed]
- Binmahfoz, A.; Dighriri, A.; Gray, C.; Gray, S.R. Effect of resistance exercise on body composition, muscle strength and cardiometabolic health during dietary weight loss in people living with overweight or obesity: a systematic review and meta-analysis. BMJ Open Sport Exerc Med. 2025, 11, e002363. [Google Scholar] [CrossRef] [PubMed]
- Laddu, D.R.; Lee, V.R.; Blew, R.M.; Sato, T.; Lohman, T.G.; Going, S.B. Predicting visceral adipose tissue by MRI using DXA and anthropometry in adolescents and young adults. Int. J. Body Compos Res. 2012, 10, 93–100. [Google Scholar] [PubMed]
- Huang, J.; Li, Y.; Chen, M.; Cai, Z.; Cai, Z.; Jiang, Z. Comparing caloric restriction regimens for effective weight management in adults: a systematic review and network meta-analysis. Int. J. Behav. Nutr. Phys. Act. 2024, 21, 108. [Google Scholar] [CrossRef] [PubMed]
- Kibret, K.T.; Peeters, A.; Tegegne, T.K.; Mesfin, Y.M.; Nichols, M. Intermittent Fasting for the Prevention of Cardiovascular Disease Risks: Systematic Review and Network Meta-Analysis. Curr. Nutr. Rep. 2025, 14, 93. [Google Scholar] [CrossRef] [PubMed]
- Silva, A.I.; Direito, M.; Pinto-Ribeiro, F.; Ludovico, P.; Sampaio-Marques, B. Effects of Intermittent Fasting on Regulation of Metabolic Homeostasis: A Systematic Review and Meta-Analysis in Health and Metabolic-Related Disorders. J. Clin. Med. 2023, 12. [Google Scholar] [CrossRef] [PubMed]
- Bergman, R.N.; Kim, S.P.; Catalano, K.J.; Hsu, I.R.; Chiu, J.D.; Kabir, M.; Hucking, K.; Ader, M. Why visceral fat is bad: mechanisms of the metabolic syndrome. Obesity 2006, 14 Suppl 1, 16s–19s. [Google Scholar] [CrossRef] [PubMed]
- Yao, K.; Duan, Y.; Li, F.; Tan, B.; Hou, Y.; Wu, G.; Yin, Y. Leucine in Obesity: Therapeutic Prospects. Trends Pharmacol. Sci. 2016, 37, 714–727. [Google Scholar] [CrossRef] [PubMed]
- Zhang, L.; Li, F.; Guo, Q.; Duan, Y.; Wang, W.; Zhong, Y.; Yang, Y.; Yin, Y. Leucine Supplementation: A Novel Strategy for Modulating Lipid Metabolism and Energy Homeostasis. Nutrients 2020, 12. [Google Scholar] [CrossRef] [PubMed]
- Barnosky, A.; Kroeger, C.M.; Trepanowski, J.F.; Klempel, M.C.; Bhutani, S.; Hoddy, K.K.; Gabel, K.; Shapses, S.A.; Varady, K.A. Effect of alternate day fasting on markers of bone metabolism: An exploratory analysis of a 6-month randomized controlled trial. Nutr. Healthy Aging 2017, 4, 255–263. [Google Scholar] [CrossRef] [PubMed]
- Brown, J.D.; Buscemi, J.; Milsom, V.; Malcolm, R.; O'Neil, P.M. Effects on cardiovascular risk factors of weight losses limited to 5-10. Transl. Behav. Med. 2016, 6, 339–346. [Google Scholar] [CrossRef] [PubMed]
- Vidal, J. Updated review on the benefits of weight loss. Int. J. Obes. Relat. Metab. Disord. 2002, 26 Suppl 4, S25–28. [Google Scholar] [CrossRef] [PubMed]
- Santos, H.O.; Lavie, C.J. Weight loss and its influence on high-density lipoprotein cholesterol (HDL-C) concentrations: A noble clinical hesitation. Clin. Nutr. ESPEN 2021, 42, 90–92. [Google Scholar] [CrossRef] [PubMed]
- Jiao, J.; Han, S.-F.; Zhang, W.; Xu, J.-Y.; Tong, X.; Yin, X.-B.; Yuan, L.-X.; Qin, L.-Q. Chronic leucine supplementation improves lipid metabolism in C57BL/6J mice fed with a high-fat/cholesterol diet. Food Nutr. Res. 2016, 60. [Google Scholar] [CrossRef] [PubMed]
- Horne, B.D.; Muhlestein, J.B.; Anderson, J.L. Health effects of intermittent fasting: hormesis or harm? A systematic review. Am. J. Clin. Nutr. 2015, 102, 464–470. [Google Scholar] [CrossRef] [PubMed]
- Johnson, J.B.; Laub, D.R.; John, S. The effect on health of alternate day calorie restriction: eating less and more than needed on alternate days prolongs life. Med. Hypotheses 2006, 67, 209–211. [Google Scholar] [CrossRef] [PubMed]
- Yang, J.; Chi, Y.; Burkhardt, B.R.; Guan, Y.; Wolf, B.A. Leucine metabolism in regulation of insulin secretion from pancreatic beta cells. Nutr. Rev. 2010, 68, 270–279. [Google Scholar] [CrossRef] [PubMed]
Figure 1.
This figure depicts the CONSORT participant flow diagram.
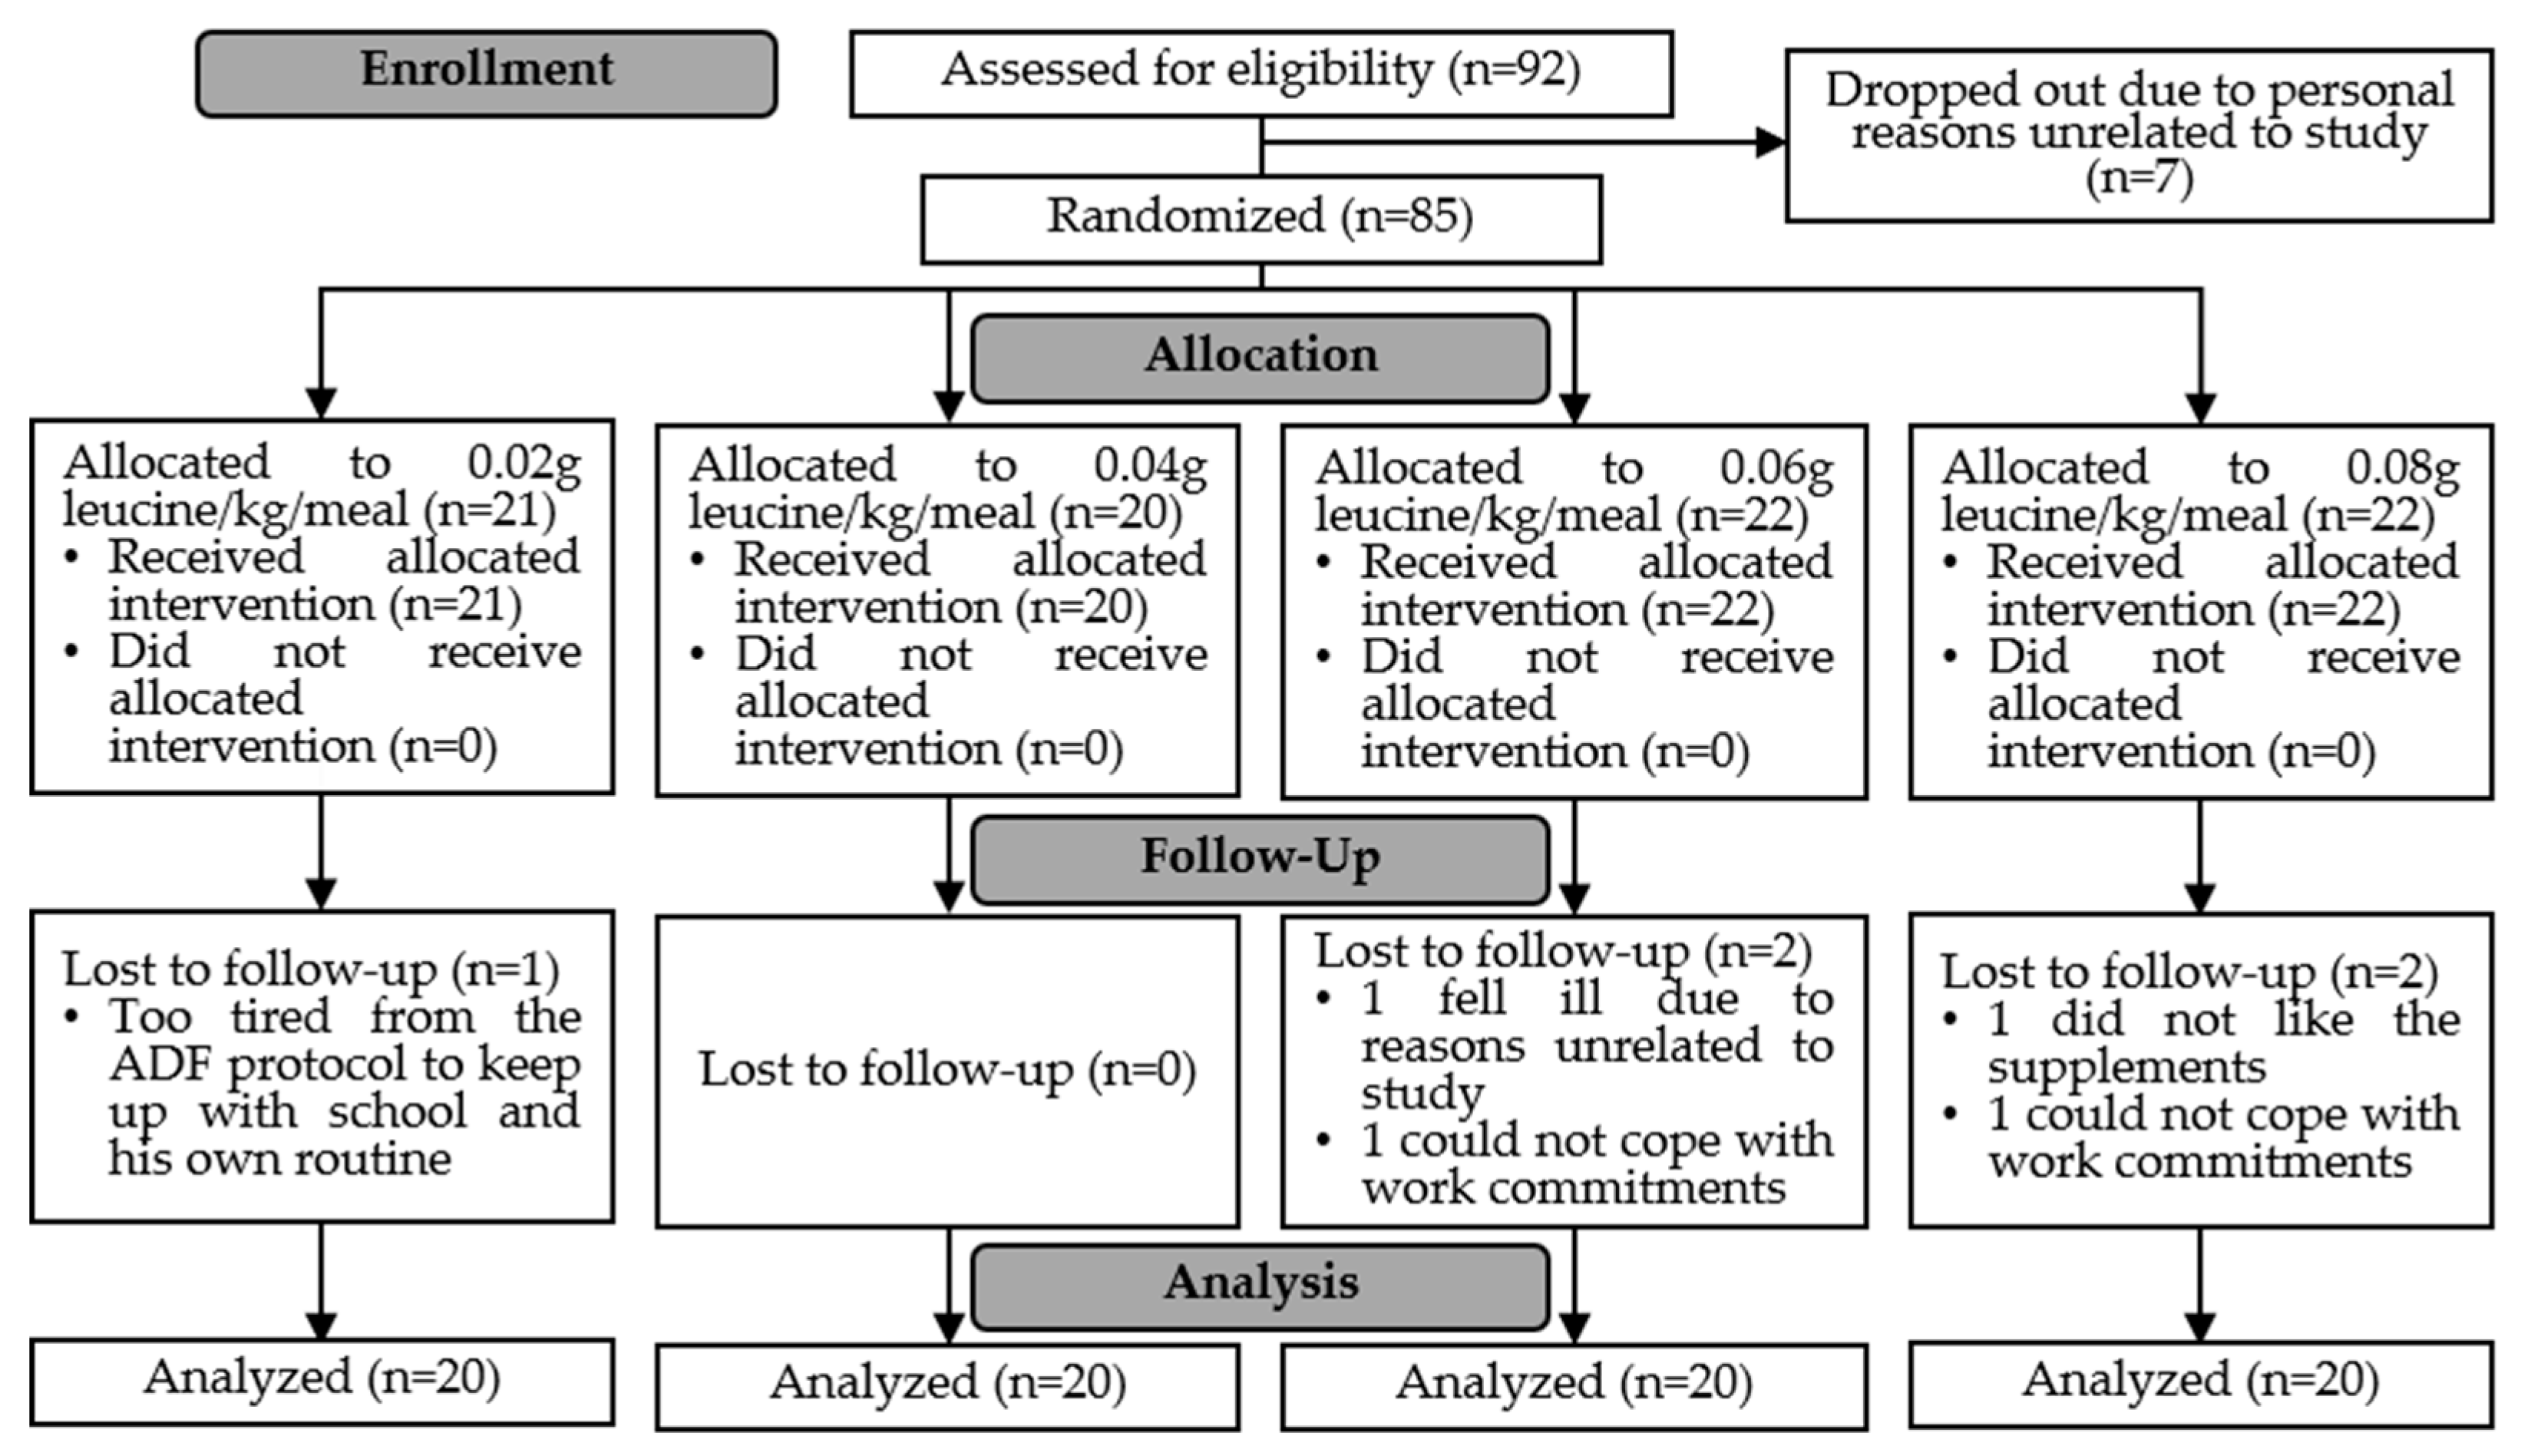
Figure 2.
Schematic of Laboratory Sessions. ADF, Alternate-Day Fasting; W, Week; S, Session.
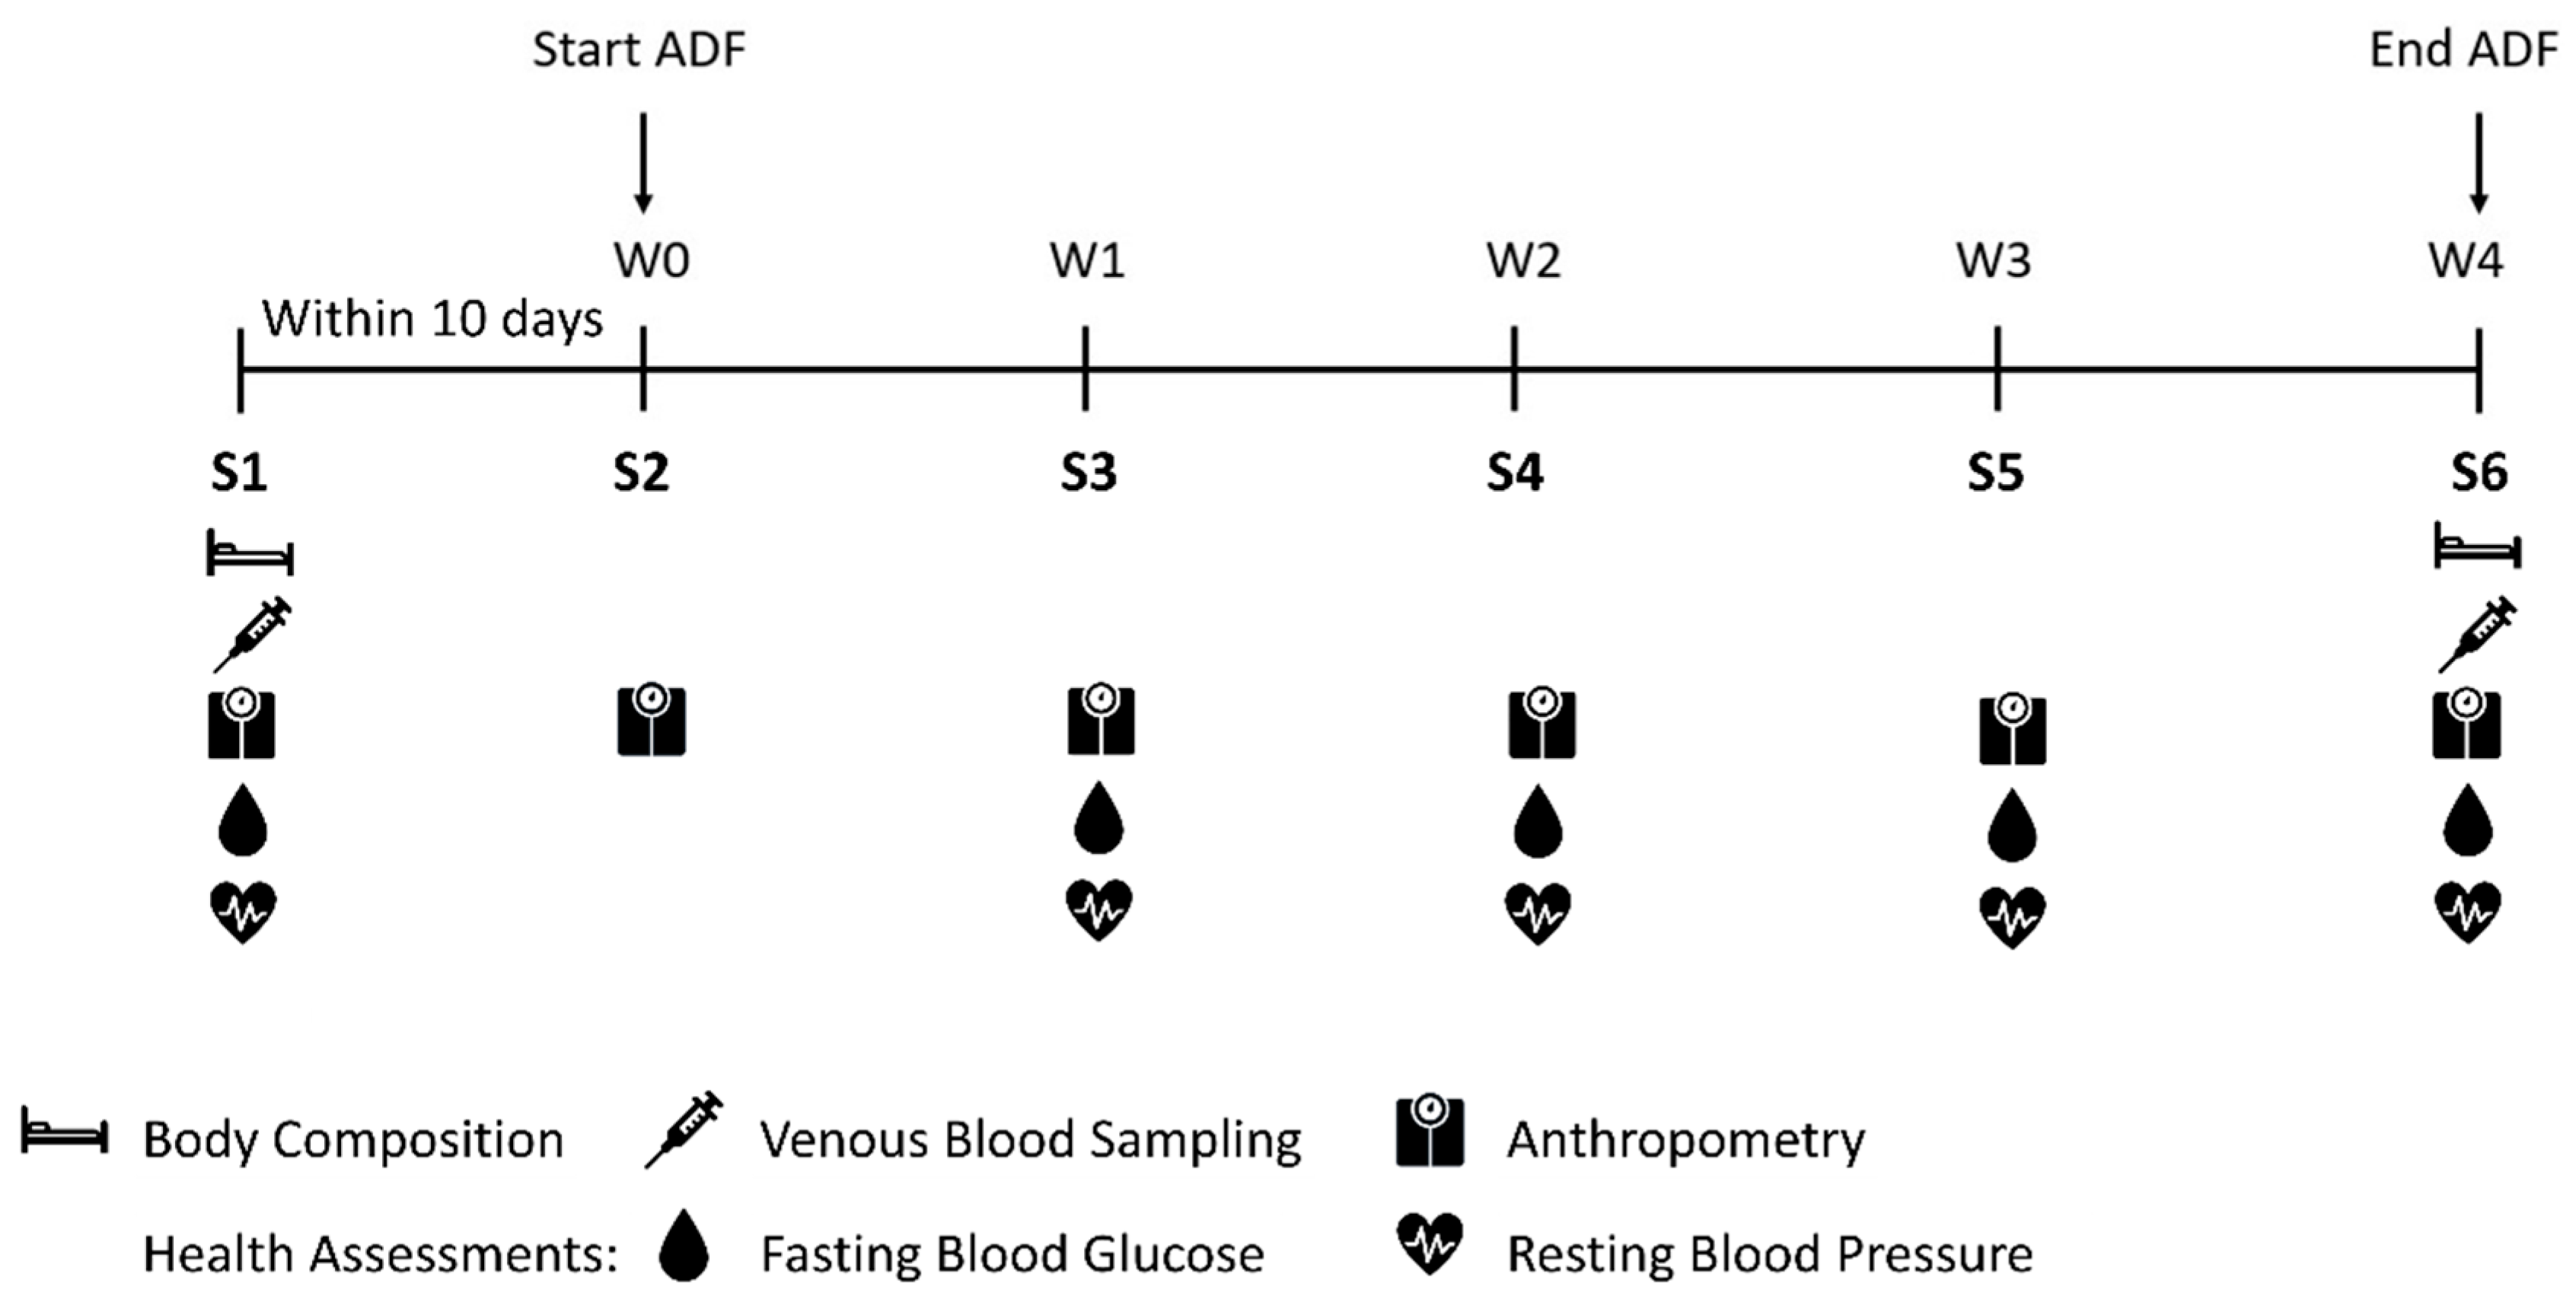
Figure 3.
Pre-post changes in body composition. Bar chart presented as mean and 95% CI, with scatterplot of individual data points. Leu, leucine; BM, body mass; FM, fat mass; LM, lean mass; ALM, appendicular lean mass; BMI, body mass index; FMI, fat mass index; LMI, lean mass index; ALMI, appendicular lean mass index; PBF, percentage body fat; BMC, bone mineral content; BMD, bone mineral density. *Significant main effect of time.
Figure 3.
Pre-post changes in body composition. Bar chart presented as mean and 95% CI, with scatterplot of individual data points. Leu, leucine; BM, body mass; FM, fat mass; LM, lean mass; ALM, appendicular lean mass; BMI, body mass index; FMI, fat mass index; LMI, lean mass index; ALMI, appendicular lean mass index; PBF, percentage body fat; BMC, bone mineral content; BMD, bone mineral density. *Significant main effect of time.
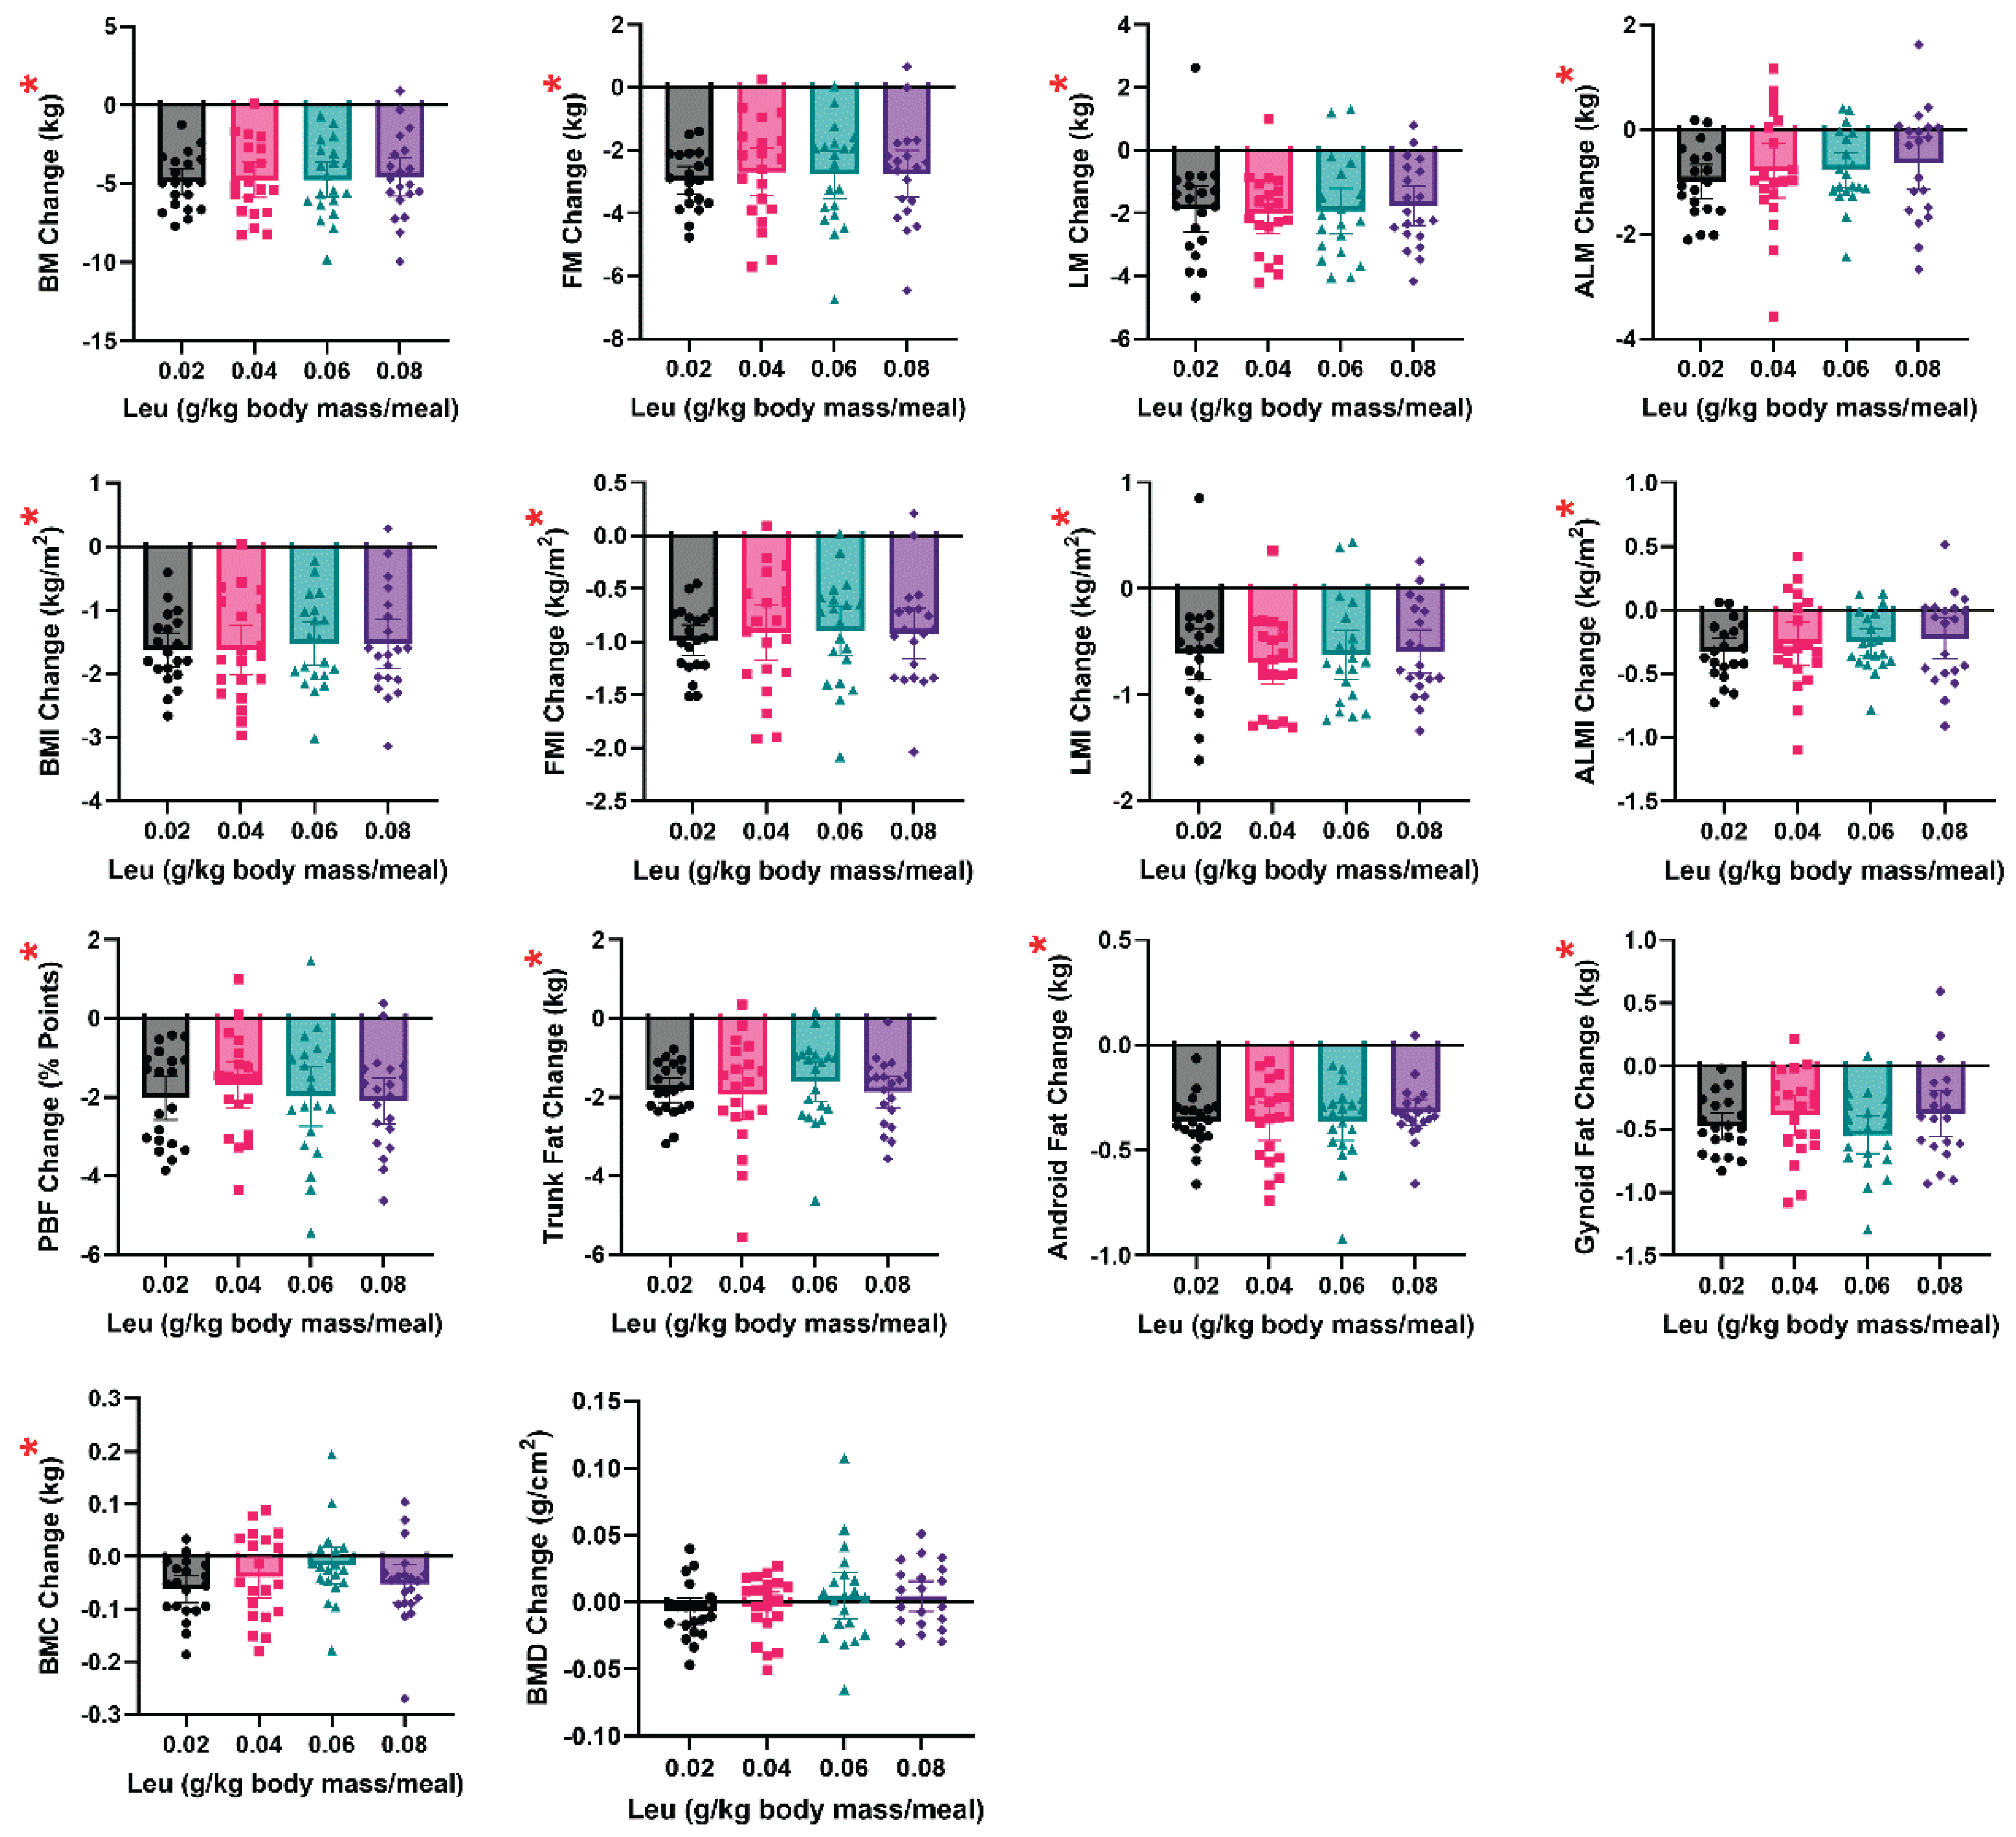

Table 1.
Participant characteristics.
| Leucine Dose | Group | 0.02 g/kg/meal | 0.04 g/kg/meal | 0.06 g/kg/meal | 0.08 g/kg/meal | ||||
| Characteristics | Session | Pre | Post | Pre | Post | Pre | Post | Pre | Post |
| N | 20 | 20 | 20 | 20 | 20 | 20 | 20 | 20 | |
| Age (y) | Mean | 26 | 26 | 24 | 24 | 25 | 25 | 25 | 25 |
| SD | 3 | 3 | 3 | 3 | 4 | 4 | 3 | 3 | |
| Min | 21 | 21 | 21 | 21 | 21 | 21 | 21 | 21 | |
| Max | 32 | 32 | 34 | 34 | 35 | 35 | 33 | 33 | |
| Height (m) | Mean | 1.73 | 1.73 | 1.71 | 1.71 | 1.75 | 1.75 | 1.72 | 1.72 |
| SD | 0.07 | 0.07 | 0.06 | 0.06 | 0.06 | 0.06 | 0.06 | 0.06 | |
| Min | 1.61 | 1.61 | 1.59 | 1.59 | 1.64 | 1.64 | 1.60 | 1.60 | |
| Max | 1.92 | 1.92 | 1.84 | 1.84 | 1.86 | 1.86 | 1.85 | 1.85 | |
| Body Mass (kg) | Mean | 83.0 | 78.1 | 82.8 | 78.0 | 81.2 | 76.4 | 81.7 | 77.1 |
| SD | 12.0 | 11.8 | 11.8 | 10.5 | 13.2 | 11.7 | 13.4 | 13.4 | |
| Min | 67.4 | 62.5 | 59.1 | 55.2 | 65.4 | 61.5 | 60.4 | 56.4 | |
| Max | 104.9 | 97.2 | 104.8 | 97.0 | 124.6 | 114.8 | 115.9 | 107.8 | |
| Fat Mass (kg) | Mean | 24.4 | 21.4 | 23.3 | 20.6 | 20.7 | 17.9 | 22.0 | 19.2 |
| SD | 7.3 | 7.4 | 9.3 | 8.6 | 8.6 | 8.1 | 9.7 | 9.6 | |
| Min | 12.6 | 10.5 | 8.9 | 6.6 | 6.4 | 4.7 | 5.0 | 3.2 | |
| Max | 35.7 | 33.4 | 39.6 | 35.0 | 38.8 | 32.0 | 42.1 | 38.5 | |
| Lean Mass (kg) | Mean | 55.4 | 53.5 | 56.2 | 54.2 | 57.4 | 55.4 | 56.4 | 54.6 |
| SD | 7.0 | 7.0 | 5.4 | 5.2 | 7.9 | 8.0 | 7.3 | 7.4 | |
| Min | 42.1 | 41.1 | 47.9 | 46.2 | 46.2 | 43.1 | 41.9 | 39.5 | |
| Max | 67.2 | 66.4 | 65.4 | 62.4 | 81.8 | 78.6 | 69.5 | 67.1 | |
| Appendicular Lean Mass (kg) | Mean | 26.3 | 25.3 | 26.5 | 25.7 | 27.0 | 26.3 | 27.0 | 26.3 |
| SD | 3.8 | 3.6 | 3.1 | 2.8 | 3.5 | 3.6 | 3.7 | 3.7 | |
| Min | 20.1 | 19.0 | 21.8 | 20.9 | 20.8 | 20.1 | 19.2 | 18.0 | |
| Max | 32.5 | 31.6 | 30.7 | 29.7 | 37.4 | 36.3 | 34.3 | 33.3 | |
| Body Mass Index (kg/m2) | Mean | 27.6 | 26.0 | 28.2 | 26.5 | 26.5 | 24.9 | 27.4 | 25.9 |
| SD | 3.3 | 3.3 | 3.6 | 3.1 | 3.4 | 3.1 | 3.3 | 3.5 | |
| Min | 23.0 | 21.3 | 23.1 | 21.8 | 23.3 | 21.9 | 23.5 | 21.8 | |
| Max | 36.3 | 33.6 | 35.7 | 32.8 | 38.5 | 35.4 | 34.1 | 32.7 | |
| Fat Mass Index (kg/m2) | Mean | 8.1 | 7.1 | 7.9 | 7.0 | 6.7 | 5.8 | 7.4 | 6.4 |
| SD | 2.2 | 2.3 | 3.1 | 2.9 | 2.6 | 2.5 | 3.1 | 3.1 | |
| Min | 4.6 | 3.8 | 3.2 | 2.6 | 2.1 | 1.5 | 1.7 | 1.1 | |
| Max | 12.4 | 11.4 | 14.4 | 12.7 | 12.0 | 9.9 | 14.3 | 13.4 | |
| Lean Mass Index (kg/m2) | Mean | 18.4 | 17.8 | 19.2 | 18.5 | 18.7 | 18.1 | 19.0 | 18.4 |
| SD | 2.0 | 2.0 | 1.7 | 1.6 | 2.2 | 2.3 | 1.6 | 1.7 | |
| Min | 15.3 | 14.3 | 16.2 | 15.7 | 15.6 | 15.1 | 16.5 | 15.5 | |
| Max | 22.7 | 21.6 | 21.8 | 22.2 | 25.3 | 24.3 | 21.9 | 21.9 | |
| Appendicular Lean Mass Index (kg/m2) | Mean | 8.7 | 8.4 | 9.0 | 8.8 | 8.8 | 8.6 | 9.1 | 8.8 |
| SD | 1.0 | 1.0 | 1.0 | 0.9 | 1.0 | 1.0 | 0.8 | 0.8 | |
| Min | 7.2 | 6.8 | 7.4 | 7.1 | 7.3 | 7.1 | 7.6 | 7.1 | |
| Max | 10.5 | 10.3 | 10.4 | 10.4 | 11.6 | 11.2 | 10.8 | 10.9 | |
| Percent Body Fat (%) | Mean | 29.0 | 27.0 | 27.3 | 25.6 | 24.9 | 22.9 | 26.2 | 24.1 |
| SD | 5.8 | 6.5 | 8.2 | 8.4 | 7.7 | 8.6 | 8.5 | 8.9 | |
| Min | 18.2 | 16.0 | 13.9 | 11.0 | 8.7 | 6.5 | 7.2 | 5.0 | |
| Max | 36.6 | 35.6 | 40.2 | 38.7 | 35.8 | 35.0 | 42.5 | 41.2 | |
| Trunk Fat Mass (kg) | Mean | 13.9 | 12.1 | 13.5 | 11.6 | 11.0 | 9.4 | 12.2 | 10.3 |
| SD | 4.4 | 4.4 | 5.9 | 5.2 | 4.9 | 4.6 | 5.5 | 5.3 | |
| Min | 7.5 | 6.2 | 4.3 | 3.0 | 3.2 | 2.1 | 2.6 | 1.5 | |
| Max | 22.2 | 19.8 | 25.6 | 20.0 | 23.7 | 19.1 | 24.4 | 21.3 | |
| Android Fat Mass (kg) | Mean | 2.5 | 2.2 | 2.4 | 2.0 | 2.0 | 1.6 | 2.1 | 1.8 |
| SD | 0.9 | 0.9 | 1.1 | 1.0 | 0.9 | 0.9 | 1.0 | 1.0 | |
| Min | 1.3 | 1.0 | 0.8 | 0.5 | 0.6 | 0.3 | 0.4 | 0.2 | |
| Max | 4.6 | 4.0 | 4.6 | 3.9 | 4.2 | 3.3 | 4.3 | 4.0 | |
| Gynoid Fat Mass (kg) | Mean | 4.3 | 3.8 | 4.2 | 3.8 | 3.9 | 3.4 | 3.9 | 3.5 |
| SD | 1.3 | 1.2 | 1.5 | 1.3 | 1.4 | 1.3 | 1.5 | 1.5 | |
| Min | 2.2 | 2.0 | 1.8 | 1.6 | 1.5 | 0.9 | 1.1 | 0.7 | |
| Max | 6.7 | 6.2 | 6.7 | 6.1 | 6.5 | 5.7 | 7.2 | 6.8 | |
|
Bone Mineral Content (kg) |
Mean | 3.20 | 3.14 | 3.27 | 3.23 | 3.14 | 3.12 | 3.30 | 3.25 |
| SD | 0.45 | 0.44 | 0.45 | 0.43 | 0.43 | 0.44 | 0.58 | 0.54 | |
| Min | 2.61 | 2.60 | 2.31 | 2.33 | 2.43 | 2.53 | 2.08 | 2.15 | |
| Max | 4.15 | 4.11 | 3.95 | 3.98 | 4.02 | 4.22 | 4.45 | 4.22 | |
|
Bone Mineral Density (g/cm2) |
Mean | 1.29 | 1.28 | 1.33 | 1.32 | 1.27 | 1.27 | 1.32 | 1.33 |
| SD | 0.08 | 0.09 | 0.12 | 0.11 | 0.08 | 0.09 | 0.11 | 0.10 | |
| Min | 1.09 | 1.09 | 1.10 | 1.12 | 1.11 | 1.10 | 1.06 | 1.10 | |
| Max | 1.46 | 1.45 | 1.49 | 1.49 | 1.39 | 1.44 | 1.51 | 1.50 | |
Table 2.
Baseline Characteristics.
|
Group (Leucine Dose) |
N | Mean | SD | Min | Max | |
| Body Mass (kg) | 0.02 g/kg/meal | 20 | 82.8 | 11.9 | 67.5 | 105.5 |
| 0.04 g/kg/meal | 20 | 82.6 | 11.3 | 60.6 | 102.7 | |
| 0.06 g/kg/meal | 20 | 81.4 | 13.8 | 64.4 | 128.6 | |
| 0.08 g/kg/meal | 20 | 81.5 | 13.2 | 61.7 | 115.2 | |
| Age (y) | 0.02 g/kg/meal | 20 | 25.9 | 3.0 | 21.0 | 32.0 |
| 0.04 g/kg/meal | 20 | 24.1 | 3.4 | 21.0 | 34.0 | |
| 0.06 g/kg/meal | 20 | 24.6 | 3.5 | 21.0 | 35.0 | |
| 0.08 g/kg/meal | 20 | 25.3 | 3.1 | 21.0 | 33.0 | |
| GPAQ Physical Activity Level (MET·min) | 0.02 g/kg/meal | 20 | 1281 | 861 | 220 | 3941 |
| 0.04 g/kg/meal | 20 | 1435 | 1115 | 320 | 4920 | |
| 0.06 g/kg/meal | 20 | 1231 | 988 | 120 | 3800 | |
| 0.08 g/kg/meal | 20 | 1369 | 859 | 228 | 3280 | |
| Daily Energy Expenditure (kcal) | 0.02 g/kg/meal | 20 | 2058 | 278 | 1561 | 2736 |
| 0.04 g/kg/meal | 20 | 2071 | 253 | 1683 | 2474 | |
| 0.06 g/kg/meal | 20 | 2043 | 300 | 1616 | 2852 | |
| 0.08 g/kg/meal | 20 | 2061 | 345 | 1621 | 2994 |
GPAQ, global physical activity questionnaire; MET, metabolic equivalent of task.
Table 3.
Potential Confounders during the 4-Week Intervention.
|
Group (Leucine Dose) |
N | Mean | SD | Min | Max | |
| Average Sleep (h/day) | 0.02 g/kg/meal | 20 | 7.5 | 0.6 | 6.2 | 8.5 |
| 0.04 g/kg/meal | 20 | 6.9 | 0.7 | 5.6 | 8.2 | |
| 0.06 g/kg/meal | 20 | 7.1 | 0.7 | 5.4 | 8.3 | |
| 0.08 g/kg/meal | 20 | 7.3 | 1.0 | 5.0 | 8.7 | |
| Total Physical Activity (MET·min) | 0.02 g/kg/meal | 20 | 3326 | 2402 | 620 | 7808 |
| 0.04 g/kg/meal | 20 | 2982 | 2247 | 572 | 10044 | |
| 0.06 g/kg/meal | 20 | 3336 | 2253 | 776 | 8348 | |
| 0.08 g/kg/meal | 20 | 3017 | 1794 | 720 | 8308 | |
|
Total Resistance Exercise Time (h) |
0.02 g/kg/meal | 20 | 2.2 | 3.0 | 0.0 | 11.3 |
| 0.04 g/kg/meal | 20 | 2.3 | 3.5 | 0.0 | 12.7 | |
| 0.06 g/kg/meal | 20 | 2.6 | 3.7 | 0.0 | 14.9 | |
| 0.08 g/kg/meal | 20 | 1.7 | 1.5 | 0.0 | 5.7 |
MET, metabolic equivalent of task.
Table 4.
Diet Analysis.
| Group1 | N | Energy (kcal) | Protein (g) | Leucine (g) | Fat (g) | CHO (g) | Protein (%) | Fat (%) | CHO (%) | Energy (kcal/kg) | Protein (g/kg) | Leucine (g/kg) |
| Given (Feeding Day) | ||||||||||||
| 0.02 | 20 | 2484 (281) | 81 (11) | 5.3 (0.8) | 81 (11) | 359 (42) | 13 (1) | 29 (2) | 58 (2) | 30.59 (2.23) | 1.00 (0.07) | 0.06 (0.00) |
| 0.04 | 20 | 2487 (249) | 95 (12) | 9.7 (1.4) | 83 (12) | 340 (37) | 15 (1) | 30 (2) | 55 (3) | 30.81 (3.13) | 1.17 (0.06) | 0.12 (0.00) |
| 0.06 | 20 | 2465 (324) | 96 (16) | 14.1 (2.3) | 82 (15) | 336 (38) | 16 (1) | 30 (2) | 55 (3) | 30.99 (2.52) | 1.20 (0.06) | 0.18 (0.00) |
| 0.08 | 20 | 2467 (316) | 98 (15) | 19.0 (3.1) | 81 (12) | 337 (45) | 16 (1) | 29 (2) | 55 (3) | 30.87 (2.22) | 1.22 (0.06) | 0.24 (0.00) |
| Given (Fasting Day) | ||||||||||||
| 0.02 | 20 | 504 (58) | 26 (5) | 1.8 (0.3) | 17 (4) | 61 (12) | 20 (3) | 31 (7) | 49 (8) | 6.22 (0.47) | 0.32 (0.05) | 0.02 (0.00) |
| 0.04 | 20 | 499 (46) | 37 (5) | 3.5 (0.5) | 14 (2) | 56 (8) | 29 (3) | 26 (4) | 45 (4) | 6.18 (0.62) | 0.45 (0.05) | 0.04 (0.00) |
| 0.06 | 20 | 498 (71) | 45 (7) | 4.8 (0.7) | 15 (4) | 46 (9) | 36 (4) | 27 (5) | 37 (4) | 6.27 (0.47) | 0.57 (0.04) | 0.06 (0.00) |
| 0.08 | 20 | 500 (66) | 52 (7) | 6.4 (1.1) | 14 (3) | 41 (7) | 42 (3) | 26 (4) | 33 (2) | 6.27 (0.54) | 0.65 (0.07) | 0.08 (0.00) |
| Given (Overall) | ||||||||||||
| 0.02 | 20 | 1494 (169) | 54 (8) | 3.6 (0.5) | 49 (6) | 210 (25) | 14 (1) | 30 (2) | 56 (2) | 18.41 (1.34) | 0.66 (0.05) | 0.04 (0.00) |
| 0.04 | 20 | 1493 (147) | 66 (8) | 6.6 (1.0) | 49 (6) | 198 (21) | 18 (2) | 29 (2) | 53 (2) | 18.49 (1.87) | 0.81 (0.05) | 0.08 (0.00) |
| 0.06 | 20 | 1482 (197) | 71 (11) | 9.5 (1.5) | 48 (9) | 191 (23) | 19 (2) | 29 (2) | 52 (2) | 18.63 (1.49) | 0.89 (0.04) | 0.12 (0.00) |
| 0.08 | 20 | 1483 (190) | 75 (10) | 12.7 (2.1) | 48 (7) | 189 (25) | 20 (1) | 29 (2) | 51 (2) | 18.57 (1.35) | 0.94 (0.06) | 0.16 (0.00) |
| Consumed (Feeding Day) | ||||||||||||
| 0.02 | 20 | 2355 (388) | 80 (13) | 5.2 (0.8) | 75 (15) | 340 (57) | 14 (1) | 29 (2) | 58 (2) | 28.86 (3.17) | 0.98 (0.08) | 0.06 (0.00) |
| 0.04 | 20 | 2362 (247) | 94 (11) | 9.6 (1.4) | 77 (11) | 322 (43) | 16 (2) | 29 (2) | 54 (3) | 29.43 (4.32) | 1.16 (0.07) | 0.12 (0.00) |
| 0.06 | 20 | 2312 (238) | 94 (12) | 13.9 (2.0) | 76 (10) | 314 (38) | 16 (2) | 29 (2) | 54 (3) | 29.35 (4.09) | 1.18 (0.08) | 0.17 (0.00) |
| 0.08 | 20 | 2423 (332) | 97 (15) | 18.9 (3.1) | 79 (14) | 331 (45) | 16 (1) | 29 (2) | 55 (3) | 30.29 (2.23) | 1.21 (0.06) | 0.23 (0.00) |
| Consumed (Fasting Day) | ||||||||||||
| 0.02 | 20 | 500 (61) | 26 (5) | 1.8 (0.3) | 17 (5) | 61 (12) | 21 (3) | 31 (7) | 49 (8) | 6.17 (0.50) | 0.32 (0.05) | 0.02 (0.00) |
| 0.04 | 20 | 496 (45) | 37 (5) | 3.5 (0.5) | 14 (2) | 56 (8) | 30 (3) | 26 (4) | 45 (4) | 6.16 (0.65) | 0.45 (0.05) | 0.04 (0.00) |
| 0.06 | 20 | 489 (67) | 44 (7) | 4.7 (0.8) | 15 (4) | 45 (8) | 36 (3) | 27 (5) | 37 (5) | 6.15 (0.52) | 0.56 (0.05) | 0.06 (0.00) |
| 0.08 | 20 | 500 (67) | 52 (7) | 6.4 (1.1) | 14 (3) | 41 (7) | 42 (3) | 26 (4) | 33 (2) | 6.26 (0.55) | 0.65 (0.07) | 0.08 (0.00) |
| Consumed (Overall) | ||||||||||||
| 0.02 | 20 | 1427 (221) | 53 (8) | 3.5 (0.5) | 46 (9) | 200 (32) | 15 (1) | 29 (2) | 56 (2) | 17.52 (1.73) | 0.65 (0.05) | 0.04 (0.00) |
| 0.04 | 20 | 1429 (141) | 65 (8) | 6.6 (0.9) | 46 (6) | 189 (24) | 18 (2) | 29 (2) | 53 (3) | 17.79 (2.47) | 0.81 (0.05) | 0.08 (0.00) |
| 0.06 | 20 | 1400 (136) | 69 (9) | 9.3 (1.4) | 45 (6) | 179 (20) | 20 (2) | 29 (2) | 51 (3) | 17.75 (2.23) | 0.87 (0.05) | 0.12 (0.00) |
| 0.08 | 20 | 1461 (198) | 74 (10) | 12.7 (2.1) | 47 (8) | 186 (26) | 20 (1) | 29 (2) | 51 (2) | 18.28 (1.36) | 0.93 (0.06) | 0.16 (0.00) |
| Data presented as mean (SD). *Group by leucine dose (g/kg/meal). CHO, Carbohydrates. | ||||||||||||
Table 5.
Body Composition Analyses – Main effect of time.
| Characteristics | 95% CI | ||||
| p-value |
Mean Difference* |
Lower | Upper | Cohen’s d | |
| Body mass (kg) | < 0.001 | -4.7 | -5.2 | -4.2 | -0.4 |
| Fat Mass (kg) | < 0.001 | -2.8 | -3.1 | -2.5 | -0.3 |
| Lean Mass (kg) | < 0.001 | -1.9 | -2.2 | -1.6 | -0.3 |
| ALM (kg) | < 0.001 | -0.8 | -1.0 | -0.6 | -0.2 |
| BMI (kg/m2) | < 0.001 | -1.6 | -1.7 | -1.4 | -0.5 |
| FMI (kg/m2) | < 0.001 | -0.9 | -1.0 | -0.8 | -0.3 |
| LMI Index (kg/m2) | < 0.001 | -0.6 | -0.7 | -0.5 | -0.3 |
| ALMI (kg/m2) | < 0.001 | -0.3 | -0.3 | -0.2 | -0.3 |
| PBF (%) | < 0.001 | -2.0 | -2.3 | -1.7 | -0.3 |
| Trunk Fat Mass (kg) | < 0.001 | -1.8 | -2.0 | -1.6 | -0.4 |
| Android Fat Mass (kg) | < 0.001 | -0.4 | -0.4 | -0.3 | -0.4 |
| Gynoid Fat Mass (kg) | < 0.001 | -0.4 | -0.5 | -0.4 | -0.3 |
| BMC (kg) | < 0.001 | -0.0 | -0.1 | -0.0 | -0.1 |
| BMD (g/cm2) | 0.992 | -0.0 | -0.0 | 0.0 | 0.0 |
*Post minus pre values. ALM, appendicular lean mass; LMI, lean mass index; ALMI, appendicular lean mass index; BMI, body mass index; PBF, percentage body fat; FMI, fat mass index; BMC, bone mineral content; BMD, bone mineral density.
Table 6.
Health Characteristics. N = 20 for each variable and all groups unless otherwise specified.
Table 6.
Health Characteristics. N = 20 for each variable and all groups unless otherwise specified.
| Leucine Dose | Group | 0.02 g/kg/meal | 0.04 g/kg/meal | 0.06 g/kg/meal | 0.08 g/kg/meal | ||||
| Characteristics | Session | Pre | Post | Pre | Post | Pre | Post | Pre | Post |
| Systolic Blood Pressure (mmHg) | Mean | 120 | 115 | 119 | 116 | 120 | 117 | 118 | 114 |
| SD | 8 | 9 | 9 | 7 | 6 | 6 | 9 | 10 | |
| Min | 100 | 99 | 100 | 99 | 107 | 106 | 100 | 98 | |
| Max | 129 | 130 | 141 | 128 | 129 | 127 | 138 | 135 | |
| Diastolic Blood Pressure (mmHg) | Mean | 72 | 69 | 74 | 72 | 72 | 70 | 71 | 68 |
| SD | 7 | 8 | 8 | 5 | 9 | 9 | 9 | 9 | |
| Min | 59 | 54 | 62 | 65 | 52 | 53 | 53 | 50 | |
| Max | 84 | 84 | 93 | 85 | 88 | 85 | 86 | 86 | |
| Fasting Glucose (mmol/L) | Mean | 5.4 | 5.1 | 5.4 | 5.2 | 5.4 | 5.0 | 5.3 | 5.1 |
| SD | 0.4 | 0.6 | 0.4 | 0.4 | 0.3 | 0.5 | 0.3 | 0.3 | |
| Min | 4.0 | 4.0 | 5.0 | 5.0 | 5.0 | 4.0 | 5.0 | 5.0 | |
| Max | 6.0 | 6.0 | 6.0 | 6.0 | 6.0 | 6.0 | 6.0 | 6.0 | |
| Insulin (mU/L) | N | 20 | 20 | 19 | 20 | 20 | 20 | 20 | 20 |
| Mean | 9.7 | 5.8 | 10.8 | 7.3 | 8.2 | 4.5 | 8.9 | 5.6 | |
| SD | 2.9 | 2.7 | 5.0 | 5.3 | 4.9 | 2.0 | 4.8 | 3.7 | |
| Min | 6.0 | 2.0 | 5.0 | 2.0 | 2.0 | 1.0 | 3.0 | 2.0 | |
| Max | 16.0 | 12.0 | 25.0 | 21.0 | 23.0 | 8.0 | 20.0 | 17.0 | |
| HOMA-IR (Homeostasis Model Assessment of Insulin Resistance) | N | 20 | 20 | 19 | 20 | 20 | 20 | 20 | 20 |
| Mean | 2.3 | 1.4 | 2.6 | 1.8 | 2.0 | 1.0 | 2.1 | 1.3 | |
| SD | 0.7 | 0.7 | 1.3 | 1.4 | 1.2 | 0.5 | 1.2 | 0.9 | |
| Min | 1.0 | 0.0 | 1.0 | 0.0 | 1.0 | 0.0 | 1.0 | 0.0 | |
| Max | 4.0 | 3.0 | 7.0 | 5.0 | 5.0 | 2.0 | 5.0 | 4.0 | |
| HbA1c (%, Glycated Hemoglobin) | N | 20 | 20 | 19 | 20 | 20 | 19 | 20 | 20 |
| Mean | 5.3 | 5.3 | 5.3 | 5.3 | 5.3 | 5.3 | 5.3 | 5.3 | |
| SD | 0.3 | 0.4 | 0.3 | 0.2 | 0.3 | 0.2 | 0.3 | 0.2 | |
| Min | 4.6 | 4.6 | 4.8 | 5.0 | 4.7 | 4.8 | 4.7 | 4.9 | |
| Max | 5.7 | 5.8 | 5.7 | 5.7 | 5.9 | 5.8 | 5.9 | 5.7 | |
| Total Cholesterol (mmol/L) | N | 19 | 20 | 18 | 20 | 20 | 20 | 20 | 20 |
| Mean | 4.8 | 4.3 | 5.2 | 4.6 | 4.3 | 4.0 | 5.0 | 4.4 | |
| SD | 0.9 | 0.8 | 1.0 | 0.9 | 0.8 | 0.5 | 1.0 | 1.2 | |
| Min | 3.5 | 3.0 | 3.6 | 2.7 | 3.3 | 3.1 | 3.7 | 2.8 | |
| Max | 6.4 | 5.7 | 6.7 | 6.0 | 5.7 | 5.4 | 8.3 | 7.6 | |
| High-Density Lipoprotein (HDL) Cholesterol (mmol/L) | N | 19 | 20 | 18 | 20 | 20 | 20 | 20 | 20 |
| Mean | 1.3 | 1.2 | 1.3 | 1.2 | 1.5 | 1.4 | 1.6 | 1.3 | |
| SD | 0.2 | 0.2 | 0.3 | 0.3 | 0.3 | 0.3 | 0.3 | 0.3 | |
| Min | 0.9 | 0.8 | 1.0 | 0.9 | 0.9 | 0.9 | 0.9 | 0.9 | |
| Max | 1.6 | 1.5 | 2.0 | 1.9 | 2.1 | 2.1 | 2.4 | 2.1 | |
| Low-Density Lipoprotein Cholesterol (mmol/L) | N | 19 | 20 | 18 | 20 | 20 | 20 | 20 | 20 |
| Mean | 3.0 | 2.6 | 3.3 | 2.9 | 2.5 | 2.2 | 2.9 | 2.6 | |
| SD | 0.8 | 0.8 | 0.9 | 0.8 | 0.7 | 0.5 | 0.9 | 1.1 | |
| Min | 1.8 | 1.3 | 1.9 | 1.1 | 1.6 | 1.4 | 2.0 | 1.3 | |
| Max | 4.7 | 4.1 | 4.4 | 4.2 | 3.7 | 3.4 | 5.9 | 5.7 | |
| Total Cholesterol/ HDL Ratio | N | 19 | 20 | 18 | 20 | 20 | 20 | 20 | 20 |
| Mean | 3.9 | 3.8 | 4.0 | 3.8 | 3.1 | 3.0 | 3.4 | 3.4 | |
| SD | 1.0 | 1.0 | 0.9 | 0.9 | 0.9 | 0.7 | 1.1 | 1.2 | |
| Min | 2.4 | 2.4 | 2.2 | 2.2 | 1.9 | 1.8 | 2.1 | 2.1 | |
| Max | 5.6 | 6.1 | 5.8 | 5.4 | 5.1 | 4.0 | 7.1 | 6.7 | |
| Triglycerides (mmol/L) | N | 19 | 19 | 18 | 20 | 20 | 20 | 20 | 20 |
| Mean | 1.2 | 1.0 | 1.1 | 1.1 | 0.9 | 0.8 | 1.1 | 0.9 | |
| SD | 0.6 | 0.5 | 0.5 | 0.4 | 0.4 | 0.3 | 0.6 | 0.4 | |
| Min | 0.5 | 0.6 | 0.5 | 0.6 | 0.3 | 0.3 | 0.6 | 0.5 | |
| Max | 2.8 | 3.1 | 2.1 | 2.4 | 2.3 | 1.4 | 3.0 | 2.1 | |
Disclaimer/Publisher’s Note: The statements, opinions and data contained in all publications are solely those of the individual author(s) and contributor(s) and not of MDPI and/or the editor(s). MDPI and/or the editor(s) disclaim responsibility for any injury to people or property resulting from any ideas, methods, instructions or products referred to in the content. |
© 2026 by the authors. Licensee MDPI, Basel, Switzerland. This article is an open access article distributed under the terms and conditions of the Creative Commons Attribution (CC BY) license (http://creativecommons.org/licenses/by/4.0/).
Copyright: This open access article is published under a Creative Commons CC BY 4.0 license, which permit the free download, distribution, and reuse, provided that the author and preprint are cited in any reuse.