
Submitted:
18 August 2026
Posted:
19 August 2026
You are already at the latest version
Abstract
Background/Objectives: Baseline MRI findings may provide prognostic information beyond existing clinical scoring systems in primary central nervous system lymphoma (PCNSL). This study evaluated whether baseline MRI findings predict survival in immunocompetent PCNSL and assessed the clinical implications of subependymal enhancement for treatment decision-making. Methods: Fifty immunocompetent PCNSL patients treated at a single institution (2010–2024) were retrospectively analyzed. Baseline MRI features, including subependymal enhancement, leptomeningeal spread, and ventricular involvement, were evaluated. Univariate and multivariate Cox analyses were performed for PFS and OS, and the relationship between subependymal enhancement and chemoradiotherapy outcome was assessed by log-rank and interaction testing. Results: Median PFS and OS were 21.1 and 23.6 months, respectively. On multivariate analysis, subependymal enhancement was the strongest independent predictor of both PFS (HR 2.447, 95% CI 1.164–5.145; p=0.018) and OS (HR 2.607, 95% CI 1.279–5.313; p=0.008), and leptomeningeal spread was independently associated with worse OS (HR 3.418, 95% CI 1.473–7.932; p=0.004). Among patients with subependymal enhancement, chemoradiotherapy was associated with markedly improved PFS (33.5 vs. 3.0 months; p=0.029) and OS (39.8 vs. 13.4 months; p=0.029) and a higher complete response rate (100% vs. 0%) compared with chemotherapy alone. No significant chemoradiotherapy benefit was observed in patients without subependymal enhancement (PFS p=0.332; OS p=0.907). Conclusions: Subependymal enhancement and leptomeningeal spread independently predict survival in PCNSL. Although subependymal enhancement marks a poor-risk subgroup overall, patients with this feature who received chemoradiotherapy achieved markedly better outcomes, suggesting a role for early chemoradiotherapy in this population. Systematic MRI assessment at diagnosis may guide individualized treatment decisions beyond existing clinical scoring systems.
Keywords:
primary central nervous system
; lymphoma
; magnetic resonance imaging
; chemoradiotherapy
; prognosis
1. Introduction
Primary central nervous system lymphoma (PCNSL) is a rare and aggressive subtype of extranodal non-Hodgkin lymphoma confined to the brain, spinal cord, cerebrospinal fluid (CSF), and eyes, without evidence of systemic disease at diagnosis [1,2]. Histologically, the vast majority of cases are classified as diffuse large B-cell lymphoma (DLBCL) and the disease accounts for approximately 1%–5% of all primary brain tumors [2,3]. The introduction of HD-MTX-based chemotherapy have substantially improved outcomes over whole-brain radiotherapy (WBRT) alone [4,5]. Nevertheless, prognosis remains poor, with 5-year overall survival rates of only 30%–40% in unselected populations [1,3,6], and a significant risk of treatment-related neurotoxicity [7,8].
Risk stratification in PCNSL currently relies on the International Extranodal Lymphoma Study Group (IELSG) prognostic score and the Memorial Sloan-Kettering Cancer Center (MSKCC) recursive partitioning model [9,10]. However, both systems rely exclusively on clinical and laboratory parameters, without incorporating baseline MRI findings, which are routinely obtained at diagnosis and may provide independent, immediately available, and clinically actionable prognostic information at the time of treatment planning [11,12,13]. Furthermore, the involvement of deep structures of the brain criterion in the IELSG score subsumes a heterogeneous spectrum of tumor locations under a single binary variable, potentially limiting its prognostic precision [9,14].
Among the MRI features observed in PCNSL, subependymal enhancement, defined as linear or curvilinear contrast enhancement along the ependymal lining of the ventricular walls, and leptomeningeal spread represent distinct patterns of tumor dissemination that have been described in CNS lymphoma [11,15] but have not been systematically characterized as prognostic or predictive biomarkers in immunocompetent PCNSL. In the present study, we retrospectively analyzed 50 immunocompetent PCNSL patients treated over 15 years to evaluate whether these baseline MRI findings independently predict survival outcomes, and to assess whether subependymal enhancement may further identify patients who derive substantial survival benefit from the inclusion of chemoradiotherapy in their first-line treatment regimen.
2. Materials and Methods
2.1. Study Design and Patients
This was a single-center retrospective cohort study. We identified consecutive patients diagnosed with PCNSL between January 2010 and December 2024 at our hospital. Inclusion criteria were: (1) histologically confirmed PCNSL (diffuse large B-cell lymphoma type); (2) age ≥18 years; (3) absence of systemic lymphoma at diagnosis; and (4) availability of baseline MRI. Patients with HIV infection, prior immunosuppressive therapy, or secondary CNS lymphoma were excluded. A total of 50 patients were included. This study was approved by the Institutional Review Board of Incheon St. Mary’s Hospital, the Catholic University of Korea (IRB No. OC26RID10143), and informed consent was waived due to the retrospective design.
2.2. Clinical Data Collection
Baseline clinical characteristics included age, sex, Karnofsky Performance Status (KPS), ECOG performance status, and serum lactate dehydrogenase (LDH). Surgical approach was categorized as stereotactic biopsy, open biopsy, or craniotomy. First-line treatment regimens were classified as HD-MTX alone, ifosfamide-carboplatin-etoposide with or without radiotherapy (ICE±RT), methotrexate-procarbazine-vincristine with or without radiotherapy (MPV±RT), or RT alone. Chemoradiotherapy was defined as chemotherapy followed by planned RT as part of the first-line regimen (ICE+RT or MPV+RT). Radiologic response was assessed per the International PCNSL Collaborative Group (IPCG) criteria and categorized as complete response (CR), partial response (PR), stable disease (SD), or progressive disease (PD).
2.3. MRI Assessment
Baseline brain MRI was reviewed by a neuroradiologist blinded to clinical outcomes. The following features were evaluated: (1) number of lesions (solitary vs. multiple); (2) radiologic location (cortical vs. subcortical/deep structures); (3) subependymal enhancement, defined as linear or curvilinear contrast enhancement along the ventricular wall (ependymal lining); (4) ventricular involvement, defined as direct tumor extension into the ventricular cavity; and (5) leptomeningeal spread, defined as linear or nodular enhancement along leptomeningeal surfaces, cranial nerves, or an enhancing mass occupying the cisternal space without identifiable parenchymal origin.
2.4. Survival Outcomes
Progression-free survival (PFS) was defined as the time from initiation of first-line treatment to confirmed disease recurrence on MRI. Patients without confirmed recurrence (no recurrence or unknown status) were treated as true missing for the PFS event definition and were censored at their overall survival time. OS was defined as the time from diagnosis to death from any cause; surviving patients were censored at the last follow-up date.
2.5. Statistical Analysis
Categorical variables are presented as frequencies and percentages, and continuous variables as median with range. Survival curves were estimated using the Kaplan-Meier method and compared between groups using the log-rank test. Univariate Cox proportional hazards regression was performed to estimate hazard ratios (HRs) with 95% confidence intervals (CIs) for each prognostic variable. Given the small sample size, a parsimonious multivariate model was constructed using three variables selected based on clinical relevance and univariate analysis results: subependymal enhancement, leptomeningeal spread, and chemoradiotherapy. To evaluate the interaction between subependymal enhancement and chemoradiotherapy in first-line treatment, a Cox model including both variables and their product term (subependymal enhancement × chemoradiotherapy) was fitted; the likelihood ratio test was used to assess the statistical significance of the interaction term. Stratified log-rank tests were further performed within subependymal enhancement subgroups (Yes vs. No) to assess the chemoradiotherapy effect in each stratum. Treatment response rates (CR and overall response rate [ORR]) were compared between subgroups using Fisher's exact test. Non-parametric comparisons of continuous variables were performed using the Mann-Whitney U test. All statistical tests were two-sided, and P < 0.05 was considered statistically significant. Statistical analyses were performed using Python (version 3.12) with the lifelines (version 0.27) and SciPy libraries.
3. Results
3.1. Patient Characteristics
A total of 50 patients with PCNSL were included in this study. The median age was 63 years (range, 33–79 years), and 32 patients (64.0%) were older than 60 years. The male-to-female ratio was 28:22. The median KPS at diagnosis was 70 (range, 30–90), with 29 patients (58.0%) having 70 or greater. ECOG PS was 0–1 in 14 (28.0%), 2 in 21 (42.0%), and 3–4 in 15 (30.0%) patients. Serum LDH was evaluable in 40 patients; of these, 15 (37.5%) had elevated LDH.
On baseline MRI, solitary and multiple lesions were equally distributed. Subcortical or deep structure location was identified in 23 patients (46.0%), subependymal enhancement in 22 patients (44.0%), ventricular involvement in 9 (18.0%), and leptomeningeal spread in 9 (18.0%). Stereotactic biopsy was performed in 15 patients (30.0%), open biopsy in 24 (48.0%), and craniotomy in 11 (22.0%; non-GTR in 5, GTR in 6).
Regarding first-line treatment, 30 patients (60.0%) received HD-MTX alone, 8 (16.0%) received ICE±RT, 10 (20.0%) received MPV±RT, and 2 (4.0%) received radiotherapy alone. Of these, 13 patients (26.0%) received chemoradiotherapy (ICE+RT or MPV+RT) as part of their first-line regimen. Radiologic response after the first-line treatment was evaluable in 46 patients; CR was achieved in 25 (54.3%), PR in 6 (13.0%), SD in 1 (2.2%), and PD in 12 (26.1%). The overall response rate (ORR; CR+PR) was 67.4% (Table 1).
3.2. Survival Outcomes
With a median follow-up of 20.6 months (range, 0.7–148.7 months), confirmed disease recurrence following first-line treatment was documented in 33 patients (66.0%), while 9 (18.0%) had no recurrence and 8 (16.0%) had an unknown recurrence status. The overall median PFS was 21.1 months (events: 33/50; censored: 17). PFS rates were 65.8% (95% CI, 50.4–77.5%) at 6 months, 60.9% (95% CI, 45.1–73.3%) at 12 months, 37.9% (95% CI, 22.9–52.9%) at 24 months, and 25.3% (95% CI, 9.7–36.7%) at 36 months (Figure 1A).
At the time of analysis, 38 patients (76.0%) had died, 11 (22.0%) were alive, and 1 (2.0%) was lost to follow-up. The median OS for the entire cohort was 23.6 months. OS rates were 90.0% (95% CI, 75.2–94.4%) at 6 months, 77.6% (95% CI, 60.8–85.3%) at 12 months, 47.9% (95% CI, 32.8–61.6%) at 24 months, and 37.8% (95% CI, 23.6–52.0%) at 36 months (Figure 1B).
3.3. Univariate Analysis of Progression-Free Survival and Overall Survival
Among all variables evaluated on univariate analysis, MRI findings and treatment modality were most strongly associated with survival outcomes. Among MRI features, subependymal enhancement showed a borderline association with shorter PFS (Yes vs. No: 3.2 vs. 23.7 months; HR = 1.792; 95% CI, 0.934–3.437; P = 0.054). Regarding treatment modality, when analyzed with chemoradiotherapy as the reference group, chemotherapy alone was associated with significantly shorter PFS (median 10.6 vs. 33.5 months; HR = 2.302; 95% CI, 1.047–5.060; P = 0.024), while radiotherapy alone showed a trend toward worse PFS without reaching statistical significance (median 3.3 months; HR = 4.653; 95% CI, 0.400–54.155; P = 0.074). Other clinical and imaging variables, including age, sex, KPS, ECOG PS, serum LDH, number of lesions, radiologic location, ventricular involvement, and leptomeningeal spread, were not significantly associated with PFS (all P > 0.10) (Table 2).
For OS, the two MRI features of primary interest, subependymal enhancement and leptomeningeal spread, were identified as significant prognostic factors. The presence of subependymal enhancement was significantly associated with shorter OS (median 17.0 vs. 37.7 months; HR = 2.075; 95% CI, 1.089–3.954; P = 0.014), and leptomeningeal spread was associated with markedly worse OS (median 13.4 vs. 32.2 months; HR = 2.572; 95% CI, 1.174–5.635; P = 0.007). With respect to treatment, chemoradiotherapy did not show a statistically significant association with OS compared with chemotherapy alone (median 43.6 vs. 21.8 months; HR = 0.547; 95% CI, 0.223–1.343; P = 0.182). Although RT alone showed a marginal P-value for worse OS compared with chemoradiotherapy (P = 0.047), this finding is not interpretable given the extremely small sample size (n = 2) and an extremely wide confidence interval (HR = 4.415; 95% CI, 0.713–27.355). All remaining clinical and imaging variables were not significantly associated with OS (all P > 0.10) (Table 2).
Subependymal enhancement was also significantly associated with treatment response. The complete response rate was markedly lower in patients with subependymal enhancement than in those without (18.2% vs. 75.0%, P < 0.001), and the overall response rate (CR+PR) was similarly lower (31.8% vs. 85.7%, P < 0.001), indicating that the presence of subependymal enhancement on baseline MRI was strongly associated with a poor response to first-line chemotherapy-based treatment.
3.4. Multivariate Analysis of Progression-Free Survival and Overall Survival
Multivariate Cox proportional hazards analysis was performed using three variables: subependymal enhancement and leptomeningeal spread, selected as the primary MRI-based prognostic factors of interest identified on univariate analysis, and chemoradiotherapy, selected as the treatment variable given its stronger and more clinically homogeneous association with survival (Table 3).
For PFS, subependymal enhancement and chemoradiotherapy were identified as independent prognostic factors. Subependymal enhancement was independently associated with a significantly higher risk of disease recurrence (HR = 2.447; 95% CI, 1.164–5.145; P = 0.018), while chemoradiotherapy was independently associated with a significantly lower risk of recurrence (HR = 0.293; 95% CI, 0.115–0.741; P = 0.010). Leptomeningeal spread was not independently associated with PFS on multivariate analysis (HR = 1.427; 95% CI, 0.503–4.051; P = 0.504). The model demonstrated good discriminative ability (concordance index 0.725; likelihood ratio test P = 0.006).
For OS, subependymal enhancement and leptomeningeal spread were independently associated with significantly worse survival. Subependymal enhancement was independently associated with a significantly higher risk of death (HR = 2.607; 95% CI, 1.279–5.313; P = 0.008), and leptomeningeal spread was independently associated with significantly worse OS (HR = 3.418; 95% CI, 1.473–7.932; P = 0.004). Chemoradiotherapy showed a borderline association with improved OS that did not reach statistical significance (HR = 0.431; 95% CI, 0.174–1.071; P = 0.070). The model demonstrated acceptable discriminative ability (concordance index 0.672; likelihood ratio test P = 0.001).
3.5. Subependymal Enhancement as a Predictive Biomarker for Chemoradiotherapy Benefit
To evaluate whether subependymal enhancement predicts differential benefit from chemoradiotherapy, patients were stratified into four subgroups according to the presence or absence of subependymal enhancement on baseline MRI and whether chemoradiotherapy was included in their first-line treatment regimen: patients with subependymal enhancement who received chemoradiotherapy (Group A, n = 4), patients with subependymal enhancement who did not receive chemoradiotherapy (Group B, n = 18), patients without subependymal enhancement who received chemoradiotherapy (Group C, n = 9), and patients without subependymal enhancement who did not receive chemoradiotherapy (Group D, n = 19) (Figure 2A, 3A).
Among patients with subependymal enhancement, Group A demonstrated markedly superior outcomes compared with Group B. Median PFS was 33.5 months in Group A versus 3.0 months in Group B (P = 0.029) (Figure 2B), and median OS was 39.8 versus 13.4 months, respectively (P = 0.029) (Figure 3B). The complete response rate was 100% in Group A compared with 0% in Group B (P < 0.001). In contrast, no statistically significant difference in PFS or OS was observed between Group C and Group D (PFS: 28.4 vs. 21.2 months, P = 0.332; OS: 43.6 vs. 30.3 months, P = 0.907) (Figure 2C, 3C), suggesting that the beneficial effect of chemoradiotherapy on survival was largely confined to patients with subependymal enhancement.
The interaction between subependymal enhancement and chemoradiotherapy was formally assessed using a Cox regression model incorporating a product term. The interaction term did not reach statistical significance for either PFS (HR = 0.417; 95% CI, 0.098–1.776; P = 0.237) or OS (HR = 0.298; 95% CI, 0.067–1.323; P = 0.111), likely reflecting limited statistical power due to the small number of patients in Group A (n = 4). Nevertheless, the magnitude of the differential chemoradiotherapy effect across subependymal enhancement strata was clinically substantial, and the consistent findings across both PFS and OS endpoints strengthen the biological plausibility of this interaction.
Pairwise comparisons further demonstrated that Group B had significantly worse PFS and OS than those in all other subgroups. Compared with Group C, Group B showed significantly shorter PFS (3.0 vs. 28.4 months, P = 0.004) and a trend toward worse OS (13.4 vs. 43.6 months, P = 0.062). Similarly, compared with Group D, Group B had significantly worse PFS (3.0 vs. 21.2 months, P = 0.008) and OS (13.4 vs. 30.3 months, P = 0.002). Taken together, these findings suggest that subependymal enhancement on baseline MRI may identify a subset of PCNSL patients in whom chemotherapy alone is insufficient and the early incorporation of chemoradiotherapy into the first-line treatment regimen appears to confer substantial survival benefit, supporting its potential role as a predictive biomarker for chemoradiotherapy benefit.
4. Discussion
PCNSL remains one of the most challenging subtypes of non-Hodgkin lymphoma [16]. Prior to HD-MTX-based chemotherapy, WBRT alone yielded a median OS of 10–18 months with rapid relapse [17,18]. HD-MTX regimens improved complete response rates to 30%–60% and median OS to 25–60 months [19,20,21], and the IELSG32 randomized trial established the rituximab and thiotepa to methotrexate-cytarabine as a new induction benchmark for fit patients aged up to 70 years [22,23,24]. Despite these advances, 5-year OS rates remain at 30%–40% [1,6], relapse is common, and combined chemoradiotherapy carries a well-established risk of delayed neurotoxicity, particularly leukoencephalopathy, in up to 25%–35% of long-term survivors [18,25]. In our cohort, median PFS and OS of 21.1 and 23.6 months, respectively, are consistent with outcomes reported in previous series [26,27].
The IELSG prognostic score and MSKCC model are the most widely validated prognostic tools in PCNSL [9,10], but both rely exclusively on clinical and laboratory variables without incorporating baseline MRI findings. The involvement of deep structures of the brain in the IELSG score, encompassing periventricular region, basal ganglia, corpus callosum, brainstem, and cerebellum under a single binary criterion, has been criticized for its broad and heterogeneous definition, which may limit its prognostic precision [9,14]. Neither system incorporates MRI-based enhancement patterns, which may provide more sensitive and specific prognostic information [11,12].
Against this background, the present study provides novel evidence that two specific baseline MRI features, subependymal enhancement and leptomeningeal spread, independently predict survival in PCNSL, offering complementary prognostic information beyond existing scoring systems. Subependymal enhancement was present in 44% of patients and emerged as the strongest independent predictor of both PFS and OS on multivariate analysis. The markedly lower complete response rate in patients with subependymal enhancement compared with those without further underscores its association with a chemotherapy-resistant disease phenotype, and is consistent with the hypothesis that subependymal enhancement reflects diffuse tumor infiltration along the ependymal surface that is inadequately controlled by systemic chemotherapy alone. To the best of our knowledge, this is the first study to evaluate subependymal enhancement as an independent prognostic factor in immunocompetent PCNSL. Although subependymal enhancement has been described as a hallmark of leptomeningeal dissemination in secondary CNS lymphoma [11], its prognostic significance in immunocompetent PCNSL has not been previously investigated.
Leptomeningeal spread was independently associated with worse OS but not with PFS on multivariate analysis, revealing a dissociation between its effect on initial disease progression and long-term survival. Although leptomeningeal spread did not significantly shorten the time to first recurrence, indicating that first-line treatment achieves at least partial initial disease control even in the presence of leptomeningeal dissemination, it independently predicted a markedly higher risk of death. This pattern suggests that leptomeningeal spread identifies a subset of patients who achieve sufficient initial disease control to avoid early recurrence but are rendered highly susceptible to rapid fatal deterioration following relapse, possibly through impaired responsiveness to salvage therapy in the setting of diffuse leptomeningeal dissemination throughout the CSF compartment. Prior series have suggested a potential prognostic role of meningeal involvement in PCNSL [28,29], though this has not been consistently replicated [30,31], in part because CSF cytology has a well-recognized high false-negative rate for detecting meningeal disease [9]. MRI-based assessment of leptomeningeal enhancement may provide more sensitive and reproducible detection in this context. Clinically, identification of leptomeningeal spread at baseline MRI may alert treating physicians to patients at high risk of treatment-refractory relapse, warranting proactive discussion of salvage strategies, such as pomalidomide-based regimens for relapsed or refractory disease [32], and goals of care from the outset of treatment.
The most clinically significant finding of the present study is the identification of subependymal enhancement as a predictive biomarker for chemoradiotherapy benefit. Among patients with subependymal enhancement, chemoradiotherapy was associated with markedly superior PFS, OS, and CR rate compared with chemotherapy alone. In contrast, no significant survival benefit from chemoradiotherapy was observed in patients without subependymal enhancement, in whom chemotherapy alone showed comparable efficacy. These findings suggest that the benefit of radiotherapy in PCNSL is not uniformly distributed across all patients but is concentrated in those with subependymal enhancement, a subgroup poorly controlled by chemotherapy alone.
The biological basis for this differential treatment response is likely rooted in the anatomical characteristics of subependymal enhancement. The ventricular ependymal surface is contiguous with the entire ventricular system and communicates directly with the subarachnoid space, providing a continuous pathway for widespread CSF dissemination [33]. Although HD-MTX achieves therapeutic CSF concentrations [19,20], drug penetration and exposure across the human CNS are spatially heterogeneous and vary by anatomical region [34], raising the possibility that cytotoxic exposure may be insufficient across the full extent of diffusely infiltrated ependymal surfaces. Because its cytotoxic effect does not depend on systemic drug delivery, WBRT may offer a relative advantage over chemotherapy in regions of the CNS where blood–brain barrier limitations restrict adequate drug penetration [35], potentially eradicating residual or chemotherapy-resistant tumor cells that escape systemic agents. Conversely, in patients without subependymal enhancement whose tumors are more focally parenchymal, HD-MTX achieves adequate tumor control without radiotherapy, which would carry unnecessary neurotoxicity risk. These observations are consistent with the G-PCNSL-SG-1 trial, which demonstrated that omitting WBRT after HD-MTX did not significantly compromise OS in the overall PCNSL population while reducing neurotoxicity [7], and suggest that subependymal enhancement may identify the specific subgroup in whom radiotherapy is not merely optional but essential for adequate disease control.
Several limitations of the present study warrant acknowledgment. This was a retrospective single-center study with a small sample size, and the number of patients with subependymal enhancement who received chemoradiotherapy was particularly limited. Although the observed effect sizes were large and consistent across PFS and OS, the formal interaction test did not reach significance, almost certainly reflecting inadequate statistical power. The retrospective design introduces potential selection bias, as treatment was not randomized. The reproducibility of MRI-based assessment of subependymal enhancement across different readers and institutions was not formally evaluated, and inter-rater reliability data are lacking. Finally, the heterogeneity of first-line regimens across the 15-year study period may have introduced confounding. Prospective validation in a larger multicenter cohort, ideally incorporating subependymal enhancement as a pre-specified stratification variable in a randomized treatment trial, is essential before these imaging biomarkers can be translated into routine clinical practice. Future studies may also explore whether machine learning–based integration of these MRI features could further refine individualized risk stratification [13], particularly as novel therapeutic targets and treatment strategies for PCNSL continue to evolve [36].
5. Conclusions
In this retrospective study of 50 immunocompetent patients with PCNSL, baseline MRI findings independently predicted survival outcomes and provided clinically actionable information beyond existing prognostic scoring systems. Subependymal enhancement and leptomeningeal spread were identified as independent prognostic factors for OS, with subependymal enhancement additionally serving as an independent predictor of PFS. Critically, although subependymal enhancement was associated with poor prognosis overall, patients harboring this feature who received chemoradiotherapy achieved markedly improved outcomes, compared with dismal outcomes in those treated with chemotherapy alone. No significant survival benefit from chemoradiotherapy was observed in patients without subependymal enhancement, suggesting that the benefit of radiotherapy in PCNSL may be concentrated in this specific MRI-defined subgroup.
These findings suggest that systematic assessment of subependymal enhancement and leptomeningeal spread on baseline MRI at the time of PCNSL diagnosis may complement existing clinical scoring systems and guide more individualized treatment decisions. In particular, the presence of subependymal enhancement may warrant early and deliberate incorporation of chemoradiotherapy into the first-line treatment regimen, while its absence may support the use of chemotherapy alone, thereby potentially sparing patients from the neurotoxic risks of radiotherapy without compromising survival. Prospective validation of these MRI-based biomarkers in larger multicenter cohorts is warranted before they can be adopted as standard stratification tools in clinical practice.
Author Contributions
Conceptualization, D.S.C. and W.S.Y.; methodology, W.S.Y.; formal analysis, D.K.; investigation, W.S.Y.; data curation, D.K.; writing—original draft preparation, D.K.; writing—review and editing, D.S.C.; supervision, W.S.Y. All authors have read and agreed to the published version of the manuscript.
Funding
This research received no external funding.
Institutional Review Board Statement
This study was conducted in accordance with the Declaration of Helsinki and was approved by the Institutional Review Board of Incheon St. Mary's Hospital, the Catholic University of Korea (IRB No. OC26RID10143; approved on 27 January 2026).
Informed Consent Statement
Patient consent was waived by the Institutional Review Board due to the retrospective nature of the study, which involved only the analysis of pre-existing, anonymized clinical and imaging data collected during routine medical care, with no additional risk or impact on patient management.
Data Availability Statement
The data presented in this study are available on request from the corresponding author due to institutional restrictions on patient privacy.
Acknowledgments
Not applicable.
Conflicts of Interest
The authors declare no conflicts of interest.:
Abbreviations
The following abbreviations are used in this manuscript:
| PCNSL | Primary central nervous system lymphoma |
| MRI | Magnetic resonance imaging |
| PFS | Progression-free survival |
| OS | Overall survival |
| HD-MTX | High-dose methotrexate |
| WBRT | Whole-brain radiotherapy |
| IELSG | International Extranodal Lymphoma Study Group |
| MSKCC | Memorial Sloan-Kettering Cancer Center |
| CSF | Cerebrospinal fluid |
| DLBCL | Diffuse large B-cell lymphoma |
| KPS | Karnofsky Performance Status |
| ECOG | Eastern Cooperative Oncology Group |
| LDH | Lactate dehydrogenase |
| HR | Hazard ratio |
| CI | Confidence interval |
| CR | Complete response |
| PR | Partial response |
| SD | Stable disease |
| PD | Progressive disease |
| ORR | Overall response rate |
| RT | Radiotherapy |
References
- Grommes, C.; DeAngelis, L.M. Primary CNS lymphoma. J. Clin. Oncol. 2017, 35, 2410–2418. [Google Scholar] [CrossRef] [PubMed]
- Shiels, M.S.; Pfeiffer, R.M.; Besson, C.; et al. Trends in primary central nervous system lymphoma incidence and survival in the U.S. Br. Haematol 2016, 174, 417–424. [Google Scholar] [CrossRef] [PubMed]
- Villano, J.L.; Koshy, M.; Shaikh, H.; Dolecek, T.A.; McCarthy, B.J. Age, gender, and racial differences in incidence and survival in primary CNS lymphoma. Br. J. Cancer 2011, 105, 1414–1418. [Google Scholar] [CrossRef] [PubMed]
- DeAngelis, L.M.; Seiferheld, W.; Schold, S.C.; Fisher, B.; Schultz, C.J. Radiation Therapy Oncology Group Study 93-10. Combination chemotherapy and radiotherapy for primary central nervous system lymphoma: Radiation Therapy Oncology Group Study 93-10. J. Clin. Oncol. 2002, 20, 4643–4648. [Google Scholar] [CrossRef] [PubMed]
- Glass, J.; Gruber, M.L.; Cher, L.; Hochberg, F.H. Preirradiation methotrexate chemotherapy of primary central nervous system lymphoma: Long-term outcome. J. Neurosurg. 1994, 81, 188–195. [Google Scholar] [CrossRef] [PubMed]
- Ostrom, Q.T.; Patil, N.; Cioffi, G.; Waite, K.; Kruchko, C.; Barnholtz-Sloan, J.S. CBTRUS statistical report: Primary brain and other central nervous system tumors diagnosed in the United States in 2013-2017. Neuro-Oncology 2020, 22, iv1–iv96. [Google Scholar] [CrossRef] [PubMed]
- Thiel, E.; Korfel, A.; Martus, P.; et al. High-dose methotrexate with or without whole brain radiotherapy for primary CNS lymphoma (G-PCNSL-SG-1): A phase 3, randomised, non-inferiority trial. Lancet Oncol. 2010, 11, 1036–1047. [Google Scholar] [CrossRef] [PubMed]
- Schultz, C.J.; Bovi, J. Current management of primary central nervous system lymphoma. Int. J. Radiat. Oncol. Biol. Phys. 2010, 76, 666–678. [Google Scholar] [CrossRef] [PubMed]
- Ferreri, A.J.M.; Blay, J.Y.; Reni, M.; et al. Prognostic scoring system for primary CNS lymphomas: The International Extranodal Lymphoma Study Group experience. J. Clin. Oncol. 2003, 21, 266–272. [Google Scholar] [CrossRef] [PubMed]
- Abrey, L.E.; Ben-Porat, L.; Panageas, K.S.; et al. Primary central nervous system lymphoma: The Memorial Sloan-Kettering Cancer Center prognostic model. J. Clin. Oncol. 2006, 24, 5711–5715. [Google Scholar] [CrossRef] [PubMed]
- Haldorsen, I.S.; Espeland, A.; Larsson, E.M. Central nervous system lymphoma: Characteristic findings on traditional and advanced imaging. AJNR Am. J. Neuroradiol. 2011, 32, 984–992. [Google Scholar] [CrossRef] [PubMed]
- Capasso, R.; Negro, A.; Russo, C.; et al. Conventional and advanced MRI techniques in the evaluation of primary CNS lymphoma. Semin. Ultrasound CT MR 2023, 44, 126–135. [Google Scholar] [CrossRef] [PubMed]
- Ko, C.C.; Liu, Y.L.; Hung, K.C.; et al. MRI-based machine learning for prediction of clinical outcomes in primary central nervous system lymphoma. Life 2024, 14, 1290. [Google Scholar] [CrossRef] [PubMed]
- Chen, J.; Cen, B.; Hu, F.; Qiu, Y.; Xiao, G.; Zhou, J.; Ma, X.; Zhang, F. Primary brainstem lymphoma: A population-based study. Front. Surg. 2022, 9, 829048. [Google Scholar] [CrossRef] [PubMed]
- Goncalves, J.; Rodrigues, A.; Pires, R.; et al. Ependymal enhancement on MRI: Imaging patterns and diagnostic algorithms-A pictorial essay. Neuroradiology 2026, 68, 167–180. [Google Scholar] [CrossRef] [PubMed]
- Ma, L.; Gong, Q. Recent advances and challenges in primary central nervous system lymphoma: A narrative review. Transl. Cancer Res. 2023, 12, 1335–1352. [Google Scholar] [PubMed]
- Nelson, D.F.; Martz, K.L.; Bonner, H.; et al. Non-Hodgkin's lymphoma of the brain: Can high dose, large volume radiation therapy improve survival? Report on a prospective trial by the Radiation Therapy Oncology Group (RTOG): RTOG 8315. Int. J. Radiat. Oncol. Biol. Phys. 1992, 23, 9–17. [Google Scholar] [CrossRef] [PubMed]
- Hoang-Xuan, K.; Deckert, M.; Ferreri, A.J.M.; et al. European Association of Neuro-Oncology (EANO) guidelines for treatment of primary central nervous system lymphoma (PCNSL). Neuro-Oncology 2023, 25, 37–53. [Google Scholar] [CrossRef] [PubMed]
- Grommes, C.; Rubenstein, J.L.; DeAngelis, L.M.; Ferreri, A.J.M.; Batchelor, T.T. Comprehensive approach to diagnosis and treatment of newly diagnosed primary CNS lymphoma. Neuro-Oncology 2019, 21, 296–305. [Google Scholar] [CrossRef] [PubMed]
- Ferreri, A.J.M.; Reni, M.; Foppoli, M.; et al. High-dose cytarabine plus high-dose methotrexate versus high-dose methotrexate alone in patients with primary CNS lymphoma: A randomised phase 2 trial. Lancet 2009, 374, 1512–1520. [Google Scholar] [CrossRef] [PubMed]
- Yoon, W.S.; Park, J.S.; Kim, Y.I.; et al. High-dose methotrexate monotherapy for newly diagnosed primary central nervous system lymphoma: 15-year multicenter experience. Asia Pac. J. Clin. Oncol. 2021, 17, 123–130. [Google Scholar] [CrossRef] [PubMed]
- Ferreri, A.J.M.; Cwynarski, K.; Pulczynski, E.; et al. Chemoimmunotherapy with methotrexate, cytarabine, thiotepa, and rituximab (MATRix regimen) in patients with primary CNS lymphoma: Results of the first randomisation of the International Extranodal Lymphoma Study Group-32 (IELSG32) phase 2 trial. Lancet Haematol. 2016, 3, e217–e227. [Google Scholar] [CrossRef] [PubMed]
- Ferreri, A.J.M.; Cwynarski, K.; Pulczynski, E.; et al. Whole-brain radiotherapy or autologous stem-cell transplantation as consolidation strategies after high-dose methotrexate-based chemoimmunotherapy in patients with primary CNS lymphoma: Results of the second randomisation of the International Extranodal Lymphoma Study Group-32 phase 2 trial. Lancet Haematol. 2017, 4, e510–e523. [Google Scholar] [CrossRef] [PubMed]
- Ferreri, A.J.M.; Cwynarski, K.; Pulczynski, E.; et al. Long-term efficacy, safety and neurotolerability of MATRix regimen followed by autologous transplant in primary CNS lymphoma: 7-year results of the IELSG32 randomized trial. Leukemia 2022, 36, 1870–1878. [Google Scholar] [CrossRef] [PubMed]
- Masuda, Y.; Nara, K.; Fujii-Mori, A.; et al. Treatment-related leukoencephalopathy in adults with central nervous system lymphoma: A retrospective analysis of 126 patients. Ann. Hematol. 2024, 104, 1095–1104. [Google Scholar] [CrossRef] [PubMed]
- Mendez, J.S.; Ostrom, Q.T.; Gittleman, H.; et al. The elderly left behind: Changes in survival trends of primary central nervous system lymphoma over the past 4 decades. Neuro-Oncology 2018, 20, 687–694. [Google Scholar] [CrossRef] [PubMed]
- Zhong, S.; Zhao, L.; Chai, J.; et al. Clinical characteristics and prognosis of primary central nervous system lymphoma: A retrospective analysis. Cancers 2026, 18, 541. [Google Scholar] [CrossRef] [PubMed]
- Khan, R.B.; Shi, W.; Thaler, H.T.; et al. Is intrathecal methotrexate necessary in the treatment of primary CNS lymphoma? J. Neurooncol. 2002, 58, 175–178. [Google Scholar] [CrossRef] [PubMed]
- Bessell, E.M.; Graus, F.; Lopez-Guillermo, A.; et al. Primary non-Hodgkin's lymphoma of the CNS treated with CHOD/BVAM or BVAM chemotherapy before radiotherapy: Long-term survival and prognostic factors. Int. J. Radiat. Oncol. Biol. Phys. 2004, 59, 501–508. [Google Scholar] [CrossRef] [PubMed]
- Kiewe, P.; Fischer, L.; Martus, P.; et al. Primary central nervous system lymphoma: Monocenter, long-term, intent-to-treat analysis. Cancer 2008, 112, 1812–1820. [Google Scholar] [PubMed]
- Korfel, A.; Weller, M.; Martus, P.; et al. Prognostic impact of meningeal dissemination in primary CNS lymphoma (PCNSL): Experience from the G-PCNSL-SG1 trial. Ann. Oncol. 2012, 23, 2374–2380. [Google Scholar] [CrossRef] [PubMed]
- Tun, H.W.; Johnston, P.B.; DeAngelis, L.M.; et al. Phase 1 study of pomalidomide and dexamethasone for relapsed/refractory primary CNS or vitreoretinal lymphoma. Blood 2018, 132, 2240–2248. [Google Scholar] [CrossRef] [PubMed]
- Chowdhary, S.; Damlo, S.; Chamberlain, M.C. Cerebrospinal fluid dissemination and neoplastic meningitis in primary brain tumors. Cancer Control 2017, 24, S1–S16. [Google Scholar] [CrossRef] [PubMed]
- Li, J.; Wickramasinghe, C.; Jiang, J.; et al. Mechanistic modeling of spatial heterogeneity of drug penetration and exposure in the human central nervous system and brain tumors. Clin. Pharmacol. Ther. 2025, 117, 690–703. [Google Scholar] [CrossRef] [PubMed]
- Ferreri, A.J.M. Therapy of primary CNS lymphoma: Role of intensity, radiation, and novel agents. Hematol. Am. Soc. Hematol. Educ. Program 2017, 2017, 565–577. [Google Scholar] [CrossRef] [PubMed]
- von Roemeling, C.; Ferreri, A.J.M.; Soussain, C.; Tun, H.W.; Grommes, C. Targets and treatments in primary CNS lymphoma. Leuk. Lymphoma 2024, 65, 1055–1067. [Google Scholar] [CrossRef] [PubMed]
Figure 1.
Kaplan-Meier survival curves for the entire cohort (N = 50). (A) Progression-free survival (PFS). Median PFS was 21.1 months (33 events, 17 censored); PFS rates were 65.8%, 60.9%, 37.9%, and 25.3% at 6, 12, 24, and 36 months, respectively. (B) Overall survival (OS). Median OS was 23.6 months; OS rates were 90.0%, 77.6%, 47.9%, and 37.8% at 6, 12, 24, and 36 months, respectively. Shaded areas indicate 95% confidence intervals; tick marks indicate censored observations.
Figure 1.
Kaplan-Meier survival curves for the entire cohort (N = 50). (A) Progression-free survival (PFS). Median PFS was 21.1 months (33 events, 17 censored); PFS rates were 65.8%, 60.9%, 37.9%, and 25.3% at 6, 12, 24, and 36 months, respectively. (B) Overall survival (OS). Median OS was 23.6 months; OS rates were 90.0%, 77.6%, 47.9%, and 37.8% at 6, 12, 24, and 36 months, respectively. Shaded areas indicate 95% confidence intervals; tick marks indicate censored observations.
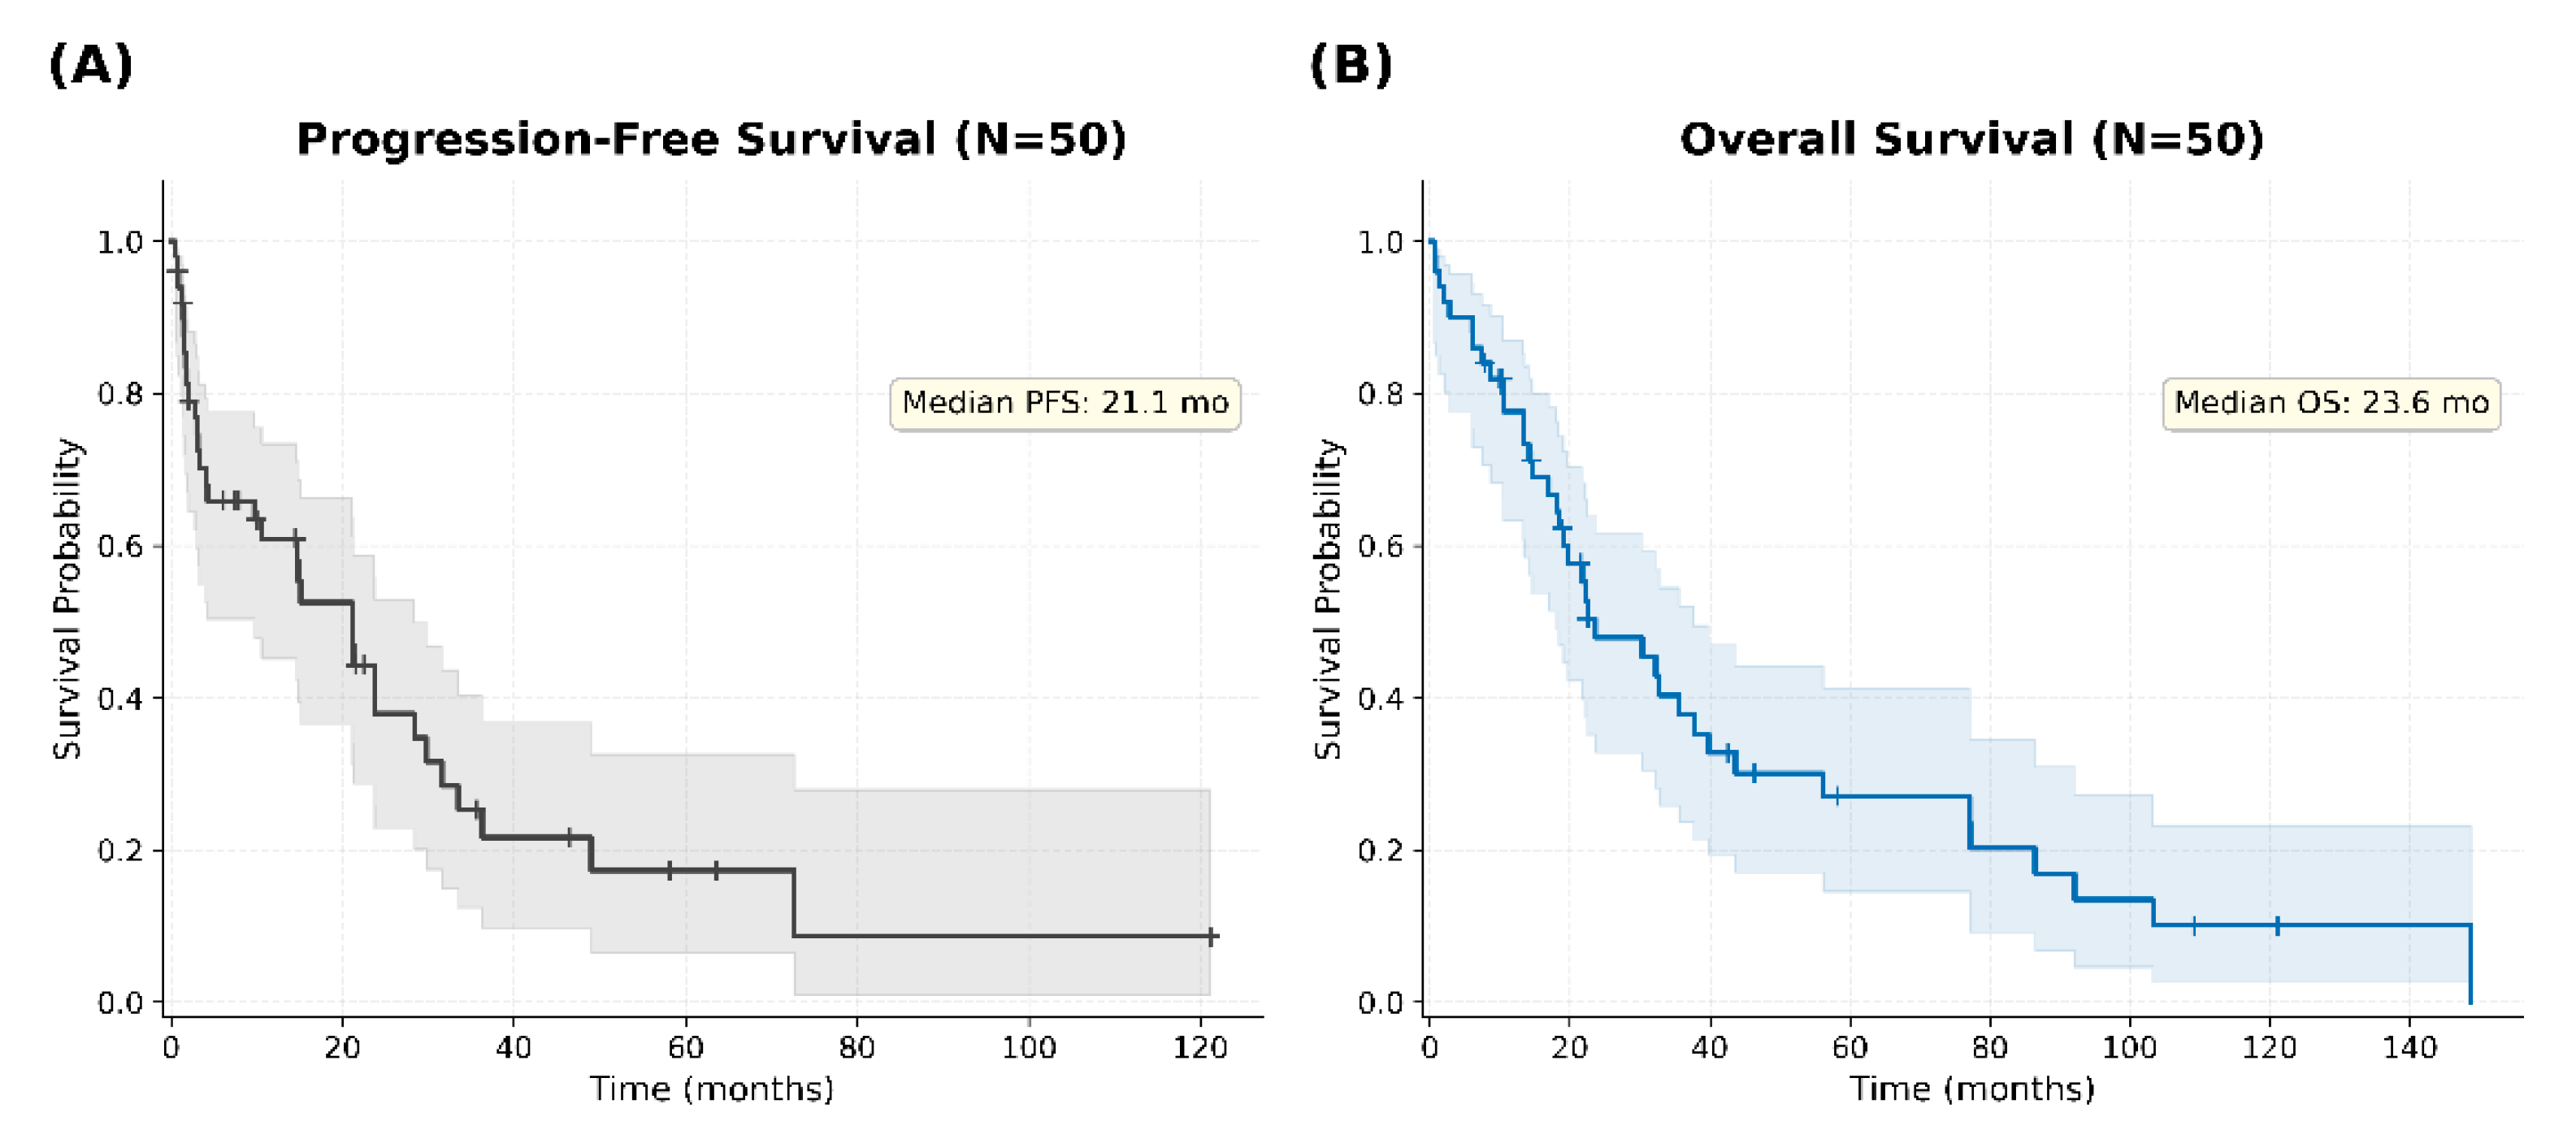
Figure 2.
Progression-free survival according to subependymal enhancement and chemoradiotherapy status. Patients were divided into four groups according to the presence or absence of subependymal enhancement on baseline MRI and receipt of chemoradiotherapy (chemotherapy followed by planned radiotherapy, ICE+RT or MPV+RT) as part of first-line treatment: subependymal enhancement present with chemoradiotherapy (Group A, n = 4); subependymal enhancement present without chemoradiotherapy (Group B, n = 18); subependymal enhancement absent with chemoradiotherapy (Group C, n = 9); and subependymal enhancement absent without chemoradiotherapy (Group D, n = 19). (A) PFS in all four groups. Median PFS was 33.5, 3.0, 28.4, and 21.2 months for Groups A, B, C, and D, respectively. (B) Among patients with subependymal enhancement, PFS was markedly longer in patients who received chemoradiotherapy (Group A) than in those who did not (Group B) (33.5 vs. 3.0 months; P = 0.029). (C) Among patients without subependymal enhancement, PFS did not differ significantly according to chemoradiotherapy status (Group C vs. Group D) (28.4 vs. 21.2 months; P = 0.332). Taken together, the PFS benefit of chemoradiotherapy was confined to patients with subependymal enhancement. Shaded areas indicate 95% confidence intervals; tick marks indicate censored observations.
Figure 2.
Progression-free survival according to subependymal enhancement and chemoradiotherapy status. Patients were divided into four groups according to the presence or absence of subependymal enhancement on baseline MRI and receipt of chemoradiotherapy (chemotherapy followed by planned radiotherapy, ICE+RT or MPV+RT) as part of first-line treatment: subependymal enhancement present with chemoradiotherapy (Group A, n = 4); subependymal enhancement present without chemoradiotherapy (Group B, n = 18); subependymal enhancement absent with chemoradiotherapy (Group C, n = 9); and subependymal enhancement absent without chemoradiotherapy (Group D, n = 19). (A) PFS in all four groups. Median PFS was 33.5, 3.0, 28.4, and 21.2 months for Groups A, B, C, and D, respectively. (B) Among patients with subependymal enhancement, PFS was markedly longer in patients who received chemoradiotherapy (Group A) than in those who did not (Group B) (33.5 vs. 3.0 months; P = 0.029). (C) Among patients without subependymal enhancement, PFS did not differ significantly according to chemoradiotherapy status (Group C vs. Group D) (28.4 vs. 21.2 months; P = 0.332). Taken together, the PFS benefit of chemoradiotherapy was confined to patients with subependymal enhancement. Shaded areas indicate 95% confidence intervals; tick marks indicate censored observations.
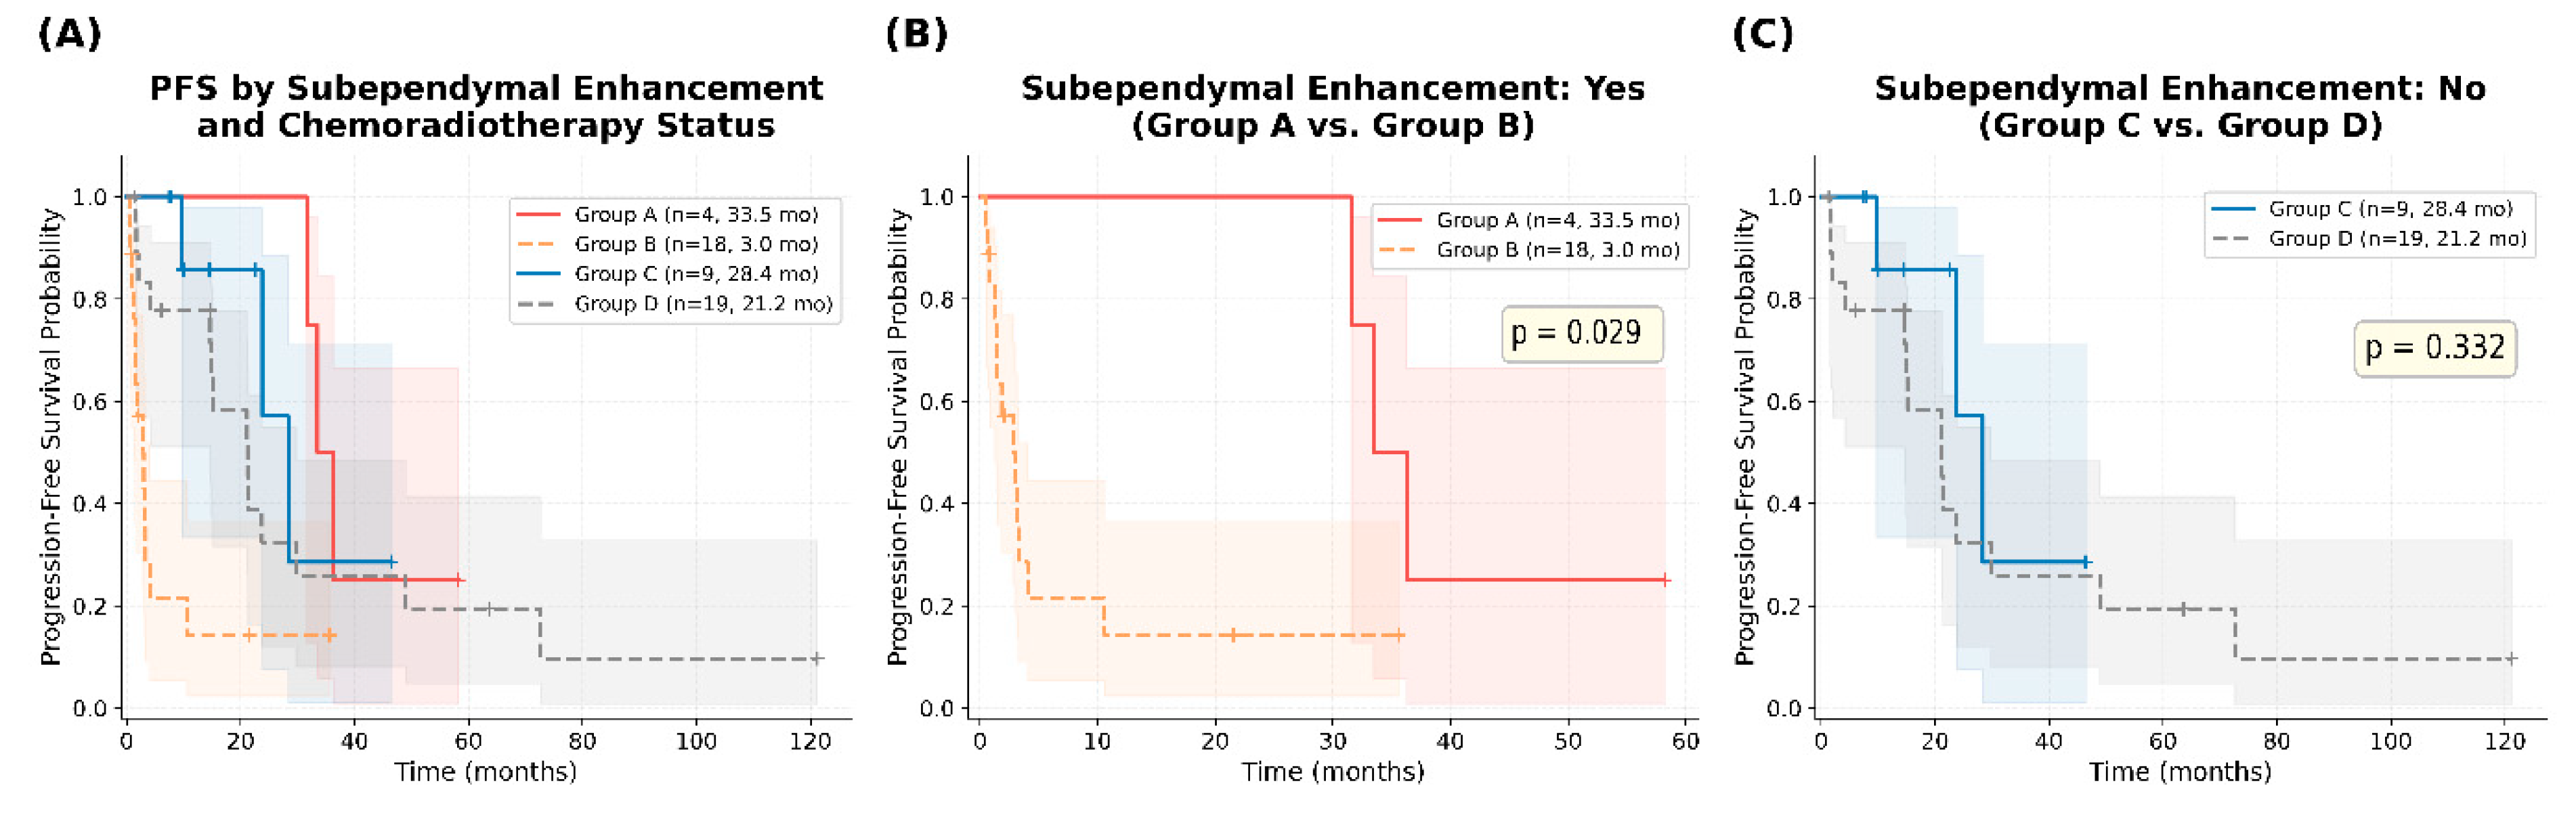
Figure 3.
Overall survival according to subependymal enhancement and chemoradiotherapy status (groups defined as in Figure 2). (A) OS in all four groups. Median OS was 39.8, 13.4, 43.6, and 30.3 months for Groups A, B, C, and D, respectively. (B) Among patients with subependymal enhancement, OS was markedly longer in patients who received chemoradiotherapy (Group A) than in those who did not (Group B) (39.8 vs. 13.4 months; P = 0.029). (C) Among patients without subependymal enhancement, OS did not differ significantly according to chemoradiotherapy status (Group C vs. Group D) (43.6 vs. 30.3 months; P = 0.907). Taken together, the OS benefit of chemoradiotherapy was confined to patients with subependymal enhancement. Shaded areas indicate 95% confidence intervals; tick marks indicate censored observations.
Figure 3.
Overall survival according to subependymal enhancement and chemoradiotherapy status (groups defined as in Figure 2). (A) OS in all four groups. Median OS was 39.8, 13.4, 43.6, and 30.3 months for Groups A, B, C, and D, respectively. (B) Among patients with subependymal enhancement, OS was markedly longer in patients who received chemoradiotherapy (Group A) than in those who did not (Group B) (39.8 vs. 13.4 months; P = 0.029). (C) Among patients without subependymal enhancement, OS did not differ significantly according to chemoradiotherapy status (Group C vs. Group D) (43.6 vs. 30.3 months; P = 0.907). Taken together, the OS benefit of chemoradiotherapy was confined to patients with subependymal enhancement. Shaded areas indicate 95% confidence intervals; tick marks indicate censored observations.
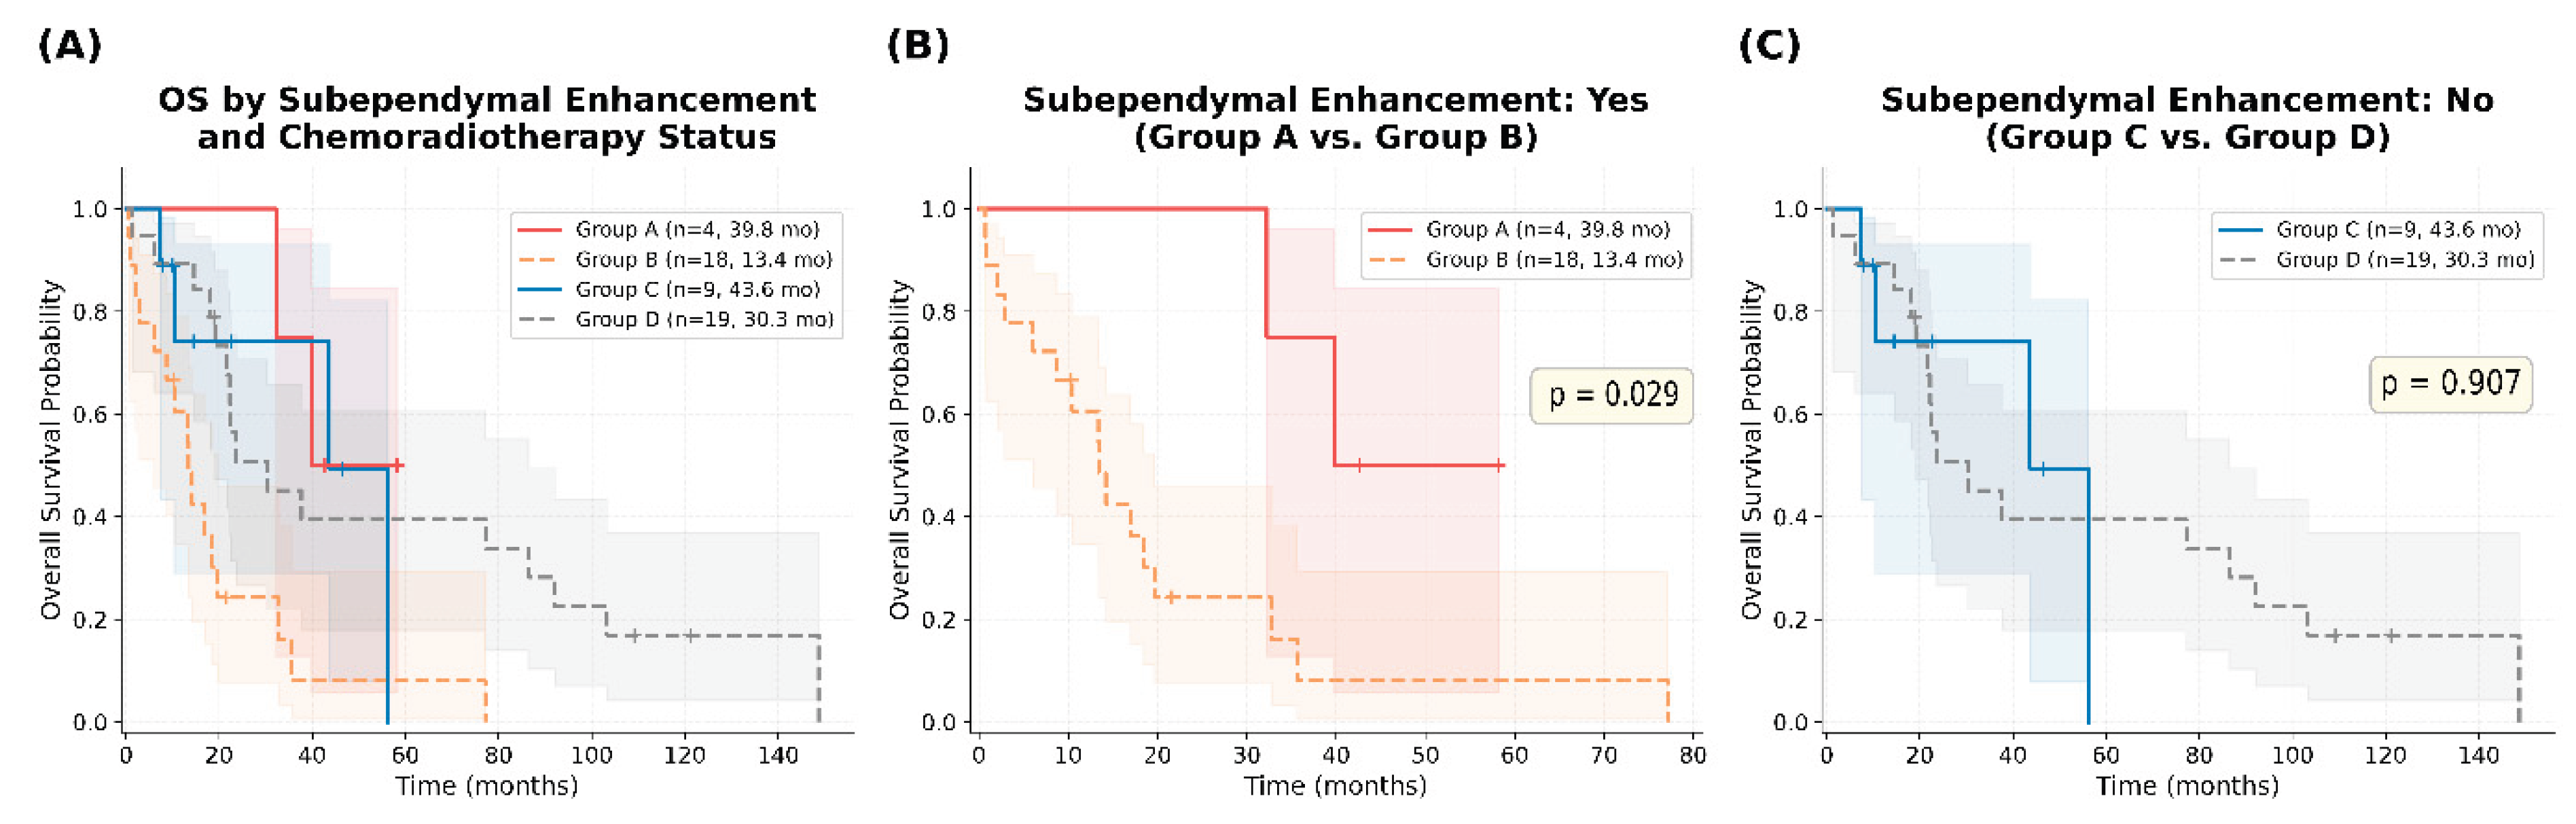

Table 1.
Baseline characteristics of PCNSL patients (N = 50).
| Characteristic | Value (N, %) |
|---|---|
| Median age, years (range) | 63 (33 - 79) |
| >60 years | 32 (64.0%) |
| Sex ratio (male : female) | 0.79 (28 : 22) |
| Median F/U period, months (range) | 20.6 (0.7–148.7) |
| Median KPS (range) | 70 (30 - 90) |
| ≥ 70 | 29 (58.0%) |
| < 70 | 21 (42.0%) |
| ECOG PS | |
| 0 -1 | 14 (28.0%) |
| 2 | 21 (42.0%) |
| 3 – 4 | 15 (30.0%) |
| Serum LDH | |
| Normal | 25 (50.0%) |
| Elevated | 15 (30.0%) |
| Unknown | 10 (20.0%) |
| MRI findings | |
| N of lesions | |
| Solitary | 25 (50.0%) |
| Multiple | 25 (50.0%) |
| Radiologic location | |
| Cortical | 27 (54.0%) |
| Subcortical or Deep structures | 23 (46.0%) |
| Subependymal enhancement | 22 (44.0%) |
| Ventricular involvement | 9 (18.0%) |
| Leptomeningeal spread | 9 (18.0%) |
| Surgical approach | |
| Stereotactic biopsy | 15 (30.0%) |
| Open biopsy | 24 (48.0%) |
| Resection (non-GTR) | 5 (10.0%) |
| Resection (GTR) | 6 (12.0%) |
| First-line Tx | |
| HD-MTX | 30 (60.0%)) |
| ICE ± RT | 8 (16.0%) |
| MPV ± RT | 10 (20.0%) |
| RT alone | 2 (4.0%) |
| Radiologic response to the first-line Tx | |
| CR | 25 (50%) |
| PR | 6 (12.0%) |
| SD | 1 (2.0%) |
| PD | 12 (24.0%) |
| Unknown | 6 (12.0%) |
| Recurrence after the first-lineTx | |
| Yes | 33 (66.0%) |
| No | 9 (18.0%) |
| Unknown | 8 (16.0%) |
| Overall survival | |
| Death | 38 (76.0%) |
| Alive | 11 (22.0%) |
| F/U loss | 1 (2.0%) |
N, number; F/U, follow-up; KPS, Karnofsky Performance Status; ECOG, Eastern Cooperative Oncology Group; LDH, lactate dehydrogenase; MRI, magnetic resonance imaging; GTR, gross total resection; Tx, treatment; HD-MTX, high-dose methotrexate; ICE, ifosfamide-carboplatin-etoposide; RT, radiotherapy; MPV, methotrexate-procarbazine-vincristine; CR, complete response; PR, partial response; SD, stable disease; PD, progressive disease.
Table 2.
Univariate analysis of progression-free survival and overall survival (N = 50).
| Variables | Progression-free survival | Overall survival | ||||
|---|---|---|---|---|---|---|
| Median (months) | HR (95% CI) | P-value | Median (months) | HR (95% CI) | P-value | |
| Sex | 0.547 | 0.895 | ||||
| Male (n=28) | 14.8 | 1 (ref) | 30.3 | 1 (ref) | ||
| Female (n=22) | 23.7 | 1.204 (0.629 - 2.304) | 19.7 | 1.040 (0.561 - 1.926) | ||
| Age (years) | 0.227 | 0.798 | ||||
| < 60 (n=16) | 14.8 | 1 (ref) | 23.6 | 1 (ref) | ||
| ≥ 60 (n=34) | 21.3 | 0.689 (0.359 - 1.323) | 22.5 | 0.926 (0.494 - 1.735) | ||
| KPS scale | 0.542 | 0.768 | ||||
| ≥ 70 (n=29) | 21.1 | 1 (ref) | 32.2 | 1 (ref) | ||
| < 70 (n=21) | 21.2 | 1.206 (0.628 - 2.316) | 22.2 | 1.091 (0.588 - 2.024) | ||
| ECOG PS | 0.649 | 0.684 | ||||
| 0 - 2 (n=35) | 15.1 | 1 (ref) | 23.6 | 1 (ref) | ||
| 3 - 4 (n=15) | 21.2 | 1.159 (0.584 - 2.302) | 22.2 | 0.879 (0.453 - 1.704) | ||
| Serum LDH | 0.097 | 0.952 | ||||
| Normal (n=25) | 14.7 | 1 (ref) | 22.5 | 1 (ref) | ||
| Elevated (n=15) | 28.4 | 0.545 (0.250 - 1.189) | 35.6 | 0.980 (0.474 - 2.023) | ||
| Number of lesions | 0.793 | 0.206 | ||||
| Solitary (n=25) | 21.1 | 1 (ref) | 37.7 | 1 (ref) | ||
| Multiple (n=25) | 21.2 | 0.923 (0.481 - 1.768) | 18.4 | 1.443 (0.783 - 2.661) | ||
| Radiologic location | 0.440 | 0.751 | ||||
| Cortical (n=27) | 14.8 | 1 (ref) | 21.8 | 1 (ref) | ||
| Subcortical or deep structures (n=23) | 28.4 | 0.788 (0.411 - 1.513) | 32.8 | 0.908 (0.481 - 1.717) | ||
| Subependymal enhancement | 0.054ǂ | 0.014* | ||||
| No (n=28) | 23.7 | 1 (ref) | 37.7 | 1 (ref) | ||
| Yes (n=22) | 3.2 | 1.792 (0.934 - 3.437) | 17 | 2.075 (1.089 - 3.954) | ||
| Ventricular involvement | 0.983 | 0.58 | ||||
| No (n=41) | 21.1 | 1 (ref) | 22.5 | 1 (ref) | ||
| Yes (n=9) | 29.8 | 0.992 (0.446 - 2.204) | 30.3 | 1.228 (0.562 - 2.683) | ||
| Leptomeningeal spread | 0.332 | 0.007* | ||||
| No (n=41) | 21.2 | 1 (ref) | 32.2 | 1 (ref) | ||
| Yes (n=9) | 10.6 | 1.502 (0.594 - 3.801) | 13.4 | 2.572 (1.174 - 5.635) | ||
| Radiation (1st-line) | 0.029* | 0.366 | ||||
| Non-radiation group (n=35) | 10.6 | 1 (ref) | 21.8 | 1 (ref) | ||
| Radiation group (n=15) | 31.6 | 0.466 (0.221 - 0.982) | 39.8 | 0.731 (0.352 - 1.519) | ||
| Treatment modality (1st-line) | 0.303 | 0.430 | ||||
| Chemo+RT (n=13) | 33.5 | 1 (ref) | - | 43.6 | 1 (ref) | - |
| Chemo-alone (n=35) | 10.6 | 2.302 (1.047 – 5.060) | 0.024* vs Chemo+RT |
21.8 | 1.655 (0.744 – 3.683) | 0.181 vs Chemo+RT |
| RT-alone (n=2) | 3.3 | 4.653 (0.400 – 54.155) | 0.074 vs Chemo+RT |
13.4 | 4.415 (0.713 – 27.355) | 0.047* vs Chemo+RT |
N, number; HR, hazard ratio; CI, confidence interval; KPS, Karnofsky Performance Status; ECOG, Eastern Cooperative Oncology Group; LDH, lactate dehydrogenase; RT, radiotherapy; ref, reference; Chemo, chemotherapy. * p < 0.05; † borderline (p < 0.10).
Table 3.
Multivariate Cox proportional hazards analysis of progression-free survival and overall survival (N = 50).
Table 3.
Multivariate Cox proportional hazards analysis of progression-free survival and overall survival (N = 50).
| Variables | Progression-free survival | Overall survival | ||||
|---|---|---|---|---|---|---|
| HR | 95% CI | P-value | HR | 95% CI | P-value | |
| Subependymal enhancement | 2.447 | 1.164 – 5.145 | 0.018* | 2.607 | 1.279 – 5.313 | 0.008* |
| Leptomeningeal spread | 1.427 | 0.503 – 4.051 | 0.504 | 3.418 | 1.473 – 7.932 | 0.004* |
| Chemoradiotherapy | 0.293 | 0.115 – 0.741 | 0.010* | 0.431 | 0.174 – 1.071 | 0.070† |
| Concordance index | 0.725 | 0.672 | ||||
| LR test p-value | 0.006 | 0.001 | ||||
N, number; HR, hazard ratio; CI, confidence interval; LR, likelihood ratio. * p < 0.05; † p < 0.10 (borderline significance). Reference categories: subependymal enhancement No, leptomeningeal spread No, chemoradiotherapy No (chemotherapy alone or radiotherapy alone).
Disclaimer/Publisher’s Note: The statements, opinions and data contained in all publications are solely those of the individual author(s) and contributor(s) and not of MDPI and/or the editor(s). MDPI and/or the editor(s) disclaim responsibility for any injury to people or property resulting from any ideas, methods, instructions or products referred to in the content. |
© 2026 by the authors. Licensee MDPI, Basel, Switzerland. This article is an open access article distributed under the terms and conditions of the Creative Commons Attribution (CC BY) license (http://creativecommons.org/licenses/by/4.0/).
Copyright: This open access article is published under a Creative Commons CC BY 4.0 license, which permit the free download, distribution, and reuse, provided that the author and preprint are cited in any reuse.