
Submitted:
17 August 2026
Posted:
19 August 2026
You are already at the latest version
Abstract
Based on Information Processing Theory (IPT), this study examines the impact of suppliers’ digital transformation (SDT) on focal firms’ green innovation (FGI) through supply chain information processing. From an information processing perspective, it identifies three boundary conditions: geographical distance, environmental regulation intensity, and analyst attention, and further analyzes how they moderate the relationship between SDT and FGI. A “focal firm–year–supplier” dataset of Chinese listed firms from 2008 to 2022 was established through data matching. A series of robustness checks and endogeneity treatments were conducted to ensure the reliability of the findings. The results indicate that SDT can significantly enhance FGI by facilitating information transmission and integration across the supply chain. Moreover, this positive effect becomes more pronounced as geographic distance decreases, environmental regulation intensity increases, and analyst attention rises; these findings provide indirect evidence supporting the information-processing in supply chain. By systematically analyzing how SDT promotes innovation performance beyond organizational boundaries through information transmission and integration, this paper reveals a novel type of interaction between suppliers and focal firms, thereby contributing to the literature on the determinants of green innovation and information spillovers.
Keywords:
green innovation
; digital transformation
; supply chain
; Information Processing Theory
; information spillover
1. Introduction
Green innovation (GI) has increasingly been viewed as a pragmatic way for firms to pursue sustainable development and fulfill environmental responsibilities [1,2,3,4,5]. Unlike conventional innovation which primarily targets improving economic performance, GI centers on the adoption of cleaner technologies, sustainable materials, and energy-efficient processes. However, such initiatives are typically characterized by complex technologies, substantial resource, long payback periods, and considerable commercial uncertainty [5,6,7]. These challenges make it important to identify additional drivers that can help firms overcome resource constraints and knowledge limitations in pursuing GI [8].
Numerous studies have examined the impact of digital transformation (DT) on GI in businesses, revealing a range of positive effects [5,9,10,11,12]. Nevertheless, existing research has predominantly focused on firms’ internal DT and its impact on GI [11,12]. Consequently, little is known about whether and how suppliers’ digital transformation (SDT) affects focal firms’ green innovation (FGI). However, suppliers occupy an upstream position within the supply chain. Their operational capabilities directly impacts the efficiency of interactions between firms and the resulting output [13]. Some studies also highlight suppliers as key contributors to improved environmental performance [14], as SDT can reduce uncertainty associated with carbon emissions and ultimately improve the low-carbon performance of other firms in the chain [15]. Given these insights, this study investigates whether and how SDT influences FGI in the current era of DT.
By analyzing panel data from Chinese listed firms from 2008 to 2022, we find that SDT primarily promotes FGI by enhancing supply chain information processing. According to Information Processing Theory (IPT), the proposed effect consists of two stages: information transmission and integration. Specifically, SDT enhances supply chain transparency [15], thereby facilitating more efficient information transmission across organizational boundaries. Focal firms, in turn, receive more timely and structured information from upstream suppliers and convert these dispersed informational inputs into innovation-relevant knowledge through their internal information integration capabilities, ultimately fostering GI. Furthermore, this effect is amplified when geographical distance is shorter, environmental regulation intensity is higher, and analyst attention is greater. These findings indirectly corroborate the proposed information-processing effect.
This paper makes three contributions. First, it extends research on the determinants of GI by shifting attention from firms’ internal capabilities to digital spillover effect originating from the supply chain. While previous research has largely focused on the role focal firms play in their own DT for promoting GI, this paper shows that SDT can also serve as an important external source of innovation capability, highlighting the importance of inter-organizational digital linkages in advancing firms’ GI. Second, this paper contributes to research in supply-chain information spillover. Based on IPT, it demonstrates how SDT supports FGI through information transmission and integration along the supply chain. Moreover, it identifies the conditions under which digital-enabled information processing is more effectively translated into GI outcomes by analyzing the moderating effects of geographical distance, environmental regulation intensity and analyst attention. Third, it advances the literature on supplier–focal firm relationships by revealing how DT reshapes inter-organizational collaboration in supply chains. Earlier studies have primarily examined supplier relationships from the perspective of resources exchange and coordination, whereas this paper adds a new dimension, showing that suppliers can provide valuable information and knowledge to focal firms and further boost their innovation capacity in the digital era. Accordingly, the findings highlight the strategic value—beyond traditional transactional relationships—that arises from collaboration between suppliers and focal firms.
2. Literature Review and Hypotheses Development
2.1. Green Innovation
GI refers to improvements in hardware or software related to waste recycling, pollution prevention, environmental management, and energy conservation, which enhance firms’ environmental competitiveness while supporting sustainable development [1,16]. For firms, GI not only aligns with their development needs but also shapes their brand image, improving their competitive advantage [8]. The drivers of GI vary across organizational and environmental contexts and can be generally categorized into internal and external factors.
From an internal perspective, firms’ strategic and cultural factors can drive GI. These factors are largely shaped by the green intentions of the firm’s top management teams (TMTs), who establish the firm’s overall green culture through top-level design, thereby driving employees to adopt green improvements and innovations [17,18]. For instance, TMTs with stronger environmental awareness can identify external GI demands more effectively [3]; Similarly, TMT members with a green background also facilitate the firm’s GI [19]. In addition, a firm’s resources, such as knowledge and technology, determine its ability to translate green firm strategies into innovative outcomes [20]. Greater capital investment , coupled with a higher tolerance for failure can better promote GI [21]. Likewise, efforts to enhance innovation performance while reducing costs are also essential to promoting GI [22].
External factors also shape firms’ pursuit of GI. Institutional pressures, including laws, formal rules, and informal norms, influence firms’ GI choices [23,24]. Existing evidence on the role of environmental regulation, however, remains mixed. Some studies argue that environmental regulation may suppress GI by internalizing pollution costs and diverting funds from GI [21], while others suggest that it can facilitate GI [3,25] and that government subsidies can increase manufacturing firms’ willingness to invest in GI, particularly in the case of private firms [26]. Beyond this, Supply chain partners and investors also communicate environmental expectations that encourage firms to pursue GI [27,28]. Some research reports a positive effect of stakeholder pressure on GI [29], whereas others find no significant connection between stakeholder pressure and firms’ environmental behavior [30]. At the same time, supply chains provide resources and relationships that support firms’ innovation [31]. In particular, green supply chain management [32], integration[33], and learning[34] can strengthen GI.
Despite these insights, existing research still concentrates mainly on internal determinants of GI [9,11]. Although external influences, such as environmental regulation [23,24,35] and stakeholder concerns [29], have drawn attention, there remains relatively little research on interactions within supply chains. Firms operate within complex business ecosystems rather than in isolation [36]. In these ecosystems, supply chains serve as important sources for knowledge and resources that support firm development [37]. Collaborative ties with supply chain partners improve access to external support, facilitate knowledge flows, and ultimately strengthen firms’ innovation capabilities [38]. Suppliers can, for example, support GI by broadening focal firms’ external search and enriching their knowledge base [32]. In the digital age, digital technologies provide better technical support for this information exchange. Against this background, this study focuses on how SDT affects FGI.
2.2. Suppliers’ DT and Focal Firms’ GI
DT can optimize firms’ production, processes, and service systems[39], strengthen GI [12], improve operational performance [40], increase supply chain efficiency [41], enhance sustainability performance [42], and improve environmental, social, and governance (ESG) outcomes [43]. Importantly, these effects are not confined to firm boundaries. Existing evidence shows that focal firms’ DT can promote GI among suppliers [44], while SDT can stimulate innovation among downstream firms [45]. Together, these findings suggest that DT generates certain spillover effects throughout supply chain networks [31,45].
Drawing on IPT, this study proposes that SDT promotes FGI by improving the exchange and processing of green information across organizational boundaries. Tushman and Nadler (1978) conceptualize organizations as open systems that must manage environmental uncertainty and coordinate interdependent activities [46]. As environmental regulations become more stringent and market demand for green products continues to grow, suppliers and focal firms need to process greater amounts of information about energy use, carbon emissions, material usage, and environmental compliance [20]. The interdependence among supply chain participants makes the efficiency of cross-organizational information processing critical to GI. Specifically, SDT enhances supply chain information processing through two phases.
First, SDT strengthens information transmission. Digital technologies embedded in suppliers’ operating systems enable automatic data collection, real-time monitoring, and rapid information exchange. As a result, focal firms can receive timely and detailed information about production processes, energy use, carbon emissions, and other environmentally relevant activities [47,48]. Greater supply chain visibility reduces information asymmetry and improves transparency between organizations [49]. Moreover, long-term cooperation also allows suppliers and focal firms to accumulate shared experience and tacit knowledge, which improves the quality of their information exchange [31]. Ultimately, SDT transforms green information from something merely available into knowledge that downstream partners can access, trust, and apply [45].
Second, SDT supports information integration within focal firms. According to IPT, effective information processing requires not only that information be available, and but also that firms possess the capacity to absorb, interpret, and apply it [50]. By incorporating suppliers’ operational and environmental data into internal knowledge systems, focal firms can identify opportunities to reduce emissions, optimize resource allocation, and redesign products or production processes in more environmentally sustainable ways [11,22,51]. In addition, SDT connects dispersed supply chain participants through collaborative digital networks, expanding firms’ access to external knowledge and helping them combine that knowledge with internal capabilities [10]. Greater transparency can also raise firms’ environmental awareness and stimulate the search for new green technologies and products [5]. Through information integration and resource reconfiguration, external environmental information can be transformed into systematic knowledge and ultimately generate substantive GI outcomes [12].
Overall, from the perspective of IPT, SDT improves the transmission and integration of green-related information, reduces coordination and search costs, increases focal firms’ access to external knowledge sources, and increases the firms’ capacity to identify and capitalize on GI opportunities. Thus, we propose the following hypothesis:
H1. SDT is positively associated with FGI.
The preceding arguments suggest that SDT promotes FGI when information can be effectively transmitted and used across the supply chain. However, greater access to operational and environmental information does not automatically produce GI. According to IPT, organizational outcomes depend not only on the availability of information but also on an organization’s ability to process information in ways that match task requirements [46]. GI is knowledge-intensive and highly uncertain, so firms need acquire, interpret, and integrate diverse information from external partners [52]. The effectiveness of SDT in promoting FGI therefore depends on contextual conditions that support information transmission and integration throughout the supply chain.
From an information-processing perspective, this study identifies three boundary conditions—geographical distance, environmental regulation intensity, and analyst attention—that influence the extent to which information generated by SDT can be transformed into FGI.
First, while digital technologies significantly diminish communication barriers, geographical proximity still facilitates more frequent exchanges, more robust communication channels, and stronger trust among supply chain partners [53]. Additionally, spatially closeness also facilitates the exchange of tacit knowledge, which cuts down on information asymmetry and coordination costs [37,54]. As a result, focal firms can receive and interpret information about production processes, energy usage and environmental practices from the suppliers in a more accurate and effective manner. Hence, shorter geographical distance strengthens information transmission and integration, which in turn has a positive impact on FGI.
Second, environmental regulation intensity expands both the demand and supply of green information. Regulatory pressure encourages firms throughout the supply chain to monitor environmental performance, disclose relevant data, and adopt cleaner production methods [3,23]. Suppliers facing tighter regulation consequently generate more detailed and standardized environmental information through digital systems. Focal firms, in turn, have stronger incentives to obtain and use that information to meet regulatory requirements and develop green technology development [3]. Environmental Regulation intensity can therefore improve information transmission and integration, allowing SDT to generate greater innovation benefits.
Third, As intermediaries in capital markets, analysts collect, interpret, and disseminate firm-specific information [55]. Greater analyst attention encourages suppliers and focal firms to provide more transparent operational and environmental disclosure, thereby improving the quality and credibility of information available to stakeholders. Moreover, analysts also facilitate the dissemination of valuable information across supply chains, making it easier for focal firms to evaluate external knowledge and apply it to innovation. Consequently, analyst attention improves both the transmission of suppliers’ digital information and its integration into FGI outcomes.
Together, the three contextual factors reinforce the information-processing effect through which SDT promotes FGI. Therefore, the positive relationship between SDT and FGI is expected to be stronger when geographical distance is shorter, environmental regulation is more intense, and analyst attention is greater.
2.3. Geographical Distance
Based on IPT, this study argues that geographical distance moderates the relationship between SDT and FGI by influencing the effectiveness of information transmission and integration between suppliers and focal firms. Although SDT substantially improves supply chain visibility and enables the real-time transmission of operational and environmental information, digital technologies alone cannot overcome the challenges imposed by spatial separation. GI requires close inter-organizational interaction, including the exchange of tacit knowledge, iterative communication and joint problem solving, which goes beyond digital information transfer.
If suppliers and focal firms are located geographically close, digital platforms can be complemented by extensive face-to-face communication, site visits and collaborative problem solving to convey both explicit and tacit knowledge [53,56]. Such proximity results in greater understanding, stronger trust and less ambiguity, and thereby fostering more accurate and timely information sharing across organizational boundaries [53,56]. Therefore, focal firms can more easily acquire comprehensive information on suppliers’ production processes, environmental practices, energy consumption, and technological advancements. Enhanced information transfer helps to create a stronger foundation for subsequent information integration and GI.
By contrast, greater geographical distance restricts informal interaction and raises coordination costs among supply chain partners. Although digital systems can still transmit standardized information, opportunities to interpret complex environmental information and exchange tacit knowledge decline. This results in weaker supply chain visibility, greater information asymmetry [37], and a reduced ability of focal firms to convert SDT into FGI. The positive effect of SDT on FGI should therefore weaken as geographical distance increases.
H2.Geographic distance negatively moderates the positive association between SDT and FGI, such that the effect of SDT on FGI is stronger when focal firms are located closer to their suppliers.
2.4. Geographical Distance
This study argues that environmental regulation intensity strengthens the positive relationship between SDT and FGI by enhancing both information transmission and information integration within supply chains. Environmental regulation comprises a set of mandatory rules and enforcement mechanisms designed to improve environmental quality by increasing firms’ accountability for their environmental performance [3]. Regulatory actions against firms that violate environmental standards not only impose direct penalties on offenders, but also put pressure on other firms operating within the same industry or region [57]. As a result, focal firms have greater incentives to acquire timely and reliable environmental information from partners to control regulatory risks and comply with regulations.
From the perspective of information transmission, stricter environmental regulations increase both the volume and quality of environmental information generated by suppliers’ digital systems. To meet the regulatory requirements, suppliers are increasingly inclined to adopt digital tools to monitor and record production processes, energy consumption, carbon emissions, and environmental management. These digital records enhance the transparency, standardization, and credibility of environmental information within the supply chain, thereby advancing its more accurate and efficient transmission to focal firms. Consequently, SDT becomes a more effective channel for the flow of environmental information across organizational boundaries.
From the information integration perspective, higher regulatory pressure stimulates focal firms to integrate and act on environmental information from the external. As the costs of regulatory noncompliance rise, firms become more willing to analyze suppliers’ environmental data to identify potential risks. Meanwhile, they incorporate external knowledge into green product development and process improvement. In this way, environmental information obtained through SDT is more likely to be transformed into actionable knowledge that supports GI. Therefore, stronger environmental regulation reinforces both information transmission and integration, amplifying the positive effect of SDT on FGI.
H3. Environmental regulation intensity positively moderates the relationship between SDT and FGI, such that the positive effect of SDT on FGI is stronger under higher levels of environmental regulation intensity.
2.5. Analyst Attention
This study argues that analyst attention strengthens the positive relationship between SDT and FGI by enhancing both information transmission and information integration within supply chains. Analysts serve as crucial information intermediaries who gather, analyze, and report firm-specific information to the stakeholders. In doing so, they mitigate information asymmetry and enhance capital market transparency [55,58]. In addition to gathering information from open sources, they also glean industry- and supply-chain-specific information by conducting site visits, attending management meetings, and communicating with supply chain partners. These activities allow them to obtain valuable intelligence regarding firms’ operational dynamics, competitive environments and strategic capabilities [59]. This means that higher analyst attention elevates the quality, credibility and accessibility of information surrounding both the focal firms and their partners.
Greater analyst attention enhances focal firms’ incentives and capabilities to deploy externally acquired information in decisions making. Analysts’ evaluations and reports draw attention to environmentally relevant operating information and reduce uncertainty about firms’ environmental performance. This helps managers identify opportunities in green products, cleaner production, and sustainable technologies [60,61]. Furthermore, scrutiny from analysts also encourages firms to disclose their operational and environmental activities more transparently, increasing the availability of useful green information across the supply chain. As that information becomes more credible and easier to interpret, focal firms can better integrate the digitally generated information from suppliers into their knowledge bases and innovation processes.
Additionally, analyst also reinforces managers’ long-term strategic orientation by increasing external monitoring and market accountability [58,62]. As GI typically requires substantial investment in R&D, organizational learning, and intangible assets [10], firms under greater analyst attention are more likely to use supply chain information for long-term innovation rather than short-term operational objectives. Thus, analyst attention enhances the translation of SDT-acquired information into substantive GI outcomes.
H4. Analyst attention positively moderates the relationship between SDT and FGI, such that the positive effect of SDT on FGI is stronger when analyst attention is higher.
The research framework is illustrated in Figure 1.
3. Methodology
3.1. Data Collection and Sample
This study constructs its sample by merging data from various databases, covering the Chinese listed firms from 2008 to 2022. And the data are obtained as follows.
(1) Green Patent Data: information regarding invention patents, utility model patents, and related green patent classifications is primarily obtained from CNRDS database.
(2) Financial Indicators: Return on Assets (ROA), firm age, corporate governance metrics (e.g., equity structure) and other financial data, are retrieved from CSMAR database.
(3) Supply Chain Relationship Data: A “focal firm-supplier-year” panel dataset is constructed based on the data from the CSMAR Supply Chain Database, retaining only those observations where both the suppliers and focal firms are publicly listed entities.
(4) DT Indicators: SDT indicators are derived from a word-frequency analysis of publicly listed firms’ annual reports by text mining techniques.
To facilitate data measurement, this study developed a “focal firm-supplier-year” dataset. In any given year, a focal firm (F) may have multiple supplier firms (I, J, K). Therefore, databases were constructed for each focal firm-supplier-year relationships, such as F-I-2018, F-J-2018, and F-K-2018. Based on existing literature, the raw data underwent a stringent filtering process:
(1) firms in the insurance and financial sectors were excluded;
(2) firms designated as Special Treatment (ST) or Particular Transfer (PT) were removed;
(3) observations with missing key variables were omitted;
(4) all continuous indicators (e.g., board size) were winsorized at the 1st and 99th percentiles.
3.2. Measures
3.2.1. Dependent Variable
As innovation performance is typically measured using patents [63,64], some existing studies use firms’ green patent applications to measure GI [3,10,24]. Unlike granted patents, patent applications are not examined by the patent office and are there not subject to procedural delays [5]. Furthermore, using data on granted patents poses a truncation problem because the patent-granting process takes time [3]. Green patents reflect firms’ capabilities in developing technologies that reduce resource consumption and increase material reuse. Firms possessing these technologies will be better positioned to achieve sustainable development, so we measure GI by the number of such patent applications.
3.2.2. Independent Variable
DT refers to the process through which an entity undergoes substantial changes in its attributes by integrating communication, computing and other digital technologies to enhance its processes and operations [39]. Firm-level DT remains difficult to measure due to its multidimensional and evolving nature [11]. Earlier studies use methods like surveys [65] and text-based indices derived from corporate annual reports. Following recent work [9,12], this study measures firms’ DT by counting the frequency of DT-related keywords disclosed in Chinese listed firms’ annual report. This measure captures the strategic emphasis on, and practical adoption of digital technologies reported in public disclosures. Because keyword counts tend to be highly skewed [12], the logarithmic transformation log(x+1) is applied to construct the DT indicator (SupDig) to improve the measure’s distributional properties.
3.2.3. Moderators
First, following existing studies [56], geographical distance (Dis) is measured based on the average longitude and latitude of suppliers and focal firms, with higher values indicating greater spatial separation. Second, environmental regulation intensity (ER) is proxied by the ratio of investment in industrial pollution control to industrial value added [25,66]. This reflects regulatory stringency through actual pollution-abatement expenditure. Third, consistent with prior work [67,68], analyst attention (Analyst) is defined as the natural logarithm of one plus the number of analysts tracking the firm.
3.2.4. Control Variables
To estimate the effect of SDT on FGI, this study controls for a set of firm-level characteristics that potentially affect GI. Drawing on prior GI studies [5,10,47,69,70], this study include the following controls: state ownership (Soe), ownership-control separation (Separation), CEO duality (Dual), firm age (Age), leverage (Lev), independent director ratio (Bod_indep), largest shareholder ownership (Top1), board size (Board), return on assets (ROA), and firm size (Size). Table 1 provides detailed definitions and constructions for mentioned variables.
3.3. Analytical Method
To determine the appropriate panel model, a Hausman test was conducted on the baseline specification. Using the full model (including core explanatory and moderating variables), the test rejects the random effects, as reported in Table 2. Accordingly, a fixed effect model is adopted as the primary estimation strategy, including industry, year, and firm fixed effects in the baseline specification. Following existing research [6,34], this study measures GI at year t+1 as the dependent variable to mitigate potential reverse causality. The baseline model for hypothesis testing is specified as follows:
In the model, Gii,t+1 represents focal firms’ green innovation (FGI), and SupDigi,t denotes suppliers’ digital transformation (SDT). Moderatork,i,t includes geographical distance (Dis), environmental regulation intensity (ER), and analyst attention (Analyst). The vector Controli,t includes all firm-level control variables. Year and Industry represent year and industry fixed effects respectively, and firm indicates firm-specific fixed effect. The error term is denoted by ε, with subscripts i and t indexing firm and year respectively.
4. Empirical Results
Descriptive statistics and correlation matrix of all the variables are presented in Table 3. The OLS regression results for the influence of SupDig on GI, and the moderating effect of Dis, ER, and Analyst are summarized in Table 4.
Model 1 includes the moderating variables together with the control variables, and Column (1) of Table 4 reports their effects on GI. Model 2 introduces SupDig to test H1. The coefficient is positive and statistically significant at the 1% level (β = 0.100, p < 0.01), signifying a positive association between SDT and FGI. Economically, a one-unit increase in SupDig corresponds to an approximately 10.5% increase in GI. Models 3 to 5 further incorporate the interaction terms to examine the moderating effects. In Model 3, the significantly negative coefficient on SupDig*Dis (β = -0.079, p < 0.01) shows that greater distance weakens the positive effect of SupDig on GI. In Model 4, the interaction term is replaced by SupDig*ER. The positive and significant coefficient (β = 26.747, p < 0.01) indicates that stricter regulation strengthens the relationship. Model 5 includes SupDig*Analyst, whose coefficient is positive at the 1% significance level (β = 0.073, p < 0.01), showing that greater analyst attention reinforces the primary association.
Figure 2 to 4 graphically illustrate these moderating effects. Specifically, Figure 2 shows that the positive influence of SDT on FGI strengthens with shorter geographical distance. Figure 3 indicates that this effect is amplified under stricter environmental regulation intensity, while Figure 4 reveals that the positive impact becomes more evident when analyst attention is higher.
5. Robustness Checks and Endogeneity Solving
5.1. Alternative Measure of SDT
To further capture the multidimensional nature of DT, an alternative measure of SDT (Digit) was constructed based on the frequency of digital technology adoption-related terms disclosed in firms’ annual reports [11]. As reported in Table 5, the alternative Digit remains positively associated with FGI. Moreover, the interaction effects between Digit and the three moderators (Dis, ER, and Analyst) are consistent with those reported in the baseline analyses. These findings confirm that the robustness of the results to alternative operationalizations of SDT and the positive spillover effects of suppliers’ application of digital technologies on FGI.
5.2. Additional Control Variables
Although variables are controlled across various dimensions in the baseline regression, there remains a possibility that key variables influencing FGI may be overlooked. Firms with higher ESG ratings exhibit stronger environmental awareness, which promotes GI [3]. Furthermore, GI typically requires substantial initial investment and relies on government subsidies to support its development [52]. Therefore, drawing on existing literature [10,11], ESG performance (ESG) and government subsidy expenses (Subsidy) are included in the analysis. On the one hand, the Huazheng ESG rating, which assigns values from 1 to 9 to listed firms in ascending order, is used. On the other hand, subsidy is defined as the natural logarithm of a firm’s current-period government subsidy expenses. In addition, supply chain concentration (Concentration) measures the degree of interdependence between suppliers and the focal firms [72]. The greater a firm’s dependence on other firms in the supply chain, the stronger its incentive to accommodate the demands arising from SDT [73]. Therefore, Concentration serves as another robustness control measure, measured as the ratio of procurement from the top five suppliers to total procurement. And the research results remain consistent, as shown in Table 6.
5.3. Alternative Measure of Green Innovation
To comprehensively capture the level of GI activities among focal firms, this study considers utility model patents. Although these patents do not demonstrate breakthrough innovations to the same extent as invention patents, they still play a role in driving GI. Therefore, the dependent variable is redefined as the natural logarithm of the sum of green invention and utility model patent applications [10], providing a broader measure of GI. The corresponding results, presented in Table 7, remain robust.
5.4. Sample Window Adjustments
To assess whether the core conclusions are affected by extreme events or policy changes during specific periods, robustness tests are conducted by temporal window adjustments. Specifically, observations from 2008 (the global financial crisis) and 2015 (the Chinese stock market turbulence) were excluded. After the adjustments, the results in Table 8 are in line with the main results.
5.5. Instrumental Variable Estimation
To alleviate potential endogeneity concerns arising from reverse causality and unobserved omissions, the two-stage least squares (2SLS) method is applied. The instrumental variable is the average degree of DT of other firms in the same industry and region (A-SupDig). This instrument captures common exposure to technological trajectories, regional policy environments, and industry-level digitalization trends, which tend to generate correlated DT decisions across peer firms. At the same time, the identification strategy assumes that while A-SupDig is closely related to suppliers’ own DT behavior, it does not directly affect FGI outcomes except through its influence on SupDig. In addition to firm-level fixed effects, industry-level and year-level fixed effects are included to address other sources of heterogeneity. Table 9 presents the relevant results. The first-stage estimation is positively correlated with SupDig for A-SupDig (β = 0.378, p < 0.01), validating the instrument’s relevance requirement. In the second stage, SupDig remains positive and statistically significant at the 5% level (β = 0.214), signifying that the original correlation has not changed substantially after correcting for endogeneity.
5.6. Alternative Estimation Model
5.7. Lagged Dependent Variable
To mitigate reverse causality, the dependent variable is also lagged by two periods, extending the baseline one-period lag framework. The results in Table 11 reveal that SupDig remains positively associated with GI, and the interaction terms retain their expected signs. The effect does not exhibit noticeable attenuation as the lag structure is extended, indicating temporal stability in the relationship between SDT and FGI.
6. Discussion and Conclusion
Based on data from Chinese listed firms from 2008 to 2022, this study constructs a focal firm–year–supplier panel dataset to investigate how suppliers’ digital transformation (SDT) influences focal firms’ green innovation (FGI). Drawing on IPT, this study argues that SDT generates positive information spillover effects beyond firm boundaries by enhancing inter-organizational information processing. Specifically, the findings demonstrate that the positive impact of SDT on FGI comprises two stages: information transmission and information integration. In the transmission stage, SDT reduces information friction between suppliers and focal firms by facilitating more efficient information flow within the supply chain [31,38]. In the integration stage, focal firms interpret the acquired information in a targeted manner to optimize their own production and process activities, thereby catalyzing GI. And further analysis signify that the positive impact of SDT on FGI is more pronounced when geographic distance is shorter, environmental regulations are stricter, and analyst attention is higher.
6.1. Theoretical Contributions
First, this study contributes to the literature on the determinants of corporate GI by introducing a supply chain perspective. Existing research on the relationship between DT and GI within supply chains can be broadly classified into two streams. The first stream examines the overall impact of supply chain digitalization on firms’ GI, but often treats the supply chain as an integrated whole, overlooking the heterogeneous roles of upstream suppliers and downstream focal firms [10]. The second stream explores how focal firms’ DT influences supplier innovation, emphasizing downstream-driven spillover effects while paying insufficient attention to the potential influence of upstream suppliers on focal firms’ innovation outcomes [44]. Meanwhile, research on the antecedents of DT has primarily focused on firm-level characteristics, but rarely considered how firms’ positions within supply networks and inter-organizational digital linkages shape DT outcomes [5,9,11,12].
To address these gaps, this study shifts the focus from focal firms’ internal digital capabilities to SDT and examines how upstream digitalization generates innovation spillovers for downstream firms. The findings demonstrate that SDT represents an important yet underexplored source of GI by enabling focal firms to access and leverage digitally generated supply chain knowledge. In doing so, this study extends existing research on GI by highlighting the role of inter-organizational digital connections in shaping firms’ GI outcomes.
Second, this study advances research on supply chain information spillovers by developing an information-processing perspective on how digital information is transformed into GI. Drawing on IPT, this study conceptualizes information processing as a two-stage process consisting of information transmission and information integration, thereby extending prior research that primarily focuses on information spillover among supply chain partners [31]. Although existing studies have highlighted the importance of information transparency and transmission across organizational boundaries, but overlooked how transmitted information is subsequently interpreted, absorbed, and transformed into innovation-related knowledge within focal firms.
Furthermore, this study identifies the contextual conditions that dictate the effectiveness of supply-chain information processing. Specifically, geographical distance, environmental regulation intensity, and analyst attention capture distinct dimensions of the information-processing environment. By incorporating these boundary conditions, this study provides a deeper understanding of when and why SDT-generated information can be effectively converted into GI outcomes. In doing this, this research enriches literature on information-spillovers in the supply chain.
Third, this study enriches the literature on supplier firm-focal firm interactions. By revealing the new partnerships based on information spillovers enabled by digitalization, this study explores in depth how SDT affects GI levels of focal firms, extending the classic supplier technological involvement model pioneered by Geffen and Rothenberg (2000). While emphasizing the role of supplier collaboration in corporate environmental alignment, their model lacks the information-spillover characteristics of the digital age. However, digital technology significantly enhances supply chain transparency and information-sharing efficiency [38], providing technical support for the information-spillover in this study. Therefore, this study further extends these findings to the field of GI.
6.2. Practice Implications
This study offers practical implications for governments and firms. As the findings reveal that SDT promotes FGI, the government must promote SDT from an industrial chain perspective by providing fiscal subsidies, tax incentives, and collaborative platforms. These initiatives can help firms overcome “digital silos” and encourage digitalization beyond internal operations, thereby supporting the digital transformation of the entire supply chain to facilitate GI in focal firms. Firms should avoid focusing solely on internal digital processes and take proactive steps to strengthen connectivity and collaboration with supply chain partners (especially suppliers). By leveraging digitalization, they can access technological resources to reconstruct green production and product innovation models. Focal firms should actively learn from the green information from SDT, promoting management reform and upgrading production lines to advance the use of more sustainable materials. At the same time, they should work closely with suppliers to build value co-creation systems, enhance supply chain resilience and improve their own GI capabilities.
Additionally, this study finds that shorter geographic distance, stricter environmental regulation, and greater analyst attention all have a positive impact on both SDT and FGI. Accordingly, governments may consider formulating differentiated environmental regulation standards based on the environmental carrying capacity of different industries and regions. And enforcement can be strengthened to further encourage firms to increase environmental investment. Governments can also engage the public and analysts in environmental supervision, improving corporate environmental accountability while recognizing firms with significant DT achievements. Furthermore, improvements in industry information disclosure systems can also foster positive interactions between suppliers and focal firms to strengthen their cooperation and expand green markets. In turn, firms can leverage the advantages of business clusters to acquire knowledge about green supply chains to further enhance their GI efficiency.
6.3. Limitations and Future Research
Despite its theoretical and empirical contributions, this study has several limitations. First, the generalizability of the findings is constrained by the data exclusively drawn from Chinese listed firms. The relationship between SDT and FGI may vary in different regional, cultural and institutional contexts. Future research could test the findings with data from other parts of the world, such as Europe and the Americas. Second, this study focuses only on two pathways by which SDT facilitate FGI: information transmission and information integration, while other pathways are not investigated. Further studies could examine additional mechanisms across industries and firm sizes, to investigate how those mechanisms interact, compare their effects, and examine their implications for different stakeholders. Third, the sample is limited to listed suppliers and focal firms. Although listed firms provide reliable and publicly available data, this dataset size may limit the findings. Future research could incorporate non-listed firms to validate the conclusions using a broader and more diverse sample.
Author Contributions
Conceptualization, L.H. and X.X.; methodology, X.X.; validation, L.H. and X.X.; formal analysis, L.H.; investigation, L.H.; resources, X.X.; data curation, L.H.; writing—original draft preparation, L.H.; writing—review and editing, X.X.; visualization, L.H.; supervision, X.X.; project administration, X.X. All authors have read and agreed to the published version of the manuscript.
Funding
This research received no external funding.
Data Availability Statement
The datasets generated and/or analyzed in this study are not publicly available, as they remain in use for ongoing research and future publications. However, they can be obtained from the corresponding author upon reasonable request.
Acknowledgments
We gratefully acknowledge the provision of documentation and technical support by the Department of Education of Fujian Province and the School of Economics and Management at Fuzhou University in the early stages of this research.
Conflicts of Interest
The authors declare no conflict of interest.
References
- Chen, Y.-S.; Lai, S.-B.; Wen, C.-T. The Influence of Green Innovation Performance on Corporate Advantage in Taiwan. J. Bus. Ethics 2006, 67, 331–339. [Google Scholar] [CrossRef]
- Ghisetti, C.; Quatraro, F. Beyond Inducement in Climate Change: Does Environmental Performance Spur Environmental Technologies? A Regional Analysis of Cross-Sectoral Differences. Ecol. Econ. 2013, 96, 99–113. [Google Scholar] [CrossRef]
- Lin, J.; Cao, X.; Dong, X.; An, Y. Environmental Regulations, Supply Chain Relationships, and Green Technological Innovation. J. Corp. Financ. 2024, 88, 102645. [Google Scholar] [CrossRef]
- Xiao, Y.; Xiang, R.; Sun, Y.; Chen, J.; Hao, Y. Digital Disruption, Knowledge and Collaborative Networks and Green Innovation in China Manufacturing Transformation. Technol. Forecast. Soc. Change 2025, 216, 124120. [Google Scholar] [CrossRef]
- Zhang, J.; Yu, C.-H.; Zhao, J.; Lee, C.-C. How Does Corporate Digital Transformation Affect Green Innovation? Evidence from China’s Enterprise Data. Energy Econ. 2025, 142, 108217. [Google Scholar] [CrossRef]
- Li, B.; Zhang, S. Toward Suppliers’ Green Innovation: The Role of Buyers’ Environmental Information Disclosure. Corp. Soc. Responsib. Environ. Manag. 2026, 33, 1–17. [Google Scholar] [CrossRef]
- Ju, X.; Jiang, J.; Yu, H.; Qiao, X. The Impact of Patient Capital on Green Innovation in Resource-Based Enterprises. Systems 2026, 14, 784. [Google Scholar] [CrossRef]
- Chen, Y.-S. The Driver of Green Innovation and Green Image – Green Core Competence. J. Bus. Ethics 2008, 81, 531–543. [Google Scholar] [CrossRef]
- Tang, M.; Liu, Y.; Hu, F.; Wu, B. Effect of Digital Transformation on Enterprises’ Green Innovation: Empirical Evidence from Listed Companies in China. Energy Econ. 2023, 128, 107135. [Google Scholar] [CrossRef]
- Luo, S.; Xiong, Z.; Liu, J. How Does Supply Chain Digitization Affect Green Innovation? Evidence from a Quasi-Natural Experiment in China. Energy Econ. 2024, 136, 107745. [Google Scholar] [CrossRef]
- Wang, B.; Khan, I.; Ge, C.; Naz, H. Digital Transformation of Enterprises Promotes Green Technology Innovation – the Regulated Mediation Model. Technol. Forecast. Soc. Change 2024, 209, 123812. [Google Scholar] [CrossRef]
- Sun, Z.; Zhao, L.; Mehrotra, A.; Salam, M.A.; Yaqub, M.Z. Digital Transformation and Corporate Green Innovation: An Affordance Theory Perspective. Bus. Strat Env. 2025, 34, 433–449. [Google Scholar] [CrossRef]
- Agostino, M.; Giunta, A.; Nugent, J.B.; Scalera, D.; Trivieri, F. The Importance of Being a Capable Supplier: Italian Industrial Firms in Global Value Chains. Int. Small Bus. J. Res. Entrep. 2015, 33, 708–730. [Google Scholar] [CrossRef]
- Geffen, C.A.; Rothenberg, S. Suppliers and Environmental Innovation: The Automotive Paint Process. Int. J. Oper. Prod. Manag. 2000, 20, 166–186. [Google Scholar] [CrossRef]
- Belhadi, A.; Venkatesh, M.; Kamble, S.; Abedin, M.Z. Data-Driven Digital Transformation for Supply Chain Carbon Neutrality: Insights from Cross-Sector Supply Chain. Int. J. Prod. Econ. 2024, 270, 109178. [Google Scholar] [CrossRef]
- Gao, X.; Wei, S. The Impact of Supply Chain Finance on Corporate Green Innovation: Evidence from A-Share Listed Companies in China. Sustainability 2026, 18, 8137. [Google Scholar] [CrossRef]
- Lv, J.; Wang, S. Top Management Team Resource-Based Faultline and Corporate Green Innovation: Empirical Evidence from Listed Chinese Manufacturing Companies. Eur. J. Innov. Manag. 2024. [Google Scholar] [CrossRef]
- Jiang, L.; Wang, X.; Zhang, J. The Systemic Impact of Dynamic Regulations on Green Technology Innovation: An Evolutionary Game Incorporating Consumer Preferences. Systems 2026, 14, 603. [Google Scholar] [CrossRef]
- Hu, W.; Shi, S. CEO Green Background and Enterprise Green Innovation. Int. Rev. Econ. Financ. 2025, 97, 103765. [Google Scholar] [CrossRef]
- Chen, X.; Xu, X.; Tong, D. Digital Transformation and Green Innovation Performance in New Energy Enterprises: A Configurational Analysis of Complex Resource Systems Using fsQCA. Systems 2026, 14, 855. [Google Scholar] [CrossRef]
- Huang, X.; Liu, W.; Zhang, Z.; Zou, X.; Li, P. Quantity or Quality: Environmental Legislation and Corporate Green Innovations. Ecol. Econ. 2023, 204, 107684. [Google Scholar] [CrossRef]
- Lange, S.; Pohl, J.; Santarius, T. Digitalization and Energy Consumption. Does ICT Reduce Energy Demand? Ecol. Econ. 2020, 176, 106760. [Google Scholar] [CrossRef]
- Berrone, P.; Fosfuri, A.; Gelabert, L.; Gomez-Mejia, L.R. Necessity as the Mother of ‘Green’ Inventions: Institutional Pressures and Environmental Innovations. Strateg. Manag. J. 2013, 34, 891–909. [Google Scholar] [CrossRef]
- Kim, I.; Pantzalis, C.; Zhang, Z. Multinationality and the Value of Green Innovation. J. Corp. Financ. 2021, 69, 101996. [Google Scholar] [CrossRef]
- Li, Z.; Huang, Z.; Su, Y. New Media Environment, Environmental Regulation and Corporate Green Technology Innovation:Evidence from China. Energy Econ. 2023, 119, 106545. [Google Scholar] [CrossRef]
- Sun, X.; Tang, J.; Li, S. Promote Green Innovation in Manufacturing Enterprises in the Aspect of Government Subsidies in China. IJERPH 2022, 19, 7864. [Google Scholar] [CrossRef] [PubMed]
- Shang, T.-T.; Dong, G.-M.; Tian, M. How Does Market Orientation Affect Disruptive Green Innovation? The Mediating Role of Resource Bricolage. Eur. J. Innov. Manag. 2025, 28, 2394–2418. [Google Scholar] [CrossRef]
- Du, Y.; Wang, H. Green Innovation Sustainability: How Green Market Orientation and Absorptive Capacity Matter? Sustainability 2022, 14, 8192. [Google Scholar] [CrossRef]
- Rui, Z.; Lu, Y. Stakeholder Pressure, Corporate Environmental Ethics and Green Innovation. Asian J. Technol. Innov. 2021, 29, 70–86. [Google Scholar] [CrossRef]
- Qi, G.Y.; Shen, L.Y.; Zeng, S.X.; Jorge, O.J. The Drivers for Contractors’ Green Innovation: An Industry Perspective. J. Clean. Prod. 2010, 18, 1358–1365. [Google Scholar] [CrossRef]
- Isaksson, O.H.D.; Simeth, M.; Seifert, R.W. Knowledge Spillovers in the Supply Chain: Evidence from the High Tech Sectors. Res. Policy 2016, 45, 699–706. [Google Scholar] [CrossRef]
- Du, L.; Zhang, Z.; Feng, T. Linking Green Customer and Supplier Integration with Green Innovation Performance: The Role of Internal Integration. Bus. Strategy Environ. 2018, 27, 1583–1595. [Google Scholar] [CrossRef]
- Abourokbah, S.H.; Salam, M.A.; Badawi, N.S. The Knowledge Pipeline: How Supply Chain Information Integration Fuels Green Absorptive Capacity, Employee Creativity, and Innovation Performance. Logistics 2026, 10, 16. [Google Scholar] [CrossRef]
- Li, Y.; Xu, N. Harnessing AI for Green Innovation: The Role of Executive Cognition. Systems 2026, 14, 284. [Google Scholar] [CrossRef]
- Rennings, K.; Rammer, C. The Impact of Regulation-Driven Environmental Innovation on Innovation Success and Firm Performance. Ind. Innov. 2011, 18, 255–283. [Google Scholar] [CrossRef]
- Wang, L.; Li, M.; Wang, W.; Gong, Y.; Xiong, Y. Green Innovation Output in the Supply Chain Network with Environmental Information Disclosure: An Empirical Analysis of Chinese Listed Firms. Int. J. Prod. Econ. 2023, 256, 108745. [Google Scholar] [CrossRef]
- Chu, Y.; Tian, X.; Wang, W. Corporate Innovation along the Supply Chain. Manag. Sci. 2019, 65, 2445–2466. [Google Scholar] [CrossRef]
- Geng, Y.; Xiang, X.; Zhang, G.; Li, X. Digital Transformation along the Supply Chain: Spillover Effects from Vertical Partnerships. J. Bus. Res. 2024, 183, 114842. [Google Scholar] [CrossRef]
- Vial, G. Understanding Digital Transformation: A Review and a Research Agenda. J. Strateg. Inf. Syst. 2019, 28, 118–144. [Google Scholar] [CrossRef]
- Guo, X.; Li, M.; Wang, Y.; Mardani, A. Does Digital Transformation Improve the Firm’s Performance? From the Perspective of Digitalization Paradox and Managerial Myopia. J. Bus. Res. 2023, 163, 113868. [Google Scholar] [CrossRef]
- Teng, Y.; Du, A.M.; Lin, B. The Mechanism of Supply Chain Efficiency in Enterprise Digital Transformation and Total Factor Productivity. Int. Rev. Financ. Anal. 2024, 96, 103583. [Google Scholar] [CrossRef]
- Chen, W.; Ren, H.; Shu, Y. The Impact of Corporate Digital Transformation on Sustainable Development in China. Bus. Strat Env. 2025, 34, 2721–2747. [Google Scholar] [CrossRef]
- Ding, X.; Vuković, D.B.; Sokolov, B.I.; Vukovic, N.; Liu, Y. Enhancing ESG Performance through Digital Transformation: Insights from China’s Manufacturing Sector. Technol. Soc. 2024, 79, 102753. [Google Scholar] [CrossRef]
- Liu, Y.; Hu, S.; Wang, C. The Green Innovation Spillover Effect of Enterprise Digital Transformation: Based on Supply Chain Perspective. Econ. Anal. Policy 2024, 84, 1381–1393. [Google Scholar] [CrossRef]
- Yan, Y.; Lei, Y.; Wang, Y.; Lv, D.; Lu, F.; Yao, Y. Digital Transformation and Customer Enterprise Innovation - from the Perspective of Supply Chain Spillover Effects. Financ. Res. Lett. 2025, 76, 106941. [Google Scholar] [CrossRef]
- Tushman, M.L.; Nadler, D.A. Information Processing as an Integrating Concept in Organizational Design. Acad. Manag. Rev. 1978, 3, 613–624. [Google Scholar] [CrossRef]
- Fang, X.; Liu, M. How Does the Digital Transformation Drive Digital Technology Innovation of Enterprises? Evidence from Enterprise’s Digital Patents. Technol. Forecast. Soc. Change 2024, 204, 123428. [Google Scholar] [CrossRef]
- Su, Y.; Li, H.; Tian, G.G.; Ding, C.J.; Ahmed, A.D. Enhancing Technological and Green Innovation through Digital Leapfrogging in Manufacturing. Bus. Strat Env. 2025, 34, 5240–5259. [Google Scholar] [CrossRef]
- Manita, R.; Elommal, N.; Baudier, P.; Hikkerova, L. The Digital Transformation of External Audit and Its Impact on Corporate Governance. Technol. Forecast. Soc. Change 2020, 150, 119751. [Google Scholar] [CrossRef]
- Srinivasan, R.; Swink, M. An Investigation of Visibility and Flexibility as Complements to Supply Chain Analytics: An Organizational Information Processing Theory Perspective. Prod. Oper. Manag. 2018, 27, 1849–1867. [Google Scholar] [CrossRef]
- Harding, J.A.; Swarnkar, R. Implementing Collaboration Moderator Service to Support Various Phases of Virtual Organisations. Int. J. Prod. Res. 2013, 51, 7372–7387. [Google Scholar] [CrossRef]
- Chen, Y.; Zhang, Y.; Wang, M. Green Credit, Financial Regulation and Corporate Green Innovation: Evidence from China. Financ. Res. Lett. 2024, 59, 104768. [Google Scholar] [CrossRef]
- Jaffe, A.B.; Trajtenberg, M.; Henderson, R. Geographic Localization of Knowledge Spillovers as Evidenced by Patent Citations. Q. j. Econ. 1993, 108, 577–598. [Google Scholar] [CrossRef]
- Khalil, S.; Ghadiri, S.M. Balancing Exploration and Exploitation: How Green Knowledge Integration Drives Supplier Performance in Sustainable Supply Chains. Logistics 2025, 9, 176. [Google Scholar] [CrossRef]
- Guan, Y.; Wong, M.H.F.; Zhang, Y. Analyst Following along the Supply Chain. Rev. Account. Stud. 2015, 20, 210–241. [Google Scholar] [CrossRef]
- Hong, W.; Su, Y.-S. The Effect of Institutional Proximity in Non-Local University–Industry Collaborations: An Analysis Based on Chinese Patent Data. Res. Policy 2013, 42, 454–464. [Google Scholar] [CrossRef]
- Shimshack, J.P.; Ward, M.B. Regulator Reputation, Enforcement, and Environmental Compliance. J. Environ. Econ. Manag. 2005, 50, 519–540. [Google Scholar] [CrossRef]
- Healy, P.M.; Palepu, K.G. Information Asymmetry, Corporate Disclosure, and the Capital Markets: A Review of the Empirical Disclosure Literature. J. account. econ. 2001, 31, 405–440. [Google Scholar] [CrossRef]
- Brauer, M.; Wiersema, M. Analyzing Analyst Research: A Review of Past Coverage and Recommendations for Future Research. J. Manag. 2018, 44, 218–248. [Google Scholar] [CrossRef]
- Barth, M.E.; Kasznik, R.; McNichols, M.F. Analyst Coverage and Intangible Assets. J. Account. Res. 2001, 39, 1–34. [Google Scholar] [CrossRef]
- Frankel, R.; Li, X. Characteristics of a Firm’s Information Environment and the Information Asymmetry between Insiders and Outsiders. J. Account. Econ. 2004, 37, 229–259. [Google Scholar] [CrossRef]
- Hazarika, S.; Karpoff, J.M.; Nahata, R. Internal Corporate Governance, CEO Turnover, and Earnings Management. J. Financ. Econ. 2012, 104, 44–69. [Google Scholar] [CrossRef]
- Zheng, M.; Feng, G.-F.; Jang, C.-L.; Chang, C.-P. Terrorism and Green Innovation in Renewable Energy. Energy Econ. 2021, 104, 105695. [Google Scholar] [CrossRef]
- Comino, S.; Graziano, C. How Many Patents Does It Take to Signal Innovation Quality? Int. J. Ind. Organ. 2015, 43, 66–79. [Google Scholar] [CrossRef]
- Zhao, N.; Hong, J.; Lau, K.H. Impact of Supply Chain Digitalization on Supply Chain Resilience and Performance: A Multi-Mediation Model. Int. J. Prod. Econ. 2023, 259, 108817. [Google Scholar] [CrossRef] [PubMed]
- Jaffe, A.B.; Palmer, K. Environmental Regulation and Innovation: A Panel Data Study. Rev. Econ. Stat. 1997, 79, 610–619. [Google Scholar] [CrossRef]
- Guo, B.; Pérez-Castrillo, D.; Toldrà-Simats, A. Firms’ Innovation Strategy under the Shadow of Analyst Coverage. J. Financ. Econ. 2019, 131, 456–483. [Google Scholar] [CrossRef]
- Maoret, M.; Moreira, S.; Sabanci, H. Closing the Gender Pay Gap: Analyst Coverage, Stakeholder Attention, and Gender Differences in Executive Compensation. Organ. Stud. 2024, 45, 495–521. [Google Scholar] [CrossRef]
- Ren, X.; Li, W.; Li, Y. Climate Risk, Digital Transformation and Corporate Green Innovation Efficiency: Evidence from China. Technol. Forecast. Soc. Change 2024, 209, 123777. [Google Scholar] [CrossRef]
- Zheng, Q.; Huang, D. The Impact of Digital and Real Technological Integration on Corporate Green Collaborative Innovation. Systems 2026, 14, 928. [Google Scholar] [CrossRef]
- Claessens, S.; Djankov, S.; Lang, L.H. The Separation of Ownership and Control in East Asian Corporations. J. financ. Econ. 2000, 58, 81–112. [Google Scholar] [CrossRef]
- Zhong, W.; Ma, Z.; Tong, T.W.; Zhang, Y.; Xie, L. Customer Concentration, Executive Attention, and Firm Search Behavior. Acad. Manag. J. 2021, 64, 1625–1647. [Google Scholar] [CrossRef]
- Levitas, E. Demand-Side Research’s Role in Macro-Management: A Commentary on Priem, Li, and Carr. J. Manag. 2013, 39, 1069–1084. [Google Scholar] [CrossRef]
Figure 1.
Research framework.
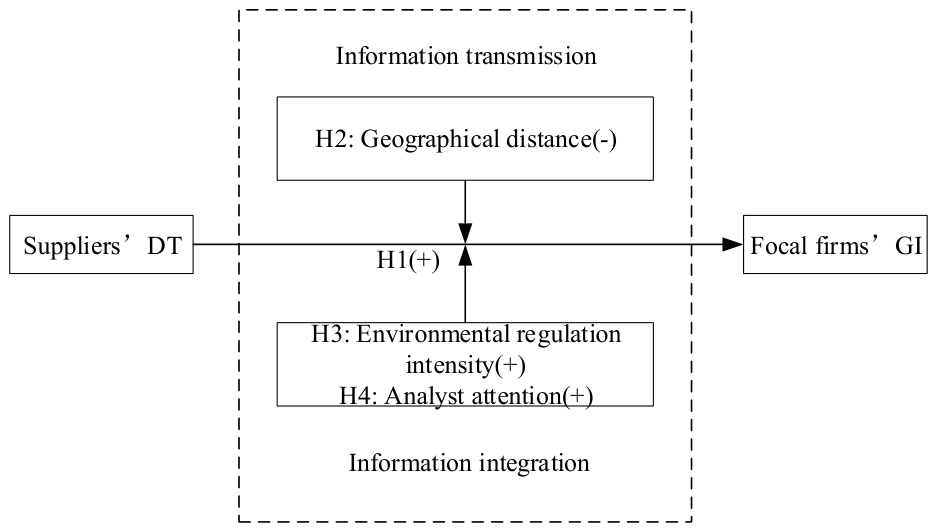
Figure 2.
The moderating effect of geographical distance.
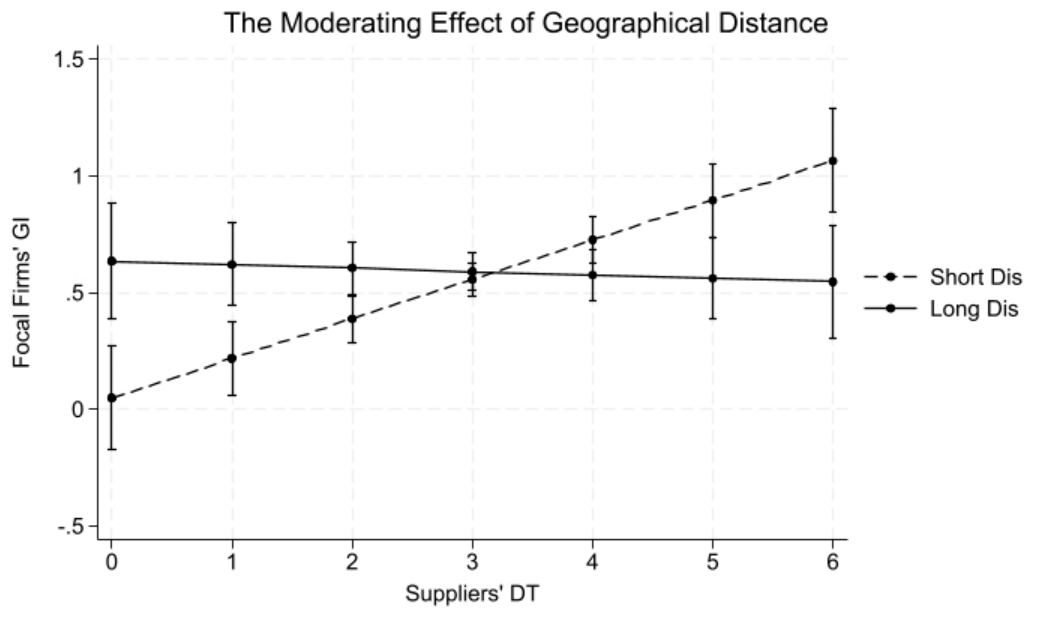
Figure 3.
The moderating effect of environmental regulation intensity.
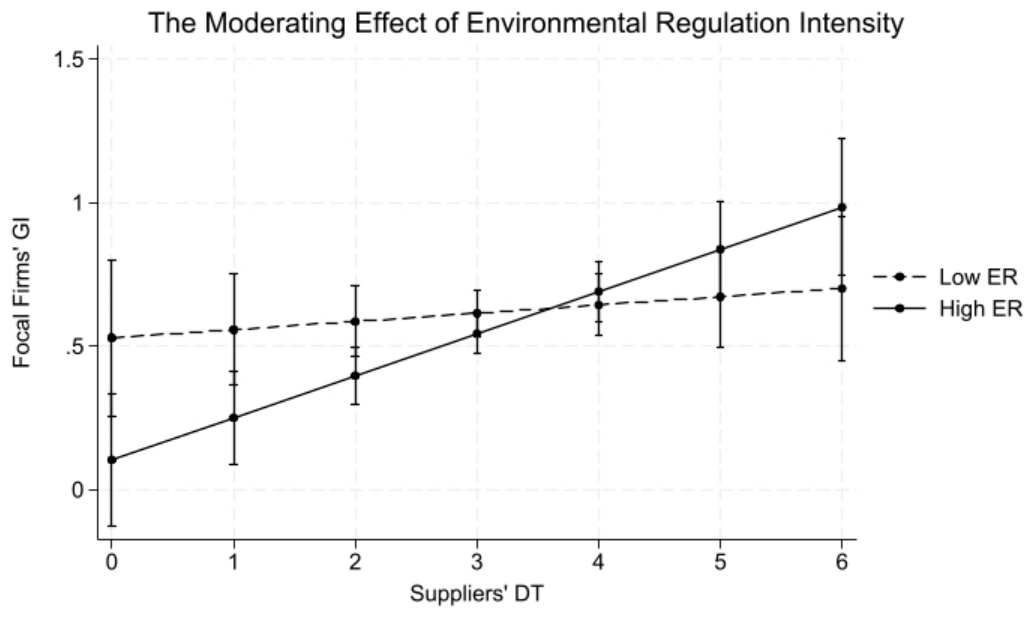
Figure 4.
The moderating effect of analyst attention.
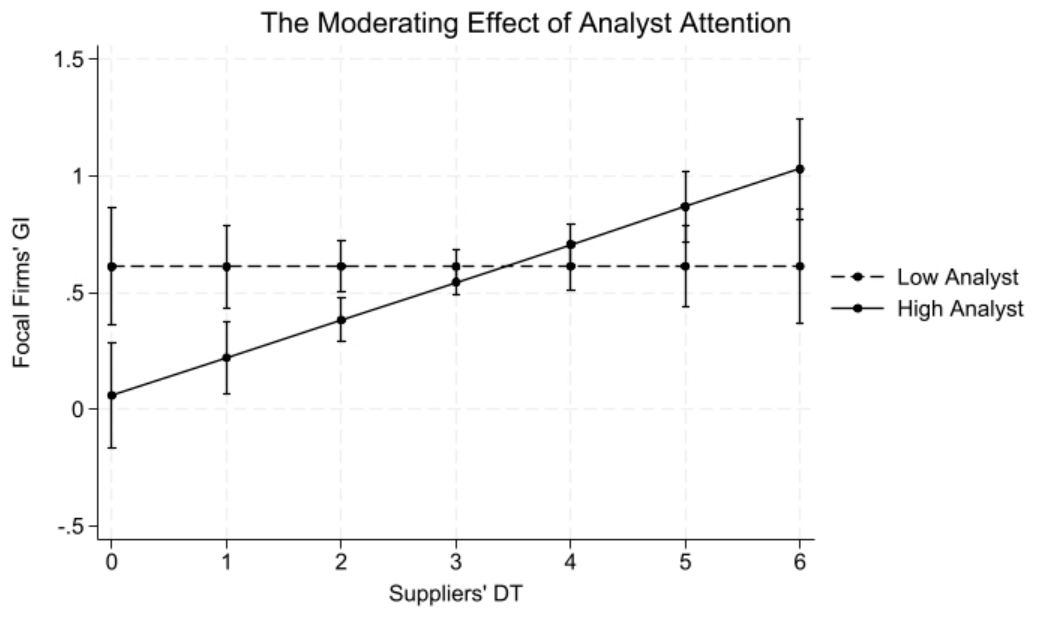

Table 1.
Main variables.
| Variable | Abbreviation | Operationalization | Source | References |
| Focal firm’s Green Innovation | GI | The natural logarithm of the number of green patent applications | CNRDS | [3] |
| Digital transformation of suppliers | SupDig | Natural logarithm of the frequency of digital keywords in the annual report of listed firms | Annual Report on Listed Firms | [12] |
| Geographical distance | Dis | Geographical distance between supplier firms and focal firms | CSMAR | [56] |
| Environmental regulation intensity | ER | Industrial pollution control investment/ Industrial value added | National Bureau of Statistics of China | [25] |
| Analyst attention | Analyst | Natural logarithm of the number of analysts focusing on the same listed firm | CSMAR | [67] |
| Firm size | Size | The natural logarithm of the total assets of the firm | CSMAR | [12] |
| Firm ownership nature | Soe | Whether it is a state-owned firm or state-controlled (1 for yes, 0 for no) | CSMAR | [10] |
| Duality | Dual | Whether the chairman also serves as the general manager | CSMAR | [10] |
| Firm age | Age | The natural logarithm of the age of the firm | CSMAR | [12] |
| The independent director proportion | Bod_indep | Proportion of independent directors among the total number of directors | CSMAR | [69] |
| Ownership of the largest shareholder | Top1 | Shareholding ratio of the largest shareholder | CSMAR | [10] |
| Board Size | Board | Natural logarithms of the number of directors | CSMAR | [47] |
| Separation of powers ratio | Separation | The difference between the shares held by controlling shareholders in the firm’s board of directors and senior management | CSMAR | [71] |
| Financial leverage | Lev | Total liabilities / Total assets | CSMAR | [10] |
| Profitability | ROA | Net profit / Total assets | CSMAR | [12] |
Table 2.
Hausman (1978) test.
| Coef. | ||
| Chi-square test value | 79.84 | |
| p-value | 0.0035 | |
| Coef. | ||
| Chi-square test value | 107.09 | |
| p-value | 0.0000 |
Table 3.
Descriptive statistics and correlation matrix.
| Variables | (1) | (2) | (3) | (4) | (5) | (6) | (7) | (8) | (9) | (10) | (11) | (12) | (13) | (14) | (15) |
| (1) GI | 1.000 | ||||||||||||||
| (2) SupDig | 0.110*** | 1.000 | |||||||||||||
| (3) Dis | -0.023 | 0.053*** | 1.000 | ||||||||||||
| (4) ER | -0.098*** | -0.014 | 0.036* | 1.000 | |||||||||||
| (5) Analyst | 0.130*** | 0.147*** | 0.007 | 0.199*** | 1.000 | ||||||||||
| (6) Size | 0.472*** | -0.033* | -0.012 | 0.044** | 0.196*** | 1.000 | |||||||||
| (7) Soe | 0.168*** | -0.083*** | -0.056*** | 0.067*** | -0.036* | 0.430*** | 1.000 | ||||||||
| (8) Dual | -0.089*** | -0.006 | -0.009 | -0.093*** | 0.012 | -0.225*** | -0.320*** | 1.000 | |||||||
| (9) Age | 0.055* | -0.008 | -0.053*** | -0.156*** | -0.275*** | 0.225*** | 0.171*** | -0.094*** | 1.000 | ||||||
| (10) Bod_indep | -0.027 | 0.015 | -0.003 | -0.053*** | -0.060*** | -0.015 | -0.049** | 0.085*** | 0.035* | 1.000 | |||||
| (11) Top1 | 0.193*** | -0.117*** | -0.055*** | -0.018 | 0.036* | 0.251*** | 0.336*** | -0.099*** | -0.032* | -0.043** | 1.000 | ||||
| (12) Board | 0.118*** | -0.005 | -0.021 | 0.117*** | 0.133*** | 0.268*** | 0.229*** | -0.133*** | -0.023 | -0.524*** | 0.077*** | 1.000 | |||
| (13) Separation | 0.095*** | -0.062*** | -0.008 | 0.107*** | -0.001 | 0.093*** | 0.041** | -0.071*** | 0.035* | -0.110*** | 0.132*** | 0.136*** | 1.000 | ||
| (14) Lev | 0.234*** | -0.033* | 0.041** | 0.061*** | -0.030 | 0.502*** | 0.313*** | -0.168*** | 0.204*** | 0.019 | 0.104*** | 0.130*** | 0.052*** | 1.000 | |
| (15) ROA Mean SD |
0.011 0.558 0.945 |
-0.048** 2.633 1.503 |
-0.034* 6.097 1.160 |
0.002 0.002 0.002 |
0.206*** 1.115 1.226 |
-0.019 22.118 1.329 |
-0.038* 0.401 0.490 |
0.060*** 0.257 0.437 |
-0.122*** 18.938 6.135 |
-0.051*** 0.368 0.050 |
0.163*** 34.022 15.338 |
0.028 2.248 0.175 |
0.039* 4.766 7.420 |
-0.345*** 0.436 0.207 |
1.000 0.030 0.063 |
| Note: *** p<0.01, ** p<0.05, * p<0.1 | |||||||||||||||
Table 4.
The Effect of Suppliers’ DT on Focal Firms’ GI.
| Model 1 | Model 2 | Model 3 | Model 4 | Model 5 | |
| SupDig | 0.100*** | 0.561*** | 0.030 | 0.000 | |
| (0.034) | (0.097) | (0.043) | (0.041) | ||
| Dis | 0.015 | 0.016 | 0.253*** | 0.012 | 0.018 |
| (0.031) | (0.030) | (0.056) | (0.030) | (0.030) | |
| SupDig*Dis | -0.079*** | ||||
| (0.016) | |||||
| ER | -15.795 | -15.211 | -11.851 | -96.359*** | -14.720 |
| (15.515) | (15.428) | (15.170) | (34.138) | (15.232) | |
| SupDig*ER | 26.747*** | ||||
| (10.049) | |||||
| Analyst | -0.021 | -0.025 | -0.026 | -0.028 | -0.251*** |
| (0.027) | (0.027) | (0.026) | (0.027) | (0.059) | |
| SupDig* Analyst | 0.073*** | ||||
| (0.017) | |||||
| Size | 0.041 | 0.059 | 0.052 | 0.075 | 0.042 |
| (0.097) | (0.097) | (0.095) | (0.096) | (0.095) | |
| Soe | 0.334 | 0.341 | 0.263 | 0.342 | 0.263 |
| (0.214) | (0.213) | (0.210) | (0.212) | (0.211) | |
| Dual | 0.092 | 0.076 | 0.042 | 0.067 | 0.081 |
| (0.085) | (0.084) | (0.083) | (0.084) | (0.083) | |
| Age | 0.116*** | 0.095** | 0.106*** | 0.096** | 0.106*** |
| (0.039) | (0.039) | (0.039) | (0.039) | (0.039) | |
| Bod_indep | 0.266 | 0.381 | 0.444 | 0.219 | 0.159 |
| (0.961) | (0.956) | (0.939) | (0.954) | (0.945) | |
| Top1 | 0.016*** | 0.016*** | 0.015*** | 0.016*** | 0.015*** |
| (0.004) | (0.004) | (0.004) | (0.004) | (0.004) | |
| Board | 0.273 | 0.316 | 0.181 | 0.231 | 0.275 |
| (0.321) | (0.320) | (0.315) | (0.320) | (0.316) | |
| Separation | -0.001 | -0.002 | -0.003 | -0.003 | -0.001 |
| (0.007) | (0.006) | (0.006) | (0.006) | (0.006) | |
| Lev | 0.333 | 0.340 | 0.331 | 0.266 | 0.283 |
| (0.324) | (0.322) | (0.316) | (0.322) | (0.318) | |
| ROA | 0.194 | 0.202 | -0.024 | -0.104 | 0.205 |
| (0.545) | (0.542) | (0.534) | (0.552) | (0.535) | |
| Constant | -4.730** | -5.133** | -6.100*** | -5.039** | -4.453** |
| (2.203) | (2.195) | (2.165) | (2.186) | (2.173) | |
| R2 | 0.244 | 0.253 | 0.280 | 0.261 | 0.273 |
| Firm fixed effect | YES | YES | YES | YES | YES |
| Year fixed effect | YES | YES | YES | YES | YES |
| Industry fixed effect | YES | YES | YES | YES | YES |
| Observations | 1158 | 1158 | 1158 | 1158 | 1158 |
Note: Standard errors in parentheses: *** p<0.01, ** p<0.05, * p<0.1. Unless otherwise noted, the table below is the same as the one shown here.
Table 5.
Replacing independent variable.
| Model 1 | Model 2 | Model 3 | Model 4 | Model 5 | |
| Digit | 0.077** | 0.552*** | 0.001 | -0.020 | |
| (0.033) | (0.100) | (0.042) | (0.039) | ||
| Dis | 0.015 | 0.017 | 0.254*** | 0.012 | 0.018 |
| (0.031) | (0.031) | (0.056) | (0.030) | (0.030) | |
| Digit *Dis | -0.081*** | ||||
| (0.016) | |||||
| ER | -15.795 | -15.347 | -12.008 | -103.586*** | -14.516 |
| (15.515) | (15.467) | (15.214) | (33.455) | (15.262) | |
| Digit *ER | 29.565*** | ||||
| (9.955) | |||||
| Analyst | -0.021 | -0.025 | -0.027 | -0.028 | -0.247*** |
| (0.027) | (0.027) | (0.026) | (0.027) | (0.057) | |
| Digit * Analyst | 0.074*** | ||||
| (0.017) | |||||
| Size | 0.041 | 0.058 | 0.056 | 0.077 | 0.043 |
| (0.097) | (0.097) | (0.095) | (0.097) | (0.096) | |
| Soe | 0.334 | 0.342 | 0.267 | 0.347 | 0.257 |
| (0.214) | (0.213) | (0.210) | (0.212) | (0.211) | |
| Dual | 0.092 | 0.082 | 0.048 | 0.072 | 0.085 |
| (0.085) | (0.084) | (0.083) | (0.084) | (0.083) | |
| Age | 0.116*** | 0.098** | 0.109*** | 0.100** | 0.109*** |
| (0.039) | (0.040) | (0.039) | (0.039) | (0.039) | |
| Bod_indep | 0.266 | 0.369 | 0.447 | 0.211 | 0.136 |
| (0.961) | (0.959) | (0.942) | (0.955) | (0.947) | |
| Top1 | 0.016*** | 0.016*** | 0.015*** | 0.016*** | 0.015*** |
| (0.004) | (0.004) | (0.004) | (0.004) | (0.004) | |
| Board | 0.273 | 0.303 | 0.181 | 0.212 | 0.259 |
| (0.321) | (0.321) | (0.316) | (0.320) | (0.317) | |
| Separation | -0.001 | -0.002 | -0.003 | -0.003 | -0.001 |
| (0.007) | (0.006) | (0.006) | (0.006) | (0.006) | |
| Lev | 0.333 | 0.346 | 0.333 | 0.270 | 0.290 |
| (0.324) | (0.323) | (0.317) | (0.322) | (0.319) | |
| ROA | 0.194 | 0.219 | -0.002 | -0.123 | 0.206 |
| (0.545) | (0.543) | (0.536) | (0.552) | (0.536) | |
| Constant | -4.730** | -5.090** | -6.211*** | -5.051** | -4.428** |
| (2.203) | (2.202) | (2.175) | (2.189) | (2.178) | |
| R2 | 0.244 | 0.250 | 0.276 | 0.259 | 0.270 |
| Firm fixed effect | YES | YES | YES | YES | YES |
| Year fixed effect | YES | YES | YES | YES | YES |
| Industry fixed effect | YES | YES | YES | YES | YES |
| Observations | 1158 | 1158 | 1158 | 1158 | 1158 |
Table 6.
Adding control variables.
| Model 1 | Model 2 | Model 3 | Model 4 | Model 5 | |
| SupDig | 0.079** | 0.519*** | 0.011 | -0.029 | |
| (0.034) | (0.097) | (0.043) | (0.041) | ||
| Dis | 0.015 | 0.016 | 0.243*** | 0.011 | 0.018 |
| (0.030) | (0.030) | (0.056) | (0.030) | (0.030) | |
| SupDig*Dis | -0.076*** | ||||
| (0.016) | |||||
| ER | -16.844 | -16.291 | -12.628 | -95.098*** | -16.402 |
| (15.491) | (15.443) | (15.206) | (34.451) | (15.208) | |
| SupDig*ER | 25.990** | ||||
| (10.167) | |||||
| Analyst | -0.018 | -0.021 | -0.023 | -0.024 | -0.265*** |
| (0.027) | (0.027) | (0.027) | (0.027) | (0.059) | |
| SupDig* Analyst | 0.080*** | ||||
| (0.017) | |||||
| Size | 0.003 | 0.017 | 0.014 | 0.030 | 0.005 |
| (0.100) | (0.100) | (0.098) | (0.099) | (0.098) | |
| Soe | 0.332 | 0.337 | 0.259 | 0.339 | 0.229 |
| (0.219) | (0.218) | (0.215) | (0.217) | (0.216) | |
| Dual | 0.052 | 0.044 | 0.011 | 0.036 | 0.050 |
| (0.085) | (0.085) | (0.083) | (0.084) | (0.083) | |
| Age | 0.169*** | 0.157*** | 0.154*** | 0.163*** | 0.165*** |
| (0.041) | (0.041) | (0.040) | (0.041) | (0.040) | |
| Bod_indep | -0.007 | 0.087 | 0.167 | -0.080 | -0.229 |
| (0.969) | (0.967) | (0.951) | (0.965) | (0.955) | |
| Top1 | 0.014*** | 0.015*** | 0.013*** | 0.014*** | 0.013*** |
| (0.004) | (0.004) | (0.004) | (0.004) | (0.004) | |
| Board | 0.189 | 0.233 | 0.109 | 0.153 | 0.191 |
| (0.322) | (0.322) | (0.317) | (0.322) | (0.317) | |
| Separation | 0.003 | 0.003 | 0.001 | 0.001 | 0.003 |
| (0.007) | (0.007) | (0.007) | (0.007) | (0.007) | |
| Lev | 0.368 | 0.369 | 0.358 | 0.304 | 0.292 |
| (0.326) | (0.325) | (0.319) | (0.325) | (0.320) | |
| ROA | 0.056 | 0.066 | -0.141 | -0.210 | 0.010 |
| (0.546) | (0.544) | (0.537) | (0.552) | (0.536) | |
| ESG | 0.007 | 0.005 | 0.008 | 0.001 | 0.003 |
| (0.029) | (0.029) | (0.028) | (0.028) | (0.028) | |
| Subsidy | 0.013*** | 0.012*** | 0.011*** | 0.012*** | 0.011*** |
| (0.004) | (0.004) | (0.004) | (0.004) | (0.004) | |
| Concentration | -0.005** | -0.005** | -0.004** | -0.005** | -0.005** |
| (0.002) | (0.002) | (0.002) | (0.002) | (0.002) | |
| Constant | -4.601** | -5.036** | -5.781** | -4.992** | -4.268* |
| (2.323) | (2.323) | (2.290) | (2.313) | (2.293) | |
| R2 | 0.269 | 0.275 | 0.299 | 0.282 | 0.298 |
| Firm fixed effect | YES | YES | YES | YES | YES |
| Year fixed effect | YES | YES | YES | YES | YES |
| Industry fixed effect | YES | YES | YES | YES | YES |
| Observations | 1121 | 1121 | 1121 | 1121 | 1121 |
Table 7.
Replacing dependent variable.
| Model 1 | Model 2 | Model 3 | Model 4 | Model 5 | |
| SupDig | 0.131*** | 0.538*** | 0.043 | 0.017 | |
| (0.040) | (0.116) | (0.051) | (0.048) | ||
| Dis | 0.002 | 0.003 | 0.212*** | -0.003 | 0.005 |
| (0.037) | (0.036) | (0.067) | (0.036) | (0.036) | |
| SupDig*Dis | -0.070*** | ||||
| (0.019) | |||||
| ER | -25.348 | -24.582 | -21.611 | -126.976*** | -24.019 |
| (18.488) | (18.358) | (18.204) | (40.595) | (18.142) | |
| SupDig*ER | 33.750*** | ||||
| (11.950) | |||||
| Analyst | 0.005 | -0.001 | -0.002 | -0.004 | -0.260*** |
| (0.032) | (0.032) | (0.031) | (0.032) | (0.070) | |
| SupDig* Analyst | 0.084*** | ||||
| (0.020) | |||||
| Size | 0.145 | 0.168 | 0.163 | 0.188 | 0.150 |
| (0.116) | (0.115) | (0.114) | (0.115) | (0.114) | |
| Soe | 0.383 | 0.392 | 0.323 | 0.394 | 0.303 |
| (0.255) | (0.253) | (0.251) | (0.252) | (0.251) | |
| Dual | 0.002 | -0.018 | -0.049 | -0.030 | -0.013 |
| (0.101) | (0.100) | (0.100) | (0.100) | (0.099) | |
| Age | 0.138*** | 0.110** | 0.120** | 0.111** | 0.123*** |
| (0.046) | (0.047) | (0.046) | (0.047) | (0.046) | |
| Bod_indep | 1.455 | 1.606 | 1.661 | 1.402 | 1.352 |
| (1.145) | (1.137) | (1.127) | (1.134) | (1.126) | |
| Top1 | 0.019*** | 0.019*** | 0.018*** | 0.019*** | 0.018*** |
| (0.005) | (0.005) | (0.005) | (0.005) | (0.005) | |
| Board | 0.508 | 0.564 | 0.444 | 0.456 | 0.517 |
| (0.383) | (0.381) | (0.379) | (0.381) | (0.376) | |
| Separation | 0.001 | 0.001 | -0.000 | -0.001 | 0.001 |
| (0.008) | (0.008) | (0.008) | (0.008) | (0.008) | |
| Lev | 0.097 | 0.107 | 0.099 | 0.013 | 0.042 |
| (0.386) | (0.383) | (0.380) | (0.383) | (0.379) | |
| ROA | -0.080 | -0.070 | -0.270 | -0.457 | -0.066 |
| (0.649) | (0.645) | (0.641) | (0.656) | (0.637) | |
| Constant | -8.755*** | -9.284*** | -10.139*** | -9.165*** | -8.504*** |
| (2.626) | (2.612) | (2.598) | (2.599) | (2.588) | |
| R2 | 0.269 | 0.280 | 0.295 | 0.289 | 0.298 |
| Firm fixed effect | YES | YES | YES | YES | YES |
| Year fixed effect | YES | YES | YES | YES | YES |
| Industry fixed effect | YES | YES | YES | YES | YES |
| Observations | 1158 | 1158 | 1158 | 1158 | 1158 |
Table 8.
Excluding or filtering specific years.
| Model 1 | Model 2 | Model 3 | Model 4 | Model 5 | |
| SupDig | 0.087** | 0.588*** | 0.031 | -0.008 | |
| (0.037) | (0.106) | (0.047) | (0.044) | ||
| Dis | 0.036 | 0.036 | 0.295*** | 0.030 | 0.035 |
| (0.034) | (0.034) | (0.061) | (0.034) | (0.033) | |
| SupDig*Dis | -0.086*** | ||||
| (0.017) | |||||
| ER | -23.345 | -21.722 | -17.379 | -90.001** | -20.556 |
| (16.956) | (16.906) | (16.582) | (38.544) | (16.707) | |
| SupDig*ER | 22.318** | ||||
| (11.329) | |||||
| Analyst | -0.022 | -0.026 | -0.027 | -0.028 | -0.245*** |
| (0.029) | (0.029) | (0.028) | (0.029) | (0.063) | |
| SupDig* Analyst | 0.071*** | ||||
| (0.018) | |||||
| Size | 0.105 | 0.121 | 0.094 | 0.135 | 0.107 |
| (0.113) | (0.113) | (0.110) | (0.113) | (0.111) | |
| Soe | 0.506** | 0.517** | 0.410* | 0.528** | 0.407* |
| (0.248) | (0.247) | (0.243) | (0.247) | (0.246) | |
| Dual | 0.104 | 0.093 | 0.060 | 0.088 | 0.103 |
| (0.090) | (0.090) | (0.089) | (0.090) | (0.089) | |
| Age | 0.127*** | 0.111*** | 0.120*** | 0.115*** | 0.118*** |
| (0.033) | (0.034) | (0.033) | (0.034) | (0.033) | |
| Bod_indep | -0.539 | -0.435 | -0.473 | -0.588 | -0.589 |
| (1.072) | (1.069) | (1.047) | (1.069) | (1.057) | |
| Top1 | 0.019*** | 0.018*** | 0.016*** | 0.018*** | 0.017*** |
| (0.005) | (0.005) | (0.005) | (0.005) | (0.005) | |
| Board | 0.187 | 0.221 | 0.100 | 0.143 | 0.192 |
| (0.349) | (0.348) | (0.341) | (0.349) | (0.344) | |
| Separation | -0.003 | -0.002 | -0.004 | -0.004 | -0.003 |
| (0.007) | (0.007) | (0.007) | (0.007) | (0.007) | |
| Lev | 0.593 | 0.572 | 0.576 | 0.488 | 0.485 |
| (0.362) | (0.361) | (0.353) | (0.362) | (0.357) | |
| ROA | 0.430 | 0.416 | 0.125 | 0.142 | 0.353 |
| (0.590) | (0.587) | (0.578) | (0.602) | (0.581) | |
| Constant | -6.311** | -6.711*** | -7.245*** | -6.658*** | -5.972** |
| (2.498) | (2.495) | (2.446) | (2.489) | (2.473) | |
| R2 | 0.252 | 0.259 | 0.290 | 0.264 | 0.278 |
| Firm fixed effect | YES | YES | YES | YES | YES |
| Year fixed effect | YES | YES | YES | YES | YES |
| Industry fixed effect | YES | YES | YES | YES | YES |
| Observations | 1035 | 1035 | 1035 | 1035 | 1035 |
Table 9.
Instrumental variable test.
| IV: Phase 1 | IV: Phase 2 | |
| SupDig | 0.214** | |
| (0.106) | ||
| A-SupDig | 0.378*** | |
| (0.028) | ||
| Dis | 0.057** | -0.035 |
| (0.024) | (0.038) | |
| ER | -25.837* | 9.453 |
| (15.257) | (20.046) | |
| Analyst | 0.009 | 0.018 |
| (0.029) | (0.038) | |
| Size | -0.019 | 0.401*** |
| (0.026) | (0.054) | |
| Soe | -0.089 | 0.045 |
| (0.061) | (0.084) | |
| Dual | -0.085 | -0.003 |
| (0.057) | (0.073) | |
| Age | -0.000 | -0.013 |
| (0.005) | (0.009) | |
| Bod_indep | -0.198 | 0.196 |
| (0.585) | (0.877) | |
| Top1 | 0.000 | 0.007** |
| (0.002) | (0.003) | |
| Board | -0.035 | 0.428* |
| (0.161) | (0.242) | |
| Separation | -0.005 | 0.013*** |
| (0.003) | (0.005) | |
| Lev | 0.026 | 0.039 |
| (0.157) | (0.251) | |
| ROA | -0.202 | -0.202 |
| (0.458) | (0.739) | |
| Constant | 2.589*** | -10.454*** |
| (0.824) | (1.229) | |
| R2 | 0.781 | 0.455 |
| Year fixed effect | YES | YES |
| Industry fixed effect | YES | YES |
| Observations | 1204 | 581 |
Table 10.
Alternative Estimation Model.
| Model 1 | Model 2 | Model 3 | Model 4 | Model 5 | |
| SupDig | 0.147** | 0.715*** | 0.055 | 0.047 | |
| (0.063) | (0.203) | (0.079) | (0.080) | ||
| Dis | 0.076 | 0.070 | 0.373*** | 0.067 | 0.075 |
| (0.053) | (0.053) | (0.116) | (0.053) | (0.053) | |
| SupDig*Dis | -0.096*** | ||||
| (0.032) | |||||
| ER | -15.297 | -14.582 | -14.860 | -125.856* | -15.414 |
| (28.206) | (27.992) | (27.655) | (64.622) | (27.846) | |
| SupDig*ER | 38.279* | ||||
| (19.973) | |||||
| Analyst | 0.091* | 0.085 | 0.083 | 0.083 | -0.133 |
| (0.056) | (0.055) | (0.055) | (0.055) | (0.122) | |
| SupDig* Analyst | 0.069** | ||||
| (0.035) | |||||
| Size | 0.742*** | 0.743*** | 0.732*** | 0.743*** | 0.743*** |
| (0.081) | (0.080) | (0.080) | (0.080) | (0.080) | |
| Soe | 0.012 | 0.049 | 0.025 | 0.072 | 0.036 |
| (0.181) | (0.180) | (0.179) | (0.180) | (0.179) | |
| Dual | 0.051 | 0.059 | 0.030 | 0.053 | 0.073 |
| (0.153) | (0.152) | (0.151) | (0.152) | (0.152) | |
| Age | -0.016 | -0.018 | -0.017 | -0.019 | -0.017 |
| (0.015) | (0.015) | (0.015) | (0.015) | (0.015) | |
| Bod_indep | -0.096 | -0.099 | 0.089 | -0.237 | -0.127 |
| (1.570) | (1.556) | (1.546) | (1.556) | (1.548) | |
| Top1 | 0.012** | 0.012** | 0.012*** | 0.012** | 0.012** |
| (0.005) | (0.005) | (0.005) | (0.005) | (0.005) | |
| Board | 0.561 | 0.587 | 0.561 | 0.526 | 0.598 |
| (0.487) | (0.482) | (0.480) | (0.483) | (0.480) | |
| Separation | 0.022** | 0.023** | 0.021** | 0.023** | 0.023** |
| (0.010) | (0.009) | (0.009) | (0.009) | (0.009) | |
| Lev | 0.875* | 0.873* | 0.830* | 0.860* | 0.791* |
| (0.463) | (0.458) | (0.456) | (0.457) | (0.458) | |
| ROA | 1.034 | 1.097 | 1.038 | 0.706 | 1.023 |
| (1.152) | (1.145) | (1.137) | (1.157) | (1.143) | |
| Year fixed effect | YES | YES | YES | YES | YES |
| Industry fixed effect | YES | YES | YES | YES | YES |
| Observations | 1158 | 1158 | 1158 | 1158 | 1158 |
Table 11.
Dependent variable two lags.
| Model 1 | Model 2 | Model 3 | Model 4 | Model 5 | |
| SupDig | 0.155*** | 1.062*** | 0.065 | 0.074 | |
| (0.058) | (0.149) | (0.077) | (0.068) | ||
| Dis | 0.124** | 0.123** | 0.639*** | 0.121** | 0.115** |
| (0.057) | (0.056) | (0.095) | (0.056) | (0.056) | |
| SupDig*Dis | -0.160*** | ||||
| (0.024) | |||||
| ER | -17.499 | -18.628 | -8.197 | -99.768* | -17.655 |
| (28.339) | (28.032) | (26.150) | (53.819) | (27.819) | |
| SupDig*ER | 28.642* | ||||
| (16.241) | |||||
| Analyst | 0.049 | 0.038 | 0.036 | 0.036 | -0.153 |
| (0.048) | (0.048) | (0.045) | (0.048) | (0.096) | |
| SupDig* Analyst | 0.064** | ||||
| (0.028) | |||||
| Size | -0.126 | -0.076 | -0.021 | -0.029 | -0.052 |
| (0.168) | (0.167) | (0.156) | (0.169) | (0.166) | |
| Soe | 0.934 | 0.852 | 0.644 | 0.785 | 0.834 |
| (0.875) | (0.866) | (0.807) | (0.863) | (0.859) | |
| Dual | 0.091 | 0.059 | 0.006 | 0.035 | 0.053 |
| (0.147) | (0.146) | (0.136) | (0.146) | (0.145) | |
| Age | -0.030 | -0.077 | -0.073 | -0.076 | -0.100 |
| (0.074) | (0.075) | (0.070) | (0.075) | (0.076) | |
| Bod_indep | 0.651 | 0.545 | -0.098 | 0.205 | 0.293 |
| (1.668) | (1.650) | (1.540) | (1.655) | (1.641) | |
| Top1 | -0.004 | -0.003 | -0.004 | -0.003 | -0.004 |
| (0.007) | (0.007) | (0.007) | (0.007) | (0.007) | |
| Board | 0.417 | 0.438 | 0.188 | 0.334 | 0.428 |
| (0.562) | (0.555) | (0.519) | (0.556) | (0.551) | |
| Separation | -0.001 | -0.002 | -0.007 | -0.003 | -0.002 |
| (0.011) | (0.010) | (0.010) | (0.010) | (0.010) | |
| Lev | -0.012 | -0.141 | -0.165 | -0.249 | -0.282 |
| (0.573) | (0.569) | (0.530) | (0.570) | (0.568) | |
| ROA | 2.053** | 1.989* | 1.621* | 1.725* | 1.907* |
| (1.022) | (1.011) | (0.943) | (1.018) | (1.004) | |
| Constant | 2.198 | 1.687 | -1.672 | 1.310 | 2.134 |
| (3.816) | (3.779) | (3.556) | (3.770) | (3.755) | |
| R2 | 0.282 | 0.300 | 0.396 | 0.308 | 0.314 |
| Firm fixed effect | YES | YES | YES | YES | YES |
| Year fixed effect | YES | YES | YES | YES | YES |
| Industry fixed effect | YES | YES | YES | YES | YES |
| Observations | 488 | 488 | 488 | 488 | 488 |
Disclaimer/Publisher’s Note: The statements, opinions and data contained in all publications are solely those of the individual author(s) and contributor(s) and not of MDPI and/or the editor(s). MDPI and/or the editor(s) disclaim responsibility for any injury to people or property resulting from any ideas, methods, instructions or products referred to in the content. |
© 2026 by the authors. Licensee MDPI, Basel, Switzerland. This article is an open access article distributed under the terms and conditions of the Creative Commons Attribution (CC BY) license (http://creativecommons.org/licenses/by/4.0/).
Copyright: This open access article is published under a Creative Commons CC BY 4.0 license, which permit the free download, distribution, and reuse, provided that the author and preprint are cited in any reuse.