

Submitted:
17 August 2026
Posted:
18 August 2026
You are already at the latest version
Abstract
The Earthview BluBird continuous methane emissions-monitoring system participated in METEC single-blind ADED field testing in 2022 and 2024. The test program consisted of natural-gas releases ("experiments"), with each experiment comprised of one to five simultaneous releases. Results are categorized according to detection of at least one release per experiment ("per experiment" detection) and on detection of all releases. Ninety-seven percent of individual experiments were detected based on a report-and-release overlap criterion. Using METEC's standard criteria, 91% of experiments were detected, with a 69% detection rate for all releases. Un-detected releases during multi-release experiments, rather than un-detected experiments, account for the large majority of missed releases. Using the overlap criterion, the 90% probability of detection is 0.6 kg/h for per-experiment detection, and 3.9 kg/h for all releases. Source locations were correctly identified at the equipment group level for 76% of the experiments. Release start times and end times were accurate to within 30 minutes for 92% of the experiments. Actual and estimated methane emission mass summed over daily to monthly intervals correlate significantly, with BluBird underestimating mass by 26% for the full ADED 2024 period for single-release experiments. This underestimate is dominated by emission rate error rather than release detection capability.
Keywords:
methane emissions
; continuous monitoring system
; point sensor network
; oil and gas
; controlled release testing
; METEC ADED
; detection probability
; emission quantification
1. Introduction
Methane emissions from oil and gas operations is estimated to have reached roughly 78 million metric tons in 2025 [1]. Using already-existing technologies, the oil-and-gas sector has the highest near-term potential for significant net reduction in methane release. This can be achieved by rapidly detecting and repairing emission sources [2].
Among the many technologies being applied to this problem, relatively inexpensive continuous emission monitoring systems CEMS) deployed at oil and gas production sites are an attractive option. These systems provide near real time measurements, with the ability to detect and quantify dynamic, short-lived emission events [3,4]. This complements periodic-monitoring technologies such as optical gas imaging and aircraft and satellite overflights by allowing rapid detection and repair of fugitive emissions that might otherwise persist for extended periods of time [5,6,7].
The strengths and limitations of commercially-available, affordable, and practical CEMS are still being defined (e.g., [8,9,10,11]). General conclusions to date are that some relatively low-cost sensing systems are capable of reliably detecting methane emissions in the range of 5 to 10 kg/h at oil and gas sites [12]. The ability of CEMS to quantify methane emissions at levels suitable for some regulatory applications remains uncertain [10,13] and potentially limiting [14,15]. This is particularly so for the types of relatively low-cost sensors that would be practical and affordable for deployment at hundreds or thousands of operating oil and gas production sites [16,17]. It is important though to weigh the performance of CEMS in terms of other candidate emission monitoring methods [9,18] and to take into account emissions that are missed due to intermittent leaks that would otherwise be detected by CEMS (e.g., [7]).
Here, we present results of single-blind field testing of the BluBird CEMS [19]. In particular, we focus on four of the main aspects that define how well CEMS can contribute to reducing fugitive methane emissions from oil and gas operations: (1) emission detection, including time to detection and time to alerts; (2) emission event duration accuracy; (3) emission quantification; and (4) localization of the emission source. Performance is assessed using results from single-blind testing carried out in 2022 and 2024 as part of the “Advancing Development of Emissions Detection” (ADED; https://energy.colostate.edu/metec/aded/) project conducted the Methane Emissions Technology Evaluation Center (METEC; https://energy.colostate.edu/metec/), operated by Colorado State University [8,20,21,22,23].
Among the key findings of this work are (1) the BluBird system demonstrates, across the full range of release rates, a strong ability to detect when at least one leak (i.e., an ADED release) is present on the METEC site at leak rates well below 5 kg/h; (2) failure to detect all releases during multi-release experiments rather than failure to detect that at least one release was underway accounts for the large majority of missed releases; (3) the timing and duration of releases are accurately determined; (4) BluBird’s detection of releases is essentially independent of release rate, with slight dependency on release duration and wind conditions; (5) 90% probability of detection (PoD) estimates vary over roughly an order of magnitude, from 0.6 kg/h to around 9 kg/h, depending on relatively slight differences in performance grading and on whether the objective is detection of site-level releases or on detection of multiple, simultaneous releases, and; (6) estimates of total emitted methane mass correlate significantly with actual emission totals, but with a negative bias. This underestimation is attributable mainly to emission rate bias rather than to undetected releases, which suggests that future work should focus on improving rate calculation rather than detection capability. An important take-away from this work, which also applies to other publications regarding CEMS capabilities, is that performance assessments depend greatly on whether the CEMS is evaluated in terms of ability to detect that at least one leak is present versus how well the system can detect multiple, simultaneous releases. In other words, whether the evaluation treats missing one leak out of several the same as failing to detect that a leak is present at all.
This paper is organized as follows: Section 2.1 introduces the main elements of the BluBird system that are relevant for the presented analyses, including the detection and reporting methodology used for participation in the ADED 2022 and 2024 programs. Section 2.2 reviews the METEC testing configuration and assessment protocols. Section 2.3 and Section 2.4 describe the original ADED programs and test-result data sets, emissions release strategies, and performance grading criteria. Analytical methods are summarized in Section 2.5, including introduction of alternative performance classification metrics intended to comprehensively represent release-detection performance.
Test results are presented in Section 3, focusing mainly on ADED 2024 but referencing the ADED 2022 results where relevant. We begin with the fundamental question of how well the BluBird CEMS detected and reported start and end times of individual ADED natural gas releases (Section 3.1). Section 3.1 also makes the case for including additional alternative classification rules to assign detection reports as true-positive detections versus missed releases (false negatives) or false positive detections.
Rates of detection as functions of gas release rate and release duration are given in Section 3.2. Section 3.3 describes statistically-derived probability of detection (PoD). Minimum detection level, detection of multiple releases and time to detection are considered in sections 3.4, 3.5, and 3.6. Emission rate quantification and total methane mass emitted over time are investigated in Section 3.7. Section 3.8 addresses the determination of emission source locations. Factors influencing release detection and quantification, including the potential effects of residual, lingering gas on the METEC site, are considered in Section 3.9.
2. Materials and Methods
2.1. BluBird System Overview
The Earthview BluBird gas monitoring system [19] is comprised of three main subsystems; (1) a sensor network consisting of from one to multiple solar-powered autonomous Internet of Things-enabled (IoT) field sensor nodes (Figure 1) deployed at a site; (2) a suite of cloud-based data acquisition and analysis software that converts sensor readings to methane concentrations and then to emission rates using the node-reported local wind information; and (3) a data access and display dashboard for site management, graphical analysis, time series presentation, and emission summaries.
The number of nodes used on a site is dictated by site complexity, wind patterns, and expected potential for multiple simultaneous emissions from different locations. The choices regarding how many nodes are deployed and where they are placed on a site are driven by the fact that point-sensor CEMS are unable to measure 100% of emissions all of the time [22]. The node configuration therefore depends on clients’ priorities and budget, site characteristics, and on the dictates of regulations.
The BluBird system operates at a relatively low cost compared to competing systems, primarily by taking advantage of the capabilities of inexpensive metal oxide sensors (MOS), along with modularized, easy-to-deploy field hardware. Obtaining reliable and accurate methane measurements from MOS requires addressing known limitations of the sensors; primarily the effects of atmospheric humidity on sensor readings and variations between individual sensors and changes in sensor behavior over time. To account for this, the BluBird system uses sensor modeling applied to a set of simultaneous measurements from an array of MOS. This modeling yields a statistical “digital twin” [24] for each individual MOS. Each twin evolves over time, and is combined with a version of automatic background calibration. The measured methane concentrations are then converted to emission rates, primarily using inverse Gaussian plume modeling ([11,26,27,28]. The Gaussian plume approach includes a range of simplifying assumptions but is efficient and performs comparably to more computationally intensive modeling [e.g., [29]]. Details of Earthview’s methodology can be found in [19].
The BluBird 1.5 version was deployed for ADED 2022, while for ADED 2024, the BluBird 2.0 system was used. BluBird 2.0 includes hardware and software improvements compared to BluBird 1.5. For example, whereas the leak detection procedure used with the BluBird 1.5 system during ADED 2022 involved some manual interpretation, Earthview’s emission detection procedure for BluBird 2.0 was and remains fully automated. The time series of emission rates calculated from sensor node readings, which are reported at approximately 30 second intervals, are analyzed using a moving time window to identify likely emission events. Specifically, the emissions data are analyzed for 10-minute segments within a moving 60-minute window. If an emission rate within the 10-minute window exceeds a pre-defined threshold, then that 10-minute period is flagged. Concentration along with wind speed and direction (measured at each node) during each 10-minute time segment are used to help identify the most likely emission source location. Once 60 minutes has elapsed, the count of the number of 10-minute segments that exceeded the emission threshold is compared to a second threshold. If enough 10-minute segments are flagged, then the system concludes that an emissions event has occurred. The start time for the event is set as the time at the start of the 10-minute increments. We note these details here since, as discussed below, this use of time segments and assignment of event start times affects the grading of BluBird’s leak detection performance as part of the ADED tests.
As implemented for the ADED 2024 testing, if the automated source location step used by BluBird 2.0 identified more than one potential source during an emissions event, each of these additional sources was considered a potential detection. After the initial detection report had been emailed to METEC, these additional detections were reviewed manually. If any were considered likely to be true detections, the initial detection report was modified to include them and then updated via a follow-on email to METEC (such revisions were allowed by the ADED protocol for up to one week after the initial reporting).
2.2. Methane Emissions Technology Evaluation Center (METEC) Facility
The Colorado State University operates the METEC testing facility in Fort Collins, Colorado (https://metec.colostate.edu/aded/) (Figure 2). The primary goal of the ADED program is “to reliably test, quantify, and standardize the accuracy of next-generation emission detection solutions in highly realistic, controlled field environments.” During the 2022 and 2024 ADED programs, natural gas was released at the METEC facility from any of five equipment groups, and from different equipment locations within the groups. Earthview deployed six BluBird 1.5 nodes for ADED 2022 and 12 BluBird 2.0 nodes for ADED 2024 at the positions indicated in Figure 2.
2.3. ADED 2022 and 2024 Testing Programs
Details of the ADED protocol used for 2022 and 2024 and overviews of participants’ results are available at https://metec.colostate.edu/aded-testing-results/ and are summarized by [21]. The ADED 2022 testing phase extended from Feb. 1st. – May 11th. 2022, with a total of 325 release periods, (referred to as “experiments” by METEC), comprising 557 individual releases. The testing phase for ADED 2024 spanned Feb. 6th – April 29th 2024, with a total of 347 experiments made up of 775 separate releases (Figure 3). Each experiment consisted of from one to four simultaneous releases in 2022 and one to five releases in 2024, from any of the five “equipment group” locations on the test pad. Compared to ADED 2022, ADED 2024 included considerably more multiple release experiments, fewer single-release experiments, and the addition of experiments that included five simultaneous releases. For ADED 2024, 73% of releases were at rates below 1.0 kg/h, with 40% of releases and 34% of releases less than 0.5 kg/h in 2024 and 2022, respectively. The most frequent rate range in 2022 was 0.5-1.0 kg/h (34% of releases), while in 2024 the most populated range was for rates < 0.5 kg/h, containing 33% of releases.
Test participants were required to report release detections, including start and end times, as well as additional required or optional information such as estimated release rate and source location, via email to METEC’s server. The participant-supplied detection information was parsed by METEC using criteria outlined in the protocols to classify each release as either successfully detected (“true positive”; TP), missed (“false negative”; FN), or as a detection report not associated with an actual release (“false positive”; FP).
2.4. Implications of Performance Assessment Methods
In the discussion below, two main aspects of the ADED testing are particularly important for assessing and interpreting BluBird’s performance and are also relevant to performance assessments of other CEMS. The most significant issue pertains to how METEC investigators have, to-date, chosen to analyze ADED results in reports and publications. Recall that an ADED “experiment” could consist of anywhere from one to five simultaneous releases (one to four releases in 2022). METEC’s standard grading and assessment methods [e.g., [8,20,21,22] and https://metec.colostate.edu/aded-testing-results/] do not differentiate between whether a monitoring technology entirely misses an experiment (i.e., no leak was detected at the site during an experiment) versus whether the technology detected the experiment but missed one or more releases among several. One FN would be assigned in either case. If the technology reported more releases than were actually present, this results in an FP.
To understand the potential significance of this, consider that missing four releases out of a five-release experiment is treated as equivalent to missing four out of five individual experiments. In both cases, the standard analyses treat the FNs and FPs as equivalent to missing entire experiments or as incorrectly reporting that an experiment is underway. Since the ability of participants to detect site-level leaks is not investigated, readers are unable to judge, based on TP and FN totals alone, what the underlying strengths and weaknesses of a particular technology might be. For example, continuous monitoring solutions may be more suited to detecting individual, intermittent leak events while less able to differentiate multiple simultaneous leaks. In contrast, imaging systems may be more effective at the latter, but more limited for near-continuous detection of any leak event. Here, we address this by analyzing results on a “per experiment” detection basis in addition to METEC’s “all-release” basis (see Section 2.5.3). In addition, to investigate how multiple simultaneous releases might affect detection and quantification, we adopt the approach used by [28,30], in which experiments that consist of only one release are examined as a separate set.
A secondary but still significant issue in terms of BluBird assessment pertains to METEC’s ADED report-classification rules. To be assigned as a true-positive detection, METEC required that the participant’s reported start time for a detection be no more than 20.0 minutes earlier than METEC’s recorded start time. As will be seen, this interacted with the BluBird 2.0’s automated 10-minute time marching approach used for leak detection, which introduced a slight start-time offset in the detection reports that resulted in rejection of otherwise legitimate-appearing detection reports.
2.5. Analytical Methods
The methodology employed here addresses emission detection in terms of detection capability, time to detection and time to alerts; ability to accurately reproduce emission event timing and duration; emission quantification; and localization of the emission source. Probability of detection (PoD) at the 90% level as a function of emission release rate is estimated using maximum-likelihood logistic regression on the binary pairings of true positive/false negative outcomes for bins of rate for univariate estimation, and for rate, duration, and wind speed for trivariate estimation. We also calculated PoD using an exponential fit for direct comparison with PoD curves given by [22].
In addition to the detection-classification results and direct comparisons of actual and reported release emission rates, we calculate total gas emissions per experiment, which we define as the sum of emission rate for each release multiplied by the release duration. The totals are summed over different time intervals ranging from daily to the full ADED test periods.
To help diagnose possible reasons for classification error, we use time series of BluBird-derived methane concentrations as presented on Earthview’s data dashboard (dashboard.earthview.io).
Five BluBird detection reports in the ADED 2024 master results file had been entered with release end times that were earlier than start times and off by exactly 24 hours. Since these reports appear to otherwise be valid detections, the dates were corrected in the results data file used here.
Anthropic Claude was used for statistical analyses and graphics generation.
2.5.1. Meteorological Data
To investigate possible relationships between atmospheric conditions and emission detection and quantification, we use the wind information provided within the METEC ADED data reports along with wind speed and direction reported by each BluBird node. Surface boundary layer conditions are assessed using NOAA High Resolution Rapid Refresh (HRRR) model fields [30] obtained from the NOAA Open Data archive on Amazon Web Services S3 (https://noaa-hrrr-bdp-pds.s3.amazonaws.com/), using the Herbie Python package.
2.5.2. Detection Overlap Accuracy and Alternative Data Groupings
A simple but effective way to see how well ADED releases were detected is to plot time-lines of releases and BluBird reports. This approach (Figure 4) allows us to assess important aspects of CEMS capabilities, such as overall detection, the accuracy of start and end times (i.e., release duration), the ability to detect short releases, and ability to distinguish between individual releases separated by short time gaps. It also illustrates clearly how the above-mentioned use of multiple releases and METEC’s start-time grading criterion affects classification results.
In Figure 4, ADED releases (top half of the graph) and BluBird detection reports (bottom half of the graph) are displayed for a randomly-selected, representative 144-hour period from 23 March through 28 March 2024. The colors show the results of METEC’s standard grading for true positives (TP; blue and green), false negatives (FN; red), and false positives (FP; orange). Each stack of bars in the graph’s top half represents one ADED experiment. Multiple bars in a stack indicate multiple releases during a single experiment. Interpretation of these overlay comparison plots is presented in Section 3.1. Figure 5 is an example of the underlying data used by BluBird to detect release periods. It shows a typical example of BluBird-reported methane concentrations and corresponding detection reports for four experiments spanning a 24-hour period. During the METEC releases in this time period, concentrations ranged from around five to 30 ppm, and settling at around 1.9 ppm between releases. For this set, the ADED grading resulted in four TPs and two FPs, with the latter due to BluBird’s overestimate of the number of simultaneous releases during the first two experiments.
2.5.3. Alternative Grading Using Site Detection, Relaxed Start-Time Threshold, and Detection Overlap
To assess the ability to detect at least one release among multiple releases, we divide METEC’s supplied version 3 report into three sets; the full original data set consisting of all releases for all experiments and which follows the standard METEC approach to date (“all releases”, i.e., single-release and multiple-release experiments), a “per experiment” data set that represents site-level leak detection (i.e., detection of at least one release during an experiment), and a data set consisting of experiments with only one release per experiment (“single releases”). By dividing up the analysis in this manner, we can duplicate the METEC results using the “all release” subset, consistent with [20,21,22], investigate BluBird’s performance for site-level leak detection and quantification using the “per experiment” data set, and separate out the effects of multiple releases using the “single release” data set. For the per-experiment set, an experiment is assigned a TP result if BluBird detected at least one release during the experiment. Experiments that have no corresponding BluBird detection report are assigned as FNs. A detection report that does not correspond to an experiment period is assigned an FP.
As discussed in Section 3.1 below, there are many cases where the BluBird detection reports appear to correspond quite closely with METEC release times but which are nevertheless classified as FNs and/or FPs. Many of these are due to reported times being slightly earlier than the METEC start times. The method used by Earthview to automatically assign leak-detection start times (Section 2.1) has the potential to yield a start time as much as 10 minutes earlier than the METEC-recorded start times solely due to book-keeping. In addition to this timing offset issue, the possibility exists that some early start times (as well as cases where BluBird did not identify gaps between experiments) may have been due to residual methane gas on the site; a topic we consider further in Section 3.9.
Based on the graphical and time-offset evidence that these close matches to the METEC releases are in fact legitimate detections, we devised two additional classification criteria to complement METEC’s standard <= 20.0-minute start time threshold (“METEC standard”); (1) an early-start-time threshold of <= 30.0 minutes (“30-minute”), and (2) a criterion that considers how well a BluBird detection report overlaps with a corresponding METEC release period. For the latter, the release and report need to overlap by at least 75% to be treated as a TP detection (“75% overlap”). Specifically, the overlap criterion is the percent of the METEC release period in seconds that is spanned by the BluBird detection period, or,
where
and the symbols are defined as:
- = duration of temporal overlap between the METEC release and the BluBird detection report, in seconds;
- = duration of the METEC release, in seconds;
- = start and end times of the METEC release;
- = start and end times of the BluBird detection report.
To qualify as a TP detection, percent overlap must be >= 75, meaning that the Earthview emission report window must cover at least three quarters of the METEC release window.
Table 1 summarizes the classification criteria used for analysis. Each subset provides different insights into the BluBird CEMS performance. For reasons noted later, the ADED 2022 results are not sensitive to the alternative classification criteria so only the original METEC standard classification is discussed. Using these classification criteria, separate subsets were made for the “all release”, “per experiment” and “single release” data groupings.
3. Results
3.1. Release vs. Detection Report Overlap
As introduced in Section 2.5.2, plots of ADED release times stacked on top of BluBird detection reports convey details regarding correspondence of start- and end-times, ability to detect small-duration releases and short gaps between releases, and comparison of release rates versus reported rates. All of the time periods discussed below have been randomly selected and are representative of the full ADED 2024 test period.
3.1.1. Overlap Patterns, Gap Delineation, Multiple Releases
The time period in Figure 6 includes 13 individual experiments (each separate set of bars) consisting of a total of 23 releases. The organization and color coding are the same as used earlier in Figure 4.
Several key points are immediately apparent in this figure and apply to all of the subsequent interpretations of BluBird performance. Based on the visible correspondence of detections with releases, BluBird was able to reliably map individual releases of different durations and to identify gaps between releases, including short gaps. Beyond the general detection patterns, the implications of multiple releases per experiment (the individual stacks of bars) are clear. For example, BluBird detected presence of gas during all 13 experiments in the time period (or 100% detection, in terms of detecting at least one release during experiments), but was assigned a total of 10 FNs for this period. Each of these is a result of not reporting one or more simultaneous releases during individual experiments. In contrast, all of the FPs are due to over-reporting the number of releases during multiple-release experiments. None of the FPs are due to detecting gas when none was present. The main takeaway is that BluBird detected all of the cases during this period when at least one leak was present and would therefore have correctly alerted a client to consider an LDAR inspection, and no FPs were generated that would have triggered an unwarranted site inspection.
The experiments mapped in Figure 7 and Figure 8 below highlight the challenges posed by the ADED protocol, which included short-duration releases with short time gaps between releases. In this case, which is typical of the full data set, all of the experiments were detected by the BluBird CEMS. Several relatively short releases were identified, as were some short time gaps between releases. However, the number of releases per experiment tended to be over-estimated. For the first experiment in this time series, BluBird was assigned two FPs (the orange bars) and an FN (the red bar) due to reports with early start times. Three additional FPs were assigned for the second experiment due to over-reporting detections, along with an FN for failing to assign the short release as a separate event. BluBird detected the short experiment at around 17:00 hours on 24 April (experiment number four in this series), but the three reported detections were again assigned as FPs (along with one FN) due to a reported start time that was 24.2 minutes earlier than METEC’s listed start time. For this set of experiments, application of the 30-minute start time threshold re-classifies experiment number four as one TP, two FPs and zero FNs instead of three FPs and one FN. The start time differential for the other two experiments is greater than 30 minutes, but they qualify as detections using the 75% overlap classification criterion. In Figure 7, the BluBird reports for the first and last experiments were again rejected due to having start times slightly earlier than METEC’s 20-minute threshold. The fifth experiment, for example, has a reported start time of 30.1 minutes earlier than the METEC release start time.
For all detection reports where BluBird assumed a continuous release when a gap was in fact present, such as between experiments two and three and between experiments 11 and 12 at around 18:00 UTC in Figure 7, BluBird-reported methane concentrations were above background for at least one node. The FPs assigned during 12:00-14:00 on 12 Feb. in Figure 8 are two out of six cases during ADED 2024 where BluBird reports had no overlap with a METEC release (e.g., “true” FPs). In five of these cases, at least one sensor node was reporting concentrations above background. The implications of this are analyzed further in Section 3.9.
3.1.2. Accuracy of Detection Report Overlap Periods
To help quantify the visual evidence from the overlay plots that BluBird reports represent legitimate detections, we calculated a Jaccard Index (or Jaccard Similarity Coefficient; [32]), which describes how well two sets intersect. A Jaccard Index value of 0.0 indicates complete mismatch and 1.0 indicates a perfect match. In our case, the sets are the ADED 2024 release times and the corresponding BluBird detection report times; a high degree of intersection suggests that the two series are substantially similar and therefore could reasonably be treated as true detections. The overall Index is 0.92 with an interquartile range (IQR) of 0.77 and 0.98 encompassing the middle 50% of the cases. This is consistent with the overlap plots in suggesting that the BluBird reports correspond well to the METEC reports. Lower similarity values are almost entirely due to early start times rather than mismatched ending times. With just a few exceptions, these early-start cases otherwise overlap well with a corresponding METEC release.
3.2. Detection Performance
As noted earlier in Section 2.5.3, to be able to assess BluBird performance in terms of site-level leak detection independent of multiple simultaneous releases, we divided the ADED 2022 and 2024 data sets into three sets: (1) the full set of results consisting of all releases for all single-release and multiple-release experiments (the “all-release” data set, which is the same data set reported on in [21,22]; (2) a “per-experiment” data set, where an experiment is defined as a period with at least one METEC release; and (3) a subset consisting only of experiments with just one release (“single-release” experiments).
METEC’s assigned TP, FN, and FPs for ADED 2022 and ADED 2024, along with results for the data subsets and alternative classification criteria, are given in Table 2, Table 3 and Table 4. “Rescues” represent detection reports that were classified as FPs using METEC’s standard grading but which transitioned to TPs when the alternative classification criteria (30-minute start time threshold or 75% overlap) were applied.
Overall detection rates for experiments improved from 57% for ADED 2022 to 91% for ADED 2024 using METEC standard grading, and to 94% and 97% using the 30-minute start threshold and 75% overlap criteria, respectively. A key aspect is that, for ADED 2024, detection success (TP% in Table 2, Table 3 and Table 4) is considerably different depending on whether the measure is detection of individual experiments (i.e., at least one release per experiment) versus detection of all releases within experiments (90.5% versus 69.2%). The BluBird FNs and FPs in the 2024 results are primarily due to under- or over-reporting of releases during multiple-release experiments or to slight report-timing offsets rather than to missed or over-reported experiments. Misclassifications during multi-release experiments account for 94% of FNs in the ADED 2024 results, and slightly fewer (82%) for ADED 2022. This is consistent with the patterns seen in the overlay plots in Section 3.1.
When the classification start-time threshold is relaxed slightly (i.e., a 30-minute start threshold is applied versus METEC’s standard 20-minute threshold) or report overlap is considered (the 75% overlap criterion), the number of FNs decreases, with TP% rising to 97.4%. The number of FNs and FPs that do not overlap at all with METEC-reported releases is small; three out of the 775 ADED 2024 releases were totally missed (0.5%), in that BluBird reported no corresponding detections within one hour of the release, and just three detection reports were issued for times when no release was underway (defined as within +/- 60 minutes of a release).

Table 5.
Detection classification results for ADED 2022 per-experiment and all-releases sets. For the 2022 data, use of the different classification criteria listed had no effect.
Table 5.
Detection classification results for ADED 2022 per-experiment and all-releases sets. For the 2022 data, use of the different classification criteria listed had no effect.
| Subset | Classification Criterion | # of cases | # of TPs | # of FNs | TP% |
| Per-experiment | METEC standard (20-minute start threshold) | 325 | 184 | 141 | 56.6 |
| All-releases | METEC standard (20-minute start threshold) | 557 | 194 | 363 | 34.8 |
Detection percentages for ADED 2024 as a function of methane release-rate bins are summarized in Figure 9, Figure 10, Figure 11, Figure 12 and Figure 13. Comparing the all-release versus the per-experiment results again highlights the significance of considering the ADED performance in terms of per-experiment (site-level) leak detection (Figure 9 and Figure 10). For the per-experiment classification using the 75% overlap criterion, detection rates are greater than 95% for all release rate bins, and greater than 90% using the 30-minute start time criterion (not shown). With the 75% overlap criterion applied, the detection rate is 100% for all experiments with release rates greater than 2 kg/h (Figure 10). Results are similar for single-release experiments, with a slightly lower (93%) detection rate for releases < 1 kg/h.
Improvement in detection rates between ADED 2022 and ADED 2024 is apparent across all release rate bins, with detection improving by roughly a factor of 2. Results are similar between the per-experiment set (Figure 11) and the all-release set (not shown).
Release rate and release duration (Figure 12) can both be expected to affect detection rates for fixed-position point sensors such as the BluBird CEMS. This was the case for the ADED 2022 BluBird 1.5 results; detection rates correlate significantly with higher release rates as well as with longer release duration. For ADED 2024 though, no statistically significant relationship with release rate is found; since detection rates are above 90% across the release-rate range, there is little variability to be accounted for. However, release duration was a significant factor in detection rate for both ADED programs.
Figure 13 compares detection versus release rate and duration for the ADED 2024 all-releases and per-experiment sets. The fact that many more FNs appear in the all-releases plot than in the per-experiment plot shows that, as discussed earlier, most of the FNs are missed releases in multiple-release experiments rather than failure to detect entire experiments. Application of the 30-minute start time threshold (not shown) re-classifies relatively few FNs as TPs. However, three of these TPs represent releases at rates greater than 6 kg/h; which lie at the far right of the release rate distribution. As shown in the next section, this small change in classification has notable effects on PoD curve fitting.
3.3. Probability of Detection
Statistically-derived probabilities of detection as functions of gas release rate, release duration and wind speed were calculated using logistic regression with trivariate analysis, which takes into account that detection rate may depend simultaneously on all three parameters. The ADED 2024 and ADED 2022 per-experiment results are presented in Table 6 and Figure 14, calculated for release rate at median release duration and median wind speed (i.e., trivariate-at-median results). For the per-experiment subset, the release used is the sum of rates for all releases during an experiment.
A key result is the very large difference between 90% PoD estimated using the all-release data set (the full data set where releases are treated independently) and the per-experiment data sets that treat experiments as individual site-level events. Recall that the all-release data set does not differentiate whether TPs and FNs are associated with site-level leak detection or detection of individual releases within simultaneous-release experiments. For this data set, a TP or FN is assigned for every release. In contrast, for the per-experiment data set, a TP or FN is assigned to each experiment; therefore, if at least one release during an experiment is detected, that experiment is assigned a TP. The all-release data set combined with the standard METEC start-time threshold is equivalent to the data sets analyzed by METEC investigators in [20,21,22].
For the per-experiment set, the calculated 90% PoD release rate for detecting whether a leak is present on a site improves to 0.64 kg/h in the ADED 2024 results, compared to 16.44 kg/h using the all-release set, a projected value that lies beyond the range of release rates used during the ADED program and therefore is not physically relevant. This all-release estimate improves to 9.04 kg/h and to 3.94 kg/h using the 30-minute start time and 75% overlap criteria, respectively. These alternative classification criteria allow an additional 13 TPs for detections that appear legitimate based on their correspondence with METEC releases, with three of those occurring at release rates > 6 kg/h. The position of these TPs at the high end of the release rate distribution has a large effect on the fitted PoD curve. The effect is largest for the all-releases subset but only slight for the per-experiment subset. Overall though, the critical choice is whether to define PoD in terms of detecting all releases during multiple-release experiments as in [20,21,22] or in terms of the ability to detect any release during an experiment (i.e., a site-level detection).
The PoD estimation further illustrates relationships between detection rates and other parameters. Individual dependencies of detection on release rate, duration and wind speed are seen to be small for the ranges encompassed by the ADED 2024 test period. When taken together, these factors explain less than 5% of the variance in detection rate for the per-experiment data set. This is counterintuitive particularly in terms of release rates, but is consistent with the observation in Section 3.2 that the release detection capability of the BluBird 2.0 was essentially independent of release rates, under the set of test conditions present for ADED 2024.
Another way of approaching the combined effects is to consider how detection might depend on total methane mass emission per experiment. This combines the influence of rate and duration, and can help define detection rate in terms of a potentially useful additional parameter. For the ADED 2024 per-experiment data, the univariate relationship is significant but relatively weak (Figure 15). The 90% PoD is reached at an emission mass of around 3 kg of methane. When analyzed as a bivariate set of emission mass and wind speed, the estimated 90% PoD varies from 1.1 kg at wind speeds near 1.2 m/s (10th. percentile) to 8.2 kg at 5.2 m/s (90th. percentile). Overall, the total methane mass emitted per release is the strongest single predictor of detection. Release duration is the next strongest predictor, with release rate being considerably less significant. The relationships are weak, however, which reflects that fact that for the BluBird CEMS there is little variation in detection rate throughout the range of conditions covered by ADED 2024.
To further assess the sensitivity of the PoD estimate to the curve fitting methods and detection classifications, we consider two additional approaches. First, for their 2025 report [21], METEC applied a Weibull-form exponential curve fit (PoD = 1 − exp(-a . xb) to detection as a function of release rate. Applying this method to the BluBird results for the ADED 2024 30-minute classification of the all-releases data set yields a 90% PoD of 9.21 kg/h; essentially the same as the 9.03 kg/h value estimated using the trivariate logistic regression approach. Second, we can apply a different detection classification method. For this, we classify each BluBird detection report as a TP or FN based on whether it has a Jaccard Similarity Coefficient index >= 50% (see Section 3.1.2). When applied to the per-experiment data set the 90% PoD is 0.27 kg/h, and 4.3 kg/h for the all-release data set. The 90% PoD value of 0.27 kg/h is within 8% of the 90% PoD value listed earlier when the 75% overlap classification criterion is used. Therefore, as we have seen earlier, the choice of which basic assessment approach is being used (i.e., whether to grade based on detecting all releases or detecting individual experiments) outweigh the specific choices about curve fitting or detection classification.
3.4. Minimum Detection Level (MDL)
Here, we define the minimum detection level (MDL) for emission rate as the lowest reliably detected rate, encompassing the set of potential error contributors in the BluBird system. Based on the per-experiment trivariate PoD curves applied to release rate, release duration, and wind speed for the ADED 2024 data, and assuming that the most favorable grading criterion is used (the 75% overlap criterion), a reasonable MDL is approximately 250 g/h, with a 95% confidence interval of 50 to 380 g/h, for typical ADED testing-day conditions. More generally, across a range of wind speeds (1.5–3.5 m/s) and experiment durations (>= 1 hour), the MDL is roughly 150–500 g/h for the ADED 2024 test scenario.
3.5. Detection of Multiple Releases
The BluBird 2.0 real-time signal processing software was not optimized to detect and quantify multiple simultaneous leaks (the currently-used 2.5 version has been upgraded in this regard). However, as noted in Section 2.1, it was capable of generating more than one detection per experiment. These were then checked manually in a similar manner to Earthview’s practice for assessing complex emission events reported for clients’ sites. With this approach, the BluBird system was correct 73% of the time in determining whether an experiment consisted of multiple releases. In other words, if the BluBird CEMS reported multiple detections, the experiment was indeed likely to be a multi-release event. For multi-release experiments, BluBird correctly identified the exact number of releases in 53% of the cases consisting of two releases. The success rate declined with an increasing number of releases (35%, 20% and 7% for 3, 4 and 5 releases, respectively).
3.6. Time to Detection
Time to detection (TTD) refers to how rapidly the BluBird CEMS was able to detect a release and then issue an alert. For ADED 2024, the “alerts” consisted of automatically-generated emails to METEC. In practice, these are automated emissions alerts sent to clients. Based on the ADED 2024 TP experiments, using the standard METEC 20-minute start time criterion, the mean start-time error is +9.3 minutes (BluBird earlier than METEC), with a median difference of -9 seconds. Seventy-eight percent of the BluBird-reported release start times were within +/- 10 minutes of the actual times, with 92% within +/- 30 minutes. Reported release end times in 2024 were similarly accurate; 73% were within +/- 10 minutes of the actual end times, with 83% within +/- 30 minutes. The manually-determined start times for ADED 2022 were substantially less accurate; 46% were within +/- 10 minutes, with 66% within +/- 30 minutes.
3.7. Emissions Quantification
Quantification performance is assessed for the ADED 2024 program in terms emission rates and total emissions averaged over different time intervals. The per-experiment and single-release subsets as classified using the 20-minute and 30-minute start time criteria are discussed here (results for 75% overlap detection classification criterion differ only slightly).
3.7.1. Emission Rate
Emission rates (Figure 16) show considerable scatter, as is typical of dispersion-model based CEMS [e.g., [31]]. Median relative quantification error as calculated for the per-experiment subset is -59% (n=314; Figure 16). For single-release experiments, median relative error is -44% (n=88). Error varies with release rate (Table 7), with 54% of estimated rates within 3x of actual for the per-experiment subset and 67% for single-release experiments (Table 8). Results are similar for the other classification criteria subsets (the 30-minute start time and 75% overlap criteria). For the per-experiment comparison using METEC standard grading, BluBird’s median relative error is -29%, with 56% of the rates within a factor of three.
3.7.2. Total Emissions over Time
Estimated and actual methane emissions summed over daily, weekly and monthly periods during the ADED 2024 program are presented in Figure 17 and Figure 18. The “TP matched” plots compare total emissions for releases that were detected by BluBird, and address the question of, “When BluBird detected releases, how well did it quantify the amount of methane released?” The “system level” plots pertain to how well BluBird matched the total methane released, including from releases that BluBird did not detect. As expected, differences are larger when some releases during multiple release experiments were not detected, or when releases were over-reported (the “system level” panels in Figure 17). The similarity of the “TP matched” and “system level” totals for single-release experiments only (Figure 18) further highlights the impact of multiple releases on the comparisons. Overall, BluBird generally underestimated the total mass emitted.
The correlation increases when the TP-matched releases are summed over longer time intervals (Figure 19). For daily intervals, correlations are statistically significant for both the per-experiment (R² = 0.34, p < 0.001, n = 81) and single-release subsets (R² = 0.17, p = 0.002, n = 52). When summed over weekly intervals, per-experiment R² rises to 0.46 (p = 0.02, n = 12) and single-release R² to 0.36 (p = 0.04, n = 12).
Over the entire ADED 2024 program, METEC released a total methane mass of 2272 kg (a summation of all releases during the program). Using the METEC standard grading of the all-release data set, the total mass reported by BluBird was 1326 kg, or 58% of the total. About half of the difference is due to missed releases during the multiple-release experiments with the other half attributable to underestimation of emission rates. If the comparison is limited to just single-release experiments to avoid complications from the multiple-release detection issues, BluBird detected 64% of the total mass emitted (441 kg), or 74% using the 30-minute classification criterion. With the single-release data set, we can address the question of how much of the underestimate of emitted methane is due to underestimating release rates versus failing to detect some releases. Of the methane mass that was not reported by BluBird for single-release experiments, only 3.8 kg (3%) is due to missed releases. The remainder (110.6 or 97%) is attributable to underestimating the actual emission rates for the 99 detected releases.
3.8. Identification of Emission Source Location
During ADED 2022 and 2024, natural gas was released from any of five equipment groups on the METEC site (Figure 2 in Section 2.1). For the ADED 2024 30-minute start-gap subset, the BluBird CEMS correctly identified the emitting equipment group for 76% of the all-releases data set and for 85% of the per-experiment data set. Identification accuracy showed no apparent dependence on position on the site, or on wind conditions. BluBird was not able to reliably identify the specific piece of equipment (“equipment units”) within equipment groups; equipment units were correctly identified 31% of the time. This was expected since the spatial resolution of the grid system that BluBird used to identify potential leak locations was sufficient to resolve the separate equipment groups but not the individual equipment units within groups.
3.9. Influencing Factors
We have seen in previous sections that, within the ranges of emissions and environmental conditions tested as part of ADED 2024, the BluBird system’s release detection rate did not depend significantly on any single parameter among release rate, wind speed, and release duration. Taken together, they explain less than 5% of the variance in detection rate for the per-experiment data set. Notably, the performance of the BluBird 2.0 in terms of detection rates is shown to be essentially independent of release rates, under the conditions explored by ADED 2024. Although not statistically strong, individual relationships between release rate, duration, and wind speed were still apparent and consistent with the physical mechanisms at work (Figure 20). Detection rate was slightly reduced for releases at higher wind speeds (median speed of 5.2 m/s). Wind patterns for the missed releases suggest that the narrower gas plumes associated with higher winds may have been aligned between sensor nodes and/or potentially elevated above the sensor intakes.
Wind speed did, however, correlate significantly with release rate accuracy, with accuracy increasing with increasing wind speed. Using the all-release data set, BluBird underestimated release rate across the wind speed range, but the error was greatest for releases at wind speeds below 2 m/s. The pattern was similar for the single-release data set (although no longer statistically significant) except that accuracy increased substantially at the lowest, essentially calm, wind speeds. BluBird 2.0 applies an alternative dispersion model in place of the Gaussian plume model for these conditions, but there are not enough of these cases to draw conclusions regarding the contribution of the low-wind model.
As noted earlier, one factor that may have affected detection rate indirectly through the METEC standard TP, FN, FP classification process is the potential for methane to have lingered on the METEC site in between separate experiments. Although wind speed alone did not correlate significantly with detection rate, the combination of low wind speeds with short time gaps between experiments may have been a factor. For situations where the inter-experiment gap was less than 60 minutes and the mean wind speed was less than two m/s (a total of nine cases), BluBird assigned start-times that were 100 minutes earlier than the METEC release start-time on average. Sixty-seven percent of those cases were more than 60 minutes early. Outside of those cases with short-gap plus low-wind conditions (106 cases), the median BluBird-reported start time was only 12 minutes early; consistent with the 10-minute time stepping used by BluBird’s automated detection software (Section 2.1).
This suggests that at least some of the BluBird detections that were rejected under METEC’s standard 20-minute start time threshold, as well as some false positive reports, may have been influenced by residual methane; either by (a) BluBird seeing above-background methane concentrations just before a new METEC release and then treating that as part of the subsequent release, (b) not seeing a clear-cut return to background conditions during short gaps between experiments, or (c) treating the elevated concentrations as releases on their own, resulting in FPs. There are several examples of these situations apparent in the BluBird-reported methane concentrations. For example, Figure 21 shows the METEC releases and BluBird reports for 24 hours starting on 12 Feb. 00:00 UTC, superimposed on the time series of BluBird-estimated methane concentrations (this event was introduced earlier in Section 3.1). The first BluBird report’s start time of 00:10 was 20 minutes and 37 seconds earlier than the corresponding two METEC releases, resulting in one FP and two FNs. At 00:10, two of the BluBird nodes reported concentrations of 2.4 ppm, compared to usual background values around 1.9 ppm (for example, the inter-release period from 04:00 to 06:00). At 06:30, three nodes reported concentrations ranging from 2.3 to 3.2 ppm but the duration was too short to trigger a release detection. From 12:00 until 14:00, concentrations are well above background, resulting in BluBird issuing a detection report for a time when no METEC release was active. Finally, at around 10:20 pm, concentrations were well above background, with multiple nodes reporting between 5 and 6 ppm methane. Again, there is no corresponding METEC release around this time. Winds were near-calm on Feb. 12, with a neutral to stable boundary layer; conducive to gas trapping and a lack of clearing of residual gas. The data suggest that a time gap of >= 2 hours between experiments, or wind speeds greater than approximately 2 m/s, is enough to clear the site of residual methane. Neither time gap or wind speed individually accounts for the relationships seen.
4. Discussion
Graphical analysis of the overlap between release times and corresponding BluBird reports shows clearly that most of the false negatives (FNs) and false positives (FPs) assigned to the BluBird results for ADED 2022 and ADED 2024 are associated with multiple-release experiments; 94% of the total number of mis-classifications are associated with these experiments for ADED 2024, and are due mainly to over- or under-reporting the number of releases in the experiment or to the previously-noted start-time offsets. We therefore divided the METEC-supplied ADED results into an “all releases” data set (where no distinction is made between missing a single release or missing an entire experiment), a “per experiment” data set (where the test is made on the experiment level where reporting at least one release during an experiment qualifies as an experiment detection), and a “single release” data set, which consists of the experiments with only one release.
The graphical overlay analysis also shows that a substantial number of BluBird release detections that were scored as FNs or FPs under the standard ADED protocol actually correspond well with ADED releases in terms of start and end times and percent overlap; enough to reasonably conclude that BluBird detected the specific releases (Section 2.5.2). The number of these rejected reports is enough to significantly affect the release detection ratio and detection pairings, especially for experiments with multiple releases where the start-time offset might result in multiple FNs and FPs for a single experiment. To address this, we made two additional sets of ADED classifications. One set used a 30.0-minute early start-time threshold, whereas the standard METEC ADED criterion uses a 20.0-minute threshold. The second set capitalizes on the obvious visual overlapping of releases and detection reports demonstrated in Section 2.5.2, and requires a 75% overlap to qualify as a detection.
Treating the “all releases” and “per experiment” detections separately demonstrates that BluBird’s overall detection percentage for the ADED 2024 program and estimation of 90% Probability of Detection (PoD) differ substantially depending on whether performance is being assessed in terms of the ability to detect that there is a leak on a site versus the ability to resolve multiple simultaneous leaks. For the per-experiment set (i.e., detection of at least one release per experiment), the detection rate is 91% using standard METEC grading with a 20-minute start time threshold, increasing to 94% with the 30-minute detection classification criterion and 97% using the overlap classification criterion. The detection rate for all releases is 69%, increasing to a maximum of 74% using the overlap criterion. This difference in detection rates between the per-experiment set and the all-releases set again highlights that when BluBird missed a release, it was in nearly all cases one of several during a multiple-release experiment rather than a completely missed experiment.
The improvement in detection performance between ADED 2022 and ADED 2024 can be attributed mainly to BluBird hardware and software improvements. The use of more nodes in 2024 would be expected to improve detection by reducing source-to-sensor distance and angular spacing between nodes. However, release detection rates did not vary significantly with distance or with wind direction variability; contrary to what would be expected if node spacing was a factor.
It is useful to consider how detection percentage aligns with emission release rates listed in active or proposed methane-mitigation regulations. For emission rate bins defined as >= 0.4 kg/h (U.S. EPA OOOOb) and >= 0.1 kg/h and >= 5 kg/h (U.S. EPA alternative monitoring methods for periodic screening technologies), detection rates for the three different detection criteria and the per-experiment data set are above 90% for each of the three EPA rate categories, except for the standard METEC-graded subset (20-minute start-time threshold) at the >= 5 kg/h bin, for which the detection rate is 88%. However, when a few additional high-rate releases that had slightly early assigned start times raises the >5 kg/h detection rate to 95% and 100% for the 30-minute and 75% overlap classification criteria sets.
Consistent with the high percentage of detection across all release rate bins for the ADED 2024 data, the logistics-regression prediction curve for detection vs. release rate reaches a 90% PoD at a rate of 0.64 kg/h for the per-experiment data set using the standard METEC 20-minute start time classification threshold. The extension of the allowable early start time from 20 minutes to 30 minutes yields relatively few additional TPs (13 in total). However, several of these additional TPs are for high-rate releases that lie at the extreme end of the PoD distribution curve. This has little effect on the 90% PoD estimate for the per-experiment data set. However, these additional detections have a large and statistically significant effect on curve-fitting to the all-release set. Compared to an estimated 90% PoD (16.4 kg/h; which lies outside of the ADED testing range), the all-release 90% PoD decreases to 9.04 kg/h for the 30-minute start time criterion (allowing the extra 10 minutes of start time offset) and to 3.94 kg/h when detection overlap is considered (allowing additional early start times but requiring substantial report overlap).
Detection rate is typically assumed to depend strongly on release rate; the 90% PoD value versus rate is routinely treated as a basic measure of CEMS performance. However, this dependence is not apparent in the BluBird results during ADED 2024. Since BluBird’s detection rates are uniformly high across the range of release rates, there is little variance to account for. Among other factors that are likely to affect detection, release duration and total emission per release (a combination of rate and duration) are stronger predictors than rate alone. Since the BluBird system was sensitive enough to detect the full range of emission rates, the main factor driving detection is likely to be how long it took for an emissions plume to intersect a node. This will depend in part on plume dispersion, but variation in wind direction probably plays the main role. This is important when considering the implications of how many sensor nodes are deployed on a site, and where they are positioned. While these results strictly apply only to the range of release rates used during ADED 2024, there is no reason to expect that detection rate would decrease with larger releases, and release rates lower than those used during ADED are typically of less concern for typical oil and gas CEMS operations.
In terms of other influencing factors, within the range of conditions tested, emission detection rates were only weakly correlated with wind conditions. No significant relationships were found between boundary layer conditions and detection rates or emission quantification errors. Atmospheric stability did, however, correlate with some of the cases where BluBird reported earlier release start times or failed to detect gaps between METEC releases, which we attribute potentially to methane gas lingering on-site in between experiments (see Section 3.8).
Any information a CEMS can provide about leak source location is potentially useful for LDAR efforts. This is true as well for leak start- and end-times, which can help operators target particular equipment types or assess effectiveness of repairs. For ADED 2024, BluBird correctly identified the emitting equipment group in most cases, and 92% of the BluBird-reported release start times were accurate to within 30 minutes. It is worth noting that, although BluBird 2.0 as deployed during ADED 2024 was not optimized for multiple-release detection, it proved to be able to identify, in 73% of cases, when an experiment consisted of more than one release. Given this, emission detection alerts could be modified to alert an LDAR team to look for more than one leak, even if the exact number and location of those leaks is not known.
BluBird’s median release-rate quantification error for the ADED 2024 per-experiment subset is within approximately +/- 50%, with 72% of estimates within 3x of the actual rates, with a negative bias in rates across the full range of release rates tested. Methane mass emitted over time is, ultimately, the main parameter that methane monitoring systems are intended to measure and thereby influence. Converting the BluBird ADED measurements into totals of emitted methane summed over different time periods yields comparisons that are relatively direct and straightforward to interpret. Totals summed over daily and weekly periods are significantly correlated, which suggests that such totals can be used to monitor trends.
These methane mass comparisons highlight BluBird’s tendency to underestimate the ADED emissions. Some of this underestimate in total emissions arises from the fact that fence-line sensors do not detect 100% of emissions from a site [23,33]. However, since the large majority of BluBird’s underestimate is due to missed detections of releases during multiple-release experiments, this spatial sampling issue appears to be relatively minor. Only 3% of the underestimate in methane emission mass for the single-release experiment subset is due to missed detections; this suggests that the underestimate in emission mass is due to rate bias rather than to missed releases. Given this, work on improving the BluBird system should prioritize emission rate quantification rather than leak detection capability.
5. Conclusions
Testing of continuous emission monitoring systems (CEMS) designed to detect, quantify, locate and report methane emissions under representative oil-and-gas-site field conditions is a significant challenge. Here, using CSU METEC “Advancing Development of Emissions Detection” (ADED) test results for 2022 and 2024, we assess the performance of the commercially-available BluBird system.
Overall BluBird performance improved substantially from ADED 2022 to ADED 2024. Emission detection reports show consistent overlap with ADED 2024 release periods, and the CEMS was able to identify short-duration releases and short gaps between releases. The system detected 91% of ADED 2024 experiments (defined as the detection of at least one release during an experiment), increasing to 97% when reports with slightly early start times were accepted. Detection rates for all releases during an experiment are 69% and 74%, respectively. The system effectively located sources, with minimal delay in time to detection and reporting.
The 90% probability of detecting at least one release during an experiment is estimated as 0.64 kg/h, while in terms of detection of all releases in an experiment (the standard grading approach used by METEC), the 90% PoD ranges from 3.94 kg/h to 9.04 kg/h. For the release rates seen during ADED 2024, the estimated PoD is only marginally influenced by rate; instead, it is dominated by how many releases are in multiple-release experiments. When a release went undetected, it typically was one among several in a multiple-release experiment. These differences in detection rate and PoD depending on whether the measure used is the ability to detect the presence of one or more leaks during an emissions event versus identifying all leaks that are present during an event are substantial. Summarizing emissions in terms of total methane mass released time shows that aggregating over time reduces overall noise [23]. Estimates of mass are biased low but benefit from time averaging, and are correlated significantly for weekly totals and could be useful for tracking trends or shifts in emissions from a site.
While the ADED program, particularly with the revised ADED 2.0 protocol, is well suited to meeting its goals (see Section 2.2), there are several ways that ADED and METEC could further assist sensor developers and potential users of emission monitoring technologies. To date, METEC has assessed the performance of emission monitoring systems using the “all releases” approach (e.g., [29,31]), which as noted above, does not differentiate between missing a site-level leak or missing one leak among many simultaneous leaks. Point-sensor CEMS detect emissions on a continuous basis but are typically not optimized for identifying multiple, simultaneous leak sources. Imaging systems can see multiple sources but with less frequent sampling of the full site. Reporting results on a per-experiment basis in addition to an all-releases basis would place different technologies on a uniform playing field, and would help in understanding their strengths, weaknesses, and best routes for improvement.
For the BluBird CEMS, the ADED data suggest that further improvements should focus on rate quantification [5]; other factors such as leak detection and mapping of leak duration contributed only slightly to overall error in these tests. Several routes exist for improving the estimation of emission rates as part of the BluBird system. Work is presently underway to test adjustments to the Gaussian plume model for different conditions, and to implement a Gaussian puff approach [e.g., [34]], which can improve localization and provide more options for enhanced physical treatments.
6. Specifications Table
| Subject | Pollution |
| Specific subject area | Methane emissions detection and monitoring from oil and gas production facilities. |
| Type of data | Table, Graph, Figure, Analyzed, Processed |
| Data collection | Data represented here are records on methane emissions releases and reported detections as part of field testing. Data were generated using automated sensor processing algorithms and compiled into a standard test-program results data file. |
| Data source location | Methane emissions testing was carried out in Fort Collins, Colorado, USA |
| Data accessibility | All of the data depicted in this publication are included as Supplementary Materials |
Supplementary Materials
The following supporting information can be downloaded at the website of this paper posted on Preprints.org, The original METEC data files resulting from Earthview’s participation in ADED 2022 and ADED 2024, with derived columns for overlap, Jaccard, and alternative-criterion classifications, are provided as Supplementary Materials in Earthview_MDPI_ADED_supplementary_data.zip (containing ADED_2022_supplementary_data.xlsx and ADED_2024_v3_supplementary_data.xlsx). Contact the lead author if additional information such as sensor-derived methane concentrations and/or wind information is desired.
Author Contributions
J.M., K.S. and K.Y. contributed to original data collection and submission. K.Y. was responsible for software systems. F. Givhan provided overall project guidance.
Funding
This work was funded internally by Earthview Corp.
Institutional Review Board Statement
Not applicable.
Informed Consent Statement
Not applicable.
Data Availability Statement
The Supplementary Materials files are provided as a zip folder.
Acknowledgments
Mr. Kevin Gomez and Mr. Kyle Schneider assisted with software development and data reporting. The authors would also like to acknowledge the efforts of Mr. Ryan Brouwer and other members of the METEC field team.
Conflicts of Interest
JM, KY, and BG are employed by Earthview Corp. KG was employed as an Earthview contractor during the test program.
References
- IEA International Energy Agency. Global methane tracker 2026; IEA Paris, 2026; Volume 78 pgs. Available online: www.iea.org.
- Alvarez, A.R.; Zavala-Araiza, D.; Lyon, D.R.; Allen, D.T.; Barkley, Z.R.; Brandt, A.R.; Davis, K.J.; Herndon, S.C.; Jacob, D.J.; Karion, A.; Kort, E.A.; Lamb, B.K.; Lauvaux, T.; Maasakkers, J.D.; Marchese, A.J.; O’Mara, M.; Pacala, S.W.; Peischl, J.; Robinson, A.L.; Shepson, P.B.; Sweeney, C.; Townsend-Small, A.; Wofsy, S.C.; Hamburg, S.P. Assessment of methane emissions from the U.S. oil and gas supply chain. Science 2018, Vol. 361(Issue 6398), 186–188. [Google Scholar] [CrossRef] [PubMed]
- Uzermans, R.; Jones, M.; Weidmann, D.; van de Kerkhof, B.; Randell, D. Long-term continuous monitoring of methane emissions at an oil and gas facility using a multi-open-path laser dispersion spectrometer. Sci. Rep. 2024, 14, 623. [Google Scholar] [CrossRef] [PubMed]
- Xie, Z.; Tang, J.; Li, R.; Tian, G.; Ma, R. A review of source-term estimation for continuous methane monitoring: From data acquisition to modeling and estimation. ACS Omega 2026, 11, 18570–19589. [Google Scholar] [CrossRef] [PubMed]
- Ravikumar, A.P.; Sreedhara, S.; Wang, J.; Englander, J.; Roda-Stuart, D.; Bell, C.; Zimmerle, D.; Lyon, D.; Mogstad, I.; Ratner, B.; Brandt, A.R. Single-blind inter-comparison of methane detection technologies – results from the Stanford/EDF Mobile Monitoring Challenge. Elem. Sci. Anth 2019, 7, 37. [Google Scholar] [CrossRef]
- Sharafutdinov, E.; Ravikumar, A.P. High Resolution Surveys Reveal Pitfalls of Using Regional Observations to Verify Oil and Gas Methane Emissions, 2025 EEMDL Annual Event, Poster Session. Available online: https://www.ceesa.utexas.edu/posters.
- Hodshire, A.L.; Duggan, G.P.; Zimmerle, D.; Santos, A.; McArthur, T.; Bylsma, J.; Alden, C.B.; Youngquist, D.; White, A.; Rieker, G. B Intermittent emissions from oil and gas operations: Implications for detection effectiveness from periodic leak detection surveys. ACS EST Air 2025, 2, 2776–2785. [Google Scholar] [CrossRef]
- Bell, C.; Ilonze, C.; Duggan, A.; Zimmerle, D. Performance of continuous emission monitoring solutions under a single-blind controlled testing protocol. Environ. Sci. Technol. 2023, 57, 5794–5805. [Google Scholar] [CrossRef] [PubMed]
- Chen, Q.; Schissel, C.; Kimura, Y.; McGaughey, G.; McDonald-Buller, E.; Allen, D.T. Assessing detection efficiencies for continuous methane emission monitoring systems for at oil and gas production sites. Env. Sci. Technol.>, Energy Clim. 2023, Vol. 57(Issue 4), 1788–1796. [Google Scholar] [CrossRef] [PubMed]
- Chen, Y.; Cusworth, D.; Frankenberg, C.; Brandt, A. Comparing continuous methane monitoring technologies for high-volume emissions: A single-blind controlled release study. ACS ES&T Air 2024, 1, 871−884. [Google Scholar] [CrossRef]
- Yang, S. L.; Ravikumar, A. P. Assessing the performance of point sensor continuous monitoring systems at midstream natural gas compressor stations. ACS ES&T Air 2025, 2, 466–475. [Google Scholar] [CrossRef]
- Torres, V.M.; Sullivan, D.W.; He’Bert, D.W.; Spinhirne, E.; Modi, J.; Allen, M. D.T. Field inter-comparison of low-cost sensors for monitoring methane emissions from oil and gas production operations. Atmos. Meas. Tech. 2022. [Google Scholar] [CrossRef]
- Kemp, C.; Ravikumar, A. New technologies can cost effectively reduce oil and gas methane emissions, but policies will require careful eesign to establish mitigation equivalence. Environ. Sci. Technol. 2021, 55, 9140–9149. [Google Scholar] [CrossRef] [PubMed]
- Riddick, S.N.; Ancona, R.; Cheptonui, R.; Bell, C.S.; Duggan, A.; Bennett, K.E.; Zimmerle, D.J. A cautionary report of calculating methane emissions using low-cost fence-line sensors. Elem. Sci. Anthr. 2022, 10(1), 00021. [Google Scholar] [CrossRef]
- Day, R. E.; Emerson, E.; Bell, C.; Zimmerle, D. Point sensor networks struggle to detect and quantify short controlled releases at oil and gas sites. Sensors 2024, 24(8), 2419. [Google Scholar] [CrossRef] [PubMed]
- Peltier, J. (Ed.) An update on low-cost sensors for the measurement of atmospheric composition; World Meteorological Organization: Geneva, Switzerland, 2021; Volume WMO-No. 1215, p. 89 pgs. [Google Scholar]
- Barchyn, T.E.; Hugenholtz, C.H.; Gough, T.; Vollrath, C.; Gao, M. Low-cost fixed sensor deployments for leak detection in North American upstream oil and gas: Operational analysis and discussion of a prototypical program. Elem. Sci. Anth 2023, 11, 1. [Google Scholar] [CrossRef]
- Ilonze, C.; Wang, J.; Ravikumar, A.P.; Zimmerle, D. Methane quantification performance of the quantitative optical gas imaging (QOGI) system using single-blind controlled release assessment. MDPI Sens. 2024, 24(13), 4044. [Google Scholar] [CrossRef] [PubMed]
- Earthview. U.S. EPA Alternative Test Method Description of Technology for the Earthview BluBird system, 70 pp. 2025. Available online: https://cg-e7a81369-5de4-401e-bad8-901e7388d350.s3.us-gov-west.
- Ilonze, C.; Emerson, E.; Duggan, A.; Zimmerle, D. Assessing the progress of the performance of continuous monitoring solutions under a single-blind controlled testing protocol. In Env. Sci. and Tech.; 2024. [Google Scholar]
- Zimmerle, D.; Bell, C.; Emerson, E.; Levin, E.; Ilonze, C.; Cheptonui, F.; Day, R. Advancing development of emissions detection: DE-FE0031873 final report. January 31, 2025. Contract Number DE-FE0031873. Energy Institute, Colorado State University. Available online: https://metec.colostate.edu/wp-content/uploads/sites/37/2025/03/ADED-Final-Report_DE-FE0031873_rev-0131025.pdf.
- Cheptonui, F.; Emerson, E.; Ilonze, C.; Day, R.; Levin, E.; Fleischmann, D.; Brouwer, R.; Zimmerle, D.J. Assessing the performance of emerging and existing continuous monitoring solutions under a single-blind controlled testing protocol. ChemRxiv working paper not yet peer-reviewed. 2024. [Google Scholar] [CrossRef]
- Ball, D.; Eichenlaub, N.; Lashgari, A. Performance evaluation of fixed-point continuous monitoring systems: Influencing of averaging time in complex emission environments. Sensors 2025, 25(9), 2801. [Google Scholar] [CrossRef] [PubMed]
- Cahill, B.; Almasalha, S.; Gupta, S.; Kyi, A. The state of greenhouse gas emissions management, EEMDL 2024 Annual Event, Energy Emissions Modeling and Data Lab (EEMDL). Available online: www.
- Glaessgen, E.H.; Stargel, D.S. The digital twin paradigm for future NASA and U.S. Air Force vehicles. 53rd. Structures, Structural Dynamics, and Materials Conf., Special Session on the Digital Twin, Am. Inst. Aeronautics and Astronautics, 2012. [Google Scholar]
- U.S. EPA. Other Test Method (OTM) 33 and 33A Geospatial Measurement of air Pollution—Remote Emissions Quantification Direct Assessment (GMAP-REQ-DA). 2014; p. 91 pgs. [Google Scholar]
- Riddick, S.N.; Ancona, R.; Bell, C.S.; Duggan, A.; Vaughn, T.L.; Bennett, K.; Zimmerle, D.J. Quantitative comparison of methods used to estimate methane emissions from small point sources. Atmos. Meas. Tech. Disc. [CrossRef]
- Jia, M.; Fish, R.; Daniels, W.S.; Sprinkle, B.; Hammerling, D. A fast and lightweight implementation of the Gaussian puff model for near-field atmospheric transport of trace gasses. Sci. Rep. 2025, 15, 18710. [Google Scholar] [CrossRef] [PubMed]
- Mbua, M.; Riddick, S.N.; Kiplimo, E.; Shonkwiler, K.B.; Hodshire, A.; Zimmerle, D. Evaluating the feasibility of using downwind methods to quantify point source oil and gas emissions using continuously monitoring fence-line sensors. Atmos. Meas. Tech. 2025, Vol. 18(Issue 20, AMT), 18.5687–5703. [Google Scholar]
- Dowell, D.C.; Alexander, C.R.; James, E.P.; Weygandt, S.S.; Benjamin, S.G.; Maniken, G.S.; Blake, B.T.; Brown, J.M.; Olson, J.B.; Hu, M.; Smirnova, T.G.; Ladwig, T.; Kenyon, J.S.; Ahmadov, R.; Turner, D.D.; Duda, J.D.; Alcott, T.I. The High-Resolution Rapid Refresh (HRRR): An hourly updating convection-allowing forecast model. Part I: Motivation and system description. Weather Forecast. 2022, Vol. 37, 1371–1395. [Google Scholar] [CrossRef]
- Guerra, J.E.; Eichenlaub, N.; Solomon, D. Event-based analysis of performance of Project Canary’s continuous monitoring systems. 2023. Available online: https://www.projectcanary.com/blog/event-based-analysis-of-performance-by-project-canarys-continuous-monitoring-systems/.
- Park, G.; Cho, M.; Lee, J. Leveraging machine learning for automatic topic discovery and forecasting of process mining research: A literature review. Expert Syst. Appl. 2024, 239, 122435. [Google Scholar]
- Fox, T.A.; Barchyn, T.E.; Risk, D.; Ravikumar, A.P.; Hugenholtz, C.H. A review of close-range and screening technologies for mitigating fugitive methane emissions in upstream oil and gas. Env. Res. Lett. 2019, 14, 053002. [Google Scholar] [CrossRef]
- Ball, D.; Ismail, U.; Eichenlaub, N.; Metzger, N.; Lashgari, A. Performance evaluation of multi-source methane emission quantification models using fixed-point continuous monitoring systems. Atmos. Meas. Tech. 18, 5375–5391. [CrossRef]
Figure 1.
The Earthview BluBird 2.0 sensor node, showing stand, solar panel and backup battery, instrument enclosure, communications antenna, wind anemometer, and adjustable telescoping air-intake mast.
Figure 1.
The Earthview BluBird 2.0 sensor node, showing stand, solar panel and backup battery, instrument enclosure, communications antenna, wind anemometer, and adjustable telescoping air-intake mast.
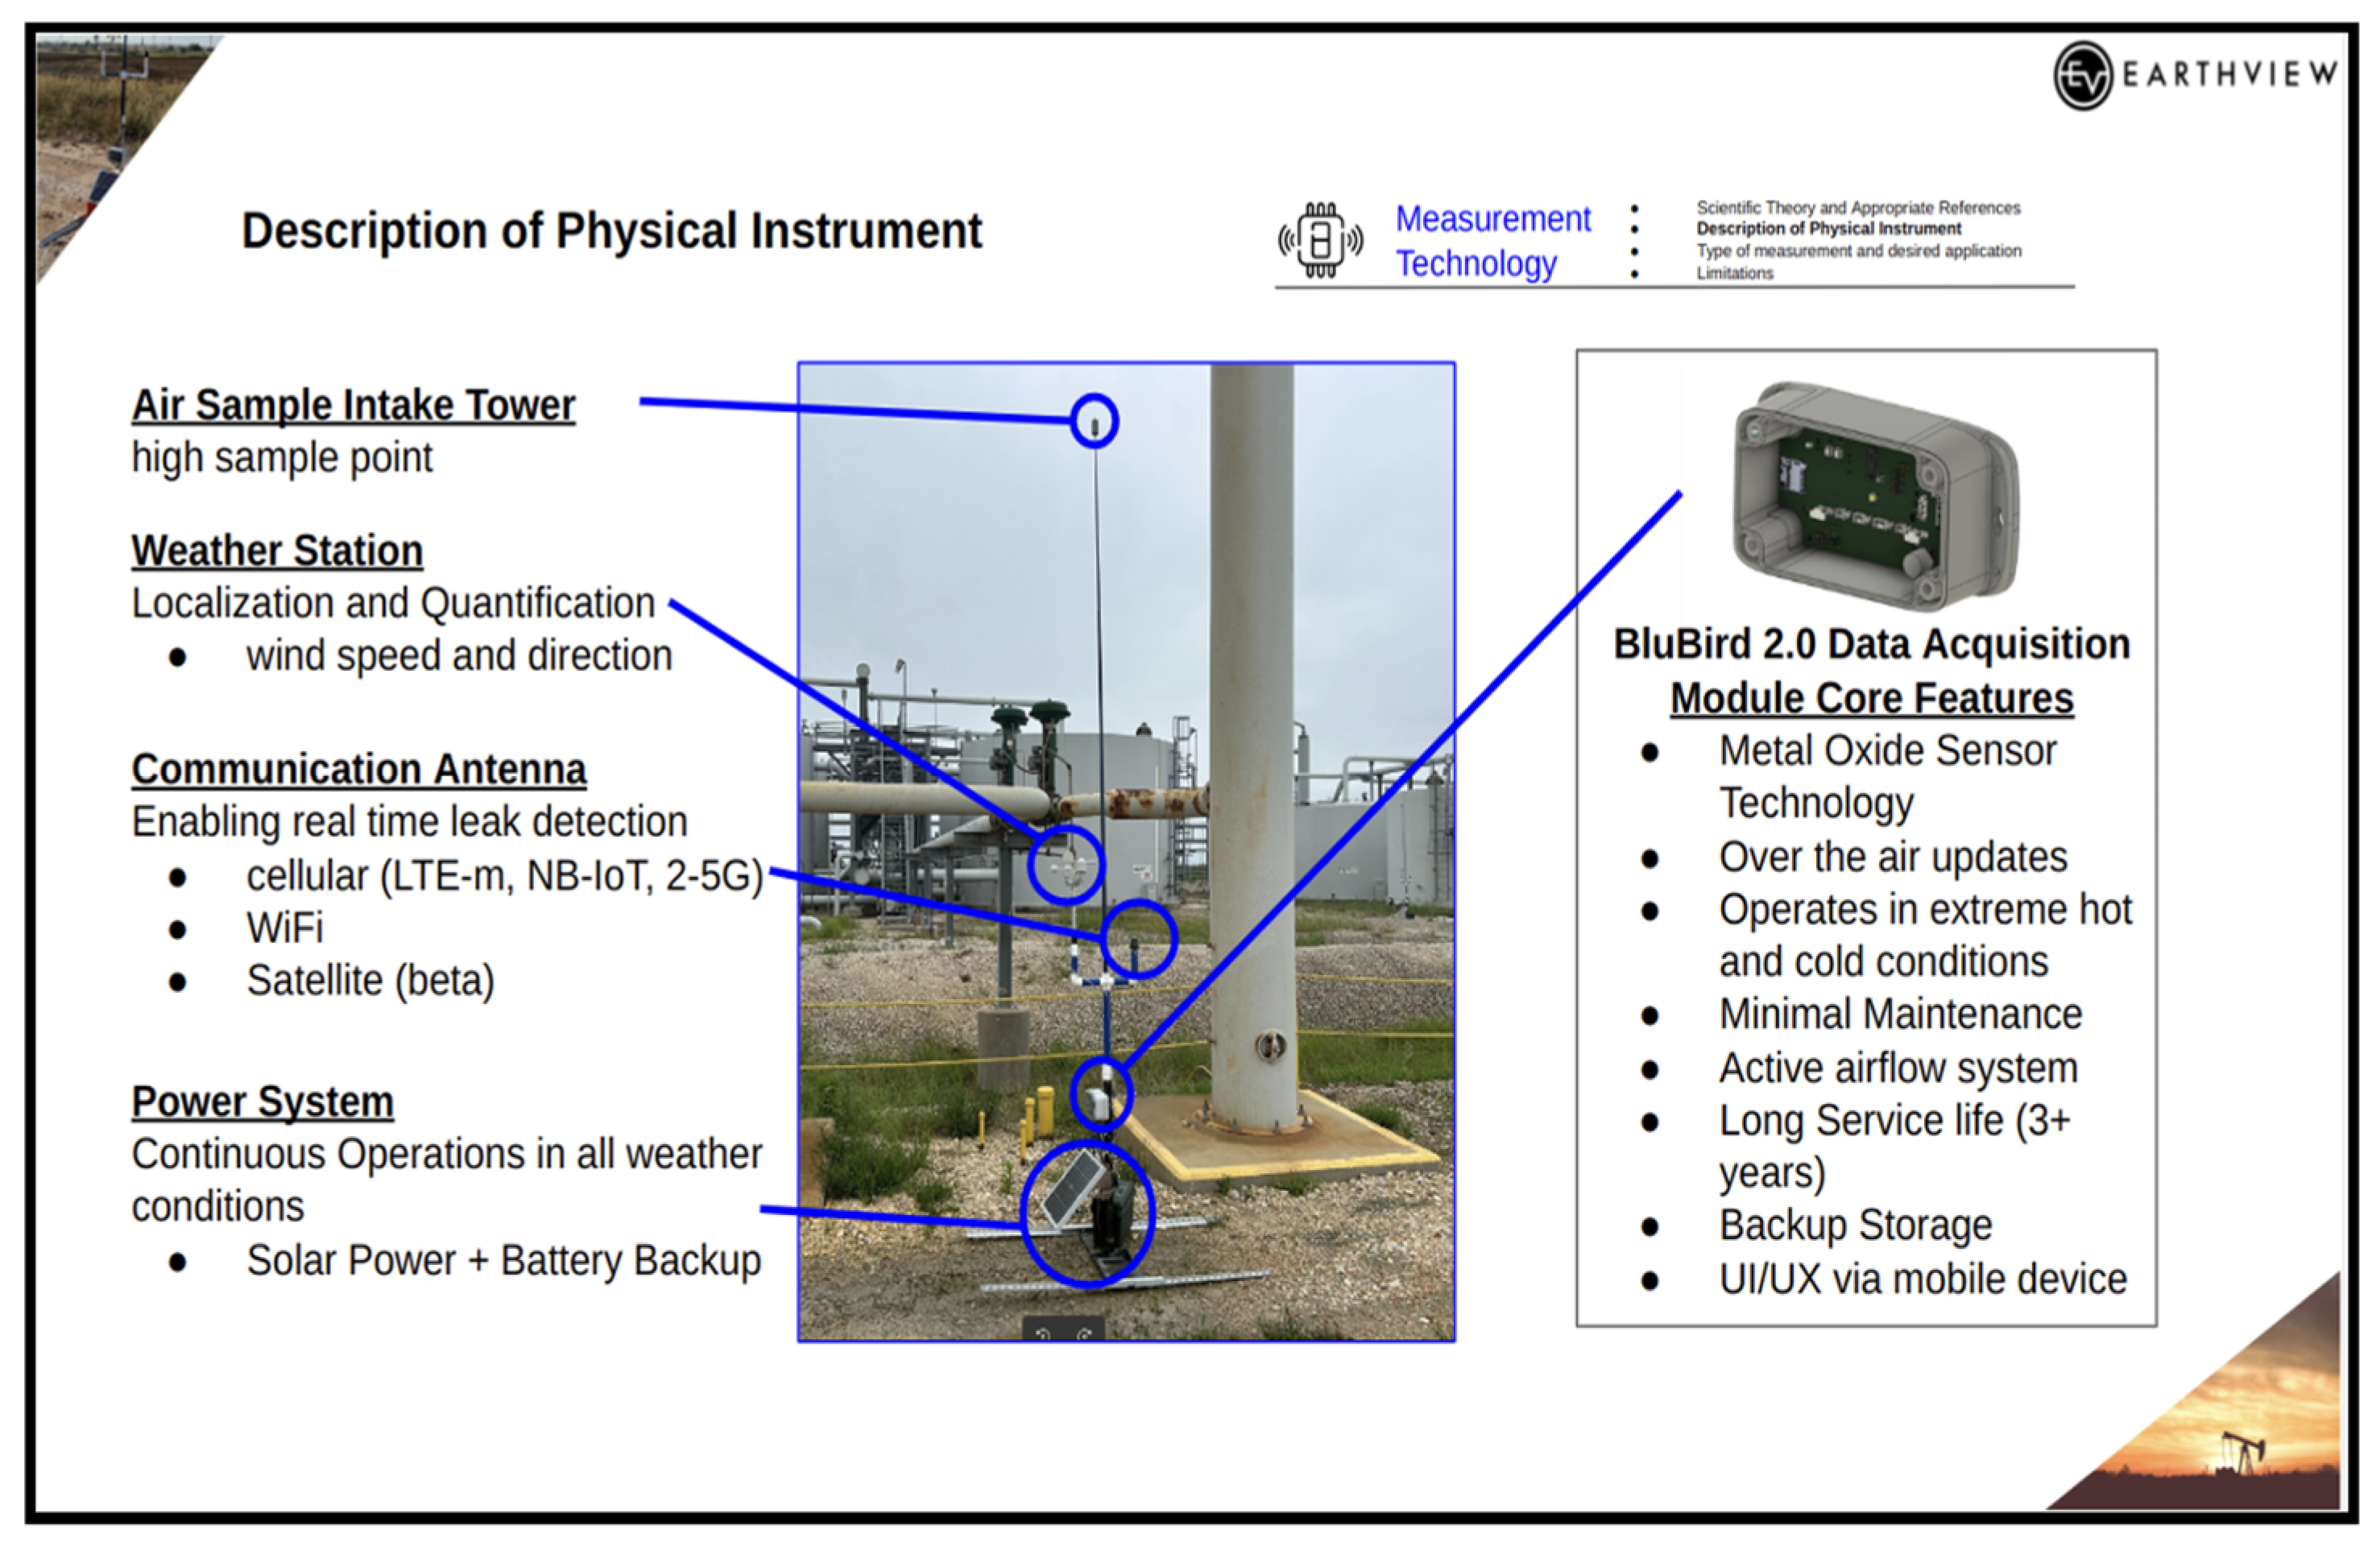
Figure 2.
The Colorado State University METEC test facility. Placements are shown for BluBird 1.5 nodes During ADED 2022 (white symbols) and BluBird 2.0 nodes for ADED 2024 (red symbols) (image courtesy Google Earth; Imagery Date: 4/23/2023, lat 40.595782o, lon -105.139867o, elev 5142 ft., eye alt 5576 ft.).
Figure 2.
The Colorado State University METEC test facility. Placements are shown for BluBird 1.5 nodes During ADED 2022 (white symbols) and BluBird 2.0 nodes for ADED 2024 (red symbols) (image courtesy Google Earth; Imagery Date: 4/23/2023, lat 40.595782o, lon -105.139867o, elev 5142 ft., eye alt 5576 ft.).
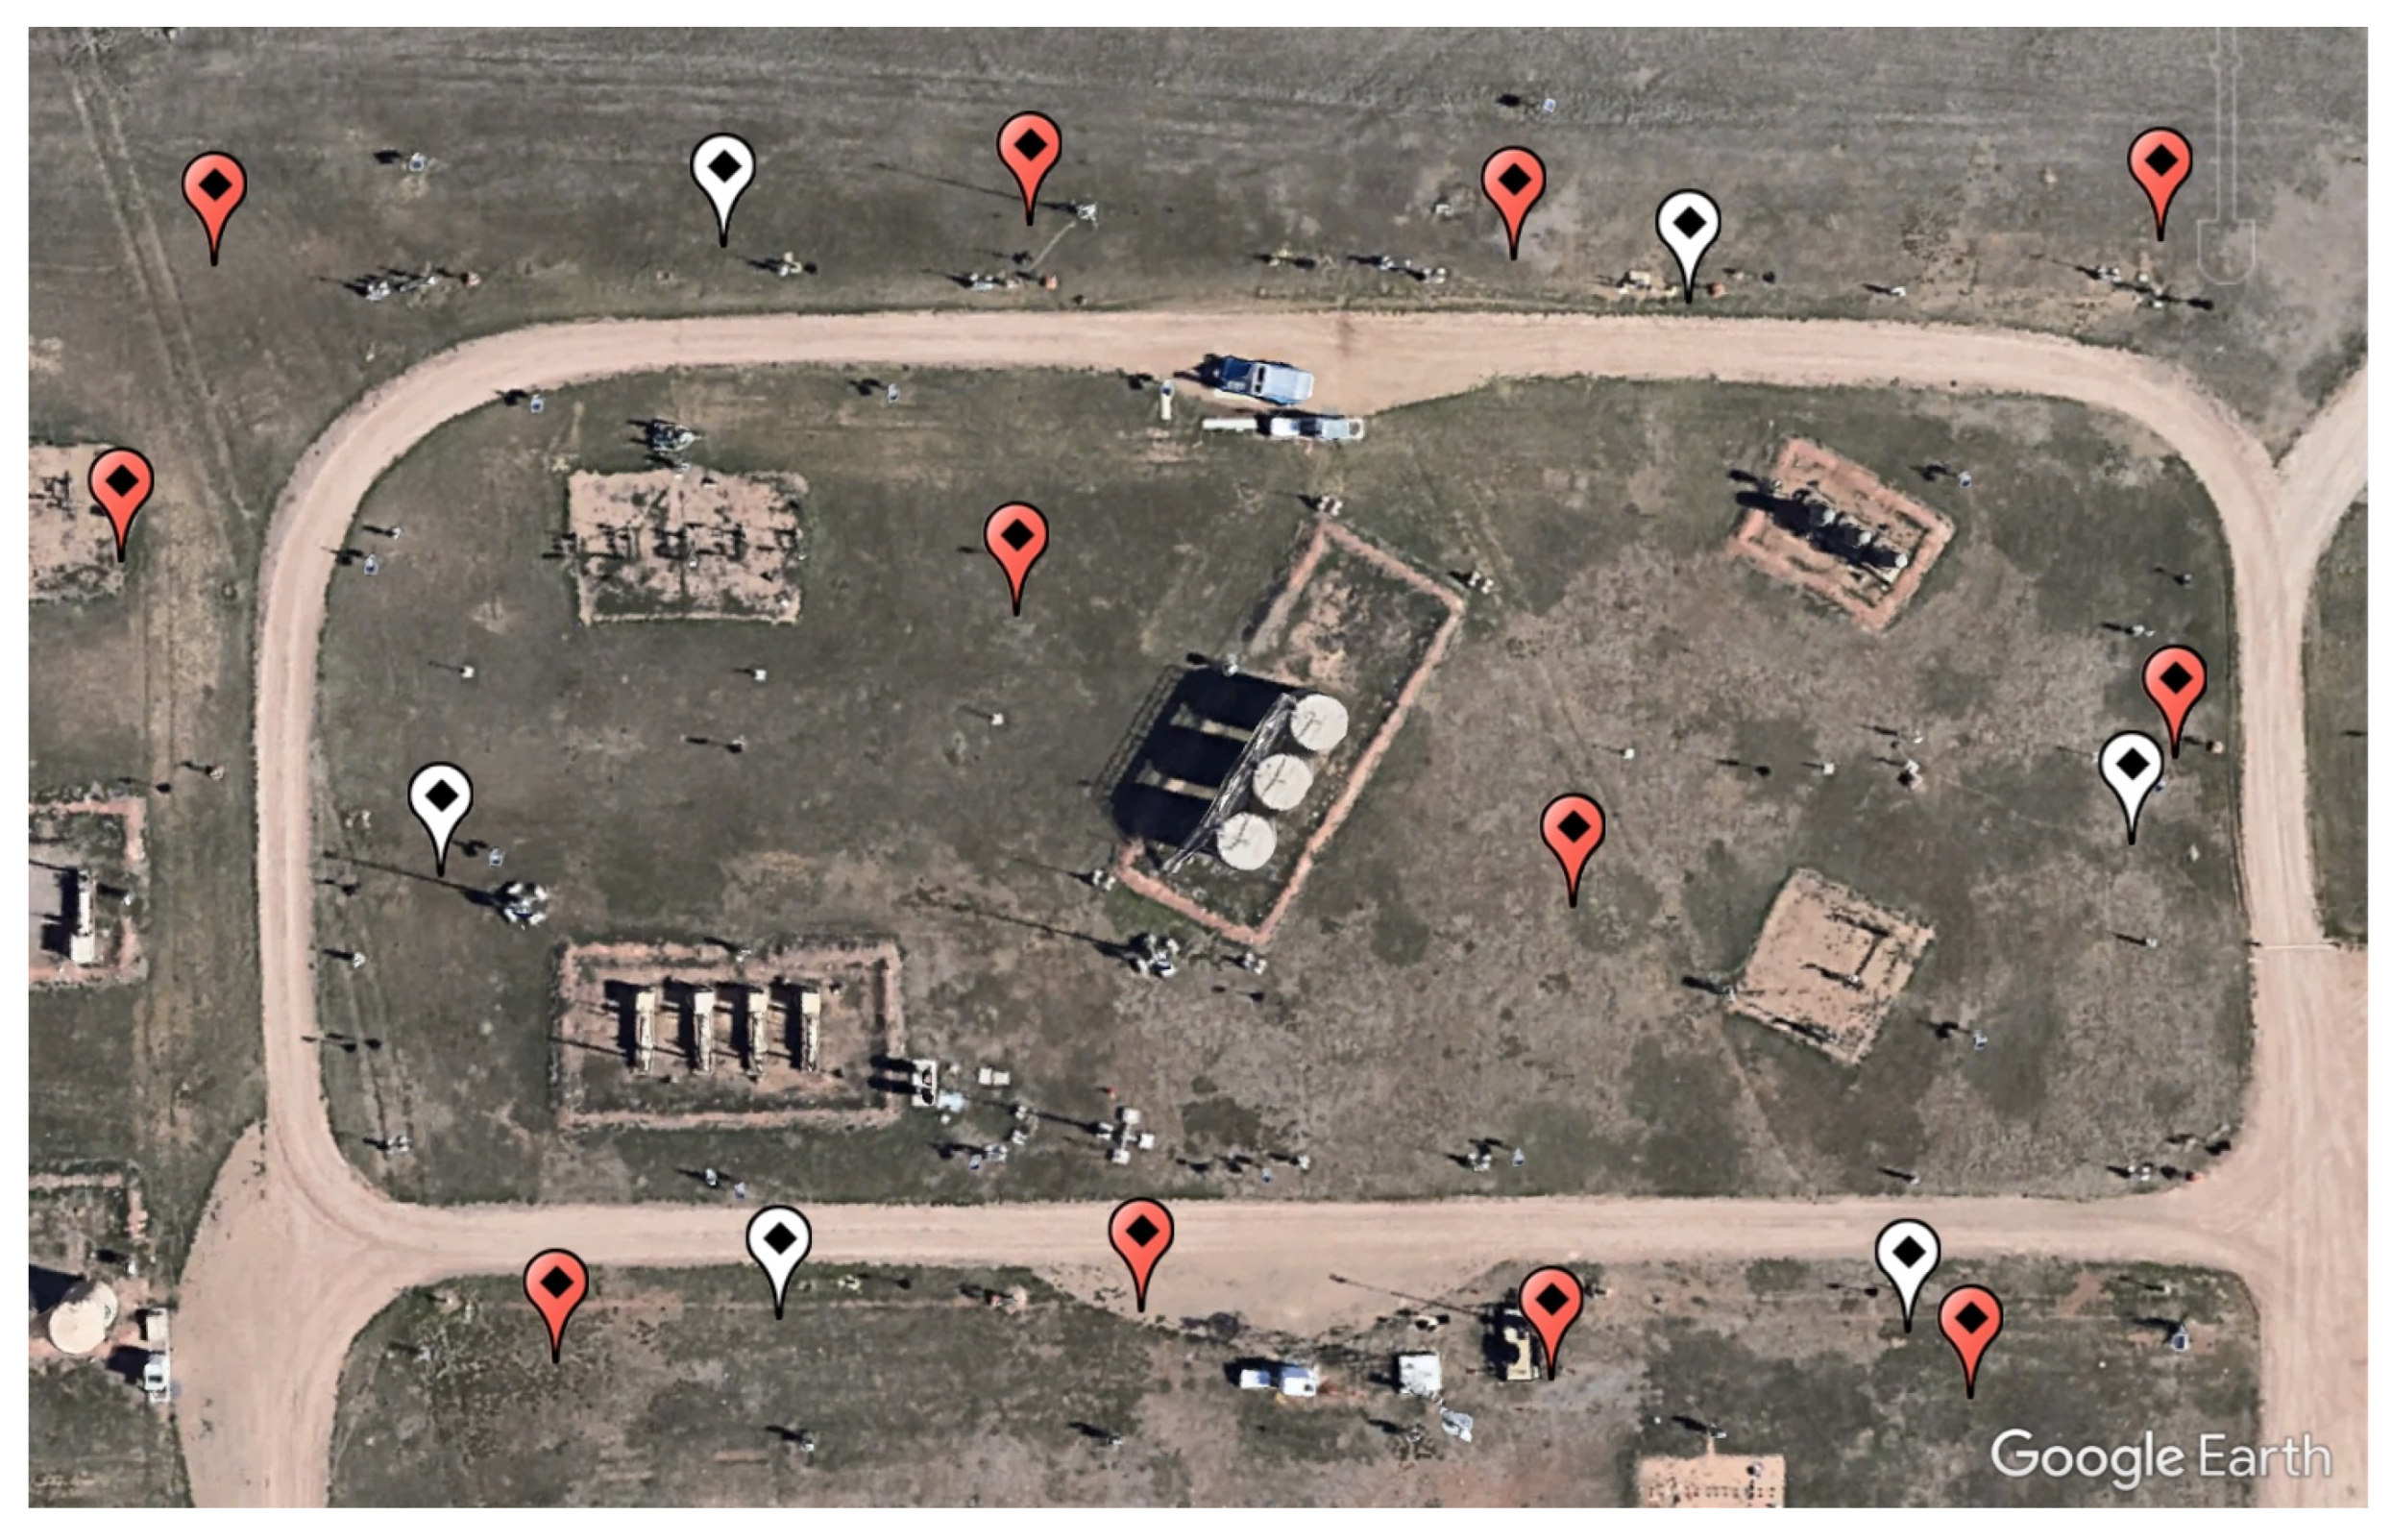
Figure 3.
Number of natural gas releases per experiment for ADED 2022 and ADED 2024.
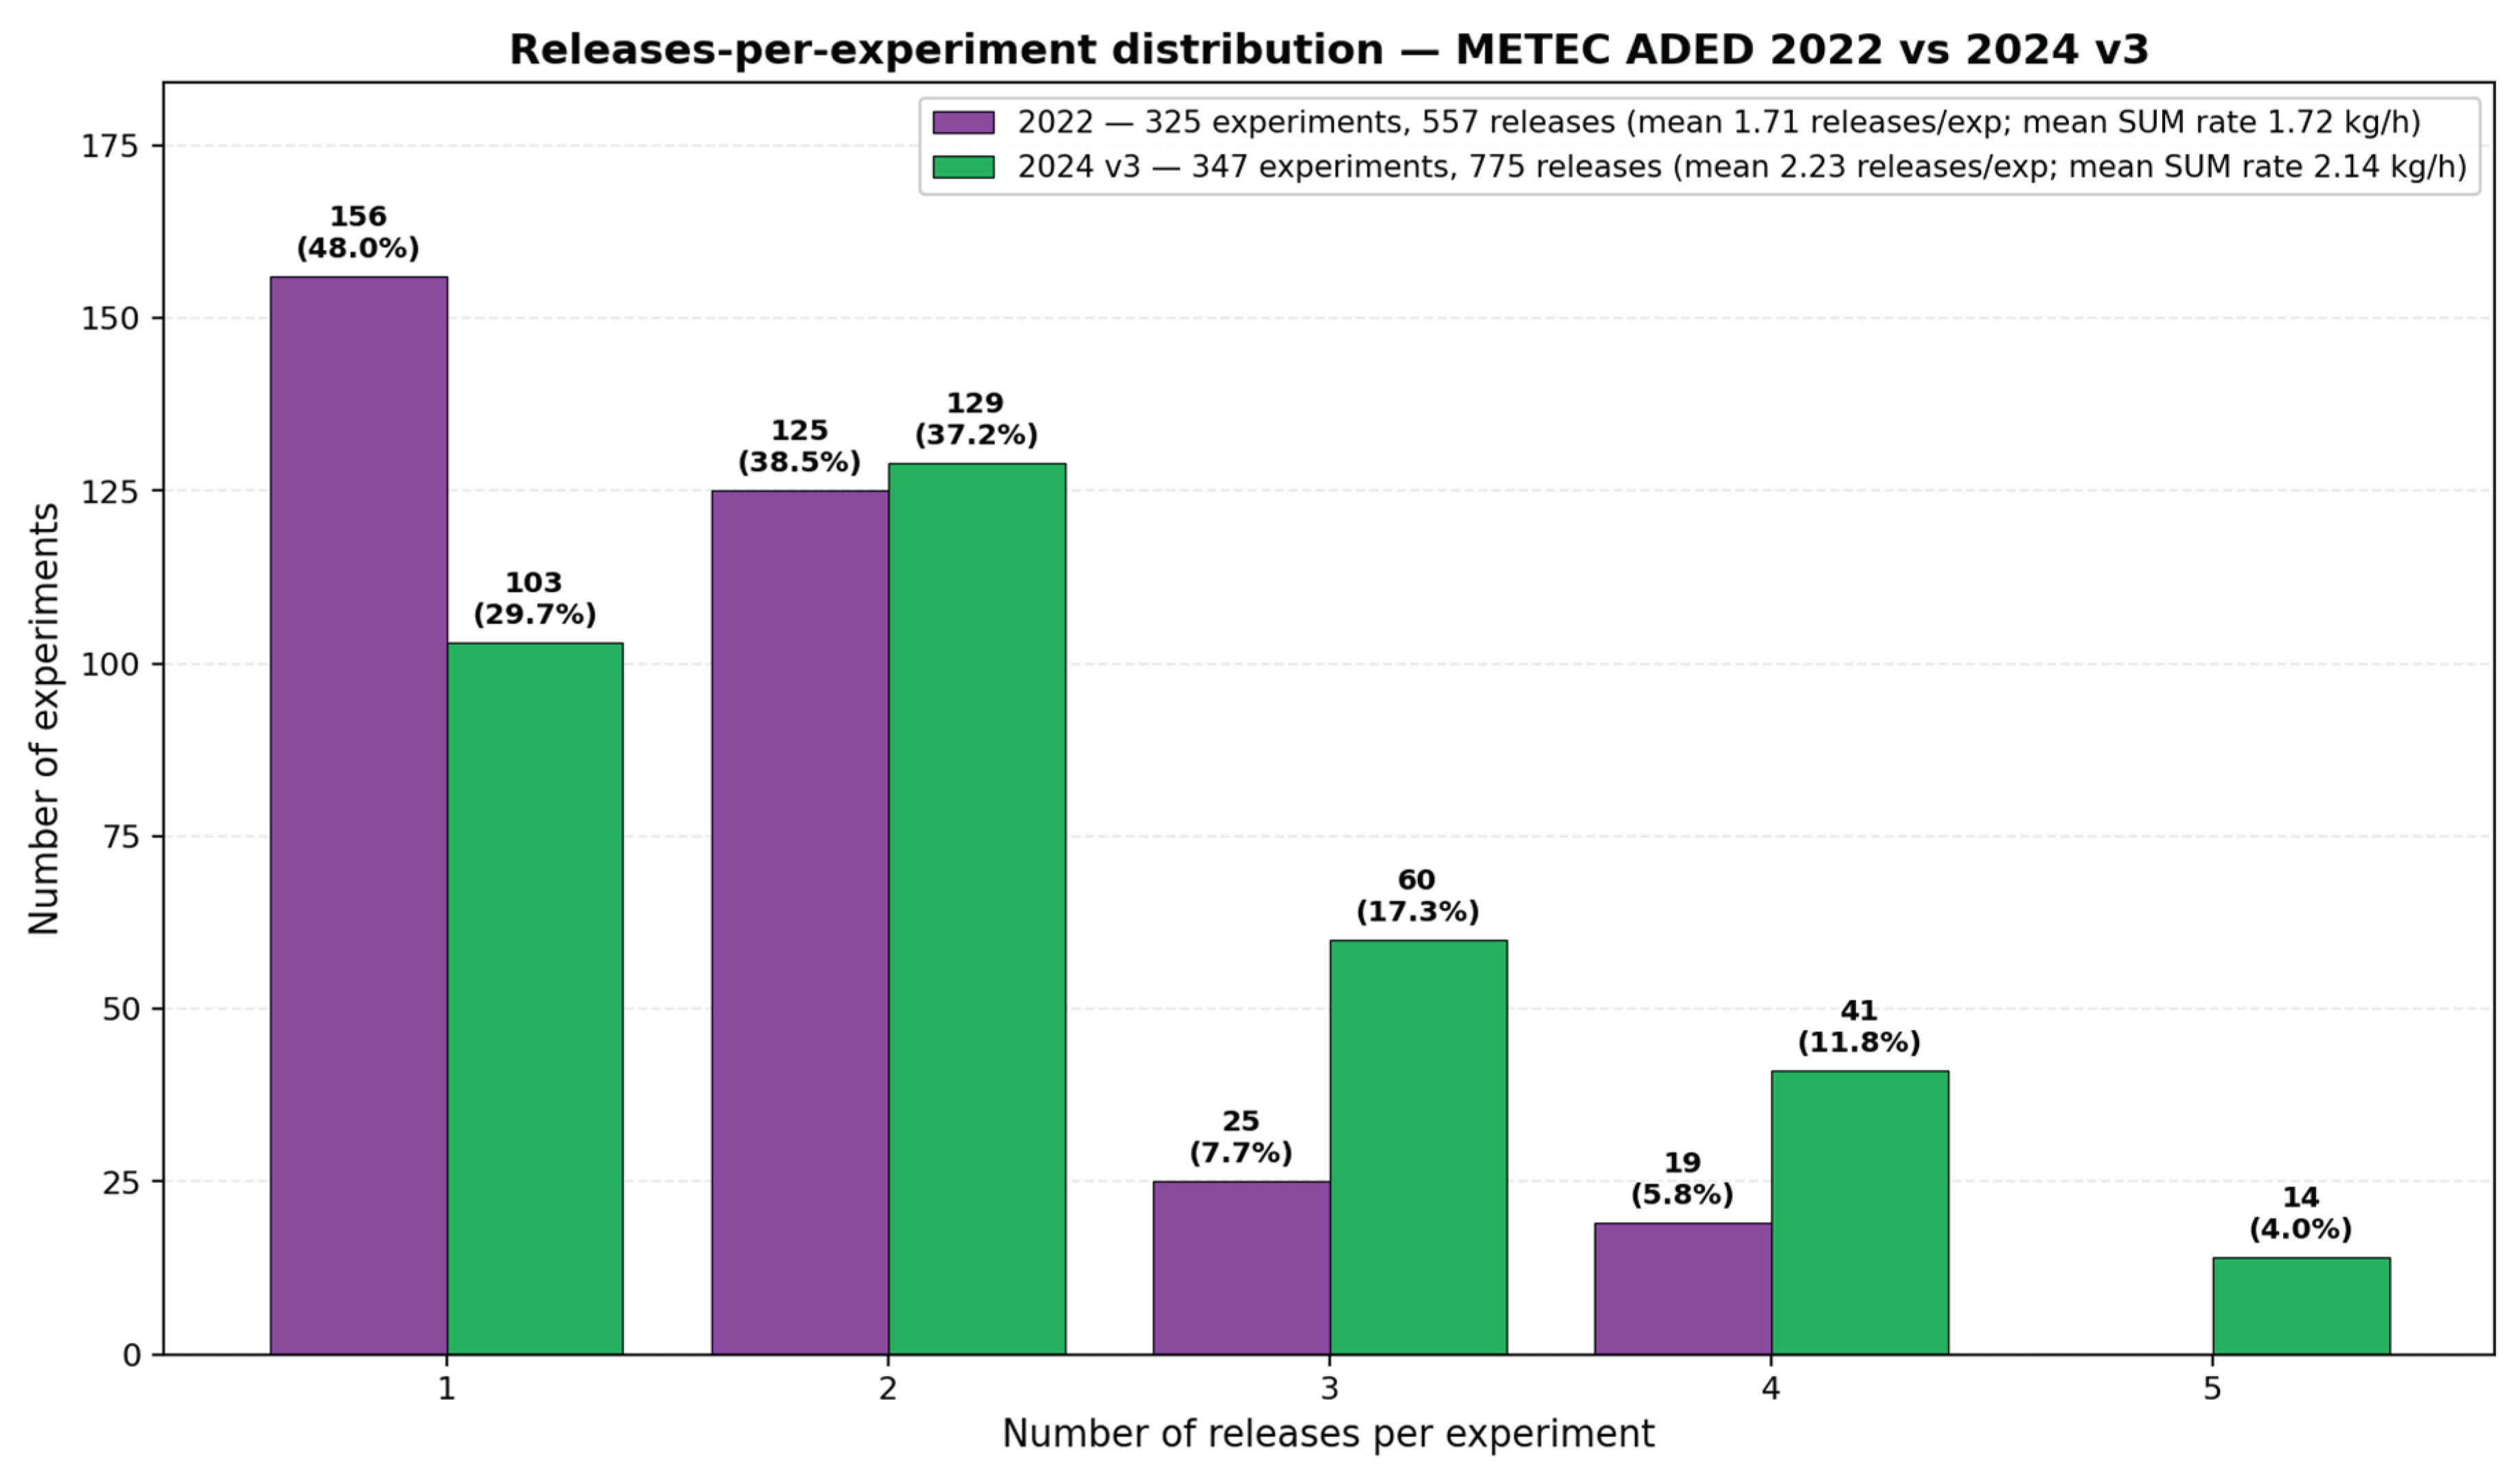
Figure 4.
Comparison of ADED release periods (top half of the graph) with BluBird-reported release detections (bottom half of the graph) for 23 March–28 March 2024 (UTC). Each stack of bars in the graph’s top half represents one ADED experiment. Multiple bars in a stack indicate multiple releases during a single experiment. Blue and green bars are releases that were classified as successful detections (TPs). Red bars are releases classified as undetected (FNs). Orange bars indicate a detection report classified as having no corresponding ADED release (FPs). BluBird-derived methane concentrations for the area in the black box are presented below in Figure 5.
Figure 4.
Comparison of ADED release periods (top half of the graph) with BluBird-reported release detections (bottom half of the graph) for 23 March–28 March 2024 (UTC). Each stack of bars in the graph’s top half represents one ADED experiment. Multiple bars in a stack indicate multiple releases during a single experiment. Blue and green bars are releases that were classified as successful detections (TPs). Red bars are releases classified as undetected (FNs). Orange bars indicate a detection report classified as having no corresponding ADED release (FPs). BluBird-derived methane concentrations for the area in the black box are presented below in Figure 5.
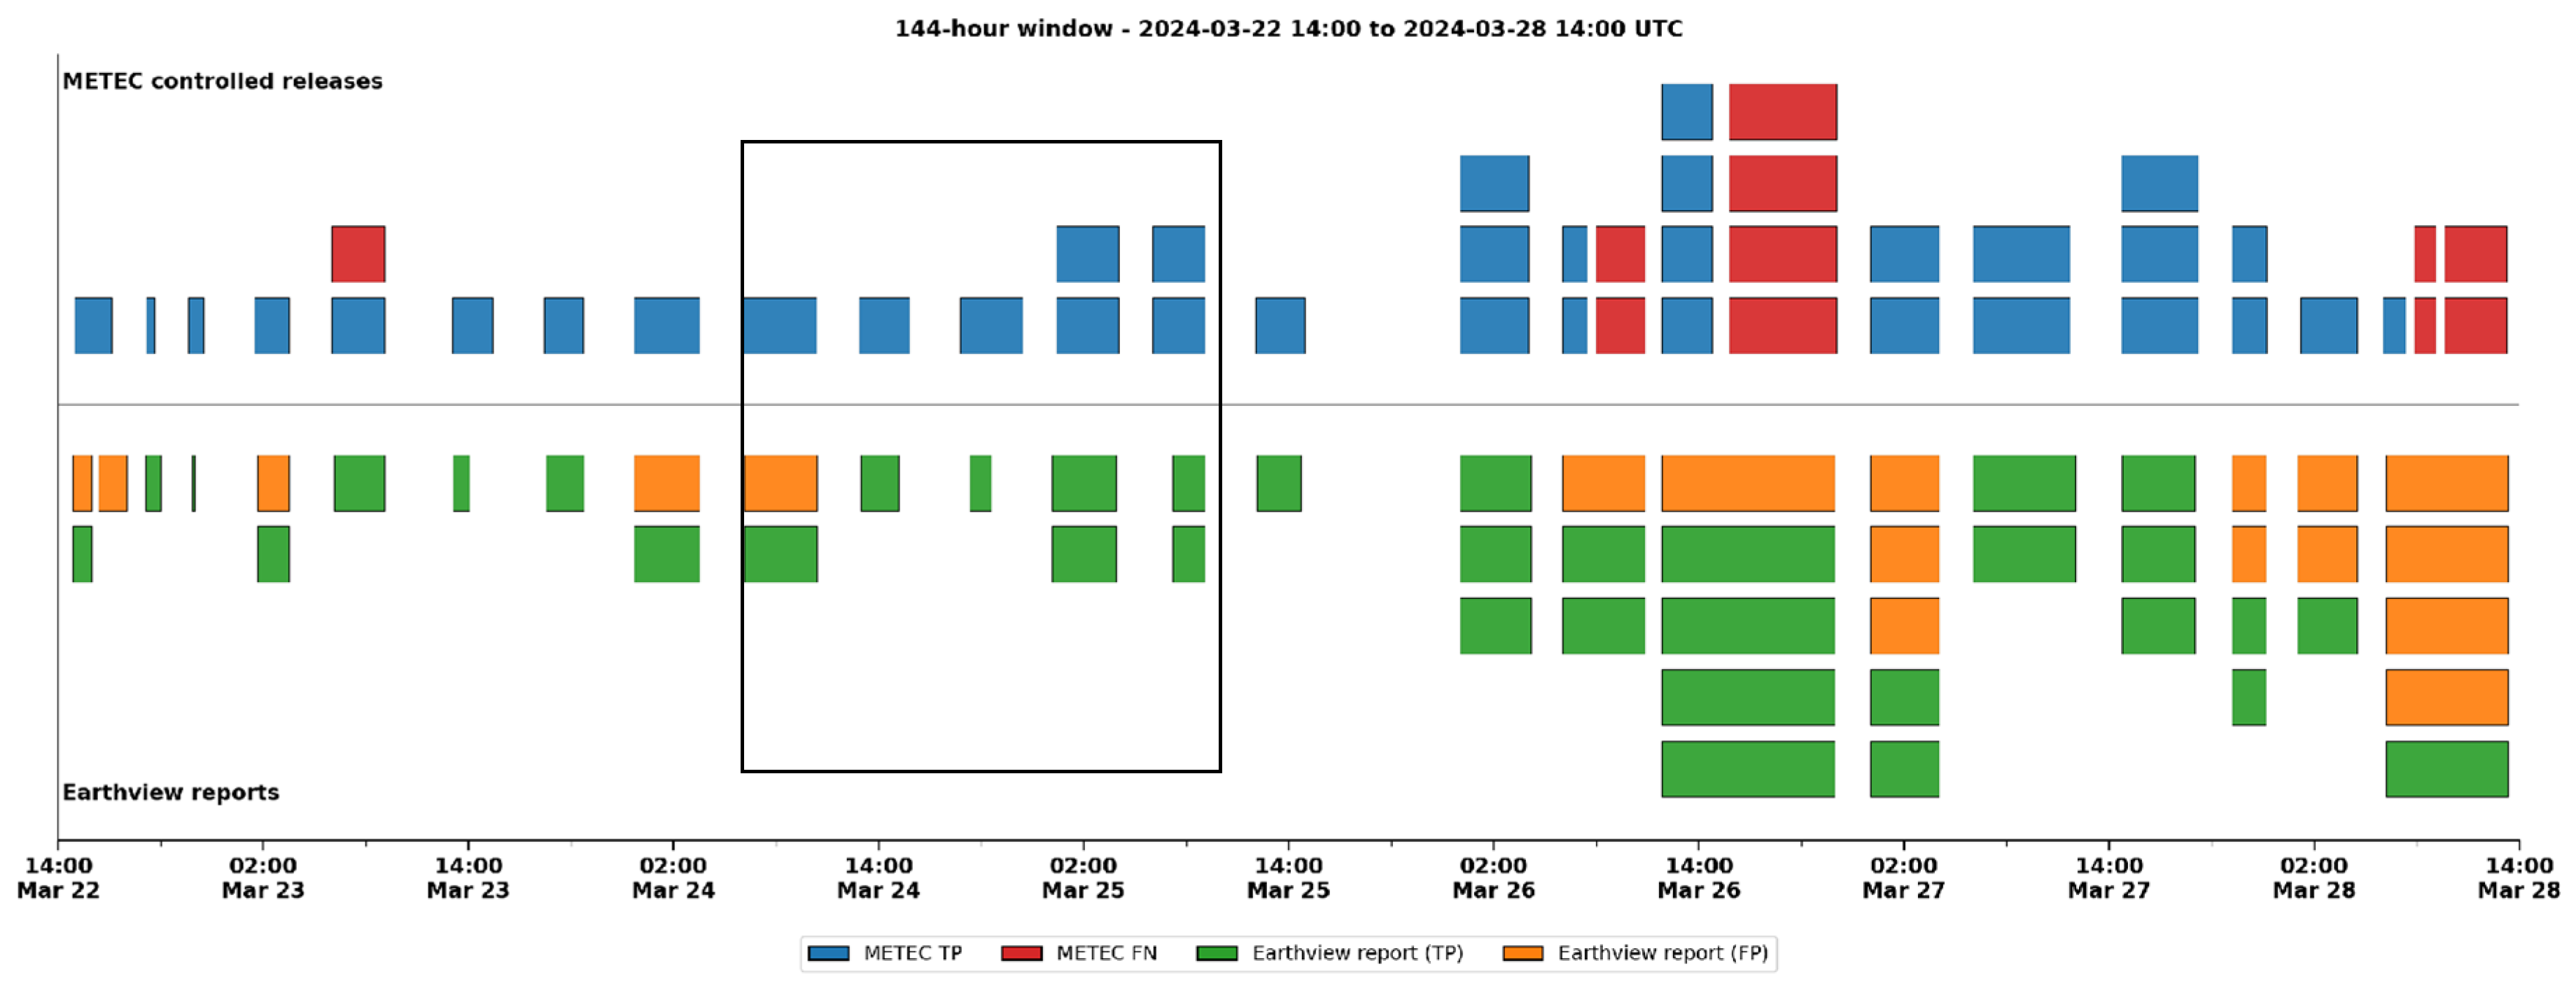
Figure 5.
Time series of BluBird-reported methane concentrations (line graph), corresponding METEC releases (blue bars in the top panel), and BluBird detection reports (green and orange bars in the bottom panel) for 24 March 2024 (the subset highlighted by the black box in Figure 4). The color scheme for the bars is as in Figure 4. Each of the lines in the line graph represents concentrations from an individual BluBird node.
Figure 5.
Time series of BluBird-reported methane concentrations (line graph), corresponding METEC releases (blue bars in the top panel), and BluBird detection reports (green and orange bars in the bottom panel) for 24 March 2024 (the subset highlighted by the black box in Figure 4). The color scheme for the bars is as in Figure 4. Each of the lines in the line graph represents concentrations from an individual BluBird node.
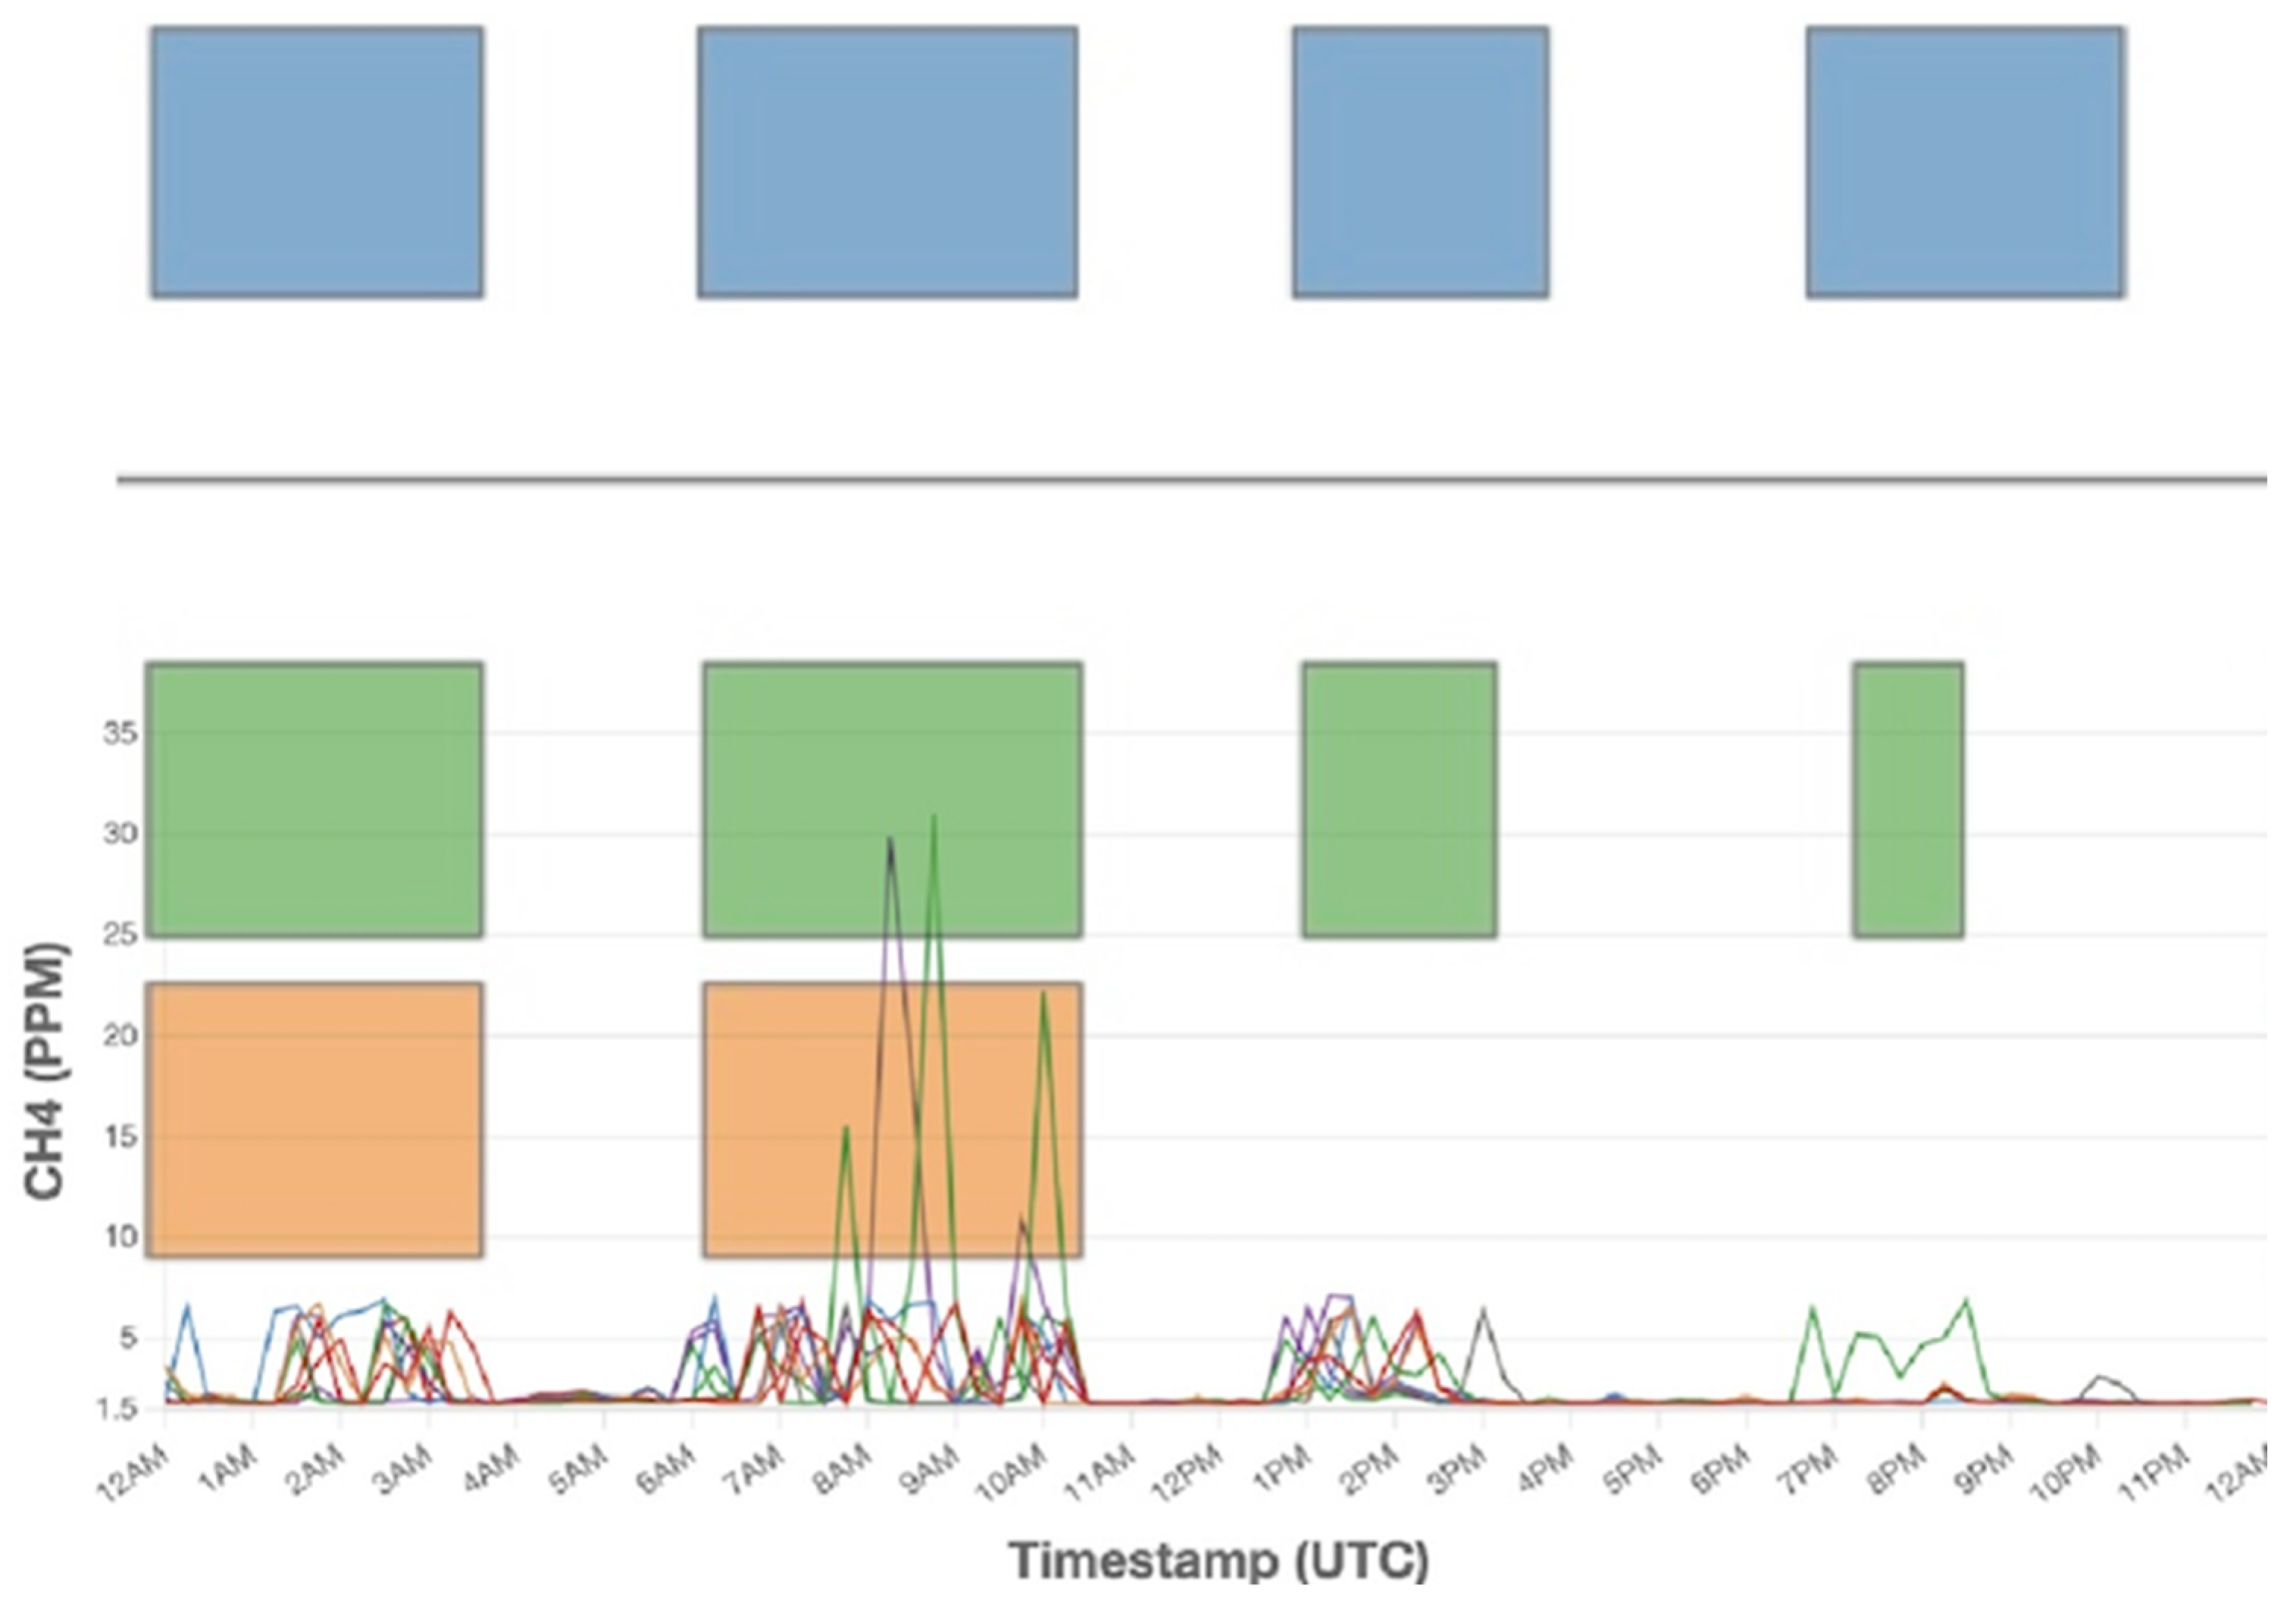
Figure 6.
Comparison of ADED release periods (top half of the graph) with BluBird-reported release detections (bottom half of the graph) for 19 Feb.–21 Feb. 2024 (UTC). The organization and color coding are as in Figure 4. The labels on each bar are METEC’s reported gas release rates (g/h) or, for the BluBird reports, the estimated emission rates.
Figure 6.
Comparison of ADED release periods (top half of the graph) with BluBird-reported release detections (bottom half of the graph) for 19 Feb.–21 Feb. 2024 (UTC). The organization and color coding are as in Figure 4. The labels on each bar are METEC’s reported gas release rates (g/h) or, for the BluBird reports, the estimated emission rates.
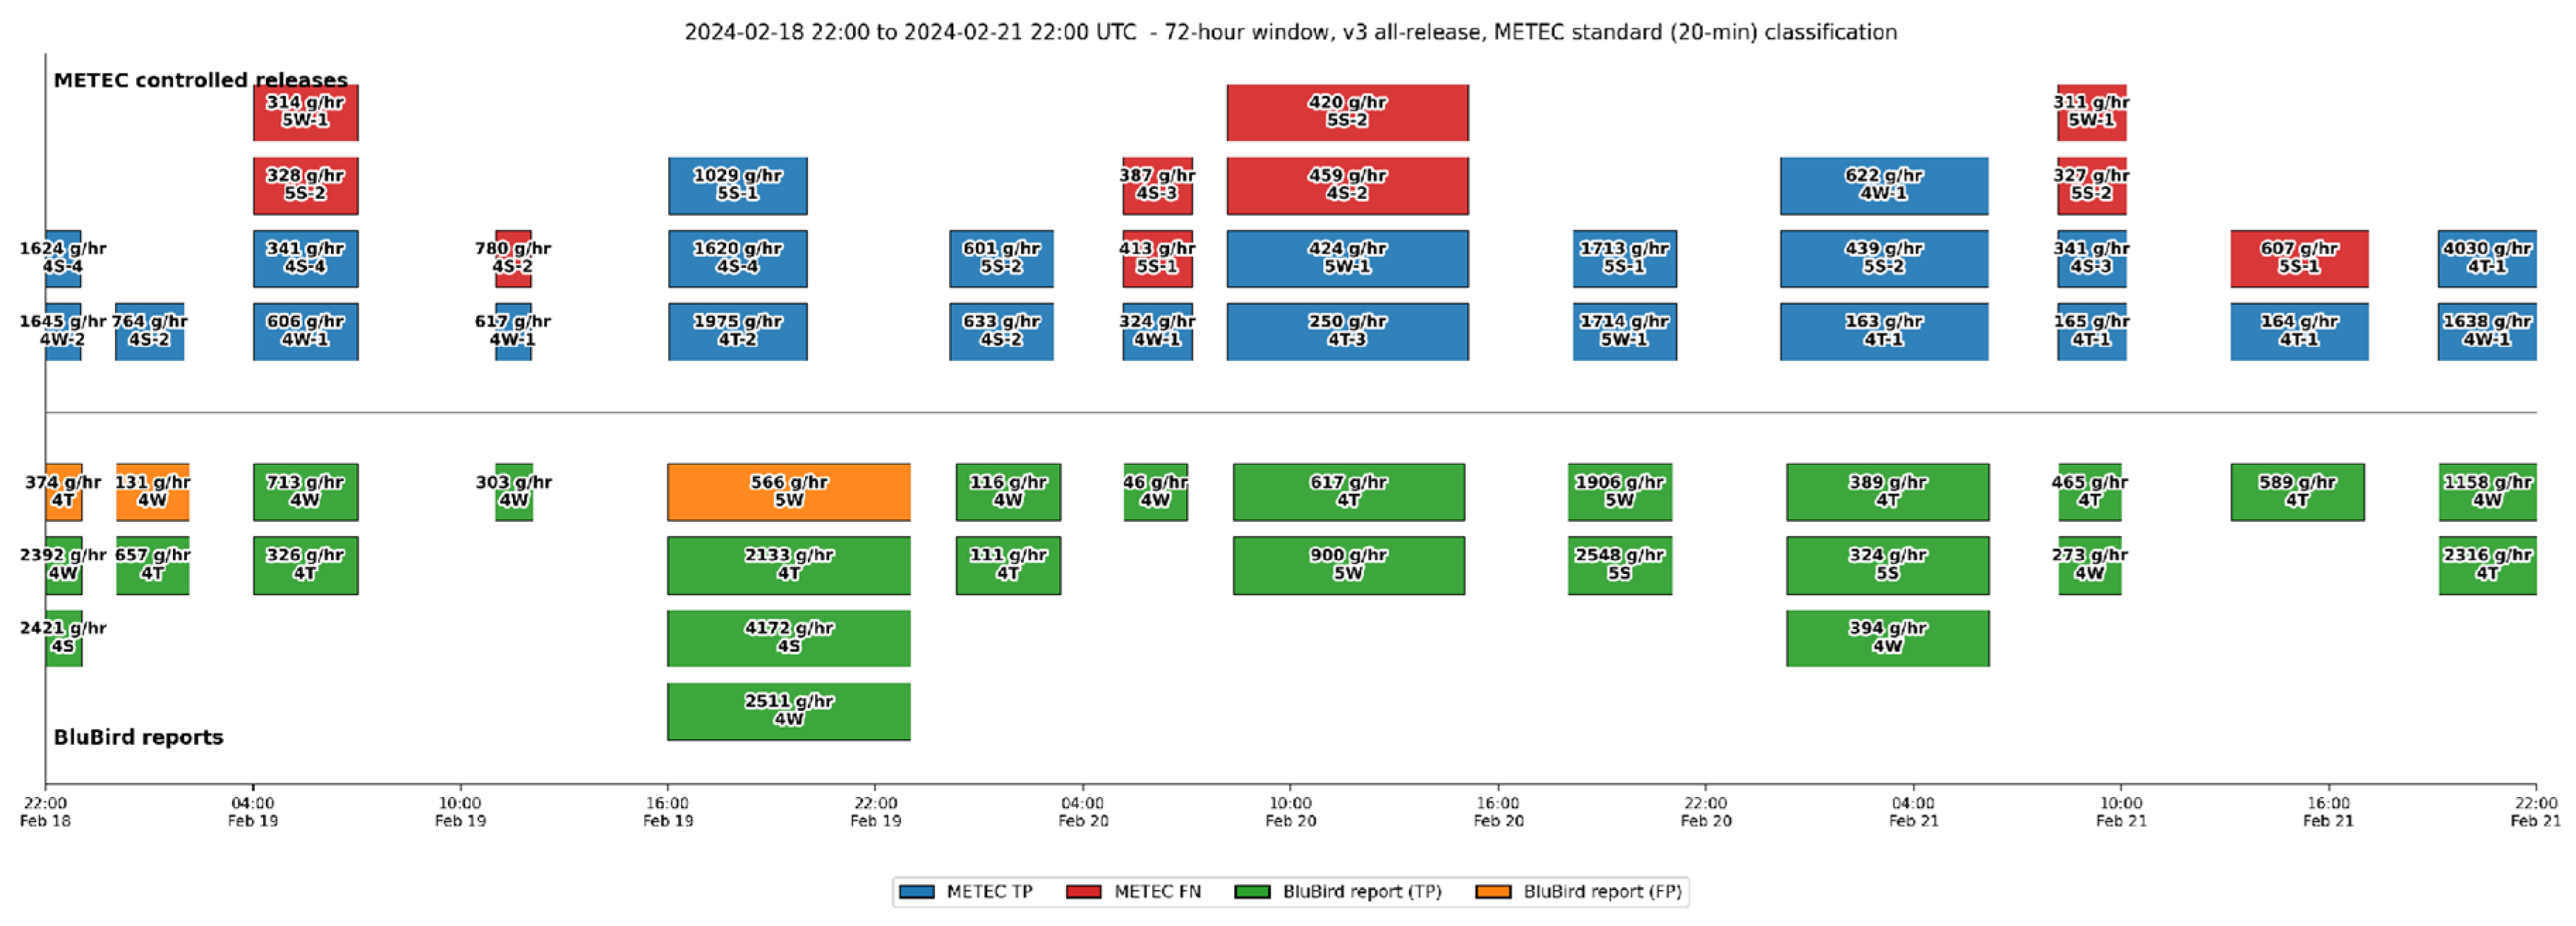
Figure 7.
Comparison of ADED release periods with BluBird-reported release detections for 24 April–26 2024.
Figure 7.
Comparison of ADED release periods with BluBird-reported release detections for 24 April–26 2024.
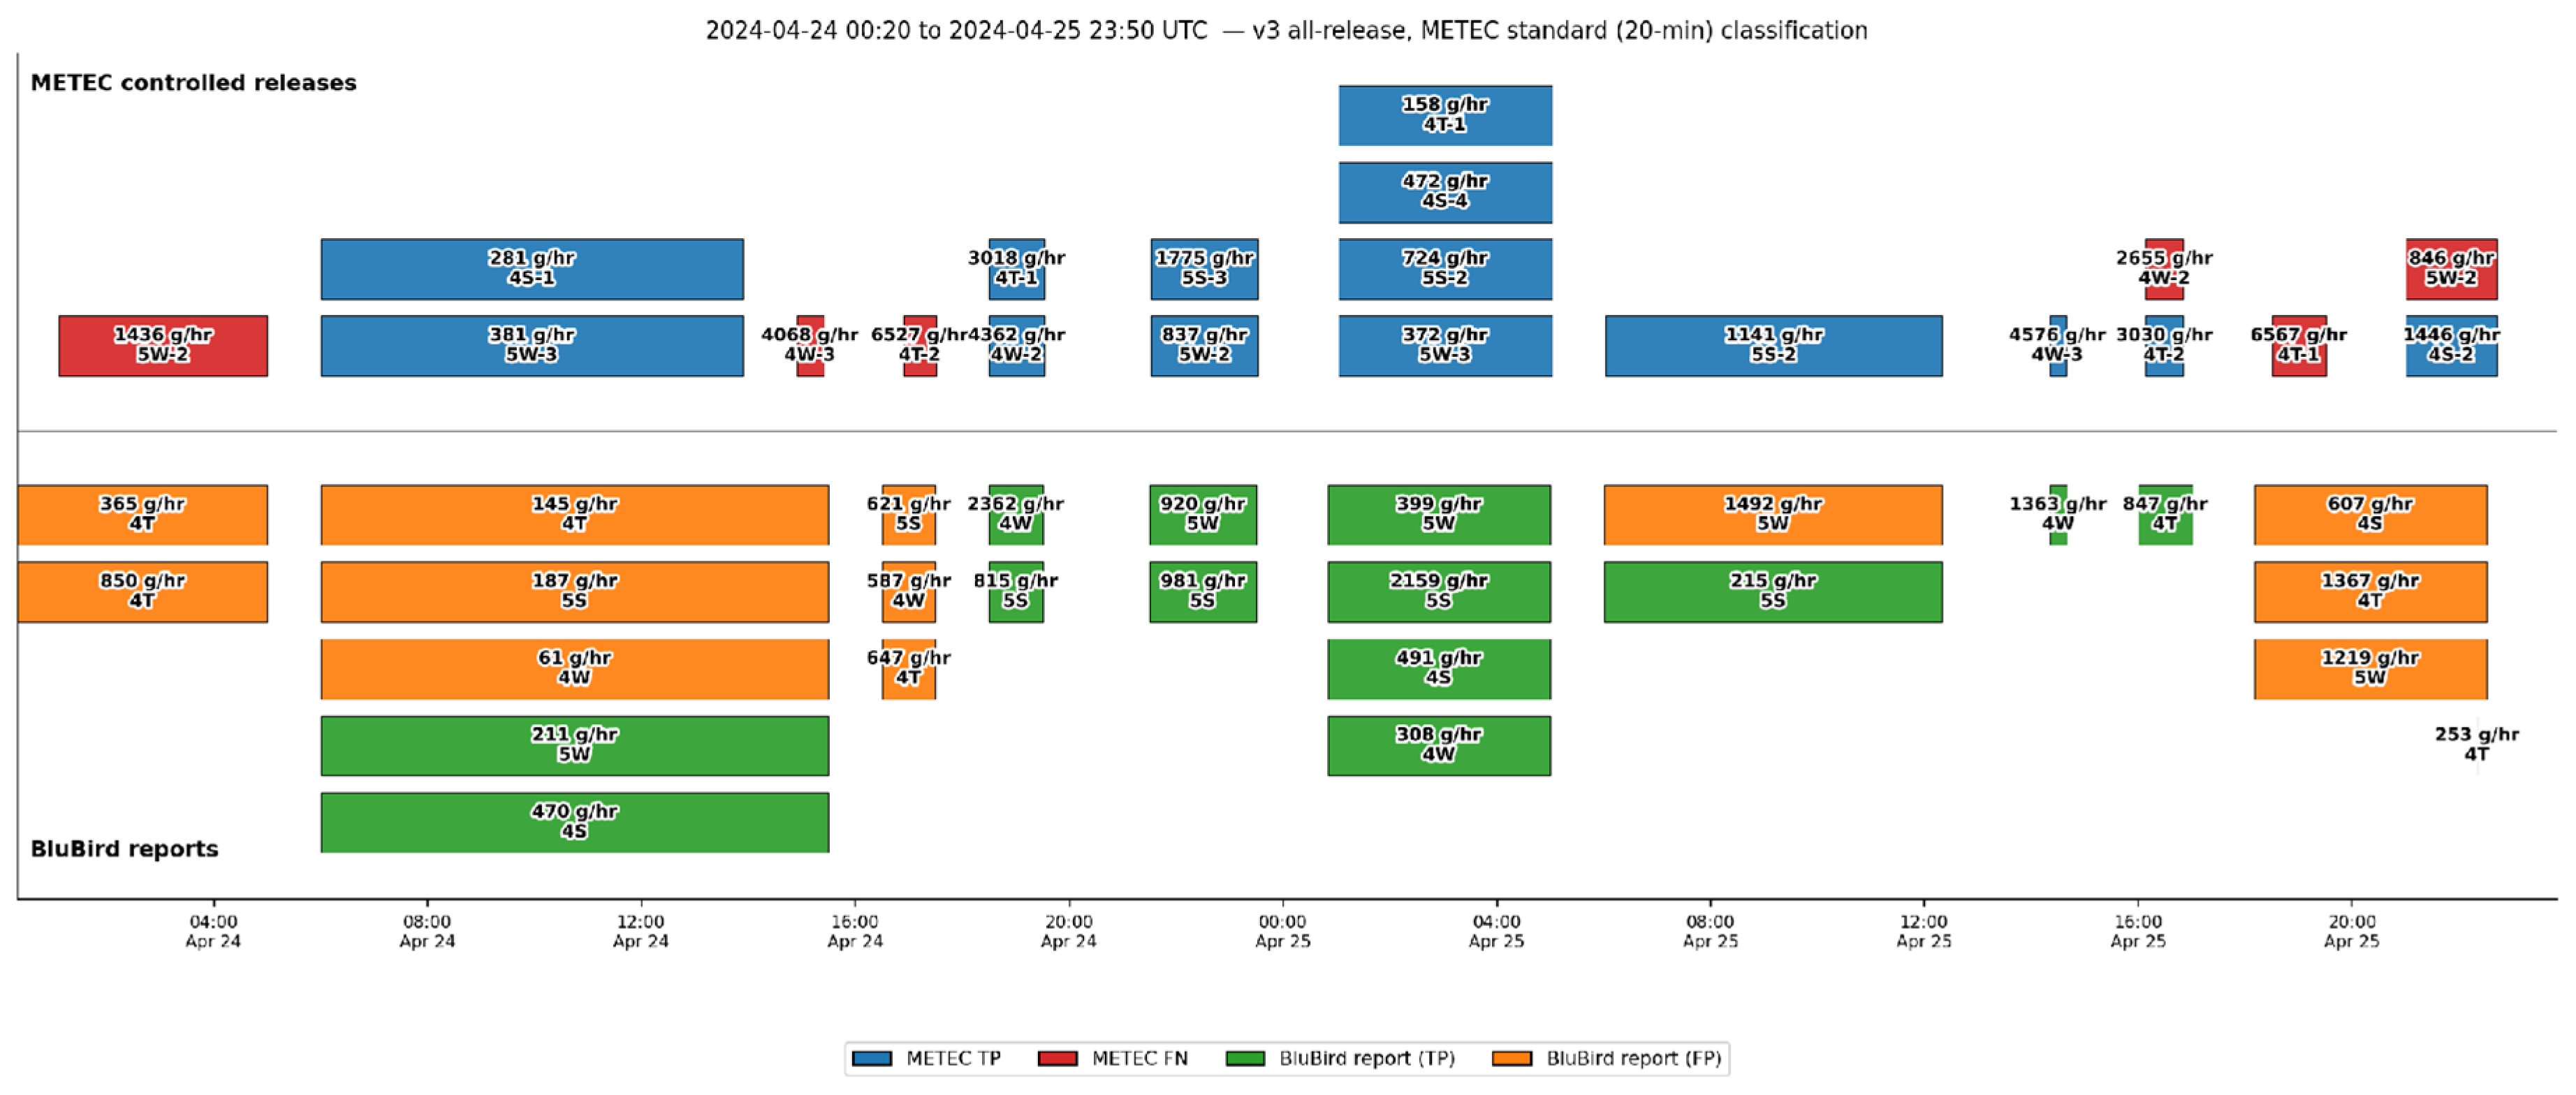
Figure 8.
Overlap time series for 12 Feb.–15 Feb., showing examples of report rejections due to start times less than one minute earlier than METEC’s start-time threshold.
Figure 8.
Overlap time series for 12 Feb.–15 Feb., showing examples of report rejections due to start times less than one minute earlier than METEC’s start-time threshold.
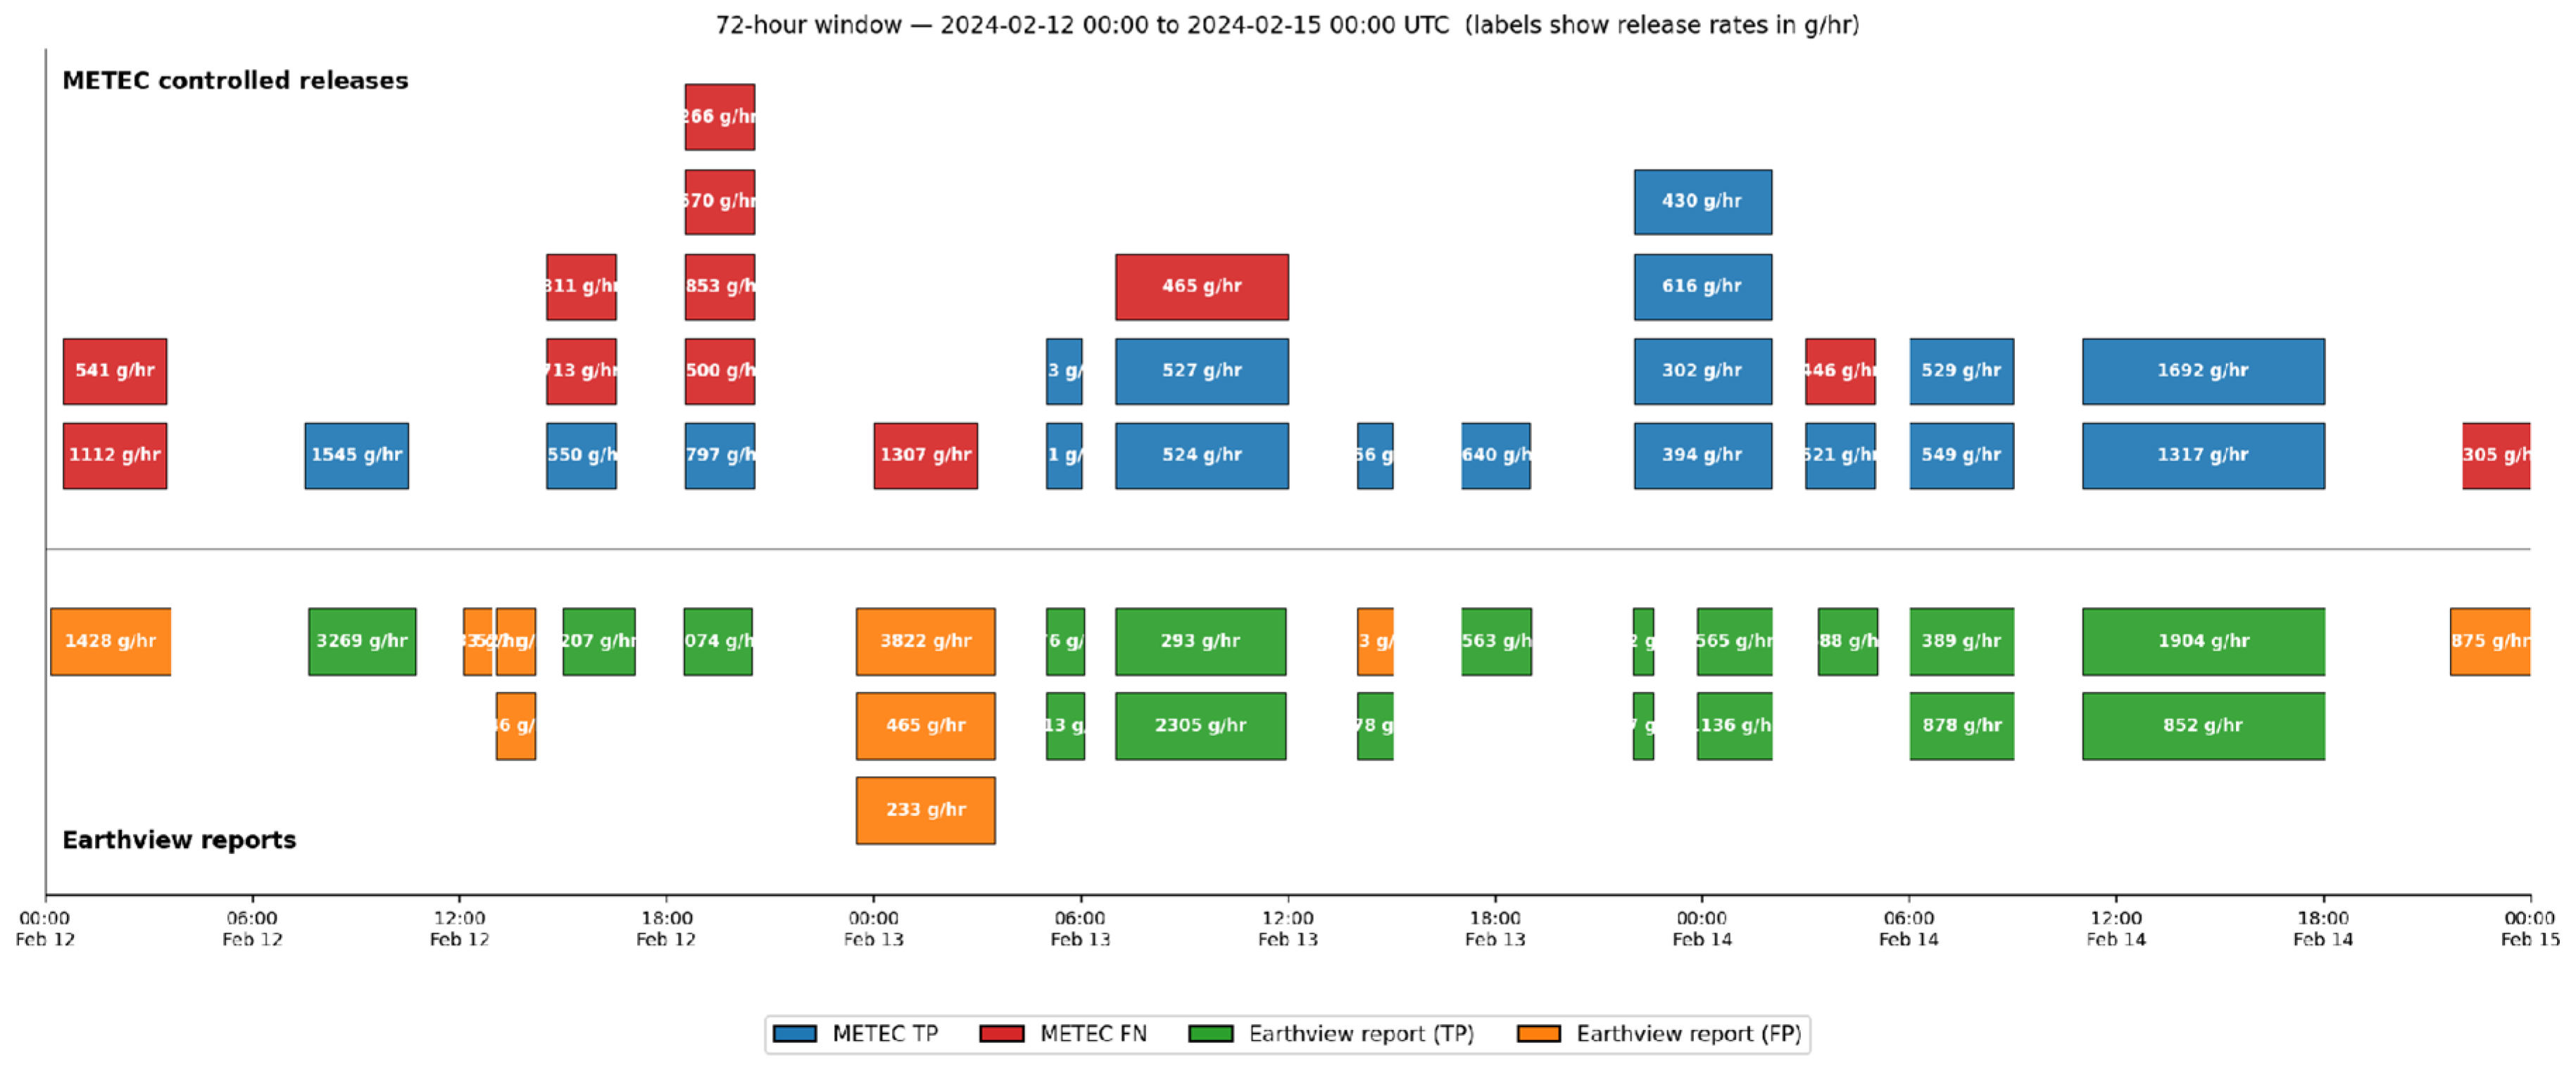
Figure 9.
Detection percentage versus emission release rate bins for ADED 2024 using the standard METEC grading (20-minute start-time threshold). All-release results (left panel) and per-experiment (at least one release detected) results (right panel).
Figure 9.
Detection percentage versus emission release rate bins for ADED 2024 using the standard METEC grading (20-minute start-time threshold). All-release results (left panel) and per-experiment (at least one release detected) results (right panel).
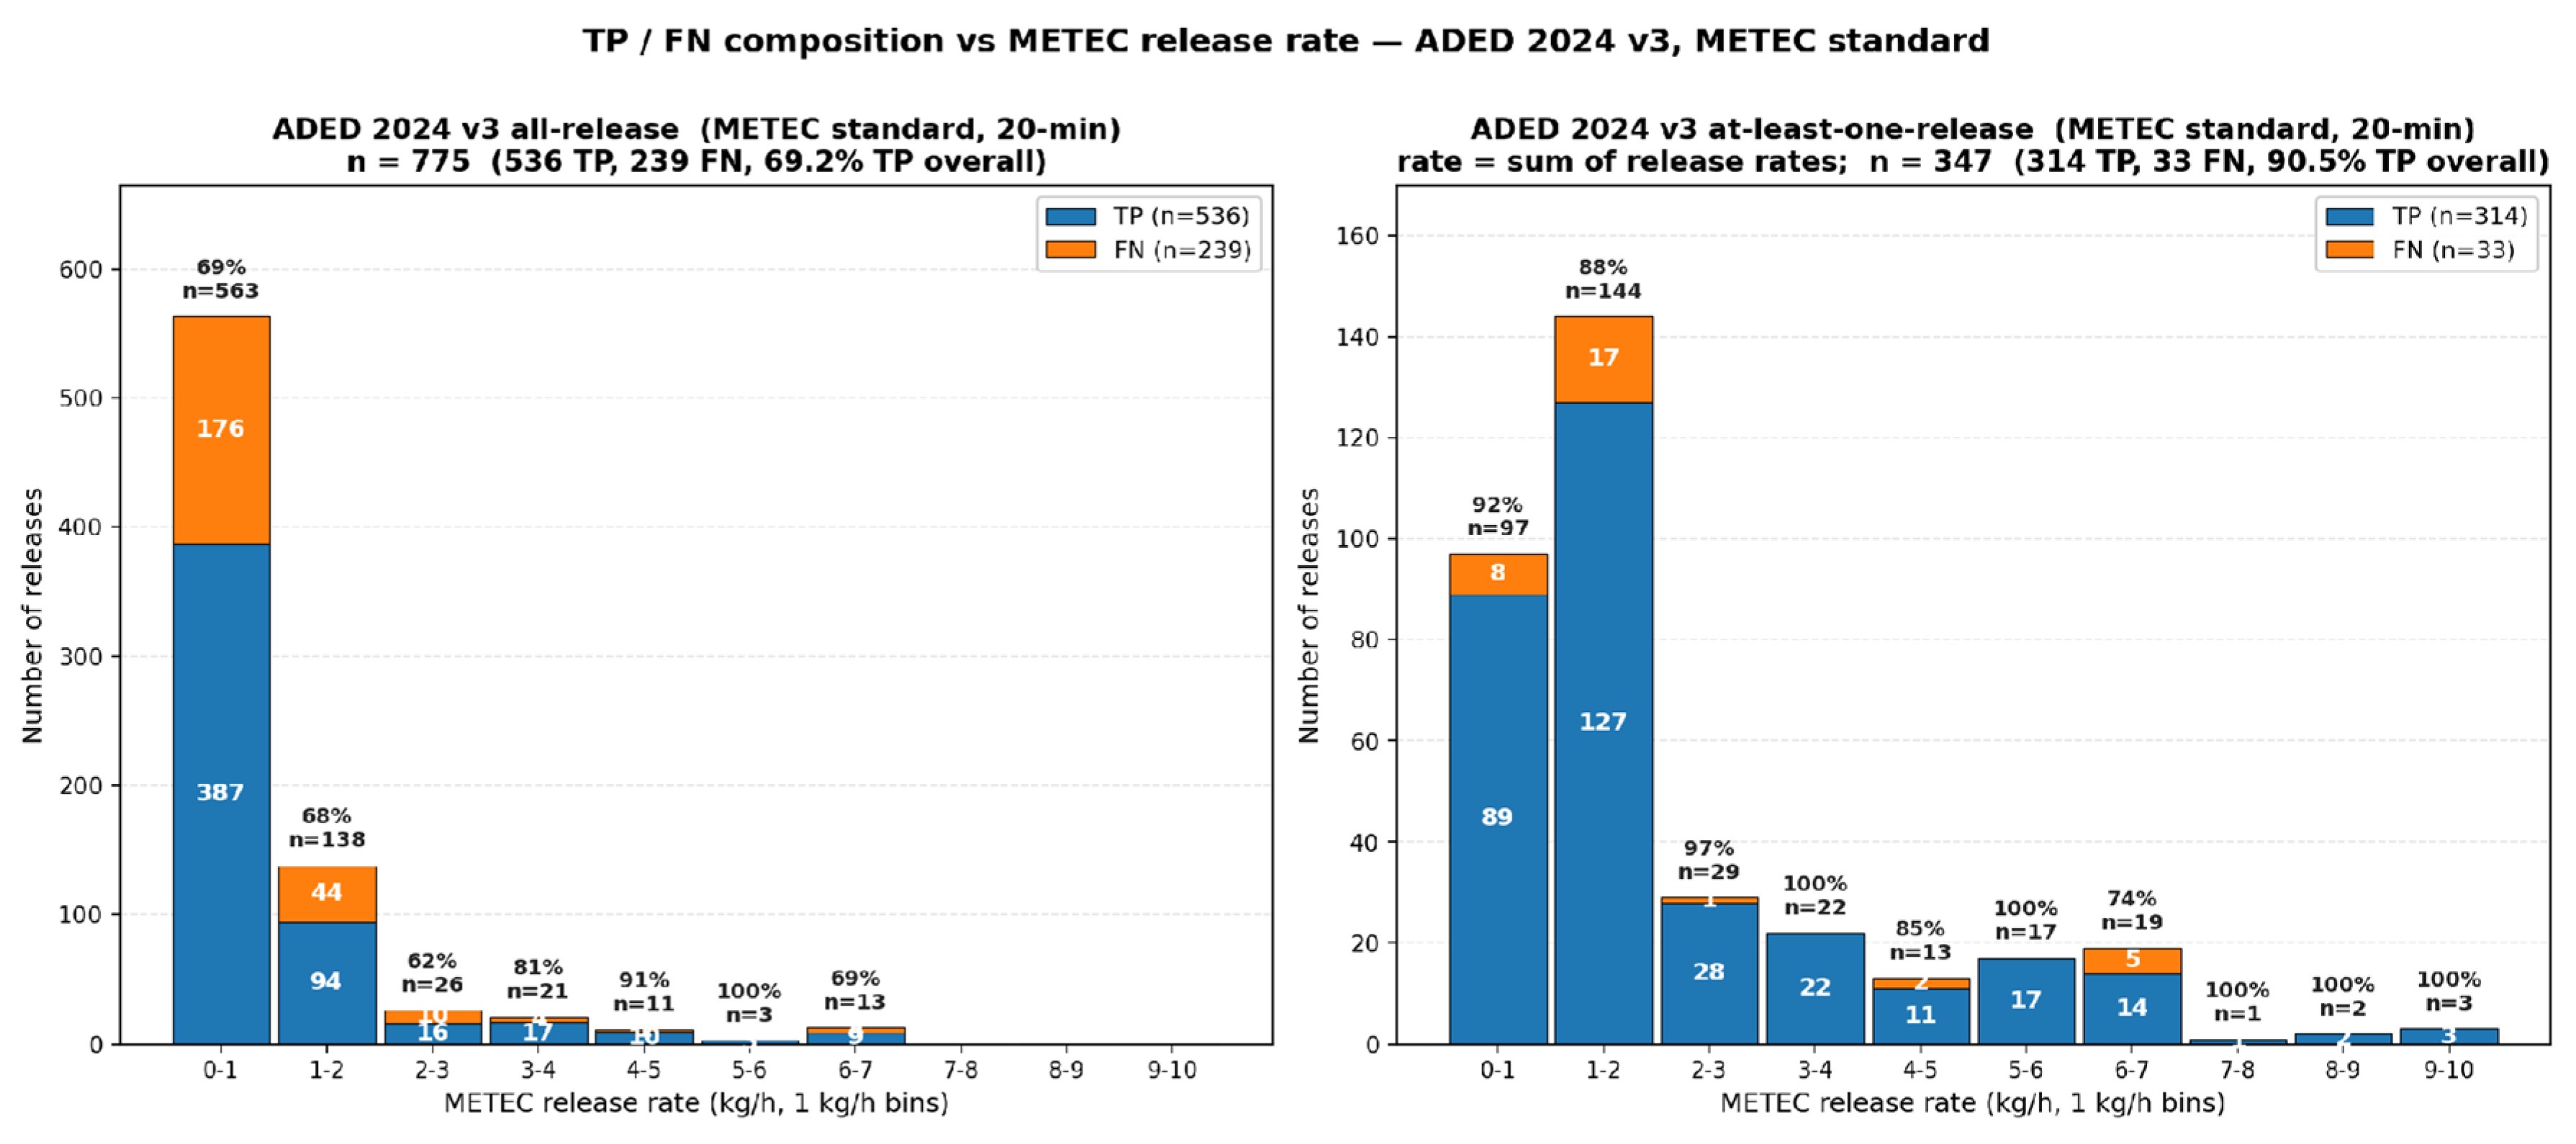
Figure 10.
Detection percentage versus emission release rate bins for ADED 2024 results using the 75% overlap classification criterion. All-release results (left panel) and per-experiment (at least one release detected) results (right panel).
Figure 10.
Detection percentage versus emission release rate bins for ADED 2024 results using the 75% overlap classification criterion. All-release results (left panel) and per-experiment (at least one release detected) results (right panel).
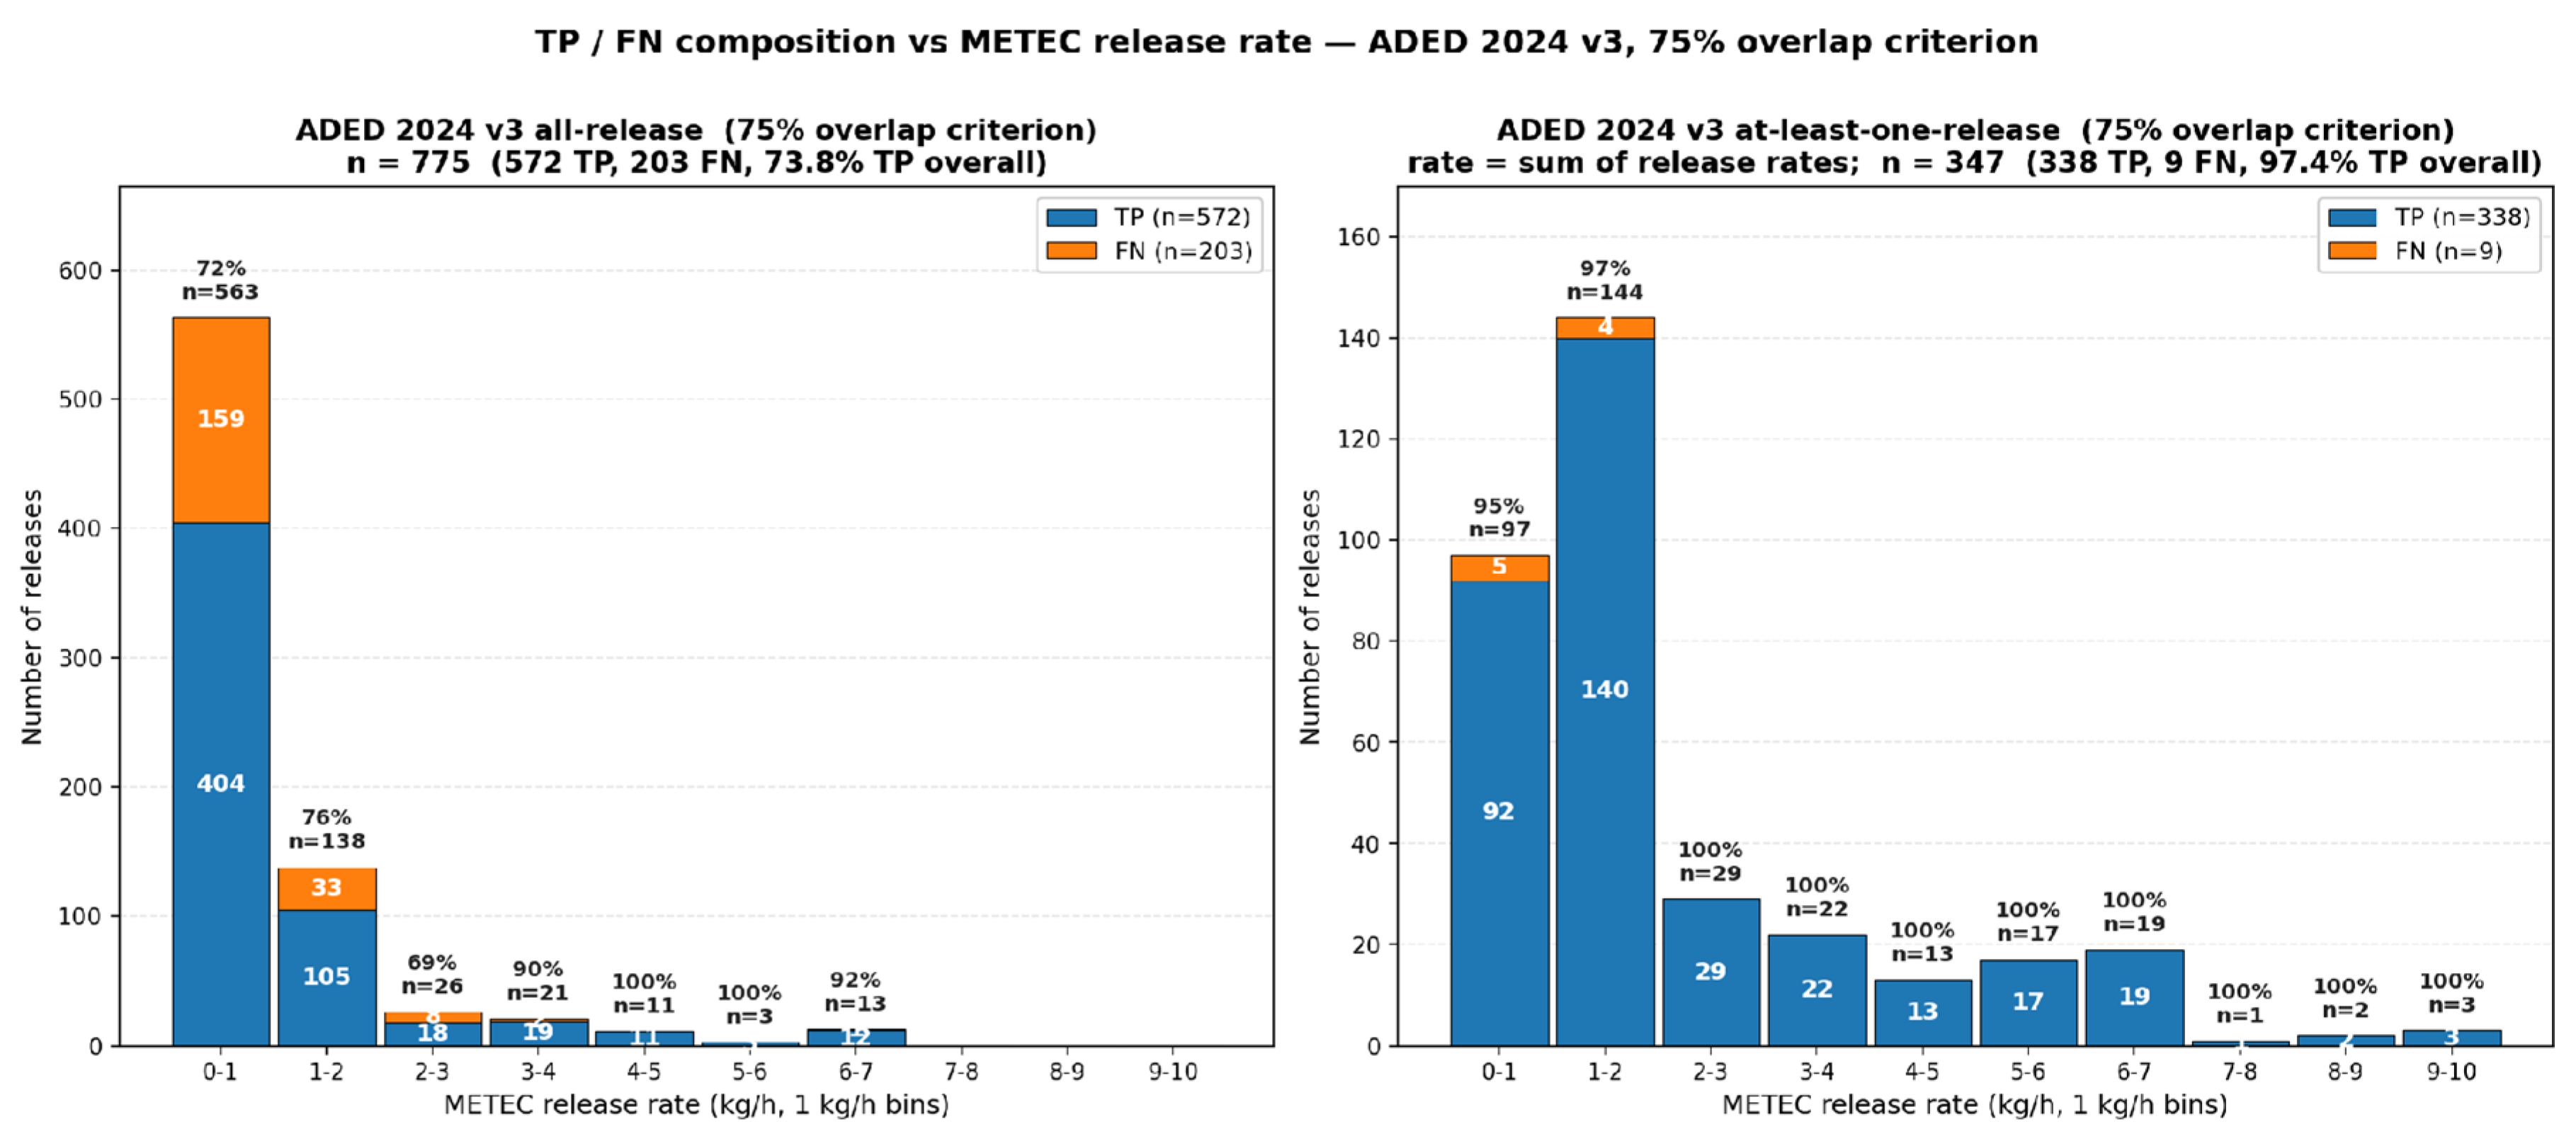
Figure 11.
Per-experiment detection percentage versus emission release rate bins for ADED 2022 (left panel) and ADED 2024 (right panel) using the standard METEC grading (20-minute start-time threshold).
Figure 11.
Per-experiment detection percentage versus emission release rate bins for ADED 2022 (left panel) and ADED 2024 (right panel) using the standard METEC grading (20-minute start-time threshold).
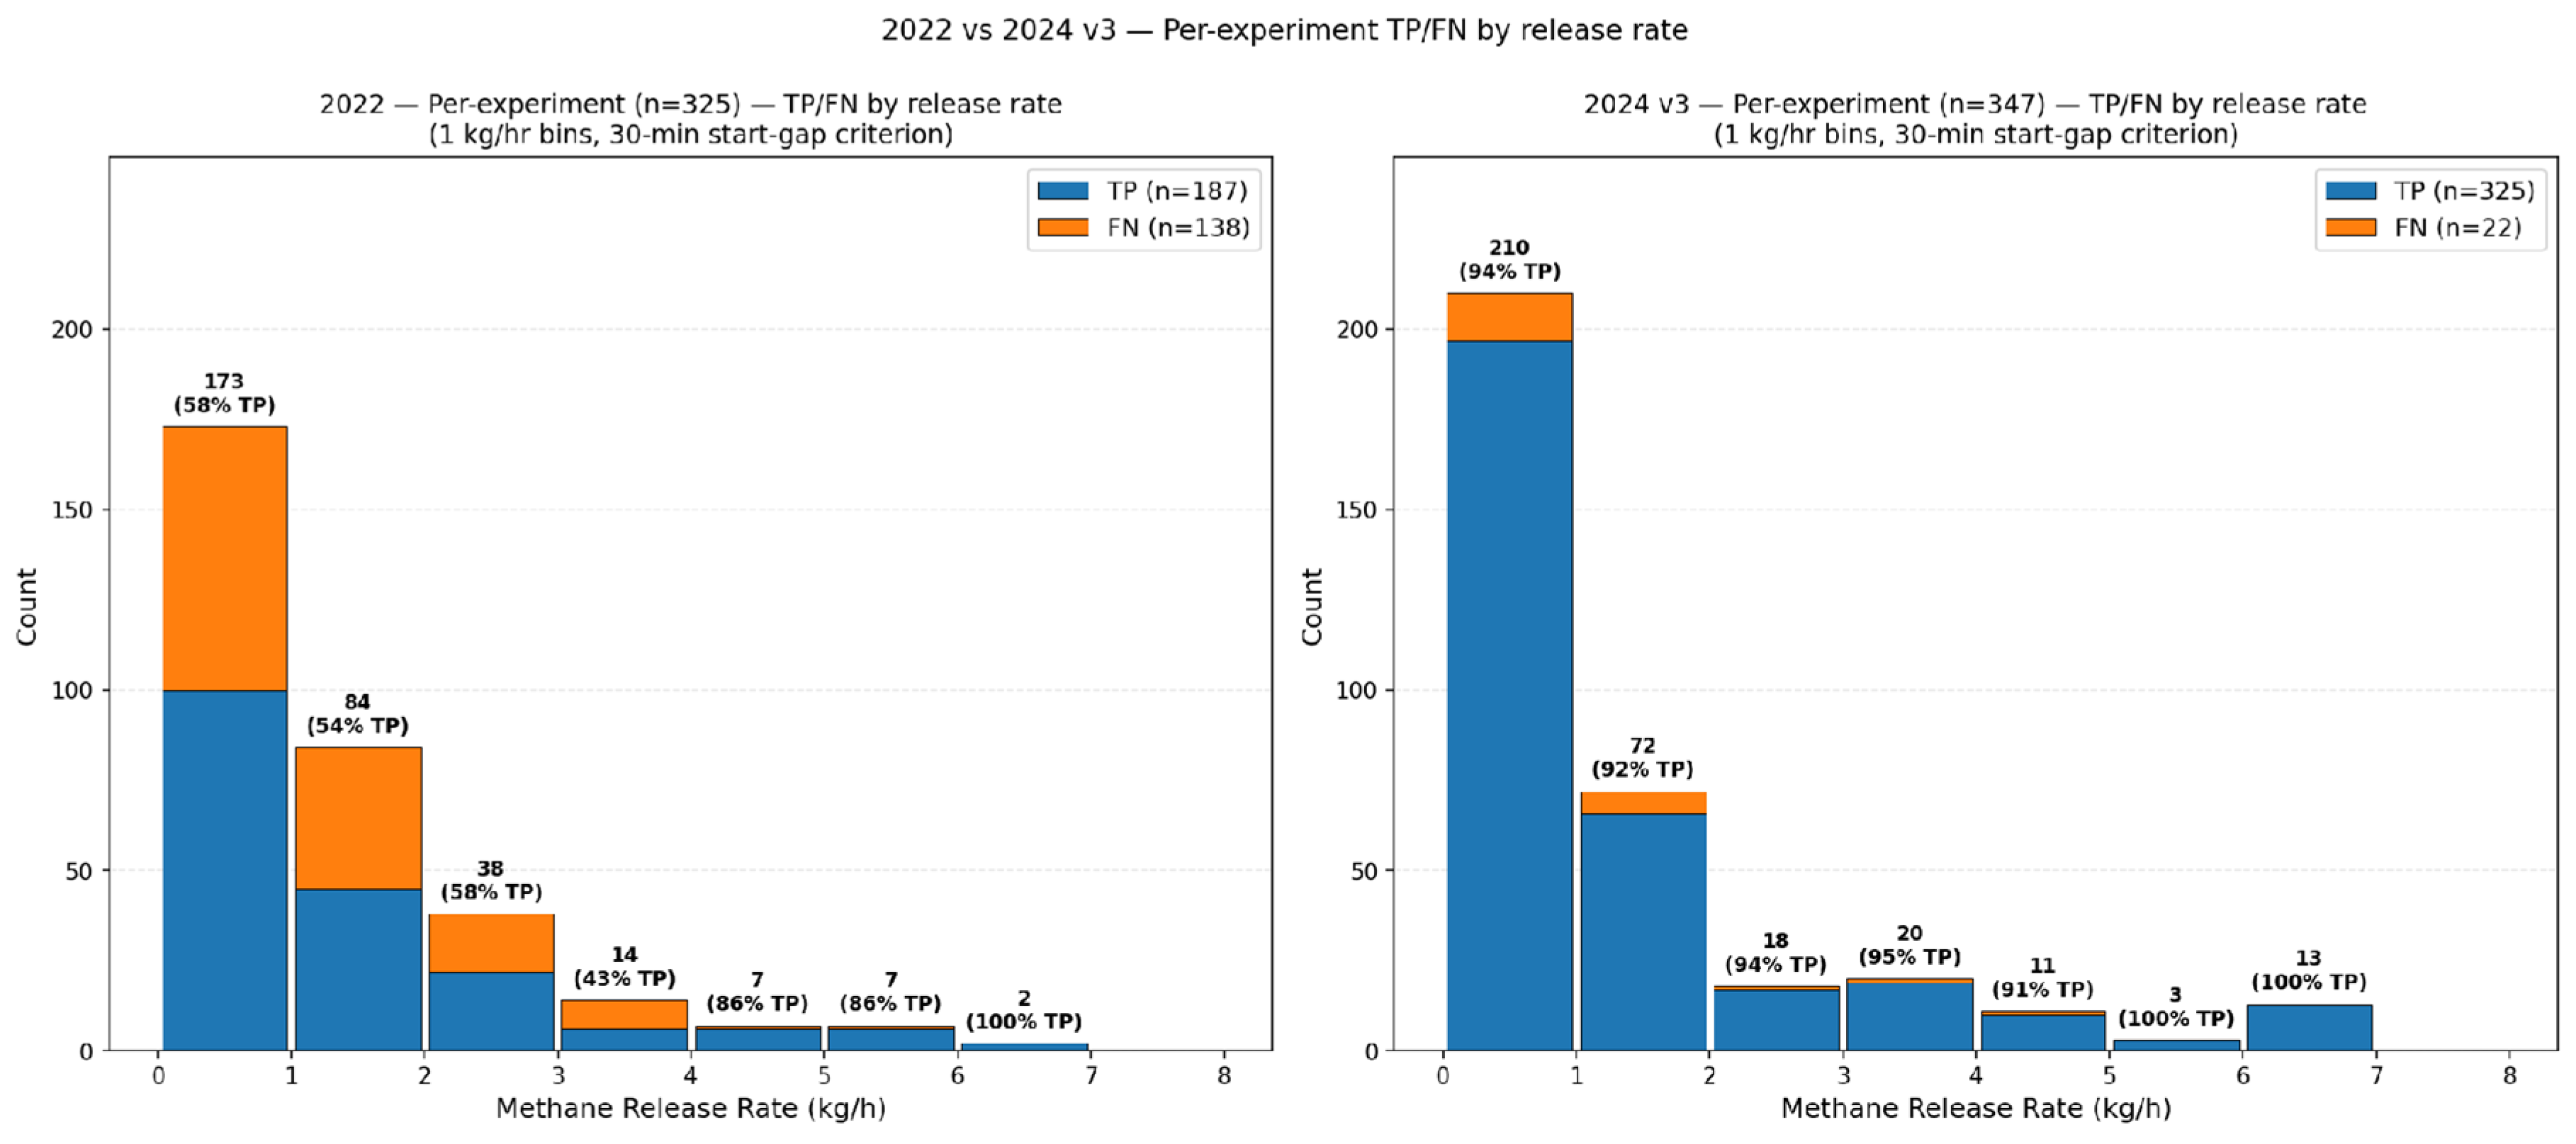
Figure 12.
True positive (TP) and false negative (FN) assignments plotted as a function of release duration (hours) and methane release rate (kg/h) for the ADED 2022 (left panel) and ADED 2024 (right panel) per-experiment subsets. The adjacent histograms show TP and FN counts for duration and release rates.
Figure 12.
True positive (TP) and false negative (FN) assignments plotted as a function of release duration (hours) and methane release rate (kg/h) for the ADED 2022 (left panel) and ADED 2024 (right panel) per-experiment subsets. The adjacent histograms show TP and FN counts for duration and release rates.
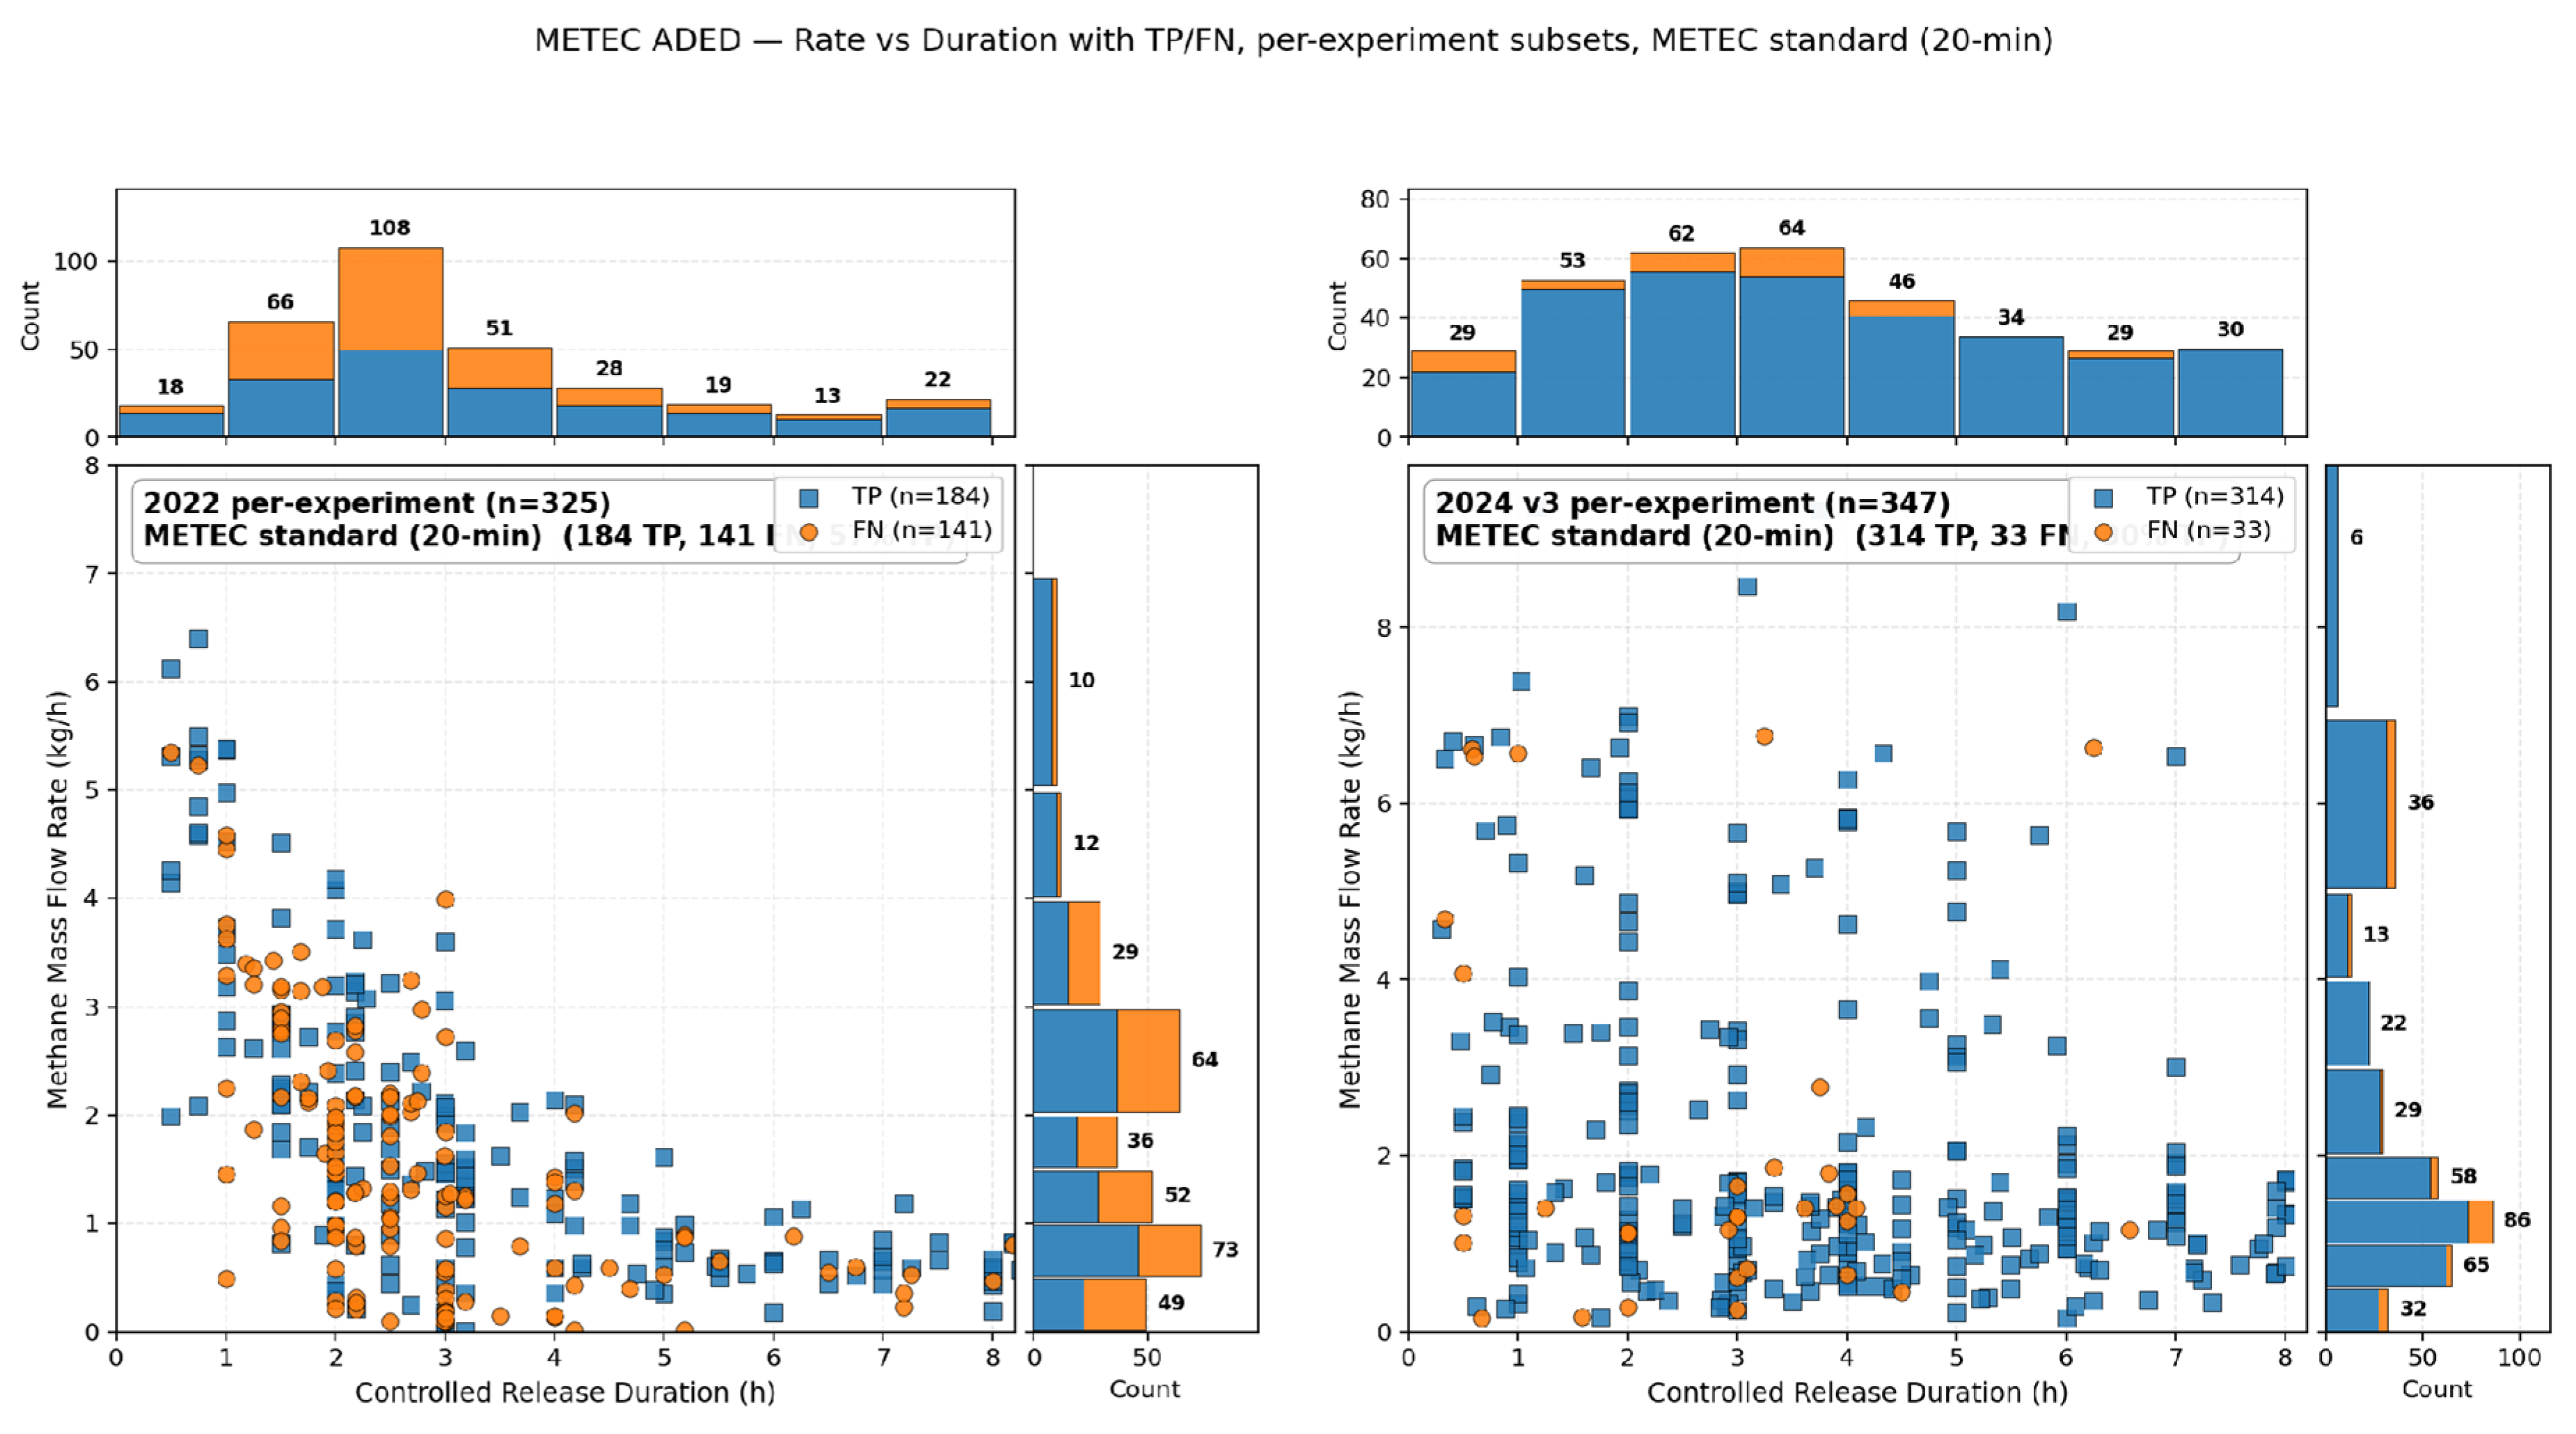
Figure 13.
True positive (TP) and false negative (FN) assignments plotted for release duration (hours) and methane release rate (kg/h) for the ADED 2024 all-releases subset (left panel) and per-experiment subset (right panel). The adjacent histograms show TP and FN counts for respective x and y axes.
Figure 13.
True positive (TP) and false negative (FN) assignments plotted for release duration (hours) and methane release rate (kg/h) for the ADED 2024 all-releases subset (left panel) and per-experiment subset (right panel). The adjacent histograms show TP and FN counts for respective x and y axes.
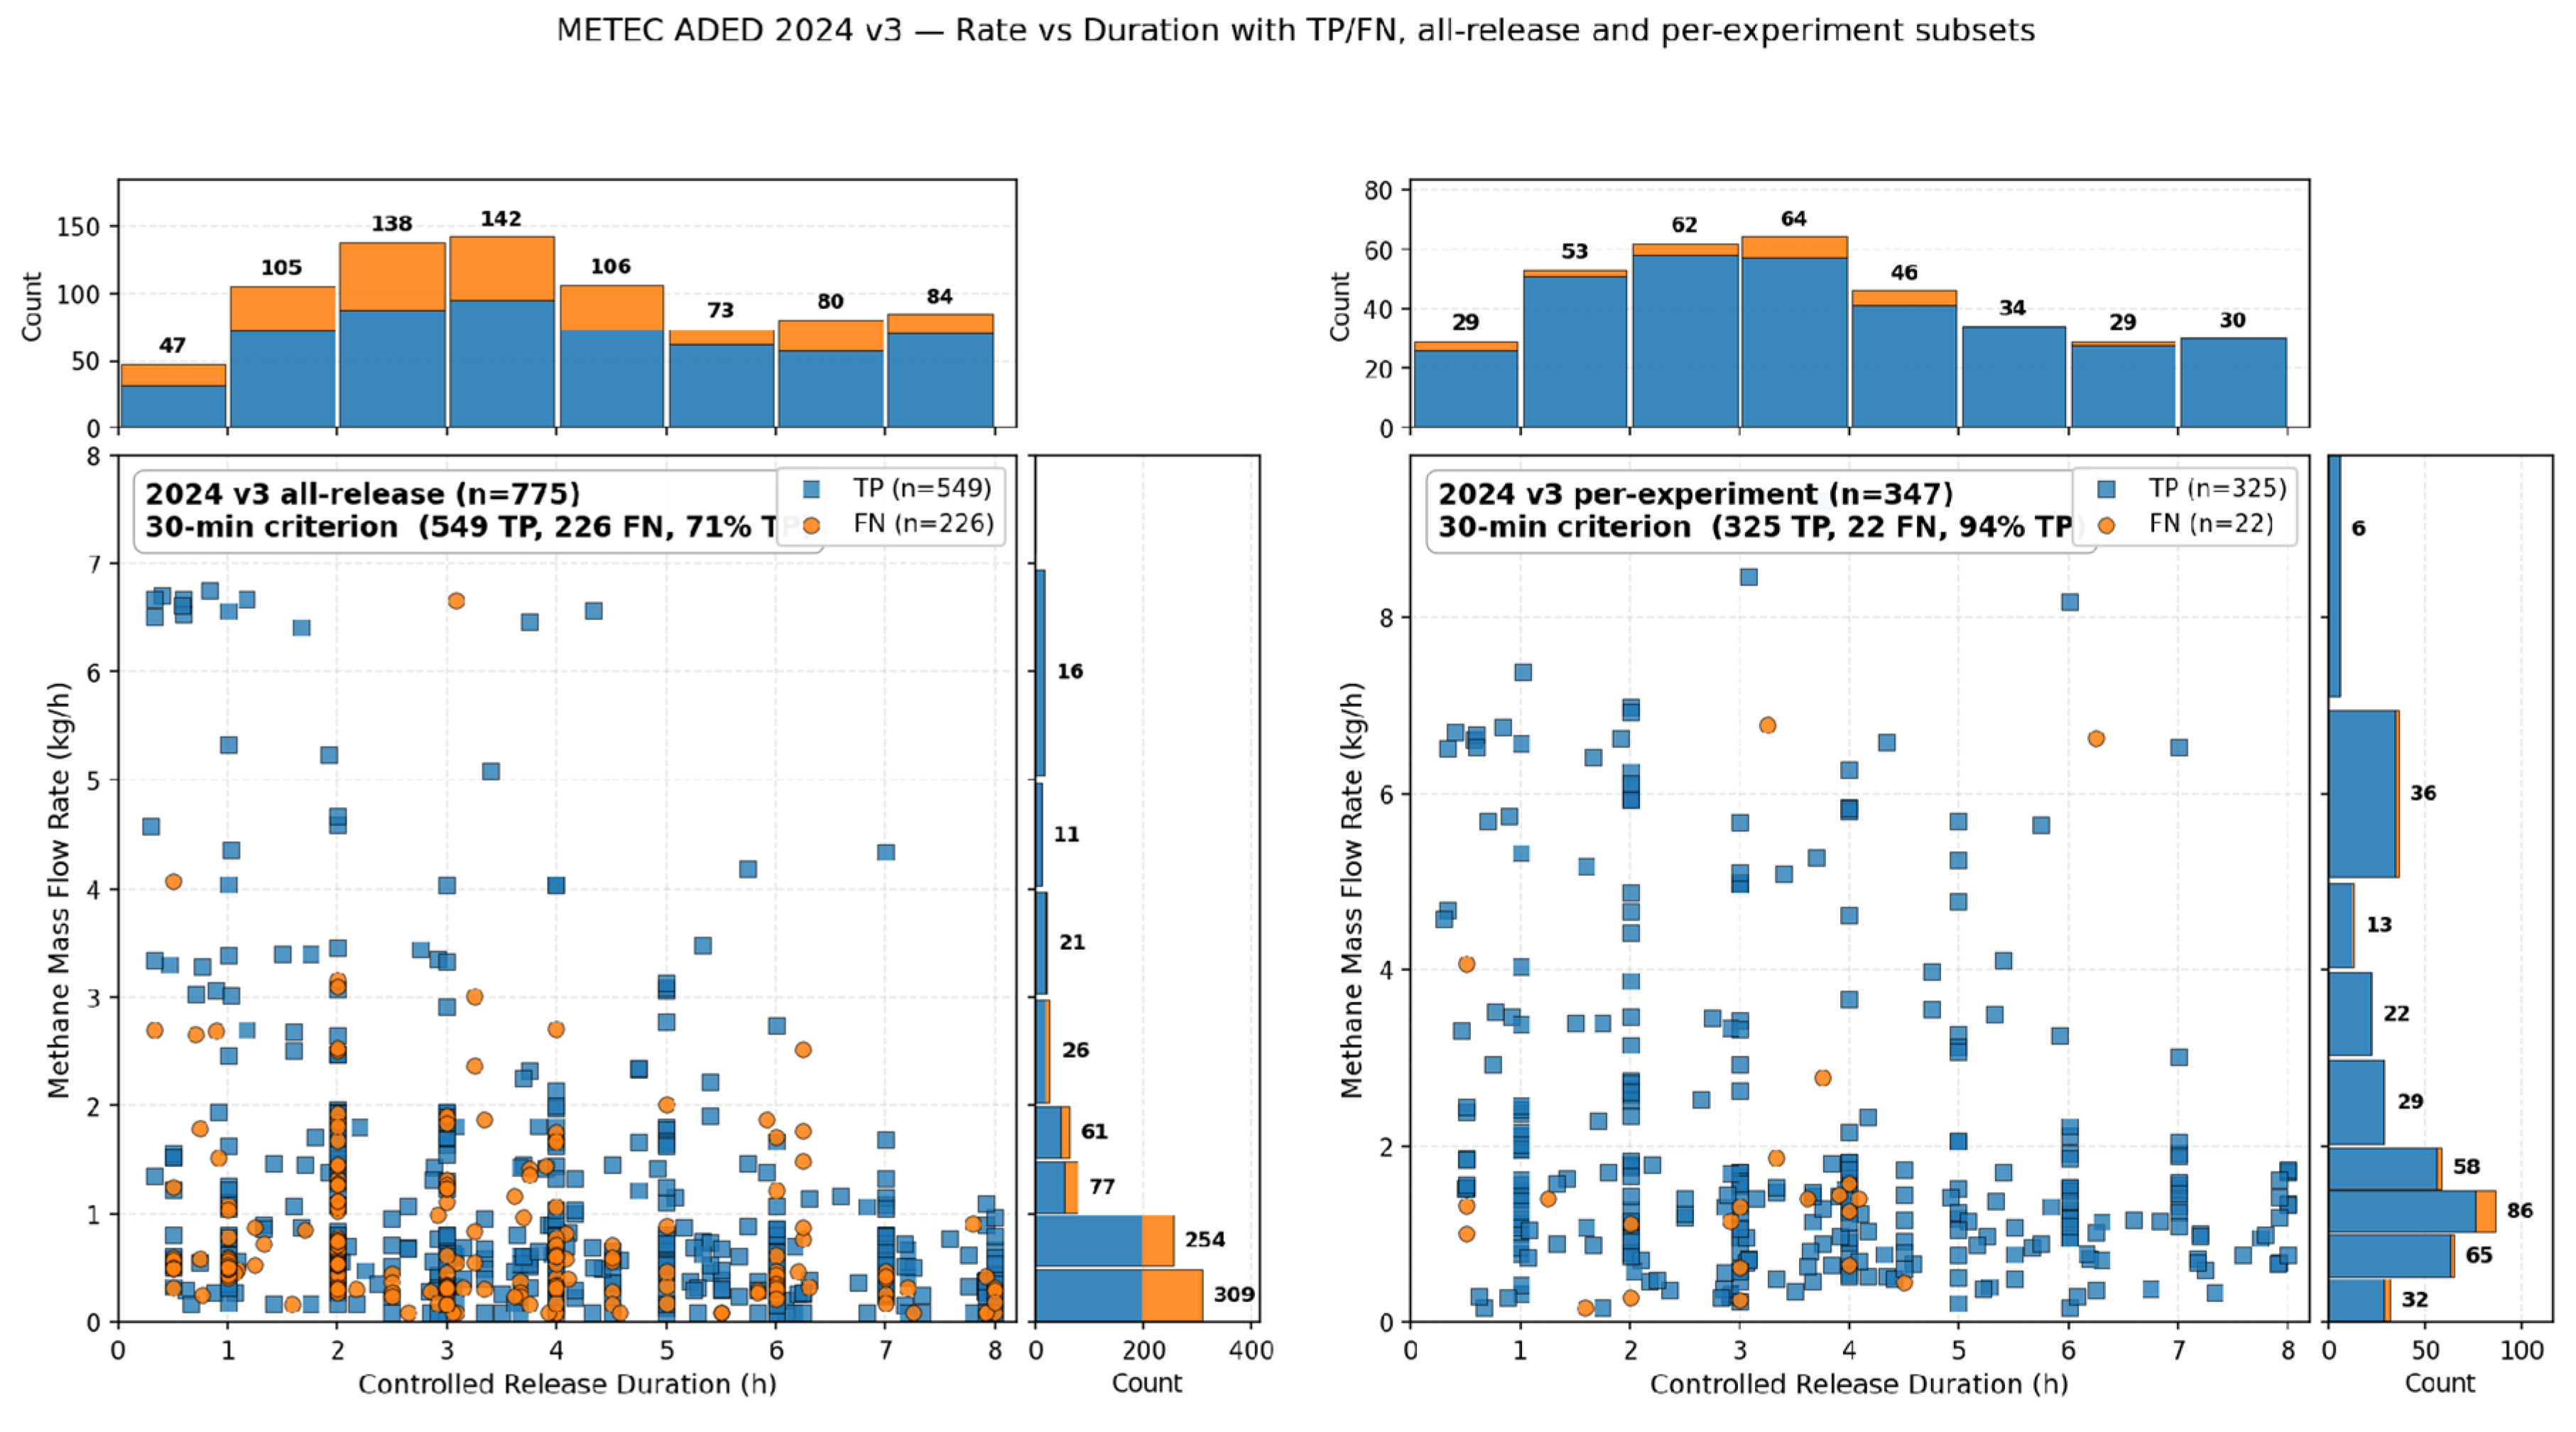
Figure 14.
BluBird PoD as a function of release rate for the per-experiment subset, for which any release detected results in a detected experiment (i.e., a TP). Curves show the multivariate logistic fit under the three classification criteria for 2024 (METEC standard, 30-minute, and 75% overlap). Ninety percent PoD release-rate values are marked at each curve’s intersection with the “PoD = 0.90” reference line. Note that the x axis is on a log scale.
Figure 14.
BluBird PoD as a function of release rate for the per-experiment subset, for which any release detected results in a detected experiment (i.e., a TP). Curves show the multivariate logistic fit under the three classification criteria for 2024 (METEC standard, 30-minute, and 75% overlap). Ninety percent PoD release-rate values are marked at each curve’s intersection with the “PoD = 0.90” reference line. Note that the x axis is on a log scale.
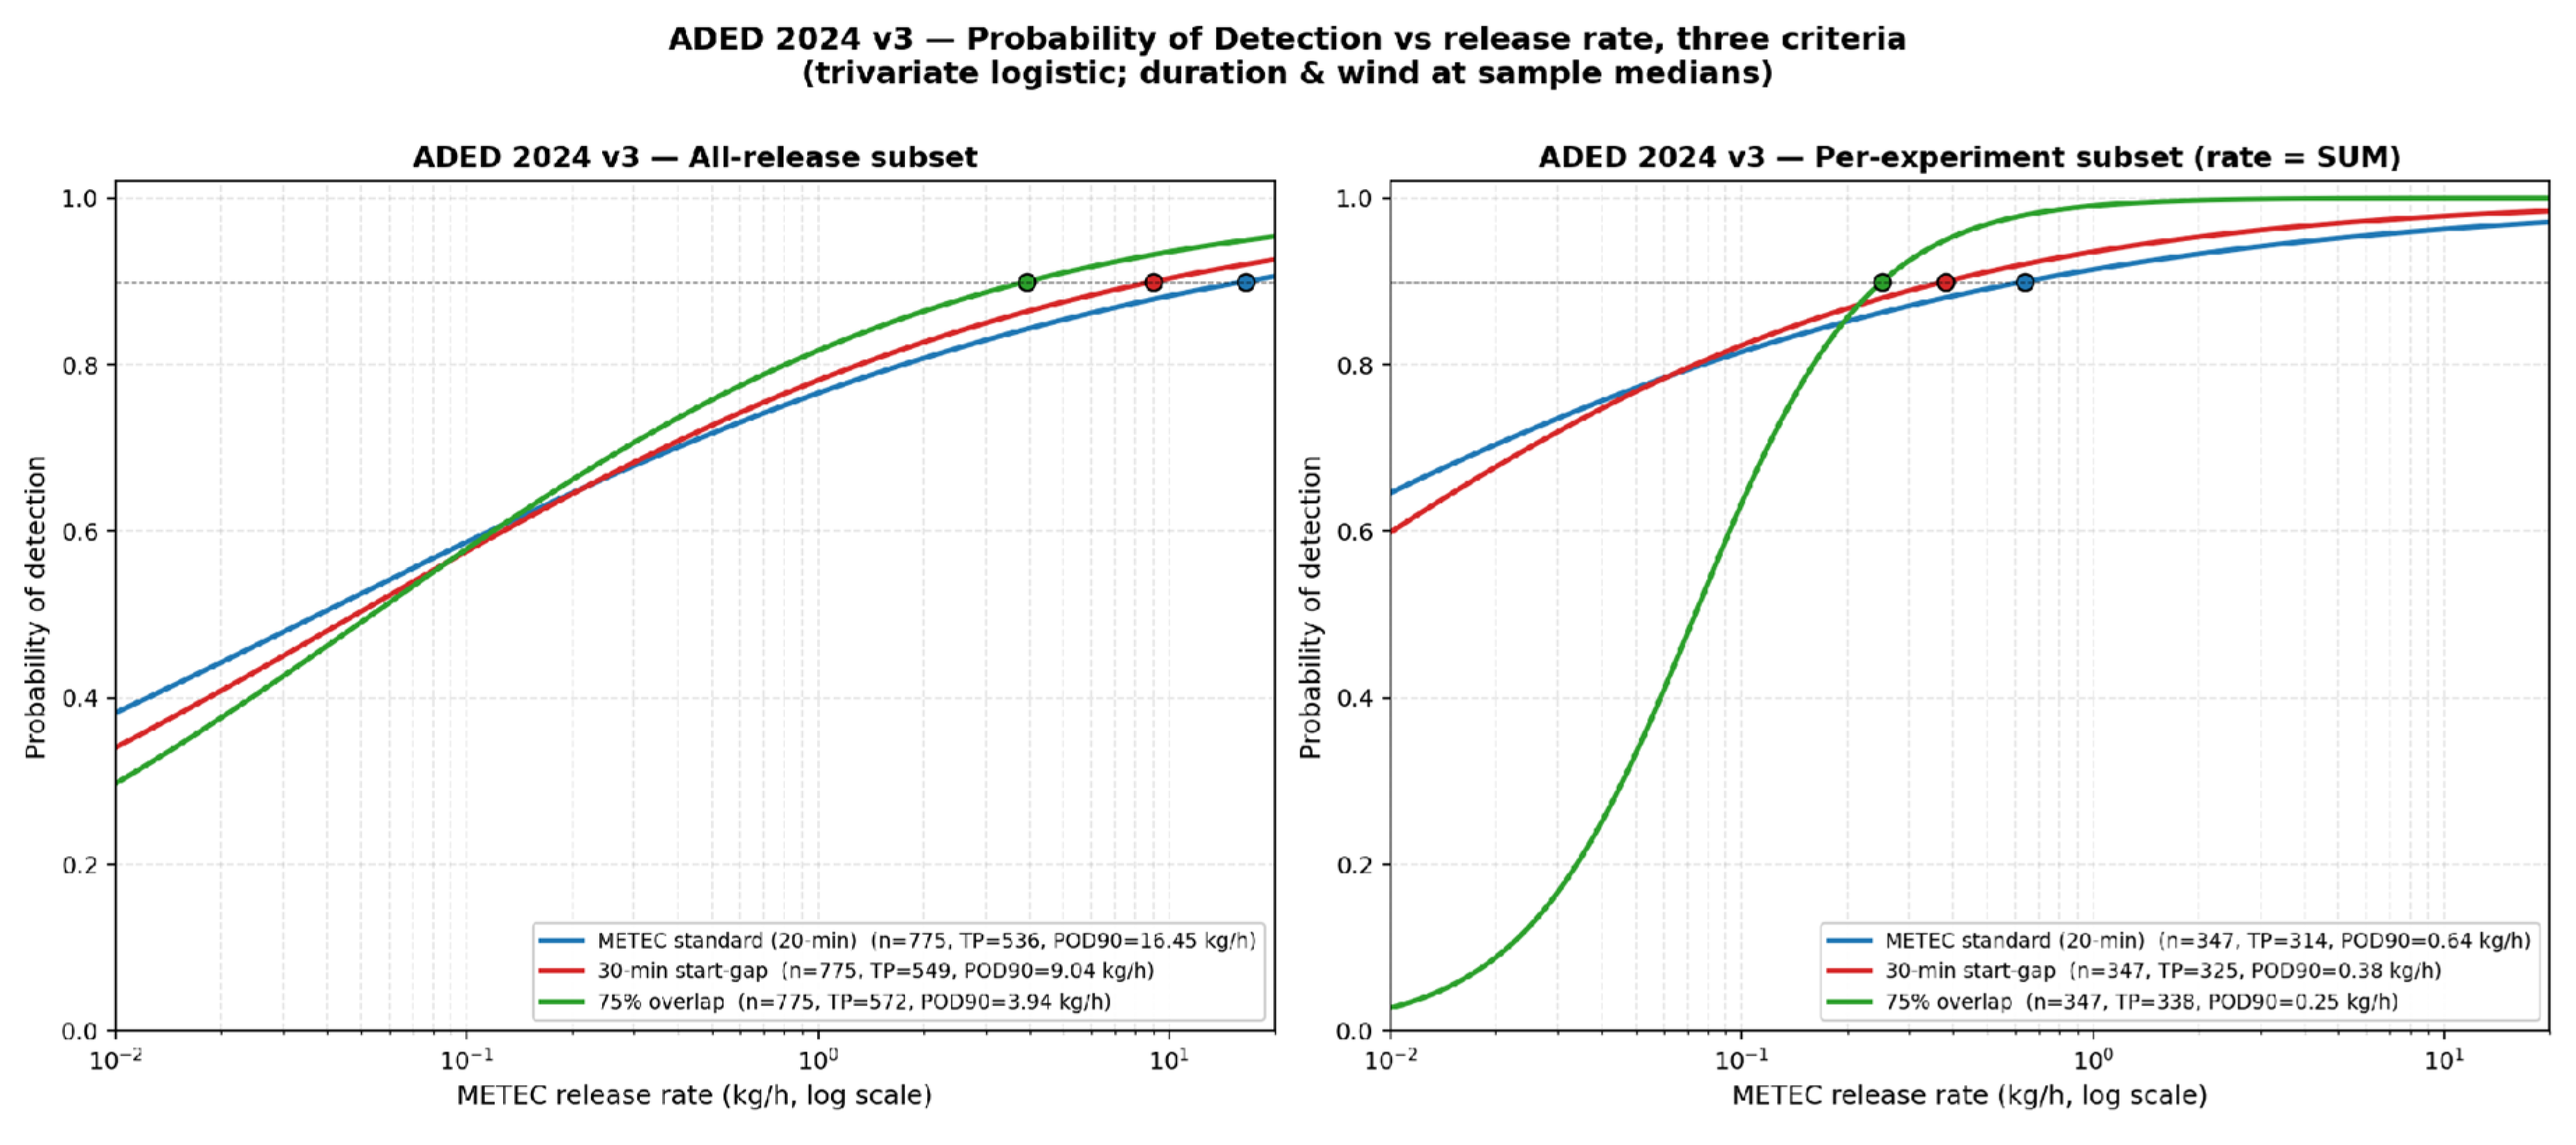
Figure 15.
BluBird PoD as a function of the total mass of methane emitted per experiment. Curves show the univariate logistic fit versus total mass, along with multivariate fits of mass with wind speed.
Figure 15.
BluBird PoD as a function of the total mass of methane emitted per experiment. Curves show the univariate logistic fit versus total mass, along with multivariate fits of mass with wind speed.
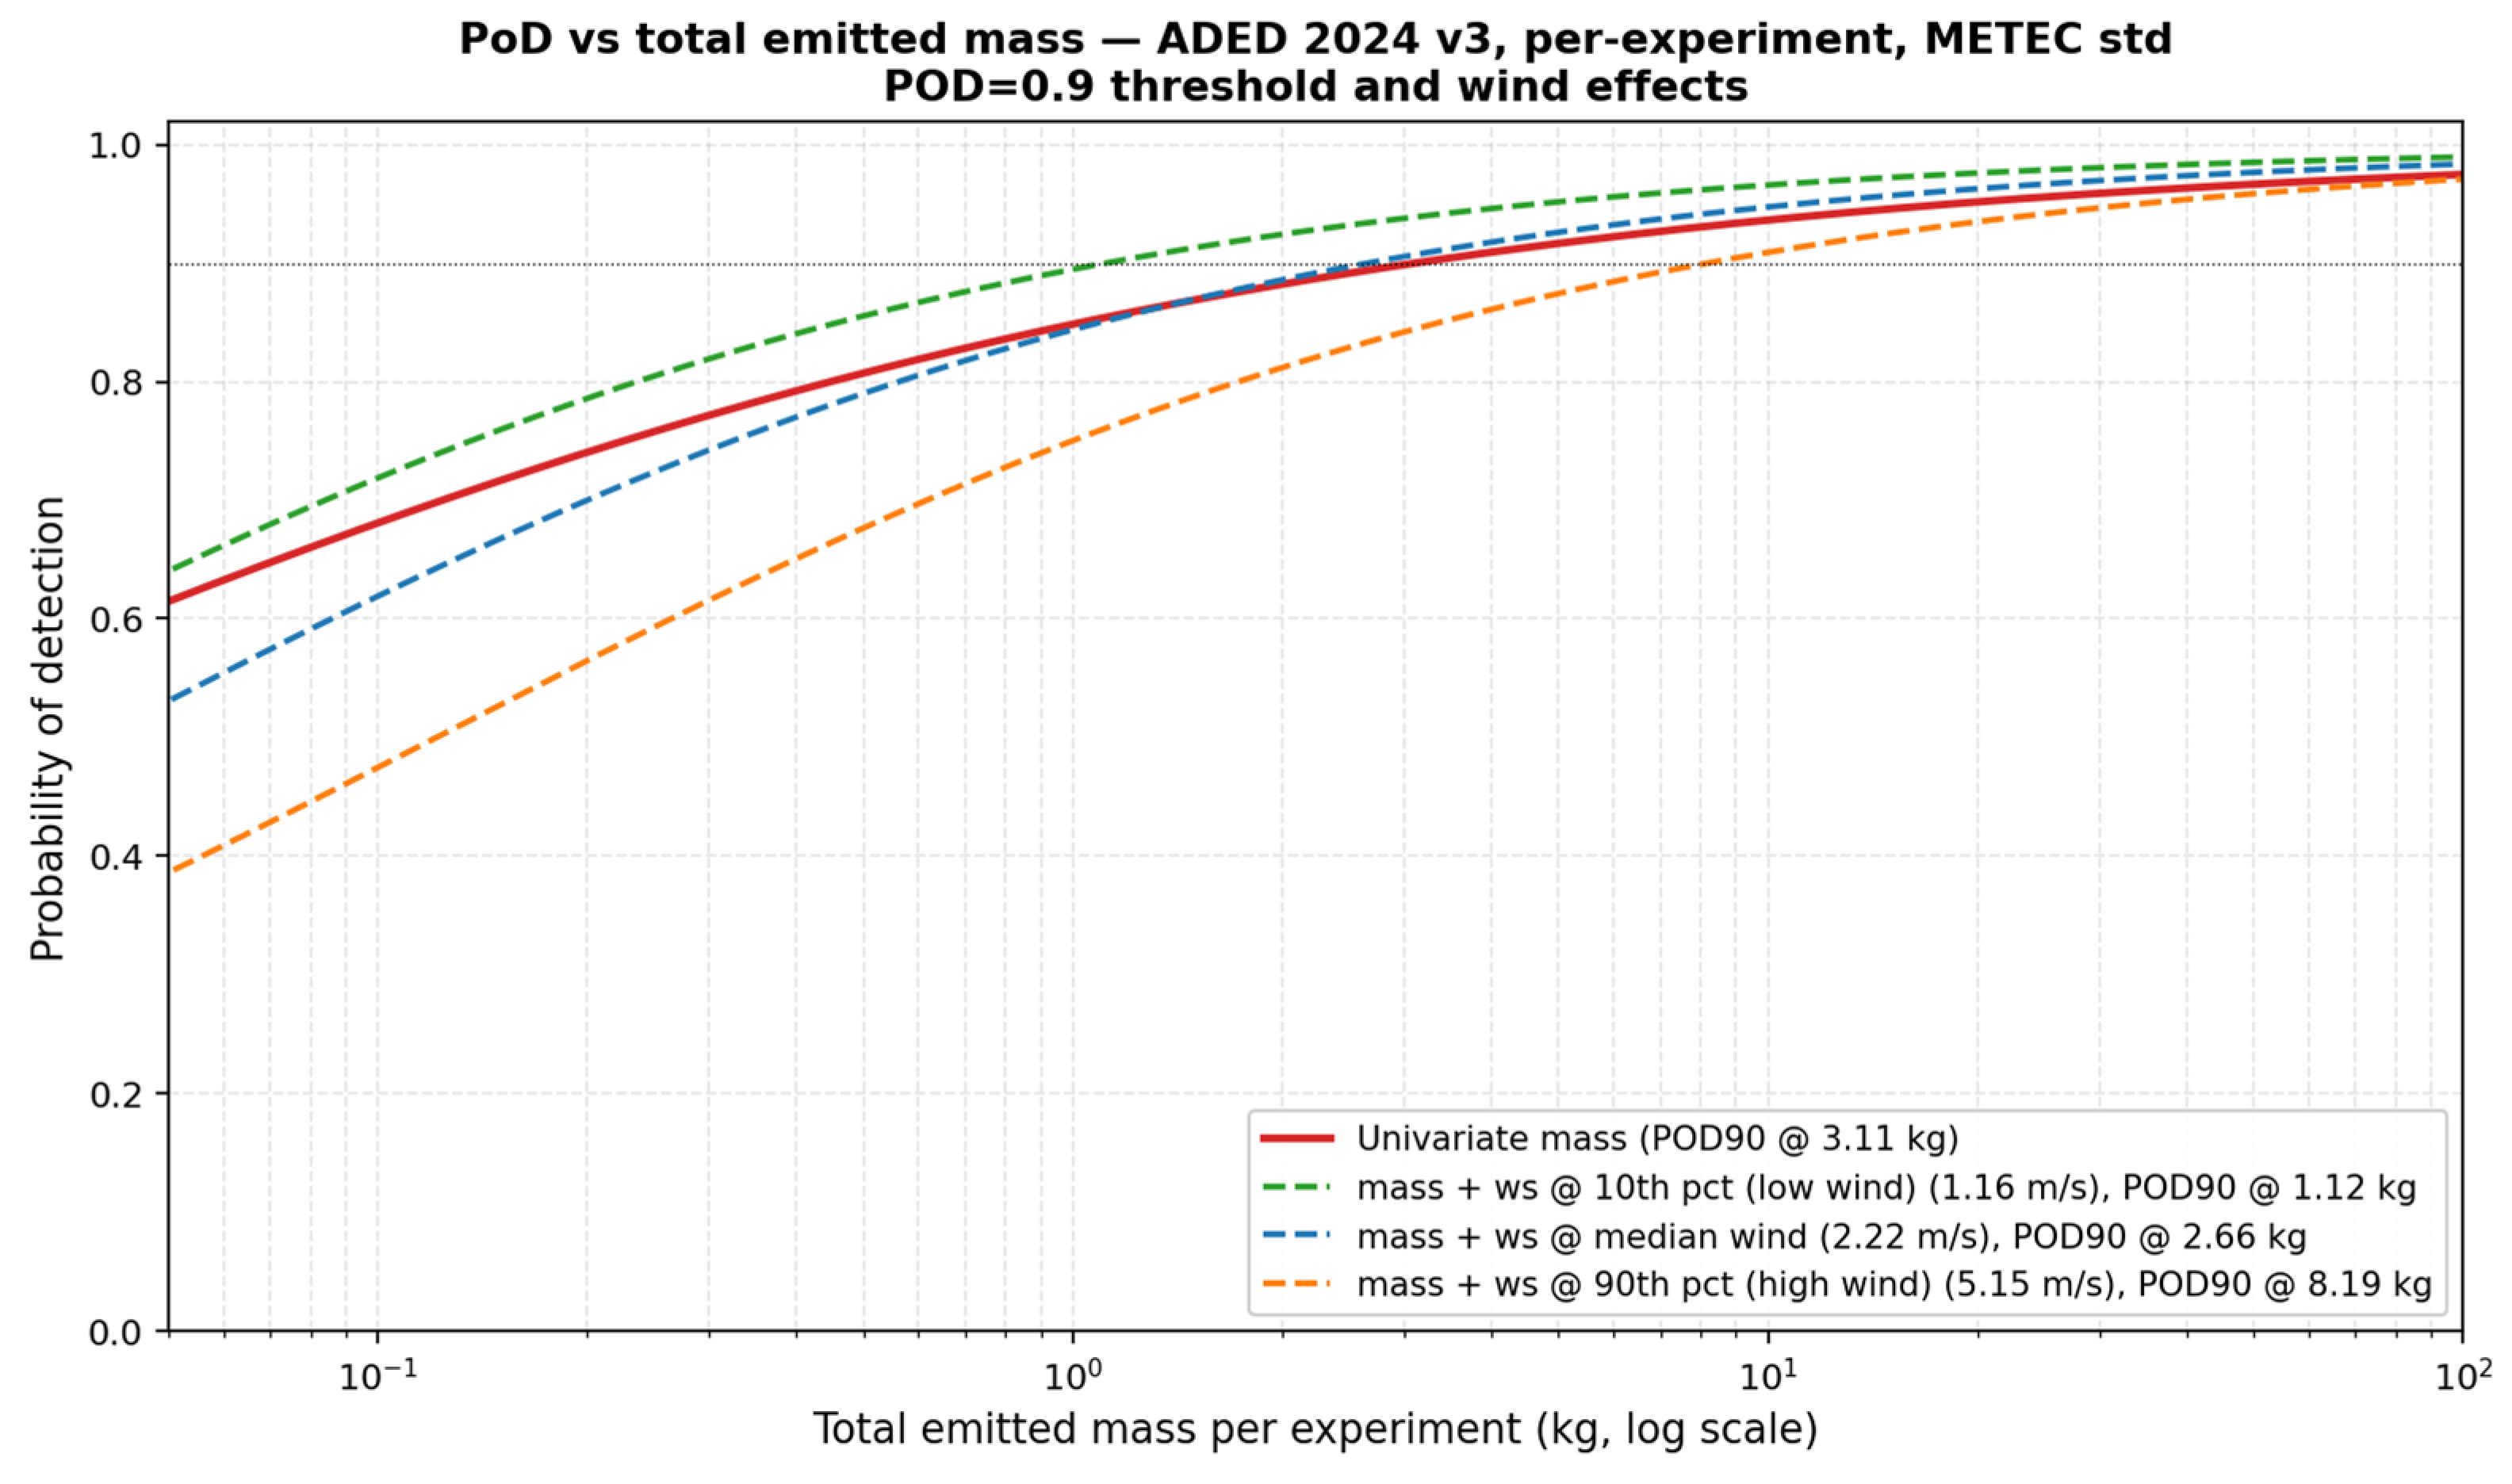
Figure 16.
Comparisons of METEC ADED release rates (kg/h) versus corresponding BluBird reported rates.
Figure 16.
Comparisons of METEC ADED release rates (kg/h) versus corresponding BluBird reported rates.
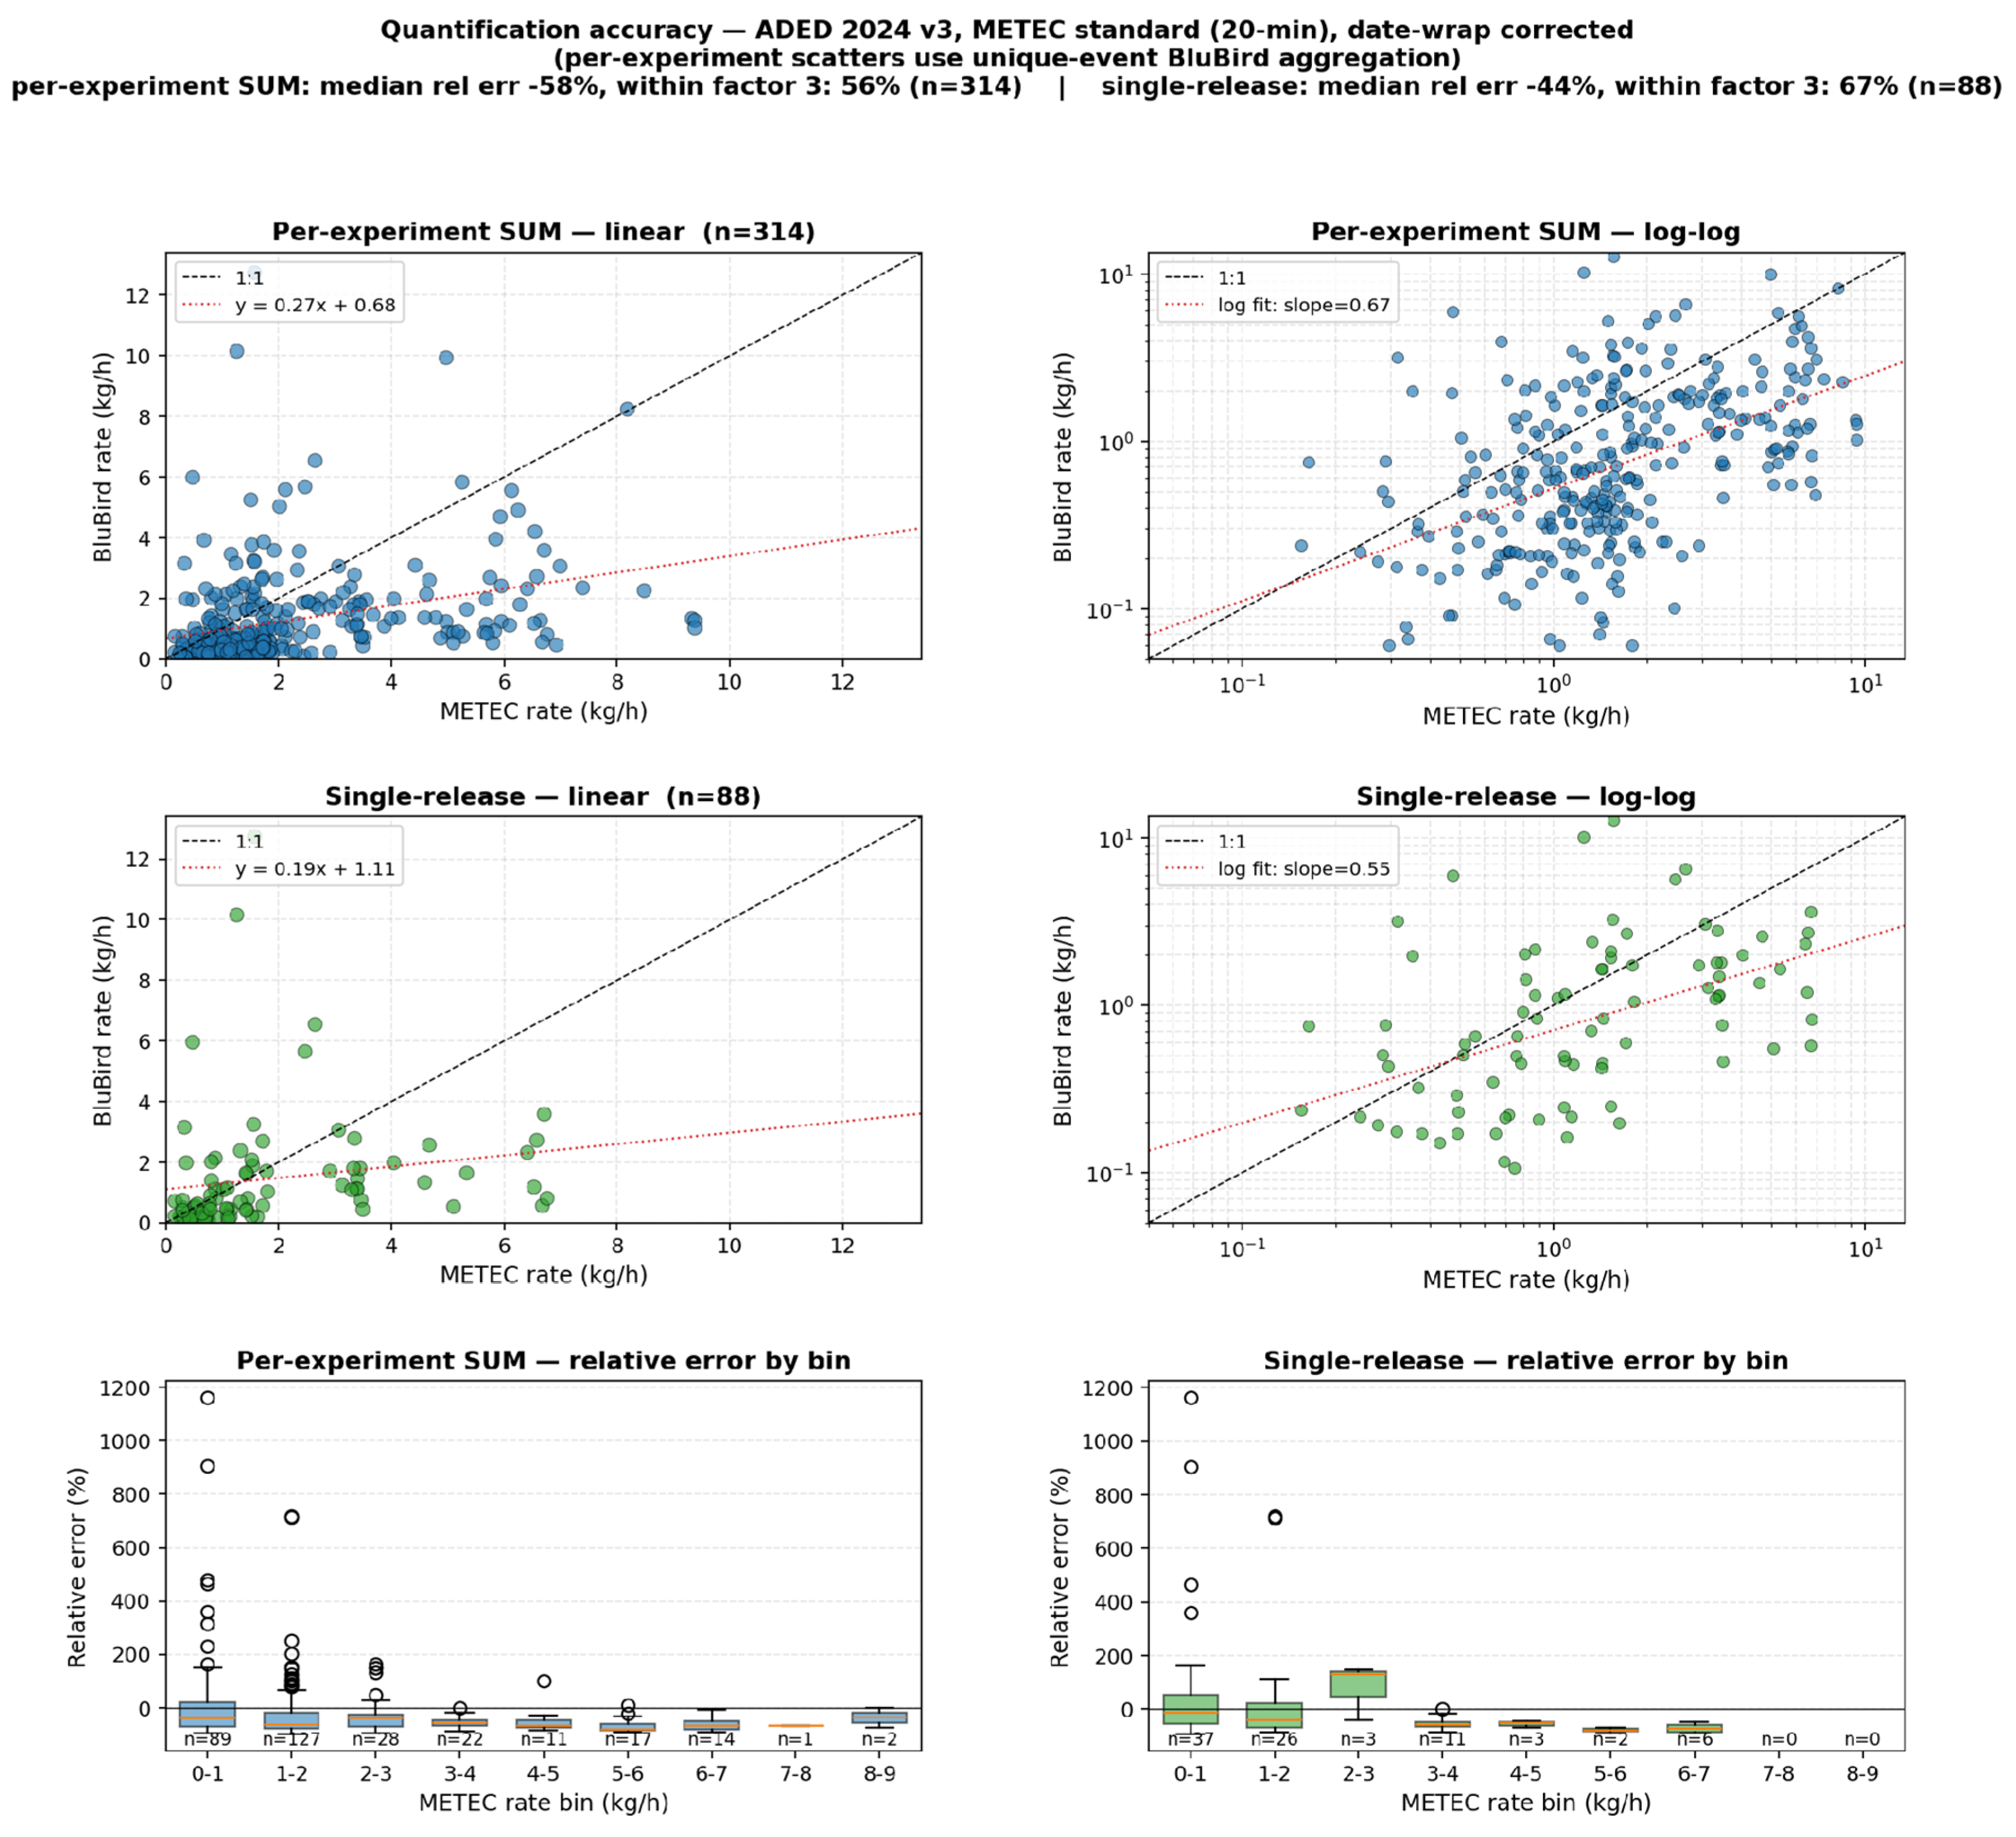
Figure 17.
Comparisons of METEC-reported and BluBird-estimated methane-emission total mass when summed over daily, weekly, and monthly intervals for the all-releases data set. The top panels are for successfully detected (“TP-matched”) releases. The bottom panels include every release (i.e., encompassing all TPs and FNs).
Figure 17.
Comparisons of METEC-reported and BluBird-estimated methane-emission total mass when summed over daily, weekly, and monthly intervals for the all-releases data set. The top panels are for successfully detected (“TP-matched”) releases. The bottom panels include every release (i.e., encompassing all TPs and FNs).
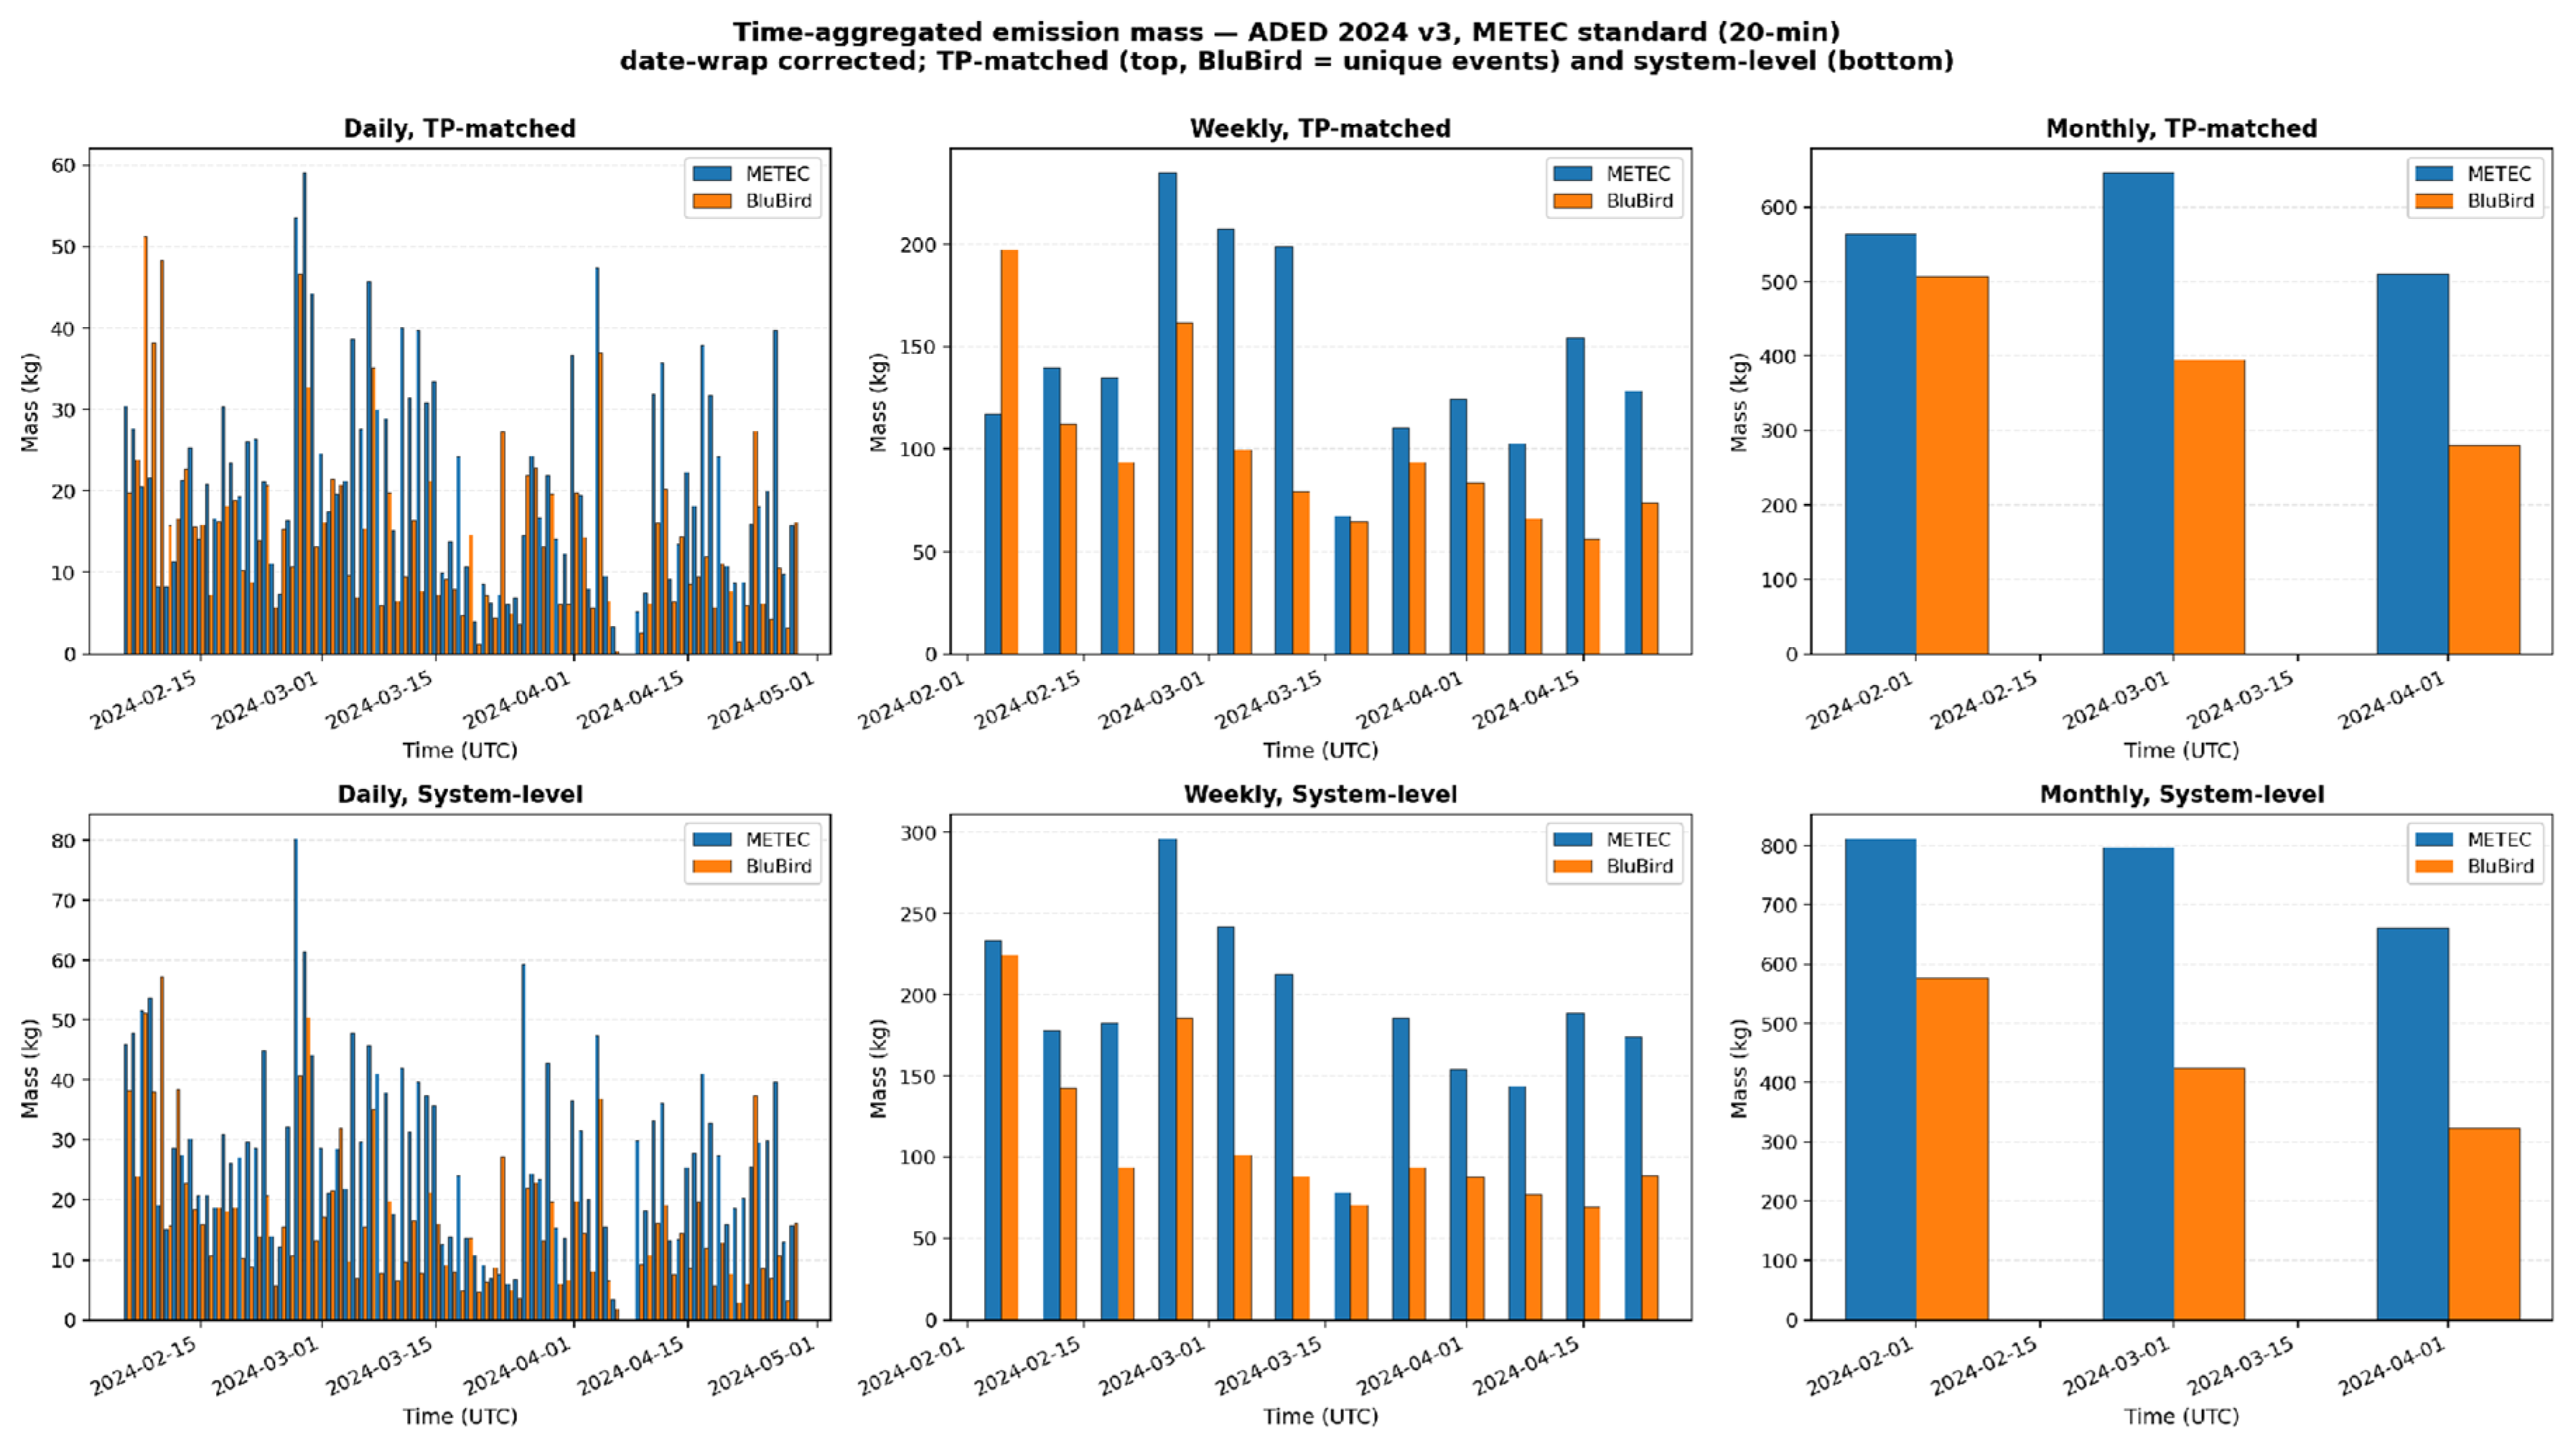
Figure 18.
Comparisons of METEC-reported and BluBird-estimated methane-emission total mass when summed over daily, weekly, and monthly intervals for the single-release subset of experiments. The top panels are for TP-matched releases. The bottom panels are for single- release experiments only (i.e., encompassing all TPs and FNs).
Figure 18.
Comparisons of METEC-reported and BluBird-estimated methane-emission total mass when summed over daily, weekly, and monthly intervals for the single-release subset of experiments. The top panels are for TP-matched releases. The bottom panels are for single- release experiments only (i.e., encompassing all TPs and FNs).
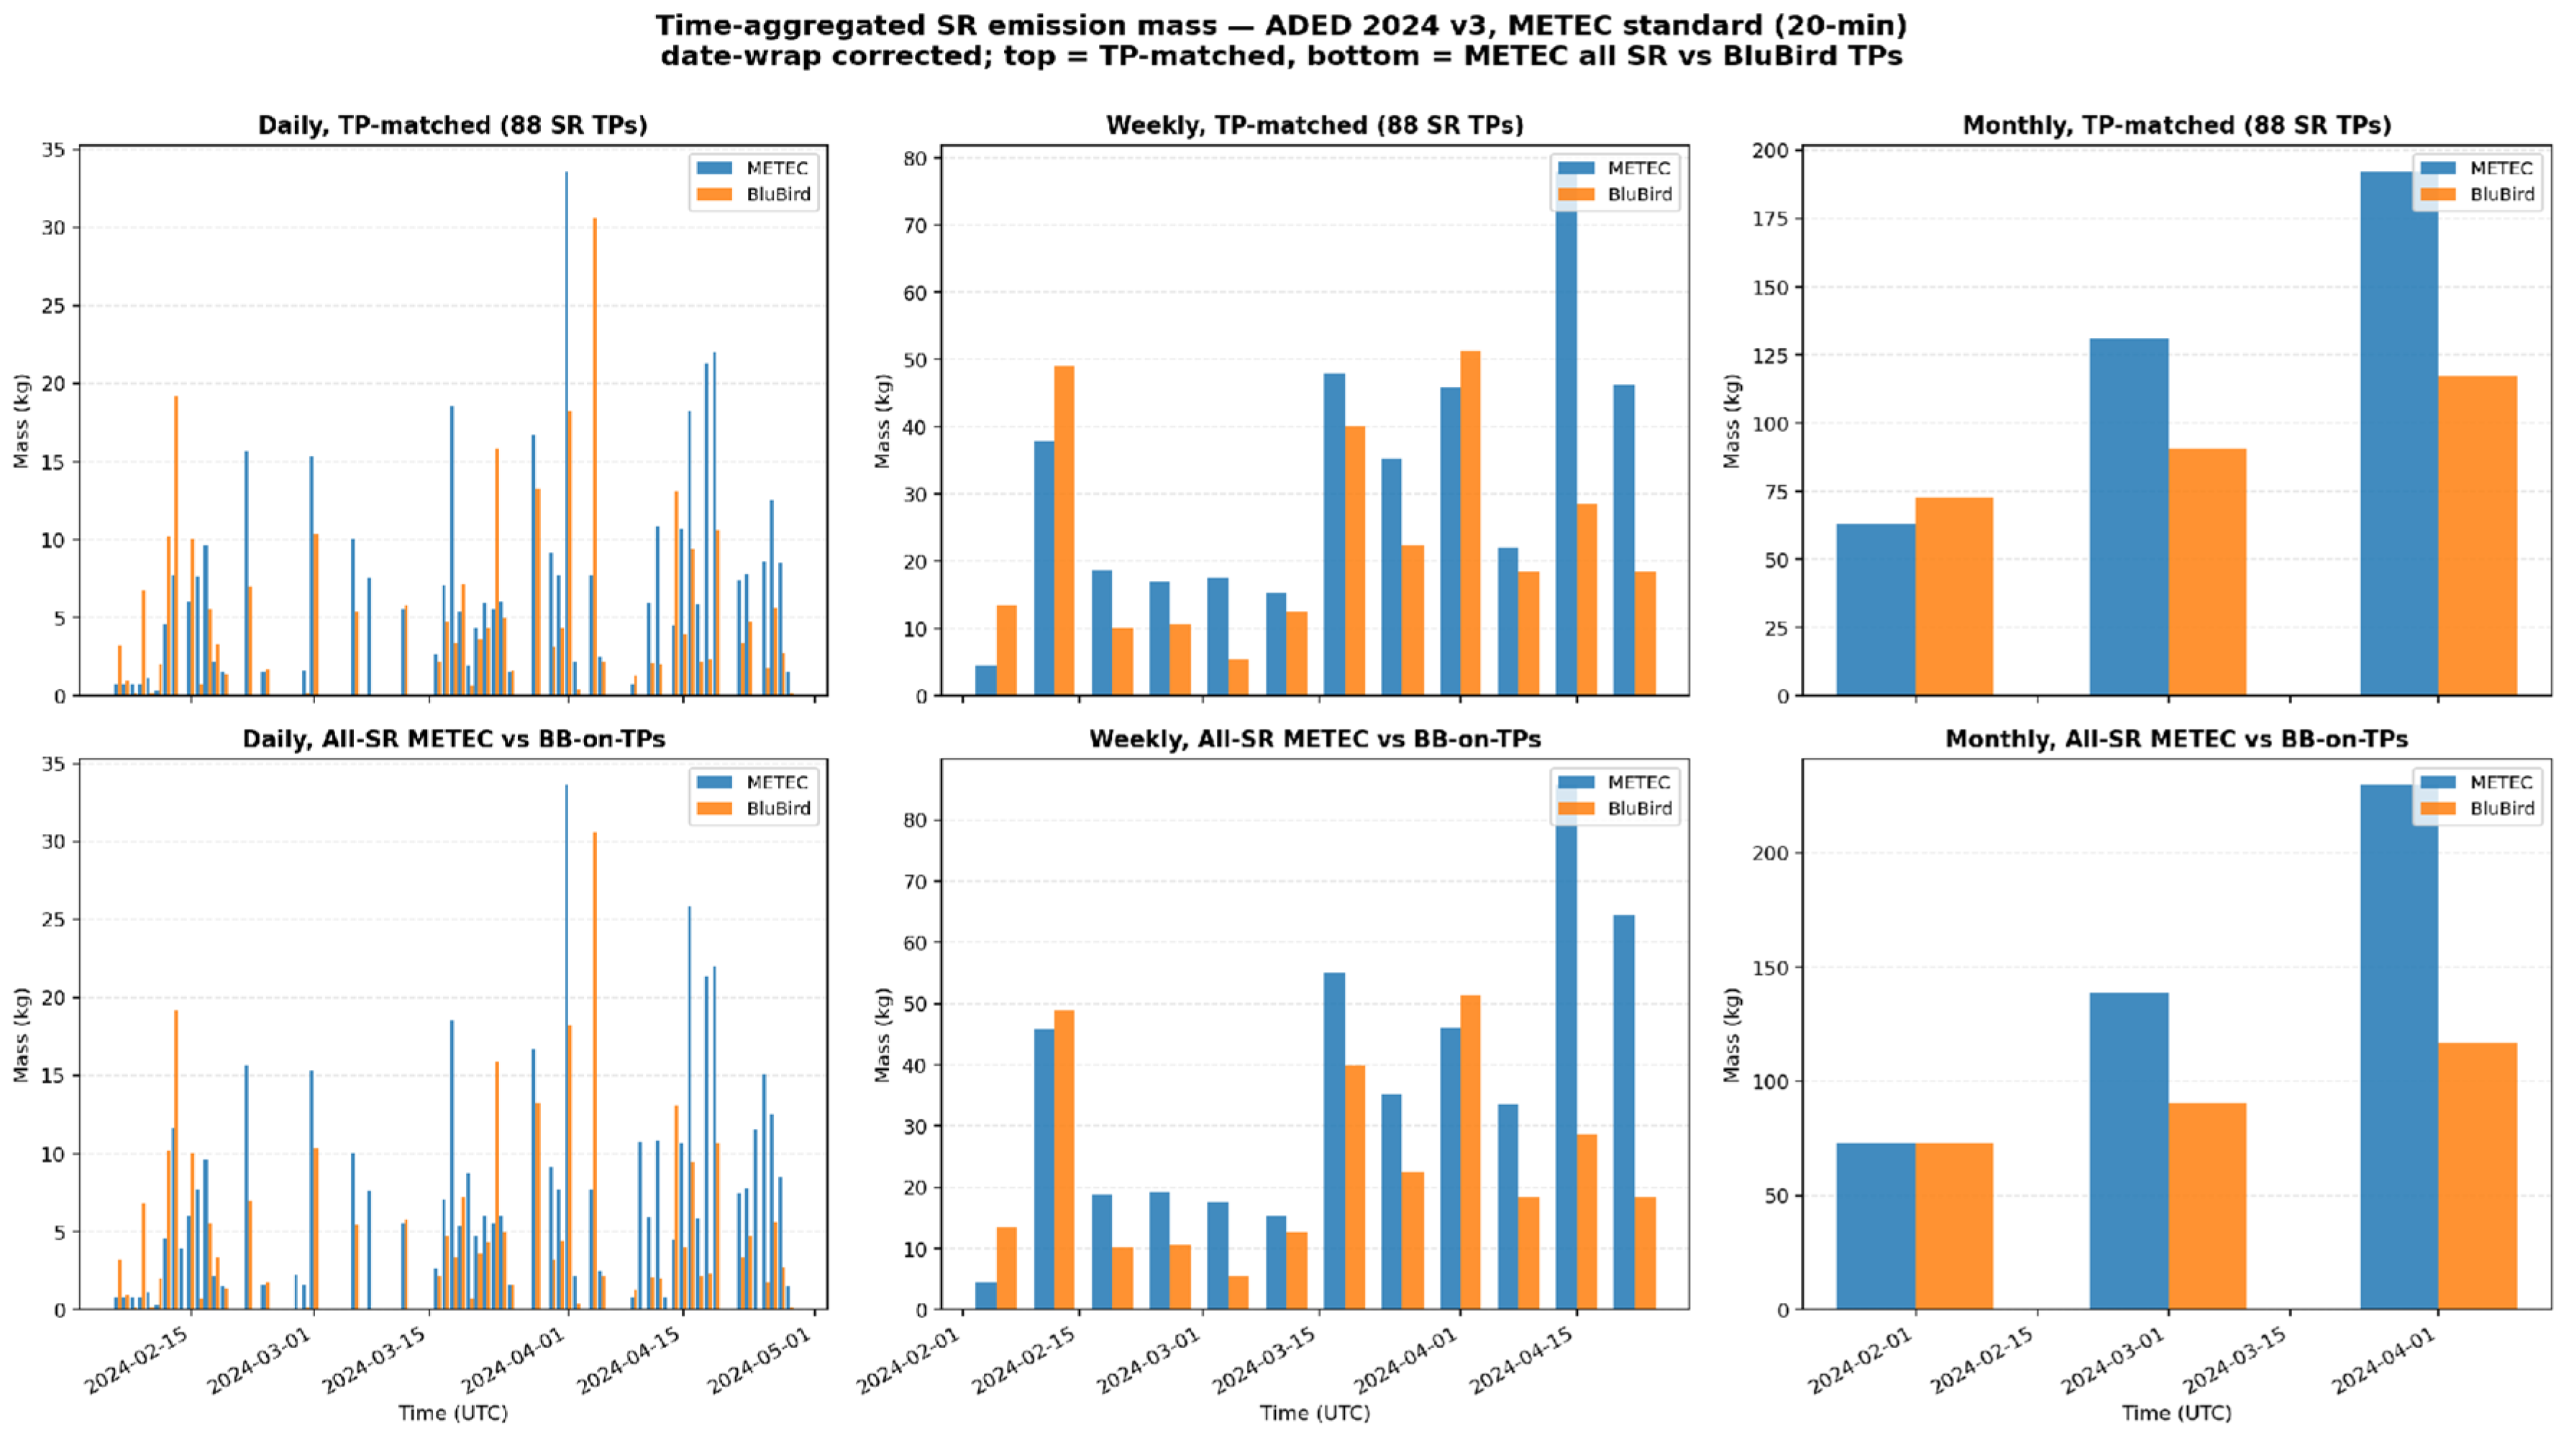
Figure 19.
Relationships between METEC-reported and BluBird-estimated methane emission mass for per-experiment and single-release subsets when summed over daily and weekly intervals.
Figure 19.
Relationships between METEC-reported and BluBird-estimated methane emission mass for per-experiment and single-release subsets when summed over daily and weekly intervals.
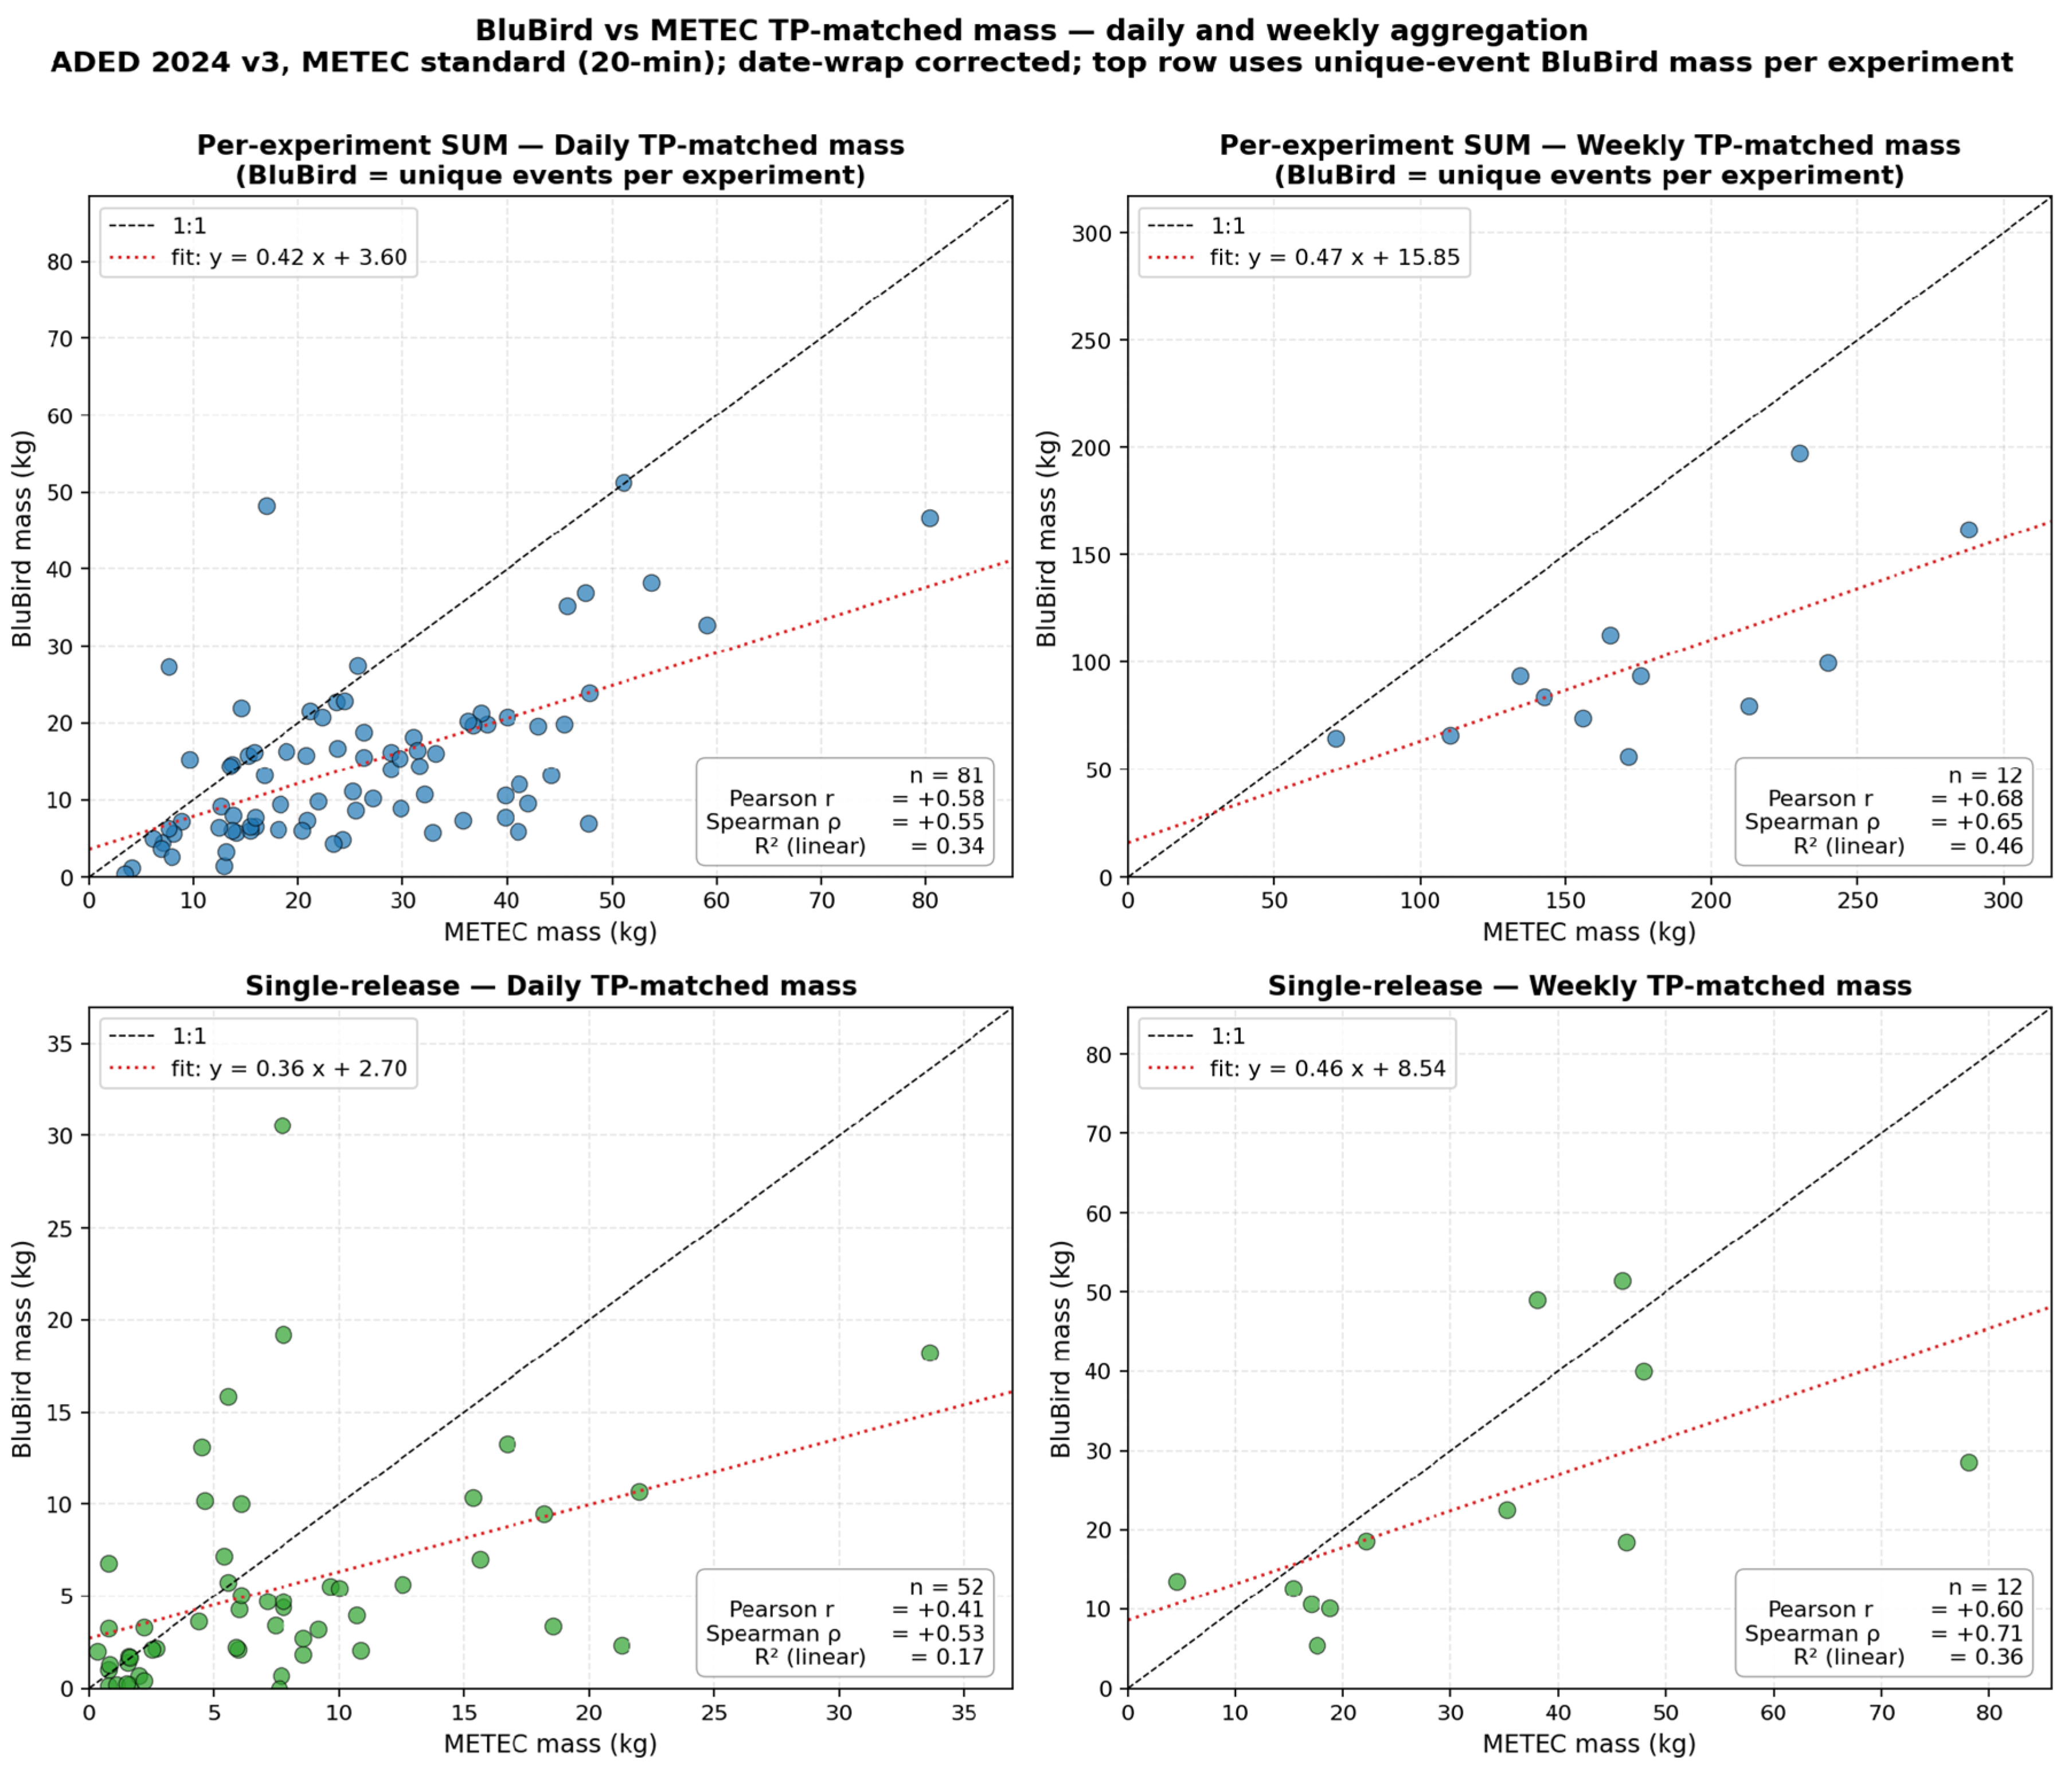
Figure 20.
Relationships between release detection rate and release duration (left panel) and wind speed (right panel), for the per-experiment set with standard METEC classification.
Figure 20.
Relationships between release detection rate and release duration (left panel) and wind speed (right panel), for the per-experiment set with standard METEC classification.
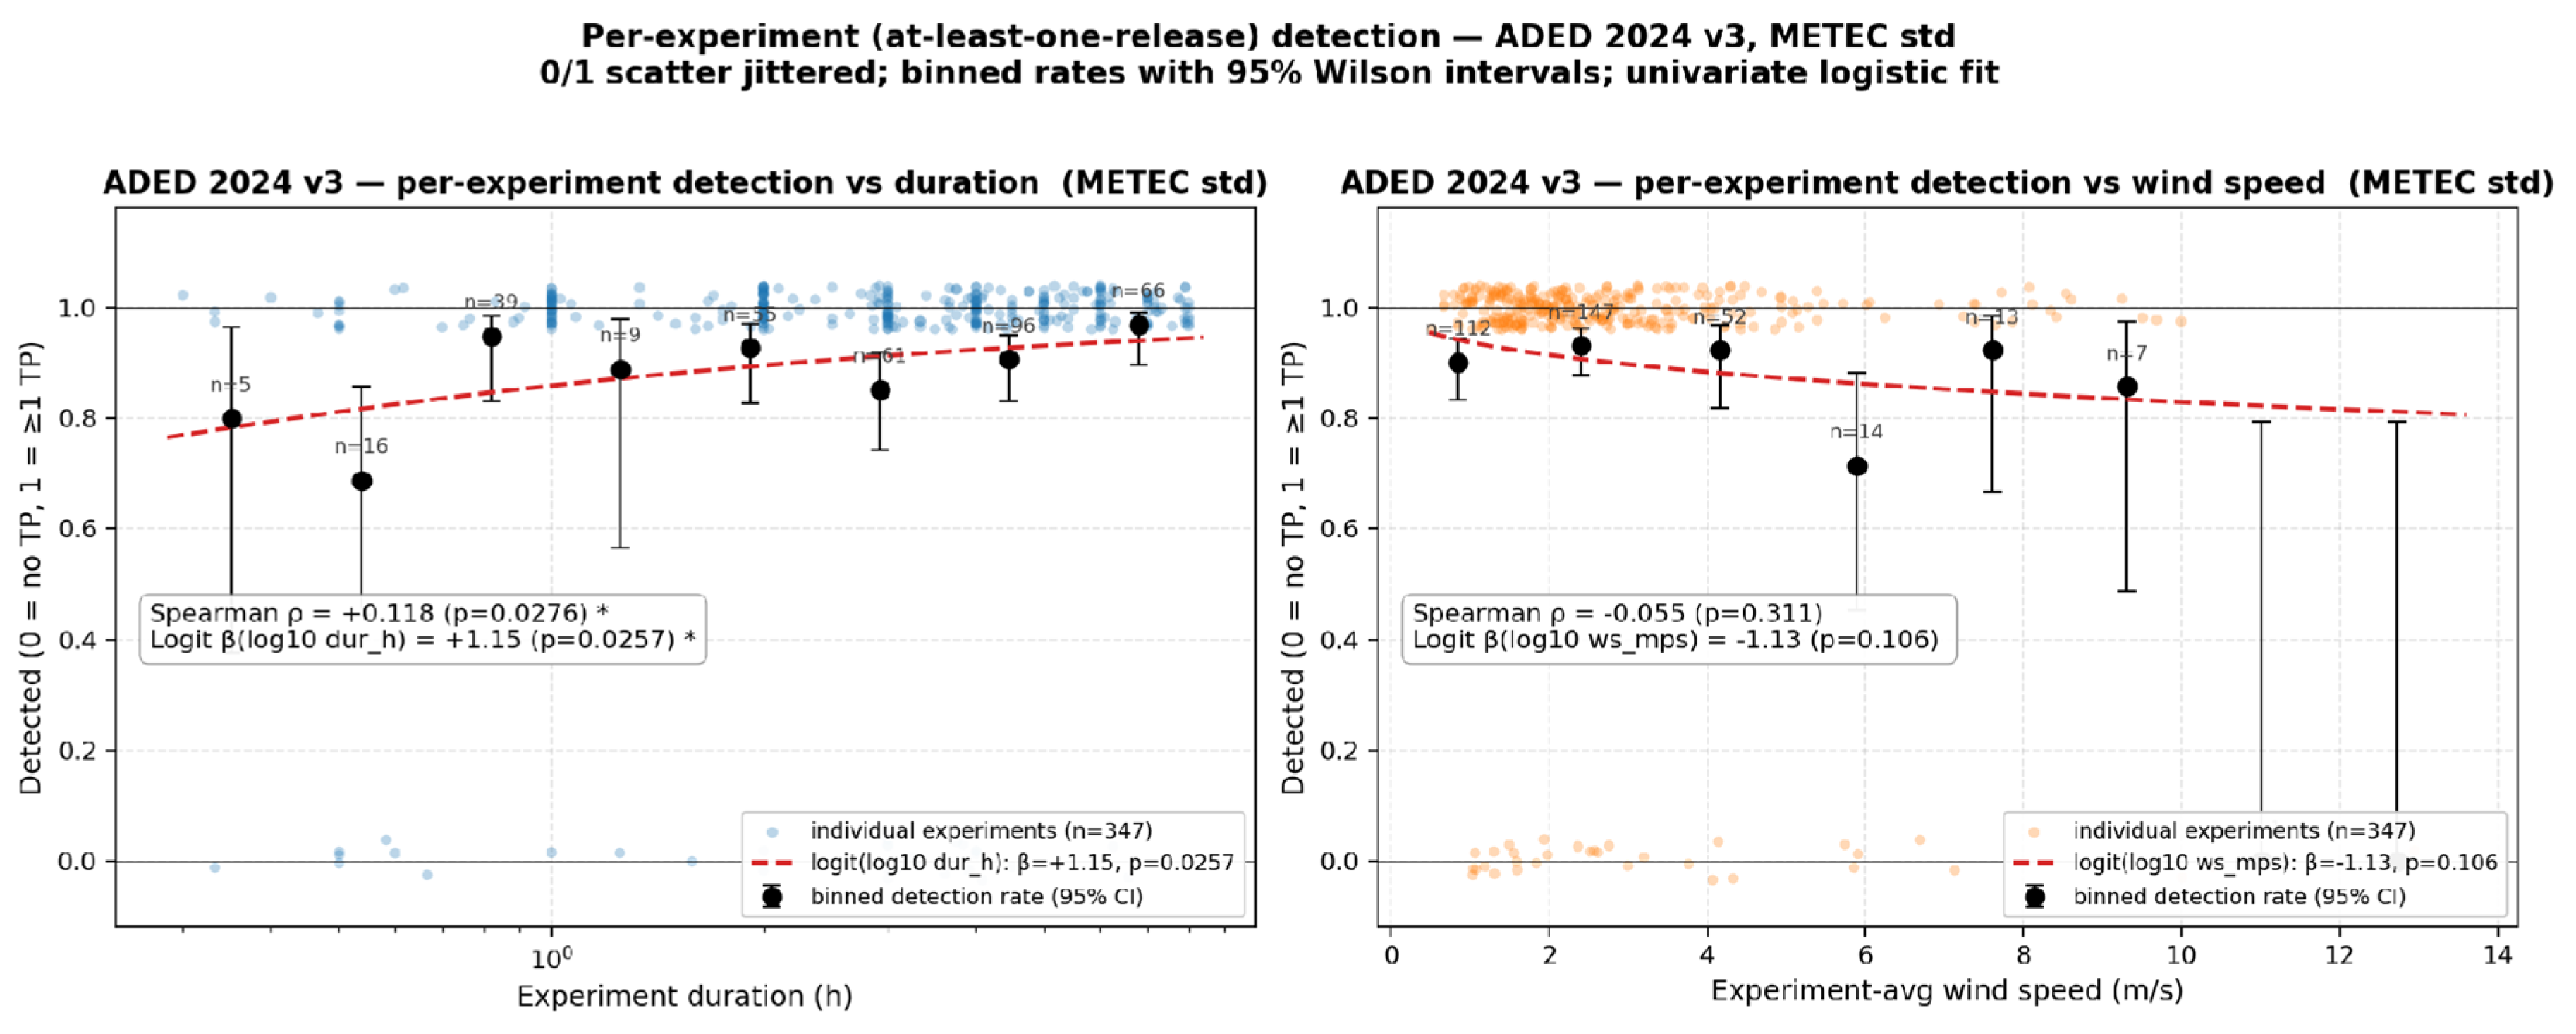
Figure 21.
Correspondence of METEC releases and BluBird detection reports (top panel) and estimated methane concentrations (bottom panel) taken from the Earthview data dashboard for 12 Feb. 2024. Note the elevated concentrations from 12 pm to 2 pm and from 10 pm to 11 pm, which did not correspond to METEC releases.
Figure 21.
Correspondence of METEC releases and BluBird detection reports (top panel) and estimated methane concentrations (bottom panel) taken from the Earthview data dashboard for 12 Feb. 2024. Note the elevated concentrations from 12 pm to 2 pm and from 10 pm to 11 pm, which did not correspond to METEC releases.
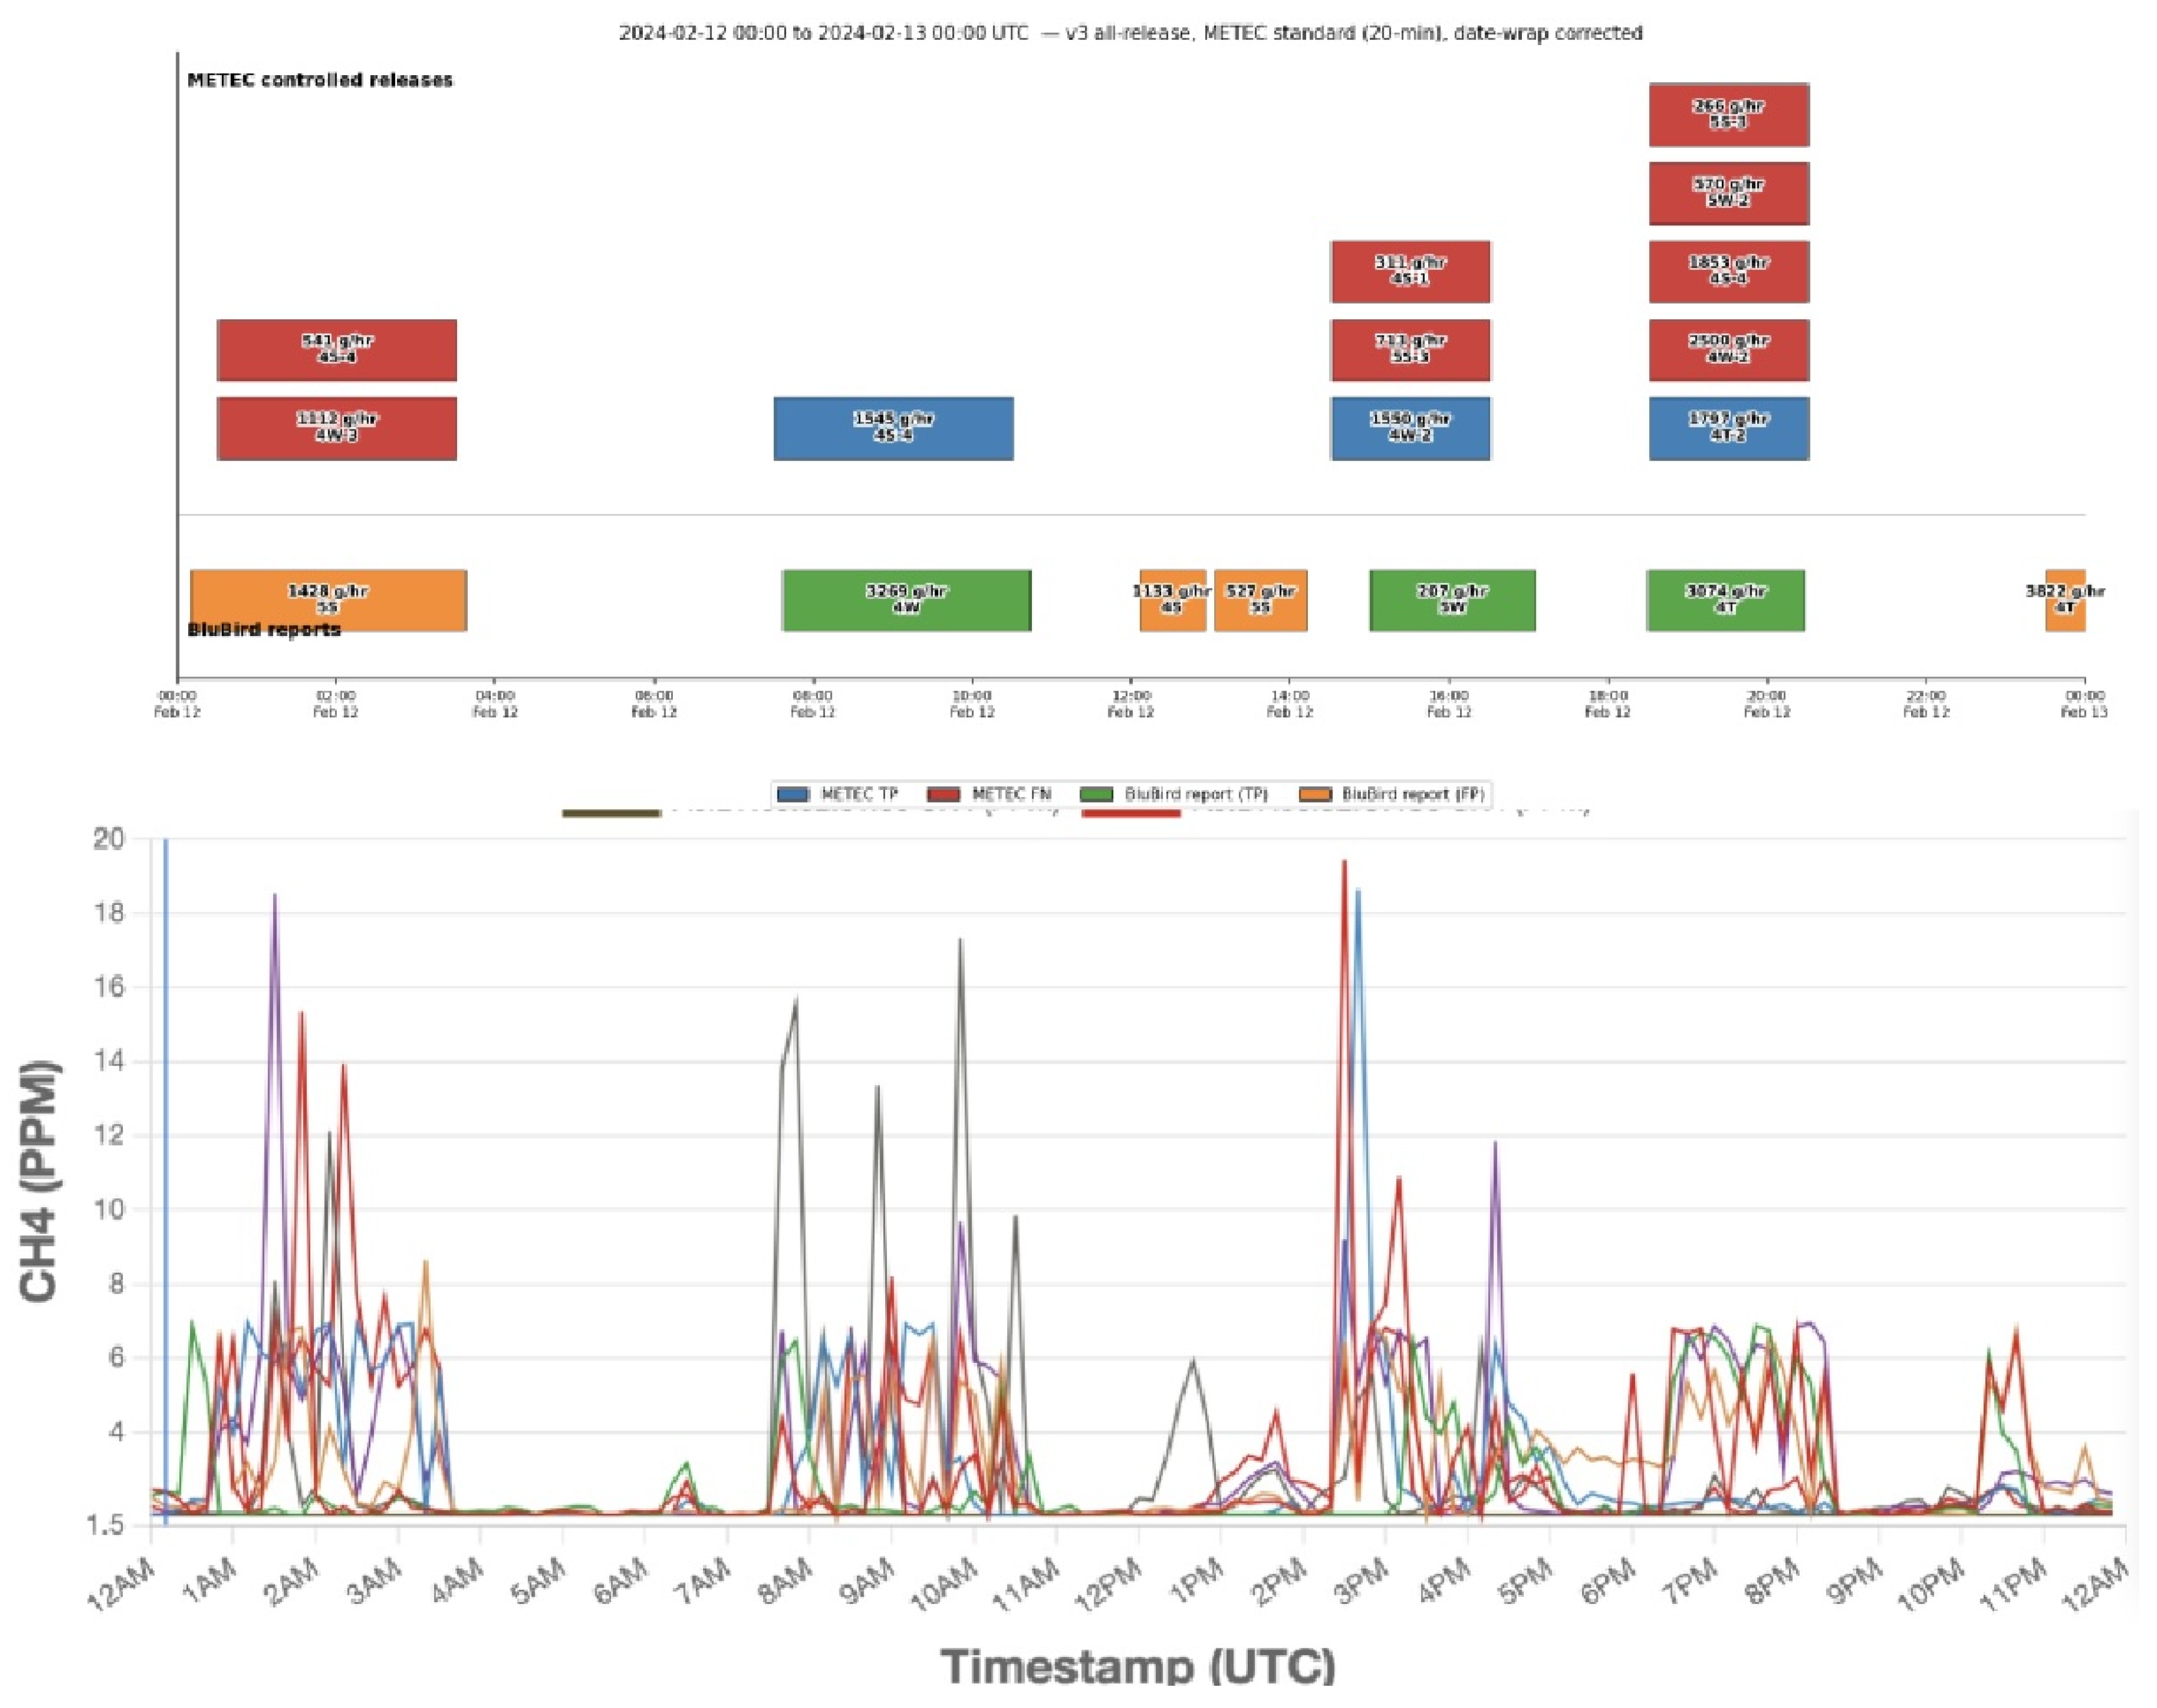
Table 1.
Subsets of METEC ADED 2024 results used for analysis, along with classification options for TP, FN and FP determination. “V.3” refers to the ADED data file version provided by METEC.
Table 1.
Subsets of METEC ADED 2024 results used for analysis, along with classification options for TP, FN and FP determination. “V.3” refers to the ADED data file version provided by METEC.
| Classification Criterion | Explanation |
| METEC standard | Full METEC v.3 results data set with METEC-assigned classifications |
| 30-minute | Full METEC v.3 results data set with a 30-minute early-start time threshold used for classification |
| 75% overlap | Full METEC v.3 results data set with a requirement that individual METEC releases and BluBird detections overlap in time by >= 75% |
Table 2.
Detection classification results for ADED 2024 experiments (per-experiment set; 347 cases). “Rescues” are reports that were classified as FPs but that transitioned to TPs using the different classification criteria.
Table 2.
Detection classification results for ADED 2024 experiments (per-experiment set; 347 cases). “Rescues” are reports that were classified as FPs but that transitioned to TPs using the different classification criteria.
| Classification Criterion | # of TPs | # of FNs | TP% | Rescues* |
| METEC standard (20-minute start threshold) | 314 | 33 | 90.5 | 0 |
| 30-minute start threshold | 325 | 22 | 93.7 | 13 |
| 75% overlap | 338 | 9 | 97.4 | 36 |
Table 3.
Detection classification results for ADED 2024 all releases (all-release set; 775 cases).
| Classification Criterion | # of TPs | # of FNs | TP% |
| METEC standard (20-minute start threshold) | 536 | 239 | 69.2 |
| 30-minute start threshold | 549 | 226 | 70.8 |
| 75% overlap | 572 | 203 | 73.8 |
Table 4.
Detection classification results for ADED 2024 single-release experiments (single-release set; 103 cases). “Rescues” are reports that were classified as FPs but that transitioned to TPs using the different classification criteria.
Table 4.
Detection classification results for ADED 2024 single-release experiments (single-release set; 103 cases). “Rescues” are reports that were classified as FPs but that transitioned to TPs using the different classification criteria.
| Classification Criterion | # of TPs | # of FNs | TP% | Rescues* |
| METEC standard (20-minute start threshold) | 88 | 15 | 85.4 | 0 |
| 30-minute start threshold | 95 | 8 | 92.2 | 7 |
| 75% overlap | 99 | 4 | 96.1 | 11 |
Table 6.
Trivariate-at-median 90% PoD (kg/h) by campaign, results subset, and detection criterion, as a function of release rate. (*Rate is outside the program release-rate range).
Table 6.
Trivariate-at-median 90% PoD (kg/h) by campaign, results subset, and detection criterion, as a function of release rate. (*Rate is outside the program release-rate range).
| Campaign | Subset | 90% PoD (METEC standard) | 90% PoD (30-min start-gap) | 90% PoD (75% overlap |
| ADED 2024 (BluBird 2.0) | Per-experiment | 0.64 kg/h | 0.38 kg/h | 0.25 kg/h |
| Single-release | 1.59 | 0.49 | 0.26 | |
| All-releases | 16.45* | 9.04 | 3.94 | |
| ADED 2022 (BluBird 1.5) | Per-experiment | 26.88* | 26.88* | 26.88* |
| Single-release | 13.43* | 13.43* | 13.43* | |
| All-releases | 8.95 | 8.95 | 8.95 |
Table 7.
Summary of emission rate errors for per-experiment paired TP releases [(BluBird − METEC) / METEC].
Table 7.
Summary of emission rate errors for per-experiment paired TP releases [(BluBird − METEC) / METEC].
| Emission Rate Range (kg/h) | # Cases (n) | Median relative error | Interquartile Range (IQR; p25 to p75) |
| 0.0 to 0.5 | 27 | -31% | [−71%, +67%] |
| 0.5 to 2.0 | 189 | -58% | [−75%, −1%] |
| 2.0 to 3.0 | 28 | -39% | [−71%, −24%] |
| 3.0 to 7.0 | 64 | -66% | [−81%, −45%] |
| 7.0 to 10.0 | 6 | -79% | [−86%, −69%] |
Table 8.
Percent of BluBird-estimated emission rates within specified ranges of METEC rates for the per-experiment and single-release data sets (METEC standard grading).
Table 8.
Percent of BluBird-estimated emission rates within specified ranges of METEC rates for the per-experiment and single-release data sets (METEC standard grading).
| Within factor of: | Per-experiment (n=314) | Single-release (n=88) |
| 1.25 (+/- 25%) | 9% | 17% |
| 1.5 | 20% | 23% |
| 2 | 37% | 43% |
| 3 | 56% | 67% |
Disclaimer/Publisher’s Note: The statements, opinions and data contained in all publications are solely those of the individual author(s) and contributor(s) and not of MDPI and/or the editor(s). MDPI and/or the editor(s) disclaim responsibility for any injury to people or property resulting from any ideas, methods, instructions or products referred to in the content. |
© 2026 by the authors. Licensee MDPI, Basel, Switzerland. This article is an open access article distributed under the terms and conditions of the Creative Commons Attribution (CC BY) license (http://creativecommons.org/licenses/by/4.0/).
Copyright: This open access article is published under a Creative Commons CC BY 4.0 license, which permit the free download, distribution, and reuse, provided that the author and preprint are cited in any reuse.