

Submitted:
15 August 2026
Posted:
18 August 2026
You are already at the latest version
Abstract
Colorectal cancer (CRC) is the second leading cause of cancer-related death in the United States and has a high prevalence in both men and women. Current methods of treatment for CRC include chemotherapy and radiotherapy; however, long periods of exposure to either of these treatment methods are detrimental to one’s overall health. Phytochemicals have been used as natural, non-toxic therapeutic agents against various cancers, suggesting they could be a potential novel treatment for cancers with fewer or no side effects. Curcumin is the bioactive component of Curcuma longa, or turmeric, and is known for its anti-inflammatory, antioxidant, and anti-cancer properties. Several studies have shown that curcumin exhibits anticancer activity through multiple key signaling pathways. Another phytochemical, silibinin B, is the major bioactive component of silymarin, which is present in Silybum marianum (milk thistle). Silibinin B has been used as a treatment for hepatic diseases and has also shown promising results as a chemopreventative agent. Silibinin B exhibits anticancer activity against various cancer types. Previously, using an in vitro model, we demonstrated that combinatorial treatment with curcumin and silymarin (CS), that contains all seven phytochemicals from milk thistle, synergistically increased CRC cell death compared with single-compound treatment. In our current study, we used a xenograft mouse model to evaluate the efficacy of curcumin alone, silibinin B alone, and their combination against tumors induced by the colorectal cancer cell line DLD-1. We observed that the combination treatment significantly reduced tumor growth compared to either compound alone. Furthermore, the combination treatment induced significantly higher levels of tumor cell apoptosis than the single-compound treatments. To understand how CS reduces tumor burden , we treated DLD‑1 cells with the agents singly or in combination. CS‑treated cells exhibited a significant increase in reactive oxygen species (ROS) levels. We also found that elevated ROS activated AMPK, which in turn inhibited the mTORC1 pathway. The combined effects of increased ROS and mTORC1 inhibition create a “double hit” that may promote cancer cell death.
Keywords:
colorectal cancer
; curcumin
; silibinin B
; athymic nude mice
1. Introduction
Among noncommunicable diseases, cancer is a leading cause of death and one of the most important barriers to increasing life expectancy globally. Colorectal cancer (CRC) ranks third in terms of incidence and second in terms of mortality globally [1,2]. While rates of colon cancer in humans in the 50+ age group are dropping due to effective screening, the age group under 50 is experiencing an alarming increase in colon and rectal cancers in the USA [2]. CRC incidence in 20-34 year-olds is predicted to increase up to 90% and 124% for colon and rectal cancers respectively, and recent estimates further underscore this trend, with approximately 11% of new CRC cases occurring in individuals under the age of 55 [3,4,5]. Even though the reason behind the sharp increase in younger adults is not easily explained, epidemiology studies suggest that a diet lacking in vegetables and fruits but rich in processed foods may be a cause of CRC [5,6].
Development of CRC is multifactorial. Genetic predisposition contributes 5-10% towards CRC onset; the remaining 90-95% of CRCs are due to lifestyle issues such as diet and alcohol or tobacco use [6]. However, some inflammatory bowel disorders (Crohn’s and ulcerative colitis) are also associated with CRC [7,8]. CRC development is a multistep process involving genetic aberrations and epigenetic dysregulation [9]. Epigenetics (specifically involving DNA methylation, histone modification, and noncoding RNA) is implicated in every aspect of tumor formation, from early neoplasia to malignant transformation [9,10,11,12].
Current treatment for CRC is based on removing primary tumors followed by radiotherapy and/or chemotherapy. Unfortunately, both radiation and chemotherapy cause adverse side effects and increased chemoresistance, with an associated increased rate of metastasis [13,14]. Based on results from several clinical studies, recurrence rates rate for colon cancer and for rectal cancer vary [15]. Thus, a preventive approach is needed to avoid CRC and the adverse effects associated with current treatment modalities. CRC prevention should not only focus on preventing CRC in young people but should also concentrate on reducing CRC recurrence in CRC-treated patients. CRC development occurs in those with diets conducive to CRC (low intake of fruits and vegetables, high intake of processed foods), and CRC initiation occurs in those with a genetic predisposition for CRC [16,17,18,19,20].
Some phytochemicals have been shown to protect against cancer. Epidemiological studies show that populations consuming greater amounts of spices and vegetables have a lower incidence of CRC [6,21,22,23,24,25,26,27]. For example, in Asian Indians, the overall rate of colorectal, prostate, and lung cancers in both males and females is the lowest among all populations studied, and this low incidence is attributed to the phytochemical curcumin present in the spice turmeric [26]. Phytochemicals offer alternative approaches to cancer prevention, with reduced host toxicity (due to minimal/no host toxicity) and diminished side effects compared to those of current chemotherapeutic agents [28,29,30,31]. However, when these phytochemicals have been studied in vitro and translated into mice and human studies, the pharmacologically effective dose is several-fold higher than that indicated by epidemiological studies [32]. For example, in clinical trials, curcumin has shown promising anticancer effects and is well tolerated at a dose of 12 g/day [32,33,34]. But the normal dietary intake of turmeric in the Asian population is about 2-2.5 g/day, which corresponds to 60-100 mg/day of curcumin [35,36]. In addition, the low bioavailability of curcumin has raised questions about how epidemiological studies and several research publications can demonstrate medicinal effects in animal and human studies against diseases such as cancer, Alzheimer’s, and arthritis [32,37,38,39,40,41,42,43,44]. Despite the low bioavailability of curcumin and its relatively low amount of regular dietary intake [35,37,38], if there is a beneficial protective effect against cancer, as suggested by epidemiological studies, it could be because curcumin is always consumed in combination with other substances. We hypothesized that curcumin, together with other phytochemicals present in a regular diet, acts synergistically in cancer prevention, thereby explaining the results observed in epidemiological studies [22,23,24,26,39].
Our previous study showed that a combination of curcumin and the whole milk thistle phytochemical silymarin (CS) elicited synergistically enhanced anticancer activity in vitro [40], supporting our postulate. In our study using a xenograft mouse model, only the CS-treated group showed a significant reduction in tumor size compared with single compound phytochemical treatment or control groups. To understand the mechanism of the anti-tumor effect of combination compounds, we used an in vitro model, which was the DLD-1 CRC cell line [40]. Phytochemical combinations such as CS may exert anticancer effects by disrupting redox homeostasis and metabolic signaling in tumor cells. Phytochemicals can disrupt this balance by inhibiting ROS-scavenging enzymes, thereby pushing ROS levels beyond the cytotoxic threshold and inducing cell death [41,42]. Our preliminary findings indicate that CS treatment, compared to single compound treatment and vehicle control, increases intracellular ROS, thereby activating AMPK and suppressing mTORC1 signaling—two key pathways that regulate cellular growth and survival. This coordinated increase in oxidative stress and inhibition of anabolic signaling promotes apoptosis and autophagy. Because cancer cells already maintain elevated basal ROS levels [41], the additional oxidative burden imposed by CS may overwhelm their antioxidant capacity, pushing them beyond their survival threshold and inducing cell death.
2. Materials and Methods
2.1. Cell Line and Propagation
Human colon cancer DLD-1 cells were obtained from the American Type Culture Collection (Manassas, VA) and maintained at 37 °C in a humidified incubator with 5% CO₂. Cells were cultured in Dulbecco’s modified Eagle’s medium (DMEM) supplemented with 10% fetal bovine serum, penicillin/streptomycin, glutamine, sodium pyruvate, and HEPES buffer (all from Hyclone, Logan, UT). Cultures were propagated under standard conditions until reaching confluence, at which point the cells were detached using 0.25% trypsin and neutralized with enriched DMEM. Viable cells were then counted using a hemocytometer and prepared for tumor induction.
2.2. Tumor Formation in Nude Mice
Six-week-old athymic nude mice (Charles River Laboratories) were housed in a pathogen-free facility and handled in accordance with Institutional Animal Care and Use Committee (IACUC) guidelines. Athymic nude mice are immunocompromised and readily accept human tumor cells, allowing for consistent tumor development. DLD-1 cells were centrifuged, washed with DPBS, and resuspended at 5 × 10⁶ cells per 100 μL of serum-free medium. This suspension was mixed with 100 μL of Matrigel (8 mg/mL) and kept on ice until injection. Seven-week-old mice were injected subcutaneously with 5 × 10⁶ DLD-1 cells in a total volume of 200 μL (cell suspension mixed with Matrigel) into the right and left flanks. The day of injection was designated as day 0. By day 5, tumors were visible with an average volume of approximately 50 mm³. On day 5, mice were randomly assigned to four groups (10 mice per group; five males and five females). Phytochemicals or vehicle were administered daily for 30 days. Treatments consisted of phytochemicals suspended in a carboxymethylcellulose (CMC) solution (0.5% w/v in 0.025% Tween-20 in water) or vehicle alone (CMC solution). Dosing was performed by oral gavage on days 5 through 34. Treatment groups were: (1) vehicle control (CMC only); (2) curcumin (C:200 mg/kg); (3) silibinin B (S:200 mg/kg); and (4) curcumin + silibinin B (CS:200 mg/kg each). All mice were gavaged using a 22-gauge ball-tipped feeding needle, and the gavage volume did not exceed 10 mL/kg.
Mice were monitored daily, weighed weekly, and tumors were measured twice weekly using calipers. Tumor volume was calculated using the formula: ½ × (length × width²). On day 34, animals were euthanized according to IACUC guidelines, and tumors were excised and weighed.
2.3. Immunohistochemistry
During apoptosis, inactive caspase-3 is proteolytically cleaved to generate its active form, and the presence of cleaved caspase-3 serves as a reliable marker of apoptotic cells. Tumor sections were therefore stained with an antibody against cleaved caspase-3 (Cell Signaling Technology, Cat. No. 9664), and images were captured at 20× magnification. Quantification was performed using QuPath software [43]. Each tumor section was defined as a separate region of interest, and a three-tier thresholding strategy was applied to classify staining intensity as background (0), low (1+), or high (2+) based on intensity peaks. Cells were segmented from hematoxylin-stained images, and the proportion of high-intensity (2+) cells was used to determine the percentage of cleaved caspase-3–positive cells.
2.4. Treatment of DLD-1 Cells for ROS, ADP/ATP, and Western Blot Analysis
Curcumin and silibinin B were prepared as 100 mM stock solutions in dimethyl sulfoxide (DMSO) and stored at −20 °C. DMSO alone (0.01%) served as the vehicle control. Cells were treated with 12.5 µM curcumin (C), 12.5 µM silibinin B (S), or a combination of 12.5 µM curcumin plus 12.5 µM silibinin B (CS) for 48 hours. Following treatment, cells were analyzed for reactive oxygen species and the ADP/ATP ratio. Cell lysates were quantified for protein using a BCA assay (Pierce Biotechnology, Rockford, IL) and subsequently used for SDS-PAGE and Western blot analysis.
2.4a. Measurement of Reactive Oxygen Species
Intracellular ROS levels were quantified using the oxidation-sensitive probe 2′,7′-dichlorofluorescin diacetate (DCFDA). Cells were treated with vehicle control or 12.5 µM of each compound for 48 hours. After treatment, the growth medium was removed and replaced with DCFDA diluted in Hank’s balanced salt solution, followed by incubation at 37 °C for 30 minutes. Cells were then visualized using a fluorescence microscope, and fluorescence intensity was measured using a microplate reader (Cytation 3, BioTek, Vermont, USA) at λ_excitation = 485 ± 20 nm and λ_emission = 528 ± 20 nm. Relative ROS levels in DLD-1 cells were calculated as fold change compared with untreated controls. Data were presented as mean ± SEM from at least three independent experiments (**p ≤ 0.01).
2.4b. Analysis of ATP/ADP Ratio
The ATP/ADP ratio was measured using the ApoSENSOR™ ADP/ATP Ratio Bioluminescent Assay Kit (BioVision). First, 100 µL of reaction mix was added to a 96-well plate, and background luminescence was recorded (Data A). Cells were treated with phytochemical compounds for 48 hours, after which the medium was removed, and cells were incubated with 50 µL of nucleotide-releasing buffer for 5 minutes. The resulting lysate was transferred to the wells containing the reaction mix, and luminescence was measured after 2 minutes (Data B). Samples were then read again to determine ADP-dependent signal (Data C). Subsequently, 1 µL of ADP-converting enzyme was added to each well, and luminescence was recorded (Data D). The ATP/ADP ratio was calculated using the formula:
ATP/ADP ratio = Data B-Data A
Data D- Data C
The ADP/ATP ratio was normalized to protein concentration.
2.4c. Analysis by Western Blot
DLD-1 cells treated with vehicle control (DMSO), curcumin (C, 12.5 µM), silibinin B (S, 12.5 µM), or the curcumin plus silibinin B combination (CS, 12.5 µM each) were lysed and analyzed by Western blot. Cells were lysed in buffer containing 50 mM Tris, 100 mM NaCl, protease inhibitors, and 1 mM phenylmethylsulfonyl fluoride. Lysates were centrifuged at 10,000 × g for 15 min, and the resulting supernatant was collected. Protein concentration was determined using the BCA assay (Pierce Biotechnology, Rockford, IL). Equal amounts of protein (20 µg per sample) were separated by SDS–PAGE and electrophoretically transferred onto nitrocellulose membranes (Pierce Biotechnology, Rockford, IL). Membranes were blocked for 1 h at room temperature in TBST blocking buffer (20 mM Tris, pH 7.6, 100 mM NaCl, 0.1% Tween-20, 5% nonfat dry milk) with gentle agitation. After blocking, membranes were washed and incubated overnight at 4 °C with primary antibodies against AMPK, phospho-AMPK, phospho-4E-BP1, phospho-p70S6, LC3I, LC3-II, Noxa, cleaved caspase 3, and GAPDH (Cell Signaling Technology, Danvers, MA) diluted in TBST blocking buffer. Following primary antibody incubation, membranes were washed three times with TBST and incubated with horseradish peroxidase–conjugated secondary antibodies for 1 h at room temperature. Immunoreactive bands were visualized using a chemiluminescent detection system (Pierce Biotechnology, Rockford, IL). GAPDH was used as the loading control.
2.5. Statistical Analysis
Results were presented as the mean ± standard error of the mean (SEM). All data were analyzed using a one-way ANOVA followed by Dunnett’s multiple comparisons post hoc test. A p-value of less than 0.05 (p < 0.05) was considered statistically significant.
3. Results
3.1. Combination of Phytochemical Treatment Significantly Reduced Tumor Burden
In our previous cell culture studies, we used curcumin and silymarin. Silymarin is a mixture of phytochemicals, including silychristin, silydianin, isosilybin, and silibinin B (silybin), the latter being the major flavonolignan and comprising approximately 40–60% of the total extract [44]. Subsequently, we used pure silibinin B for the current in vivo and in vitro studies, as it represents the primary bioactive component of silymarin.
In our previous studies, we treated colon cancer cell lines (DLD-1, HCT116, LoVo) with a single phytochemical (curcumin or silymarin) or with a combination of curcumin and silymarin to assess anticancer activity [40]. Curcumin inhibited colon cancer cell proliferation in a concentration-dependent manner, whereas silymarin showed significant inhibition only at the highest concentrations [40]. We observed synergistic effects when colon cancer cells were treated with curcumin and silymarin in combination [40]. The combination treatment inhibited colon cancer cell proliferation and increased apoptosis compared with single compound-treated cells [40].
In the present study, we employed immunocompromised athymic nude mice to evaluate the antitumor activity of curcumin and silibinin B (major flavonolignan of silymarin), administered individually or in combination. The human colon cancer cell line DLD-1 was injected subcutaneously into the right and left flanks of mice. On Day 5, tumors were visible (average 50 mm3) and palpable. Animals were randomized to receive either vehicle (control), curcumin alone (C), silibinin B alone (S), or the combination of curcumin and silibinin B (CS). Treatments were administered orally by gavage for 34 consecutive days (Figure 1).
As shown in Figure 2A, only the CS combination group showed a statistically significant reduction in tumor volume observed at each time point (days 8 to 34; *=p<0.05, **=p<0.001). C and S showed a significant reduction only at early time points (days 10-16; p<0.05; Figure 2A). Animals were sacrificed on day 34, and the tumors were excised and weighed. Only the CS group showed a statistically significant reduction in tumor weight (p<0.05) compared with the control C alone or S alone groups (Figure 2B). There was no statistically significant difference in mouse body weight among the groups, indicating no adverse effects from phytochemical administration or cancer cell implantation (Figure 2C). Based on these results, the combination compound showed a statistically significant reduction in tumor volume compared with animals treated with a single compound.
3.2. CS Combination Treatment Increased Apoptotic Cell Death in the Tumor
In a previous in vitro study, we observed that cells treated with the combination (CS) exhibited pronounced cell rounding and membrane blebbing, features characteristic of apoptosis [40]. Measurement of caspase-3/7 activity, a standard indicator of apoptotic cell death, showed that combination-treated cells displayed significantly higher caspase activity than control or single compound-treated cells, indicating that CS induced apoptosis [40]. To extend these findings in vivo, we analyzed cleaved caspase-3, an apoptotic marker, by immunohistochemistry of mouse tumor sections (Figure 3). As shown in Figure 3, tumors from combination-treated animals exhibited significantly greater numbers of apoptotic cells, as evidenced by cleaved caspase-3 staining. These results suggest that apoptosis-mediated cell death is one mechanism by which the combination treatment reduces tumor burden.
3.3. Treatment of DLD-1 Cells with the Curcumin–Silibinin B (CS) Combination Significantly Increased Reactive Oxygen Species (ROS) Levels
Combination treatment produced significantly higher ROS levels in vitro than either compound alone or the vehicle control. DLD-1 colorectal cancer cells were treated with vehicle control (DMSO), 12.5 µM C, 12.5 µM S, or a combination of 12.5 µM CS, and intracellular ROS levels were measured. We observed that cells treated with the combination exhibited markedly increased ROS compared with vehicle-treated or single-compound-treated cells. Figure 4A shows the intensity of green fluorescence, which reflects ROS accumulation in the cells; combination-treated cells display visibly stronger fluorescence than the other groups. The quantification of relative ROS levels is shown in Figure 4B demonstrates that the CS combination significantly increased ROS in DLD-1 colorectal cancer cells.
3.4. Curcumin -Silibinin B Treatment Elevates ADP/ATP Ratio and p-AMPK Levels in DLD-1 Cells
An increase in ROS leads to mitochondrial impairment, which elevates the ADP/ATP ratio; therefore, we measured the ADP/ATP ratio under our treatment conditions. Cells were treated with vehicle control (DMSO), 12.5 µM curcumin (C), 12.5 µM silibinin B (S), or a combination of 12.5 µM curcumin plus 12.5 µM silibinin B (CS), and the ADP/ATP ratio was quantified. As shown in Figure 4C, only curcumin-treated and CS-treated cells exhibited an increased ADP/ATP ratio. Notably, the combination treatment (CS) induced a significantly higher ADP/ATP ratio compared with vehicle control and each compound alone.
Mitochondrial impairment caused by ROS is expected to increase the ADP/ATP ratio first, followed by an increase in the AMP/ATP ratio. This progressive energy depletion activates AMPK, leading to phosphorylation of AMPK (p-AMPK). Therefore, we assessed p-AMPK levels in treated cells to evaluate its activation and the downstream inhibitory effects on the mTORC1 pathway. As shown in Figure 4D, only the curcumin–silibinin B combination (CS) induced AMPK phosphorylation, whereas no phosphorylated AMPK was detected in vehicle- or individually-treated DLD-1 cells.
3.5. Treatment of DLD-1 Cells with the Curcumin–Silibinin B (CS) Combination Leads to Inhibition of the mTORC1 Pathway
To examine the effect of CS on signaling pathways, DLD-1 cells were treated with vehicle control, C (12.5uM), S (12.5uM), or CS (12.5uM of each) for 48 hrs. Then, the cells were lysed and analyzed by Western blot for the expression of phosphorylated 4E-BP1 and phosphorylated p70S6 kinase. The downstream proteins involved in the mTORC1 pathway, 4E-BP1 and p70S6 kinase, exhibited significantly decreased phosphorylation in CS-treated cells compared to C or S treatments alone, indicating mTORC1 was downregulated (Figure 5A,B). Phospho-4E-BP1 levels were significantly reduced in curcumin-treated and CS-treated cells, with the CS combination producing a greater inhibition than curcumin alone (Figure 5E). Inhibition of the mTORC1 pathway increases autophagy and apoptosis, leading to cell death [45,46,47,48]. During autophagy, vesicles or autophagosomes form around damaged organelles and proteins and fuse with lysosomes to degrade contents and recycle them. A hallmark of autophagy is the lipidation and conversion of LC3-I to LC3-II [49]. As shown in Figure 5C, increased LC3-II was evident in CS compared to C. But we observed that LC3-I and LC3-II bands were undetectable in vehicle- and S-treated cells. A potential explanation is that DLD-1 colorectal cancer cells exhibit low basal autophagy under nutrient-rich culture conditions, keeping autophagosome machinery below the threshold of detection during rapid proliferation [50,51]. To determine whether mTORC1 inhibition combined with increased reactive oxygen species (ROS) levels induces apoptosis in DLD-1 cells, we evaluated the expression of the pro-apoptotic markers Noxa and cleaved caspase-3. ROS can independently promote apoptosis through Noxa upregulation and caspase-3 activation, while mTORC1 inhibition can indirectly induce apoptosis by reducing protein synthesis and sensitizing cells to apoptotic signaling [52,53]. Both proteins were upregulated in C- and CS-treated cells compared to both the vehicle control and S-treated cells (Figure 5D). Based on these results, combination compounds exhibit anticancer activity by inhibiting mTORC1, which in turn can lead to apoptotic and autophagy-induced cell death.
4. Discussion
Tumor growth and progression require increased cell survival, unchecked cell proliferation, activation of anti-apoptotic pathways, induction of angiogenesis, deregulation of oncogenes, repression of tumor suppressor genes, and modulation of signaling pathways [54]. Therefore, targeting a single event may not be sufficient to prevent CRC. Anticancer agents that target multiple tumorigenic events may be more effective in inhibiting CRC tumor growth and progression. Rodent models have been extensively used for preclinical cancer drug development [55]. Animal models provide valuable insights into the physiological interactions between tumor cells and their environment in vivo. In this study, we used a xenograft model in athymic nude mice, which are immunocompromised and accept human tumor cells, thereby allowing tumor development. Human xenograft tumor growth depends on the interplay between the human tumor cells and murine stromal cells, such as endothelial cells, leukocytes, and fibroblasts recruited to generate a pro-tumor microenvironment [58]. Athymic nude mice used in our xenograft model have a T cell deficiency, allowing for the growth of the xenografted tumor cells. Even though the immunodeficiency is severe in this model, both the humoral and innate adaptive immune systems remain intact. Despite the immunologically deficient environment, the model supports the formation of three-dimensional tumors and incorporates a tumor microenvironment (TME) that provides extracellular matrix, tumor–stroma interactions, and vascularization, thereby partially recapitulating human tumor biology [56]. Our results suggest that combination compound treatment significantly reduced tumor formation, and this reduction was due to increased apoptosis.
Our long-term goal is to elucidate the mechanism of CS action in CRC using in vitro and in vivo models, thereby reducing CRC incidence in high-risk groups. To understand how some of the crucial pathways are affected by CS compounds that may explain the anticancer activity, we explored the phytochemical effects on anticancer activity in vitro. We treated DLD-1 CRC cells with single or combination compounds and evaluated the effects on ROS, AMPK activation, and mTOR1 pathway status. Compared to normal cells, cancer cells have elevated ROS, because of increased metabolic activity [41,42]. They maintain high energy levels by increased glycolysis followed by lactic acid fermentation in the presence of abundant oxygen. In other words, they use aerobic glycolysis [48,57]. Any compound that increases ROS in cancer cells will reach a high ROS threshold, causing cell death [41]. Normal cells cannot undergo cell death from these compounds because basal ROS levels are low, so they cannot reach a higher ROS threshold that would trigger apoptosis. Phytochemicals such as C bind to ROS-scavenging enzymes in cancer cells, thereby increasing ROS to much higher levels [41]. The increased ROS kill leukemic cells but not normal cells [41]. Several dietary phytochemicals that increase ROS have been shown to selectively target cancer cells for killing [58,59]. The apoptosis we observed in vivo is likely due to increased ROS, among other mechanisms. To verify the increase in ROS, we treated DLD-1 cells with vehicle, C, S, or CS and found that only CS-treated cells exhibited significantly increased ROS (section 3.3). Elevated ROS can independently trigger apoptosis by inducing oxidative damage to DNA, lipids, and proteins [60]. Compared with normal cells, cancer cells maintain intrinsically higher ROS levels due to increased glycolysis, mitochondrial dysfunction, and oncogenic signaling; however, they rely heavily on antioxidant systems to survive this oxidative stress [61]. Phytochemicals can disrupt this balance by inhibiting ROS-scavenging enzymes, thereby pushing ROS levels beyond the cytotoxic threshold and inducing cell death, as observed in mouse tumors (Figure 3) [62,63].
ROS levels can impair mitochondrial function, leading to an increased ADP/ATP ratio. To assess this under our treatment conditions, we quantified the ADP/ATP ratio in cells treated with vehicle control (DMSO), 12.5 µM curcumin (C), 12.5 µM silibinin B (S), or the combination of curcumin plus silibinin (CS). As shown in Figure 4C, only curcumin- and CS-treated cells exhibited an increased ADP/ATP ratio. Notably, the combination treatment induced a significantly greater increase compared with vehicle control and each compound alone.
Mitochondrial dysfunction driven by ROS is expected to elevate the ADP/ATP ratio first, followed by an increase in the AMP/ATP ratio. This progressive decline in cellular energy activates AMPK, resulting in phosphorylation of AMPK (p-AMPK). Therefore, we evaluated p-AMPK levels in treated cells to determine the extent of AMPK activation and its downstream inhibitory effects on the mTORC1 pathway. We found that in CS-treated cells, there is an increase in p-AMPK, which is an active form and functions as an energy stress sensor. Active p-AMPK shuts down the major anabolic pathway mTORC1. Therefore, we next assessed the status of the mTORC1 pathway in phytochemical-treated cells.
mTORC1 is a central regulator of cellular growth that integrates nutritional and environmental cues, including energy availability and redox status [64,65,66]. When activated, mTORC1 promotes the transcriptional and translational programs required for cell growth, while simultaneously suppressing autophagy and apoptosis [47,67]. Therefore, sustained activation of mTORC1 inhibits programmed cell death and enhances cell proliferation, contributing to tumorigenesis [68]. A key initial event in autophagy is the formation of an autophagosome mediated by ULK1-complex and the first step is initiated by ULK1 kinase activity [47,69]. To inhibit autophagy, activated mTORC1 inactivates ULK1 [47,70]. mTORC1 regulates multiple components of the protein-synthesis machinery, including translation initiation and elongation factors as well as ribosome biogenesis [71]. Upon activation, mTORC1 phosphorylates two major downstream effectors, 4E-BP1 and p70S6K. 4E-BP1 normally functions as a translational repressor by binding to the initiation factor eIF4E; phosphorylation of 4E-BP1 causes its dissociation from eIF4E, thereby permitting translation initiation [71,72]. Phosphorylation of p70S6K1 activates a set of downstream targets that collectively enhance mRNA translation and promote protein synthesis. Therefore, reduced phosphorylation of 4E-BP1 and p70S6K indicates inhibition of the mTORC1 pathway. We found that in CS-treated cells, the phosphorylated forms of 4E-BP1 and p70S6K were markedly reduced (Figure 5A,B). Compared with control-treated cells, the CS combination significantly suppressed phospho-4E-BP1 expression (Figure 5E).
If the mTORC1 pathway is inhibited, autophagy is expected to increase. During autophagy, double-membrane vesicles (autophagosomes) form around damaged organelles and proteins, which subsequently fuse with lysosomes to degrade and recycle their contents. A hallmark of autophagy is the lipidation and conversion of LC3-I to LC3-II [49]. We observed an increase in LC3-II levels, with the strongest induction in CS-treated cells, moderate induction in C-treated cells, and no LC3-II detected in vehicle-treated or silibinin-treated cells. The reason there is no detection of LC3-I in vehicle- and S-treated cells may be that some cell lines show very low basal autophagy in nutrient-rich growth conditions that cannot be detected [50,51]. We observed both in the in vivo experiment and our earlier study that curcumin and silymarin increased apoptosis [40]. Our findings support the hypothesis that simultaneous mTORC1 inhibition and elevated ROS levels drive DLD-1 cells toward programmed cell death. This is evidenced by the marked upregulation of the pro-apoptotic markers Noxa and cleaved caspase-3 in C- and CS-treated cells compared with the control and S-treated groups (Figure 5D). These results indicate that ROS independently promotes apoptosis through Noxa induction and caspase-3 activation, whereas mTORC1 inhibition indirectly facilitates this process. By limiting de novo protein synthesis, mTORC1 suppression sensitizes malignant cells to downstream apoptotic signaling, thereby amplifying the overall cytotoxic response.
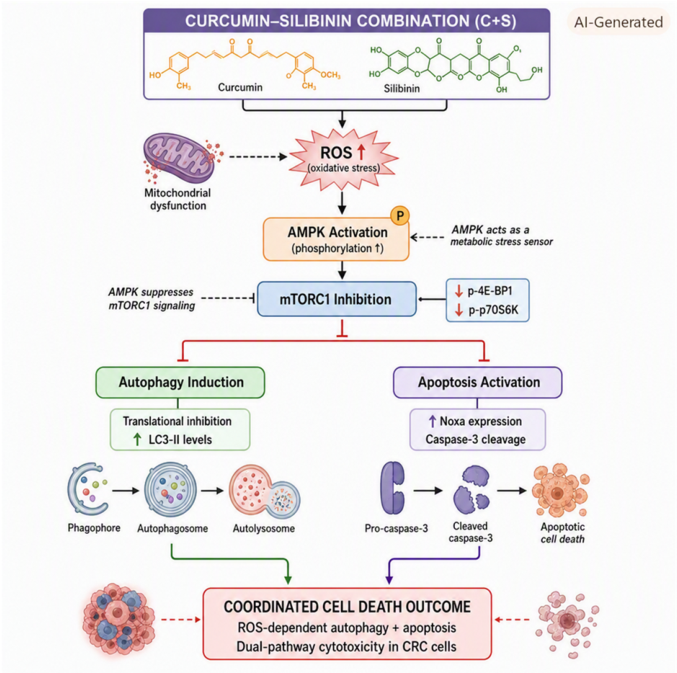
In the present study, we demonstrated that the CS combination inhibits the mTORC1 pathway, significantly increases ROS production, and elevates markers of autophagy and apoptosis in DLD-1 cells. Based on these findings, we postulate that CS engages multiple cellular mechanisms, including pathways governing cell survival and proliferation, and elicits anticancer activity (Figure 6). Future studies will focus on characterizing additional signaling cascades affected by CS, such as the Wnt pathway in vitro. Furthermore, we aim to utilize a xenograft mouse model to investigate how CS modulates the tumor microenvironment (TME), particularly regarding its role in fostering pro-tumorigenic cytokines, growth factors, and chronic inflammation [73].
Author Contributions
Conceptualization, data curation, investigation, methodology, and writing: U.R.E.; Data curation, investigation, and methodology: A.S.; Methodology, writing, and editing: R.M.H.; Data curation and methodology: M.H, V.S.S and G.K.
Funding
A.S, M.H., V.S.S, U.R.E, and R.M.H were supported by a grant from the DeNardo Education and Research Foundation.
Institutional Review Board Statement
All animal procedures in these experiments were reviewed and approved by the Saint Louis University Institutional Animal Care and Use Committee (IACUC Animal Protocol #2649, approval date: 7/26/2023).
Data Availability Statement
The data presented in this study are available on request from the corresponding author.
Acknowledgments
The authors thank the staff of the Department of Comparative Medicine, including Jenni Franey and Melanie Wiese, for their technical support.
Conflicts of Interest
The author declares no conflicts of interest.
References
- Sung, H.; et al. Global Cancer Statistics 2020: GLOBOCAN Estimates of Incidence and Mortality Worldwide for 36 Cancers in 185 Countries. CA Cancer J. Clin. 2021, 71(3), 209–249. [Google Scholar] [CrossRef] [PubMed]
- Sung, H.; et al. Global cancer statistics 2024: GLOBOCAN estimates of incidence and mortality worldwide for 34 cancers in 186 countries. CA Cancer J. Clin. 2026, 76(4), e70090. [Google Scholar] [CrossRef] [PubMed]
- Siegel, R.L.; et al. Colorectal cancer statistics, 2023. CA Cancer J. Clin. 2023, 73(3), 233–254. [Google Scholar] [CrossRef] [PubMed]
- Bailey, C.E.; et al. Increasing disparities in the age-related incidences of colon and rectal cancers in the United States, 1975-2010. JAMA Surg. 2015, 150(1), 17–22. [Google Scholar] [CrossRef] [PubMed]
- Haggar, F.A.; Boushey, R.P. Colorectal cancer epidemiology: incidence, mortality, survival, and risk factors. Clin. Colon Rectal Surg. 2009, 22(4), 191–7. [Google Scholar] [CrossRef] [PubMed]
- Baena, R.; Salinas, P. Diet and colorectal cancer. Maturitas 2015, 80(3), 258–64. [Google Scholar] [CrossRef] [PubMed]
- Ahn, J.Y.; et al. Colonic mucosal immune activity in irritable bowel syndrome: comparison with healthy controls and patients with ulcerative colitis. Dig. Dis. Sci. 2014, 59(5), 1001–11. [Google Scholar] [CrossRef] [PubMed]
- Salzer, E.; et al. Early-onset inflammatory bowel disease and common variable immunodeficiency-like disease caused by IL-21 deficiency. J. Allergy Clin. Immunol. 2014, 133(6), 1651–9 e12. [Google Scholar] [CrossRef] [PubMed]
- Herceg, Z.; Hainaut, P. Genetic and epigenetic alterations as biomarkers for cancer detection, diagnosis and prognosis. Mol. Oncol. 2007, 1(1), 26–41. [Google Scholar] [CrossRef] [PubMed]
- Mani, S.; et al. DNA methylation changes associated with risk factors in tumors of the upper aerodigestive tract. Epigenetics 2012, 7(3), 270–7. [Google Scholar] [CrossRef] [PubMed]
- Yuan, T.; et al. Identification and external validation of tumor DNA methylation panel for the recurrence risk stratification of stage II colon cancer. Transl. Oncol. 2025. 57, 102405. [Google Scholar] [CrossRef] [PubMed]
- Goel, A.; Boland, C.R. Epigenetics of colorectal cancer. Gastroenterology 2012, 143(6), 1442–1460 e1. [Google Scholar] [CrossRef] [PubMed]
- Kaiser, J.C.; Meckbach, R.; Jacob, P. Genomic instability and radiation risk in molecular pathways to colon cancer. PLoS ONE 2014, 9(10), e111024. [Google Scholar] [CrossRef] [PubMed]
- Liu, Y.Q.; et al. Protection against chemotherapy- and radiotherapy-induced side effects: A review based on the mechanisms and therapeutic opportunities of phytochemicals. Phytomedicine 2021, 80, 153402. [Google Scholar] [CrossRef] [PubMed]
- Boute, T.C.; et al. Cumulative Incidence, Risk Factors, and Overall Survival of Disease Recurrence after Curative Resection of Stage II-III Colorectal Cancer: A Population-based Study. Cancer Res. Commun. 2024, 4(2), 607–616. [Google Scholar] [CrossRef] [PubMed]
- Willett, W.C.; et al. Relation of meat, fat, and fiber intake to the risk of colon cancer in a prospective study among women. N Engl. J. Med. 1990, 323(24), 1664–72. [Google Scholar] [CrossRef] [PubMed]
- Steinmetz, K.A.; Potter, J.D. Vegetables, fruit, and cancer. II. Mechanisms. Cancer Causes Control 1991, 2(6), 427–442. [Google Scholar] [CrossRef] [PubMed]
- Al-Ishaq, R.K.; Overy, A.J.; Busselberg, D. Phytochemicals and Gastrointestinal Cancer: Cellular Mechanisms and Effects to Change Cancer Progression. Biomolecules 2020, 10(1). [Google Scholar] [CrossRef] [PubMed]
- Islam, S.U.; et al. Recent Molecular Mechanisms and Beneficial Effects of Phytochemicals and Plant-Based Whole Foods in Reducing LDL-C and Preventing Cardiovascular Disease. Antioxidants 2021, 10(5). [Google Scholar] [CrossRef] [PubMed]
- Rustgi, A.K. The genetics of hereditary colon cancer. Genes Dev. 2007, 21(20), 2525–38. [Google Scholar] [CrossRef] [PubMed]
- Aggarwal, B.B.; Shishodia, S. Molecular targets of dietary agents for prevention and therapy of cancer. Biochem Pharmacol. 2006, 71(10), 1397–421. [Google Scholar] [CrossRef] [PubMed]
- Li, Y.H.; et al. Role of phytochemicals in colorectal cancer prevention. World J. Gastroenterol. 2015, 21(31), 9262–72. [Google Scholar] [CrossRef] [PubMed]
- Meadows, G.G. Diet, nutrients, phytochemicals, and cancer metastasis suppressor genes. Cancer Metastasis Rev. 2012, 31(3-4), 441–454. [Google Scholar] [CrossRef] [PubMed]
- Mehta, R.S.; et al. Dietary Patterns and Risk of Colorectal Cancer: Analysis by Tumor Location and Molecular Subtypes. Gastroenterology 2017, 152(8), 1944–1953 e1. [Google Scholar] [CrossRef] [PubMed]
- Nimptsch, K.; et al. Dietary patterns during high school and risk of colorectal adenoma in a cohort of middle-aged women. Int. J. Cancer 2014, 134(10), 2458–67. [Google Scholar] [CrossRef] [PubMed]
- Sinha, R.; et al. Cancer risk and diet in India. J. Postgrad. Med. 2003, 49(3), 222–8. [Google Scholar] [PubMed]
- Sinha, R.; et al. Lifestyle and Sporadic Colorectal Cancer in India. Asian Pac. J. Cancer Prev. 2015, 16(17), 7683–8. [Google Scholar] [CrossRef] [PubMed]
- Rizeq, B.; et al. The Power of Phytochemicals Combination in Cancer Chemoprevention. J. Cancer 2020, 11(15), 4521–4533. [Google Scholar] [CrossRef] [PubMed]
- Kotecha, R.; Takami, A.; Espinoza, J.L. Dietary phytochemicals and cancer chemoprevention: a review of the clinical evidence. Oncotarget 2016, 7(32), 52517–52529. [Google Scholar] [CrossRef] [PubMed]
- Choudhari, A.S.; et al. Phytochemicals in Cancer Treatment: From Preclinical Studies to Clinical Practice. Front Pharmacol. 2019, 10, 1614. [Google Scholar] [CrossRef] [PubMed]
- Jain, A.; Madu, C.O.; Lu, Y. Phytochemicals in Chemoprevention: A Cost-Effective Complementary Approach. J. Cancer 2021, 12(12), 3686–3700. [Google Scholar] [CrossRef] [PubMed]
- Pricci, M.; et al. Curcumin and Colorectal Cancer: From Basic to Clinical Evidences. Int. J. Mol. Sci. 2020, 21(7). [Google Scholar] [CrossRef] [PubMed]
- Carroll, R.E.; et al. Phase IIa clinical trial of curcumin for the prevention of colorectal neoplasia. Cancer Prev. Res. (Phila) 2011, 4(3), 354–64. [Google Scholar] [CrossRef] [PubMed]
- Epstein, J.; Sanderson, I.R.; Macdonald, T.T. Curcumin as a therapeutic agent: the evidence from in vitro, animal and human studies. Br. J. Nutr. 2010, 103(11), 1545–57. [Google Scholar] [CrossRef] [PubMed]
- Chainani-Wu, N. Safety and anti-inflammatory activity of curcumin: a component of tumeric (Curcuma longa). J. Altern. Complement Med. 2003, 9(1), 161–168. [Google Scholar] [CrossRef] [PubMed]
- Sharifi-Rad, J.; et al. Turmeric and Its Major Compound Curcumin on Health: Bioactive Effects and Safety Profiles for Food, Pharmaceutical, Biotechnological and Medicinal Applications. Front Pharmacol. 2020, 11, 01021. [Google Scholar] [CrossRef] [PubMed]
- Shen, L.; et al. How does curcumin work with poor bioavailability? Clues from experimental and theoretical studies. Sci. Rep. 2016, 6, 20872. [Google Scholar] [CrossRef] [PubMed]
- Anand, P.; et al. Bioavailability of curcumin: problems and promises. Mol. Pharm. 2007, 4(6), 807–18. [Google Scholar] [CrossRef] [PubMed]
- Marshall, J.R. Nutrition and colon cancer prevention. Curr. Opin. Clin. Nutr. Metab. Care 2009, 12(5), 539–43. [Google Scholar] [CrossRef] [PubMed]
- Montgomery, A.; et al. Curcumin Sensitizes Silymarin to Exert Synergistic Anticancer Activity in Colon Cancer Cells. J. Cancer 2016, 7(10), 1250–7. [Google Scholar] [CrossRef] [PubMed]
- Larasati, Y.A.; et al. Curcumin targets multiple enzymes involved in the ROS metabolic pathway to suppress tumor cell growth. Sci Rep. 2018, 8(1), 2039. [Google Scholar] [CrossRef] [PubMed]
- Hu, Y.; et al. Antioxidant curcumin induces oxidative stress to kill tumor cells (Review). Oncol. Lett. 2024, 27(2), 67. [Google Scholar] [CrossRef] [PubMed]
- Bankhead, P.; et al. QuPath: Open source software for digital pathology image analysis. Sci. Rep. 2017, 7(1), 16878. [Google Scholar] [CrossRef] [PubMed]
- Selc, M.; Babelova, A. Looking beyond silybin: the importance of other silymarin flavonolignans. Front Pharmacol. 2025, 16, 1637393. [Google Scholar] [CrossRef] [PubMed]
- Kma, L.; Baruah, T.J. The interplay of ROS and the PI3K/Akt pathway in autophagy regulation. Biotechnol. Appl. Biochem 2021. [Google Scholar] [CrossRef] [PubMed]
- Bu, H.; et al. AMPK/mTOR/ULK1 Axis-Mediated Pathway Participates in Apoptosis and Autophagy Induction by Oridonin in Colon Cancer DLD-1 Cells. Onco Targets Ther. 2020, 13, 8533–8545. [Google Scholar] [CrossRef] [PubMed]
- Rabanal-Ruiz, Y.; Otten, E.G.; Korolchuk, V.I. mTORC1 as the main gateway to autophagy. Essays Biochem 2017, 61(6), 565–584. [Google Scholar] [CrossRef] [PubMed]
- Zhao, Y.; et al. ROS signaling under metabolic stress: cross-talk between AMPK and AKT pathway. Mol. Cancer 2017, 16(1), 79. [Google Scholar] [CrossRef] [PubMed]
- Grasso, D.; Renna, F.J.; Vaccaro, M.I. Initial Steps in Mammalian Autophagosome Biogenesis. Front Cell Dev. Biol. 2018, 6, 146. [Google Scholar] [CrossRef] [PubMed]
- Samdal, H.; et al. Basal level of autophagy and MAP1LC3B-II as potential biomarkers for DHA-induced cytotoxicity in colorectal cancer cells. FEBS J. 2018, 285(13), 2446–2467. [Google Scholar] [CrossRef] [PubMed]
- Sato, K.; et al. Autophagy is activated in colorectal cancer cells and contributes to the tolerance to nutrient deprivation. Cancer Res. 2007, 67(20), 9677–84. [Google Scholar] [CrossRef] [PubMed]
- Tonino, S.H.; et al. ROS-mediated upregulation of Noxa overcomes chemoresistance in chronic lymphocytic leukemia. Oncogene 2011, 30(6), 701–13. [Google Scholar] [CrossRef] [PubMed]
- Akter, S.; et al. Reactive oxygen species (ROS) in cancer: from mechanism to therapeutic implications. Signal Transduct. Target Ther. 2026, 11(1). [Google Scholar] [CrossRef] [PubMed]
- Park, J.H.; Pyun, W.Y.; Park, H.W. Cancer Metabolism: Phenotype, Signaling and Therapeutic Targets. Cells 2020, 9(10). [Google Scholar] [CrossRef] [PubMed]
- McIntyre, R.E.; et al. Mouse models of colorectal cancer as preclinical models. Bioessays 2015, 37(8), 909–20. [Google Scholar] [CrossRef] [PubMed]
- Lindner, D. Animal models and the tumor microenvironment: studies of tumor-host symbiosis. Semin Oncol. 2014, 41(2), 146–55. [Google Scholar] [CrossRef] [PubMed]
- Liberti, M.V.; Locasale, J.W. The Warburg Effect: How Does it Benefit Cancer Cells? Trends Biochem Sci. 2016, 41(3), 211–218. [Google Scholar] [CrossRef] [PubMed]
- NavaneethaKrishnan, S.; Rosales, J.L.; Lee, K.Y. ROS-Mediated Cancer Cell Killing through Dietary Phytochemicals. Oxid. Med. Cell Longev. 2019, 9051542. [Google Scholar] [PubMed]
- Mileo, A.M.; Miccadei, S. Polyphenols as Modulator of Oxidative Stress in Cancer Disease: New Therapeutic Strategies. Oxid. Med. Cell Longev. 2016, 6475624. [Google Scholar] [CrossRef] [PubMed]
- Zhao, Y.; et al. Cancer Metabolism: The Role of ROS in DNA Damage and Induction of Apoptosis in Cancer Cells. Metabolites 2023, 13(7). [Google Scholar] [CrossRef] [PubMed]
- Purohit, V.; Simeone, D.M.; Lyssiotis, C.A. Metabolic Regulation of Redox Balance in Cancer. Cancers 2019, 11(7). [Google Scholar] [CrossRef] [PubMed]
- Gaikwad, S.; Srivastava, S.K. Role of Phytochemicals in Perturbation of Redox Homeostasis in Cancer. Antioxidants 2021, 10(1). [Google Scholar] [CrossRef] [PubMed]
- Gorrini, C.; Harris, I.S.; Mak, T.W. Modulation of oxidative stress as an anticancer strategy. Nat. Rev. Drug Discov. 2013, 12((12), 931–47. [Google Scholar] [CrossRef] [PubMed]
- Borders, E.B.; Bivona, C.; Medina, P.J. Mammalian target of rapamycin: biological function and target for novel anticancer agents. Am. J. Health Syst. Pharm. 2010, 67(24), 2095–106. [Google Scholar] [CrossRef] [PubMed]
- Hay, N.; Sonenberg, N. Upstream and downstream of mTOR. Genes Dev. 2004, 18(16), 1926–45. [Google Scholar] [CrossRef] [PubMed]
- Foster, K.G.; Fingar, D.C. Mammalian target of rapamycin (mTOR): conducting the cellular signaling symphony. J. Biol. Chem. 2010, 285(19), 14071–7. [Google Scholar] [CrossRef] [PubMed]
- Noda, T. Regulation of Autophagy through TORC1 and mTORC1. Biomolecules 2017, 7(3). [Google Scholar] [CrossRef] [PubMed]
- Thiem, S.; et al. mTORC1 inhibition restricts inflammation-associated gastrointestinal tumorigenesis in mice. J. Clin. Invest 2013, 123(2), 767–81. [Google Scholar] [CrossRef] [PubMed]
- Dunlop, E.A.; Tee, A.R. The kinase triad, AMPK, mTORC1 and ULK1, maintains energy and nutrient homoeostasis. Biochem Soc. Trans. 2013, 41(4), 939–43. [Google Scholar] [CrossRef] [PubMed]
- Carroll, B.; Dunlop, E.A. The lysosome: a crucial hub for AMPK and mTORC1 signalling. Biochem J. 2017, 474(9), 1453–1466. [Google Scholar] [CrossRef] [PubMed]
- Thoreen, C.C. The molecular basis of mTORC1-regulated translation. Biochem Soc. Trans. 2017, 45(1), 213–221. [Google Scholar] [CrossRef] [PubMed]
- Acosta-Jaquez, H.A.; et al. Site-specific mTOR phosphorylation promotes mTORC1-mediated signaling and cell growth. Mol. Cell Biol. 2009, 29(15), 4308–24. [Google Scholar] [CrossRef] [PubMed]
- Shenoy, S. Cell plasticity in cancer: A complex interplay of genetic, epigenetic mechanisms and tumor micro-environment. Surg. Oncol. 2020, 34, 154–162. [Google Scholar] [CrossRef] [PubMed]
Figure 1.
Experimental design of the mouse tumor studies. Representative pictures of animals exhibiting tumors from the vehicle control, curcumin (C), silibinin B (S), and curcumin plus silibinin (CS) groups are shown.
Figure 1.
Experimental design of the mouse tumor studies. Representative pictures of animals exhibiting tumors from the vehicle control, curcumin (C), silibinin B (S), and curcumin plus silibinin (CS) groups are shown.
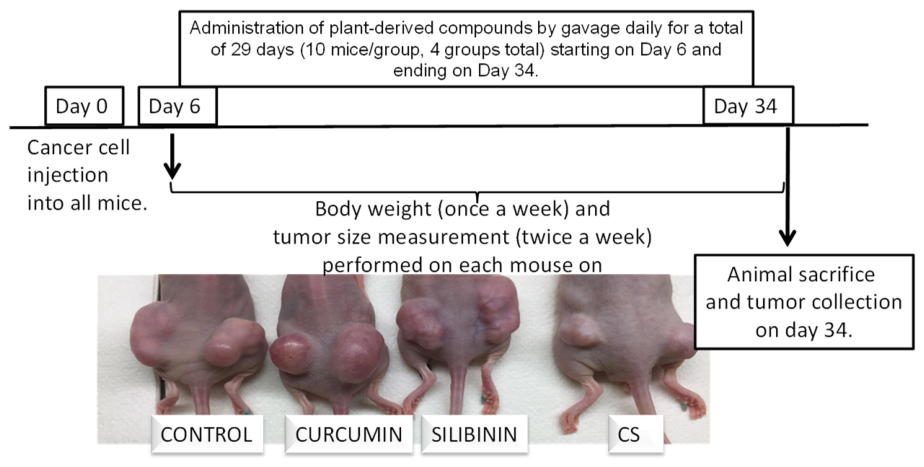
Figure 2.
Suppression of tumor growth by combination treatment with curcumin and silibinin B (CS). Five days after the DLD-1 cells were injected subcutaneously into mice, curcumin (C), silibinin B (S), or curcumin-silibinin B combination (CS) were administered by oral gavage daily from day 6 to day 34. (A) Tumor volume was measured as greatest longitudinal diameter (length) and greatest transverse diameter (width) and calculated using the following formula: 1/2 (length × width2). (B) Tumors were excised on day 34 and weighed. (C) Bodyweight of each mouse was measured, and mean body weight of mice in each group was compared to that of control mice. *=p<0.05 and ** = p<0.001. n = 10 mice per group consisting of 5 males and 5 females in each group.
Figure 2.
Suppression of tumor growth by combination treatment with curcumin and silibinin B (CS). Five days after the DLD-1 cells were injected subcutaneously into mice, curcumin (C), silibinin B (S), or curcumin-silibinin B combination (CS) were administered by oral gavage daily from day 6 to day 34. (A) Tumor volume was measured as greatest longitudinal diameter (length) and greatest transverse diameter (width) and calculated using the following formula: 1/2 (length × width2). (B) Tumors were excised on day 34 and weighed. (C) Bodyweight of each mouse was measured, and mean body weight of mice in each group was compared to that of control mice. *=p<0.05 and ** = p<0.001. n = 10 mice per group consisting of 5 males and 5 females in each group.
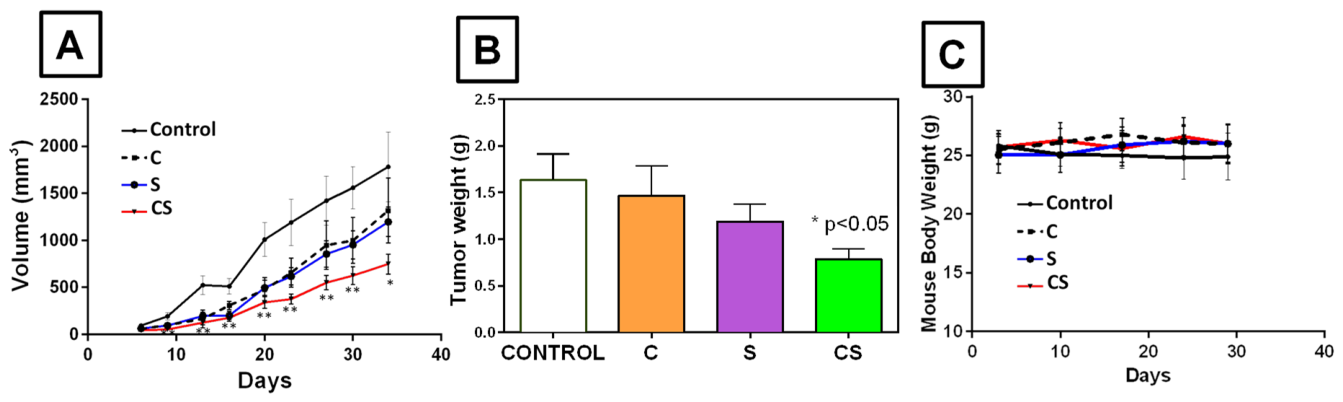
Figure 3.
An increase in cleaved caspase-3 is evident in combination-treated mouse tumors. (A) Representative immunohistochemical (IHC) images of cleaved caspase-3-stained tumor sections. (B) The cleaved caspase-3-positive area of three distinct tumors was quantified, and the percentage of positive cells was calculated based on the total cell count within the area. Only the curcumin-silibinin B combination (CS) group exhibited a significantly higher number of cleaved caspase-3-positive cells compared to the control, curcumin (C)-, and silibinin B (S)-treated groups. Statistical analysis was performed using a one-way ANOVA followed by Dunnett's multiple comparisons .post hoc test (*p<0.05).
Figure 3.
An increase in cleaved caspase-3 is evident in combination-treated mouse tumors. (A) Representative immunohistochemical (IHC) images of cleaved caspase-3-stained tumor sections. (B) The cleaved caspase-3-positive area of three distinct tumors was quantified, and the percentage of positive cells was calculated based on the total cell count within the area. Only the curcumin-silibinin B combination (CS) group exhibited a significantly higher number of cleaved caspase-3-positive cells compared to the control, curcumin (C)-, and silibinin B (S)-treated groups. Statistical analysis was performed using a one-way ANOVA followed by Dunnett's multiple comparisons .post hoc test (*p<0.05).
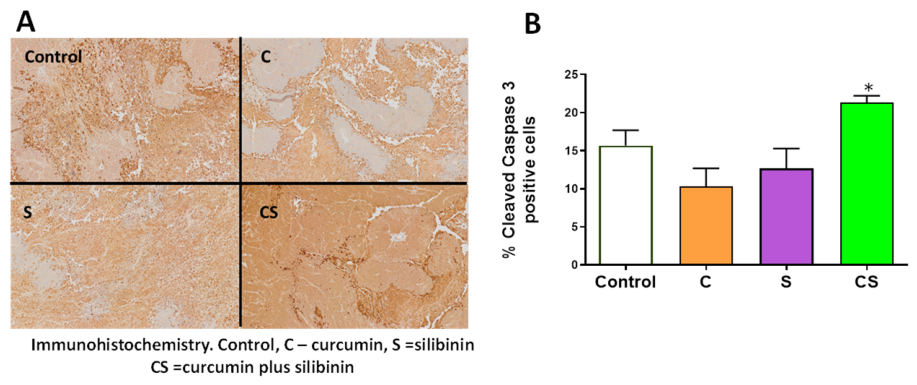
Figure 4.
Combined curcumin and silibinin B (CS) treatment increases ROS production, ADP/ATP ratio, and AMPK phosphorylation in DLD-1 colorectal cancer cells. The CS combination enhances intracellular oxidative and metabolic stress compared with single-agent or vehicle treatment. (A) Representative fluorescence images showing reactive oxygen species (ROS) levels in DLD-1 cells following treatment. The intensity of green fluorescence indicates intracellular ROS concentration. (B) Quantification of ROS levels in DLD-1 cells expressed as fold change relative to vehicle-treated control cells. DLD-1 cells were treated with vehicle control (DMSO), 12.5 µM curcumin (C), 12.5 µM silibinin B (S), or a combination of 12.5 µM C plus 12.5 µM S (CS). Data represent the mean ± SEM of at least three independent experiments (**p ≤ 0.01). The combination treatment significantly increased ROS levels compared with vehicle- and single compound–treated DLD-1 cells. (C) The CS combination treatment significantly increases the ADP/ATP ratio in DLD-1 cells compared with single-agent or vehicle-treated controls. Cells were treated as described above, and the ADP/ATP ratio was measured and normalized to total protein concentration. Data represent the mean ± SEM of at least four independent experiments (*P ≤ 0.05). (D) Western blot analysis demonstrating increased AMPK phosphorylation in DLD-1 cells treated with the curcumin–silibinin B combination. Whole-cell lysates from DMSO (control), C, S and CS–treated cells were analyzed. Increased phosphorylated AMPK (p-AMPK) was observed only in combination-treated cells, while total AMPK levels remained unchanged. GAPDH was used as the loading control. Statistical analysis was performed using a one-way ANOVA followed by Dunnett's multiple comparisons post hoc test. *p<0.05, **p<0.01.
Figure 4.
Combined curcumin and silibinin B (CS) treatment increases ROS production, ADP/ATP ratio, and AMPK phosphorylation in DLD-1 colorectal cancer cells. The CS combination enhances intracellular oxidative and metabolic stress compared with single-agent or vehicle treatment. (A) Representative fluorescence images showing reactive oxygen species (ROS) levels in DLD-1 cells following treatment. The intensity of green fluorescence indicates intracellular ROS concentration. (B) Quantification of ROS levels in DLD-1 cells expressed as fold change relative to vehicle-treated control cells. DLD-1 cells were treated with vehicle control (DMSO), 12.5 µM curcumin (C), 12.5 µM silibinin B (S), or a combination of 12.5 µM C plus 12.5 µM S (CS). Data represent the mean ± SEM of at least three independent experiments (**p ≤ 0.01). The combination treatment significantly increased ROS levels compared with vehicle- and single compound–treated DLD-1 cells. (C) The CS combination treatment significantly increases the ADP/ATP ratio in DLD-1 cells compared with single-agent or vehicle-treated controls. Cells were treated as described above, and the ADP/ATP ratio was measured and normalized to total protein concentration. Data represent the mean ± SEM of at least four independent experiments (*P ≤ 0.05). (D) Western blot analysis demonstrating increased AMPK phosphorylation in DLD-1 cells treated with the curcumin–silibinin B combination. Whole-cell lysates from DMSO (control), C, S and CS–treated cells were analyzed. Increased phosphorylated AMPK (p-AMPK) was observed only in combination-treated cells, while total AMPK levels remained unchanged. GAPDH was used as the loading control. Statistical analysis was performed using a one-way ANOVA followed by Dunnett's multiple comparisons post hoc test. *p<0.05, **p<0.01.
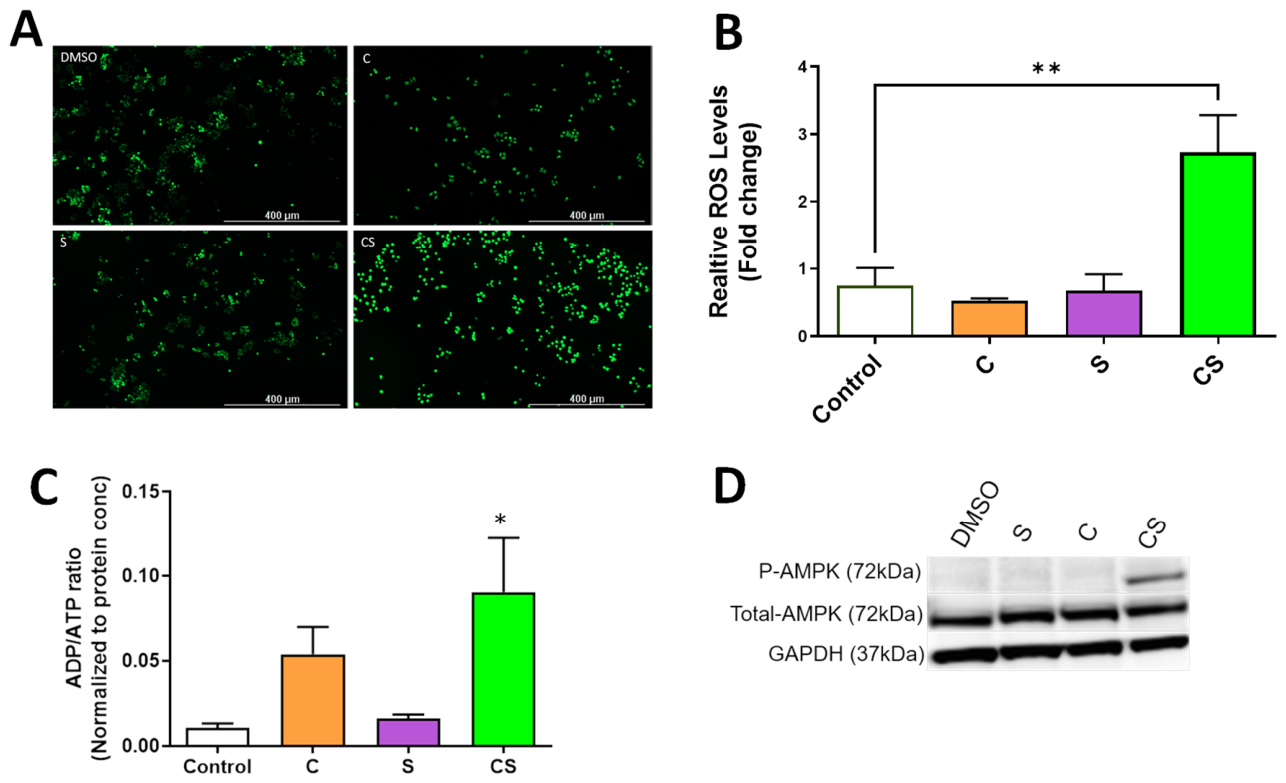
Figure 5.
Combined curcumin and silibinin B (CS) treatment inhibit mTORC1 and induces apoptosis and autophagy. Western blot analysis shows decreased levels of phosphorylated 4E-BP1 (A) and p70S6K (B) in CS-treated cells compared to control, curcumin (C)-treated, and silibinin B (S)-treated cells, indicating that the mTORC1 pathway is inhibited. (C) An increased conversion of LC3-I to LC3-II on the Western blot is observed exclusively in C- and CS-treated cells. (D) Furthermore, an upregulation of the pro-apoptotic protein Noxa and cleaved caspase-3 is observed only in C- and CS-treated cells, demonstrating activation of the apoptotic pathway and subsequent cell death. GAPDH was used as the loading control. (E) The band intensity of phospho-4E-BP1 was normalized to the respective GAPDH endogenous control, and fold changes were calculated relative to the DMSO vehicle control. All values represent the mean ± SEM of three independent experiments. Statistical analysis was performed using a one-way ANOVA followed by Dunnett's multiple comparisons post hoc test. *p<0.05, **p<0.01.
Figure 5.
Combined curcumin and silibinin B (CS) treatment inhibit mTORC1 and induces apoptosis and autophagy. Western blot analysis shows decreased levels of phosphorylated 4E-BP1 (A) and p70S6K (B) in CS-treated cells compared to control, curcumin (C)-treated, and silibinin B (S)-treated cells, indicating that the mTORC1 pathway is inhibited. (C) An increased conversion of LC3-I to LC3-II on the Western blot is observed exclusively in C- and CS-treated cells. (D) Furthermore, an upregulation of the pro-apoptotic protein Noxa and cleaved caspase-3 is observed only in C- and CS-treated cells, demonstrating activation of the apoptotic pathway and subsequent cell death. GAPDH was used as the loading control. (E) The band intensity of phospho-4E-BP1 was normalized to the respective GAPDH endogenous control, and fold changes were calculated relative to the DMSO vehicle control. All values represent the mean ± SEM of three independent experiments. Statistical analysis was performed using a one-way ANOVA followed by Dunnett's multiple comparisons post hoc test. *p<0.05, **p<0.01.
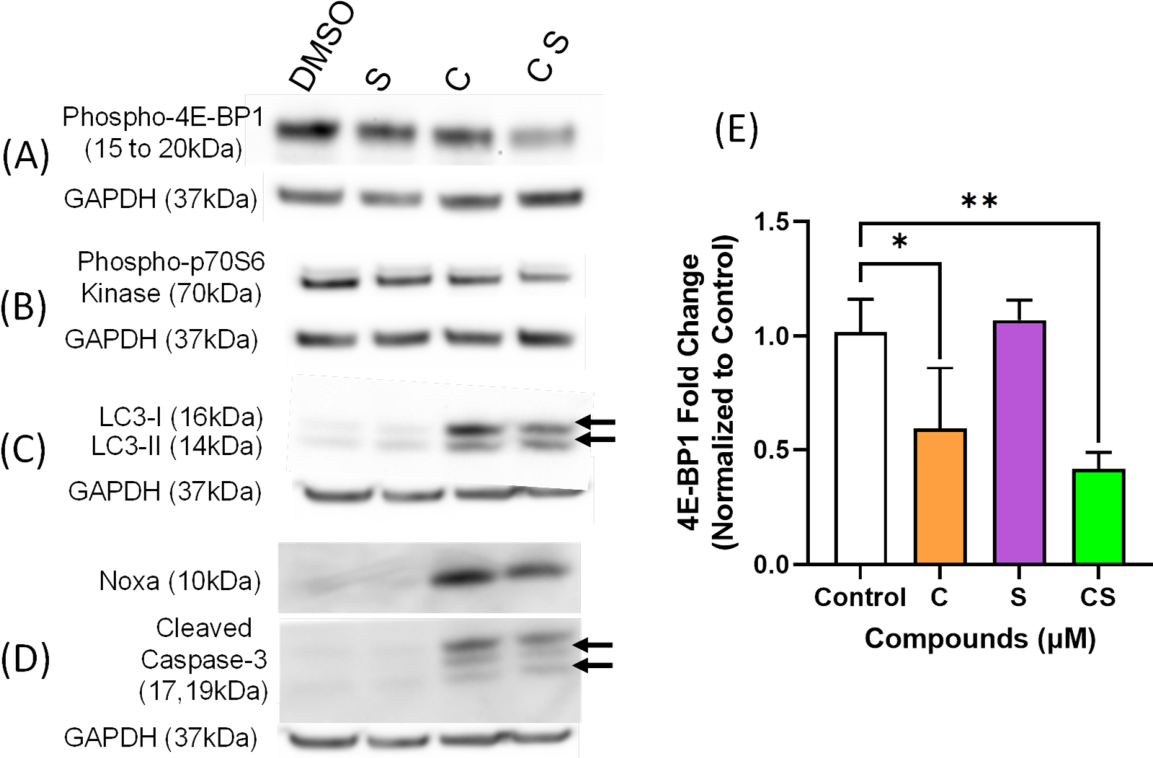
Figure 6.
Model: The Model illustrates the proposed mechanism by which the curcumin–silibinin B (CS) combination induces cell death in colorectal cancer (CRC) cells through coordinated, ROS-dependent autophagic and apoptotic pathways.
Figure 6.
Model: The Model illustrates the proposed mechanism by which the curcumin–silibinin B (CS) combination induces cell death in colorectal cancer (CRC) cells through coordinated, ROS-dependent autophagic and apoptotic pathways.
Disclaimer/Publisher’s Note: The statements, opinions and data contained in all publications are solely those of the individual author(s) and contributor(s) and not of MDPI and/or the editor(s). MDPI and/or the editor(s) disclaim responsibility for any injury to people or property resulting from any ideas, methods, instructions or products referred to in the content. |
© 2026 by the authors. Licensee MDPI, Basel, Switzerland. This article is an open access article distributed under the terms and conditions of the Creative Commons Attribution (CC BY) license.
Copyright: This open access article is published under a Creative Commons CC BY 4.0 license, which permit the free download, distribution, and reuse, provided that the author and preprint are cited in any reuse.