

Submitted:
16 August 2026
Posted:
18 August 2026
You are already at the latest version
Abstract
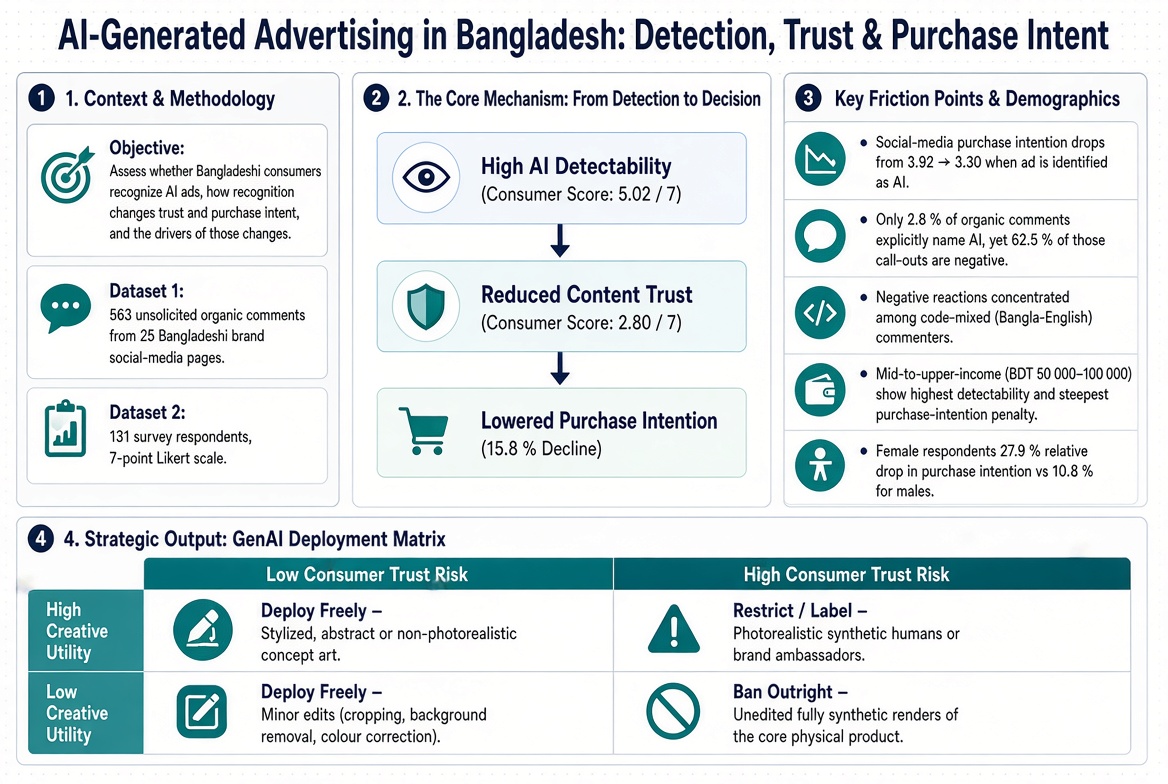
Background: Marketing through social media is turning out to be a significant part of the economy for Bangladesh, as one of the fastest growers in economy in one of the largest markets of the world; South Asia. Bangladeshi social media-based marketing adapted AI-generated content as a marketing tool-kit, this study aims to measure the impact it has on the perspectives of the consumers as it grows as a popular choice amongst marketeers. The sentiment was measured through surveys and observing real sentiments of the comment sections of the ads and try to identify a pattern rather than a generalizable conclusion. Objectives: This study examines three holistic questions that tries to assess this overall situation: can Bangladeshi consumers tell AI-generated advertising apart from conventional work; does that recognition alter trust and purchase intention; and which internal factors (trust, perceived risk, aesthetic judgment) plus external factors (language, income, platform behavior) explain any of the difference observed. Methods: Two complementary datasets were gathered for the project. The first comprises 563 unsolicited comments taken from the public social-media pages of 25 Bangladeshi brands. The second is a survey of 131 respondents that captured AI detectability, trust and purchase intention on seven-point Likert scales. Comments received manual coding for sentiment, theme and language or dialect. Survey answers were summarized with descriptive statistics and then cross-tabulated by gender, age and income. Results: Participants place their own detection skill at 5.02 out of 7, yet assign AI-generated content a trust score of only 2.85—almost identical to the 2.82 baseline they give ordinary social-media brand claims. Average purchase intention for social-media advertising sits at 3.92 and drops to 3.30 once respondents believe the advertisement was produced by AI, a reduction of 0.62 points or 15.8 percent (p < .01). Inside the comment corpus only 2.8 percent of posts name AI directly, but 62.5 percent of those posts are negative. The negative reactions cluster among code-mixed Bangla-English commenters and among mid-to-upper-income respondents. Conclusions: These patterns underwrite a four-principle, risk-tiered framework that brands can use when they deploy generative AI in advertising creative.
Keywords:
generative artificial intelligence
; advertising
; consumer trust
; purchase intention
; social media
; sentiment analysis
; Bangladesh
1. Introduction
Generative AI has settled into the ordinary toolkit category of social-media advertising. A compact creative team can now publish more material, more quickly, without a matching rise in cost (Grewal et al., 2025). As the contents are geared towards social media, therefore on platforms that reward frequent and visually distinctive posts, generative systems handle ideation, background creation, image variation, copy drafting and light finishing work across the production chain to achieve a level of output human brains and physicality would falter at and be exhausted (Grewal et al., 2025).
1.1. The Marketing Paradox
Any efficiency that is gained through high-volume, scheduled posting during production remains invisible until a consumer notice something is amiss. It happens because consumers do not encounter or experience a campaign as an internal workflow, rather they view it as a claim about a product which will influence their purchase decision.
When a generative image of a product inflates the natural appearance or makes that product appear better than it is, or simply makes it look off, the brand pays the price in dividends at a later point of time that is at the moment of purchase rather than at the moment of creating the ad on its own. In the end, the same technology that lowers the cost of producing the mass volume of advertising can therefore raise the cost of making people to believe it.
1.2. Research Objectives and Questions
The present study examines that trade-off head-on. It asks three questions: (i) whether Bangladeshi consumers can spot AI-generated advertising on social media, (ii) whether detection shifts their trust and purchase intention, and (iii) which internal and external consumer factors change the size of that shift. The article first reviews the relevant consumer-behavior theory (Section 2), then describes the dual-dataset design (Section 3), reports findings from the organic comment corpus (Section 4) and the survey (Section 5), presents demographic cross-analysis (Section 6), interprets the results through a consumer decision-process model (Section 7 and Section 8), and finally converts the evidence into a deployment framework, implementation roadmap, limitations statement and conclusion (Section 9, Section 10, Section 11, Section 12 and Section 13).
2. Theoretical Framework
Consumer responses to AI-generated advertising can be mapped onto the same internal and external factors that organize the classical buyer-behavior theory. The difference is that the new technology alters content production rather than the product category.
2.1. Internal Consumer Factors
Perception, learning, motivation, attitude and personality together shape how any individual reads a marketing stimulus. In the case of AI-generated advertisements, the most crucial point is how the consumer in their initial point of contact assume or have the idea of how the advertisement is or whether or not their claims are true: if a consumer in their first impression registers that the image or claim appears synthetic/inflated or exaggerated before trust, risk or purchase intention can shift downstream.
2.2. Perception and Selective Attention
Our social media feeds contain so much information that our brains have a hard time comprehending them or processing them fully (Malhotra, 1984). Consequently, while browsing through the mindless sea of posts, imageries and videos; a single small visual cue, an unnatural texture, an implausible background, a repeated stock element can pull a post out of passive scrolling and into active scrutiny (Pieters & Wedel, 2004). That mechanism aligns with the comment-level observation in Section 4.3 where explicit AI callouts remain rare, yet once they appear they carry outsized weight and in retrospect mostly negative.
2.3. Trust and Perceived Risk
The brands invest massively through advertisements, product qualities and visual to develop Trust among customers. Trust functions as a practical shortcut that lets consumers act on their better judgement (Morgan & Hunt, 1994). When a consumer that is a viewer of a certain ad from a certain company begins to suspect an advertisement is synthetic, the risk of not finalizing the purchase rises (Dowling & Staelin, 1994). The usual visual evidence that reduces uncertainty—what the product looks like, how it fits, how it performs—becomes less trustworthy. Section 5 documents this pathway through the measured links among detectability, trust and purchase intention.
2.4. External Consumer Factors
The societal influences of culture, reference groups, and the consumer's target social class are all decoded and converted into perceptual marketing stimuli (Bearden & Etzel, 1982). Within Bangladeshi social-media traffic, language choice (Bangla, English, Banglish or code-mixed) signals membership in distinct online sub-audiences, while income serves as a proxy for the stakes a consumer attaches to a purchase. Both variables are examined in Section 6.
2.5. Theoretical Lenses Used to Interpret the Findings
How AI generated Ads in social media sphere affects consumer decision is assessed under the lens of consumer decision Process model of Hawkins, Best and Coney (1998). The model separately identifies each underlaying factors like internal and external influences and sequences buyer behavior from problem recognition through information search, alternative evaluation, purchase decision and post-purchase evaluation. Rather than treating the sequence as rigid, we take a rather inquisitive approach about which stages generative AI actually disrupts and which stages it leaves largely untouched.
3. Method
The study combines two different datasets that measures different aspects of consumer response, which are what people say without being asked and what they report when asked directly. The subsections contain how the data were collected, analyzed and necessary steps to be heeded on when accounting for results and data associations.
3.1. Dual-Dataset Design
Human nature has a tendency of portraying different stated and observed attitudes. For context, A survey respondent described may employ a much attitude toward AI advertising than a person who is performing a different act from towards an unprompted comment on a brand page. The study therefore pairs an observational dataset (public comments) with a self-report dataset (structured survey). Reading the two together helps separate declared opinion from behavior that occurs without a researcher’s prompt.

Table 1.
Overview of the two datasets.
| Dataset | N | Captures | Strength | Main limitation |
| Organic comments | 563 | Unprompted reactions and inquiries | Naturalistic behavioral evidence | Not a representative population sample |
| Survey | 131 | Stated attitudes, trust, purchase intention | Direct measurement of perception | Self-report can differ from actual behavior |
3.2. Dataset 1: Organic Comments
For dataset one, the dataset i.e. the comment corpus holds 563 unsolicited remarks collected from the public social-media pages of 25 Bangladeshi consumer brands. Among them 534 comments (94.8 percent) are comprised of Facebook comments and Instagram have 29 comments (5.2 percent). Four brands dominate the volume: Walton (189 comments, 33.6 percent), Perfumance (142, 25.2 percent), bKash (121, 21.5 percent) and Cheez (44, 7.8 percent). The remaining 56 comments (9.9 percent) are spread across 20 other brands.
3.3. Dataset 2: Survey
The survey instrument (abridged in Appendix B) gathered 131 responses on demographics, perceived AI detectability, aesthetic-appeal deficit, trust in AI-generated content, trust in brands that use AI, and purchase intention under both a general social-media condition and an AI-labelled-ad condition. All attitude items used seven-point Likert scales. The sample leans younger, male and student-heavy (80.2 percent aged 25–34, 74.8 percent male, 58.8 percent students), which limits the reach of generalisation.
3.4. Analytical Approach
Descriptive statistics—means, medians and standard deviations—summarise the survey constructs. Cross-tabulation tests differences by gender, age and income. Comments were coded by hand for sentiment (positive, neutral, negative), theme (evaluative, informational, non-substantive) and language or dialect. Triangulation then compares stated survey attitudes with patterns visible in the organic comments.
3.5. Caution on Causal Interpretation
A difference between two survey conditions shows an association inside this sample; it does not, by itself, prove that AI use caused the difference. Likewise, the observation that 62.5 percent of explicit AI callouts are negative describes only the 16 of 563 comments (2.8 percent) that named AI at all. That figure is best read as an early-warning signal of backlash intensity once AI use becomes noticeable, not as a population-wide sentiment estimate.
4. Results I: Organic Social-Media Behavior
The 563-comment dataset across 20 different Bangladeshi brands tries to capture the overall sentiment and the matrix within the comment corpus. The analysis proceeds from the overall sentiment and thematic composition of the corpus to the subset of comments that reference AI generation explicitly, and concludes with a comparison of sentiment across language and dialect segments.
4.1. Sentiment Profile
Most comments in the corpus are neutral (Figure 1). Neutral remarks (55.8 percent) outnumber both positive (27.4 percent) and negative (16.9 percent) comments. Brand social-media pages therefore function partly as informal points of sale—consumers ask about specifications, price and availability—rather than solely as channels for praise or complaint.
4.2. Thematic Structure
Comments fall into three broad parent categories: evaluative (34.8 percent: appreciation, product review, complaint or support), informational (33.7 percent: product inquiry 16.2 percent, price inquiry 13.3 percent) and non-substantive (31.4 percent: social engagement, tags, emoji, banter). Product and price inquiries together make up roughly 29.5 percent of all comments. An AI-generated image that distorts a product’s true colour, proportion or texture therefore interferes with a genuine purchase decision, not merely with an aesthetic impression.
4.3. Explicit AI Detection
Only 16 of the 563 comments (2.8 percent) named AI generation explicitly. Of those, ten were negative, five neutral and one positive. It is not to be warranted that the scarcity of explicit callouts does not make them commercially unimportant. As it is in social spheres and in most cases, a single visible callout can shift an entire comment thread from discussion of the product to discussion of the advertisement’s authenticity, and it can serve as social proof or reference point for collectivist nature of human being, especially shown on social media (Chu & Choi, 2011). for every later viewer who scrolls past. In most of those dismissive comments, three recurring patterns appear that are: consumers applying dismissive labels to synthetic content, consumers naming or attempting to name the specific generative tool, and consumers pairing a callout with an explicit statement of reduced trust in the brand.
4.4. Linguistic Segmentation
The dataset’s analysis shows us that sentiment of the commenters varies a lot by language segment (Figure 2, Table 2). “Code-mixed comments” which is Bangla and English blended inside the same remark, carry a staggering 43.5 percent negative sentiment, roughly three times the corpus average. This segment also contributes a disproportionate share of the comments that name, or atleast try to make a guess about the employed AI tools directly. Language however is not a tool to itemize any demographic, it can be embedded as a part of culture. Because language is only a proxy and not a demographic variable in its own right, the pattern should be read as evidence that a technically engaged sub-audience exists inside the Bangladeshi social-media population, not as a claim about any single demographic group.
5. Results II: Survey – Perception and Purchase Intention
Where Section 4 examined unprompted behavior, this section reports the self-reported attitudes elicited through the structured survey (N = 131) through a carefully administered questionnaire. The results derived from the survey are presented in four parts: the core constructs measured on seven-point Likert scales, the shift in magnitude and significance of the purchase-intention shift under the AI-labelled condition, the mediating role of trust and the extent to which these findings align with previously published research of similar categories.
5.1. Core Survey Constructs
The results derived from Table 3 and Figure 3 summaries the seven core constructs of the ideation. As respondents rate their own ability to detect AI content at 5.02/7 (median 5.00, SD 1.73), well above the scale midpoint. Trust in AI-generated content sits at only 2.80/7 (median 3.00, SD 1.70), the observation is not much different to the already low 2.82/7 baseline trust they place in ordinary social-media brand claims.
5.2. The Purchase-Intention Shift
There are two separate features on this result that demand a closer look. Firstly, we can see that detectability and trust of AI-generated contents as observed move in converse directions: this occurs as respondents report reasonable confidence in recognizing AI-generated content, yet that confidence does not translate into willingness to rely on it. For recognizing that a system uses AI is not by itself, enough to reduce trust. The loss of trust appears specifically once AI is understood to be altering the truth-bearing representation of the product itself which includes color or physical proportion distortion or synthetic characters vouching for the brand. Second, the purchase-intention gap between the two conditions reaches statistical significance (p < .01).
Writing X̄PI, AI for the sample mean purchase intention under the AI-ad condition and X̄PI, Baseline for the mean under the general social-media condition:
The same formula, applied per demographic subgroup s, generates the gender, age and income penalties reported in Section 6 and Appendix A.4.
5.3. Trust as the Mediating Bridge
Before making an educated purchasing decision, a consumer answers their psyche two separate questions: “do I want this?” and “Do I believe what I am being shown?”. The figures in Table 3 suggest the first question can remain largely intact while the second is undermined. Therefore, visual credibility is treated as a component of measuring information credibility through methods that differ person to person rather than as a purely aesthetic or stylistic concern.
5.4. Convergence with External Evidence
The direction of these results matches recently published work outside this dataset, although the size of the effect appears to vary by context. Comparative contemporary studies of AI-produced and human-produced advertising report that AI advertising is judged less authentic once its source is correctly identified (Brüns & Meißner, 2024). Research on verification signals (third-party assurance marks such as feedback forms or QR codes) finds that such signals can partially restore trust and purchase intention (Sarran & Datt, 2026). This study found QR codes act as trust-building signals in AI-generated advertising, and TPCA (Third-Party Certification/Assurance seal) seals provide stronger trust signals and marginally improve purchase intention.
6. Demographic and Cultural Cross-Analysis
The pooled results reported in Section 5 may obscure systematic variation across subpopulations. This section therefore disaggregates detectability, trust and purchase intention by gender, age, income bracket and screen-time intensity and identifies where subgroup sample sizes constrain the generalizability of the resulting estimates. Given that the several subgroups are small (N as low as 13), the resulting patterns can be best read as directional rather than conclusive.
6.1. Gender
On the basis of analysis based on gender element of the demographic, female respondents report a substantially higher baseline purchase intention than male respondents (4.58 vs 3.70), but both groups coverage on the same 3.30 floor once the advertisement is understood to be AI-generated (Figure 4, Table 4). The result is that the female subgroup’s initial purchasing advantage is effectively eliminated under the AI-ad condition (−27.9% relative change, against −10.8% for men). This pattern should not be read as evidence of a single fixed psychological mechanism specific to gender; a more defensible reading is that creative-context standards, expectations around authenticity, lifestyle representation and product credibility, interact with this outcome more strongly for this subgroup in this sample, which argues for further segmented research rather than a general claim.
6.2. Age
There are two age cohorts in this observation which appear resistant to AI-made advertising for different reasons. Respondents aged 18-24 report the lowest trust in AI-content of any age group (2.46/7) alongside the largest proportional purchase-intention shift (-0.83), consistent with a fast, low trust rejection. Respondents aged 25-34 report the highest AI-detectability score (5.10/7) alongside a pronounced aesthetic-appeal deficit, consistent with a more evaluative, visually literate response that critiques execution rather than rejecting the category outright
6.3. Income
AI-detectability and the associated purchase intention penalty are not monotonic in income (Figure 5, Table 5). The BDT 50000-100000 bracket reports both the highest detectability in the sample (5.84/7) and one of the largest purchase intention penalties (−1.05, a 25.9% relative decline), consistent with mid- to-upper-income consumers, plausibly a brand’s most valuable near-term customers, being comparatively unforgiving of visibly synthetic creative. Given the small subgroup sizes (N= 13 to 19 per bracket), these estimates should be read as directional.
6.4. Digital Media Use
Heavier daily social-media use is associated with both greater AI-detectability and a larger aesthetic-appeal deficit: respondents with moderate screen time (roughly 1-3 hours/day) report an aesthetic deficit of 4.48/7, versus 5.08/7 for heavy users (roughly 3-7 hours/day), whose detectability score reaches 5.15/7. A likely mechanism is repeated exposure to recurring visual patterns (stock backgrounds, generic synthetic faces, stylish quirks), though this study did not measure exposure directly and the association should be treated as an interpretation rather than a demonstrated casual pathway.
7. Discussion: An Integrated Interpretation
The comment-level and survey-level findings together point toward a common mechanism, although each dataset illuminates a different part of it. Together they set out the internal pathway, running from perception through trust to perceived risk, alongside the external pathway operating through social amplification in comment sections. Then the findings are interpreted through the Consumer Decision Process model of Hawkins et al. (1998).
7.1. Internal and External Pathways
The measurable decrease in purchase intention caused by AI-generated advertising can be explained by two complementary routes: internal and external. The internal pathway runs from perception (noticing synthetic cues) through reduced trust to elevated perceived risk while external pathway runs through social amplifications: because comment sections are public, a single vocal detection can function as a social proof that shapes how subsequent viewers read the same post, independent of their own detection ability.
7.2. Authenticity Is Contextual
Tolerance for AI-generated creative is not uniform across content types. It is lowest wherever an image functions as evidence of the physical product (electronics, footwear, food) and highest where the audience already understands an image is conceptual or served as symbolic rather than a literal product claim. Verification cues, specifications, price information and genuine customer reviews appear to reduce uncertainty more reliably than aesthetic polish alone. This is also consistent with external research on trust signals in AI- generated advertising (Sarran & Datt, 2026).
7.3. The Consumer Decision Process Model Applied to GenAI
When examined through the lens of Consumer Decision Making Process (Hawkins et al, 1998), disruption appears to be front loaded rather than distribute evenly across the purchase journey (Table 6). Marketing- stimulus exposure, perception, and the outlet selection/purchase stage absorb most of the measure effect whereas problem recognition, family, personality, and self-concept/lifestyle show no meaningful deviation in either dataset. The practical implication from here is that AI’s disruption originated early, at first visual encounter, and its consequences surface late, at the point of sale, with the intervening stages acting mainly as a conduit rather than an independent source of resistance.
8. The AI-Adjusted Purchase Journey
We compare a baseline six-stage purchase journey (exposure, visual validation, information search, social proof, price/value evaluation, conversion) against an "AI-friction" version of the same journey to derive a worthy conclusion. This comparison reveals degraded outcomes at nearly every stage: exposure attracts lower-quality attention, unnatural details trigger skepticism, verification becomes harder, and public AI callouts function as negative social proof that lowers conversion. The design implication is that brands should ask generative tools to enhance the environment around a real product rather than to simulate the product itself.
9. Strategic and Managerial Implications
The findings in Section 5 and Section 6 have clear, practical implications for how brands should approach generative AI in advertising. However, tolerance for AI-generated creative work varies significantly across product categories. Meaning that the strategies brands adopt both internally and externally must be tailored accordingly which was suggested by the survey and demographic data. Finally, the discussion turns to the critical role of human oversight in governing creative processes.
9.1. Product Category Sensitivity
Tolerance for AI-generated creative varies systematically by product category. It tends to be low for core physical goods, financial-services visuals, and food or beverage imagery; categories where the image functions as a form of evidence that consumers rely on directly. Tolerance is moderate for fashion and lifestyle content, and high for conceptual campaign art, which audiences already interpret as symbolic rather than literal.
9.2. Internal- and External-Factor Strategy
The internal-factor strategy emerging from Section 5 and Section 6 keeps the core product image photographically real, even when the surrounding scene is AI-assisted. It also calls for disclosing AI use whenever it materially changes what a consumer sees, and for pairing stylised creative with verifiable details such as specifications, pricing, or customer reviews.
The external factor strategy, by contrast, treats comment sections as an early-warning system. It adapts language and tone across Bangla, English, Banglish, and code-mixed audiences, rather than applying a single national-average creative approach. At the same time, it applies stricter visual-credibility standards to higher-income and high-involvement segments.
9.3. Human-in-the-Loop Creative Governance
None of these findings argue for abandoning generative AI in advertising production. Instead, they point toward a more bounded creative role, one in which a human reviewer remains accountable for any asset that touches a product's core representation, involves a real person's likeness, or makes a claim that a consumer cannot verify independently.
10. A GenAI Deployment Framework
The strategic implications discussed above raise a practical question that has not yet been answered: which specific assets warrant review, and at what level. To address this, we introduce a two-axis deployment matrix, followed by four governing principles, a four-tier risk-governance process, and a measurement approach designed to detect trust erosion before it shows up in conversion metrics.
10.1. Deployment Decision Matrix
A two-axis framework that balances creative utility against consumer trust risk sorts individual advertising assets into four review tiers, as shown in Figure 6. Stylized or non-photorealistic concept art falls into the high-utility, low-risk quadrant and can be deployed freely, since audiences do not read it as a literal product claim. At the other end of the spectrum, photorealistic synthetic humans or brand ambassadors sit in the high-utility, high-risk space; they triggered the largest trust and conversion penalties in this study's data, particularly among female and younger respondents, and should therefore be restricted or clearly labelled. Minor edits such as cropping or color correction occupy the low-utility, low-risk tier and require only standard design review. Finally, unedited, fully synthetic renders of the core physical product fall into the low-utility, high-risk category, which is the scenario most strongly associated with negative AI callouts and functional verification failure and should not be used.
10.2. Four Governing Principles
The framework rests on four principles: never let AI alter the true appearance of the physical product being sold; use AI to enhance a scene rather than fabricate one; disclose AI use where it materially changes what a consumer sees, or where required by platform or regulatory policy; and pair AI-assisted creative with verifiable evidence (specifications, price, or genuine reviews) since information reduces uncertainty more reliably than aesthetics alone.
10.3. Risk-Tier Governance
Throughout the project, a practical governance process classifies every AI-assisted asset into one of four risk tiers prior to publication. Level 1 covers low-risk editing such as resizing, cropping, or background removal, and requires no formal sign-off. Level 2 involves creative enhancement that preserves the actual product such as adjustments to lighting, mood, or background and moves through the normal creative workflow. Level 3 applies to assets that materially synthesize people, environments, or products, and requires senior creative review. Level 4 covers sensitive claims or realistic synthetic people and requires combined legal and ethical review before release.
10.4. Measuring Beyond Clicks
A brand that tracks only reach and click-through rate might conclude that an AI-generated campaign is succeeding, while missing the trust erosion visible in the comment section beneath it. A more complete measurement dashboard would combine attention metrics, engagement quality, product-enquiry volume, sentiment, AI callout rate, conversion, and repeat purchase behavior, since a superficially high performing AI-generated post can mask a longer-term credibility problem.
11. Implementation Roadmap
To reduce the stutter that can sometimes arise from AI-generated elements, a phased 90-day rollout translates the framework into practice across four work streams. The first is governance: days 0–30 focus on categorizing AI assets and maintaining an approval checklist; days 31–60 shift to training creative and social teams based on early observations; and days 61–90 bring the company into full alignment with auditing and compliance requirements. The second work stream is creative production, which involves separating real product assets from AI mood assets, piloting hybrid creative, and then scaling successful formats. The third is consumer insight, covering baseline sentiment establishment, tracking by audience segment, and comparison against pre-AI benchmarks. The fourth is conversion tracking. Accompanying these is a KPI framework that pairs conventional reach and click-through metrics with actionable safeguards, including sentiment tracking, AI-callout rate, and product-inquiry volume. This ensures that trust erosion becomes visible before it shows up in top-line conversion numbers.
12. Limitations and Future Research
As with any study relying on self-reported and observational data, several limitations bear on how the findings should be interpreted. These are set out first, followed by three directions for future research that follow directly from them.
12.1. Limitations
The observational design prohibits generalizability, as the survey sample is relatively small (N = 131) and skews toward younger, male, student respondents. The comment data, meanwhile, concentrates heavily on four brands and a single platform. Because the two datasets were not collected from the same individuals, the triangulation between them is interpretive rather than a statistical match at the individual level. This limitation becomes more consequential given that demographic subgroup sizes in Section 6 are as low as N = 13, which further limits how confidently the cross-tabulations can be generalized.
12.2. Future Research
Three directions for future research follow directly from these limitations. First, qualitative in-depth interviews contrasting high- and low-trust consumers could explain how different interpretations of the same AI asset arise from a consumer perspective. Second, a regional study comparing urban and rural Bangladesh would test the geographic and cultural validity of the findings. Third, a real conversion study using A/B testing would connect stated and observed perceptions to actual sales outcomes, offering more actionable data than stated purchase intention alone.
13. Conclusion
Bangladeshi consumers who use social media for both planned and impulse purchasing generally report confidence in recognizing AI-generated content. The risk to a brand arises not from detection itself but from the associated drop in perceived credibility once detection occurs. The survey’s 2.85/7 trust score for AI-generated brand content, together with the 0.62-point (15.8 percent) purchase-intention gap, describes a measurable and statistically significant effect. The comment corpus adds that the small minority of consumers who comment on AI explicitly do so mostly negatively, concentrated among technically engaged and code-mixed-language commenters. Together the evidence suggests that generative AI remains broadly usable for ideation, stylization and production support, provided a brand keeps the product’s true appearance, and the human element of the customer relationship, grounded in verifiable reality. The central recommendation that follows is to use generative AI to make advertising more expressive and efficient, without making the underlying product harder to believe.
Supplementary Materials
The following supporting information can be downloaded at the website of this paper posted on Preprints.org.
Acknowledgments
The authors thank the anonymous respondents for responding to the survey. We also acknowledge the efforts of people who work tirelessly behind the improvement of Artificial Intelligence.
Appendix A. Integrated Data Tables
A.1 Dataset 1 Summary. Organic comments 563; brands represented 25; Facebook comments 534 (94.8%); Instagram comments 29 (5.2%); neutral sentiment 314 (55.8%); positive sentiment 154 (27.4%); negative sentiment 95 (16.9%); explicit AI detections 16 (2.8%); negative among AI detections 10/16 (62.5%); Bangla comments 323 (57.4%); English comments 173 (30.7%); Banglish comments 43 (7.6%); code-mixed comments 23 (4.1%).
A.2 Dataset 2 Respondent Profile. Survey respondents 131; age 25–34: 80.2%; age 18–24: 18.3%; male 74.8%; female 25.2%; students 58.8%; full-time employees 29.0%.
A.3 Screen-Time Sensitivity. Moderate daily screen time (approx. 1–3 hrs/day): aesthetic-appeal deficit 4.48/7. Heavy daily screen time (approx. 3–7 hrs/day): aesthetic-appeal deficit 5.08/7; AI detectability 5.15/7.
A.4 Statistical Formulas Used. ΔPI = X̄ (PI, AI) − X̄ (PI, Baseline); %ΔPI = (ΔPI/X̄ (PI, Baseline)) × 100; ΔPIsegment,s = X̄PI,AI,s − X̄PI,Baseline,s for subgroup s. Illustrative applications: ΔPIFemale = 3.30 − 4.58 = −1.28 (−27.9%); ΔPIIncome50k-100k = 3.00 − 4.05 = −1.05 (−25.9%).
Appendix B. Survey Instrument (Abridged)
Complete survey instrument available at: https://forms.gle/PbrdgXFxWwCt7RS7A
- Demographics: age, gender, monthly household income and occupation.
- “I can tell when a post was made using AI.” (AI detectability)
- “AI-made posts feel less appealing than posts by real people.” (Aesthetic deficit)
- “I trust AI-made brand posts as much as posts by real people.” (Trust in AI content)
- “I trust a brand that uses AI in its advertising.” (Trust in AI-using brands)
- “I would likely buy something seen on social media.” (Baseline purchase intention)
- “I would likely buy something from an advertisement that uses AI.” (AI-ad purchase intention)
Datasets and materials: The comment dataset and the instrument dataset is publicly available at GitHub. Dataset 1 and 2
References
- Gundersen, O. E.; Helmert, M.; Hoos, H. Improving reproducibility in AI research: Four mechanisms adopted by JAIR. J. Artif. Intell. Res. 2024, 81, 1019–1041. [Google Scholar] [CrossRef]
- Hawkins, D. I.; Best, R. J.; Coney, K. A. Consumer behavior: Building marketing strategy. 1998.
- Chu, S.-C.; Choi, S. M. Social media engagement: A comparative study of individualistic and collectivistic cultures. J. Interact. Advert. 2011, 12(1), 34–45. [Google Scholar]
- Bearden, W. O.; Etzel, M. J. Reference group influence on product and brand purchase decisions. J. Consum. Res. 1982, 9(2), 183–194. [Google Scholar] [CrossRef]
- Brüns, J. D.; Meißner, M. Do you create your content yourself? Using generative artificial intelligence for social media content creation diminishes perceived brand authenticity. J. Retail. Consum. Serv. 2024, 79, 103790. [Google Scholar] [CrossRef]
- Dowling, G. R.; Staelin, R. A model of perceived risk and intended risk-handling activity. J. Consum. Res. 1994, 21(1), 119–134. [Google Scholar] [CrossRef] [PubMed]
- Grewal, D.; Satornino, C. B.; Davenport, T. H.; Guha, A. How generative AI is shaping the future of marketing. J. Acad. Mark. Sci. 2025, 53(3), 702–722. [Google Scholar] [CrossRef]
- Malhotra, N. K. Reflections on the information overload paradigm in consumer decision making. J. Consum. Res. 1984, 10(4), 436–440. [Google Scholar] [CrossRef] [PubMed]
- Morgan, R. M.; Hunt, S. D. The commitment-trust theory of relationship marketing. J. Mark. 1994, 58(3), 20–38. [Google Scholar] [CrossRef]
- Pieters, R.; Wedel, M. Attention capture and transfer in advertising: Brand, pictorial, and text-size effects. J. Mark. 2004, 68(2), 36–50. [Google Scholar] [CrossRef]
- Sarran, D.; Datt, V. Consumer trust and purchase intentions in AI-generated advertising: The role of verification signals. Comput. Hum. Behav. Rep. 2026, 22, 101112. [Google Scholar] [CrossRef]
Figure 1.
Sentiment distribution of organic comments (N = 563).
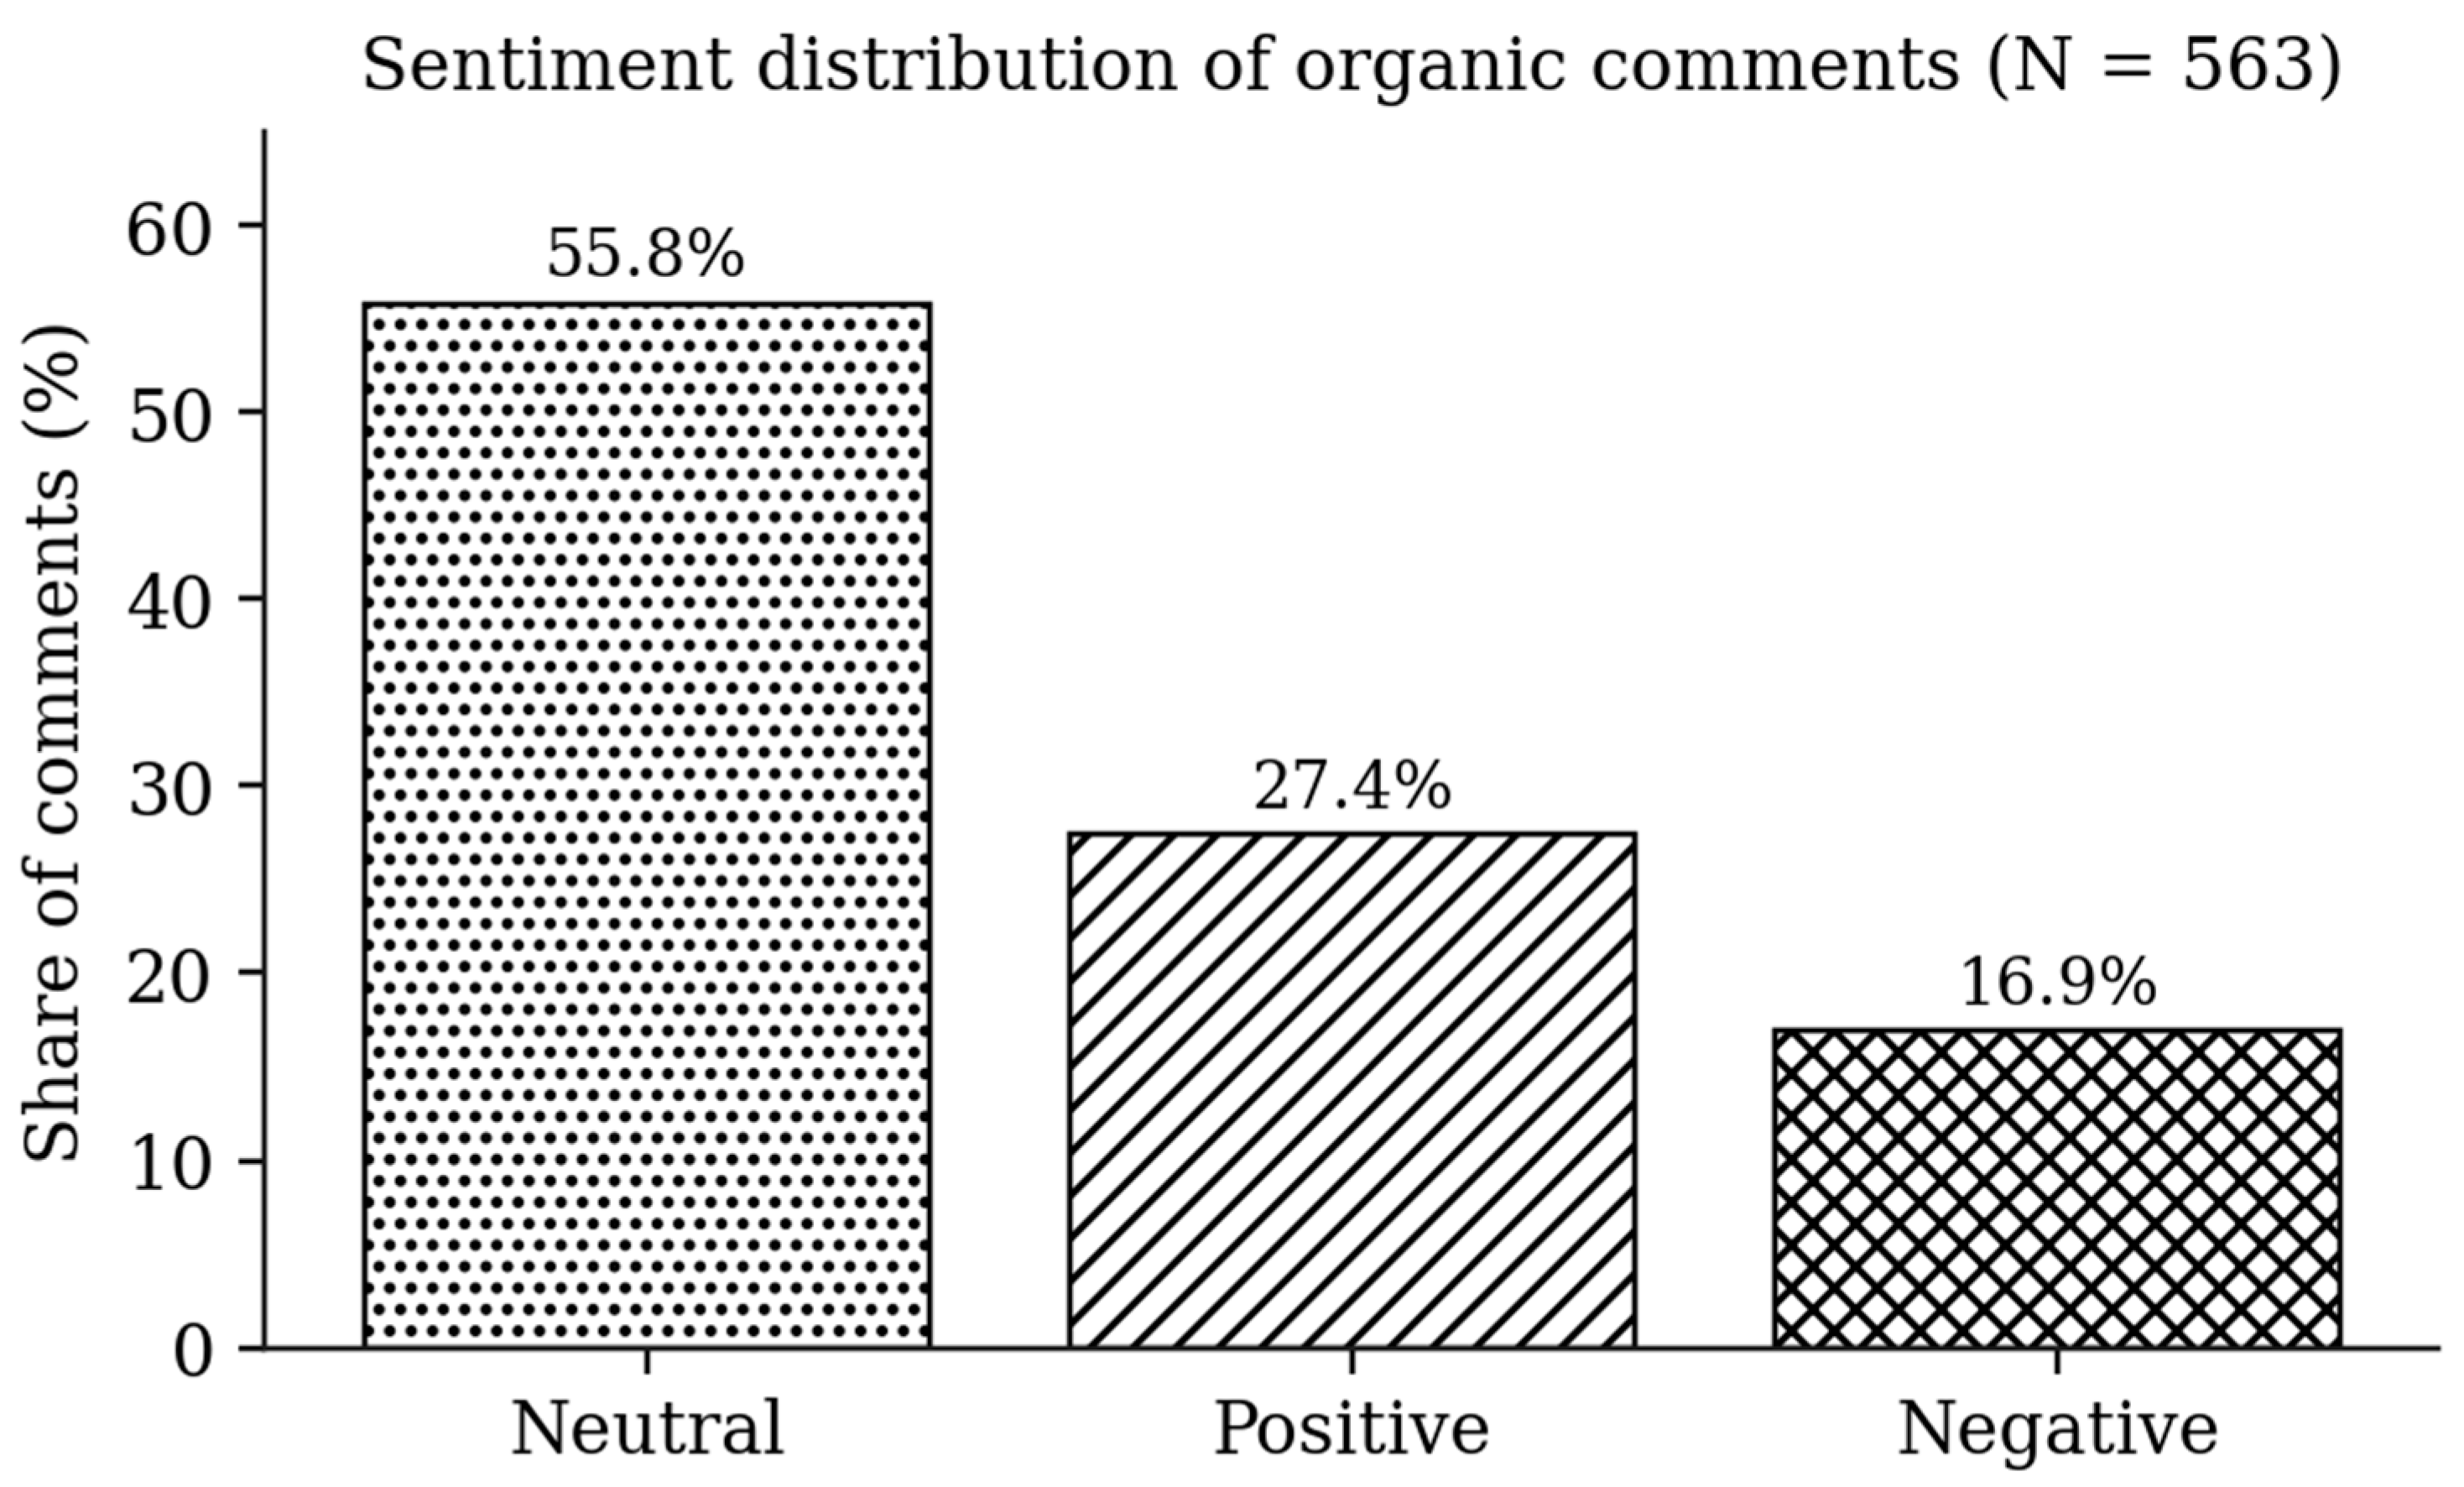
Figure 2.
Sentiment composition by language/dialect segment.
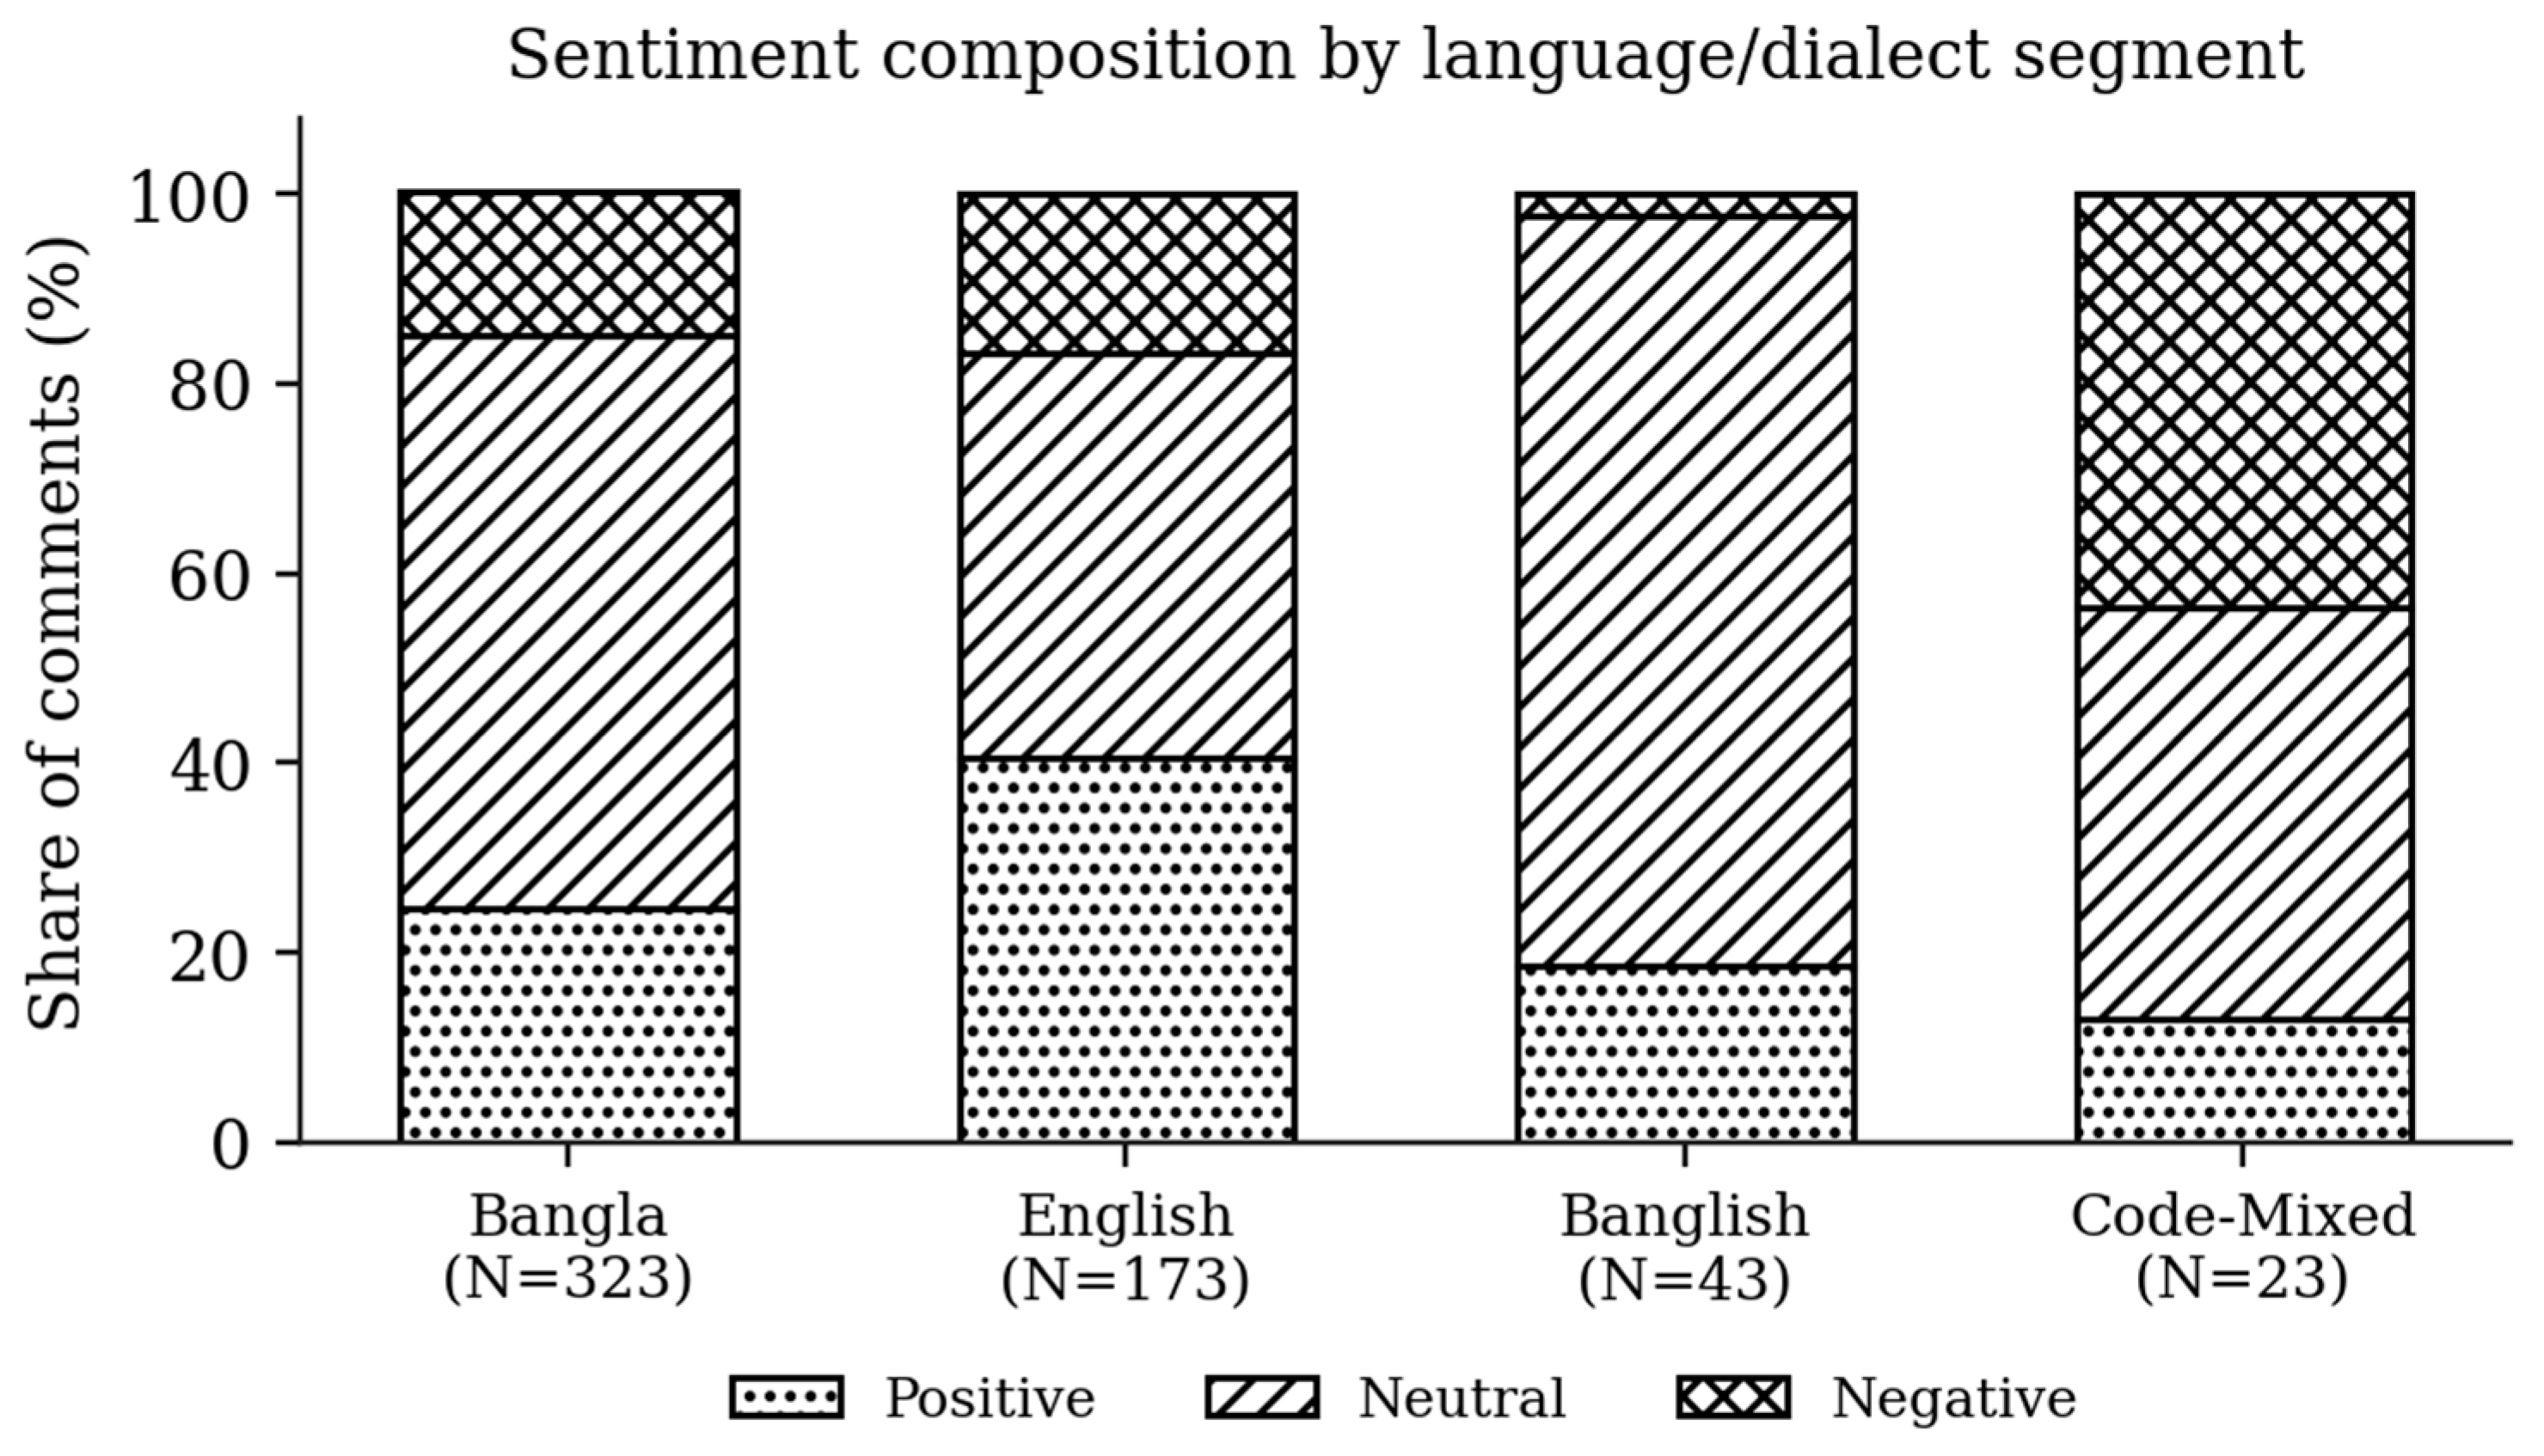
Figure 3.
Core survey constructs, means with standard-deviation whiskers (N = 131).
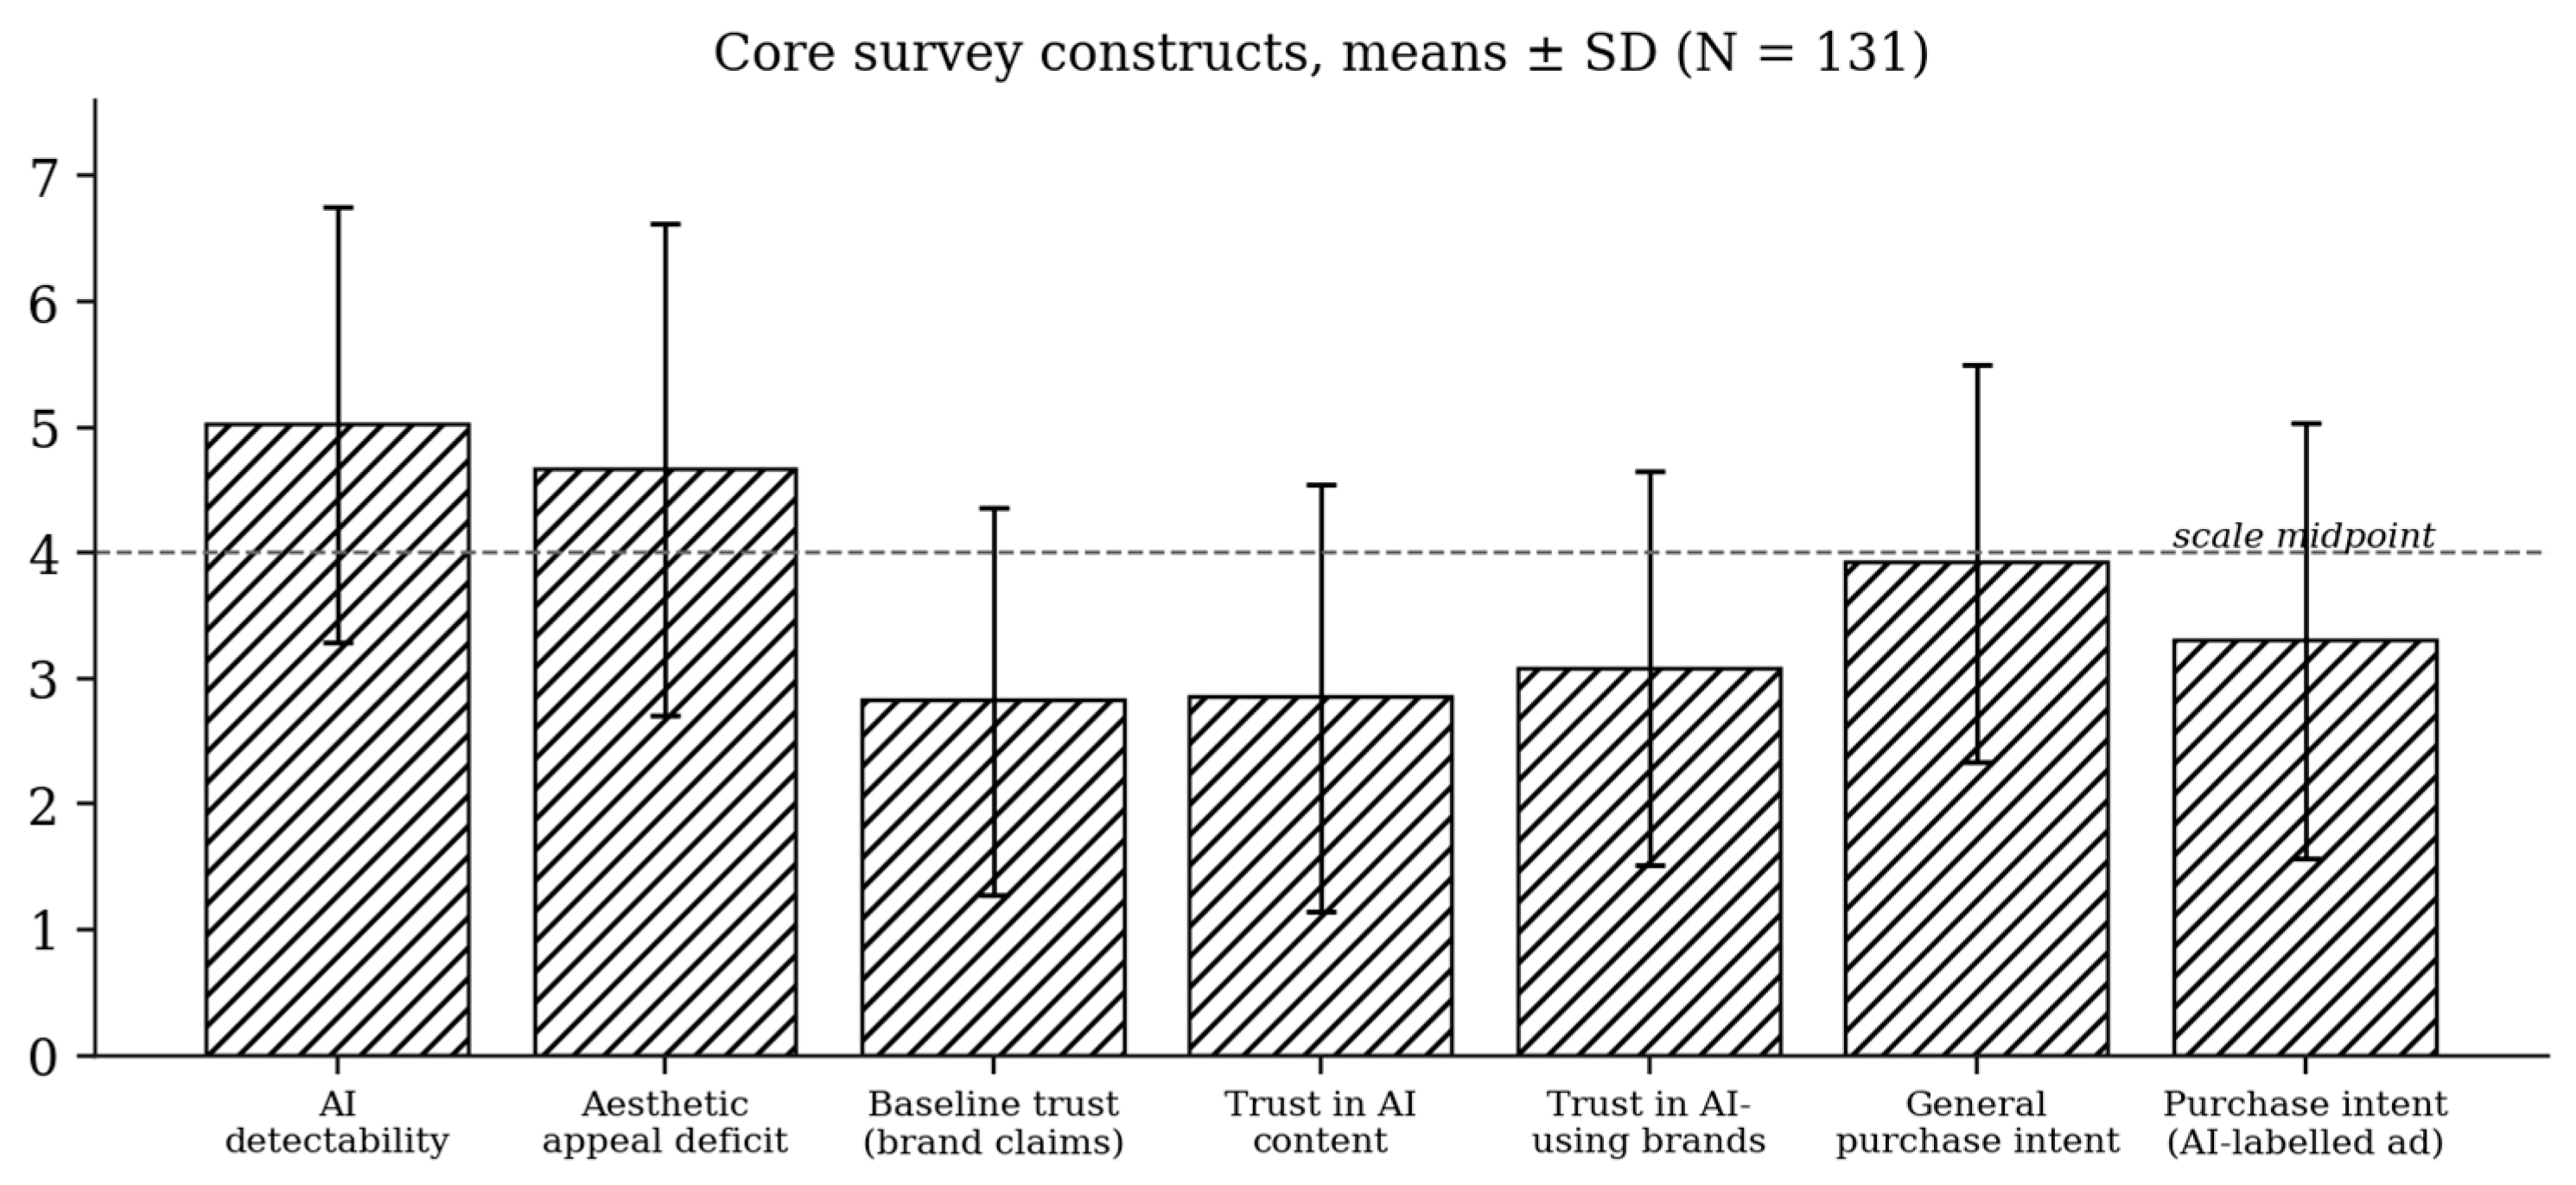
Figure 4.
Purchase-intention shift by gender.
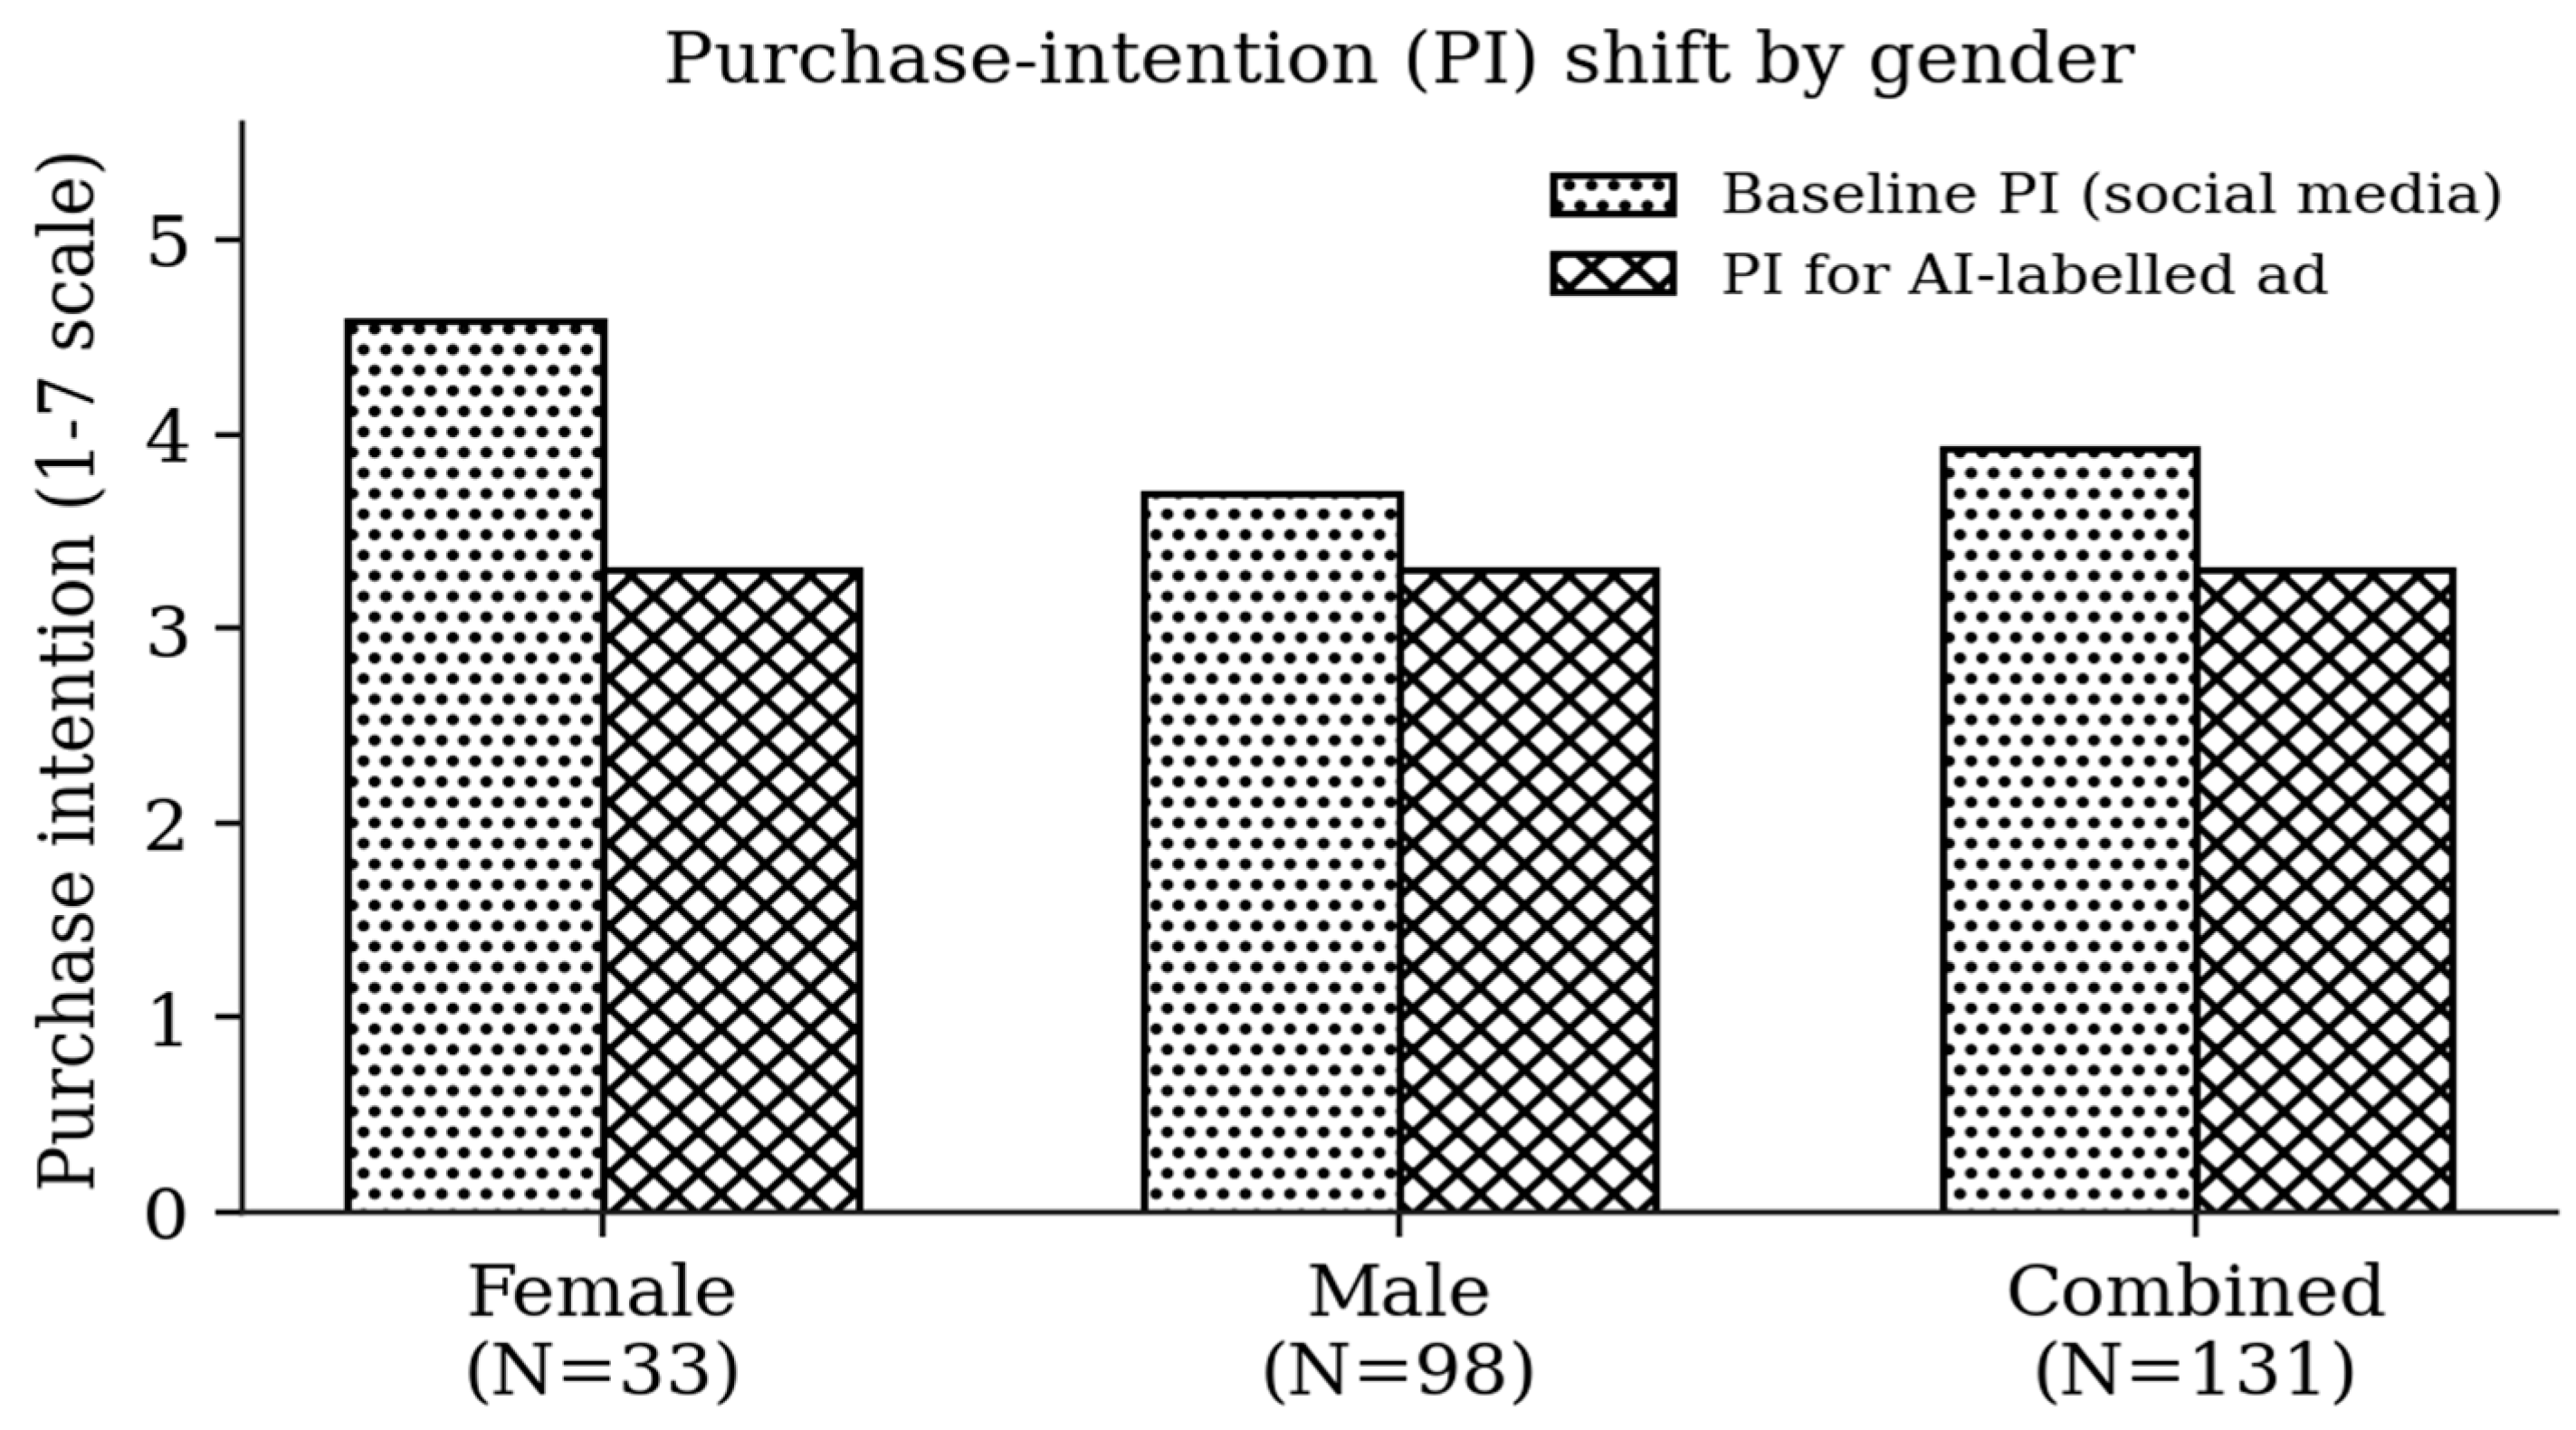
Figure 5.
Purchase-intention penalty for an AI-labelled advertisement, by income bracket.
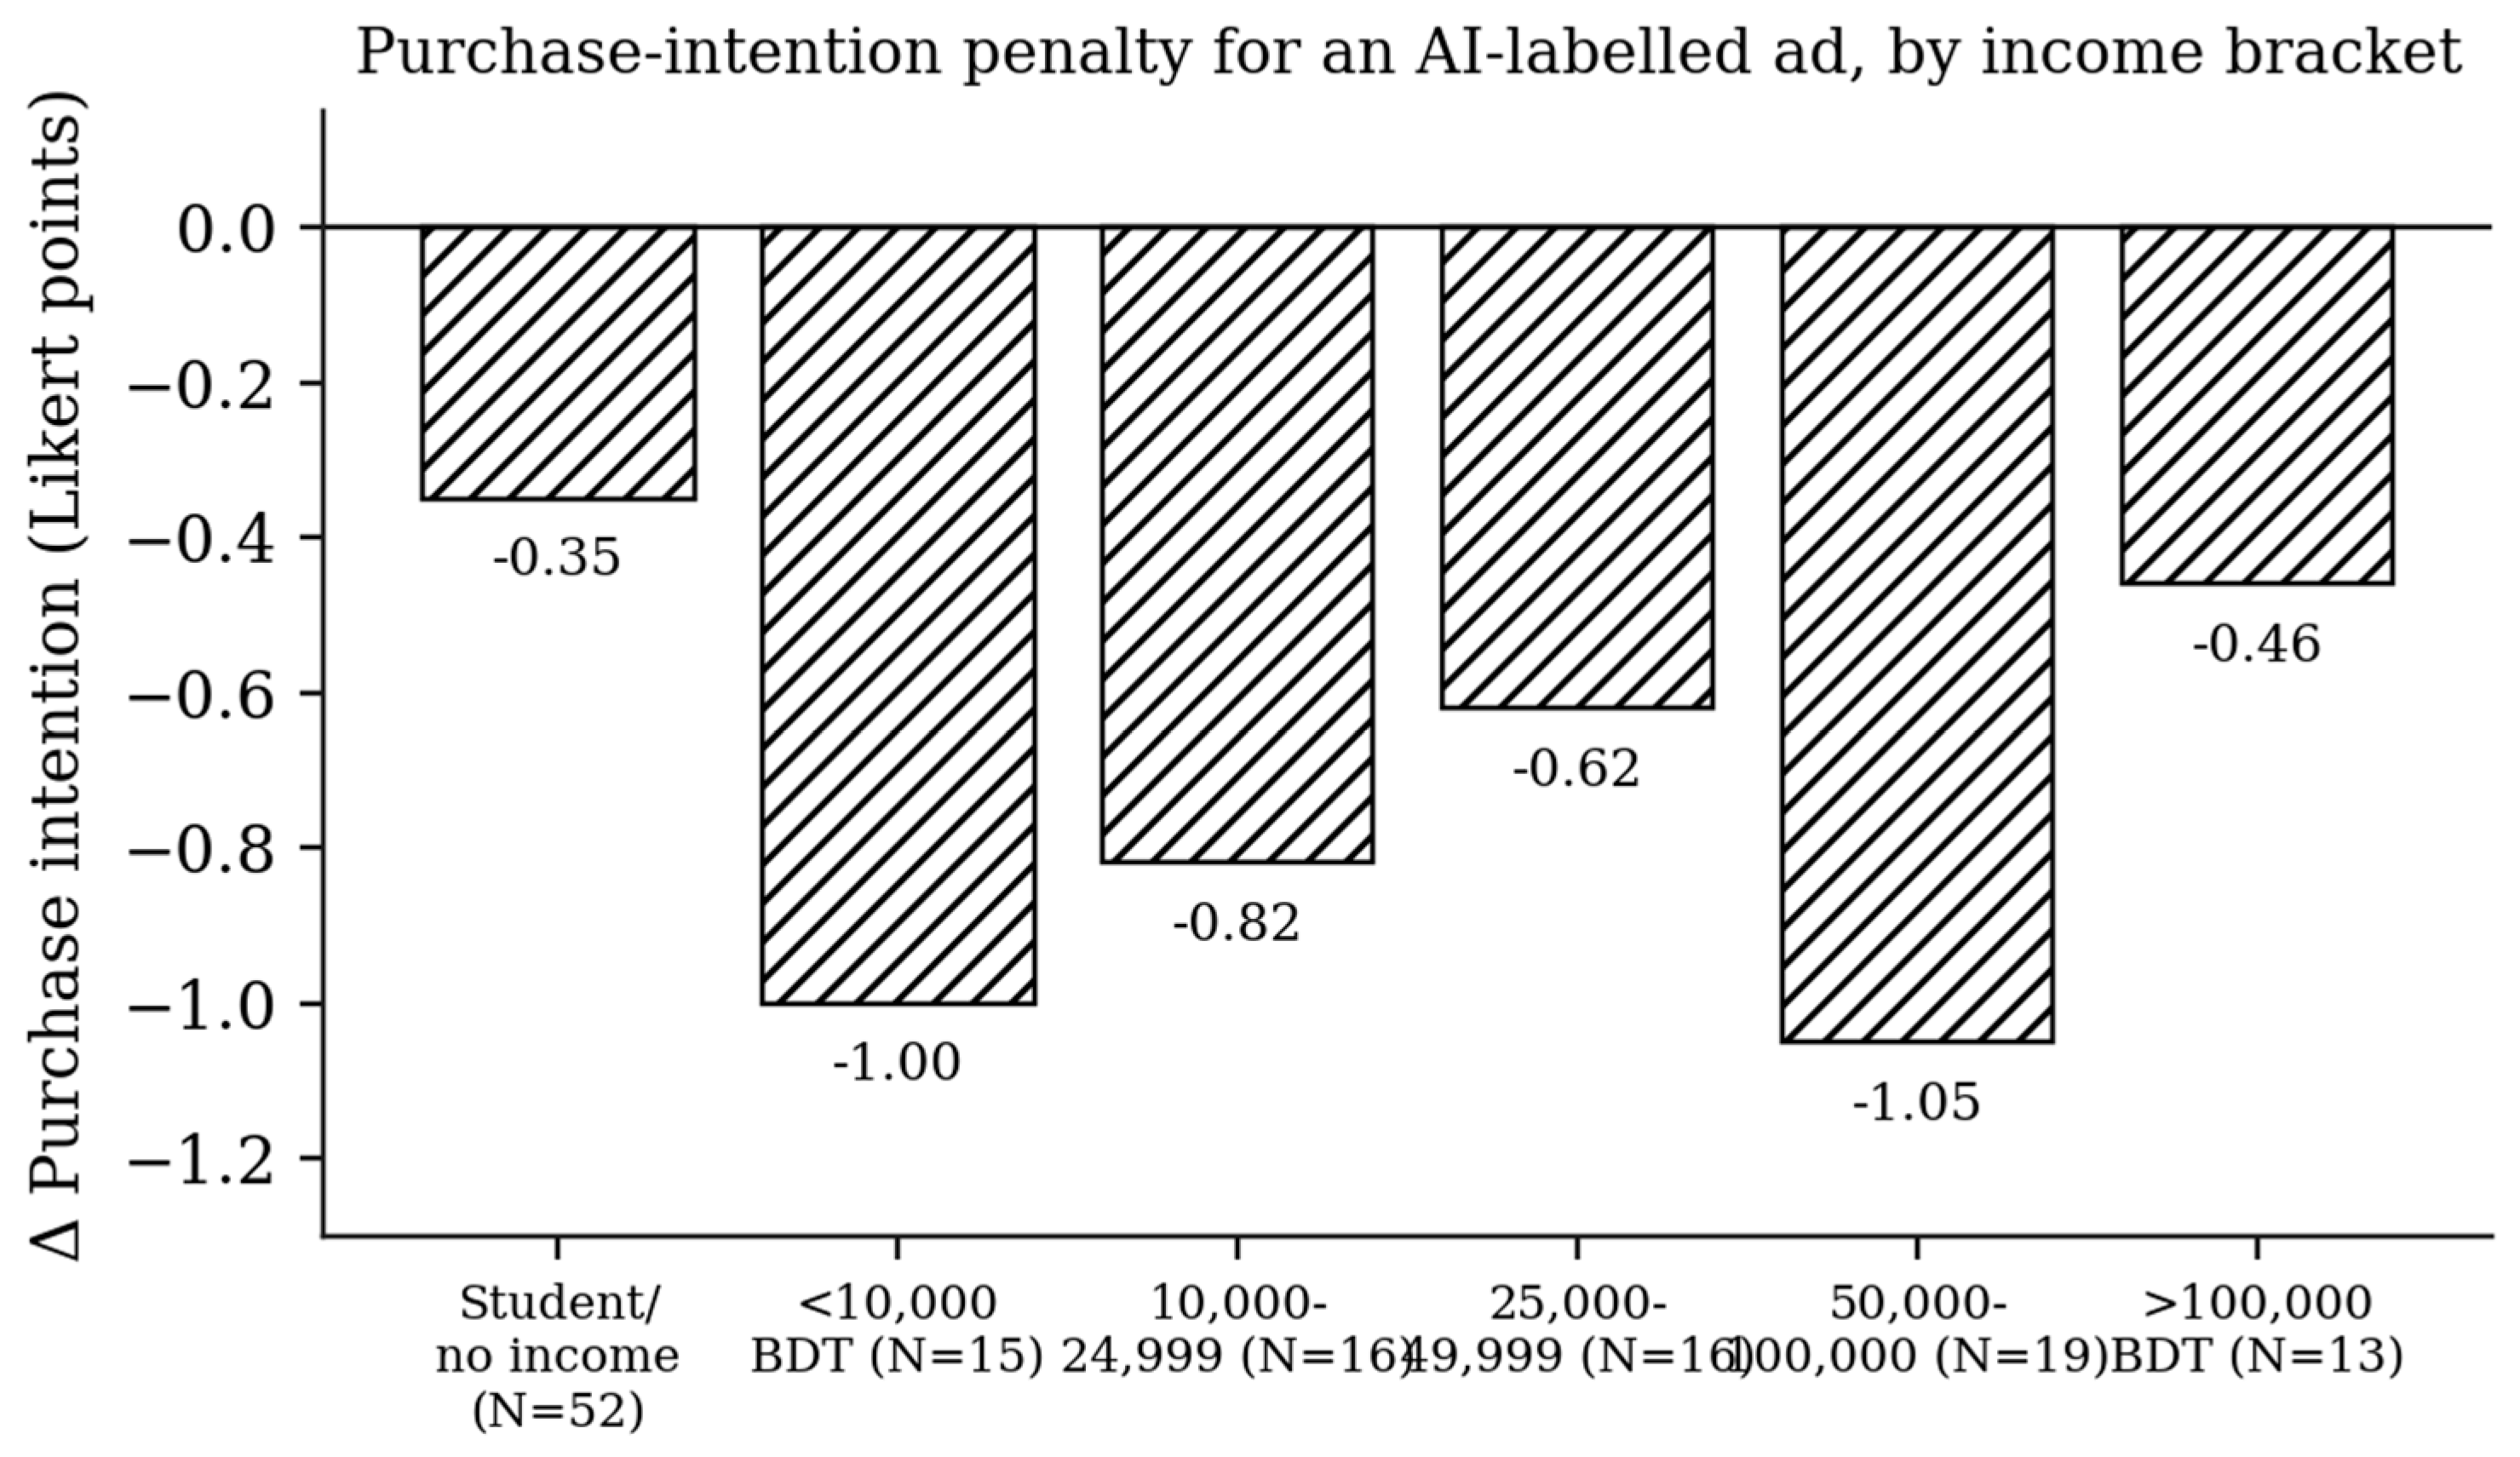
Figure 6.
GenAI deployment decision matrix.
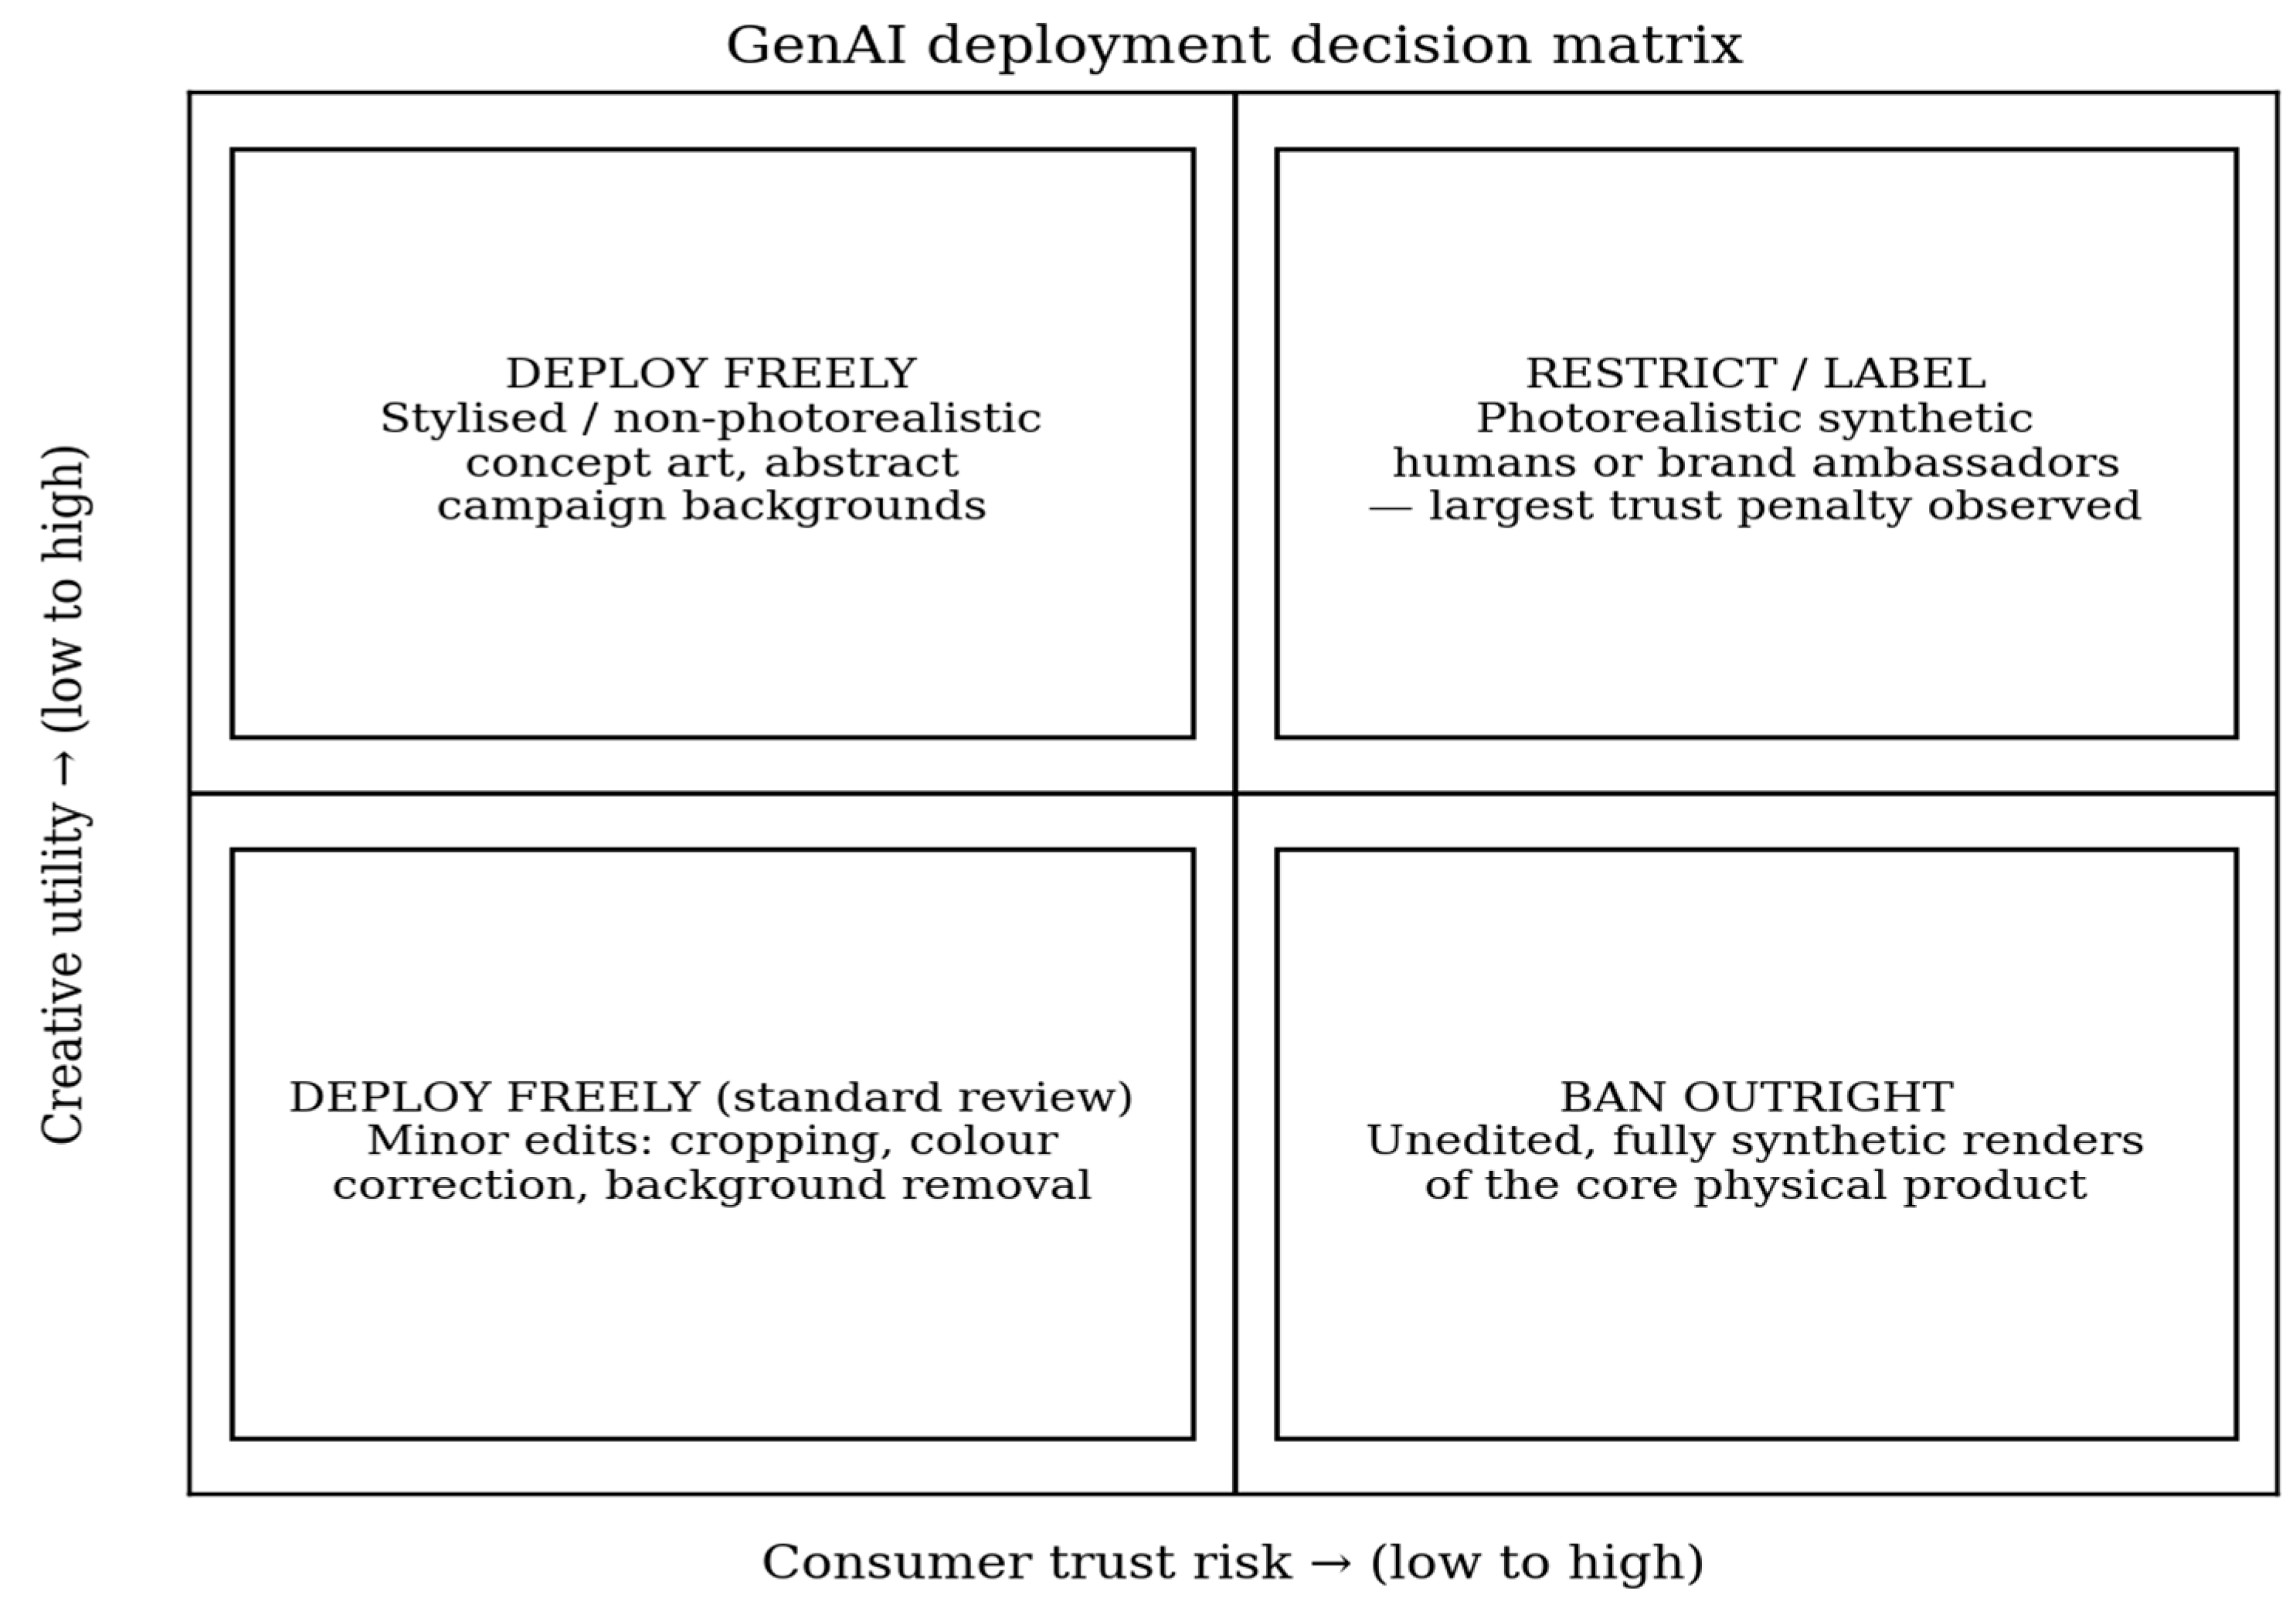
Table 2.
Comment volume and sentiment by language/dialect segment.
| Segment | N | Share | Positive | Neutral | Negative |
| Bangla | 323 | 57.4% | 24.8% | 60.4% | 15.0% |
| English | 173 | 30.7% | 40.5% | 42.8% | 16.8% |
| Banglish | 43 | 7.6% | 18.6% | 79.1% | 2.3% |
| Code-mixed | 23 | 4.1% | 13.0% | 43.5% | 43.5% |
| Total | 563 | 100.0% | 27.4% | 55.8% | 16.9% |
Table 3.
Core survey constructs (seven-point Likert scale).
| Construct | Mean | Median | SD |
| AI detectability | 5.02 | 5.00 | 1.73 |
| Aesthetic appeal deficit | 4.66 | 5.00 | 1.96 |
| Baseline trust in social-media brand claims | 2.82 | – | 1.54 |
| Trust in AI-generated content vs. human content | 2.80 | 3.00 | 1.70 |
| Trust in brands that use AI in advertising | 3.08 | 3.00 | 1.57 |
| General purchase intention (social media) | 3.92 | 4.00 | 1.58 |
| Purchase intention for an AI-generated ad | 3.30 | 4.00 | 1.73 |
Table 4.
Purchase intention (PI) by gender.
| Group | Baseline PI | AI-ad PI | Change | Relative change |
| Female (N = 33) | 4.58 | 3.30 | −1.28 | −27.9% |
| Male (N = 98) | 3.70 | 3.30 | −0.40 | −10.8% |
| Combined (N = 131) | 3.92 | 3.30 | −0.62 | −15.8% |
Table 5.
Purchase-intention penalty by income bracket.
| Income bracket (BDT/month) | N | Detectability | Baseline PI | AI-ad penalty (ΔPI) |
| Student / no income | 52 | 4.65 | 3.73 | −0.35 |
| <10,000 | 15 | 5.13 | 4.53 | −1.00 |
| 10,000–24,999 | 16 | 4.50 | 3.63 | −0.82 |
| 25,000–49,999 | 16 | 5.38 | 4.25 | −0.62 |
| 50,000–100,000 | 19 | 5.84 | 4.05 | −1.05 |
| >100,000 | 13 | 5.38 | 3.77 | −0.46 |
Table 6.
Selected components of the Consumer Decision Process model and this study’s evidence of disruption.
Table 6.
Selected components of the Consumer Decision Process model and this study’s evidence of disruption.
| Model component | Evidence from this study | Degree of disruption |
| Information search / evaluation | Product and price inquiries (29.5% of comments) show consumers actively searching around unclear creative | Strongly affected |
| Outlet selection / purchase | Purchase intention falls from 3.92 to 3.30 (−15.8%) under the AI-ad condition | Most affected |
| Alternative evaluation | Reduced ad trust weakens the reliability of the evaluation stage, pushing consumers toward comments and other users’ reactions | Moderately affected |
| Problem recognition | The need that brings a consumer to a product page exists independently of how the ad was produced | Unchanged |
| Family, personality, self-concept | Not measured directly; nothing in either dataset suggests this change with ad provenance | Unchanged / not evidenced |
Disclaimer/Publisher’s Note: The statements, opinions and data contained in all publications are solely those of the individual author(s) and contributor(s) and not of MDPI and/or the editor(s). MDPI and/or the editor(s) disclaim responsibility for any injury to people or property resulting from any ideas, methods, instructions or products referred to in the content. |
© 2026 by the authors. Licensee MDPI, Basel, Switzerland. This article is an open access article distributed under the terms and conditions of the Creative Commons Attribution (CC BY) license.
Copyright: This open access article is published under a Creative Commons CC BY 4.0 license, which permit the free download, distribution, and reuse, provided that the author and preprint are cited in any reuse.