

Submitted:
15 August 2026
Posted:
18 August 2026
You are already at the latest version
Abstract
Urban sustainability is often studied through separate lenses of mobility, public space, climate resilience, heritage, and smart-city technology, leaving limited understanding of how residents prioritize these dimensions when they must make explicit trade-offs. This study develops a discrete choice experiment to identify the urban future people would choose when alternative transformation pathways are presented simultaneously. The design comprises six attributes—urban form and public space, mobility and access, street safety, green and climate infrastructure, heritage and local identity, and smart urban services—together with a monthly household cost. Using face-to-face survey data from 400 respondents comprising 3,200 choice situations and 9,600 alternative observations, preferences were estimated with a panel mixed logit model, followed by relative-importance, willingness-to-pay, and scenario-simulation analyses. Street safety emerged as the strongest driver of choice, accounting for 27.9% of total preference importance, followed by mobility and access (17.8%) and green/climate infrastructure (15.9%). Monthly willingness to pay was highest for a one-level improvement in street safety (PKR 1,158), while smart urban services received the lowest valuation (PKR 489). Scenario simulation showed that the Integrated City captured 53.9% of predicted choices, substantially exceeding the Mobility City, Green City, Smart City, and Status Quo alternatives. The study contributes an integrated, resident-centred framework for evaluating urban transformation across place, movement, and transition, demonstrating that desirable urban futures are shaped less by technological sophistication alone than by the combined provision of safety, accessibility, environmental quality, and everyday urban value.
Keywords:
sustainable urban transformation
; discrete choice experiment
; mixed logit model
; street safety
; urban mobility
; green infrastructure
; willingness to pay
; urban futures
1. Introduction
Cities are being asked to transform on several fronts at once. They must accommodate continued urban growth while reducing environmental pressures, improving mobility, responding to climate risks, maintaining social and cultural qualities, and adapting public services to technological change. The challenge is therefore no longer simply how to make cities larger or more efficient, but how to shape urban change in ways that remain liveable, inclusive, resilient, and responsive to the people who use cities every day. Global urban agendas increasingly recognize that these objectives are interdependent and that decisions concerning land use, infrastructure, mobility, environmental quality, and public services can generate both complementarities and trade-offs [1]. Climate pressures add urgency to this transformation because urban development choices made today influence long-term exposure, energy demand, emissions, and adaptive capacity [2]. This has encouraged a shift from sector-specific interventions toward the idea of urban transformation as a systemic process involving institutions, physical environments, technologies, and the capacity of urban actors to direct change [3].
Yet the experience of urban transformation ultimately occurs at a much more immediate scale. Residents encounter the city through streets, neighbourhoods, public spaces, transport systems, local services, and the social meanings attached to particular places. Urban morphology research demonstrates that informal and incrementally developed environments are not spatially random but contain recurring configurational patterns that can be systematically examined in relation to access, connectivity, and spatial organization [4]. More broadly, evidence on place quality suggests that well-designed built environments can create interconnected social, health, economic, and environmental value rather than merely aesthetic benefits [5]. Similar relationships are evident in the mobility literature. Density, diversity, and urban design have long been associated with differences in travel behaviour [6], while subsequent synthesis research has shown that accessibility and street-network characteristics are particularly important in shaping travel demand [7]. Transit-oriented development extends this relationship by seeking closer integration between transport investment and urban form, although its outcomes vary substantially according to context, implementation, accessibility, and local design conditions [8].
These relationships become particularly important when urban development is viewed from the resident's perspective. A technically efficient planning intervention may not necessarily correspond with the qualities people value in their everyday surroundings. Research using stated-preference approaches in transit-oriented environments, for example, shows that users distinguish among street-level features and make meaningful trade-offs concerning pedestrian space, crossings, shade, land-use mix, parking, and built form [9]. Such evidence challenges approaches that evaluate sustainable urban development primarily through aggregate infrastructure provision or density targets. It suggests instead that the acceptability of urban transformation depends partly on how improvements are experienced at human scale and whether residents perceive meaningful gains in safety, accessibility, comfort, and environmental quality.
At the same time, the scope of urban transformation has expanded beyond conventional relationships between land use and transportation. Smart and sustainable city agendas increasingly combine digital infrastructure, environmental management, energy efficiency, data-driven services, and technological innovation [10]. This expansion has generated an important debate concerning whether urban technology is inherently citizen-centred or whether citizens are sometimes positioned mainly as users and consumers within technology-led models of urban development [11]. Climate-responsive planning introduces another layer of complexity. Urban green infrastructure can generate multiple benefits through heat mitigation, ecosystem services, environmental improvement, recreation, and human well-being, but its implementation also involves questions of spatial distribution, cost, governance, and public acceptance [12]. Reflecting these concerns, recent international smart-city frameworks increasingly emphasize that digitalization should serve broader goals of inclusion, sustainability, quality of life, and public value rather than function as an objective in itself [13]. Empirical research on smart-city services similarly shows that citizens evaluate technological innovation through perceived usefulness, service quality, reliability, security, cost, and the extent to which digital services produce meaningful improvements in everyday urban life [14]. The emerging people-centred approach consequently places residents' needs and public value at the core of digital urban transformation [15].
Despite these advances, a significant gap remains. Much of the literature continues to examine desirable urban change within relatively distinct domains. Urban-form studies concentrate on morphology, density, streets, public space, and place identity; transport research emphasizes accessibility, mode choice, safety, and transit-oriented development; environmental scholarship examines green infrastructure, energy, heat, and climate resilience; and smart-city research frequently focuses on technology, service delivery, or digital adoption. Each stream provides important evidence, but residents do not experience these dimensions separately. A person choosing between alternative urban futures may simultaneously value safer streets, better public transport, greener neighbourhoods, higher-quality public spaces, stronger local identity, and more effective digital services. These aspirations may also carry different costs. What remains less understood is how residents prioritize these benefits when they cannot evaluate each one in isolation and must instead make explicit trade-offs among competing urban improvements.
This study addresses this gap by conceptualizing sustainable urban transformation through three connected domains: Place, Movement, and Transition. Place captures urban form, public space, and local identity; Movement represents mobility, accessibility, and street safety; and Transition encompasses climate-responsive infrastructure and technology-enabled urban services. Rather than asking respondents whether each feature is desirable independently, the study uses a face-to-face discrete choice experiment in which alternative urban futures are presented as combinations of attributes with an associated household cost. Six dimensions—urban form and public space, mobility and access, street safety, green and climate infrastructure, heritage and local identity, and smart urban services—are evaluated simultaneously.
Accordingly, the central research question is: What combination of urban attributes defines the city people would choose when faced with competing pathways for sustainable urban transformation? The study contributes in three ways. First, it connects strands of urban research that are frequently investigated independently within a common resident-centred framework. Second, it moves beyond general measures of support or satisfaction by requiring respondents to reveal priorities through explicit trade-offs. Third, it translates these preferences into both monetary valuations and complete urban-future scenarios, providing an empirical basis for understanding not simply whether residents favour sustainable change, but which form of urban transformation they value most.
2. Literature Review
2.1. Urban Form, Public Space, and Place-Making
Urban transformation is experienced first through the physical and social organization of place. Urban morphology provides a useful basis for understanding this process because streets, plots, buildings, open spaces, and land uses do not operate independently; together, they create spatial conditions that influence accessibility, interaction, environmental exposure, and everyday activity. This perspective is particularly important in rapidly changing and incrementally developed urban environments, where formal planning frameworks may explain only part of the resulting spatial structure. Urban informality has therefore been interpreted not simply as an absence of planning but as a mode of urbanization shaped by negotiation, adaptation, and incremental development [16]. Morphological studies similarly show that the visibility and organization of informal environments reflect recurring spatial logics that can be examined systematically [17]. An integrated multidimensional approach extends this reasoning by combining different morphological characteristics to understand informal settlements as interconnected spatial systems rather than collections of isolated physical deficiencies [4]. Such an interpretation is consistent with the broader argument that neighbourhood diversity and fine-grained urban structure can sustain interaction and everyday urban life [18], while contemporary place-value research emphasizes that the quality of built environments generates social, environmental, health, and economic consequences [5].
The importance of urban form also lies in its relationship with the everyday problems residents encounter. Informal and rapidly transforming neighbourhoods often combine infrastructure deficiencies with insecure or contested public spaces, fragmented accessibility, environmental pressures, and incremental modifications to buildings and streets. These conditions make conventional physical assessments insufficient for explaining how neighbourhoods actually function. Research on the incremental production of informal urban space demonstrates how settlement form evolves through successive adaptations in buildings, plots, and public spaces [19]. This complements arguments that informality operates through flexible institutional and spatial arrangements [16], that physical form affects the visibility and use of urban space [17], and that successful urban places depend upon the intensity and diversity of everyday activity [18]. It also reinforces the need to evaluate place quality in relation to outcomes experienced by residents rather than through physical appearance alone [5].
Public space provides an especially important connection between morphology and lived experience. Streets, sidewalks, building edges, vacant spaces, and small open areas frequently accommodate activities that were never formally assigned to them. The production of urban space is therefore both physical and social: space acquires meaning through repeated use, negotiation, interaction, and adaptation [20]. Everyday practices can modify prescribed functions and create alternative forms of spatial use [21], while detailed observations of street life demonstrate how apparently ordinary public spaces accommodate complex economic and social relationships [22]. Human-scale urban design similarly emphasizes enclosure, walking conditions, active edges, opportunities for stopping, and interpersonal contact as fundamental components of successful public environments [23]. Recent work on informal settlements develops this perspective by showing how threshold and in-between spaces support everyday social, functional, and cultural activities within neighbourhood life [24]. This suggests that the value of urban space cannot be understood solely from its formal designation or geometric characteristics.
Street morphology provides a further bridge between urban structure and everyday experience. Street width, connectivity, frontage conditions, building enclosure, shade, pedestrian space, and patterns of activity influence both how streets are used and how comfortable they are under changing climatic conditions. Human-scale design research has long emphasized that the quality of movement and stationary activity depends upon the detailed configuration of the public realm [23]. Place-quality research adds that such characteristics have consequences extending beyond aesthetics to well-being and environmental performance [5]. Jacobs’ emphasis on mixed uses and continuous street activity [18], de Certeau’s understanding of everyday spatial practices [21], and Kim’s examination of sidewalks as negotiated urban environments [22] all reinforce the importance of analysing streets as lived spaces. Recent climate-responsive urban-design research extends this argument by showing that urban form, shading, vegetation, materials, and related spatial strategies can improve outdoor thermal conditions and the usability of urban open spaces [25].
Questions of form become more complex as cities densify vertically. Compact and high-rise development can improve land-use efficiency and potentially support transit, but its success depends on more than building height or density. Residents interpret vertical development through privacy, cultural expectations, social interaction, access to shared spaces, views, microclimate, and the relationship between towers and the street. Evidence concerning public perceptions of vertical cities shows that design form and socio-cultural integration remain important to the acceptance of higher-density development [26]. This aligns with the broader emphasis on human-scale experience [23], the multidimensional nature of place value [5], the social production of space [20], and the need for planning processes to possess sufficient transformative capacity to reconcile physical change with local needs [3]. People-centred urbanism therefore requires density to be considered as a qualitative spatial condition rather than solely as a quantitative development target.
Urban transformation must also negotiate continuity with inherited landscapes and local identity. Heritage is embedded not only in individual monuments but also in street patterns, settlement structures, materials, environmental adaptations, social practices, and collective meanings. Contemporary conservation increasingly recognizes this interaction between tangible and intangible values, particularly where traditional urban forms contain climate-responsive knowledge that remains relevant to present-day development. The quality of place is partly produced through such continuity [5], while human-scale urbanism emphasizes the importance of recognisable spatial environments [23]. Broader transformation frameworks likewise caution that systemic change should not be reduced to technological or physical restructuring alone [3]. People-centred approaches further emphasize the need for urban innovation to remain connected to local needs and values [15]. Values-based research on vernacular settlement morphology consequently demonstrates how heritage significance can be integrated with climate-responsive conservation and urban regeneration rather than treated as an obstacle to contemporary development [27]. Collectively, this literature defines place as an interaction among morphology, public space, identity, everyday practices, and the quality of the built environment.
2.2. Mobility, Safety, and Transit-Led Urban Transformation
The second major dimension of urban transformation concerns how people move through the city and gain access to opportunities. The relationship between transportation and urban form is reciprocal: land-use patterns shape travel demand, while major transport investments can alter accessibility, development intensity, land values, and patterns of urban growth. Early built-environment research identified density, diversity, and design as important influences on travel behaviour [6], with subsequent meta-analysis demonstrating particularly strong relationships between accessibility, street-network characteristics, and travel outcomes [7]. Transit-oriented development (TOD) seeks to capitalize on these relationships by integrating higher-density mixed-use development with high-capacity public transportation [8]. Empirical analysis of land-parcel dynamics associated with BRT investment further demonstrates that transport infrastructure can become a catalyst for physical land-use transformation around transit corridors [28].
Transit-led development, however, does not automatically produce a liveable pedestrian environment. The effectiveness of TOD depends on what happens between stations, buildings, streets, and destinations. Accessibility research therefore increasingly distinguishes proximity to transit from the broader quality of station-area environments [29]. Sustainable-mobility thinking similarly argues for reducing automobile dependence through coordinated changes in accessibility, urban structure, and travel opportunities rather than relying on technological efficiency alone [30]. Evidence connecting built form with travel behaviour [6,7] and reviews of TOD implementation [8] point toward the importance of street-level conditions. A multi-stakeholder choice experiment on liveable TOD reinforces this perspective by demonstrating the usefulness of explicit trade-offs when evaluating street-level development features rather than assuming that all TOD characteristics are valued equally [9].
The transformation of transit corridors into urban places further requires attention to the public realm. Transit corridors often concentrate movement without necessarily generating street life, pedestrian comfort, or strong relationships between transport infrastructure and surrounding development. Human-scale urbanism suggests that the quality of street edges and pedestrian environments strongly influences whether movement corridors also function as social spaces [23]. Place-value research likewise stresses the multiple benefits associated with better public environments [5], while accessibility-based TOD research highlights the importance of connecting transit provision to surrounding activities [29]. The sustainable-mobility paradigm adds that transport interventions should support broader changes in urban behaviour and spatial structure [30]. Empirical research on BRT-led TOD in Lahore shows that corridor transformation should be evaluated through changes in density, land-use diversity, and urban design around stations rather than as a transport-engineering intervention alone [31].
Equity introduces another layer to this relationship. Individuals experience mobility systems differently according to income, gender, location, vehicle ownership, physical ability, service availability, and the distribution of destinations. Transport disadvantage can reinforce social exclusion when access to employment, education, health care, and other opportunities depends on costly or unavailable mobility options [32]. The relationship between built form and travel behaviour [6,7] therefore has a distributive as well as an efficiency dimension. TOD can improve accessibility, but its benefits depend on who can reach, afford, and use the opportunities created around transit [8,29]. Comparative work on mode-choice patterns and socio-spatial equity demonstrates the importance of examining mobility transitions through both behavioural and distributional perspectives [33]. Sustainable urban transformation consequently requires not only lower-carbon mobility but also more equitable access to the urban opportunities that mobility provides.
The street itself is where many transportation objectives come into direct competition. Allocating time and space between pedestrians and vehicles involves trade-offs among traffic flow, crossing delay, safety, accessibility, and pedestrian comfort. Sustainable-mobility policy increasingly challenges the assumption that vehicular throughput should dominate such decisions [30], while transport-equity research emphasizes the disadvantages created when non-driving users face inferior access conditions [32]. Built-environment research also shows that street design and connectivity influence travel behaviour [6,7], and human-scale design principles emphasize the importance of pedestrian conditions in creating usable public environments [23]. Micro-simulation research examining trade-offs between vehicular and pedestrian traffic illustrates how signal-control strategies can be evaluated against both vehicle and pedestrian travel-time objectives [34]. This strengthens the argument that sustainable mobility depends on detailed design and management decisions as much as on network-level investment.
Among these street-level characteristics, safety may function as a fundamental condition for sustainable travel. Faster or cheaper public and active transport may remain unattractive when walking routes, crossings, waiting environments, or surrounding streets are perceived as unsafe. The sustainable-mobility paradigm recognizes behavioural change as central to transport transition [30], while transport exclusion research demonstrates that constraints on access extend beyond travel time and monetary cost [32]. Evidence concerning built-environment effects [6,7] and pedestrian-scale design [23] further indicates that the physical quality of access routes matters to travel decisions. A discrete choice experiment examining road safety as a binding constraint on sustainable mode choice found that safety-related improvements substantially increased the attractiveness of sustainable alternatives when respondents faced explicit trade-offs with conventional travel-time and cost attributes [35]. These strands of literature collectively define movement as more than mobility speed or transport supply; it encompasses accessibility, safety, equity, pedestrian experience, and the quality of connections between people and urban opportunities.
2.3. Climate-Smart and Technology-Enabled Urban Futures
Urban transformation is increasingly shaped by the need to respond simultaneously to climate change, resource consumption, energy use, and technological change. These pressures expose the limitations of treating land use, transport, buildings, and environmental infrastructure as separate systems. Climate-resilient urbanism requires the capacity to absorb disturbances while adapting physical and institutional systems over time [36], while nature-based approaches emphasize that interventions can generate multiple environmental and social co-benefits when integrated into broader urban strategies [37]. The IPCC similarly identifies urban form and infrastructure as important determinants of long-term mitigation and adaptation pathways [2]. Research integrating land use and transportation for energy efficiency extends this systems perspective by linking patterns of urban development and mobility with energy consumption and environmental pollution [38]. Such work suggests that low-carbon transformation cannot be achieved through isolated sectoral improvements.
The coupling between residential energy demand and transport energy use is especially important because households consume energy both within buildings and through daily mobility. Evaluating only one component can therefore obscure the broader energy consequences of neighbourhood form. Urban resilience research calls for greater attention to interdependencies among infrastructure systems [36], while climate-responsive planning increasingly emphasizes co-benefits across mitigation, adaptation, and quality of life [2,37]. Green infrastructure research similarly demonstrates that environmental interventions interact with the wider characteristics of urban neighbourhoods [12]. Research examining residential density through both building and transportation energy use illustrates the value of evaluating neighbourhood decarbonization beyond building performance alone [39]. This expands the meaning of sustainable mobility from transport emissions alone toward the combined environmental performance of urban living.
Land conversion and urban heat provide another manifestation of these interconnected pressures. Expansion into agricultural or vegetated areas can simultaneously alter land availability, surface characteristics, ecological functions, and local thermal conditions. Climate adaptation therefore requires attention to the spatial pattern of development rather than only building-level interventions [2]. Urban-resilience frameworks emphasize the capacity of land systems to respond to environmental stresses [36], while nature-based solutions highlight vegetation as infrastructure capable of providing cooling and other ecosystem services [37]. Place-quality research further suggests that environmental performance and human experience are closely connected [5]. Geospatial evidence documenting a transition from green to built-up land alongside changes in the urban heat environment and agricultural conversion demonstrates how growth patterns can generate multiple environmental consequences through a single process of spatial transformation [40].
Green infrastructure consequently occupies an important position between environmental performance and everyday quality of life. Parks, trees, green corridors, vegetated streets, and other nature-based interventions can support cooling, stormwater management, biodiversity, recreation, and psychological well-being [12,37]. Their value, however, is not determined solely by biophysical performance. Residents experience green infrastructure through accessibility, maintenance, comfort, aesthetics, safety, and opportunities for social use. Urban resilience research [36], climate policy [2], and place-value approaches [5] therefore support a multidimensional understanding of its contribution. Empirical research assessing green infrastructure within eco-centric smart cities extends this perspective by linking environmental provision with resident satisfaction rather than considering greenery only as a technical environmental input [41].
Digitalization adds another layer to contemporary urban transition. Smart-city strategies have increasingly promoted sensors, platforms, data analytics, connected infrastructure, and digitally enabled municipal services as mechanisms for improving urban efficiency [10]. Critics nevertheless caution that technologically driven models can marginalize citizenship, participation, and public value when technology becomes the objective rather than a means of addressing urban needs [11]. Recent international frameworks therefore emphasize people-centred smart cities [13,15], while digital-twin research has illustrated the potential for digital urban systems to support citizen feedback and interaction [42]. Research on smart-city service adoption similarly shows that citizens evaluate technology-enabled services through factors including perceived usefulness, service quality, reliability, security, and perceived cost [14]. Smartness, in this interpretation, derives from the value technology creates for people rather than from the quantity of technology deployed.
Digital tools are also changing how urban environments are represented and understood before they are constructed. Virtual reality provides immersive environments in which users can experience scale, enclosure, visibility, spatial relationships, and design alternatives differently from conventional two-dimensional plans. Such tools can potentially improve communication and spatial comprehension, although their effectiveness depends on usability, immersion, cognitive engagement, and the purpose for which they are employed. Broader smart-city research highlights the importance of connecting technological capability with actual user value [10,11], while people-centred frameworks stress accessibility and meaningful engagement [13,15]. Digital-twin research similarly illustrates the potential for interactive representations to connect urban modelling with human feedback [42]. Research comparing immersive and traditional virtual-reality environments demonstrates that immersive visualization can improve users’ understanding of architectural spatial arrangements and three-dimensional models [43].
Technological innovation is simultaneously reshaping the physical production of urban infrastructure. Additive manufacturing offers opportunities for material optimization, automated fabrication, complex geometry, and potentially reduced construction waste, although sustainability outcomes depend on material composition, energy use, structural requirements, scale, and life-cycle impacts [44]. This illustrates an important distinction between innovation as technological novelty and innovation as a contributor to sustainable urban outcomes. Smart-city frameworks [10,13], people-centred approaches [15], and interactive digital-city research [42] all point toward the need to evaluate technologies according to the problems they solve and the benefits they generate. Research on a full-scale 3D-concrete-printed pedestrian bridge demonstrates how fabrication-informed structural design and additive manufacturing can support material-efficient, reusable, and recyclable structural solutions [45]. Together, these strands define transition as the capacity to combine climate response, resource efficiency, green infrastructure, and technological innovation in ways that improve urban performance without losing sight of resident needs.
2.4. Integrating Place, Movement, and Transition
The literature reveals substantial progress within each of these domains, but also a persistent tendency to examine them separately. Morphological and place-based research explains how urban form, public space, heritage, and everyday practices influence lived environments [4,5,24,27]. Mobility scholarship demonstrates that accessibility, street design, transit development, equity, and safety influence how residents move through those environments [6,7,8,9,33,35]. Climate and smart-city research, meanwhile, addresses green infrastructure, energy, environmental performance, and technological innovation [10,12,13,14,15,36,37,38,39,40,41,42,43,44,45]. Yet residents encounter these systems simultaneously. A safer street may require changes in traffic allocation; greater density may improve transit accessibility while changing perceptions of privacy or place; additional green infrastructure competes for scarce urban space; and digitally enhanced services may carry costs without necessarily addressing the physical conditions residents value most.
This fragmentation creates an important empirical gap. Much existing research asks whether an individual intervention is beneficial, acceptable, or associated with a particular outcome. Such approaches are valuable but provide less insight into priority under constraint. In practice, planning decisions involve limited land, financial resources, household costs, and competing objectives. Residents may support safer streets, better transit, more public space, greener neighbourhoods, stronger heritage protection, and improved digital services when each is presented independently, yet their priorities may change when these attributes are offered as competing bundles. A trade-off perspective is therefore required to distinguish general approval from the strength of actual preferences.
To address this gap, the present study organizes sustainable urban transformation through three interconnected domains: Place, Movement, and Transition. Place represents the physical, social, and cultural qualities of the urban environment; Movement captures accessibility, mobility, and street safety; and Transition represents environmental adaptation and technology-enabled change. These domains are not proposed as independent systems but as overlapping dimensions through which residents evaluate possible urban futures. The central research question is therefore: What combination of urban attributes defines the city people would choose when faced with competing pathways for sustainable urban transformation? The study addresses this question through a discrete choice framework that requires respondents to make explicit trade-offs among urban attributes rather than evaluating each dimension independently.
3. Materials and Methods
3.1. Study Area and Survey Approach
The empirical study was conducted in Lahore, Pakistan, a large and rapidly transforming metropolitan area characterized by considerable variation in urban form, transportation conditions, neighbourhood development, environmental quality, and access to urban services. Lahore provides a particularly suitable setting for examining preferences for sustainable urban transformation because historic districts, established residential areas, expanding peripheral development, major public-transport infrastructure, increasing development intensity, and climate-related pressures coexist within the same metropolitan region. Pakistan’s most recent national census also reflects the continuing concentration of population and urban growth in major metropolitan areas such as Lahore [46]. This diversity provides an appropriate context for examining how residents evaluate alternative combinations of physical, mobility, environmental, cultural, and technological improvements.
Primary data were collected through a structured face-to-face survey, with a final analytical sample of 400 respondents. Face-to-face administration was considered appropriate because the choice experiment required participants to compare several urban-development characteristics simultaneously. Direct administration enabled the survey team to present the choice tasks consistently, clarify procedural questions when necessary, and reduce the likelihood that respondents would misunderstand the structure of the alternatives. Participation was voluntary, and respondents completed the survey individually.
The questionnaire comprised two components. The first recorded respondent characteristics, including age, gender, education, household income, employment status, neighbourhood type, car ownership, public-transport use frequency, and length of residence in the city. These variables provided contextual information on the socioeconomic and mobility characteristics of the sample. The second component contained the discrete choice experiment (DCE), in which respondents evaluated alternative packages of urban improvements rather than individual interventions in isolation.
A stated-choice approach was adopted because the study sought to identify how residents prioritize competing urban improvements under explicit trade-offs. DCEs are grounded in random utility theory, whereby individuals are assumed to select the alternative providing the greatest utility from the available choice set [47]. They are particularly appropriate for evaluating multi-attribute policy alternatives where preferences depend on combinations of characteristics and associated costs [48,49].
3.2. Selection of Attributes and Levels
The DCE was structured around the three conceptual domains developed in the literature review—Place, Movement, and Transition. These domains were translated into six experimentally varied urban-transformation attributes, as shown in Table 1. Place was represented by urban form and public space and by heritage and local identity. Movement was represented by mobility and access and by street safety. Transition was represented by green and climate infrastructure and by smart urban services. A monetary attribute representing an additional monthly household cost was included to introduce a realistic resource constraint and enable estimation of willingness to pay.
The selection of these attributes was intended to capture the principal dimensions through which residents are likely to experience urban transformation in everyday life. Rather than focusing exclusively on physical design, transportation, environmental performance, or technological change, the experiment brought these dimensions together within a single choice framework. This was important because actual planning decisions rarely involve improvements in only one domain. For example, changes in street design may simultaneously affect accessibility, safety, public-space quality, environmental comfort, and the character of a neighbourhood. The attribute structure therefore allowed respondents to evaluate alternative urban futures as multidimensional packages rather than as isolated planning interventions.
The attributes were defined in sufficiently broad terms to capture recognizable dimensions of urban transformation while avoiding an excessive number of characteristics within each choice task. Limiting the number and complexity of attributes is important in stated-choice research because respondents must be able to compare profiles without excessive cognitive burden [49,50]. Each non-monetary attribute was represented by three ordered levels: 0 = existing or basic conditions, 1 = moderate improvement, and 2 = strong improvement. Using a common three-level structure also ensured consistency across the six non-monetary attributes and facilitated comparison of their relative influence in subsequent analysis. The progression from existing conditions to moderate and strong improvement was designed to represent increasingly ambitious levels of urban intervention while remaining straightforward for respondents to interpret during face-to-face administration.
The cost attribute varied across the designed alternatives from PKR 500 to PKR 1500 per month, while the status-quo alternative involved no additional household cost. The monetary attribute was expressed as a monthly household contribution so that respondents could consider urban improvements in relation to a familiar and recurring financial trade-off. Incorporating a cost attribute also prevents the experiment from becoming a simple comparison in which respondents can select packages containing more improvements without any associated sacrifice. It therefore introduces an explicit constraint that makes the choice tasks more realistic and allows the strength of preferences for different urban attributes to be evaluated in relation to their economic cost. Stated-choice methods are particularly useful for this purpose because the marginal utility of an attribute can be evaluated relative to the marginal disutility of its monetary cost [48,51].
3.3. Experimental Design and Choice Tasks
The experimental design combined different levels of the six urban attributes and household cost to generate alternative urban-development profiles. Attribute combinations were constructed to provide meaningful variation across alternatives while avoiding identical profiles and straightforward dominance wherever possible. Good DCE design requires sufficient variation to estimate the contribution of individual attributes while maintaining choice tasks that respondents can reasonably evaluate [50,52].
The complete experiment contained 16 choice sets, which were divided into two blocks of eight tasks to reduce respondent burden. Each participant completed one block and therefore made eight separate urban-future choices. Blocking allowed a wider range of attribute combinations to be evaluated across the full sample without requiring every respondent to complete all 16 tasks.
Each task contained three alternatives:
- Alternative A—a hypothetical urban-development package;
- Alternative B—a competing hypothetical urban-development package; and
- Status Quo (SQ)—continuation of existing conditions without an additional household contribution.
Respondents were asked to select the alternative they would prefer if the three options represented feasible directions for future urban development. The inclusion of a status-quo alternative allowed respondents to reject both proposed transformation packages and therefore reduced the possibility of forcing an artificial preference for urban change. Choice-based experimental-design literature recommends maintaining plausible attribute combinations and manageable task numbers to improve the validity of stated choices [49,50,52].
With 400 respondents completing eight tasks each, the survey generated 3,200 choice situations. As each situation contained three alternatives, the econometric dataset comprised 9,600 alternative-level observations. The data were transformed into long format, with one record for each alternative in every choice situation and a binary choice indicator coded 1 for the selected alternative and 0 otherwise. Sample size requirements in DCE research depend on the number of alternatives, tasks, attribute levels, and intended econometric specification; the present design provided repeated choice observations from 400 individual decision makers for panel estimation [53].
3.4. Mixed Logit Model
The choice data were analysed using a panel mixed logit model within the random utility framework. This approach assumes that respondents select the alternative that provides the greatest utility among the options presented in each choice task [47,48]. The observable component of utility was specified using the attributes included in the discrete choice experiment: urban form and public space, mobility and access, street safety, green and climate infrastructure, heritage and local identity, smart urban services, and monthly household cost. A status-quo alternative-specific constant was also included to capture any general preference for maintaining existing conditions that was not explained by the measured attributes.
Mixed logit was selected because it offers greater flexibility than the standard conditional logit model and can account for differences in preferences across respondents [54,55]. This was particularly important in the present study because each participant completed eight choice tasks, producing repeated observations from the same individual. The panel specification therefore preserved the repeated-choice structure of the data and allowed respondent-specific preferences to remain consistent across the eight decisions made by each participant.
The six non-monetary urban-transformation attributes were specified as normally distributed random parameters. Their estimated mean coefficients represent the average influence of each attribute on choice across the sample, while the estimated standard deviations indicate the extent to which preferences vary among respondents. A statistically significant standard deviation was interpreted as evidence of meaningful preference heterogeneity for the corresponding attribute. The monthly cost coefficient and the status-quo alternative-specific constant were treated as fixed parameters. Correlations among the random coefficients were not imposed in the final specification.
Monthly household cost was divided by 1000 before estimation so that the estimated coefficient represented the effect of an additional PKR 1000 per month. Positive coefficients for the non-monetary attributes indicate that stronger levels of the corresponding urban improvement increase the probability that an alternative is selected, whereas a negative cost coefficient indicates that higher household contributions reduce the attractiveness of an alternative.
The model was estimated in R using the mlogit package [56]. The final specification employed 200 Halton draws for simulated maximum-likelihood estimation. Halton sequences were used to approximate the choice probabilities associated with the random parameters while maintaining computational efficiency [48,54]. The panel option was retained throughout estimation to account for the eight repeated choices made by each respondent.
Model performance was assessed using the log-likelihood, Akaike Information Criterion (AIC), and Bayesian Information Criterion (BIC). Statistical significance of the estimated parameters was evaluated using standard errors, z-statistics, and corresponding p-values. The resulting mixed logit estimates were subsequently used to calculate relative attribute importance, willingness to pay, and predicted preferences across the alternative urban-future scenarios.
3.5. Relative Attribute Importance and Willingness to Pay
Following estimation of the mixed logit model, the mean coefficients were used to compare the relative contribution of the six non-monetary urban-transformation attributes. Because all six attributes were measured on the same three-level scale, their effects could be compared using the change in utility associated with moving from the lowest to the highest level. This provided a common basis for identifying which attributes exerted the greatest influence on respondents’ choices.
For each attribute, the utility range was calculated from the estimated coefficient and the difference between the minimum and maximum attribute levels. The resulting values were then expressed as a proportion of the combined utility range across all six attributes. This produced a relative importance percentage for each dimension of urban transformation. Higher percentages indicate that an attribute contributed more strongly to the overall preference structure, while lower percentages indicate a comparatively smaller influence on choice. The resulting ranking was used to identify the urban characteristics that residents valued most when evaluating alternative development packages.
The monetary attribute was then used to estimate willingness to pay (WTP) for improvements in each non-monetary attribute. WTP was derived by comparing the estimated coefficient of each urban attribute with the coefficient of monthly household cost. Because the cost variable was entered into the model in units of PKR 1000, the resulting estimates were converted back into Pakistani rupees for interpretation. The main WTP measure therefore represents the estimated monthly household amount respondents were willing to pay for a one-level improvement in each urban-transformation attribute.
A one-level improvement corresponds to moving from existing or basic conditions to a moderate level of improvement, or from a moderate level to a strong level. This interpretation was retained because it provides a clear and policy-relevant monetary measure of the incremental value residents place on each type of urban intervention. In addition, the full improvement from the lowest to the highest level can be interpreted as twice the one-level value because the six non-monetary attributes were coded consistently from 0 to 2.
Uncertainty around the WTP estimates was assessed using 95% confidence intervals derived through the delta method and the variance-covariance matrix of the final mixed logit model. This allowed the monetary valuations to be presented together with an indication of their statistical precision. The combined relative-importance and WTP analysis therefore provided two complementary interpretations of resident preferences: the first identified how strongly each attribute influenced urban-future choices, while the second translated those preferences into an estimated monetary value [48,51,54].
3.6. Urban-Future Scenario Simulation
The final analysis translated individual attribute preferences into complete and interpretable urban-future scenarios, as shown in Table 2. Five scenarios were constructed to represent competing development pathways: Status Quo City, Mobility City, Green City, Smart City, and Integrated City. Rather than examining each attribute independently, this analysis estimated the probability that residents would select each complete package when the attributes and household costs were considered simultaneously.
The Mobility City emphasized mobility and street-safety improvements; the Green City prioritized green infrastructure and public-space quality; and the Smart City emphasized technology-enabled urban services. The Integrated City represented strong improvement across all six urban dimensions but also carried the highest household cost, while the Status Quo City retained current conditions without an additional cost.
Predicted choice probabilities were estimated through Monte Carlo simulation using 10,000 draws from the random-parameter distributions obtained from the mixed logit model. For each draw, utility was calculated for all five scenarios using the estimated random coefficients for the six urban attributes and the fixed coefficients for cost and the status-quo constant. Scenario utilities were transformed into probabilities using the logit probability function, and the probabilities were then averaged across all draws. This produced population-level predicted choice shares for each urban future. The scenario analysis therefore provided the final link between individual attribute valuation and the paper's central question: which complete urban future would residents choose when different transformation pathways and their associated costs are considered together?
4. Results
4.1. Respondent Characteristics and Choice Patterns
The final analytical sample consisted of 400 respondents, with each participant completing eight discrete choice tasks. The sample included 225 male respondents, 169 female respondents, and six respondents who identified as another gender or preferred not to disclose their gender. Respondents also varied in educational attainment, neighbourhood type, car ownership, public-transport use, employment status, household income, age, and length of residence in the city, providing variation in the social and mobility characteristics represented in the choice experiment.
Across the 3,200 choice situations, respondents selected Alternative A in 39.8% of cases and Alternative B in 45.4%, while the status-quo alternative was selected in 14.8%. Combined, the two transformation alternatives therefore accounted for approximately 85.2% of all observed choices. This initial pattern indicates that, when presented with alternative combinations of urban improvements and associated household costs, respondents generally selected an option involving some degree of urban change rather than continuation of existing conditions. However, the presence of status-quo choices also confirms that respondents did not automatically favour proposed transformation packages in every task.
Figure 1 provides a descriptive assessment of how selected choice outcomes varied across several respondent groups. Panel A presents the proportion of improved-city alternatives selected by gender. Male and female respondents showed broadly comparable distributions, with both groups selecting transformation alternatives in a large majority of their choice tasks. The median values and group means were similar, although considerable within-group variation remained. Some respondents selected an improved alternative in nearly every task, whereas others retained the status quo more frequently. The six respondents in the other/prefer-not-to-say category also generally selected improved alternatives, although the small size of this group means that its distribution should be interpreted descriptively rather than comparatively.
Panel B shows the average improvement level of the alternatives selected across educational categories. The distributions were concentrated around similar values for respondents with secondary education or less, college or diploma qualifications, bachelor's degrees, and postgraduate education. Although the shapes of the distributions differed somewhat, particularly in their lower tails, there was no strong descriptive separation between educational groups. This suggests that the overall intensity of urban improvement preferred by respondents was not confined to those with higher levels of formal education.
Panel C compares the mean street-safety level selected by neighbourhood type. Inner-city, established urban, and peri-urban respondents all displayed substantial dispersion in their selected safety levels, but their central tendencies remained relatively close. Respondents across all three neighbourhood categories therefore showed a tendency to select alternatives containing some degree of street-safety improvement. The overlap among the distributions indicates that safety preferences were not limited to a single type of residential environment.
Panel D examines selected mobility and access levels according to frequency of public-transport use. Daily users, respondents using public transport several times per week or month, and those who rarely or never used public transport all selected alternatives containing improved mobility conditions. Mobility preferences varied modestly across transit-use groups, without a clear monotonic gradient. This variation is particularly relevant to the mixed logit results presented below, where mobility and access emerged as the only attribute displaying statistically significant preference heterogeneity.
4.2. Mixed Logit Model Results
The panel mixed logit model was estimated using all 3,200 repeated choice situations and the corresponding 9,600 alternative observations. The final specification used 200 simulation draws and treated the six non-monetary urban attributes as random parameters. Monthly household cost and the status-quo alternative-specific constant were estimated as fixed parameters. The final model produced a log-likelihood of −2951.140, an Akaike Information Criterion (AIC) of 5930.280, and a Bayesian Information Criterion (BIC) of 6030.654.
The estimated mean coefficients indicate that all six urban-transformation attributes significantly influenced choice in the expected positive direction. In contrast, monthly household cost produced a significant negative effect. The results in Table 3, therefore show that respondents systematically evaluated the content of the proposed urban packages while simultaneously accounting for their associated financial costs.
Among the six urban attributes, street safety produced the largest positive coefficient (β = 0.663, p < 0.001). A movement from a lower to a higher level of street-safety provision therefore generated the largest increase in the utility associated with an urban-development alternative, holding the other characteristics constant. This establishes street safety as the strongest individual determinant of respondents' choices in the model.
The next largest coefficient was observed for mobility and access (β = 0.423, p < 0.001). Respondents were consequently more likely to choose alternatives that provided stronger public-transport access and increasingly multimodal conditions. The magnitude of this coefficient was smaller than that of street safety but remained substantially larger than several of the place- and technology-oriented attributes.
Green and climate infrastructure also had a strong positive effect (β = 0.378, p < 0.001). Alternatives incorporating higher levels of green and climate-responsive infrastructure were more attractive to respondents than otherwise comparable alternatives with more limited provision. This positioned environmental improvement as the third most influential attribute in the estimated model.
The coefficient for urban form and public space was 0.345 (p < 0.001), confirming that improvements to physical form and public-space quality also contributed positively to urban-future choices. Although this coefficient was smaller than those for street safety, mobility, and green infrastructure, its magnitude indicates that the quality of the physical urban environment remained an important component of respondents' preferred transformation packages.
The two remaining attributes displayed smaller but still highly significant positive effects. Heritage and local identity had a coefficient of 0.285 (p < 0.001), while smart urban services had a coefficient of 0.280 (p < 0.001). The similarity between these coefficients indicates that the two dimensions made comparable contributions to choice within the experimental framework. Importantly, their positive coefficients show that neither cultural continuity nor technology-enabled services were rejected by respondents; instead, their influence was more modest relative to safety, mobility, environmental infrastructure, and physical place quality.
The monthly household cost coefficient was negative and statistically significant (β = −0.573, p < 0.001). Because cost was entered in units of PKR 1,000, the coefficient indicates a substantial decline in utility as the required monthly household contribution increased. This result confirms that the experimental choices incorporated a meaningful financial trade-off. Respondents were therefore not simply selecting alternatives containing the highest levels of every improvement. Higher-quality development packages became less attractive as their household cost increased.
The status-quo alternative-specific constant was positive and statistically significant (β = 0.593, p < 0.001). This coefficient represents an underlying preference for the status quo that remains after the experimentally observed attributes and cost are controlled for. Its positive value suggests that some respondents retained an intrinsic preference for existing conditions or required sufficiently attractive improvements to shift away from them. This result is compatible with the observed choice frequencies: although status quo was selected in only 14.8% of the choice situations, it remained a meaningful option for part of the sample.
The random-parameter results provide further insight into whether the strength of these preferences varied across respondents. The estimated standard deviation for mobility and access was statistically significant (p = 0.034), providing evidence of preference heterogeneity in the value residents attached to mobility improvements. Some respondents therefore placed substantially greater emphasis on mobility and accessibility than others.
In contrast, the estimated random-parameter standard deviations for urban form and public space, street safety, green and climate infrastructure, heritage and local identity, and smart urban services were not statistically significant. The model therefore did not provide statistically significant evidence of preference heterogeneity for these attributes. Street safety, in particular, displayed a large mean effect while its random-parameter dispersion was not statistically significant, suggesting that no substantial heterogeneity in the strength of this preference was detected within the model.
The mixed logit results therefore establish a clear empirical hierarchy. Street safety exerted the strongest effect, followed by mobility and access, green and climate infrastructure, and urban form and public space. Heritage and local identity and smart urban services remained positively valued but exerted comparatively smaller effects. This ordering is examined more directly through the relative-importance and monetary-valuation results.
4.3. Relative Attribute Importance and Willingness to Pay
The relative-importance analysis converted the mixed logit coefficients into a common percentage scale, allowing the contribution of each non-monetary attribute to total preference weight to be compared directly. As shown in Figure 2A, street safety represented 27.9% of total relative importance, substantially exceeding every other urban-transformation dimension.
Mobility and access accounted for 17.8%, placing it second. Green and climate infrastructure contributed 15.9%, while urban form and public space accounted for 14.5%. The two lowest-ranked attributes were heritage and local identity at 12.0% and smart urban services at 11.8%. The difference between these final two attributes was very small, whereas the gap separating street safety from the remaining dimensions was pronounced.
The importance results show that the two Movement-related attributes together represented a substantial component of total preference weight. Street safety alone contributed more than one-quarter of total importance, and when combined with mobility and access, these two attributes represented considerably more of the preference structure than either the Place- or Transition-related attributes individually.
The willingness-to-pay estimates shown in Figure 2B provide a monetary interpretation of the same preference hierarchy. The highest WTP was again associated with street safety, for which respondents were willing to pay an estimated PKR 1,158 per month for a one-level improvement. The 95% confidence interval was wider for street safety than for several other attributes, but the estimated monetary value remained clearly positive.
The estimated WTP for a one-level improvement in mobility and access was PKR 738 per month, making it the second-highest monetary valuation. Green and climate infrastructure was valued at PKR 661 per month, while the corresponding WTP for urban form and public space was PKR 601 per month.
Lower monetary valuations were obtained for the remaining two attributes. Respondents were willing to pay approximately PKR 498 per month for a one-level improvement in heritage and local identity, while smart urban services generated an estimated WTP of PKR 489 per month. Although these estimates were lower than those associated with safety and mobility, both remained positive, demonstrating that respondents still attributed economic value to cultural and technological improvements.
The ranking generated through WTP therefore exactly mirrors the ordering obtained through relative importance: street safety, mobility and access, green and climate infrastructure, urban form and public space, heritage and local identity, and smart urban services. This consistency is expected because both measures are derived from the underlying mixed logit coefficients, but their interpretations differ. Relative importance describes the contribution of each attribute to the overall preference structure, whereas WTP expresses the estimated monetary value of an incremental improvement.
The magnitude of the street-safety valuation is especially notable. Its WTP was substantially higher than the monetary value attached to any other attribute and was more than twice that associated with smart urban services. The results therefore indicate that respondents placed their greatest economic value on improvements directly affecting everyday safety, followed by accessibility and environmental conditions. Technology-enabled urban services remained positively valued but did not attract the premium associated with improvements to the physical and mobility environment.
4.4. Urban-Future Scenario Simulation
The scenario simulation extended the analysis from individual attributes to complete urban-development pathways, as shown in Figure 3. Five alternative futures were evaluated: Status Quo City, Mobility City, Green City, Smart City, and Integrated City. Each scenario represented a distinct combination of the experimentally evaluated urban attributes and an associated monthly household cost.
The simulation produced a particularly clear ordering of predicted preferences. The Integrated City received 53.9% of the predicted choice share, accounting for more than half of the model-predicted choices. This scenario contained strong improvements across all six non-monetary attributes and also carried the highest household contribution. Its dominant predicted share therefore indicates that the combined utility generated by broad-based urban improvements more than compensated for the higher financial cost for a large proportion of respondents.
The Mobility City ranked second with 19.8% of predicted choices. This scenario emphasized stronger mobility and accessibility conditions together with street-safety improvements. Its position is consistent with the mixed logit and relative-importance results, in which the two Movement-related attributes emerged as the strongest drivers of preference.
The Green City accounted for 13.9% of predicted choices. Its share reflects the positive value attached to green and climate infrastructure and improved urban form and public-space conditions. Although environmental and place-based improvements attracted meaningful support, the Green City remained clearly less preferred than the comprehensive Integrated City and also trailed the Mobility City.
The Smart City received 10.3% of predicted choices. Smart urban services had already recorded the smallest relative-importance share and lowest WTP of the six attributes, and the scenario simulation produces a corresponding result at the package level. The Smart City was preferred by a meaningful minority of respondents but did not approach the support generated by either the integrated or mobility-oriented alternatives.
The Status Quo City attracted only 2.1% of predicted choices, the lowest share by a substantial margin. This scenario represented existing conditions without an additional household contribution. Its small predicted share is noteworthy because the mixed logit model identified a positive status-quo constant. The combination of these two findings indicates that an underlying tendency to retain current conditions exists, but that tendency can be overcome when respondents are offered sufficiently attractive combinations of improvements.
The combined predicted share of the four transformation scenarios was therefore 97.9%, leaving very limited support for an urban future based on maintaining existing conditions. More importantly, the distribution of preferences among the transformation scenarios demonstrates that respondents did not favour all forms of change equally. A technology-focused future attracted less support than a mobility-focused pathway, while an integrated package combining physical, mobility, environmental, cultural, and technological improvements clearly dominated the specialized alternatives.
The scenario analysis therefore reinforces the pattern identified throughout the empirical results. Respondents valued individual improvements across all three conceptual domains, but their choices consistently gave greatest weight to street safety and mobility. At the same time, when these improvements were combined with stronger public spaces, green infrastructure, heritage integration, and smart services, the resulting Integrated City generated the highest predicted preference. The findings show that the preferred urban future is not defined by a single intervention or sector. Rather, respondents favour a comprehensive transformation in which the strongest everyday priorities are incorporated within a broader package of urban improvements.
5. Discussion
5.1. Safety and Mobility as Foundational Urban Priorities
The findings demonstrate that residents do not value all dimensions of sustainable urban transformation equally. Although each of the six non-monetary attributes had a positive and statistically significant effect on choice, street safety emerged as the dominant consideration, accounting for 27.9% of total relative importance and generating the highest monthly willingness to pay. This result suggests that safety is not simply one desirable characteristic among many; rather, it may operate as a foundational condition that shapes whether other urban improvements are considered attractive or usable. A city may provide better transit, greener streets, improved public spaces, or advanced digital services, but the value of these interventions can be constrained if residents do not feel sufficiently safe while moving through the urban environment.
This interpretation is consistent with sustainable-mobility research that emphasizes the importance of creating conditions in which people can realistically shift away from automobile dependence [30]. The built environment influences not only travel efficiency but also perceived exposure to risk, comfort, and the willingness to walk or use public transport. Earlier research has similarly shown that traffic safety is closely related to street design and the wider built environment rather than being solely an outcome of driver behaviour [57]. Walkability research further demonstrates that pedestrian movement depends on connected, legible, comfortable, and safe street environments [58,63]. Against this background, the present findings extend earlier work identifying road safety as a binding constraint on sustainable mode choice [35]. The relatively large WTP for street-safety improvements indicates that respondents attach substantial economic value to interventions that reduce everyday mobility risk.
Mobility and access ranked second in both relative importance and willingness to pay, reinforcing the centrality of movement within residents' preferred urban future. Unlike most other attributes, mobility also displayed statistically significant preference heterogeneity. This suggests that while better accessibility is broadly valued, the strength of this preference differs meaningfully among respondents. Such variation is plausible because mobility needs are closely linked to travel frequency, vehicle ownership, employment location, household structure, and access to public transport. Previous research has shown that transport disadvantage can reinforce social exclusion when individuals cannot readily reach employment, education, health care, and other opportunities [32,64]. Related work on housing affordability pressure and forced residential mobility further broadens this perspective by showing that urban mobility is not limited to everyday travel but also concerns households’ ability to remain within or relocate across urban areas under changing affordability conditions [59]. The current findings also align with evidence that socio-spatial characteristics influence mode-choice patterns and the distribution of mobility benefits [65].
5.2. Why Residents Prefer Integrated Urban Transformation
The scenario simulation provides an important extension beyond the ranking of individual attributes. The Integrated City captured 53.9% of predicted choices, substantially more than the Mobility City, Green City, Smart City, or Status Quo City. This indicates that residents do not simply prefer the single attribute with the highest utility coefficient. Instead, they value combinations of improvements that address multiple dimensions of urban life simultaneously.
This finding supports broader arguments that urban transformation should be understood as a systemic rather than sectoral process. Sustainable urban change involves interactions among physical form, transport, environmental systems, technology, institutions, and everyday practices [3]. Similarly, research on sustainable urban transformation has emphasized that meaningful change often depends on coordinated interventions across multiple urban systems rather than isolated technological or infrastructural projects [60,66,67]. The strong preference for the Integrated City is therefore significant because it suggests that residents recognize value in the combined delivery of place quality, mobility, environmental infrastructure, heritage, and technology.
At the same time, the scenario results reveal that integration does not imply equal weighting. The Mobility City ranked second, while the Green and Smart scenarios attracted considerably smaller shares. This pattern mirrors the attribute-level results, in which street safety and mobility clearly dominated the preference structure. Recent stated-choice research examining the Orange Line Metro and office-location choice in Lahore also reinforces the importance of transport accessibility in location decisions, illustrating how major transit investment can influence preferences extending beyond travel itself to the spatial organization of urban activities [61].
The very low predicted preference for the Status Quo City is also important. The positive status-quo constant in the mixed logit model indicates that some underlying resistance to change remains after controlling for the measured attributes. Yet when residents were presented with sufficiently attractive combinations of improvements, the predicted share of the status quo fell to only 2.1%. This suggests that resistance to urban transformation may not necessarily reflect opposition to change itself. Instead, residents may require development packages that deliver visible and sufficiently valuable improvements to justify their associated costs and disruptions. Such behaviour is also consistent with the well-established status quo bias, whereby decision makers may favour existing conditions unless alternatives provide sufficiently attractive perceived gains [68].
5.3. Place, Climate, and Technology in the Preferred City
The middle-ranking attributes provide further insight into what residents consider a desirable urban future. Green and climate infrastructure accounted for 15.9% of relative importance and generated an estimated monthly WTP of PKR 661 for a one-level improvement. This places environmental quality below safety and mobility but clearly above the lowest-ranked attributes. The result is consistent with evidence that urban green infrastructure can simultaneously support cooling, stormwater management, recreation, biodiversity, and well-being [12,37,69,70]. Importantly, residents appear to value these benefits as part of the everyday urban environment rather than solely as responses to abstract climate objectives.
Urban form and public space followed closely, accounting for 14.5% of relative importance. This reinforces the argument that sustainable transformation must remain attentive to the quality of physical environments through which residents experience the city. Public space, street morphology, building relationships, and neighbourhood structure influence how urban areas function socially as well as spatially [20,21,22,23]. Research on climate-responsive urban open-space design similarly emphasizes that physical form and spatial interventions can improve environmental comfort and everyday usability [25]. Broader evidence also links built-environment quality to subjective well-being through mobility, social interaction, access to services, and environmental conditions [71]. The present findings therefore provide choice-based evidence that better form and public space remain important even when residents must trade them against mobility, safety, environmental, cultural, and technological benefits.
Heritage and local identity also had a positive influence, although its relative importance was lower. This suggests that residents do not necessarily view urban modernization and local identity as competing objectives. Instead, cultural continuity retains value within a broader transformation package. This interpretation is consistent with research positioning built cultural heritage as a contributor to sustainable urban development and cultural identity [72]. Previous research on vernacular settlement morphology has shown that heritage-sensitive development can combine cultural values with climate-responsive regeneration rather than preserving historic environments as static artifacts [27]. The results here reinforce that perspective by demonstrating that respondents are willing to assign both utility and monetary value to stronger integration of heritage and local identity.
Smart urban services produced the smallest relative-importance share, at 11.8%, and the lowest WTP, although the coefficient remained positive and highly significant. This distinction is important. Residents did not reject technology; rather, they placed it below improvements that affect safety, movement, environmental quality, and physical place. This finding supports longstanding critiques of techno-centric smart-city models that equate urban progress with the deployment of digital infrastructure [11,62,73]. People-centred smart-city approaches instead argue that technology should be judged by its capacity to improve quality of life, accessibility, inclusion, and public value [13,14,15,74]. The current results offer empirical support for that argument. Smart services appear most attractive when incorporated into a wider urban-development package rather than positioned as the defining feature of the future city.
5.4. Contribution to Understanding Sustainable Urban Transformation
The study makes a broader contribution by bringing together dimensions of urban development that are commonly investigated independently. The Place–Movement–Transition framing demonstrates that resident preferences span physical, mobility, environmental, cultural, and technological systems. More importantly, the findings show that these dimensions acquire different levels of importance when residents are required to make explicit trade-offs.
The findings therefore challenge interpretations of sustainable urban transformation that are organized around a single dominant agenda, whether smart-city technology, green development, density, or mobility. The city residents prefer is more integrated. At the same time, integration should not be understood as indiscriminate investment across all sectors. The results indicate an identifiable sequence of priorities in which safety and access provide the foundation upon which environmental quality, public space, identity, and technological innovation can add further value. In this sense, the study reframes sustainable urban transformation not simply as the accumulation of desirable urban features, but as a process of prioritizing and combining interventions according to the value residents attach to everyday urban experience.
6. Limitations and Future Research
Several limitations should be considered when interpreting the findings. First, the study was conducted in a single metropolitan context, Lahore, and the relative importance assigned to safety, mobility, environmental quality, heritage, and smart services may differ in cities with different socioeconomic, institutional, and infrastructural conditions. Future research could therefore replicate the choice experiment across multiple cities to assess the transferability of the preference structure identified here.
Second, the study relies on a stated-preference discrete choice experiment. Although this approach allows trade-offs among hypothetical urban futures to be examined systematically, stated choices may not fully reproduce behaviour under actual planning or payment conditions. Future studies could compare stated preferences with revealed behaviour or evaluate preferences after implementation of specific urban interventions.
Third, the six non-monetary attributes were represented by three ordered levels and treated as linear effects in the final model. This assumes that the utility change from Level 0 to Level 1 is comparable to that from Level 1 to Level 2. Future research could test alternative specifications, including dummy or effects coding, to identify potential non-linear preferences. The broad wording of several attributes may also conceal preferences for more specific interventions within each category.
Finally, willingness-to-pay estimates depend on the hypothetical monthly household cost presented in the experiment, while predicted scenario shares depend on the particular combinations of attributes and costs used to construct each urban future. Alternative payment mechanisms, cost levels, and scenario configurations could therefore produce different valuations and predicted shares. Future studies should test these assumptions across alternative experimental designs and population groups.
7. Conclusion
This study examined the urban future residents would choose when required to make explicit trade-offs among different dimensions of sustainable urban transformation. Using a face-to-face discrete choice experiment with 400 respondents, the analysis compared preferences across urban form and public space, mobility and access, street safety, green and climate infrastructure, heritage and local identity, smart urban services, and household cost. The results show that residents value all six dimensions positively, but they do not value them equally.
Street safety emerged as the strongest determinant of choice, followed by mobility and access, green and climate infrastructure, and urban form and public space. Heritage and local identity and smart urban services also contributed positively, although with lower relative importance. The willingness-to-pay results followed the same ordering, with respondents assigning the highest monetary value to improvements in street safety. This consistency across model coefficients, relative importance, and WTP indicates that the strongest preferences were concentrated on improvements that directly affect everyday movement, accessibility, environmental quality, and public-space conditions.
The scenario simulation provides the clearest synthesis of these preferences. The Integrated City attracted the largest predicted choice share, substantially outperforming the Mobility City, Green City, Smart City, and Status Quo City. This finding suggests that residents prefer comprehensive urban transformation rather than narrowly sectoral development pathways. At the same time, the results show that integration is not synonymous with equal emphasis across all dimensions. Safety and mobility form the strongest foundation of the preferred urban future, while environmental, spatial, cultural, and technological improvements add further value.
The study therefore contributes a resident-centred perspective to sustainable urban transformation by linking Place, Movement, and Transition within a single choice framework. Rather than measuring general approval of desirable urban features independently, it reveals how residents prioritize them when cost and competing benefits are introduced. The findings suggest that future urban policy should move beyond isolated smart-city, green-city, or transport-led strategies and instead combine them around the everyday priorities residents value most. The city people would choose is not simply the most technologically advanced or environmentally ambitious one; it is an integrated urban environment in which safety, accessibility, place quality, climate responsiveness, cultural continuity, and technology work together to improve everyday urban life.
Author Contributions
Conceptualization, M.M.A., A.A.; methodology, M.M.A.; software, M.M.A., A.A; validation, M.M.A., A.A; formal analysis, M.M.A.; investigation, M.M.A., A.A; resources, M.M.A., A.A; data curation, M.M.A., A.A; writing—original draft preparation, M.M.A., A.A; writing—review and editing, M.M.A., A.A; visualization, M.M.A., A.A; project administration, M.M.A. The authors have read and agreed to the published version of the manuscript.
Funding
This research received no external funding.
Informed Consent Statement
Informed consent was obtained from all individual participants involved in the study.
Data Availability Statement
The data supporting the findings of this study are available from the corresponding author upon reasonable request.
Acknowledgments
During the preparation of this work, the authors used ChatGPT(5.5) in order to rephrase parts of the manuscript for improved clarity and language refinement. After using these tools/services, the authors reviewed and edited the content as needed and take full responsibility for the content of the published article.
Conflicts of Interest
The authors declare no conflict of interest.
Ethics Approval
The study was approved by the Research Ethics Committee of German University of Technology in Oman (protocol code GUTECH/UPAD/2026/02, 10 February 2026).
References
- United Nations Human Settlements Programme (UN-Habitat). World Cities Report 2022: Envisaging the Future of Cities; UN-Habitat: Nairobi, Kenya, 2022. [Google Scholar]
- IPCC. Climate Change 2023: Synthesis Report. Contribution of Working Groups I, II and III to the Sixth Assessment Report of the Intergovernmental Panel on Climate Change; Lee, H., Romero, J., Eds.; IPCC: Geneva, Switzerland, 2023. [Google Scholar]
- Wolfram, M. Conceptualizing urban transformative capacity: A framework for research and policy. Cities 2016, 51, 121–130. [Google Scholar] [CrossRef]
- Iranmanesh, A.; Kamalipour, H. Towards a configurational typology of informal settlements: A syntactic analysis of informal settlements in Nagpur. J. Urban Aff. 2026, 48, 1212–1232. [Google Scholar] [CrossRef]
- Carmona, M. Place value: Place quality and its impact on health, social, economic and environmental outcomes. J. Urban Des. 2019, 24, 1–48. [Google Scholar] [CrossRef]
- Cervero, R.; Kockelman, K. Travel demand and the 3Ds: Density, diversity, and design. Transp. Res. Part D. Transp. Environ. 1997, 2, 199–219. [Google Scholar] [CrossRef]
- Ewing, R.; Cervero, R. Travel and the built environment: A meta-analysis. J. Am. Plan. Assoc. 2010, 76, 265–294. [Google Scholar] [CrossRef]
- Ibraeva, A.; de Almeida Correia, G.H.; Silva, C.; Antunes, A.P. Transit-oriented development: A review of research achievements and challenges. Transp. Res. Part A Policy Pract. 2020, 132, 110–130. [Google Scholar] [CrossRef]
- Adeel, A.; Arif, M.M.; Sheikh, N.B.; Ahsan, M.; Bashir, N. Designing livable transit-oriented development: A multi-stakeholder choice experiment on street-level trade-offs. Int. J. Civ. Infrastruct. 2025, 8, 138–154. [Google Scholar] [CrossRef]
- Bibri, S.E.; Krogstie, J. Smart sustainable cities of the future: An extensive interdisciplinary literature review. Sustain. Cities Soc. 2017, 31, 183–212. [Google Scholar] [CrossRef]
- Cardullo, P.; Kitchin, R. Being a ‘citizen’ in the smart city: Up and down the scaffold of smart citizen participation in Dublin, Ireland. GeoJournal 2019, 84, 1–13. [Google Scholar] [CrossRef]
- Herath, P.; Bai, X. Benefits and co-benefits of urban green infrastructure for sustainable cities: Six current and emerging themes. Sustain. Sci. 2024, 19, 1039–1063. [Google Scholar] [CrossRef]
- United Nations Human Settlements Programme (UN-Habitat). World Smart Cities Outlook 2024; UN-Habitat: Nairobi, Kenya, 2024. [Google Scholar]
- Choi, J. Enablers and inhibitors of smart city service adoption: A dual-factor approach based on the technology acceptance model. Telemat. Inform. 2022, 75, 101911. [Google Scholar] [CrossRef]
- United Nations Human Settlements Programme (UN-Habitat). People-Centered Smart Cities; UN-Habitat: Nairobi, Kenya.
- Roy, A. Urban informality: Toward an epistemology of planning. J. Am. Plan. Assoc. 2005, 71, 147–158. [Google Scholar] [CrossRef]
- Dovey, K.; King, R. Forms of informality: Morphology and visibility of informal settlements. Built Environ. 2011, 37, 11–29. [Google Scholar] [CrossRef]
- Jacobs, J. The Death and Life of Great American Cities; Random House: New York, NY, USA, 1961. [Google Scholar]
- Kamalipour, H.; Dovey, K. Incremental production of urban space: A typology of informal design. Habitat Int. 2020, 98, 102133. [Google Scholar] [CrossRef]
- Lefebvre, H. The Production of Space; Blackwell: Oxford, UK, 1991. [Google Scholar]
- de Certeau, M. The Practice of Everyday Life; University of California Press: Berkeley, CA, USA, 1984. [Google Scholar]
- Kim, A.M. Sidewalk City: Remapping Public Space in Ho Chi Minh City; University of Chicago Press: Chicago, IL, USA, 2015. [Google Scholar]
- Gehl, J. Cities for People; Island Press: Washington, DC, USA, 2010. [Google Scholar]
- Marnane, K. In-between urbanism: The physical, functional, socio-cultural, and identity-forming role of the otla in informal settlements in Ahmedabad. Habitat Int. 2023, 140, 102912. [Google Scholar] [CrossRef]
- Alharthi, M.A.; Lenzholzer, S.; Cortesão, J. Climate responsive design in urban open spaces in hot arid climates: A systematic literature review. Discov. Cities 2025, 2, 38. [Google Scholar] [CrossRef]
- Al Sulaimani, G.; Arif, M.M.; Adeel, A.; Basheer, M.A.; Sheikh, N.B. Rethinking vertical cities: The influence of public perception on design, form, and socio-cultural integration. Societies 2025, 15, 250. [Google Scholar] [CrossRef]
- Al Bulushi, F.; Adeel, A.; Al Ofi, I.; Agirbas, E.; Arif, M.M. Heritage values in vernacular settlement morphology: An integrated framework for climate-responsive conservation and urban regeneration. Land 2026, 15, 1356. [Google Scholar] [CrossRef]
- Mehmood, R.T.; Shah, M.Z.; Moeinaddini, M.; Arif, M.M.; Chuhdary, R.; Tahira, M. Assessing urban land parcel dynamics driven by Bus Rapid Transit (BRT) as an exclusive transit route. Urban Sci. 2024, 8, 227. [Google Scholar] [CrossRef]
- Papa, E.; Bertolini, L. Accessibility and transit-oriented development in European metropolitan areas. J. Transp. Geogr. 2015, 47, 70–83. [Google Scholar] [CrossRef]
- Banister, D. The sustainable mobility paradigm. Transp. Policy 2008, 15, 73–80. [Google Scholar] [CrossRef]
- Nadeem, M.; Matsuyuki, M.; Tanaka, S. Impact of bus rapid transit in shaping transit-oriented development: Evidence from Lahore, Pakistan. J. Asian Archit. Build. Eng. 2023, 22, 3635–3648. [Google Scholar] [CrossRef]
- Lucas, K. Transport and social exclusion: Where are we now? Transp. Policy 2012, 20, 105–113. [Google Scholar] [CrossRef]
- Arif, M.M.; Adeel, A.; Sheikh, N.B. Mode choice patterns and socio-spatial equity in contrasting transitional urban mobility systems. TeMA J. Land Use Mobil. Environ. 2025, 18, 271–292. [Google Scholar] [CrossRef] [PubMed]
- Ishaque, M.M.; Noland, R.B. Trade-offs between vehicular and pedestrian traffic using micro-simulation methods. Transp. Policy 2007, 14, 124–138. [Google Scholar] [CrossRef]
- Adeel, A.; Arif, M.M.; Sheikh, N.B.; Ahsan, M.; Khan, M.S.U. Road safety as the binding constraint on sustainable mode choice: Discrete choice experiment estimated via conditional logit. In Proceedings of the 11th International Conference on Civil, Structural and Transportation Engineering (ICCSTE 2026), Barcelona, Spain, June 2026; 185. [Google Scholar] [CrossRef]
- Meerow, S.; Newell, J.P.; Stults, M. Defining urban resilience: A review. Landsc. Urban Plan. 2016, 147, 38–49. [Google Scholar] [CrossRef]
- Raymond, C.M.; Frantzeskaki, N.; Kabisch, N.; Berry, P.; Breil, M.; Nita, M.R.; Geneletti, D.; Calfapietra, C. A framework for assessing and implementing the co-benefits of nature-based solutions in urban areas. Environ. Sci. Policy 2017, 77, 15–24. [Google Scholar] [CrossRef]
- Sheikh, N.B.; Arif, M.M.; Laverge, J.; Delghust, M. Integrating land use and transport for energy efficiency: Enabling urban transformation and combating environmental pollution. CIB Conf. 2025, 1, 9. [Google Scholar] [CrossRef]
- Norman, J.; MacLean, H.L.; Kennedy, C.A. Comparing high and low residential density: Life-cycle analysis of energy use and greenhouse gas emissions. J. Urban Plan. Dev. 2006, 132, 10–21. [Google Scholar] [CrossRef]
- Ahsan, M.; Arif, M.M.; Adeel, A.; Sheikh, N.B. Transformation from green to brown: A geospatial analysis of urban expansion, urban heat environment, and agriculture land use conversion. Glob. Chall. Reg. Sci. 2026, 5, 100024. [Google Scholar] [CrossRef]
- Sheikh, N.B.; Arif, M.M.; Raja, A.Z.; Raja, Z.A. Assessing the role of green infrastructure in fostering resident satisfaction within eco-centric smart cities: A multidimensional empirical analysis. In International Conference on Intelligent Systems and Computational Strategies in Engineering and Technology; Springer: Cham, Switzerland, 2026; pp. 403–421. [Google Scholar] [CrossRef]
- White, G.; Zink, A.; Codecá, L.; Clarke, S. A digital twin smart city for citizen feedback. Cities 2021, 110, 103064. [Google Scholar] [CrossRef]
- Paes, D.; Arantes, E.; Irizarry, J. Immersive environment for improving the understanding of architectural 3D models: Comparing user spatial perception between immersive and traditional virtual reality systems. Autom. Constr. 2017, 84, 292–303. [Google Scholar] [CrossRef]
- Khan, S.A.; Koç, M.; Al-Ghamdi, S.G. Sustainability assessment, potentials and challenges of 3D printed concrete structures: A systematic review for built environmental applications. J. Clean. Prod. 2021, 303, 127027. [Google Scholar] [CrossRef]
- Dell’Endice, A.; Bouten, S.; Van Mele, T.; Block, P. Structural design and engineering of Striatus, an unreinforced 3D-concrete-printed masonry arch bridge. Eng. Struct. 2023, 292, 116534. [Google Scholar] [CrossRef]
- Pakistan Bureau of Statistics. 7th Population and Housing Census 2023: National Census Report; Pakistan Bureau of Statistics: Islamabad, Pakistan, 2023. [Google Scholar]
- McFadden, D. Conditional logit analysis of qualitative choice behavior. In Frontiers in Econometrics; Zarembka, P., Ed.; Academic Press: New York, NY, USA, 1974; pp. 105–142. [Google Scholar]
- Train, K.E. Discrete Choice Methods with Simulation, 2nd ed.; Cambridge University Press: Cambridge, UK, 2009. [Google Scholar] [CrossRef]
- Louviere, J.J.; Hensher, D.A.; Swait, J.D. Stated Choice Methods: Analysis and Applications; Cambridge University Press: Cambridge, UK, 2000. [Google Scholar] [CrossRef]
- Johnson, F.R.; Lancsar, E.; Marshall, D.; Kilambi, V.; Mühlbacher, A.; Regier, D.A.; Bresnahan, B.W.; Kanninen, B.; Bridges, J.F.P. Constructing experimental designs for discrete-choice experiments: Report of the ISPOR Conjoint Analysis Experimental Design Good Research Practices Task Force. Value Health 2013, 16, 3–13. [Google Scholar] [CrossRef] [PubMed]
- Mariel, P.; Hoyos, D.; Meyerhoff, J.; Czajkowski, M.; Dekker, T.; Glenk, K.; Jacobsen, J.B.; Liebe, U.; Olsen, S.B.; Sagebiel, J.; Thiene, M. Environmental Valuation with Discrete Choice Experiments: Guidance on Design, Implementation and Data Analysis; Springer: Cham, Switzerland, 2021. [Google Scholar] [CrossRef]
- Rose, J.M.; Bliemer, M.C.J. Constructing efficient stated choice experimental designs. Transp. Rev. 2009, 29, 587–617. [Google Scholar] [CrossRef]
- de Bekker-Grob, E.W.; Donkers, B.; Jonker, M.F.; Stolk, E.A. Sample size requirements for discrete-choice experiments in healthcare: A practical guide. Patient 2015, 8, 373–384. [Google Scholar] [CrossRef] [PubMed]
- Hensher, D.A.; Rose, J.M.; Greene, W.H. Applied Choice Analysis, 2nd ed.; Cambridge University Press: Cambridge, UK, 2015. [Google Scholar] [CrossRef]
- Hensher, D.A.; Greene, W.H. The mixed logit model: The state of practice. Transportation 2003, 30, 133–176. [Google Scholar] [CrossRef]
- Croissant, Y. Estimation of random utility models in R: The mlogit package. J. Stat. Softw. 2020, 95, 1–41. [Google Scholar] [CrossRef]
- Ewing, R.; Dumbaugh, E. The built environment and traffic safety: A review of empirical evidence. J. Plan. Lit. 2009, 23, 347–367. [Google Scholar] [CrossRef]
- Southworth, M. Designing the walkable city. J. Urban Plan. Dev. 2005, 131, 246–257. [Google Scholar] [CrossRef]
- Arif, M.M.; Adeel, A.; Sheikh, N.B. Housing affordability pressure and forced residential mobility in British Columbia, Canada. In Proceedings of the 12th World Congress on New Technologies (NewTech 2026), London, UK, 20–22 August 2026; Paper ICCEIA 131. [Google Scholar] [CrossRef]
- McCormick, K.; Anderberg, S.; Coenen, L.; Neij, L. Advancing sustainable urban transformation. J. Clean. Prod. 2013, 50, 1–11. [Google Scholar] [CrossRef]
- Adeel, A.; Arif, M.M.; Sheikh, N.B. Orange Line Metro and office location choice in Lahore, Pakistan: Evidence from a stated choice experiment. In Proceedings of the 12th World Congress on New Technologies (NewTech 2026), London, UK, 20–22 August 2026; Paper ICCEIA 132. [Google Scholar] [CrossRef]
- Hollands, R.G. Will the real smart city please stand up? Intell. Progress. Or Entrep.? City 2008, 12, 62–83. [Google Scholar] [CrossRef]
- Ewing, R.; Handy, S. Measuring the unmeasurable: Urban design qualities related to walkability. J. Urban Des. 2009, 14, 65–84. [Google Scholar] [CrossRef]
- Delbosc, A.; Currie, G. The spatial context of transport disadvantage, social exclusion and well-being. J. Transp. Geogr. 2011, 19, 1130–1137. [Google Scholar] [CrossRef]
- Pereira, R.H.M.; Schwanen, T.; Banister, D. Distributive justice and equity in transportation. Transp. Rev. 2017, 37, 170–191. [Google Scholar] [CrossRef]
- Nevens, F.; Frantzeskaki, N.; Gorissen, L.; Loorbach, D. Urban Transition Labs: Co-creating transformative action for sustainable cities. J. Clean. Prod. 2013, 50, 111–122. [Google Scholar] [CrossRef]
- Ernst, L.; de Graaf-Van Dinther, R.E.; Peek, G.J.; Loorbach, D. Sustainable urban transformation and sustainability transitions: Conceptual framework and case study. J. Clean. Prod. 2016, 112, 2988–2999. [Google Scholar] [CrossRef]
- Samuelson, W.; Zeckhauser, R. Status quo bias in decision making. J. Risk Uncertain. 1988, 1, 7–59. [Google Scholar] [CrossRef]
- Tzoulas, K.; Korpela, K.; Venn, S.; Yli-Pelkonen, V.; Kaźmierczak, A.; Niemelä, J.; James, P. Promoting ecosystem and human health in urban areas using Green Infrastructure: A literature review. Landsc. Urban Plan. 2007, 81, 167–178. [Google Scholar] [CrossRef]
- Bowler, D.E.; Buyung-Ali, L.; Knight, T.M.; Pullin, A.S. Urban greening to cool towns and cities: A systematic review of the empirical evidence. Landsc. Urban Plan. 2010, 97, 147–155. [Google Scholar] [CrossRef]
- Mouratidis, K. Urban planning and quality of life: A review of pathways linking the built environment to subjective well-being. Cities 2021, 115, 103229. [Google Scholar] [CrossRef]
- Tweed, C.; Sutherland, M. Built cultural heritage and sustainable urban development. Landsc. Urban Plan. 2007, 83, 62–69. [Google Scholar] [CrossRef]
- Vanolo, A. Smartmentality: The smart city as disciplinary strategy. Urban Stud. 2014, 51, 883–898. [Google Scholar] [CrossRef]
- Yeh, H. The effects of successful ICT-based smart city services: From citizens’ perspectives. Gov. Inf. Q. 2017, 34, 556–565. [Google Scholar] [CrossRef]
Figure 1.
Choice patterns across respondent groups.
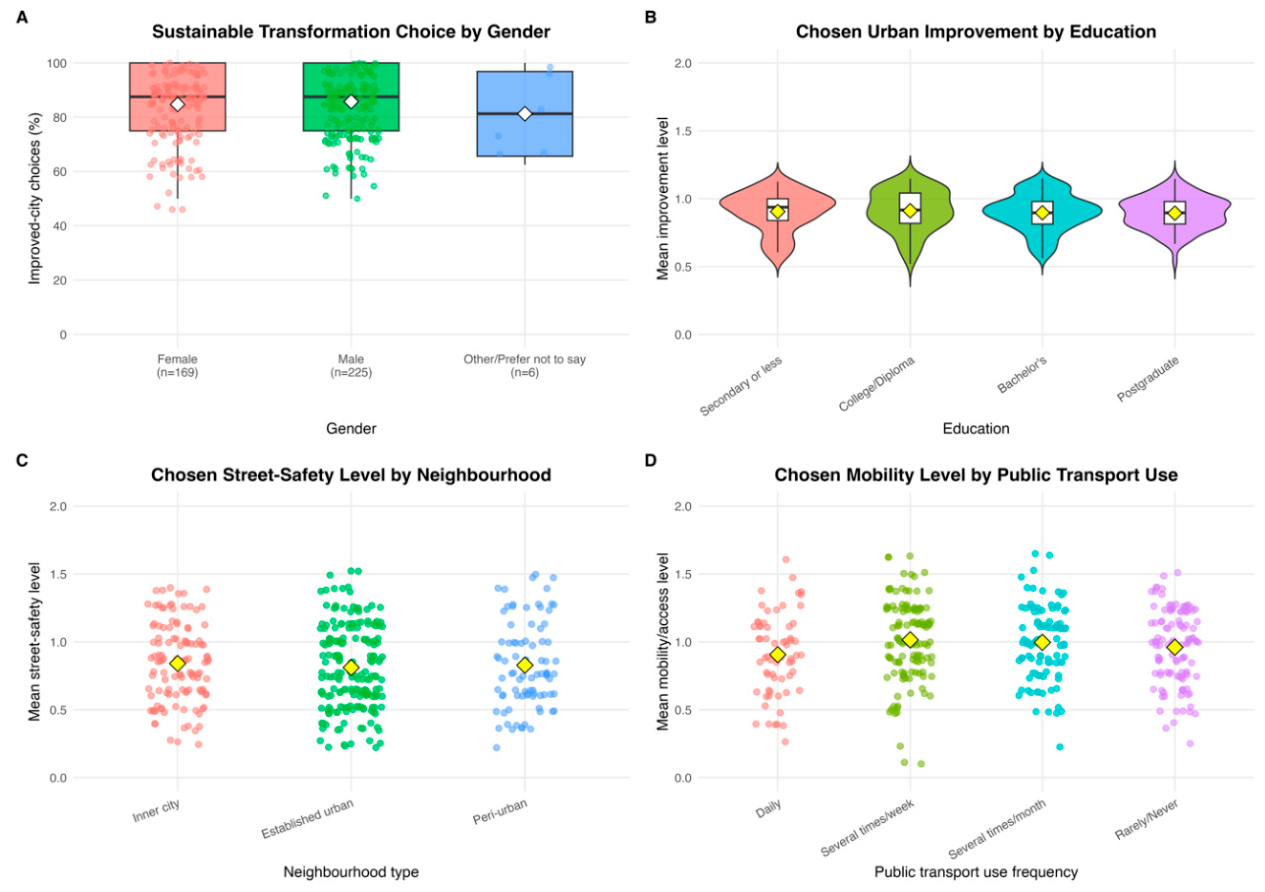
Figure 2.
Relative importance and willingness to pay for urban attributes.
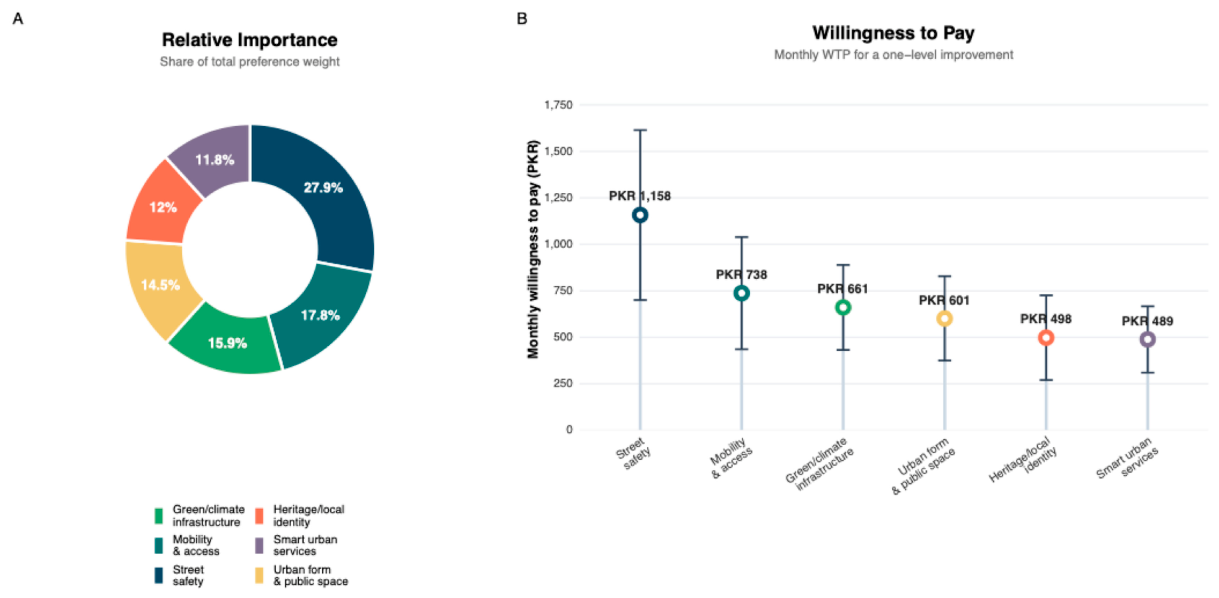
Figure 3.
Predicted choice shares for alternative urban futures.
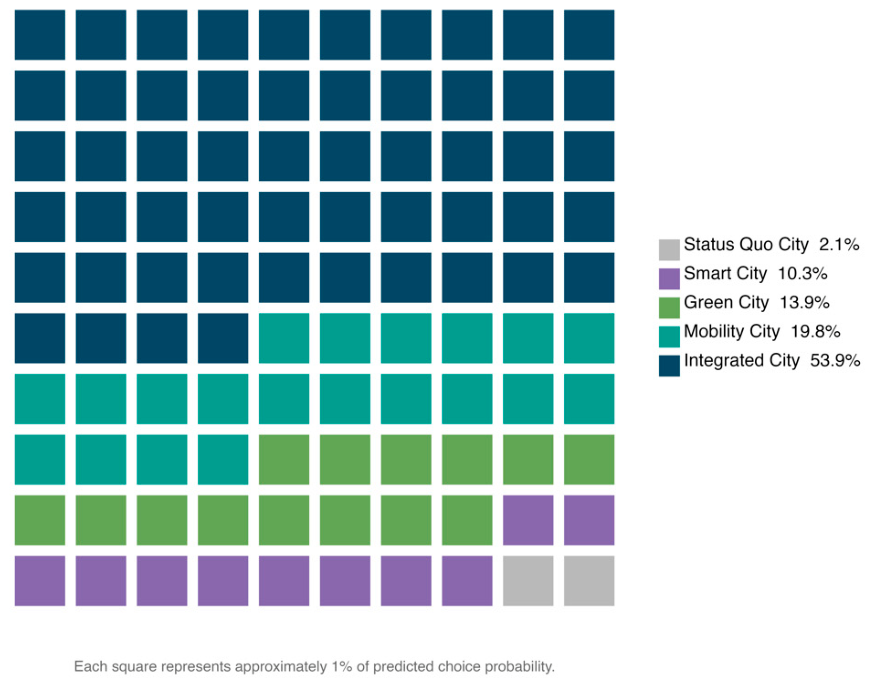

Table 1.
Attributes and levels used in the discrete choice experiment.
| Domain | Attribute | Level 0 | Level 1 | Level 2 |
| Place | Urban form and public space | Existing/conventional conditions | Moderate improvement in urban form and public-space quality | Strong improvement in urban form and public-space quality |
| Movement | Mobility and access | Existing/car-oriented conditions | Improved public-transport access | Strong multimodal, transit, walking, and cycling priority |
| Movement | Street safety | Existing conditions | Moderate street-safety improvements | Comprehensive safe-street improvements |
| Transition | Green and climate infrastructure | Limited provision | Moderate provision | Extensive green and climate-responsive infrastructure |
| Place | Heritage and local identity | Minimal integration | Partial integration | Strong integration of heritage and local identity |
| Transition | Smart urban services | Basic services | Digitally enhanced services | Strongly integrated smart urban services |
| Monetary | Monthly household cost | PKR 0 (status quo) | PKR 500–1500 across designed alternatives* | — |
Table 2.
Attribute configuration of the urban-future scenarios.
| Attribute | Status Quo City | Mobility City | Green City | Smart City | Integrated City |
| Urban form and public space | 0 | 1 | 2 | 1 | 2 |
| Mobility and access | 0 | 2 | 1 | 1 | 2 |
| Street safety | 0 | 2 | 1 | 1 | 2 |
| Green/climate infrastructure | 0 | 1 | 2 | 1 | 2 |
| Heritage/local identity | 0 | 1 | 1 | 1 | 2 |
| Smart urban services | 0 | 1 | 1 | 2 | 2 |
| Monthly household cost (PKR) | 0 | 1000 | 1000 | 750 | 1500 |
Table 3.
Panel mixed logit model estimates.
| Parameter | Coefficient | SE | z | p | Significance |
| Status quo ASC | 0.593 | 0.169 | 3.517 | <0.001 | *** |
| Urban form & public space | 0.345 | 0.030 | 11.424 | <0.001 | *** |
| Mobility & access | 0.423 | 0.037 | 11.329 | <0.001 | *** |
| Street safety | 0.663 | 0.043 | 15.543 | <0.001 | *** |
| Green/climate infrastructure | 0.378 | 0.037 | 10.243 | <0.001 | *** |
| Heritage/local identity | 0.285 | 0.036 | 7.918 | <0.001 | *** |
| Smart urban services | 0.280 | 0.037 | 7.502 | <0.001 | *** |
| Monthly cost (PKR 1,000) | −0.573 | 0.106 | −5.413 | <0.001 | *** |
| SD: Urban form & public space | 0.003 | 1.968 | −0.002 | 0.999 | ns |
| SD: Mobility & access | 0.170 | 0.080 | 2.123 | 0.034 | * |
| SD: Street safety | 0.004 | 1.578 | −0.002 | 0.998 | ns |
| SD: Green/climate infrastructure | 0.108 | 0.152 | 0.711 | 0.477 | ns |
| SD: Heritage/local identity | 0.029 | 0.414 | −0.069 | 0.945 | ns |
| SD: Smart urban services | 0.086 | 0.163 | 0.528 | 0.598 | ns |
Note: SD values are reported as absolute magnitudes. The sign of the underlying random-parameter scale estimate does not affect the magnitude of preference heterogeneity. Significance is assessed using the original model estimates. *** p < 0.001; * p < 0.05; ns = not significant.
Disclaimer/Publisher’s Note: The statements, opinions and data contained in all publications are solely those of the individual author(s) and contributor(s) and not of MDPI and/or the editor(s). MDPI and/or the editor(s) disclaim responsibility for any injury to people or property resulting from any ideas, methods, instructions or products referred to in the content. |
© 2026 by the authors. Licensee MDPI, Basel, Switzerland. This article is an open access article distributed under the terms and conditions of the Creative Commons Attribution (CC BY) license.
Copyright: This open access article is published under a Creative Commons CC BY 4.0 license, which permit the free download, distribution, and reuse, provided that the author and preprint are cited in any reuse.