

Submitted:
17 August 2026
Posted:
18 August 2026
You are already at the latest version
Abstract
The R-matrix method has long been employed as the most advanced and powerful approach to treat a variety of atomic processes. Its main application has been in spectral analysis and modeling of astrophysical and laboratory sources. We describe the R-matrix methodology, computational codes, and extensions developed for numerical simulations under wide-ranging physical conditions in astronomical objects such as stellar atmospheres in non-local-thermodynamic-equilibrium (NLTE), interstellar medium, black hole environments and active galactic nuclei, and in high-energy-density (HED) environments such as high-intensity lasers, plasma fusion devices and stellar interiors. We present exemplary results for atomic cross sections for photoionization, electron impact excitation and electron-ion recombination, as well as for plasma effects in HED sources. In addition, we illustrate selected applications at different and varying temperatures, densities, and other variables.
Keywords:
R-matrix method
; atomic processes
; astrophysical objects
; laboratory plasmas
1. Introduction
Atomic processes in plasmas span a wide range of physical effects. Any theoretical treatment of their variety requires a methodology that is rigorous and accurate, encompassing state-of-the-art physics and computationally powerful techniques on the most advanced high-performance computing platforms. At the same time, owing to various applications in laboratory and astrophysical environments, the method needs to be generally applicable to physical conditions therein. Also, since spectroscopic analysis is the primary diagnostic scientific tool, the method must be rooted in and related to experimental and observational spectroscopy. The R-matrix method meets these requirements and needs to address outstanding and fundamental problems in atomic physics, plasma physics, astronomy, and other scientific areas. It was developed by P.G. Burke and collaborators at the Queen’s University of Belfast [1,2], and later extended to large-scale projects such as the Opacity Project (OP) by M. J. Seaton and collaborators at University College London [3,4,5], and follow-up projects such as the Iron Project (IP) [6,7], and R-matrix calculations for opacities (RMOP) project [8,9,10,11,12,13]. Groups of practitioners of the R-matrix methodology involve many institutions worldwide including US, Europe and India. R-matrix researchers have extended the techniques to incorporate myriad plasma effects and novel applications [14,15,16,17,18,19,20,21,22], and to other fields such as nanoscience, biomedicine, and high energy laboratory devices [23,24,25,26,27].
2. Laboratory and Astrophysical Sources
R-matrix calculations are mainly aimed at spectral analysis of plasma sources. The R-matrix method is particularly suited for the low-energy region where electron correlation effects are important and included via a coupled channel wavefunction expansion in Equation (1). However, as the CC expansion increases, with more core or target ion energy levels included in the (e + ion) wavefunction expansion (Equation (1)), the higher the energy range that is accurately considered. For example, in the ongoing calculations for Fe ions under the new RMOP project described below. Future R-matrix work is designed for HED plasmas including in astrophysical objects, high-intensity laser produced plasmas, and inertial and magnetic confinement fusion sources, etc. Of particular contemporary interest are ultra-fast, high-intensity laser produced plasmas, warm-dense matter, etc. ([23], and references therein).
3. Theory and Computations
The R-matrix method implements the coupled channel (CC) approximation, and myriad computational pathways and codes have been described in many previous works, such as adaptations for the Opacity Project,.5.3. Machine Learning Analysis of Observational Spectra Using R-matrix Atomic Data 613 The companion analysis of 45 JWST/VLT/Keck galaxies [ 36 ] trained regression models 614 on redshift z and R-matrix-derived electron temperature Te([O III]) to predict 12+log(O/H), 615 reporting a single-split test R2 = 0.832 (Ridge) alongside a 5-fold cross-validated R2 of only 616 0.34 ± 0.86 – a substantial, unexplained gap between the two. 617 We revisit this using the same (z, Te) feature set on the 47-galaxy subsample with 618 complete density measurements, under a controlled 5-fold CV protocol (shuffled folds, 619 standardized features). This recovers R2 = 0.90 ± 0.03 for Ridge (comparable for Random the Iron Project, and other applications discussed below (e.g.[1,2,3,4,28]. The basic expression is a superposition of the –electron wavefunctions of an system, with the ion in various states of excitation. For a given (e + ion) symmetry — total angular, spin and parity symmetry — the wavefunction expansion may be expressed as
where are eigenfunctions of the N–electron target or core ion in states , describes the incident electron in channels i, and the are bound channel (e + ion) functions that account for short–range correlation and orthogonality. Diagonalization of the (e + ion) Hamiltonian yields asymptotic wavefunctions for both bound states () and continuum states (), from which collisional and radiative parameters — collision strengths, oscillator strengths and photoionization cross sections — may be obtained in a self-consistent manner. In particular, the quantum interference between open channels with and closed channel wavefunctions gives rise to Rydberg series of autoionizing resonances that dominate the continuum up to all excited levels of the core ion included in an ab initio manner.
Relativistic effects are considered either in the semi-relativistic Breit-Pauli R-matrix (BPRM) method [7], or fully relativistic Dirac R-matrix (DARC) method [29].
3.1. Breit-Pauli R-matrix Method
In the BPRM method [5,6] relativistic effects are included in the Breit-Pauli approximation where the Hamiltonian of the (N+1)-electron system is
The curly bracketed term is the non-relativistic Hamiltonian and the additional terms are the relativistic one-body correction terms, the mass correction, , Darwin, , and the spin-orbit interaction, where is the momentum of an electron, is the fine structure constant, and are the orbital and spin angular momenta.
Figure 1 shows the schematics of the BPRM codes employed in the OP, IP, and RMOP projects described below. The various branches in (Figure 1) entail relativistic effects in intermediate LSJ coupling in the Breit-Pauli formulation including one-body terms in the (e + ion) Hamiltonian. An accurate configuration interaction representation or the core ion states is obtained by two atomic structure codes, SUPERSTRUCTURE [30] and CIV3 [7]. The first two R-matrix codes, STG1,STG2, are then employed to generate the multipole integrals, algebraic coefficients and set up the (N+1)-electron Hamiltonian corresponding to the coupled integro-differential equations. The Hamiltonian is diagonalized in STGH; in BPRM calculations the diagonalization is preceded by LSJ recoupling in RECUPD. The R-matrix basis set of functions and the dipole matrix elements so produced are then input into STGB for bound state wavefunctions, STGF for continuum wavefunctions, STGBB for radiative transition probabilities, and STGBF for photoionization cross sections. In addition, STGF(J) is used to obtain collision strengths for electron impact excitation in LS or intermediate coupling and fine structure transitions.
3.2. Dirac R-Matrix Method
In the Dirac atomic -matrix method, the Dirac Hamiltonian (in au) for the (+1)-electron system is given as
where indices and denote the individual electrons, and are the usual Dirac matrices, and represents the charge of an infinitely heavy point nucleus. On the right-hand side of the Hamiltonian, the first three one-electron terms are the usual momentum, mass and the electron-nucleus Coulomb attraction. The Coulomb electron-electron repulsion is represented by the final two-electron term. The bound orbitals in relativistic -matrix calculations are obtained from multiconfiguration Dirac-Fock (MCDF) method GRASP [31]. The relativistic single electron wavefunction has the following form
where is the principal quantum number, stands for the Dirac angular quantum number, and are large and small radial components of the one-electron wavefunctions and is the the spinor spherical harmonic function.
The computer codes used in DARC calculations are shown in Figure 2. As required by the CC R-matrix formulation, the (e + ion) wavefunction expansion begins with the core or target ion wavefunctions. In DARC calculations these are carried out with the relativistic code GRASP [31] in jj-coupling, whereas in the BPRM codes the ion wavefunctions are computed in intermediate LSJ coupling using SUPERSTRUCTURE [30] or CIV3 [7] codes.
The DARC computational sequence begins with GRASP0, which generates the relativistic target-ion wavefunctions and bound orbitals. The output is then processed by DSTG0, which provides the interface between the atomic-structure and scattering calculations by preparing the target data for subsequent R-matrix stages. DSTG1/ORBS constructs the continuum orbitals, while DSTG1/INTS evaluates the corresponding radial integrals. The coupled scattering channels are assembled in DSTG2, where the angular coupling coefficients, continuum Hamiltonians, asymptotic scattering coefficients, and dipole matrix elements required for photoionization calculations are generated. The Hamiltonian matrices are subsequently diagonalized by DSTGH to obtain the R-matrix quantities. Finally, PDSTG3 performs the outer-region calculations by matching the inner-region solutions to their asymptotic forms and evaluating the resulting photoionization cross sections.
3.3. Distorted Wave (DW) Approximation
The R-matrix method is based on the CC approximation, and as such includes channel coupling via the first term of Equation (1) on the RHS that sums over all contributing channels. Interference between open and closed channels, depending on or relative to the threshold energy where resonances converge to. The DW approximation, or its relativistic version RDW, neglect channel coupling and therefore do not include resonances ab initio as in the R-matrix method. However, it is simpler and possible to also take account of resonance structures approximately without coupling among all channels, but only between the initial and final states .5.3. Machine Learning Analysis of Observational Spectra Using R-matrix Atomic Data 613 The companion analysis of 45 JWST/VLT/Keck galaxies [ 36 ] trained regression models 614 on redshift z and R-matrix-derived electron temperature Te([O III]) to predict 12+log(O/H), 615 reporting a single-split test R2 = 0.832 (Ridge) alongside a 5-fold cross-validated R2 of only 616 0.34 ± 0.86 – a substantial, unexplained gap between the two. 617 We revisit this using the same (z, Te) feature set on the 47-galaxy subsample with 618 complete density measurements, under a controlled 5-fold CV protocol (shuffled folds, 619 standardized features). This recovers R2 = 0.90 ± 0.03 for Ridge (comparable for Random as in the DW or RDW method. For example, the University College London DW code has been used to include resonances via the second sum on the RHS of Equation (1), which are otherwise considered “bound channels” [32]. The Flexible Atomic Code (FAC) DW or “FAC R-matrix” (RDW) may both contain resonances without complete channel coupling in the Hamiltonian, i.e., without the summation in the first term on the RHS of Equation (1). The differences between the traditional R-matrix method and DW approximations may manifest themselves for weak transitions that are most susceptible to coupling and resonance effects, or for complex atomic systems such as Fe II with a dense energy level structure and overlapping resonances profiles in myriad Rydberg series converging on to those target energies. Detailed comparisons are therefore necessary to ascertain the precise impact on not only collision strengths, but also on Maxellian averaged rate coefficients and line emissivities.
3.4. LS-to-Intermediate Coupling Transformation
Owing to the difficulty of BPRM or DARC calculations, a simplified approach may be adopted. The basic R-matrix calculations are carried out in LS coupling, followed by an algebraic transformation to intermediate coupling using term coupling coefficients for the target ion obtained from SUPERSTRUCTURE [30] in the Breit-Pauli approximation. This simpler approximation has been utilized in codes such as JAJOM and STGFJ [6], and intermediate coupling frame transformation calculations [33] for collision strengths for many ions and excited levels. Resonance structures are preserved as in the LS coupling R-matrix calculations, and the results are in good agreement with full BPRM calculations for multiply charged ions and strong transitions. However, for weakly coupled transitions there may be larger uncertainties, and a careful comparison with BPRM or DARC results should be made when available. While BPRM include fine structure in intermediate coupling, i.e., L + S = J, DARC or RDW is in jj-coupling. Nevertheless, the naturally occuring energy levels must be the same regardless of the algebraic coupling scheme employed.
3.5. Independent Resonance Approximation (IRA)
It is also simpler than the R-matrix method to consider resonances independently by obtaining autoionization and radiative decay rates energies of bound levels obtained in an atomic structure calculation. Such a simplification is particularly useful in computing di-electronic rate coeffcients ([5], and references therein). In addition, resonance profiles may be obtained by numerical fitting to known functional forms with computed autoionization widths in an otherwise DW-type calculation.
4. The Opacity Project
The opacity due matter interaction with radiation is the fundamental quantity for radiation transport in astrophysical and laboratory plasmas [3,5,13,34,35,36]. In previous OP works, R-Matrix calculations were carried out with small wavefunction expansion including the ground configuration and a limited set of excited ones in LS coupling, as described in these references. More extensive R-matrix calculations for opacities (RMOP) are in progress, especially under HED conditions such as stellar interirors and in radiative opacity experiments conducted at ICF devices at the Sandia Z facility and the Lawrence Livermore National Laboratory National Ignition Facility [8,9,10,11,37,38]. In particular, recent works incorporate plasma effects on R-matrix photoionization cross sections where autoionizing resonances are broadened, shifted, and dissolve into the continuum with increasing density for a given isotherm [10].
With the CC wavefunction expansion in the R-matrix formulation as in Equation (1), the transition matrix element for a radiative transition to an excited bound state or for photoionization to a continuum state is given by (e.g., [5])
where the photon-ion interaction is represented by the dipole operator, , and the sum is over the number of active electrons.
The generalized line strength is expressed as
where and are initial and final state wavefunctions. The line strengths are energy independent quantities. The oscillator strengths () and radiative decay rates or Einstein A-coefficients for E1 dipole transitions are given by
is the energy difference between initial and final states, and , are statistical weight factors of initial and final states respectively.
The photoionization cross section () is obtained as,
where is t.5.3. Machine Learning Analysis of Observational Spectra Using R-matrix Atomic Data 613 The companion analysis of 45 JWST/VLT/Keck galaxies [ 36 ] trained regression models 614 on redshift z and R-matrix-derived electron temperature Te([O III]) to predict 12+log(O/H), 615 reporting a single-split test R2 = 0.832 (Ridge) alongside a 5-fold cross-validated R2 of only 616 0.34 ± 0.86 – a substantial, unexplained gap between the two. 617 We revisit this using the same (z, Te) feature set on the 47-galaxy subsample with 618 complete density measurements, under a controlled 5-fold CV protocol (shuffled folds, 619 standardized features). This recovers R2 = 0.90 ± 0.03 for Ridge (comparable for Random he statistical weight factor of the initial bound state and is the incident photon energy. The complex resonant structures in photoionization result from channel couplings between open continuum channels ( 0) and closed channels ( 0) at electron energies corresponding to autoionizing states along Rydberg series , where is the effective quantum number relative to the target threshold .
The new RMOP project is aimed at fulfilling the original aim of OP using the BPRM method to compute radiative data described herein [13].
5. The Iron Project
The goal of OP was the calculation of large-scale computations of radiative data, primarily energy levels, oscillator strengths, photoionization cross sections, equation-of-state, and line broadening parameters. The follow-up Iron Project (IP) aimed at R-matrix collisional data [6]. In particular, relativistic effects were included an intermediate coupling scheme using the BPRM codes [7].
The dimension-less collision strength is symmetric with respect to initial and final levels, and generally exhibit extensive resonance structures, particularly in the vicinity of excitation thresholds, arising from autoionizing levels associated with higher levels included in the CC expansion Equation (1). For most plasma applications electrons are assumed to follow a Maxwellian distribution at a given electron temperature , and therefore we compute the Maxwellian averaged effective collision strengths [28],
where is the collision strength at incident electron energy E, and k is the Boltzmann constant. The effective collision strength, , varies more smoothly and gradually with temperature than the collision strengths, since the averaging process smooths out the sharp resonance structure. The collisional excitation rate is related to the effective collision strength through the excitation rate coefficient
where is the statistical weight of the initial level i. The collisional rate is then determined as
where () are ion and electron densities respectively.
6. Collisional-Radiative Model
Much of OP and IP data are used in astrophysical and laboratory plasma diagnostics with absorption lines using oscillator strengths, or emission line ratios using collisional and radiative data. Spectral line emissivities are functions of electron temperature and electron density , and a collisional-radiative (CR) models can be constructed using, for example, the SPECTRA code [28,39]. The CR model is based on solving the statistical equilibrium equations for coupled level populations. In a recent work we have computed line emissivity ratios for doubly ionized manganese Mn III transitions, and the relevant expressions are as follows [?]. The theoretical line emissivity is the amount of energy per unit time per unit volume for a given transition , expressed as
refers to the population of the upper state. Summation over refers to the total population of all levels included in the CR calculation. The ratio n(Mn iii)/n(Mn) is the ionization fraction of Mn iii relative to total manganese, and n(Mn)/n(H) is the manganese abundance relative to hydrogen deduced from H, etc. In order to obtain line emissivities from Equation (12), one needs ionization fractions Mn iii/Mn in the plasma source at the appropriate temperature and density, and are model dependent [28,40,41].
Similar expressions may be used to construct CR models, as well as to include additional processes such as (e + ion) recombination in an extended collisional-radiative-recombination (CRR) model [39,42]. It is noteworthy that (e + ion) recombination manifests itself in emission, and some of the most prominent astrophysical lines such as Lyman transition at 1015Å in the UV, Balmer H at 4861 Å and 6563 Å respectively in the optical, are formed via electron-proton recombination [5].
A sample of results for Mn III collision strengths is given below.
7. The RMOP Project: R-Matrix Calculations for Opacities
As mentioned above, owing to computational constraints and other effects that needed to be incorporated, the OP R-matrix calculations proved to be intractable and most of the work had to be carried out using essentially the Distorted Wave (DW) method neglecting channel couplings. Therefore, related physical effects such as resonance profiles and plasma broadening could not be included. In recent years, we have renewed the original quest for full R-matrix calculation of opacities (RMOP), described in the RMOP series of papers in [8,9,10,11].
The RMOP calculations employ an extended version of BPRM codes including fine structure and a large close coupling wavefunction expansion, as well as a new formulation of plasma broadening of autoionizing resonances, as shown in Figure 1.
The underlying BPRM calculations are very extensive for complex atomic systems that are necessary for opacities calculations, such middle ionization states of iron ions, Fe XV-XXI [9], important in the solar interior at the crucial boundary between radiatie and convection zones, and for ongoing ICF experiments. This task is huge since R-matrix calculations need to be carried out for all ionization states of important elements. Those include Fe and O to begin with, but would eventually extend to others such as Ne, Mg, Si, S, Ca and Ni.
The resulting calculations would yield a considerable amount of highly accurate atomic data that would be useful not only for opacities but also for many astrophysical and laboratory sources. A particular pathway that we followed in OP calculations is to proceed with calculations along an isoelectronic sequence using the same atomic structure for all ions. That simplifies the calculations considerably since the target or core ion structure is to be determined only once. The angular algebra and hamilitonian are similar, and subsequent BPRM calculations follow the same stages up to the calculation of energy levels, oscillator strengths, and photoionization cross sections. Also, ancillary dataset such as collision strengths and e-ion recombination cross sections may be obtained as part of the same calculation.
8. Atomic Data and Benchmarking
Modeling a wide variety of sources and physical processes requires a large and accurate database that can be readily interfaced with codes for numerical simulation. In addition to completeness and precision, the data needs to be of benchmarked accuracy against experimentally measured cross sections, transition probabilities, and other theoretically computed parameters. The OP and IP databases are widely employed in modeling codes. Although much of the data is using the R-matrix method it is limited in accuracy and extent, as noted above, and needs to be extended with more comprehensive calculations. The OP and IP data have been updated in this manner and incorporated into another database NORAD (Nahar-OSU-Radiative-Atomic-Data) [43], consisting mostly of R-matrix data for nearly 250 atoms and ions.
Experimental benchmarking is or primary importance to ensure reliability. In addition, there are several atomic physics approximations and codes employed to generate large quantities of data that need to be compared and evaluated. We describe ongoing and future prospects for benchmarking experimental and theoretical data sources.
9. Results and Discussion: Atomic Processes and Effects
We present new results for a variety of atomic processes to illustrate the scope, extent and physical effects incorporated in R-matrix calculations. We briefly describe the wavefunction expansions, optimization, and comparison between various approximations.
9.1. Photoionization
Results from ongoing calculations using the BPRM codes are presented, and compared with RDW results for background cross sections where available.
9.1.1. Photoionization Cross Section of Cr XIII and Ca IX
The photoionization (PI) cross sections of the ground state of Cr XIII were calculated using both the Breit–Pauli R-matrix (BPRM) method and the relativistic distorted-wave (RDW) approximation. In the BPRM calculations, an R-matrix radius of 6.50 a.u. was adopted to ensure that the target orbitals were fully enclosed within the inner-region sphere. A fine energy mesh with a step size of Ry was employed to accurately resolve the resonance structures in the photoionization cross sections.
Figure 3 (a) compares the PI cross sections of ground state obtained using the BPRM and RDW methods over the photon energy range of 25–50 Ry. The results from the two approaches exhibit excellent agreement across the entire energy range considered, demonstrating the consistency and reliability of the present calculations. The ionization potentials of the ground state of Cr XIII were determined to be 26.0243 Ry and 25.9981 Ry using the BPRM and RDW methods, respectively. These values agree well with the recommended NIST value of 26.0670 Ry, corresponding to percentage deviations of only 0.16% and 0.26%, respectively. The close agreement between the present theoretical results and the available NIST data validates the accuracy of the computational methods employed and confirms their suitability to investigate the photoionization properties of Cr XIII.
The calculated photoionization spectrum exhibits numerous resonance structures arising from excitations to both even- and odd-parity Rydberg series. The resonances associated with the even-parity target states are observed in the photon-energy range of 28.36–46.42 Ryd and converge to the thresholds corresponding to the configurations
{, }, {, }, {,
}, {, }, {, },
, }, {, }, {, }, {, }, and {, }.
Similarly, the odd-parity target states generate resonance features in the photon-energy interval of 26.02–46.40 Ryd, converging to the thresholds {, }, {, }, {, }, {, }, {, }, {, },
, }, {, }, {, }, and {, }.
The resonance series are classified using the JLK coupling notation, represented as
Resonance structures are not present beyond the highest target threshold, corresponding to at 46.42 Ryd. Consequently, the photoionization cross section exhibits a smooth decrease with increasing photon energy above this threshold.
The photoionization (PI) cross sections of the excited states of Cr XIII, calculated using the Breit–Pauli R-matrix (BPRM) and RDW method, are presented in Figure 3 (b,c,d). The cross sections for all three fine-structure levels exhibit similar resonance patterns arising from multiple Rydberg series that converge to different ionization thresholds associated with the target states included in the close-coupling expansion. The ionization potentials obtained from the BPRM calculations for the , , and states are 24.1548, 24.1188, and 24.0365 Ry, respectively. These values are in good agreement with the corresponding values recommended by the National Institute of Standards and Technology (NIST), namely 24.2131, 24.1770, and 24.0936 Ry. The relative deviations are only 0.24%, 0.24%, and 0.24%, respectively, demonstrating the high accuracy of the present BPRM calculations. The ionization potentials predicted by the RDW method for the , , and states are 24.1590, 24.1222, and 24.1076 Ry, respectively. These values also agree well with the NIST recommended data , with relative deviations of 0.22%, 0.23%, and 0.06%, respectively. The consistency between the BPRM, RDW, and NIST values provides additional confidence in the accuracy of the present theoretical results.
Figure 4 compares the photoionization (PI) cross sections of the ground state of Ca IX obtained using the Breit–Pauli R-matrix (BPRM), Dirac Atomic R-matrix Code (DARC), and relativistic distorted-wave (RDW) methods over the photon energy interval of 13–25 Ry. The background cross sections predicted by the three theoretical approaches are found to be in close agreement throughout the energy range considered, demonstrating the consistency of the present calculations.
The ionization potentials of the ground state obtained from the DARC and RDW calculations are 13.8255 Ry and 13.6899 Ry, respectively. These values compare well with the recommended NIST value of 13.8570 Ry , corresponding to relative deviations of 0.22% and 1.21%, respectively. The close agreement with the NIST data provides additional validation of the accuracy of the present theoretical results.
9.1.2. Photoionization Cross Section of Co XI
Photoionization cross-section of Co XI by employing BPRM codes described in section 3.1, we have optimized the radial wave function parameters for and orbitals for Co XII. The lowest 41 target levels of Co XII considered in the present calculations arise from the non-relativistic configurations
A total of 13 even symmetries,
and 12 odd symmetries,
were included in the photoionization cross-section calculations. These target-state symmetries consist of singlet, triplet, and quintet terms, which couple with the incoming electron to form the -electron system having even- and odd-parity doublet and quartet symmetries.
We have investigated the photoionization process of the ground state and the first excited state of Co XI using the Breit–Pauli R-matrix (BPRM) method and the Relativistic Distorted Wave (RDW) method. In the BPRM calculations, an R-matrix radius of a.u. was adopted to ensure that all target orbitals were completely enclosed within the inner-region sphere. A fine energy mesh of Ry was employed to accurately resolve the resonance structures in the photoionization cross sections.
Figure 5(a) compares the photoionization (PI) cross sections obtained using the BPRM and RDW methods for the ground state over the photon-energy range of 29–50 Ry. The cross sections calculated using the two independent methods exhibit excellent agreement throughout the entire energy range, demonstrating the consistency and reliability of the present calculations.
The ionization potentials of the ground state of Co XI were calculated to be 22.322 Ry and 22.311 Ry using the BPRM and RDW methods, respectively. These values are in excellent agreement with the recommended NIST value of 22.441 Ry, corresponding to percentage differences of only 0.53% and 0.57%, respectively. The close agreement between the present theoretical results and the available NIST data validates the accuracy of the computational methods employed and confirms their suitability to investigate the photoionization process of Co XI.
The calculated photoionization spectrum exhibits several resonance features arising from excitations to both even- and odd-parity Rydberg series. The resonances associated with the even- and odd-parity target states are observed in the photon-energy ranges of 22.322–23.229 Ry and 25.182–28.063 Ry, respectively. These resonance series converge to the thresholds corresponding to the target configurations
and
etc.
Figure 5(b) compares the PI cross sections of the first excited state obtained using the BPRM and RDW methods over the photon-energy range of 29–55 Ry. The ionization potentials of the first excited state of Co XI were calculated to be 22.141 Ry and 22.134 Ry using the BPRM and RDW methods, respectively. These values agree well with the NIST ionization potential value of 22.264 Ry, corresponding to percentage differences of only 0.55% and 0.58%, respectively. The excellent agreement between the BPRM, RDW, and NIST results provides additional confidence in the accuracy of the present theoretical calculations.
Furthermore, no resonance structures are observed above the highest target threshold, located at 28.063 Ry for the ground state and 27.882 Ry for the first excited state. Consequently, the photoionization cross sections for both states decrease smoothly with increasing photon energy beyond these thresholds.
9.1.3. Photoionization of Fe Ions: Fe XVI
As continuation of the RMOP project [8,9,10,11,13], and using OP BPRM codes (Figure 1), Figure 6 presents photoionization cross sections of the ground state of Fe XVI. Due to the complexity of BRRM calculations with a large number of core fine structure levels, preliminary calculations are first carried out in LS coupling. (Nahar, in preparation 2026). The study has been carried out as a part of the ROMP series for obtaining accurate iron opacities. The close coupling wavefunction expansion for Fe XVI included 61 LS states from shells n=3,4,5 of core ion Fe XVII pointed by the red arrows in the figure. The positions of the arrows correspond to the highest states of n=3,4,5. We observe the enhancement of the cross section background at core excited state due to strong dipole allowed transition of the core ground state . Beyond n=3 excitations, the resonances weaken and merging almost to the background beyond n=4 excitations. These indicate convergence of resonances at higher n.
9.2. Unified Electron-Ion Recombination
The R-matrix close coupling methodology has been extended to obtain unified (e + ion) recombination cross sections and rate coefficients [44,45,46]. The unification entails an ab initio and self-consistent treatment of two processes, radiative recombination (RR) and di-electronic recombination (DR), both of which naturally occur together but considered separately in simpler approximations. The unified method employs photoionization cross sections for calculated using BPRM codes (Figure 1, followed by a detalied balance scheme to calculate photo-recombination (PR) cross sections. These are then complemented by calculations for DR collision strengths, also computed with the same wavefunction expansion as the PR cross sections, to obtain total unified cross sections. Results have been reported for a large number of ions, and data archived in the database [43]. As an exemplar, new calculations for many other ions are in progress, as shown in Figure 7 for Maxwellian averaged rate coefficient for Ar XVII (Nahar, in preparation 2026).
9.3. Electron Impact Excitation
Results in this section pertain to R-matrix calculations and applications to determine densities, temperatures, abundances, and other quantities in astrophysical sources.
9.3.1. Collision strengths and line ratios for Mn III: Abundances and galactic chemical evolution
As continuation of IP work, we are studying Fe-group elements with larger eigenfunction expansions for target ions. Collision strengths for electron impact excitation of Mn III () were computed using the Breit-Pauli R-matrix (BPRM) method (Samak et al. 2026a,b). The close-coupling expansion included 38 fine-structure levels dominated by the ground configuration and the first excited configuration of the same parity obtained from superstructure calculations, with energies in good agreement with NIST values to within 1–5%. Collision strengths were obtained for all 703 transitions among these levels over an electron energy range up to 2.2 Ry. Energy levels of Mn III were also computed using the Flexible Atomic Code (fac), which is based on the Distorted Wave (DW) approximation, and were found to be in good agreement with both the NIST values and the superstructure results.
Work is currently underway to compute collision strengths for Mn III using the same code, for comparison with the BPRM R-matrix results. Fe-group elements such as Mn and Fe are produced in explosive supernova nucleosynthesis, but with markedly different production histories: manganese, an odd-Z element, is synthesized more efficiently in the neutron-rich environments of Type Ia supernovae (SNe Ia) than in core-collapse Type II supernovae (SNe II), which instead proceed from short-lived massive-star progenitors, and because SNe Ia progenitors evolve on much longer (Gyr) timescales than the Myr lifetimes of massive SNe II progenitors, the Mn/Fe abundance ratio increases with time (or with Fe/H) as the relative contribution of SNe Ia grows, making Mn/Fe a sensitive chronometer of galactic chemical evolution and star-formation history. While Mn abundances have traditionally been inferred from neutral Mn i absorption lines in stellar atmospheres, emission lines from ionized Mn have not previously been used as plasma diagnostics, so forbidden [Mn iii] lines in the NUV/optical/near-IR, several of which are now within reach of JWST, offer a complementary route to determining the Mn/Fe ratio directly from nebular emission in H ii regions and supernova remnants.
To this end, using the Maxwellian-averaged effective collision strengths , computed at – K characteristic of H ii regions, a collisional-radiative (CR) model was constructed with the spectra code to obtain level populations and line emissivity ratios as functions of electron density and temperature ; Figure 8 (a) presents the forbidden-line emissivity ratio , corresponding to the and transitions of Mn iii, whose underlying collision strengths – shown in panels (b) and (c) – exhibit dense Rydberg resonance structures below Ry. Both transitions share the same lower level () and originate from upper levels closely spaced in energy ( and , separated by only about 0.002 Ry), favouring efficient collisional mixing between the two upper levels at high electron density: as shown in panel (a), the ratio increases monotonically by roughly 70% over the range , before flattening toward a density-independent, collisionally-dominated regime at the highest densities, with a moderate temperature dependence also present as the ratio decreases systematically with increasing , indicating that this line pair provides a useful combined density–temperature diagnostic in the near-infrared (m), complementing the pure density and temperature diagnostics – presented in Samak et al. (MNRAS, 2026, in press) for other Mn iii transitions and accessible to both ground-based and JWST near-infrared spectroscopy of H ii regions and supernova remnants where Mn iii emission may be detected.
9.3.2. Electron Impact Excitation of P III: Extraterrestrial Lifeforms?
As the backbone element of DNA, comprised mainly of H, C, N, O compounds, Phosphorus is an essential biogenic element for life on Earth [39]. Consequently, it is of considerable astrobiological as well as astrophysical significance. However, its abundance in the Solar System is relatively low compared with the neighbouring even-(Z) elements in the first three periods of the periodic table. In recent years, there has been growing interest in the search for exoplanets that may potentially host life. Astronomers are engaged in recording and analyzing photons from the outer space that can give an indication of biosignatures in exoplanetary atmospheres. The abundance of phosphorus is considered to be an important factor for the search for DNA-based extraterrestrial life. Accurate determination of the phosphorus abundance in astrophysical environments requires reliable atomic data for its various ionization stages, particularly the low-ionization stages that are commonly present in photoionized plasmas. Despite their importance, there is a paucity of accurate radiative and electron-impact excitation data for phosphorus ions. This lack of atomic data limits the reliability of spectral diagnostics and abundance determinations. In the present work, we present Breit–Pauli R-matrix calculations of electron-impact collision strengths for astrophysically important transitions in P III.
Figure 9 illustrates the collision strength calculated using the Breit-Pauli R matrix method for the electron-impact excitation transition in P III as a function of incident electron energy. In the near-threshold region, the collision strength exhibits considerable autoionizing resonance features arising from channel coupling in the close-coupling R-matrix calculation. A substantial enhancement of the collision strength is observed, particularly in the energy range 0.8 and 1.0 Ryd. At higher energies > 1.4 Ryd, the resonance structures disappear and the collision strength approaches a smooth background dominated by direct electron-impact excitation. The background of collision strength increases with incident electron energy in agreement with the Coulomb–Bethe form , where a is related to the dipole oscillator strength [5]. This behavior of increasing background of is characteristic of the optically allowed electric dipole (E1) transitions.
9.4. Plasma Effects
In this section we demonstrate effects of plasma environment on atomic cross sections.
9.4.1. Photo-Recombination Cross Section of Fe XXV Ion in Dense Plasma
Figure 10 presents the photorecombination (PR) cross sections of the ground state of He-like Fe XXV for the and channels, respectively, for the isolated case and under the plasma conditions corresponding to an electron density of at a plasma temperature of 200 eV. These calculations are performed using RDW approach. In both cases, the PR cross section attains its maximum value at low incident electron energies and decreases rapidly as the electron energy increases. A pronounced rise is observed near the K-shell recombination threshold, followed by a gradual decline at higher energies. The presence of the plasma causes only a slight reduction in the magnitude of the PR cross section, while the overall profile of the curves remains nearly unchanged. This behaviour is attributed to plasma screening, which weakens the effective Coulomb attraction between the nucleus and the incoming electron, thereby reducing the probability of radiative electron capture.
9.4.2. Plasma Broadening of Autoionizing Resonances
Plasma broadening of autoionizing resonances is incorporated following the treatment of RMOP III [10]. Four mechanisms are included: electron-impact (collisional), Stark (ion-microfield), thermal Doppler, and free-free (inverse bremsstrahlung) broadening. Each unbroadened resonance is convolved with a Lorentzian profile whose total width is the sum of these four contributions,
where , , , and are the collisional, Stark, Doppler, and free-free widths, respectively. At the plasma conditions of interest ( K, – ), electron-impact broadening dominates the total width by about an order of magnitude over the other terms, which is why the Lorentzian form is adopted for the convolution.
Figure 11 shows plasma-broadened photoionization cross sections for O VI and O VII at K across electron densities – . At low density the broadened cross section tracks the unbroadened resonance structure closely; as increases, autoionizing resonances broaden and merge into the continuum, raising the background cross section by up to an order of magnitude at the highest densities shown.
The density at which resonances fully dissolve differs between the two ions, reflecting differences in resonance width and spacing in each. This behavior is consistent with the broadening trends found for O VI and O VII individually in RMOP-V [12], and for Fe ions in RMOP-III [10], underscoring that resonance dissolution with increasing density is a general feature of HED plasma broadening across ion species.
9.4.3. Electron Impact Excitation Collision Strength of Fe XXV Ion in Dense Plasma
Figure 12 presents the collision strengths obtained with the RDW method for the and transitions of He-like Fe XXV for isolated and plasma conditions. Plasma calculations were carried out for eV at electron densities of and . For the transition, the collision strength decreases monotonically with increasing incident electron energy throughout the energy interval considered. A small increase in the collision strength is observed with the increased plasma density, and this increase becomes slightly more noticeable as the electron density rises. In contrast, the transition displays the opposite energy dependence, with the collision strength increasing with electron energy. Unlike the previous case, plasma screening leads to a reduction in the collision strength, and the reduction is largest at the higher electron density. The different responses of these two transitions indicate that the plasma environment does not affect all excitation channels uniformly; instead, its influence depends on the characteristics of the individual transition.
9.5. Plasma Diagnostics and Applications
In this section we present a sample of potential applications to astrophysical and laboratory sources with atomic parameters calculated mainly using the R-matrix method.
9.5.1. Little Red Dots: Active Galactic Nuclei?
Little Red Dots (LRDs) represent a mysterious population of compact red sources recently discovered by James Webb Space Telescope (JWST). While their exact nature is still an ongoing debate, the leading hypothesis suggests they are heavily obscured Active Galactic Nuclei (AGNs). However, LRDs are typically missing the signatures typical of AGNs: the strong blast of X-ray signatures and the distinct variability. To resolve this discrepancy, it has been proposed that these AGNs are cocooned in dense gas, obscuring them. We are seeking to establish this theory further by utilizing [OII], [SII], and [OIII] emission-line ratios to compare these LRDs against both standard AGNs and typically starburst H II regions. Future works will incorporate [FeII] to further uncover if LRDs truly are AGNs. Using the Spectra code, we constructed diagnostic physical conditions of Little Red Dots (LRDs) derived from atomic emission line modeling.
Irony and GLIMPSED-329380 are the LRDs that were picked out to compare with this atomic emission line modeling. Irony is only seen on the first plot, as its temperature is and falls outside the upper bounds of Figure 13(b). Together, these diagnostics highlight the extremely high-density and high-temperature environments, characteristic of an obscured Active Galactic Nucleus (AGN) powering these LRDs, distinguishing them from standard H II regions.
9.5.2. Determine Oxygen Abundance of Astronomical Object Using R-matrix Atomic Data
For accurately estimating the oxygen abundance of H II regions in galaxies, [OII], [SII], and [OIII] line ratios play an important role. Applying CR model or collisional-radiative-recombination (CRR) model with an addition of recombination rate coefficient contribution also available from R-matrix method, SPECTRA code can calculate the relation between electron density, electron temperature, and line ratios, which can further determine the oxygen abundance. [42] has done a systematic analysis of 44 galaxies observed by JWST/VLT/Keck to estimate the oxygen abundance of each galaxy and established a preliminary result of a slow oxygen enrichment from z≈10 to current age with a best-fit result of from 7.50 to 8.25, as shown by circles and plus signs in Figure 14b.
Here, we analyzed 2 new JWST objects to estimate their oxygen abundance, one LRD at (LRD J1025+1402)[47] and one star-forming galaxy at (COS-2987)[48], with the line fluxes date coming from these two papers[47][48]. We use [SII] 6718/ 6732 line ratio to determine the electron density of LRD J1025+1402 and [OII] 3729/ 3726(COS-2987) to determine the electron density of COS-2987, by the data from Spectra code, as shown in vertical dashed lines in Figure 14a. Then, [OIII] 5007/ 4363 line ratio was used to determine the electron temperature of both of the galaxies as shown in the contours in Figure 14a. The oxygen abundance is determined by the formulation of [49] with relation between electron density, elctron temperature, line fluxes relative to H line, and oxygen abundance, with a results of 7.48 and 7.65 for LRD J1025+1402 and COS-2987 respectively, as highlighted by the arrows in Figure 14b with other galaxies’ oxygen abundances from [42] also determined by the formulation of [49].
The star-forming galaxy COS-2987 has a relatively low oxygen abundance, which generally follows the general trend of an downward oxygen abundance in early universe as seen in [42]. However, the LRD J1025+1402, even in a relatively local universe, has a low oxygen abundance profile.
9.5.3. Machine Learning Analysis of Observational Spectra Using R-Matrix Atomic Data
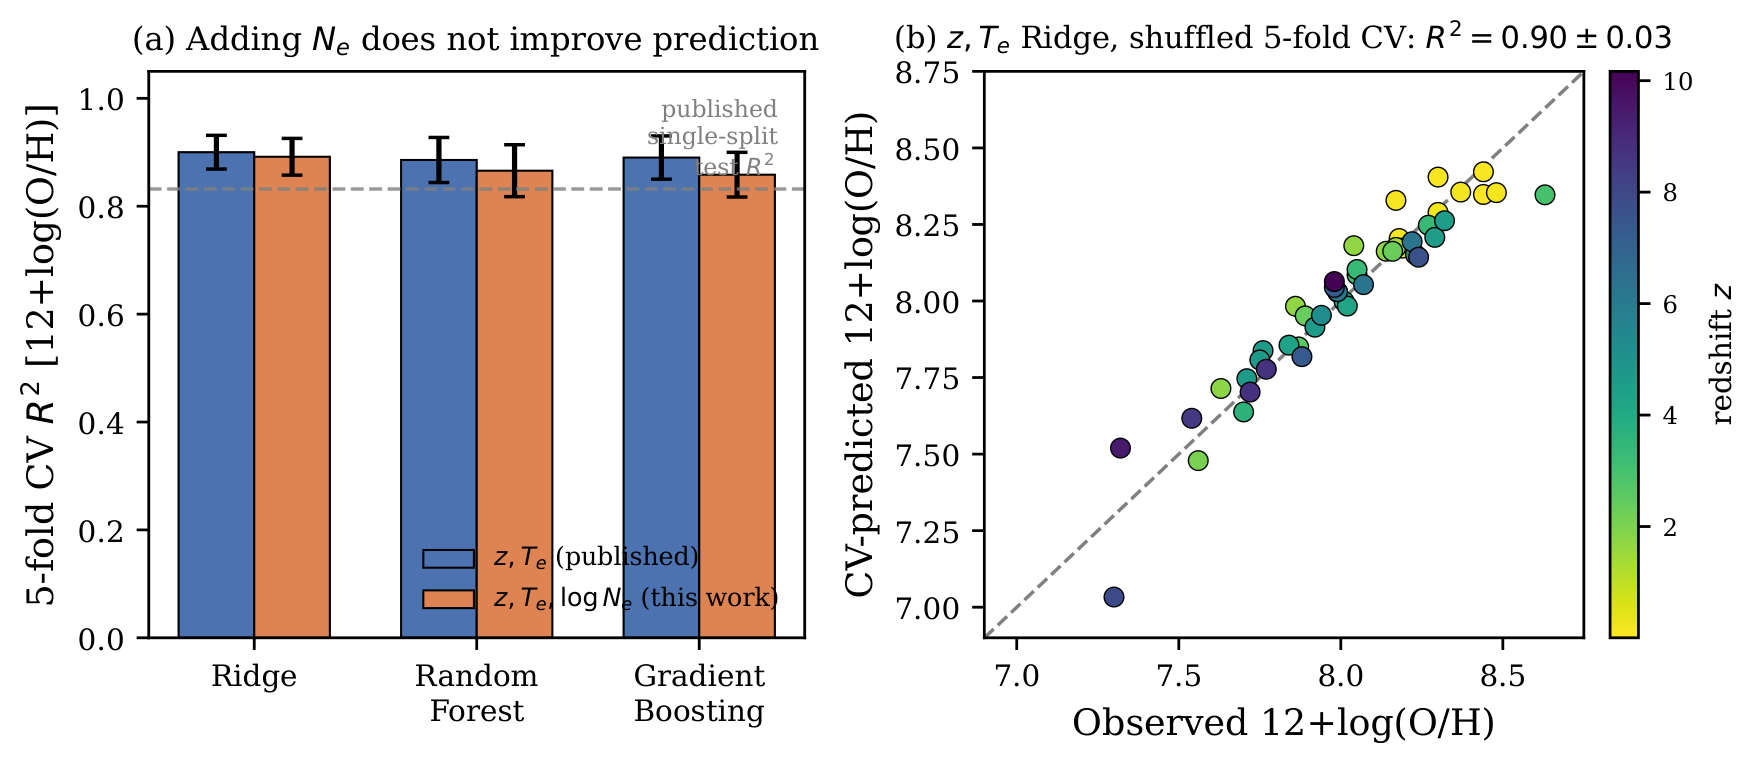
The companion analysis of 45 JWST/VLT/Keck galaxies [42] trained regression models on redshift z and R-matrix-derived electron temperature ([O iii]) to predict 12+log(O/H), reporting a single-split test (Ridge) alongside a 5-fold cross-validated of only – a substantial, unexplained gap between the two.
We revisit this using the same feature set on the 47-galaxy subsample with complete density measurements, under a controlled 5-fold CV protocol (shuffled folds, standardized features). This recovers for Ridge (comparable for Random Forest and Gradient Boosting; Figure 15b), far more stable than previously reported. Constructing folds without shuffling – i.e., against the table’s near-redshift ordering – degrades stability to , indicating that fold construction relative to the data’s redshift ordering is a likely contributor to the earlier instability, rather than the underlying z--O/H relation itself being unreliable.
We further test whether electron density – derived from the same R-matrix collisional-excitation framework as , via the [O ii]/[S ii] doublet ratios – adds predictive information. Adding as a third feature does not improve any of the three algorithms (Figure 15a: Ridge , Random Forest , Gradient Boosting ), consistent with tracing H ii region compactness and ionization structure rather than gas-phase abundance directly. Together, these results show that the -O/H relation is a genuinely stable machine-learning target once properly cross-validated, with further gains more likely to come from additional temperature- or ionization-sensitive diagnostics than from density alone.
10. Nanoscience
Atomic properties on nanomoieties have been studied, for example for particular application in nanobiomedicine [23,24,25,26,27]. It has been shown that monochromatic or quasi- monochromatic X-ray irradiation of high-Z gold or platinum nanoparticles embedded in cancerous tumors could lead to enhanced efficiency of malignant cell killing via single or double-strand DNA breakups [24,26,27]. However, R-matrix calculations for high-Z elements are challenging and remain the goal of future works.
11. Conclusions
The current status and future plans for the utilization of the powerful and versatile R-matrix method in the close coupling or coupled channel approximation is presented for laboratory and astrophysical applications. Relativistic effects are considered in BPRM calculations in intermediate coupling, or in DARC calculations in jj-coupling. A comparison is made with DW and RDW calculations without channel coupling. A sample of ongoing and heretofore unpublished material is given to illustrate the scope and extent of R-matrix work.
Author Contributions
AKP edited and organized the material in the article. All co-authors contributed equally in separate subsections with previously unpublished results and new calculations.
Funding
AKP and SNN acknowledge partial support for their work from the U.S. National Science Foundation grant AST-2407470. R.N. is grateful for the support of this research by the Department of Science and Technology (DST), New Delhi through Grant No. DST/WISE-PDF/PM-44/2024.NK sincerely thanks to Department of Science and Technology(DST), New Delhi, India for providing him senior research fellowship (SRF) with award number IF210224. AKSJ is also thankful to Anusandhan National Research Foundation (ANRF), DST, India for providing financial support under the project number CRG/2022/008061.
Data Availability Statement
The R-matrix data being computed will be made available from future publications. The data computed by the OSU group will be accessible via the online database Norad [43].
References
- Burke, P.G. R-Matrix Theory of Atomic Collisions; Springer, 2011. [Google Scholar]
- Burke, P.G.; Robb, W.D. The R-matrix theory of atomic processes. Adv. At. Mol. Phys. 1975, 11, 143. [Google Scholar] [CrossRef]
- Seaton, M.J. Atomic data for opacity calculations: I. General description. J. Phys. B At. Mol. Opt. Phys. 1987, 20, 6363. [Google Scholar] [CrossRef]
- Berrington, K.A.; Burke, P.G.; Butler, K.; Seaton, M.J.; Storey, P.J.; Taylor, K.T.; Yan, Y. Atomic data for opacity calculations: II. Computational methods. J. Phys. B At. Mol. Opt. Phys. 1987, 20, 6379. [Google Scholar] [CrossRef]
- Pradhan, A.K.; Nahar, S.N. Atomic Astrophysics and Spectroscopy; Cambridge University Press: New York, 2011. [Google Scholar]
- Hummer, D.G.; Berrington, K.A.; Eissner, W.; Pradhan, A.K.; Saraph, H.E.; Tully, J.A. Atomic data from the IRON Project. I. Goals and methods. Astron. Astrophys. 1993, 279, 298. [Google Scholar]
- Berrington, K.A.; Eissner, W.; Norrington, P.H. RMATRX1: Belfast atomic R-matrix code. Comput. Phys. Commun. 1995, 92, 290–420. [Google Scholar] [CrossRef]
- Pradhan, A.K.; Nahar, S.N.; Eissner, W. R-matrix calculations for opacities: I. Methodology and computations. J. Phys. B At. Mol. Opt. Phys. 2024, 57, 125001. [Google Scholar] [CrossRef]
- Nahar, S.N.; Zhao, L.; Eissner, W.; Pradhan, A.K. R-matrix calculations for opacities: II. Photoionization and oscillator strengths of iron ions Fe XVII, Fe XVIII and Fe XIX. J. Phys. B At. Mol. Opt. Phys. 2024, 57, 125002. [Google Scholar] [CrossRef]
- Pradhan, A.K. R-matrix calculations for opacities: III. Plasma broadening of autoionizing resonances. J. Phys. B At. Mol. Opt. Phys. 2024, 57, 125003. [Google Scholar] [CrossRef]
- Zhao, L.; Nahar, S.N.; Pradhan, A.K. R-matrix calculations for opacities: IV. Convergence, completeness, and comparison of relativistic R-matrix and distorted wave calculations for Fe XVII and Fe XVIII. J. Phys. B At. Mol. Opt. Phys. 2024, 57, 125004. [Google Scholar] [CrossRef]
- Chari, D.; Nahar, S.N.; Pradhan, A.K. R-matrix calculations for opacities: V. Temperature-density dependence of photoabsorption cross sections and opacity spectra of oxygen ions O VI and O VII. J. Phys. B At. Mol. Opt. Phys. 2026. [Google Scholar] [CrossRef]
- Pradhan, A.K.; Nahar, S.N. The Opacity Project: R-Matrix Calculations for Opacities of High-Energy-Density Astrophysical and Laboratory Plasmas. Atoms 2025, 13, 85. [Google Scholar] [CrossRef]
- Kumar, R.; Goyal, A.; Singh, N. Analysis of line intensity of cloud-to-ground lightning and flux ratio of active galactic nuclei forbidden nebular lines in NII. Indian J. Phys. 2025, 99, 725–739. [Google Scholar] [CrossRef]
- Yadav, F.; Goyal, A.; Singh, N. Spectroscopic study of Fe IV and photoionization of Fe III ions under dense plasma. Phys. Lett. Sect. A General. At. Solid State Phys. 2024, 523. [Google Scholar] [CrossRef]
- Yadav, F.; Goyal, A.; Singh, N. Analysis of line intensity ratio for optical transitions of 3d6 levels and plasma screening effect on atomic structure of Fe III ion. Radiat. Phys. Chem. 2023, 206. [Google Scholar] [CrossRef]
- Singh, A.K.; Dawra, D.; Dimri, M.; Jha, A.K.S.; Sharma, R.; Mohan, M. Relativistic photoionization cross section calculations and resonance parameters for Mg-like Se XXIII. Radiat. Phys. Chem. 2020, 168, 108447. [Google Scholar] [CrossRef]
- Dawra, D.; Dimri, M.; Singh, A.K.; Jha, A.K.S.; Pandey, R.K.; Mohan, M. Theoretical calculations of the photoionization cross sections for the ground and lowest two excited states of Ni XVIII ion. Eur. Phys. J. D. 2022, 76, 59. [Google Scholar] [CrossRef]
- Verma, N.; Jha, A.K.S.; Dawra, D.; Dimri, M.; Mohan, M. Photoionization of Na-like Si IV using R-matrix method. Eur. Phys. J. D. 2023, 77, 134. [Google Scholar] [CrossRef]
- Singh, A.K.; Dawra, D.; Dimri, M.; Jha, A.K.S.; Mohan, M. Relativistic R-matrix calculations of photoionization cross sections of Cu XVIII. Eur. Phys. J. D. 2019, 73, 85. [Google Scholar] [CrossRef]
- Mohan, M.; Le Dourneuf, M.; Hibbert, A.; Burke, P.G. Photoionization of Al IV (neon-type) from its ground 2s2 2p6 1Se and excited 2s2 2p5 3p 3Po, 1Po, 3Se states using the R-matrix method. Pramana 1999, 53, 733–741. [Google Scholar] [CrossRef]
- Mohan, M.; Sharma, R.; Prasad, V.; Le Dourneuf, M. Photoionization of ground and excited states of neon-like K X. Phys. Scr. 1997, 56, 275–278. [Google Scholar] [CrossRef]
- Nahar, S.N.; Pradhan, A.K. K-alpha resonance fluorescence in Al, Ti, Cu and potential applications for X-ray sources. J. Quant. Spectrosc. Radiat. Transf. 2015, 155, 32–48. [Google Scholar] [CrossRef]
- Lim, S.N.; Pradhan, A.K.; Barth, R.F.; Nahar, S.N.; Nakkula, R.J.; Yang, W.; Palmer, A.M.; Turro, C.; Weldon, M.; Bell, E.H.; et al. Tumoricidal activity of low-energy 160-KV versus 6-MV X-rays against platinum-sensitized F98 glioma cells. J. Radiat. Res. 2015, 56, 77–89. [Google Scholar] [CrossRef] [PubMed]
- Pradhan, A.K.; Nahar, S.N.; Montenegro, M.; Yu, Y.; Zhang, H.L.; Sur, C.; Mrozik, M.; Pitzer, R.M. Resonant X-ray Enhancement of the Auger Effect in High-Z Atoms, Molecules, and Nanoparticles: Potential Biomedical Applications. J. Phys. Chem. A 2009, 113, 12356–12363. [Google Scholar] [CrossRef] [PubMed]
- Montenegro, M.; Nahar, S.N.; Pradhan, A.K.; Huang, K.; Yu, Y. Monte Carlo Simulations and Atomic Calculations for Auger Processes in Biomedical Nanotheranostics. J. Phys. Chem. A 2009, 113, 12364–12369. [Google Scholar] [CrossRef] [PubMed]
- Westphal, M.S.; Lim, S.N.; Nahar, S.N.; Chowdhury, E.; Pradhan, A.K. Broadband, monochromatic and quasi-monochromatic x-ray propagation in multi-Z media for imaging and diagnostics. Phys. Med. Biol. 2017, 62, 6361. [Google Scholar] [CrossRef] [PubMed]
- Pradhan, A.K.; Nahar, S.N. Atomic astrophysics and spectroscopy; Cambridge University Press, 2011. [Google Scholar]
- Norrington, P. DARC manual, 2009. [CrossRef]
- Eissner, W.; Jones, M.; Nussbaumer, H. Techniques for the calculation of atomic structures and radiative data including relativistic corrections. Comput. Phys. Commun. 1974, 8, 270. [Google Scholar] [CrossRef]
- Grant, I.; Quiney, H. GRASP: The Future? Atoms 2022, 10. [Google Scholar] [CrossRef]
- Pradhan, A.K.; Norcross, D.W.; Hummer, D.G. Cross sections and excitation rates for electron collisions with heliumlike ions. Phys. Rev. A 1981, 23, 619–631. [Google Scholar] [CrossRef]
- Del Zanna, G.; Liang, G.; Mao, J.; Badnell, N.R. UK APAP R-Matrix Electron-Impact Excitation Cross-Sections for Modelling Laboratory and Astrophysical Plasma. Atoms 2025, 13. [Google Scholar] [CrossRef]
- The Opacity Project Team. The Opacity Project; Vol. 1–2, Institute of Physics Publishing: Bristol, 1995–1996. [Google Scholar]
- Seaton, M.J.; Yan, Y.; Mihalas, D.; Pradhan, A.K. Opacities for stellar envelopes. Mon. Not. R. Astron. Soc. 1994, 266, 805. [Google Scholar] [CrossRef]
- Mendoza, C.; Seaton, M.J.; Buerger, P.; Bellorín, A.; Meléndez, M.; González, J.; Rodríguez, L.S.; Palacios, E.; Pradhan, A.K.; Zeippen, C.J. OPserver: Interactive online computations of opacities and radiative accelerations. Mon. Not. R. Astron. Soc. 2007, 378, 1031. [Google Scholar] [CrossRef]
- Bailey, J.E.; Nagayama, T.; Loisel, G.P.; Rochau, G.A.; Blancard, C.; Colgan, J.; Cosse, P.; Faussurier, G.; Fontes, C.J.; Gilleron, F.; et al. A higher-than-predicted measurement of iron opacity at solar interior temperatures. Nature 2015, 517, 56–59. [Google Scholar] [CrossRef] [PubMed]
- Nahar, S.N.; Pradhan, A.K. Large enhancement in high-energy photoionization of Fe XVII and missing continuum plasma opacity. Phys. Rev. Lett. 2016, 116, 235003. [Google Scholar] [CrossRef] [PubMed]
- Hoy, K.; Nahar, S.N.; Pradhan, A.K. Biosignature line ratios of [P III] in exoplanetary and nebular environments. Mon. Not. R. Astron. Soc. Lett. 2023, 521, L48–L52. [Google Scholar] [CrossRef]
- Osterbrock, D.E.; Ferland, G.J. Astrophysics of Gaseous Nebulae and Active Galactic Nuclei, 2nd ed.; University Science Books: Sausalito, 2006. [Google Scholar]
- Dopita, M.A.; Sutherland, R.S. Astrophysics of the diffuse universe; Springer Science & Business Media, 2013. [Google Scholar]
- Bhandari, V.; Xu, M.; Nahar, S.N.; Pradhan, A.K. [O iii] line ratios and evolution of oxygen abundance with redshift using JWST–VLT–Keck observations. Mon. Not. R. Astron. Soc. 2026, 549, stag955. [Google Scholar] [CrossRef]
- Nahar, S.N. Database NORAD-Atomic-Data for Atomic Processes in Plasma. Atoms 2020, 8, 68. Available online: https://norad.astronomy.osu.edu/. [CrossRef]
- Nahar, S.N.; Pradhan, A.K. Electron-ion recombination in the close-coupling approximation. Phys. Rev. Lett. 1992, 68, 1488–1491. [Google Scholar] [CrossRef] [PubMed]
- Nahar, S.N.; Pradhan, A.K. Atomic data for opacity calculations: XX. Photoionization cross sections and oscillator strengths for Fe II. J. Phys. B At. Mol. Opt. Phys. 1994, 27, 429. [Google Scholar] [CrossRef]
- Nahar, S.N.; Pradhan, A.K. Self-consistent R-matrix approach to photoionization and unified electron–ion recombination. Radiat. Phys. Chem.;Photoeff. Theory Exp. 2004, 70, 323–344. [Google Scholar] [CrossRef]
- Ji, X.; D’Eugenio, F.; Juodžbalis, I.; Walton, D.J.; Fabian, A.C.; Maiolino, R.; Ramos Almeida, C.; Acosta Pulido, J.A.; Belokurov, V.A.; Isobe, Y.; et al. Lord of LRDs: Insights into a “Little Red Dot” with a Low-ionization Spectrum at z=0.1. Mon. Not. R. Astron. Soc. 2026, 545, staf2235. [Google Scholar] [CrossRef]
- Usui, M.; Mawatari, K.; Álvarez-Márquez, J.; et al. RIOJA. JWST and ALMA Unveil the Inhomogeneous and Complex Interstellar Medium Structure in a Star-forming Galaxy at z = 6.81. Astrophys. J. Lett. 2025, 991, L38. [Google Scholar] [CrossRef]
- Izotov, Y.I.; Stasińska, G.; Meynet, G.; Guseva, N.G.; Thuan, T.X. The chemical composition of metal-poor emission-line galaxies in the Data Release 3 of the Sloan Digital Sky Survey. Astron. Astrophys. 2006, 448, 955–970. [Google Scholar] [CrossRef]
Figure 1.
The Breit-Pauli R-matrix codes for opacities (RMOP) calculations.
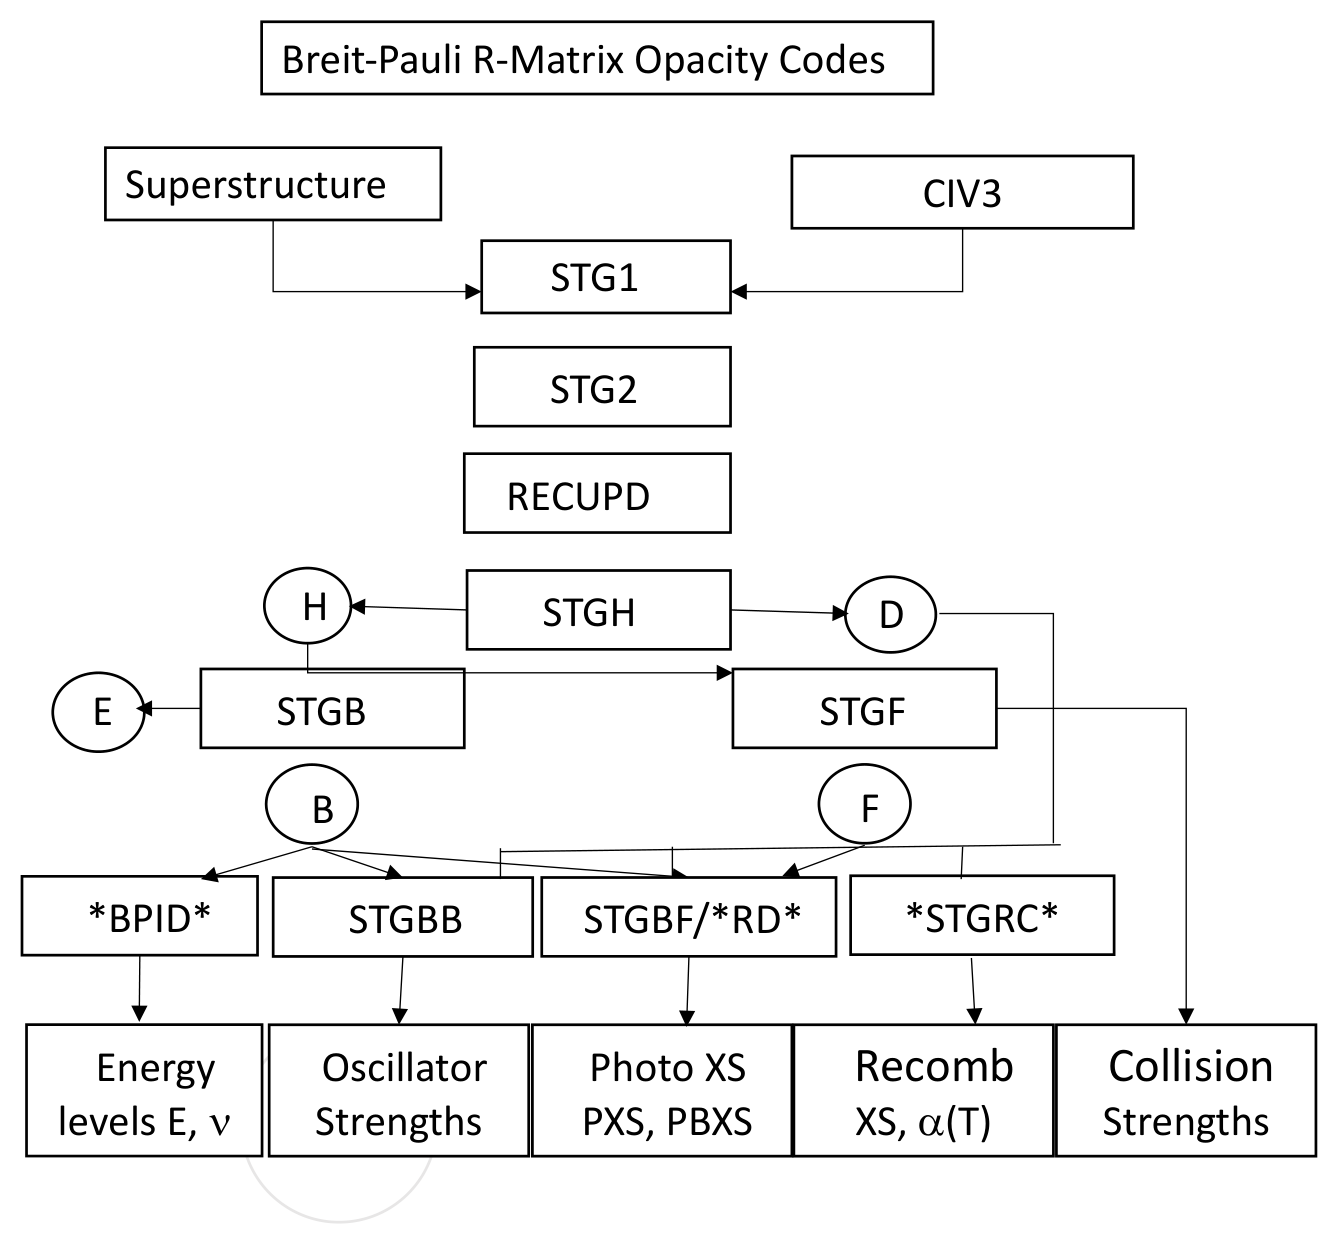
Figure 2.
The DARC code used for relativistic photoionization cross section calculations.
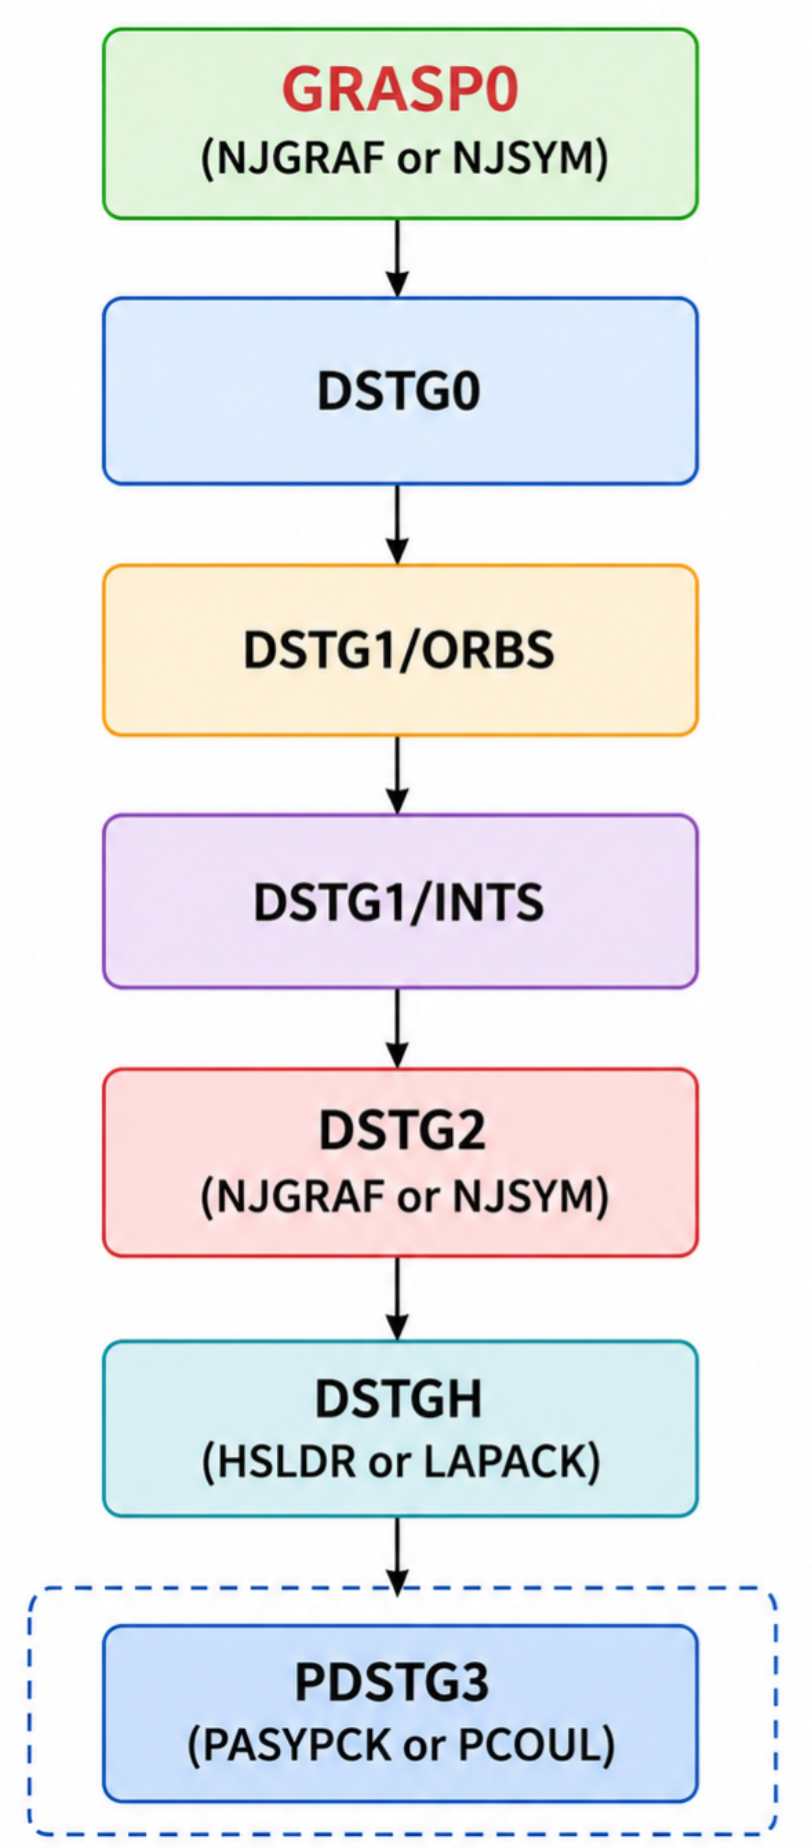
Figure 3.
Photoionization cross section for the ground state and first three excited state of Cr XIII ion calculated using the BPRM and RDW approaches.
Figure 3.
Photoionization cross section for the ground state and first three excited state of Cr XIII ion calculated using the BPRM and RDW approaches.
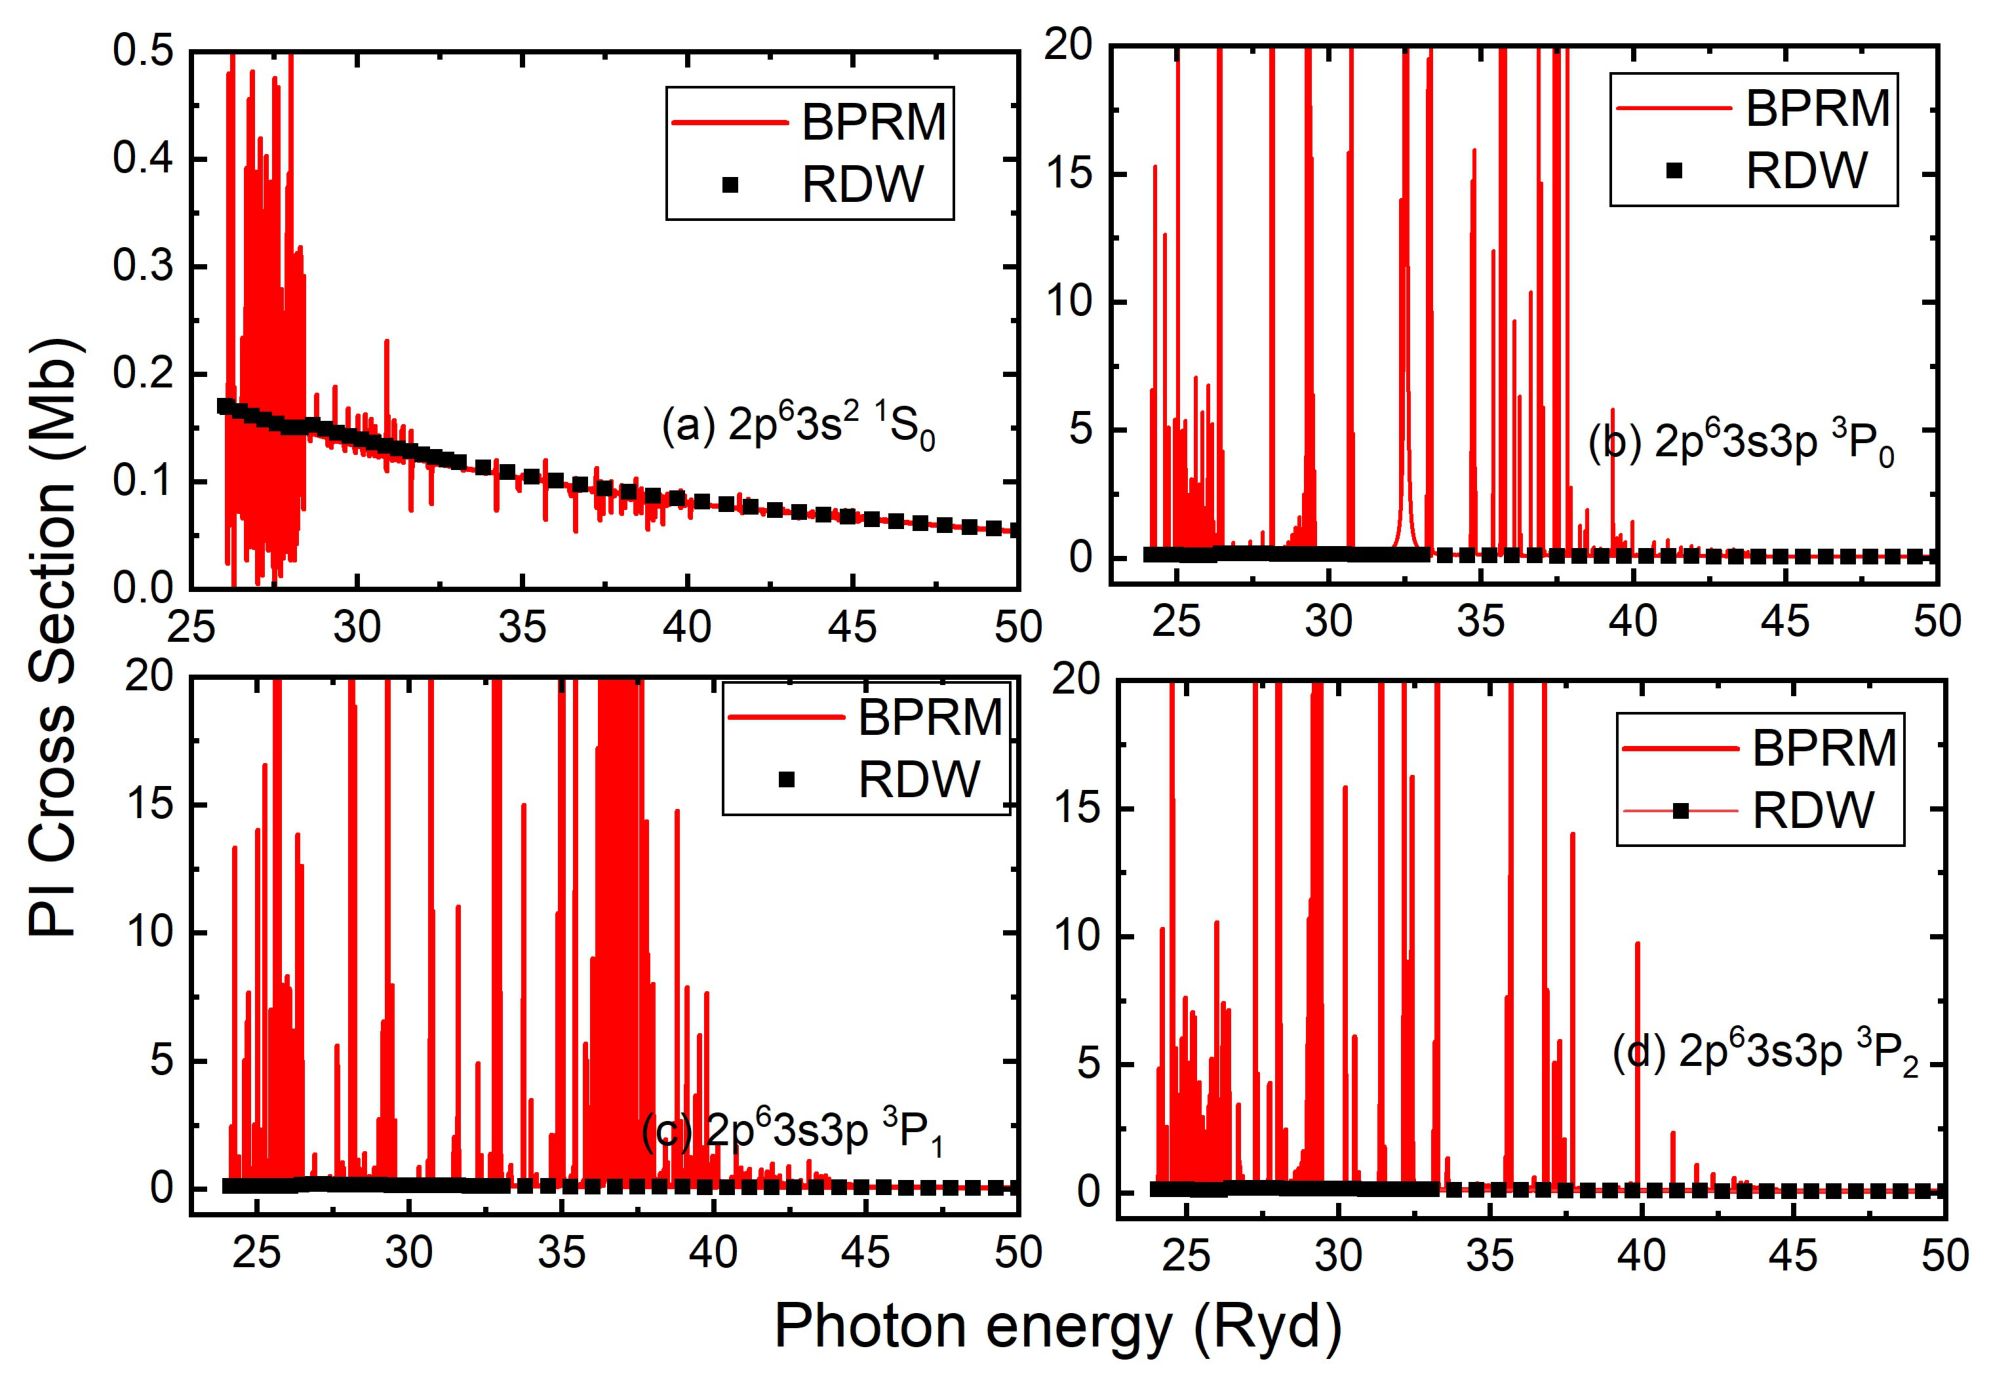
Figure 4.
Comparison of the BPRM photoionization cross sections with the DARC and RDW results for the ground state of Ca IX ion.
Figure 4.
Comparison of the BPRM photoionization cross sections with the DARC and RDW results for the ground state of Ca IX ion.
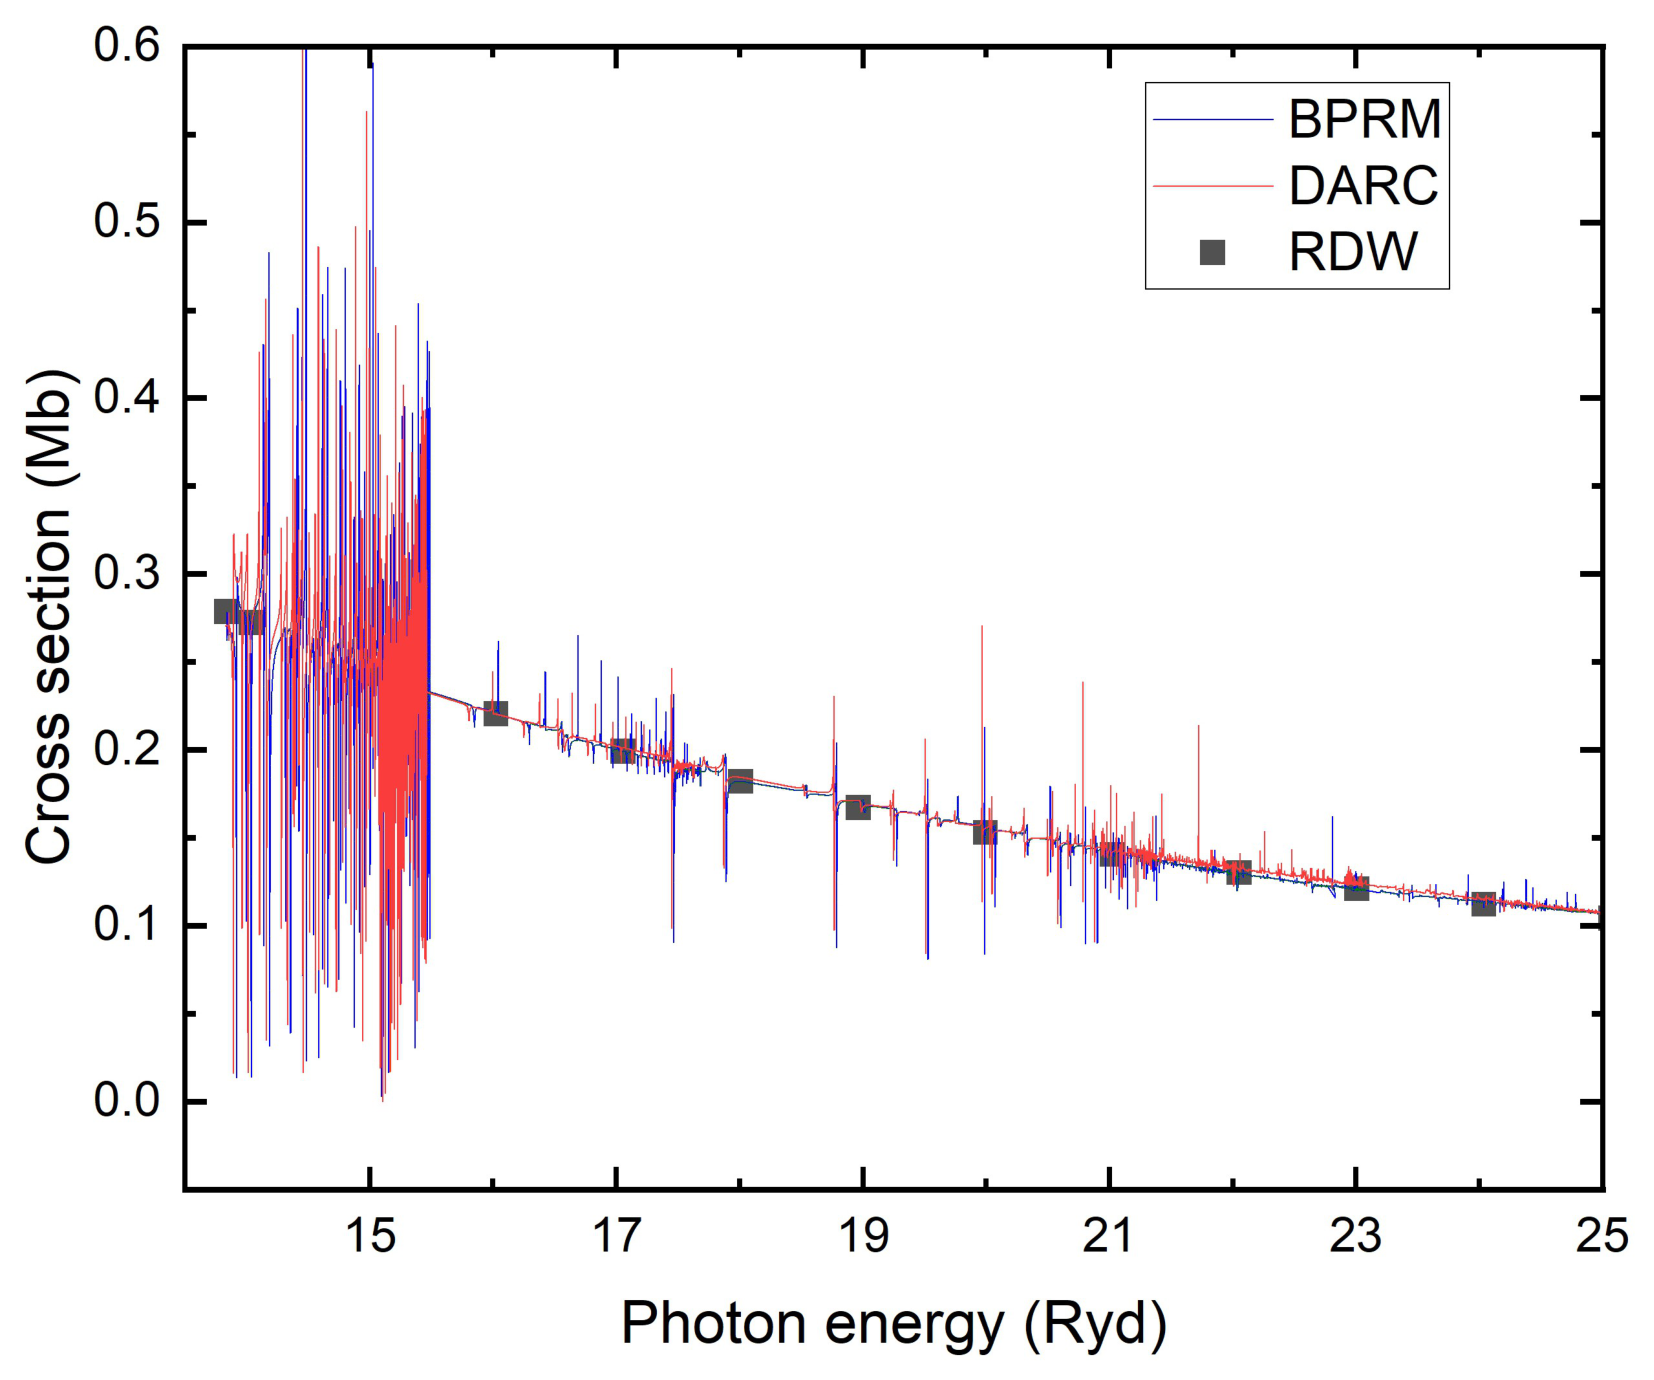
Figure 5.
Photoionization cross section for the ground state and first excited state of Co XI ion calculated using the BPRM and RDW approaches.
Figure 5.
Photoionization cross section for the ground state and first excited state of Co XI ion calculated using the BPRM and RDW approaches.
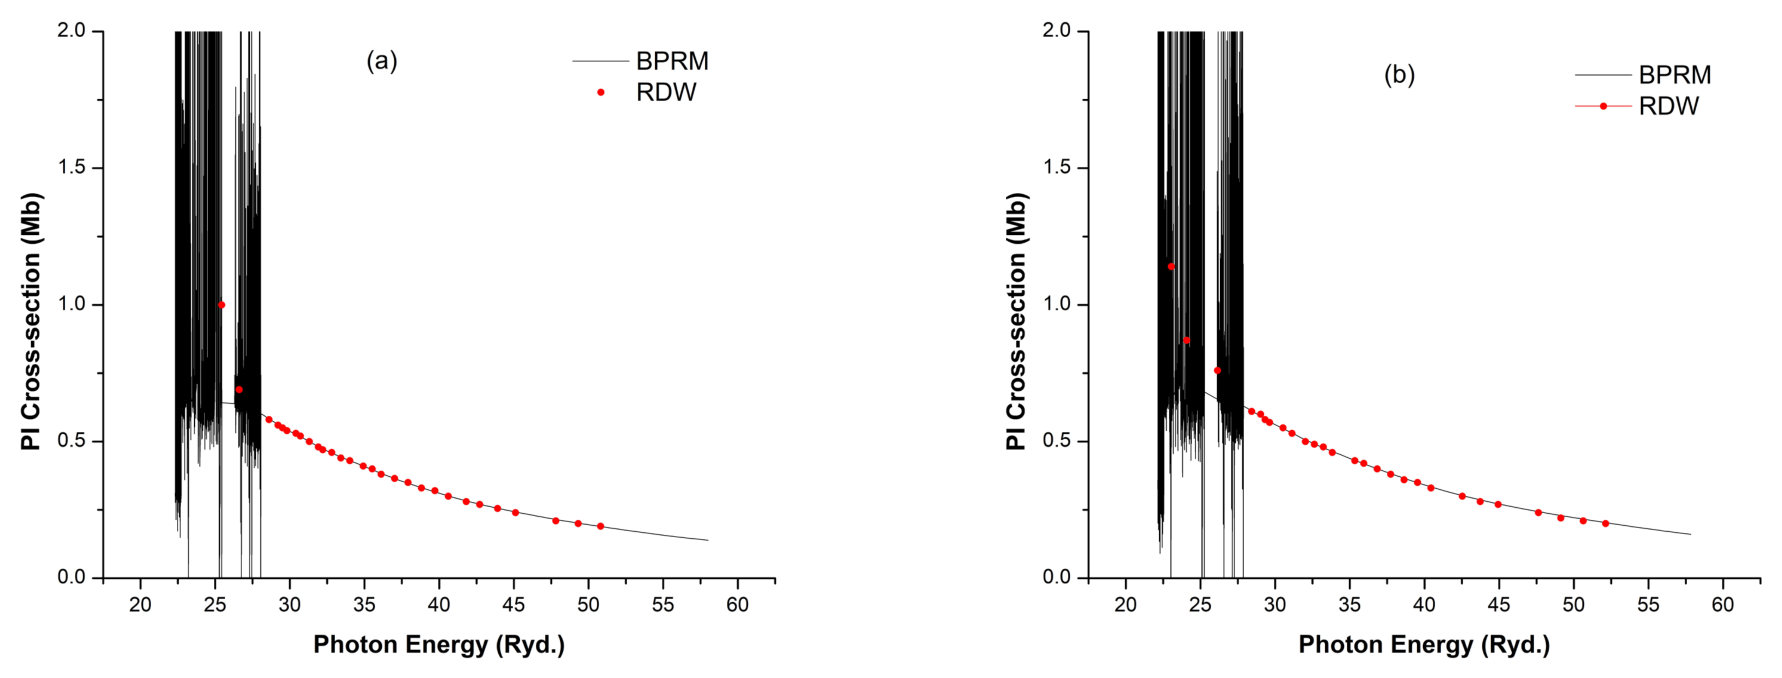
Figure 6.
Photoionization cross section for the ground state of Fe XVI
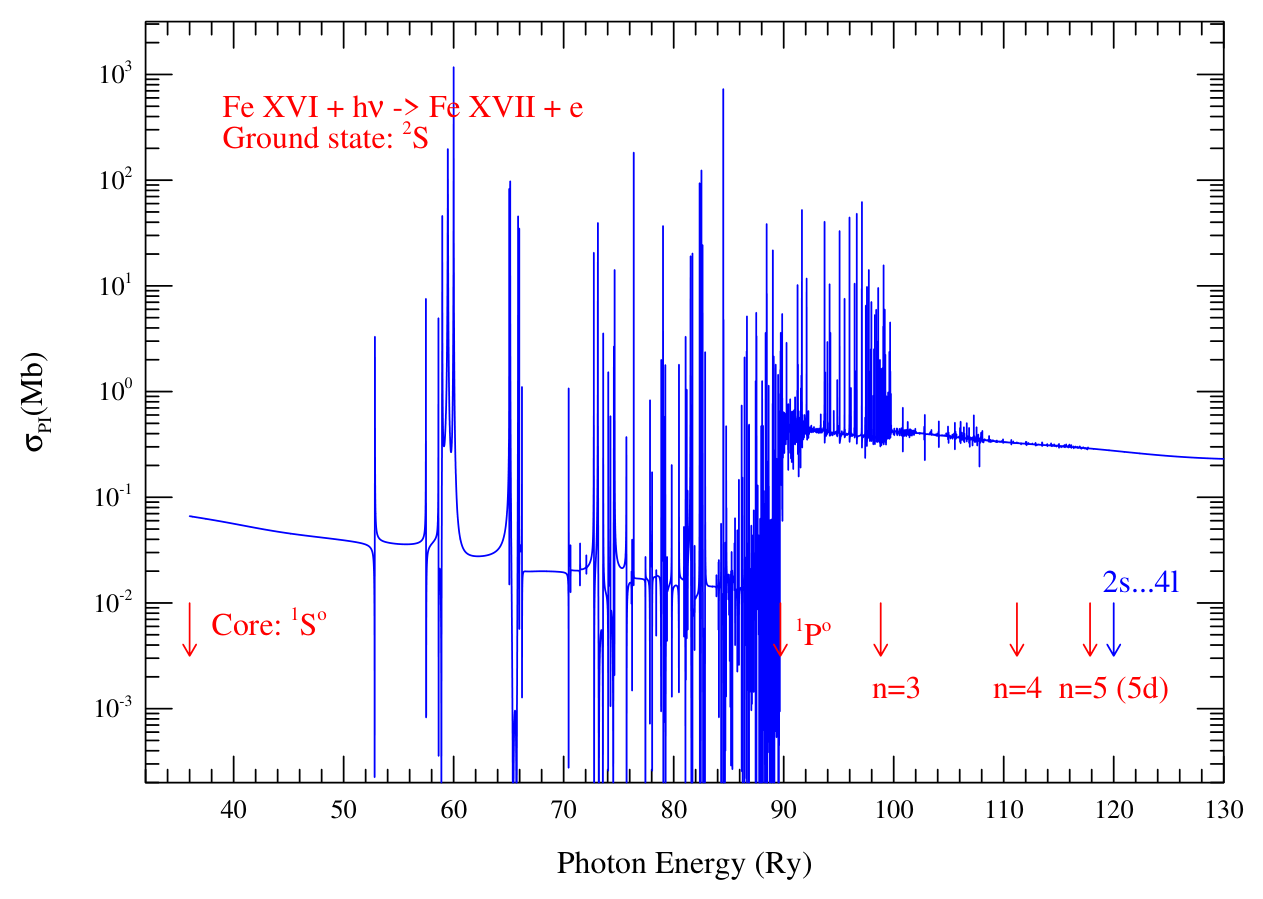
Figure 7.
Unified (e + ion) recombination rate coefficients for Ar XVII,
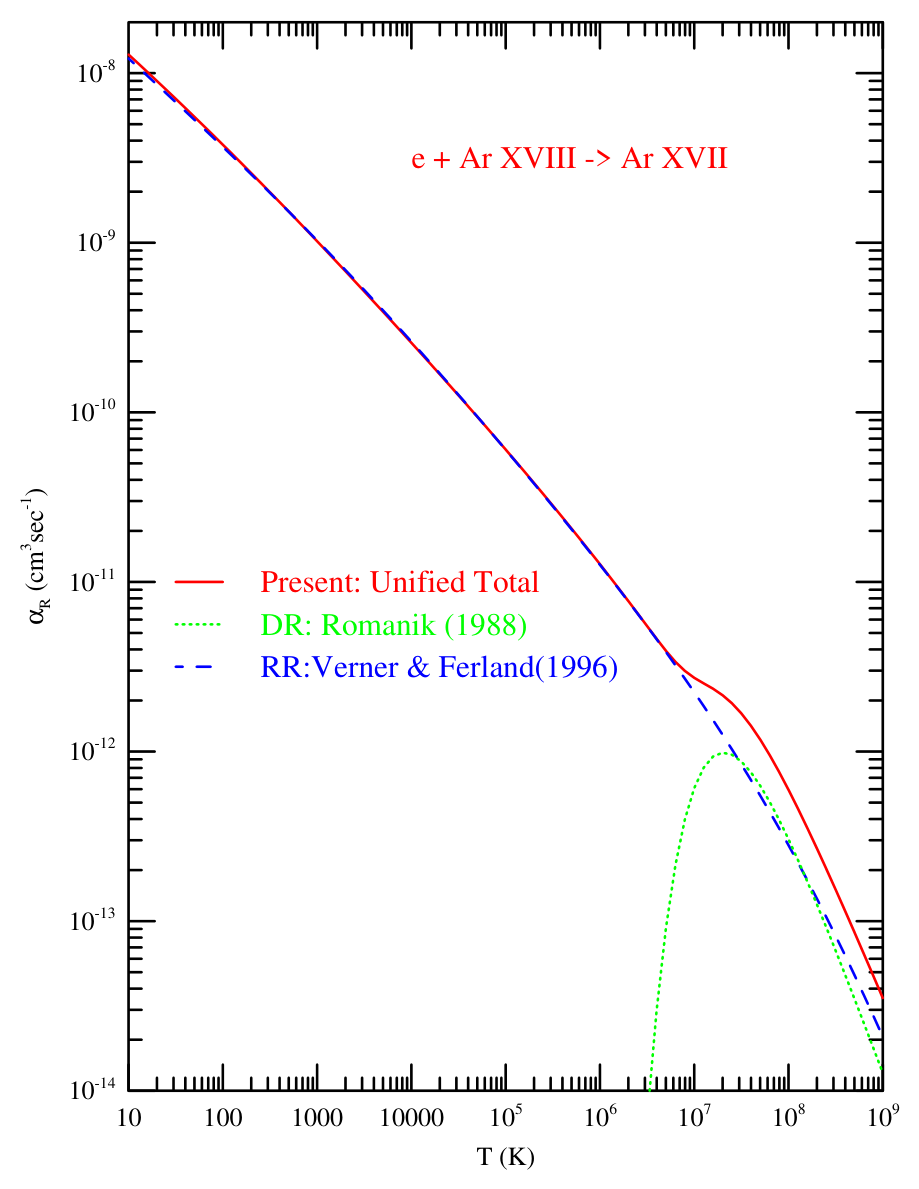
Figure 8.
(a) Mn iii forbidden-line emissivity ratio as a function of electron density at , 5000, , , , and K. The ratio corresponds to the (8200 Å) and (8068 Å) transitions, which share the common lower level . (b) Collision strength for the transition as a function of electron energy E (Ry). (c) Collision strength for the transition as a function of electron energy E (Ry).
Figure 8.
(a) Mn iii forbidden-line emissivity ratio as a function of electron density at , 5000, , , , and K. The ratio corresponds to the (8200 Å) and (8068 Å) transitions, which share the common lower level . (b) Collision strength for the transition as a function of electron energy E (Ry). (c) Collision strength for the transition as a function of electron energy E (Ry).
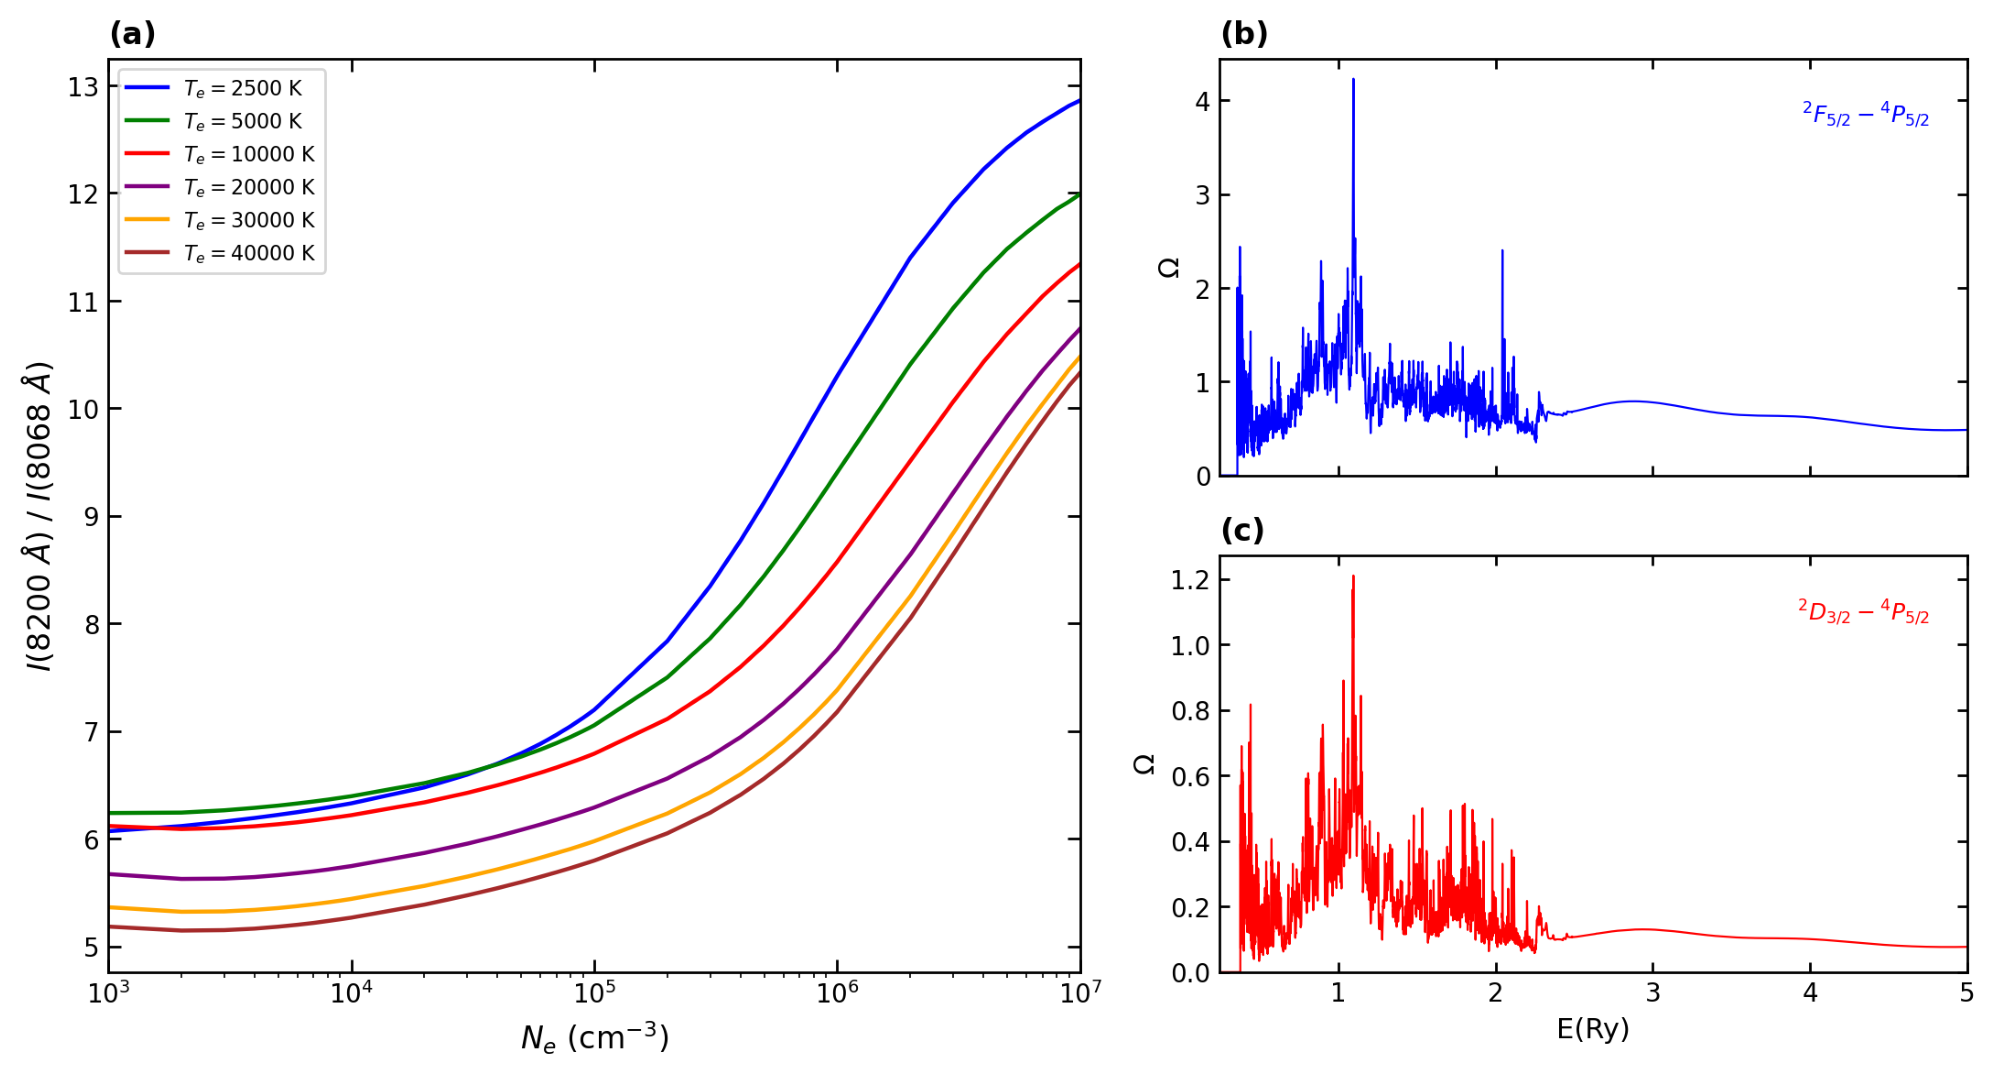
Figure 9.
Collision strengths for transitions in P III calculated using the Breit-Pauli R -matrix method. In the high energy region above all target thresholds the Coulomb-Bethe approximation is employed to ensure the behaviour characteristic of dipole allowed E1 transitions.
Figure 9.
Collision strengths for transitions in P III calculated using the Breit-Pauli R -matrix method. In the high energy region above all target thresholds the Coulomb-Bethe approximation is employed to ensure the behaviour characteristic of dipole allowed E1 transitions.
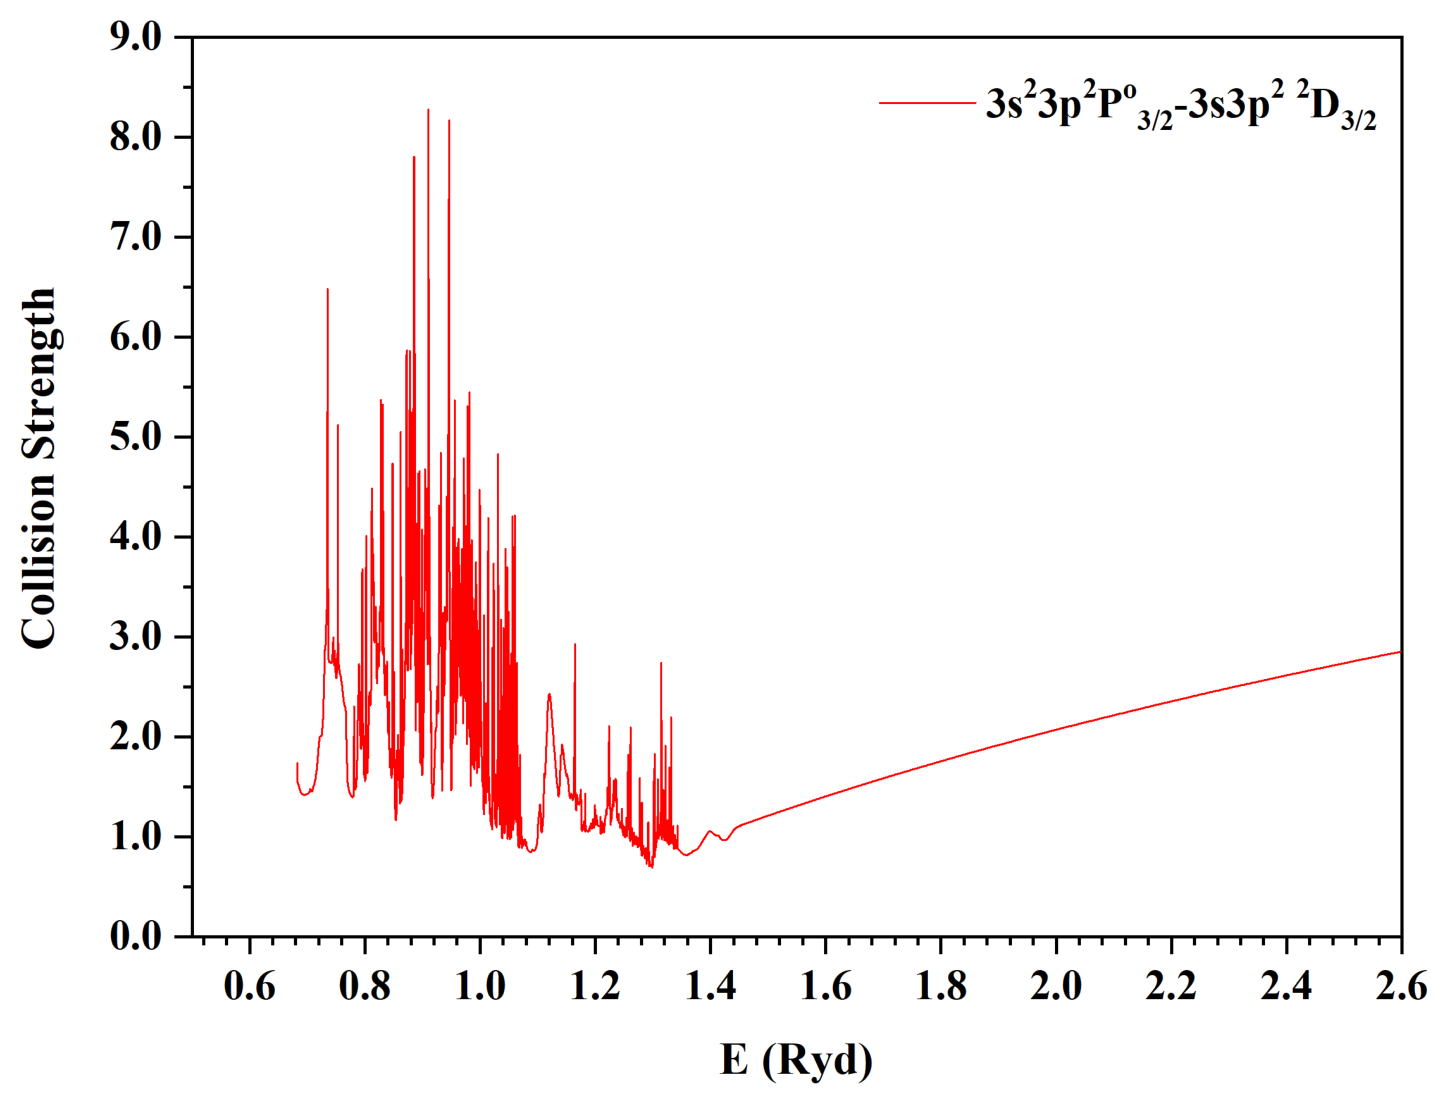
Figure 10.
PR cross section of the ground state of plasma-embedded Fe XXV ion using RDW approach
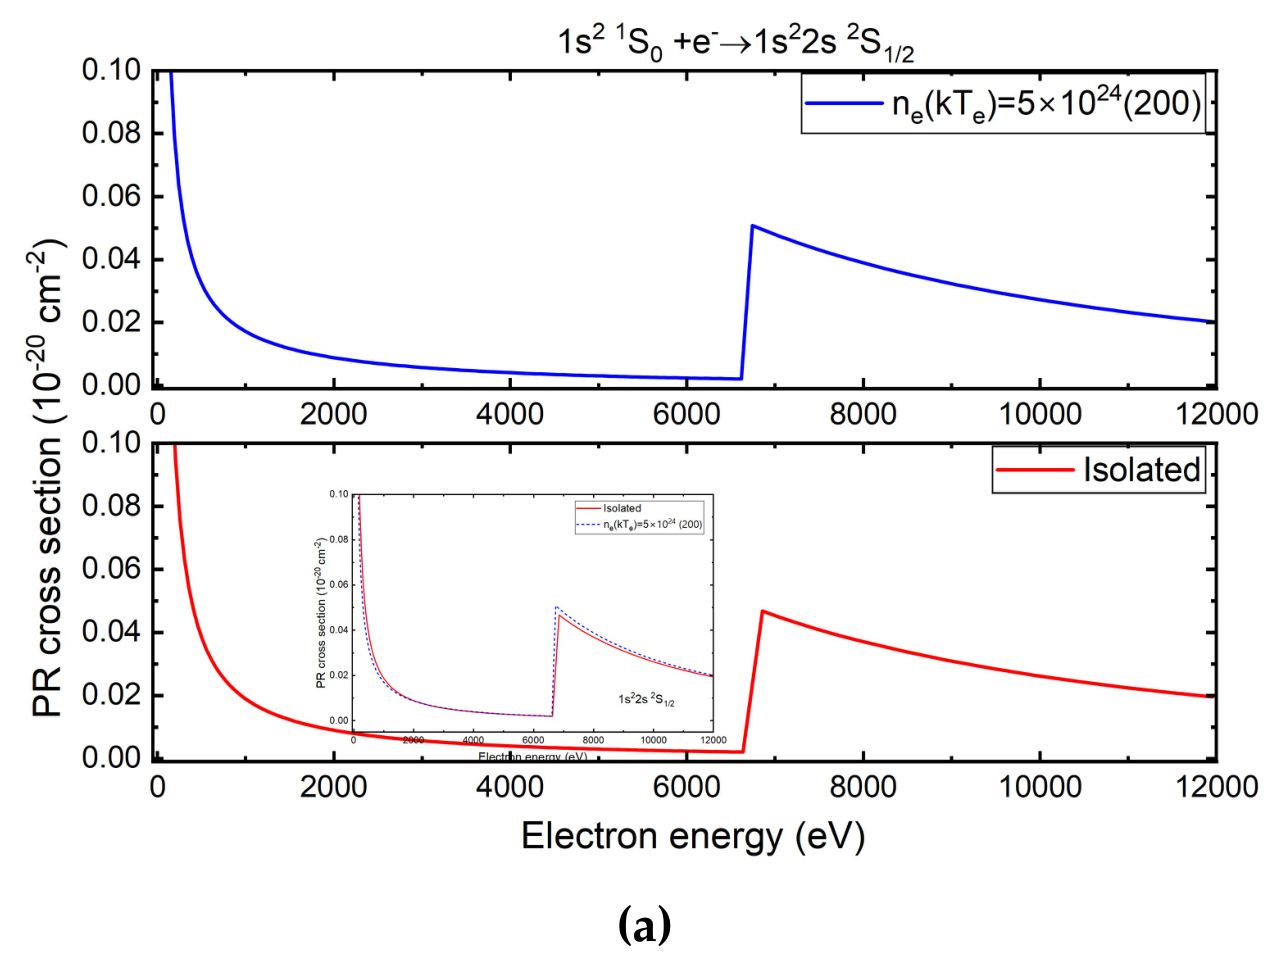
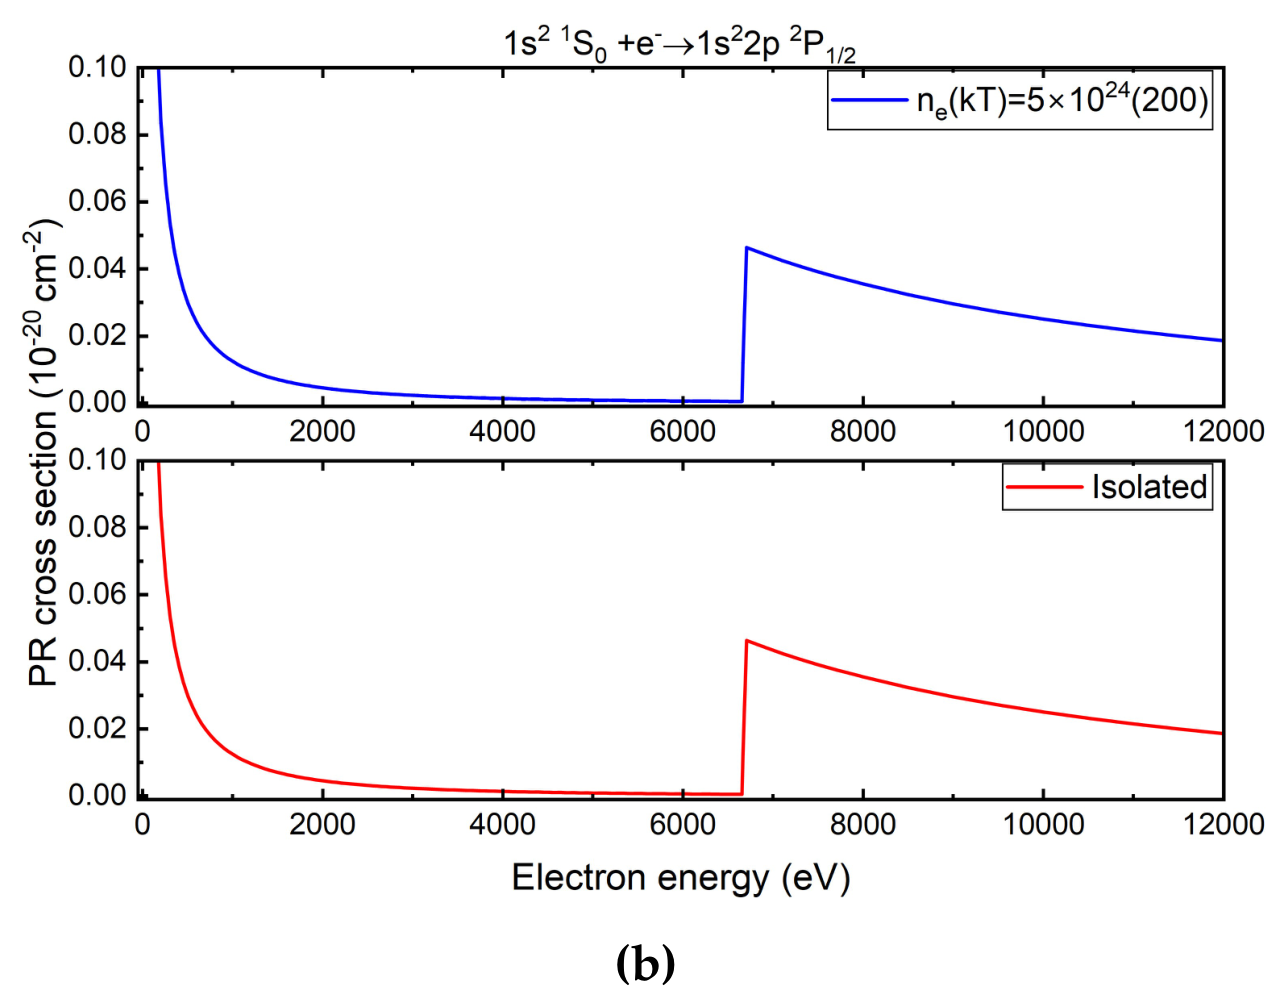
Figure 11.
Plasma broadening of the O VI and O VII photoionization cross section as a function of electron density at K. (a) O VI; (b) O VII. Gray curves show the unbroadened cross section; red curves show the broadened cross section. Each panel stack spans up to the density at which resonance structure is fully washed out.
Figure 11.
Plasma broadening of the O VI and O VII photoionization cross section as a function of electron density at K. (a) O VI; (b) O VII. Gray curves show the unbroadened cross section; red curves show the broadened cross section. Each panel stack spans up to the density at which resonance structure is fully washed out.
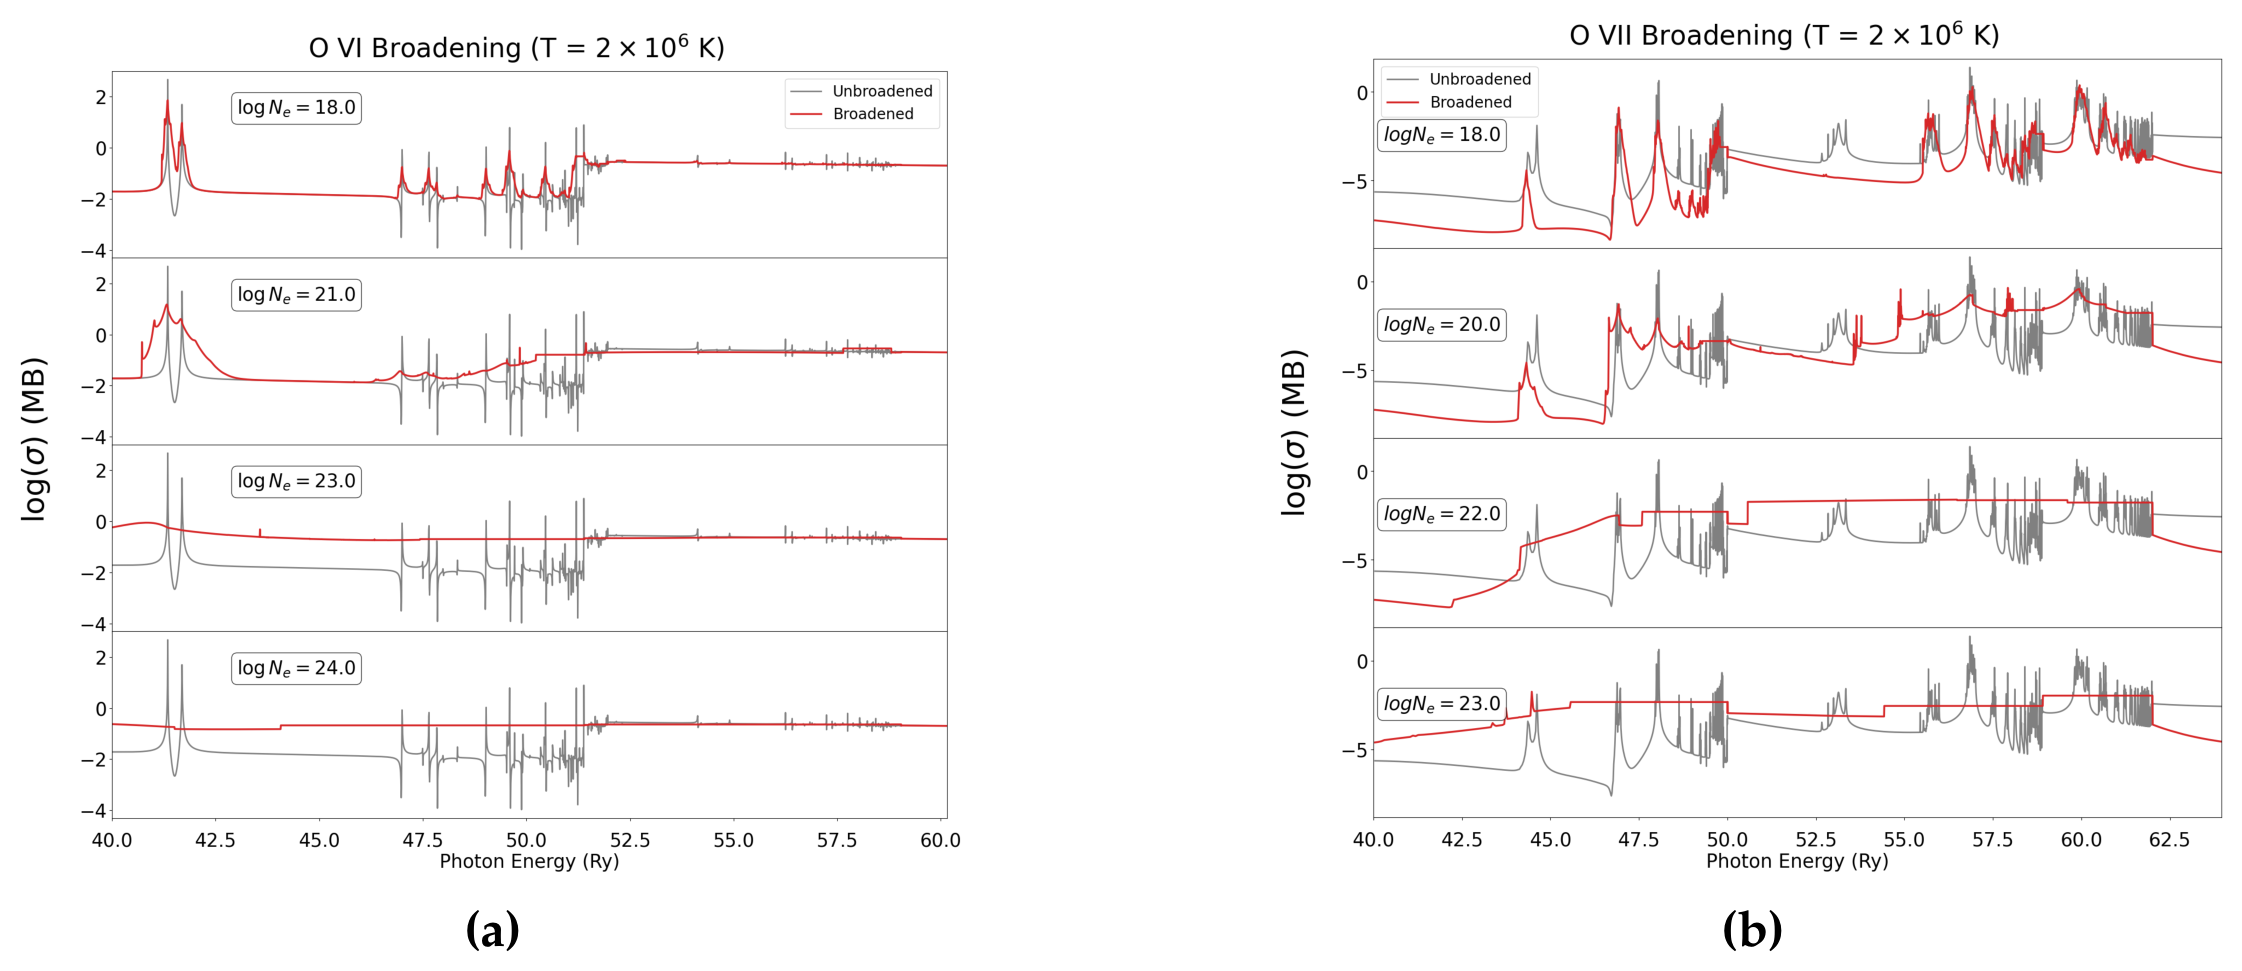
Figure 12.
Collision strengths calculated using the RDW approach for the transitions (a) and (b) of He-like Fe XXV ion.
Figure 12.
Collision strengths calculated using the RDW approach for the transitions (a) and (b) of He-like Fe XXV ion.
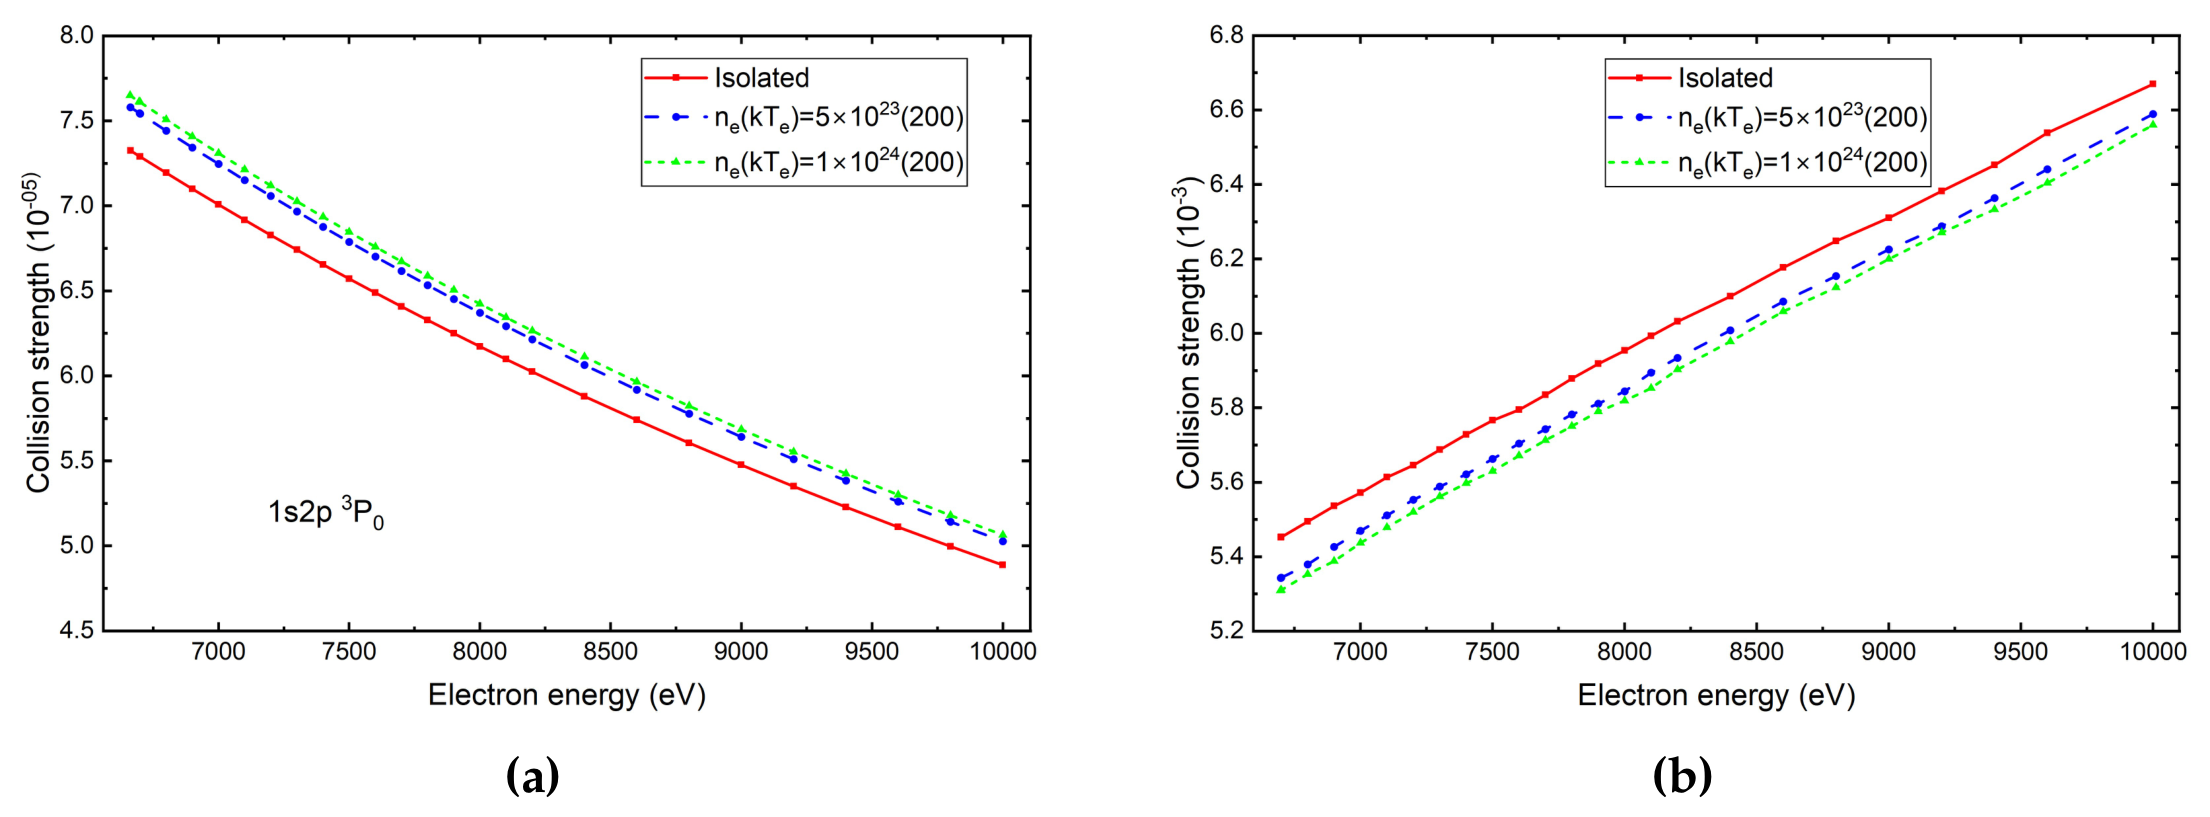
Figure 13.
Left (a): Density-dependent line ratios of and modeled at electron temperatures of and using the SPECTRA code. Right (b):Electron temperature-density contour grid tracking the emission line ratio.
Figure 13.
Left (a): Density-dependent line ratios of and modeled at electron temperatures of and using the SPECTRA code. Right (b):Electron temperature-density contour grid tracking the emission line ratio.
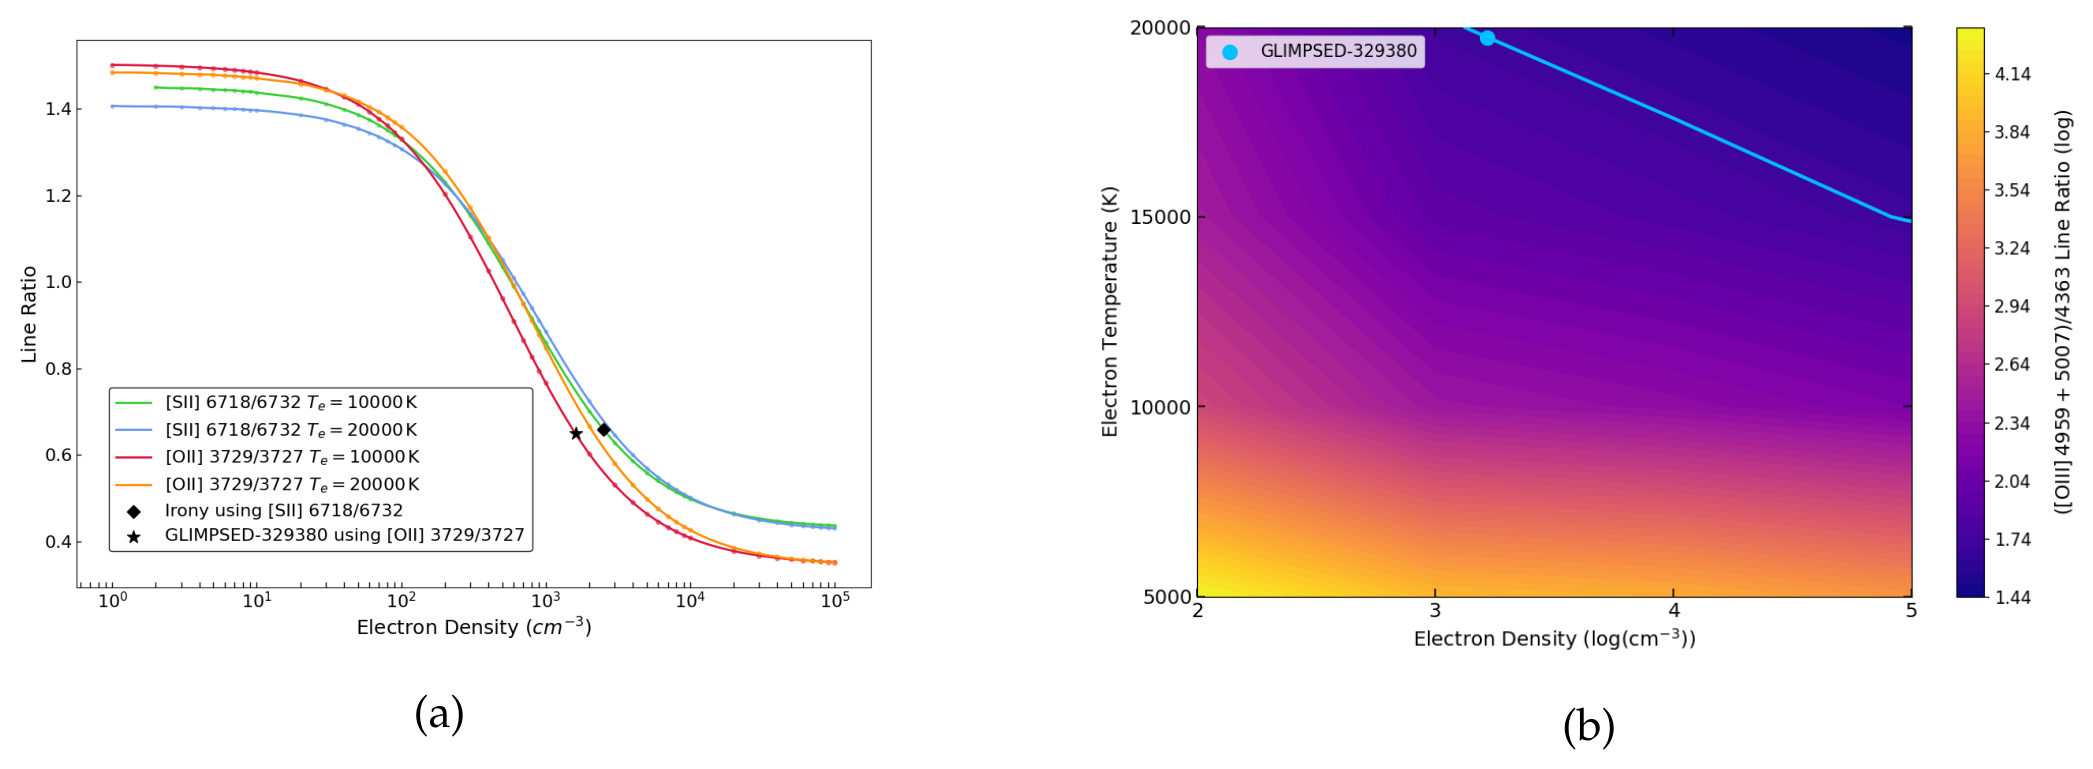
Figure 14.
(a) The electron temperature diagnostics of LRD J1025+1402(white lines) and COS-2987(black lines). Vertical lines represents the electron density diagnostics from [SII] 6718/ 6732(LRD J1025+1402) and [OII] 3729/ 3726(COS-2987). Two contours represents the [OIII] 5007/ 4363 line ratio. Their intersection locates the electron temperature of 19900K and 20100K for LRD J1025+1402 and COS-2987 respectively. (b) Oxygen Abundance evolution with redshift of 46 galaxies observed by JWST and other instruments. Galaxies oxygen abundance data represented by 44 circles and plus signs comes from [42]. LRD J1025+1402 and COS-2987 are highlighted out with arrows.
Figure 14.
(a) The electron temperature diagnostics of LRD J1025+1402(white lines) and COS-2987(black lines). Vertical lines represents the electron density diagnostics from [SII] 6718/ 6732(LRD J1025+1402) and [OII] 3729/ 3726(COS-2987). Two contours represents the [OIII] 5007/ 4363 line ratio. Their intersection locates the electron temperature of 19900K and 20100K for LRD J1025+1402 and COS-2987 respectively. (b) Oxygen Abundance evolution with redshift of 46 galaxies observed by JWST and other instruments. Galaxies oxygen abundance data represented by 44 circles and plus signs comes from [42]. LRD J1025+1402 and COS-2987 are highlighted out with arrows.
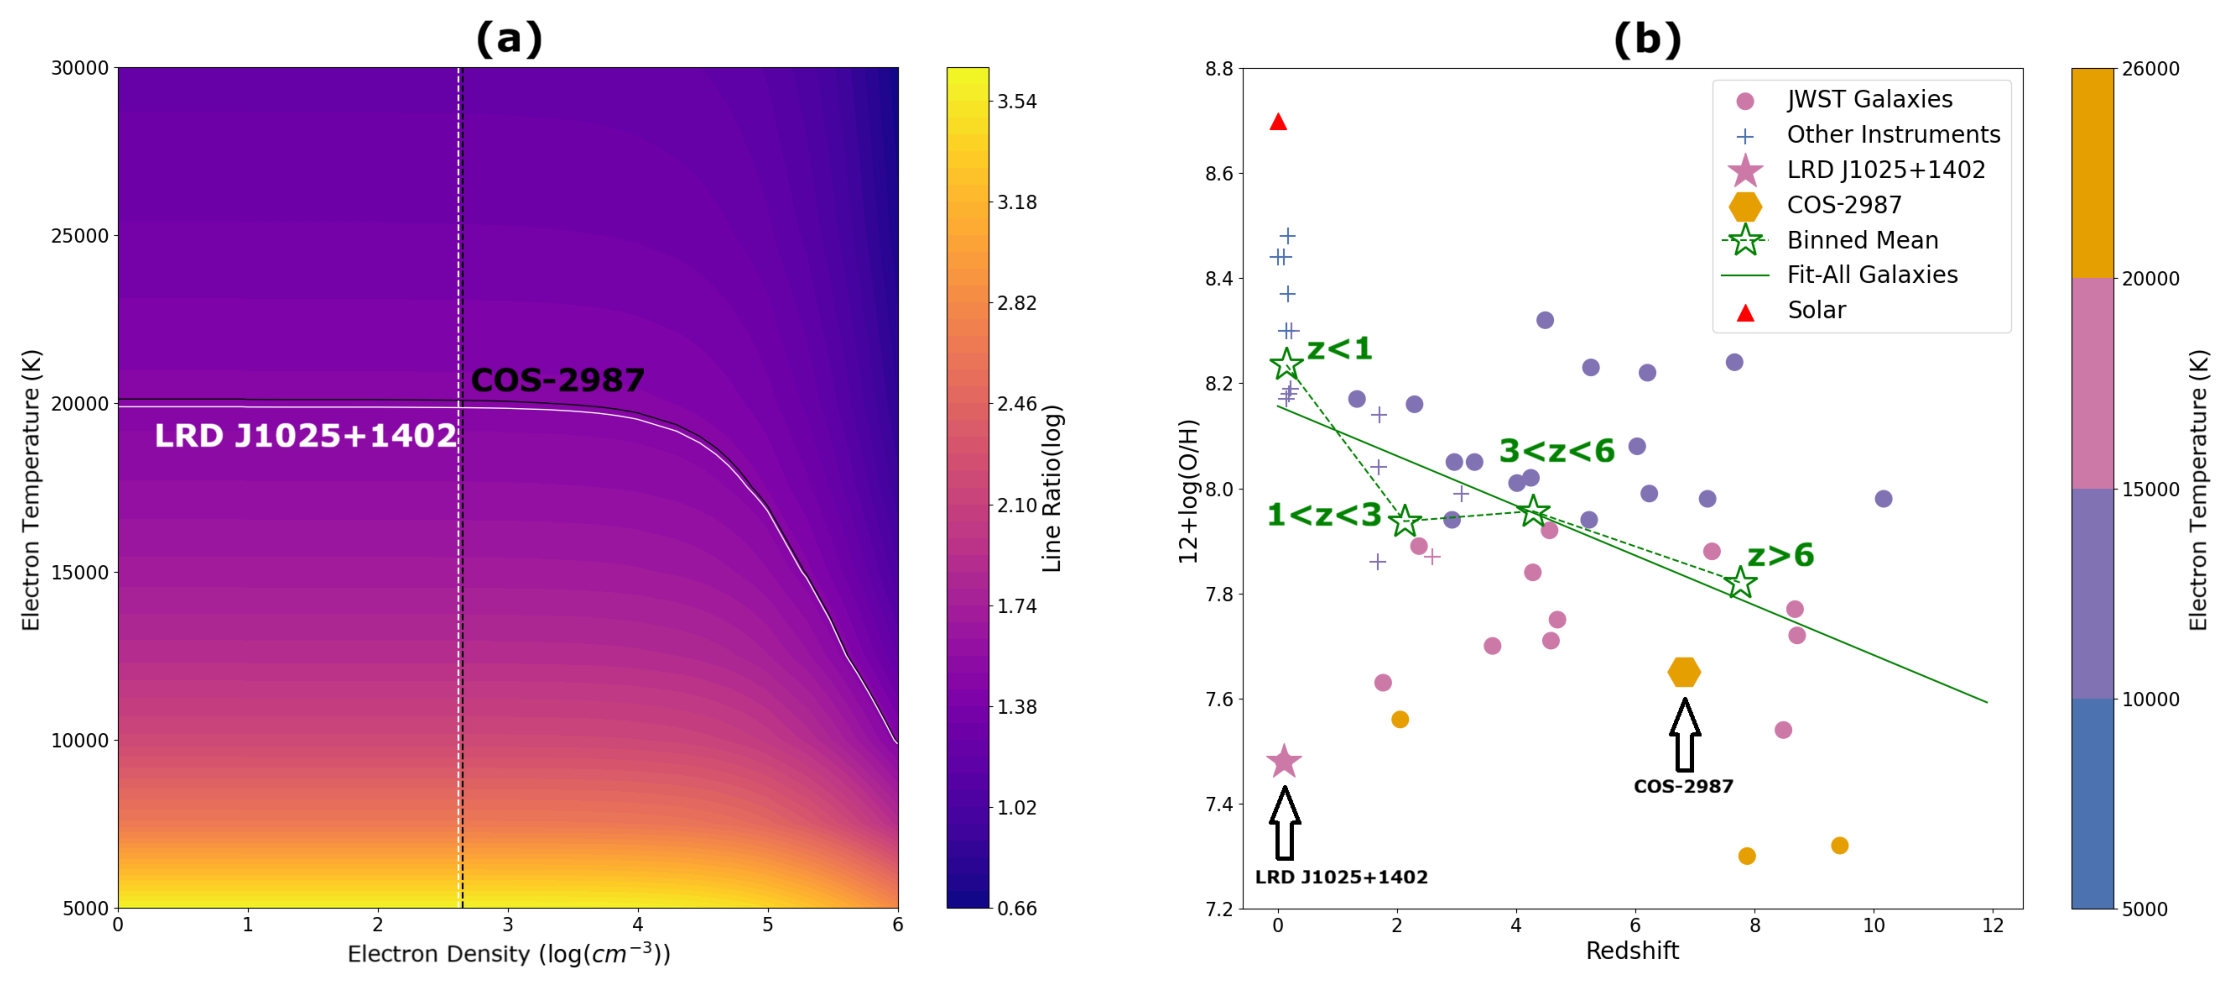
Figure 15.
(a) Five-fold cross-validated for 12+log(O/H) using the published feature set versus the extension, for the same three algorithms as [42]. (b) Predicted vs. observed abundance for the Ridge model under shuffled 5-fold CV (), colored by redshift; dashed line is 1:1.
Figure 15.
(a) Five-fold cross-validated for 12+log(O/H) using the published feature set versus the extension, for the same three algorithms as [42]. (b) Predicted vs. observed abundance for the Ridge model under shuffled 5-fold CV (), colored by redshift; dashed line is 1:1.
Disclaimer/Publisher’s Note: The statements, opinions and data contained in all publications are solely those of the individual author(s) and contributor(s) and not of MDPI and/or the editor(s). MDPI and/or the editor(s) disclaim responsibility for any injury to people or property resulting from any ideas, methods, instructions or products referred to in the content. |
© 2026 by the authors. Licensee MDPI, Basel, Switzerland. This article is an open access article distributed under the terms and conditions of the Creative Commons Attribution (CC BY) license (http://creativecommons.org/licenses/by/4.0/).
Copyright: This open access article is published under a Creative Commons CC BY 4.0 license, which permit the free download, distribution, and reuse, provided that the author and preprint are cited in any reuse.