

Submitted:
16 August 2026
Posted:
18 August 2026
You are already at the latest version
Abstract
Retatrutide, an investigational GIP/GLP-1/glucagon receptor agonist delivered up to 28.3% mean weight reduction in the Phase 3 TRIUMPH programs, but it has not yet received FDA approval. Using a federated U.S. EHR network of 29 million patients, we identified rapidly increasing use of non-trial products purported to contain retatrutide. LLM-aided adjudication of de-identified EHRs shows 983 patients whose clinical notes mention retatrutide, with confirmed exposure in 652 patients (66.3%), and documented supply route tracing in 531 patients (54%). Of these 531 users, 378 (71.2%) obtained purported retatrutide outside of trial participation, mostly through online or telehealth vendors (57.4%) and compounding pharmacies (29.4%). Retatrutide usage grew 1.8-fold per quarter from October 2023 through March 2026, reaching 137 new users from October–December 2025, and 228 new users from January-March 2026. Next, we conducted an analysis anchored on the retatrutide/placebo trial participants (n=89), who were nearest-neighbor matched 1:3:10:10 with compounded retatrutide (n=243), semaglutide (n=890), and tirzepatide (n=890) initiators, with matching covariates of age, race, sex, baseline BMI, diabetes status, prior incretin therapy exposure, and time since the most recent exposure. The observed weight loss among retatrutide trial participants in this routine care setting was 15.5% at 6–12 months, closely approaching the observed 16.9% mean weight loss across the retatrutide and placebo arms at 80 weeks after treatment initiation in TRIUMPH-1-4 (weighted average). Users of compounded retatrutide lost 7.2% body weight at 6-12 months, considerably less than the 15.5% observed in the retatrutide trial cohort (P=0.004) and comparable to the weight-loss achieved among matched tirzepatide users (7.7%; P=0.79). A significant increase in heart-rate was observed at 3 months for both the retatrutide trial cohort (+4.3 beats per minute [bpm], P=0.028) and the compounded retatrutide cohort (+2.5 bpm, P=0.011), which was not observed in the matched semaglutide or tirzepatide cohorts (P>0.9). The retatrutide trial cohort showed numerically higher, but not statistically significant, rates of 3-point MACE versus matched tirzepatide users (RR 1.77, 95% CI 0.19–7.94; P=0.34) and semaglutide users (RR 1.02, 95% CI 0.12–4.17; P=1.00), with similar findings for expanded MACE versus tirzepatide (RR 2.03, 95% CI 0.38–7.09; P=0.21) and semaglutide (RR 1.25, 95% CI 0.24–4.07; P=0.73). Furthermore, new-onset symptom burden was significantly elevated for the pooled retatrutide cohort (trial and compounded users combined) compared to both semaglutide and tirzepatide comparators, including higher-risk of cardiovascular symptoms (RR 1.56 [1.26-1.92], q<0.001) and neuropsychiatric symptoms (RR 1.95 [1.61-2.36], q<0.001). Taken together, accelerating gray-market retatrutide use is associated with less than half the trial-level weight loss while retaining retatrutide’s characteristic heart-rate rise and elevated cardiovascular symptom burden, underscoring the need for heightened clinical awareness and real-time real-world evidence to identify emerging risks before regulatory approval.
Keywords:
retatrutide
; semaglutide
; tirzepatide
Introduction
Obesity now affects 40.3% of United States adults, and without intervention an estimated 213 million adults will be overweight or obese by 20501. Incretin-based therapy has transformed the treatment landscape across a decade of escalating efficacy: liraglutide 3.0 mg produced 8.0% mean weight reduction over 56 weeks2, semaglutide 2.4 mg produced 14.9% over 68 weeks3, tirzepatide 15 mg produced 20.9% over 72 weeks4, and semaglutide reduced Major Adverse Cardiovascular Events (MACE) by 20% in adults with obesity and established cardiovascular disease5. Real-world delivery has not kept pace with the trials: one-year weight reduction in clinical practice runs well below trial benchmarks, largely because cost, coverage denials, and side effects drive early discontinuation6,7. Demand has therefore outrun both supply and insurance coverage, manufacturers have opened direct-to-consumer telehealth channels of their own8, and a large secondary market of compounded, counterfeit, and research-chemical incretins has grown in the gap: the United States Food and Drug Administration (FDA) declared the tirzepatide shortage resolved in December 2024 and the semaglutide shortage in February 2025, ending the legal basis for mass compounding, yet online sellers continue to ship incretin products without prescriptions, at unverified concentrations and with documented contamination9,10).
Retatrutide is the leading edge of this collision. A single peptide with agonist activity at the GIP, GLP-1, and glucagon receptors, it produced 24.2% mean weight reduction at 48 weeks in its phase 2 obesity trial, the largest reduction reported for any anti-obesity medication at that time11, parallel glycemic efficacy in type 2 diabetes12, and greater than 80% relative reduction of hepatic fat in metabolic dysfunction-associated steatotic liver disease13. The phase 3 TRIUMPH-1 topline, announced in May 2026, reported mean weight reductions of up to 28.3% at 80 weeks, and the first phase 3 type 2 diabetes results were published in June 202614. Retatrutide is approved in no jurisdiction, has no legal supply outside its trials, and carries a known pharmacodynamic liability: a dose-dependent heart-rate increase that peaked near 24 weeks in phase 2 before declining, a class effect that meta-analysis places at a mean of +3.5 bpm for retatrutide against placebo and that reflects direct GLP-1 receptor action on sinoatrial pacemaker cells15,16.
Anticipatory demand for an unapproved drug is a new surveillance problem. Compounded and gray-market semaglutide left a partial trail: poison-center exposures to GLP-1 receptor agonists (GLP-1 RA) more than doubled after the weight-loss approvals17, compounded products carry disproportionately more reported dosing errors and adverse events than branded ones18, and documentation of compounded GLP-1 RA use has been reported in primary-care records19. Retatrutide use leaves no such trail: with no approved product there is no National Drug Code, no pharmacy claim, and no structured prescription record anywhere in the health system. Every documented fact about who is taking it, where they obtained it, at what dose, and with what consequence exists only in the free text of clinical notes, recorded when a patient tells a clinician. The World Health Organization has already issued alerts for falsified semaglutide; no comparable visibility exists for a peptide that patients obtain from online vendors and wellness clinics before any regulator has reviewed it. Nor will retatrutide be the last such drug: coadministered cagrilintide-semaglutide and the oral agonist orforglipron have both reported pivotal results20,21, and each will spend years between headline efficacy and approved supply.
LLMs make the free text of the clinical record tractable at scale, and LLM extraction over EHR notes has previously been validated for symptom and phenotype curation22. Applied to an unapproved drug, the same machinery becomes a pharmacovigilance instrument: it can find the exposed patients, date their exposure, classify their supply route, and compare their outcomes against matched users of approved comparators, all before the drug exists on any formulary.
We applied this framework to retatrutide. From a de-identified federated EHR network, we identified every patient whose record mentions the drug, adjudicated exposure with an LLM over full note text, derived each user's start date, supply route, and reason for use, and matched the two retatrutide populations (trial participants and direct-to-consumer users) against new initiators of semaglutide and tirzepatide on seven baseline covariates. We then compared weight trajectories, heart rate and blood pressure, new-onset symptom burden across 16 clinical categories with a prespecified negative control, and MACE. The trial arm doubles as a positive control: if the framework is sound, patients receiving the drug under protocol should reproduce the trial's published effect, and the direct-to-consumer arm can then be read against that internal benchmark.
Methods
Study Design and Data Source
We conducted a retrospective observational study of de-identified EHR data accessed through the nference federated system. The study population comprised every patient with any mention of retatrutide in clinical notes or medication records through August 2026. Because retatrutide has no approved product, it has no National Drug Code and no structured prescription record; exposure ascertainment therefore proceeded from clinical text. The complete clinical note history of every patient with a retatrutide mention was retrieved for adjudication.
Exposure Adjudication from Clinical Notes
A large language model adjudicated each patient's full note text to determine whether the patient actually took retatrutide, distinguishing confirmed exposure from discussion without use, family or acquaintance use, and unclear documentation. Whole notes rather than keyword windows were provided as context, because procurement and exposure details frequently appear in medication lists, social history, and plan sections distant from the drug name. Two further extraction passes captured the supply route and compounded-product detail, and the reason for use or non-use. The auditable LLM-curation methodology, including its validation against prescription records for incretin initiation, persistence, and compounded use, has been described previously23. Model configuration and the full text of every extraction prompt are reported separately (see Supplementary Materials). Each patient's index date was defined as the earliest note confirming exposure. Where the record stated an explicit start date or interpretable start phrase, start-date phrases captured by the extraction were resolved to calendar dates (214 of 652 confirmed users, 32.8%), and the index date was re-anchored to the resolved start; the note-anchored date was retained otherwise. All downstream analyses used the resolved index dates.
Accuracy of the language model extractions was assessed by manual review at one participating site. For each of three core extraction tasks (retatrutide exposure, supply route, and reported treatment start date) items were sampled at random, stratified by the value the model had assigned, so that class-specific accuracy could be estimated for classes that are uncommon in the full cohort. Exposure and start-date items were sampled at the level of the individual note; supply route was sampled at the patient level, because that classification is derived from all of a patient's notes. A clinician reviewer, presented with the relevant excerpt of the source note alongside the extracted value, recorded each extraction as correct, incorrect, or indeterminate. Agreement was calculated within each predicted class and combined across classes by weighting according to class prevalence in the full cohort, with Wilson score confidence intervals.
Supply Route and Cohort Assignment
The supply route was classified from documented statements into direct-to-consumer acquisition (online or telehealth vendors, compounding pharmacies, wellness or medical-spa clinics, peptide vendors, friends or family, over-the-counter retail, or acquisition abroad), clinical trial supply, or other. Where the first extraction left the route unresolved, a second pass classified structural cues (for example, a drug listed under patient-reported rather than dispensed medications) and telehealth, medical-spa, etc.; Patients with trial supply formed the trial cohort and patients on any non-prescription route formed the direct-to-consumer cohort. Trial participants were randomized within their trials and remained blinded.
Matched Comparator Cohorts
Comparator pools comprised 521,208 semaglutide and 375,156 tirzepatide initiators. To align calendar time and exposure with the retatrutide population, candidate comparators were restricted to persistent users (at least two records spanning at least 30 days) whose first qualifying prescription fell in 2025. Greedy nearest-neighbor matching without replacement was performed on a joint standardized distance over seven covariates: age, sex, race, body mass index (BMI), type 2 diabetes mellitus (T2DM), prior semaglutide or tirzepatide exposure, and days since the most recent prior exposure. The trial cohort anchored the match at a 1:3:10:10 ratio, yielding 89 clinical trial, 243 direct-to-consumer, 890 semaglutide, and 890 tirzepatide patients. Standardized mean differences (SMD) were computed for all covariates before and after matching.
Weight and Vital-Sign Trajectories
Body weight, heart rate, and blood pressure measurements were pooled per patient within windows centered 12, 9, 6, and 3 months before index and 3 months, 6 months, and 6 to 12 months after index, taking the within-window median to suppress single-reading noise. Each patient's baseline was the median over a zone from 45 days before to 14 days after index, and change was computed within patient before averaging, so every trajectory point is a paired estimate. Follow-up was censored at a switch to another incretin agent. Percent weight change was compared across arms with two-sided Welch t-tests at each post-index window; vital-sign changes were tested within arm by paired t-test and across arms by Welch t-test at the 3-month window, where the phase 2 heart-rate effect is maximal.
New-Onset Symptom Outcomes from Clinical Notes
A retrieval net of 183 substrings across 14 symptom groups, built from the incretin class labels and the retatrutide trial safety profile, retrieved note fragments from 365 days before index onward for all four arms (Supplementary Table 1). The language model classified each fragment's symptom, status (active, new-onset, worsening, denied, resolved, ruled out, or family history), and clinical category. Categories were grouped into 16 clinical categories for display. The endpoint was incident mention: the first post-index mention of a symptom the patient had no pre-index mention of, with the washout applied per symptom rather than per category. The risk set was all patients; person-time ran from index to the patient's last note, with switch censoring. Rates were compared as events per person-time with exact Poisson confidence intervals by conditional-binomial inversion and two-sided exact conditional binomial tests. Benjamini-Hochberg (BH) correction was applied within each comparison family of 16 categories, and q-values are reported for all corrected endpoints. A negative-control category comprised 108 benign or structural findings with no plausible mechanistic link to incretin exposure: benign skin lesions (nevi, seborrheic keratoses, cherry angiomas, skin tags), benign imaging findings (diverticulosis, renal and hepatic cysts, lipomas, granulomas), anatomic and inherited variants (bicuspid aortic valve, horseshoe kidney, sickle cell trait), and routine screening findings (dense breast tissue, colonic polyps). The negative control was excluded from BH correction and is reported with raw P-values.
Major Adverse Cardiovascular Events
The primary MACE analysis used structured diagnosis codes alone. Two composites were prespecified: 3-point MACE (myocardial infarction, stroke, or cardiovascular death) and expanded MACE (adding heart failure). Myocardial infarction, stroke, and heart failure were determined through structured ICD codes and follow-up ran to death or the data cutoff. Rate ratios, exact Poisson confidence intervals, and exact conditional binomial tests were computed as for the symptom endpoints, with no multiplicity correction across the two prespecified composites. Within each retatrutide cohort, 3-month heart-rate and weight changes of patients with versus without a post-index event were compared by two-sided Welch t-test.
Statistical Analysis
Effect estimates are reported with 95% confidence intervals (CI), event counts per arm, and the significance measure shown in the corresponding figure: q-values where BH correction applied (symptom categories) and raw two-sided P-values otherwise (weight, vitals, MACE, and negative controls). Significance markers in figures denote q<0.05, q<0.01, and q<0.001 for BH-corrected panels and the corresponding P-value thresholds elsewhere; error bars denote 1 standard error of the mean and shaded bands the same interval around trajectory lines unless a caption states otherwise. Growth in quarterly initiation was modeled as ordinary least squares on log counts over all complete quarters and extrapolated with the fitted rate; the final observed quarter was excluded from the fit because note accrual lags the calendar and its count is a floor. Analyses used exact tests throughout because retatrutide event counts are small. Any cell with an event or patient count below 11 is reported as <11 with derived percentages suppressed, per the privacy convention adopted in this study.
Statistical Analysis Plan for Study Advancement
The analytic approach followed established pharmacoepidemiologic and biostatistical conventions throughout, and the study is reported in accordance with the STROBE and RECORD frameworks24,25. Covariate balance after matching was assessed by the SMD, with an absolute value above 0.1 indicating residual imbalance26. Continuous measures were compared by the two-sided Welch t-test27, and paired within-patient changes by the paired t-test. Event rates were compared conditional on the total event count, under which the comparison of two Poisson rates reduces to an exact binomial test28, with confidence intervals obtained by inverting the conditional binomial. Multiplicity was controlled by the Benjamini-Hochberg false-discovery-rate procedure within each prespecified comparison family29, and ascertainment bias was bounded by a prespecified negative-control outcome category30. Endpoints, comparison families, and masking rules were fixed before the outcome analyses were run; the single post hoc refinement (the third negative-control condition) is disclosed where it occurs.
Institutional Review Board Statement, Informed Consent Statement, De-Identification and HIPAA Compliance Certification
Prior to analysis, all EHR data were de-identified under an expert determination consistent with the Health Insurance Portability and Accountability Act (HIPAA) Privacy Rule (45 CFR §164.514(b)(1)). The de-identification methodology31,32 employed a multi-layered transformation approach to both structured and unstructured data fields. In structured data, direct identifiers including patient names and precise geographic locations were excluded entirely, while indirect identifiers underwent specific transformations: patient identifiers, medical record numbers, and accession numbers were replaced with one-way cryptographic hashes using confidential salts to preserve linkage across patient encounters; all dates were shifted backward by patient-specific random offsets (1 to 31 days) to preserve temporal relationships while obscuring exact event timing; ZIP codes were truncated to two-digit state-level resolution; and continuous variables including age, height, weight, and body mass index were thresholded to prevent identification of extreme values (for example, ages 89 years or older transformed to '89+' and BMI over 40 transformed to '40+'). In clinical text, an ensemble de-identification system that combines attention-based deep learning with rule-based methods achieved an estimated >99% recall for personally identifiable information (PII) detection, with detected identifiers replaced by plausible fictional surrogates. Institutional Review Board Statement and Informed Consent Statement are not applicable.
Data Harmonization
To address heterogeneity in EHR data, we harmonized clinical variables including medications, anthropometric measurements, and diagnoses to standardized concepts. For medications, we first constructed a standardized drug concept database combining the nference knowledge graph with RxNorm hierarchies to capture ingredient, brand, and dose-specific information. Medication records were matched using a hierarchical approach prioritizing RxNorm codes when available, followed by ingredient-level matching, and finally natural language processing and pattern matching on free-text medication orders when structured codes were absent. For anthropometric measurements (height, weight, body mass index), we created a unified vocabulary from SNOMED and LOINC and matched EHR measurement descriptions using standardized text matching algorithms with abbreviation expansion and synonym resolution; ambiguous mappings were resolved using OpenAI GPT-4o with summary statistics as context, followed by manual verification. For diagnoses, we developed a hierarchical disease concept database from the knowledge graph and matched EHR diagnosis records by identifying the most specific common child concept in the hierarchy.
Results
Unapproved Retatrutide Use Has Increased with Predominant Sourcing Through Direct-to-Consumer Channels
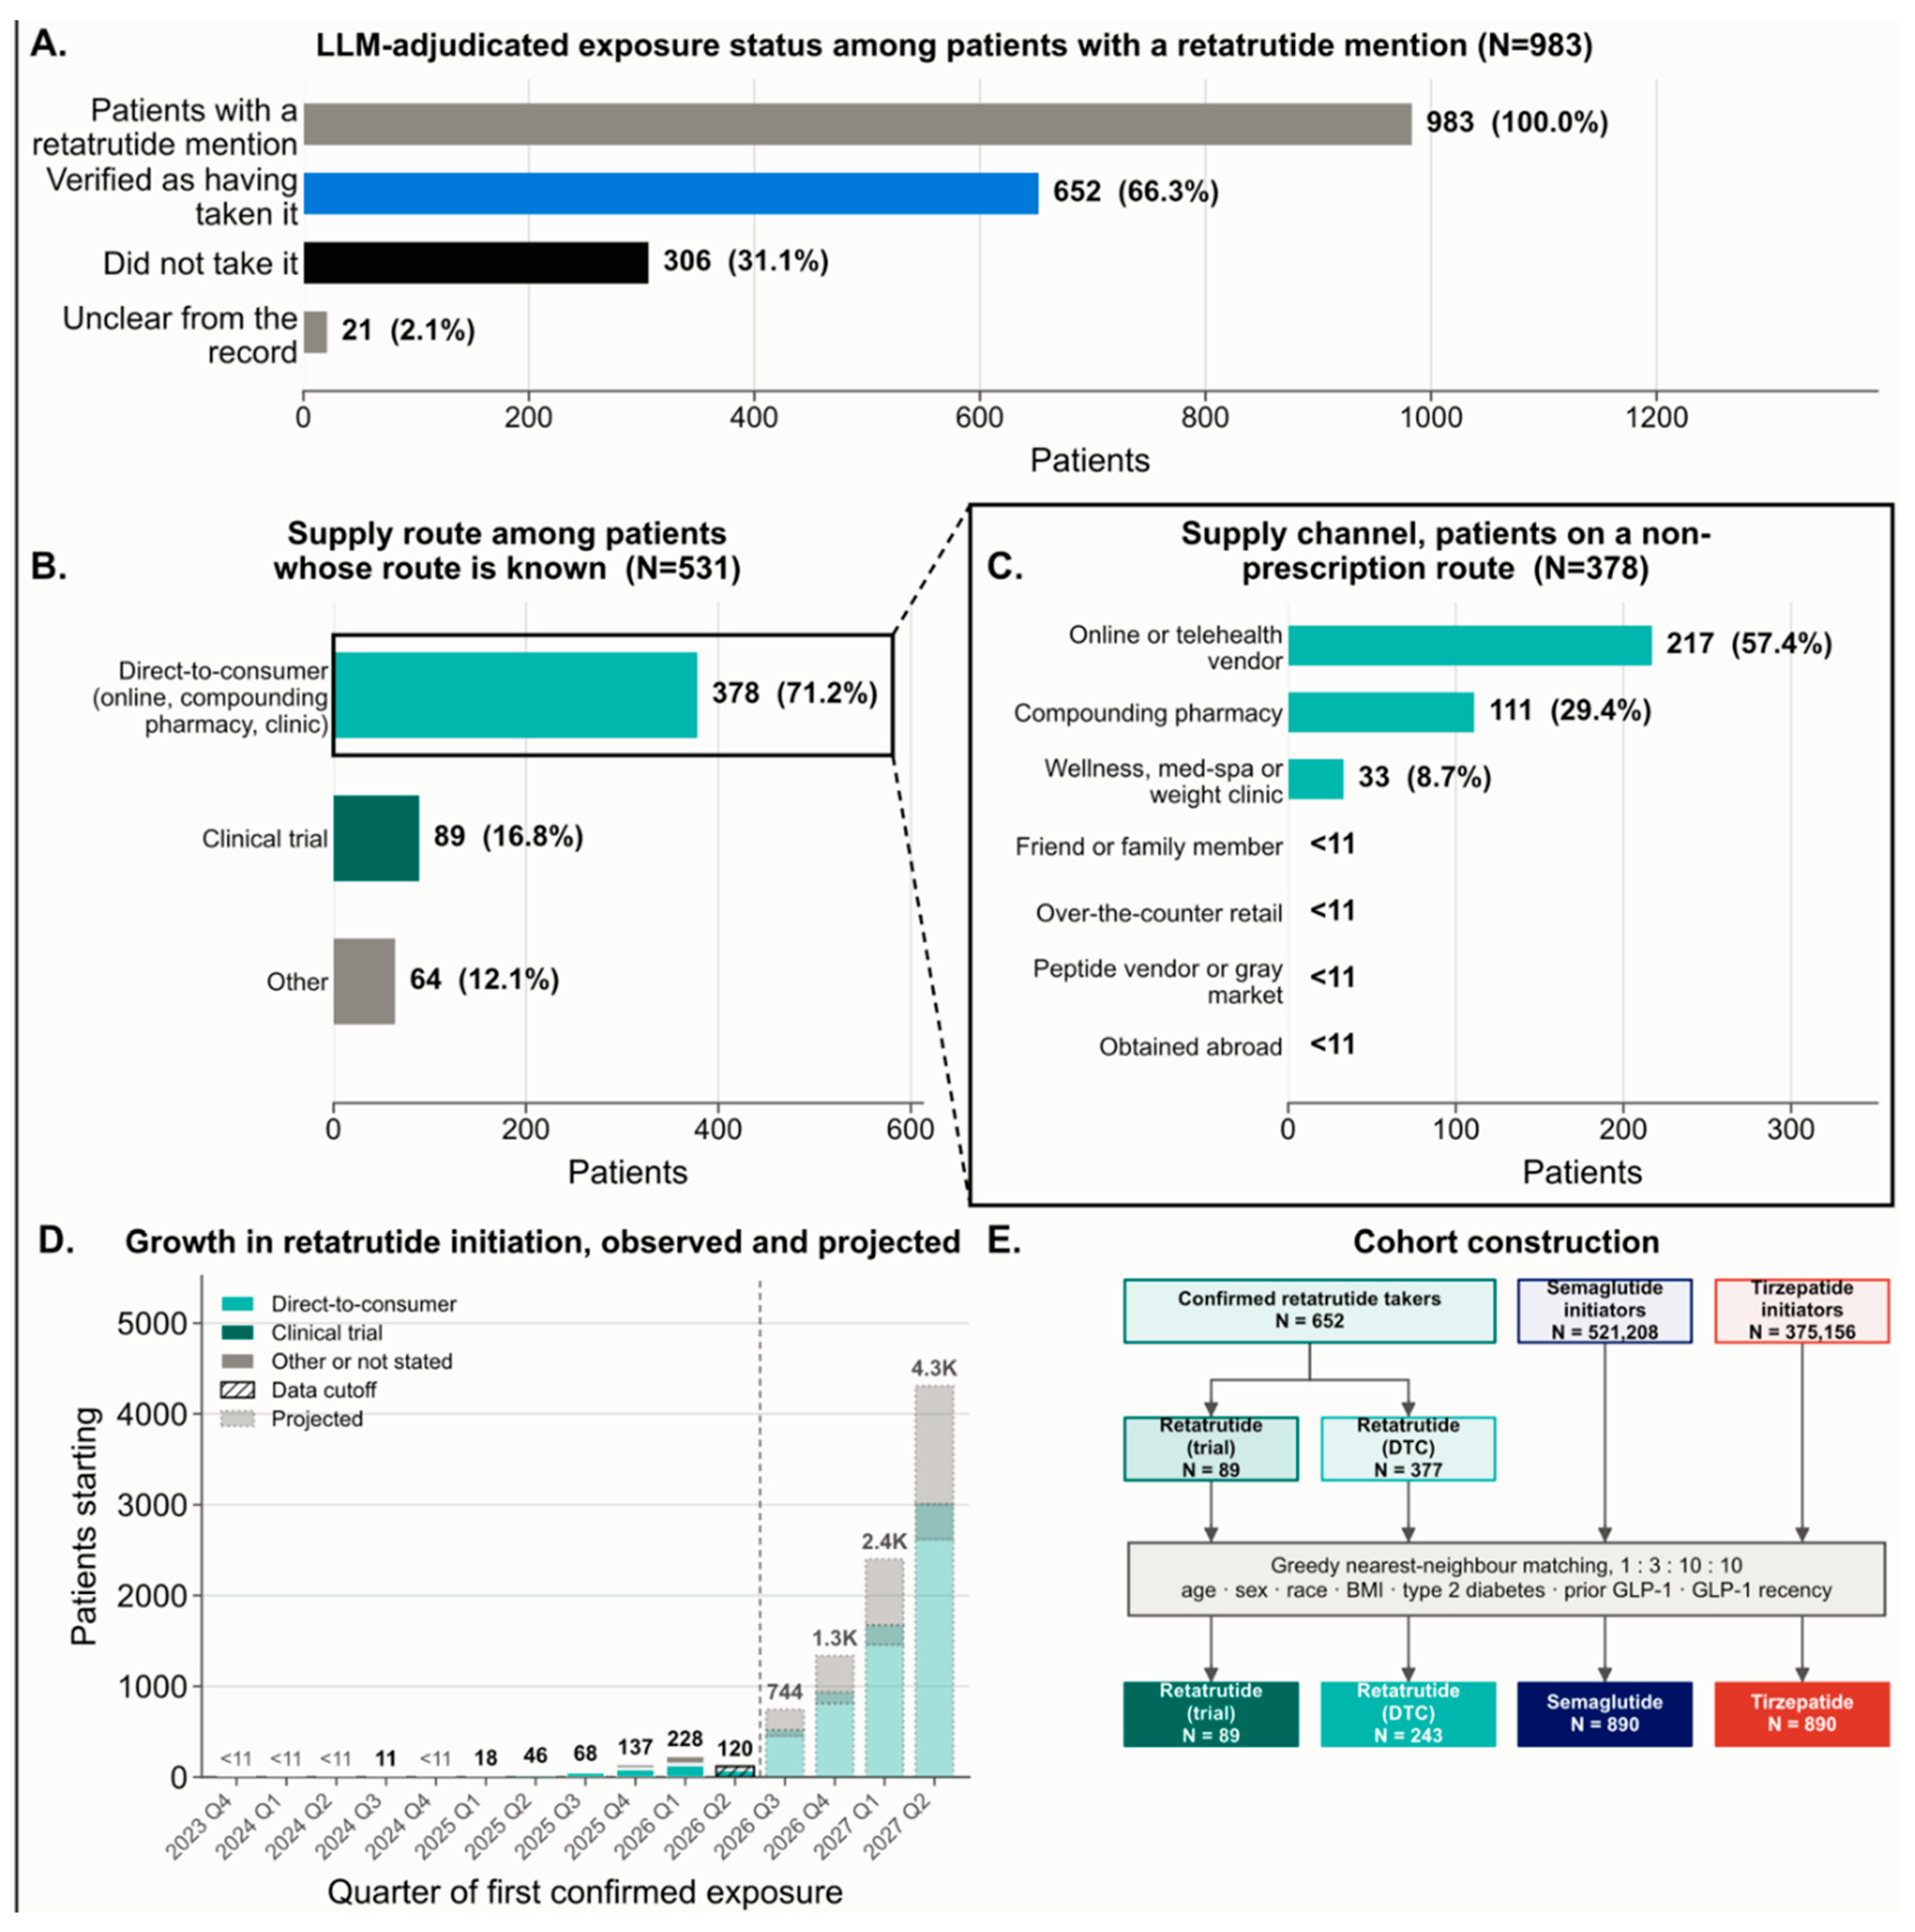
Retatrutide was mentioned in the clinical record of 983 patients. LLM adjudication of the full note history identified 652 (66.3%) with documented exposure, 306 (31.1%) who had discussed but not taken the drug, and 21 (2.1%) whose exposure was unclear (Figure 1A). A supply route was documented for 531 of the 652 users (81.4%): 378 (71.2%) obtained the drug outside any clinical trial or conventional prescription, predominantly through direct-to-consumer channels, 89 (16.8%) received blinded retatrutide or placebo as trial participants, and the remaining 64 (12.1%) reported other routes (Figure 1B). Among the 378 direct-to-consumer users, the medication was typically obtained through online or telehealth vendors supplied 217 (57.4%), compounding pharmacies 111 (29.4%), or wellness, medical-spa, or weight clinics 33 (8.7%), with peptide vendors, friends or family, over-the-counter retail, and acquisition abroad each below the reporting threshold (Figure 1C). Of note, the compounded preparations included retatrutide combined with multiple other medications including cagrilintide, high-dose tirzepatide, the unapproved peptides BPC-157 and AOD-9604, NAD+, and insulin-like growth factor 1 analogues. Some also used invented nomenclature such as GLP-3 and triple-G that have no established pharmacologic meaning. The number of retatrutide initiators grew 1.80-fold per quarter, from below the reporting threshold before mid-2024 to 68 initiations in the third quarter of 2025, 137 in the fourth, and 228 in the first quarter of 2026, with direct-to-consumer acquisition identified as the dominant route throughout (Figure 1D).
Figure 1.
Retatrutide exposure, supply routes, growth in initiation, and cohort construction. (A) LLM-adjudicated exposure status among the 983 patients with any retatrutide mention. (B) Supply route among the 531 users whose route is known; the boxed direct-to-consumer row is expanded in panel C. (C) Supply channel among the 378 direct-to-consumer users. (D) Quarter of first confirmed exposure stacked by supply route; the hatched bar marks the quarter still accruing records at the data cutoff, and dotted faded bars extrapolate the exponential fitted to all complete quarters (1.80-fold per quarter), with projected totals abbreviated in thousands. (E) Flow from confirmed users and comparator initiator pools through greedy nearest-neighbor matching (1:3:10:10 on age, sex, race, BMI, T2DM, prior incretin exposure, and incretin recency) to the four matched arms. Teal denotes the trial cohort, light teal the direct-to-consumer cohort, navy semaglutide, and red tirzepatide throughout. Categories with fewer than 11 patients are shown as <11 with no bar, and this masking convention applies to every figure and table in this study.
Figure 1.
Retatrutide exposure, supply routes, growth in initiation, and cohort construction. (A) LLM-adjudicated exposure status among the 983 patients with any retatrutide mention. (B) Supply route among the 531 users whose route is known; the boxed direct-to-consumer row is expanded in panel C. (C) Supply channel among the 378 direct-to-consumer users. (D) Quarter of first confirmed exposure stacked by supply route; the hatched bar marks the quarter still accruing records at the data cutoff, and dotted faded bars extrapolate the exponential fitted to all complete quarters (1.80-fold per quarter), with projected totals abbreviated in thousands. (E) Flow from confirmed users and comparator initiator pools through greedy nearest-neighbor matching (1:3:10:10 on age, sex, race, BMI, T2DM, prior incretin exposure, and incretin recency) to the four matched arms. Teal denotes the trial cohort, light teal the direct-to-consumer cohort, navy semaglutide, and red tirzepatide throughout. Categories with fewer than 11 patients are shown as <11 with no bar, and this masking convention applies to every figure and table in this study.
Direct-to-Consumer Retatrutide Users Experienced Less Weight Loss than Participants in Retatrutide Clinical Trials
Four analytic cohorts were constructed by matching each retatrutide population (trial and direct-to-consumer) against patients who initiated either semaglutide (N = 521,208) or tirzepatide (N = 375,156) in 2025, yielding 89 trial, 243 direct-to-consumer, 890 semaglutide, and 890 tirzepatide patients (Figure 1E). Matched arms were balanced on age (51.2, 49.0, 51.5, and 51.4 years), sex (62.6% to 64.8% female), BMI (32.2 to 33.7 kg/m2), and documented prior incretin exposure (36.2% to 37.1%) (Table 1). The trial arm was modestly older than the direct-to-consumer arm (51.2 versus 49.0 years; standardized mean difference 0.16), Black patients were under-represented in the direct-to-consumer arm relative to the comparator arms (4.9% versus 11.6% and 11.7%; standardized mean difference 0.25), and time since the most recent prior incretin exposure was longer in both retatrutide arms than in matched semaglutide users (311 and 307 days versus 243 days; standardized mean difference 0.16) (Table 1). Among retatrutide patients, treatment duration ascertained from mentions in notes was a median of 83 days (IQR 14–185) in the trial arm and 56 days (IQR 13–105) in the direct-to-consumer arm, over a median follow-up of 125 (IQR 57–390) and 130 (IQR 78–200) days, respectively (Table 1).
Patients in the retatrude trial population, who may have received retatrutide or placebo, lost an average of 5.7% of body weight by 3 months, 11.9% by 6 months, and 15.5% between 6 and 12 months, (Figure 2) approaching the published 16.9% average weight loss across all TRIUMPH trial participants at 80 weeks (Supplementary Table 2). Direct-to-consumer retatrutide was associated with significantly less weight loss: 4.7% at 3 months, 5.3% at 6 months, and 7.2% at 6 to 12 months (Figure 2), compared to 15.5% in the same time window for all trial participants (P=0.004 at 6 to 12 months; P=0.021 at 6 months). Direct-to-consumer retatrutide was associated with similar magnitude weight loss compared to the FDA-approved comparators, for example with its 7.2% loss at 6 to 12 months compared to 7.7% for tirzepatide (P=0.79) 4.6% for semaglutide (P=0.13) (Figure 2). Thus, patients who sourced an unapproved triple agonist from direct-to-consumer channels typically achieved a degree of weight loss comparable to that seen with approved and regulated incretin therapies.
Transient Heart-Rate Elevation Is Observed in both Retatrutide Trial Participants and Direct-to-Consumer Users but Not with Approved Comparators
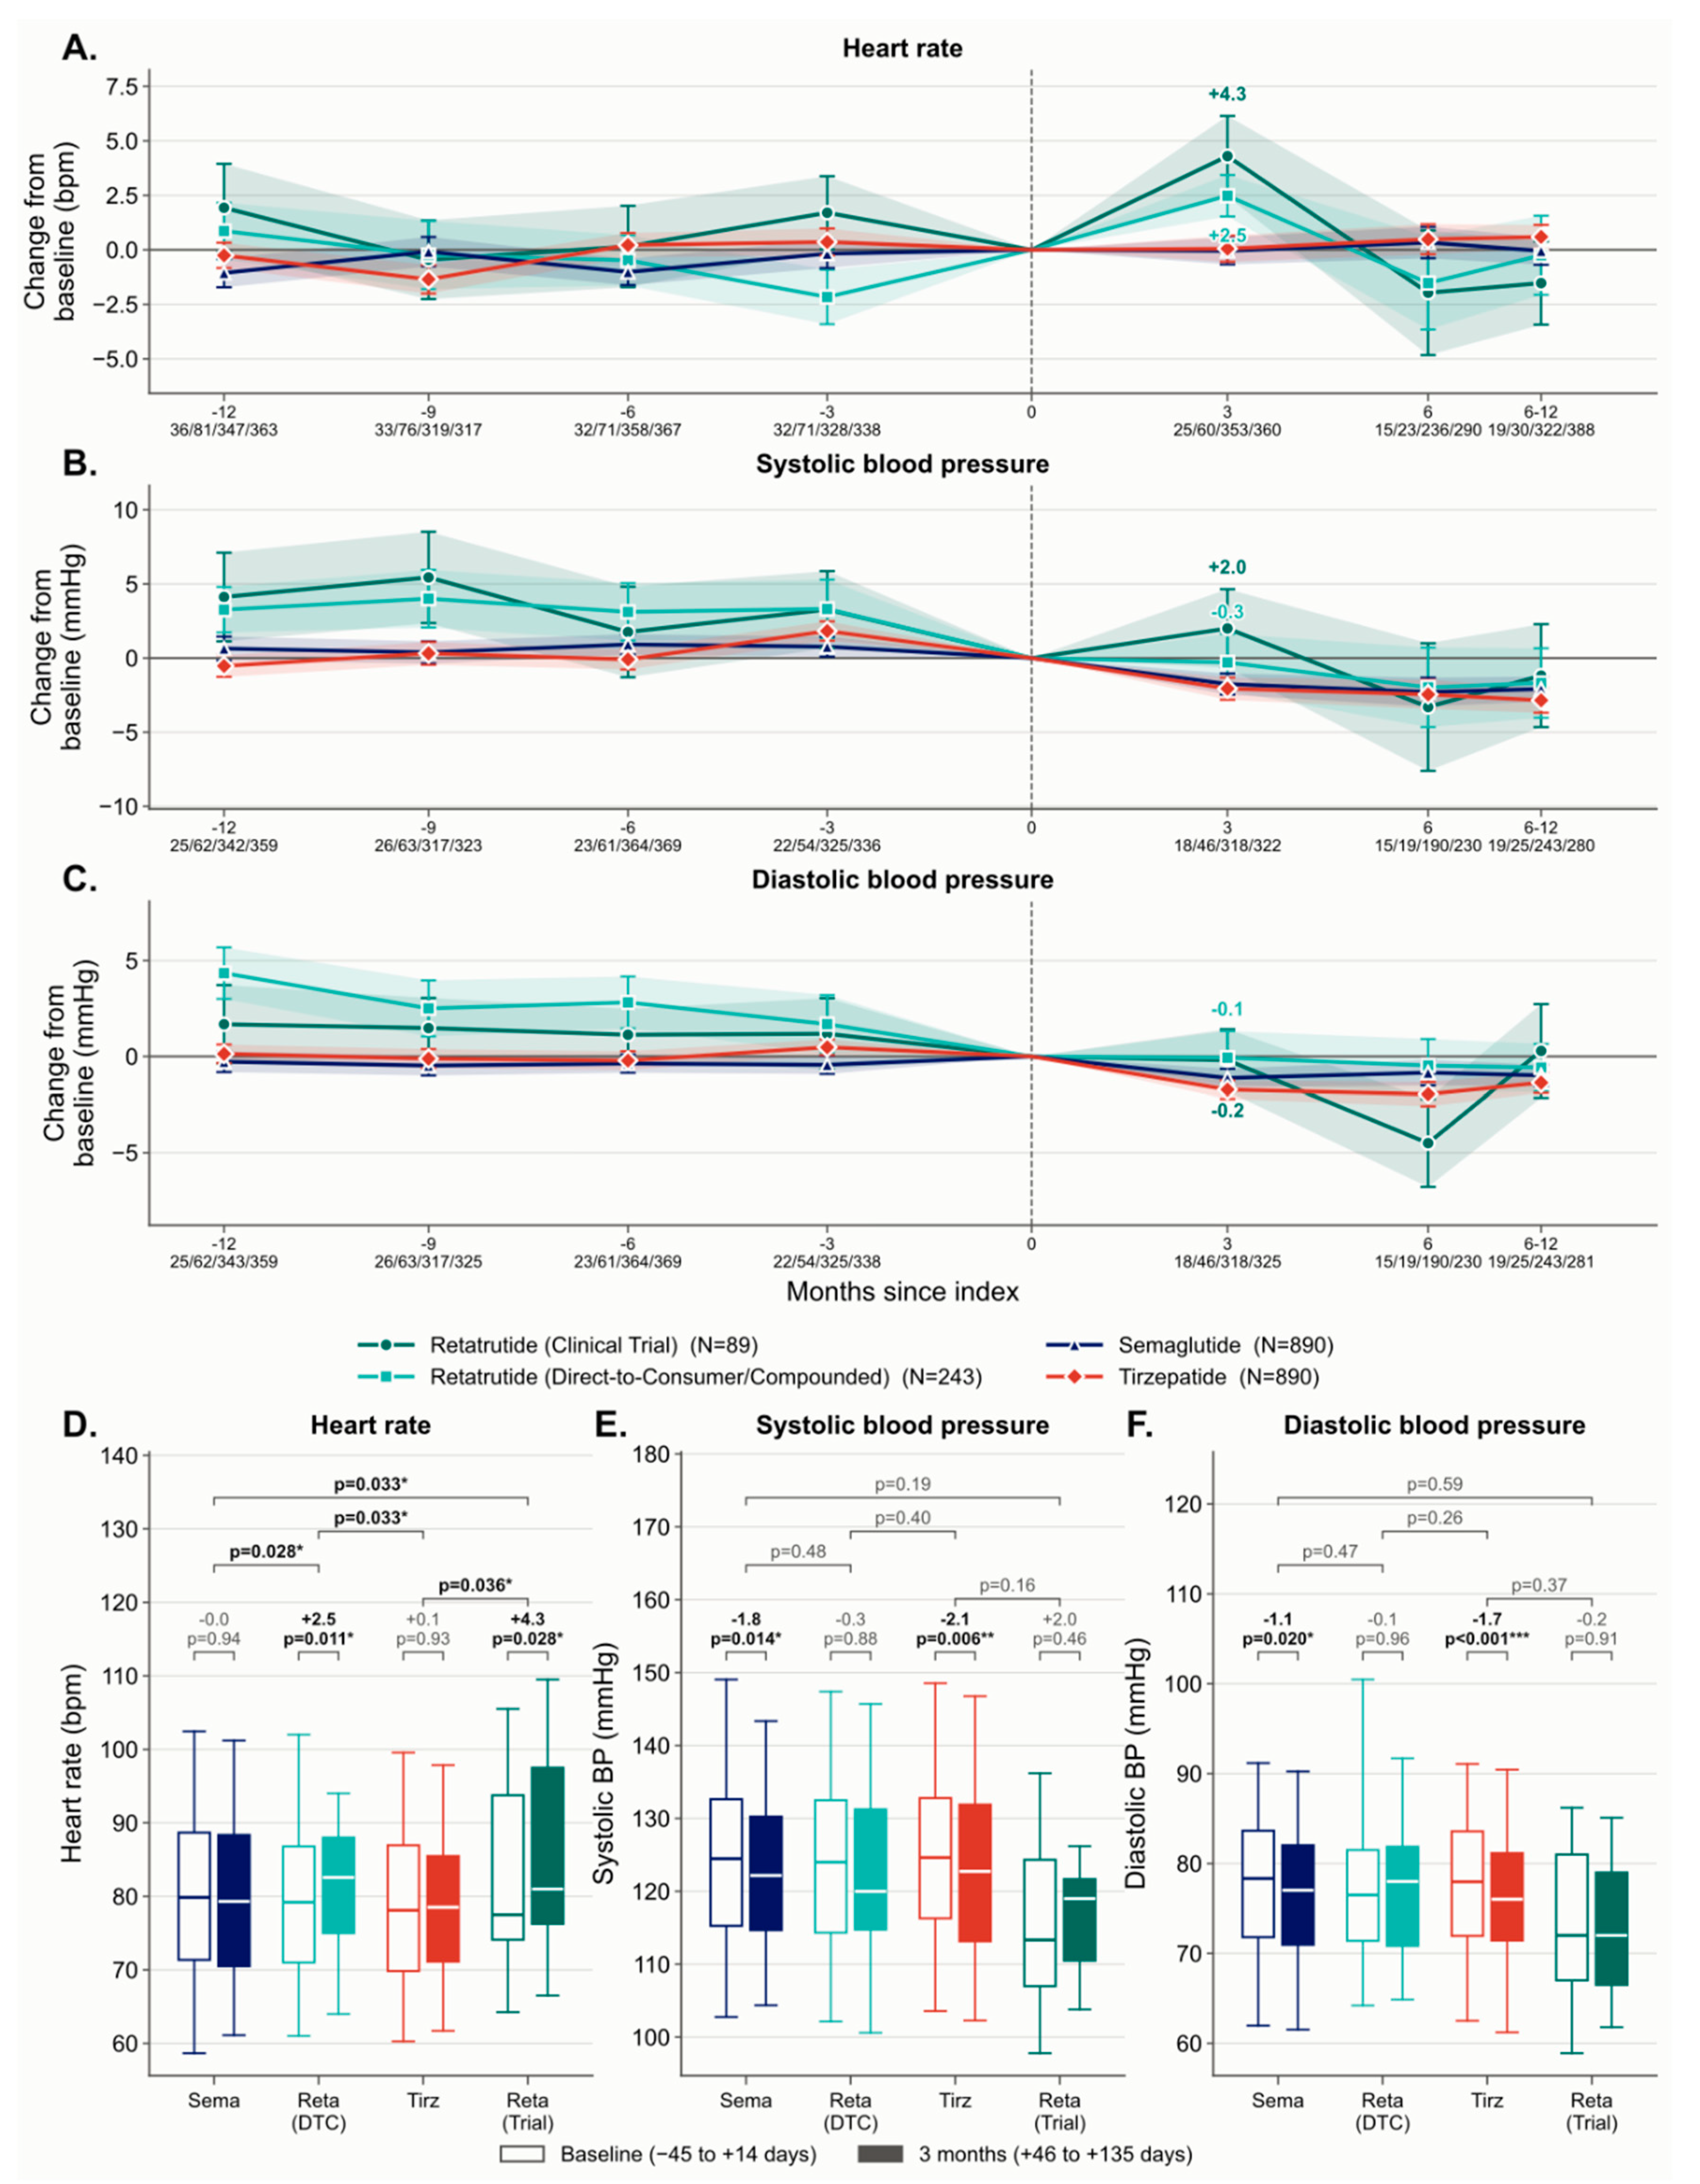
Heart rate rose in both retatrutide cohorts at 3 months, with increases of 4.3 bpm in the trial arm (P=0.028, n=25 paired) and 2.5 bpm in the direct-to-consumer arm (P=0.011, n=60), while no significant change in heart rate was observed for either semaglutide (mean change of 0.0 bpm, P=0.94) or tirzepatide (mean increase of 0.1 bpm, P=0.93) (Figure 3A, 3D). All four retatrutide-versus-comparator contrasts were statistically significant (trial versus semaglutide P=0.033 and versus tirzepatide P=0.036; direct-to-consumer versus semaglutide P=0.028 and versus tirzepatide P=0.033). The rise was transient in both retatrutide cohorts, returning to baseline by 6 months (-2.0 bpm in the trial arm and -1.5 bpm in the direct-to-consumer arm). On the other hand, blood pressure was slightly decreased at 3 months following initiation of semaglutide (systolic -1.8 mmHg, P=0.014; diastolic -1.1, P=0.020) or tirzepatide (systolic -2.1 mmHg, P=0.006; -1.7, P<0.001). , whereas neither retatrutide cohort changed significantly (systolic +2.0 mmHg, P=0.46 in the trial arm and -0.3 mmHg, P=0.88 in the direct-to-consumer arm). No retatrutide-versus-comparator contrast reached statistical significance (P=0.16 to 0.59) (Figure 3B, 3C, 3E, 3F).
Figure 3.
Heart rate and blood pressure in the matched cohorts. (A-C) Mean change from baseline in heart rate, systolic blood pressure, and diastolic blood pressure across the same windows as Figure 2; shaded bands denote 1 standard error of the mean and labels mark the 3-month values for the retatrutide arms. (D-F) Paired baseline and 3-month distributions per arm (open and filled boxes); the bracket immediately above each pair gives the within-arm paired t-test on the change, and upper brackets give two-sided Welch t-tests of each retatrutide arm's change against each comparator's. Boxes span the interquartile range with whiskers at the 5th and 95th percentiles. Arm colors follow Figure 1.
Figure 3.
Heart rate and blood pressure in the matched cohorts. (A-C) Mean change from baseline in heart rate, systolic blood pressure, and diastolic blood pressure across the same windows as Figure 2; shaded bands denote 1 standard error of the mean and labels mark the 3-month values for the retatrutide arms. (D-F) Paired baseline and 3-month distributions per arm (open and filled boxes); the bracket immediately above each pair gives the within-arm paired t-test on the change, and upper brackets give two-sided Welch t-tests of each retatrutide arm's change against each comparator's. Boxes span the interquartile range with whiskers at the 5th and 95th percentiles. Arm colors follow Figure 1.
Increase in Heart Rate Rises with Weight Loss in Retatrutide Users but Not in Users of Approved Comparators
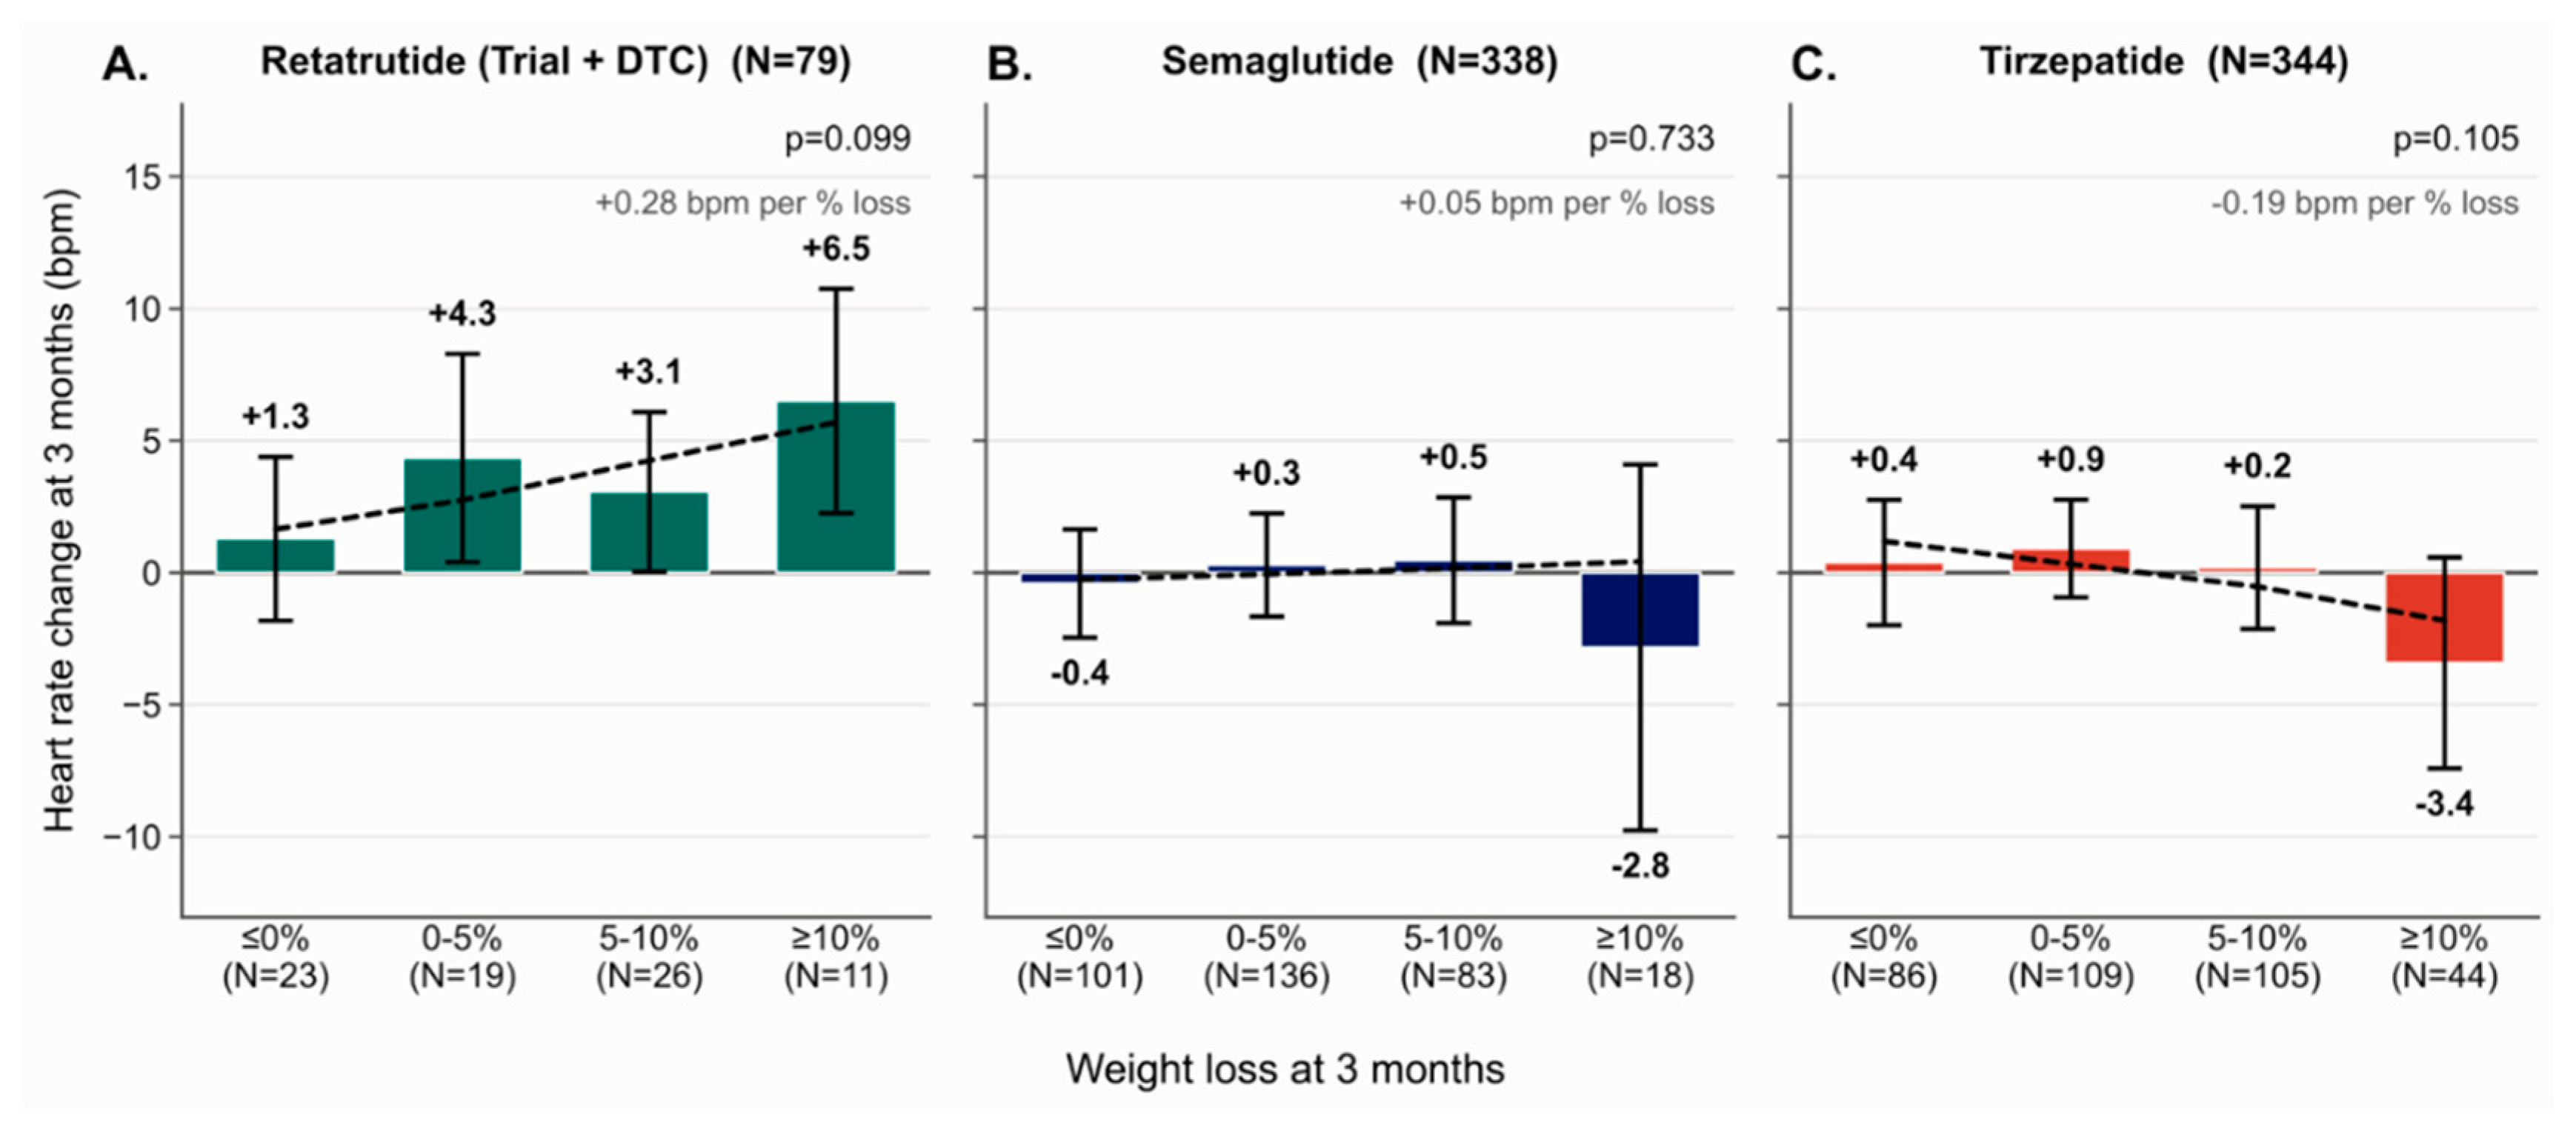
Among patients with both a paired heart rate and a paired weight measurement at 3 months, heart rate change increased across bands of greater weight loss in the pooled retatrutide cohort, comprising both trial participants and direct-to-consumer users, from 1.3 bpm in patients who lost no weight to 6.5 bpm in those who lost 10% or more, corresponding to 0.28 bpm per percent of body weight lost (P=0.099) (Figure 4A). Neither comparator showed this pattern: the trend was flat for semaglutide (0.05 bpm per percent, P=0.733) and directionally opposite for tirzepatide (-0.19 bpm per percent, P=0.105), with both comparator cohorts falling below baseline in the largest-loss band (Figure 4B, 4C). The gradient is therefore specific in direction to retatrutide among the three agents, consistent with the chronotropic and weight-lowering effects of the triple agonist being driven by a common exposure. These analyses were restricted to the 79 pooled retatrutide, 338 semaglutide, and 344 tirzepatide patients with both measurements available, and the retatrutide trend is not monotonic across bands, so they should be interpreted as exploratory.
Figure 4.
Heart rate change by weight loss at 3 months in the matched cohorts. Mean change in heart rate from baseline at 3 months, within four bands of weight loss over the same interval, among patients with a paired heart rate and a paired weight measurement in that window. (A) Retatrutide, with the clinical trial and direct-to-consumer cohorts pooled into a single group. (B) Semaglutide. (C) Tirzepatide. Bands are the conventional 5% and 10% weight-loss response thresholds; error bars denote 95% confidence intervals of each band mean, and the number of patients contributing to each band is given beneath it. The dotted line is the fitted linear trend of heart rate change on weight change within each cohort, evaluated at each band's mean weight change; the annotation gives that trend as beats per minute per percent of body weight lost, with its two-sided P value. All three panels share one vertical scale. Arm colors follow Figure 1.
Figure 4.
Heart rate change by weight loss at 3 months in the matched cohorts. Mean change in heart rate from baseline at 3 months, within four bands of weight loss over the same interval, among patients with a paired heart rate and a paired weight measurement in that window. (A) Retatrutide, with the clinical trial and direct-to-consumer cohorts pooled into a single group. (B) Semaglutide. (C) Tirzepatide. Bands are the conventional 5% and 10% weight-loss response thresholds; error bars denote 95% confidence intervals of each band mean, and the number of patients contributing to each band is given beneath it. The dotted line is the fitted linear trend of heart rate change on weight change within each cohort, evaluated at each band's mean weight change; the annotation gives that trend as beats per minute per percent of body weight lost, with its two-sided P value. All three panels share one vertical scale. Arm colors follow Figure 1.
Multiple New-Onset Symptoms Are Reported More Frequently After Retatrutide Initiation Compared to the Approved Comparators
Pooling both retatrutide cohorts, the incidence of new-onset symptoms was higher than in matched semaglutide users in 12 of 16 clinical categories after BH correction, and the same 12-of-16 count held against tirzepatide (Figure 5A; Supplementary Table 1). Against semaglutide, the largest elevations were thyroid findings (RR 2.34, 95% CI 1.39-3.85; 26 versus 47 events; q=0.002), neuropsychiatric symptoms (RR 1.95, 1.61-2.36; 149 versus 386 events; q<0.001), hypersensitivity (RR 1.82, 1.32-2.47; 59 versus 148; q=0.001), and ophthalmic complaints (RR 1.81, 1.24-2.61; 43 versus 104; q=0.004), with cardiovascular symptoms (blood pressure, tachycardia, chest pain, and related complaints) at RR 1.56 (1.26-1.92; 123 versus 360 events; q<0.001), and the expected incretin class effects present in upper gastrointestinal (RR 1.53, 1.18-1.96; q=0.002) and lower gastrointestinal categories (RR 1.51, 1.10-2.06; q=0.016). Against tirzepatide the same categories were elevated, including cardiovascular (RR 1.85, 1.49-2.28; q<0.001) and neuropsychiatric symptoms (RR 2.22, 1.82-2.68; q<0.001). At the individual-symptom level, tachycardia was increased in the retatrutide cohorts compared to semaglutide (RR 1.90; 95% CI 1.13-3.09; 25 versus 56 events; P=0.010) or tirzepatide (RR 2.88; 1.68-4.85; 25 versus 41 events; P<0.001).
The negative-control category, which included 108 findings with no plausible drug mechanism (including diverticulosis, renal and hepatic cysts, and benign skin lesions such as nevi and seborrheic keratoses), showed no significant difference between the retatrutide cohorts and and the semaglutide cohort (RR 1.03; 95% CI 0.63-1.63; 24 versus 94 events; P=0.91) or the tirzepatide cohort (RR 1.32; 0.80-2.11; P=0.25). The two retatrutide cohorts were very similar to each other in regards to adverse event documentation: across all 16 categories, only appetite loss was recorded more frequently in the trial than in the direct-to-consumer arm after correction (RR 2.94, 95% CI 1.40-6.34; q=0.036) (Figure 5B).
Major Adverse Cardiovascular Event Rates Are Statistically Indistinguishable at the Available Event Counts
Using structured diagnosis codes, 3-point MACE occurred at 2.13 per 100 person-years in the trial cohort against 2.09 in matched semaglutide users (RR 1.02, 95% CI 0.12-4.17; <11 versus 21 events; P=1.00) and 1.20 in tirzepatide users (RR 1.77, 0.19-7.94; <11 versus 12 events; P=0.34); expanded MACE gave RR 1.25 (0.24-4.07; <11 versus 26 events) versus semaglutide and 2.03 (0.38-7.09; <11 versus 16 events) versus tirzepatide (Figure 6A). The direct-to-consumer cohort pointed in the opposite direction (RR 0.24 to 0.94 across composites and comparators), and pooling accordingly moved with the larger cohort (3-point RR 0.50, 0.09-1.66 versus semaglutide). Every interval spans unity by a wide margin: with roughly 290 retatrutide person-years and single-digit events, this cohort cannot yet demonstrate or exclude a MACE difference in either direction, and no estimate here should be read causally.
Figure 6.
Major adverse cardiovascular events from structured diagnosis codes. (A) Rate ratios for 3-point MACE (myocardial infarction, stroke, or all-cause death) and expanded MACE (adding heart failure) for the trial, direct-to-consumer, and pooled retatrutide cohorts against semaglutide (navy) and tirzepatide (red), with events, rate ratio, 95% exact Poisson confidence interval, and exact conditional binomial P-value per row; retatrutide event counts fall below the privacy threshold and display as <11. (B, C) Three-month heart-rate and weight change in retatrutide patients who did versus did not have a post-index event (union of coded and note-derived events); the box body spans the 95% confidence interval of the mean, the line marks the mean, whiskers span 1 standard deviation, and brackets give two-sided Welch t-tests of cases against non-cases within each cohort.
Figure 6.
Major adverse cardiovascular events from structured diagnosis codes. (A) Rate ratios for 3-point MACE (myocardial infarction, stroke, or all-cause death) and expanded MACE (adding heart failure) for the trial, direct-to-consumer, and pooled retatrutide cohorts against semaglutide (navy) and tirzepatide (red), with events, rate ratio, 95% exact Poisson confidence interval, and exact conditional binomial P-value per row; retatrutide event counts fall below the privacy threshold and display as <11. (B, C) Three-month heart-rate and weight change in retatrutide patients who did versus did not have a post-index event (union of coded and note-derived events); the box body spans the 95% confidence interval of the mean, the line marks the mean, whiskers span 1 standard deviation, and brackets give two-sided Welch t-tests of cases against non-cases within each cohort.
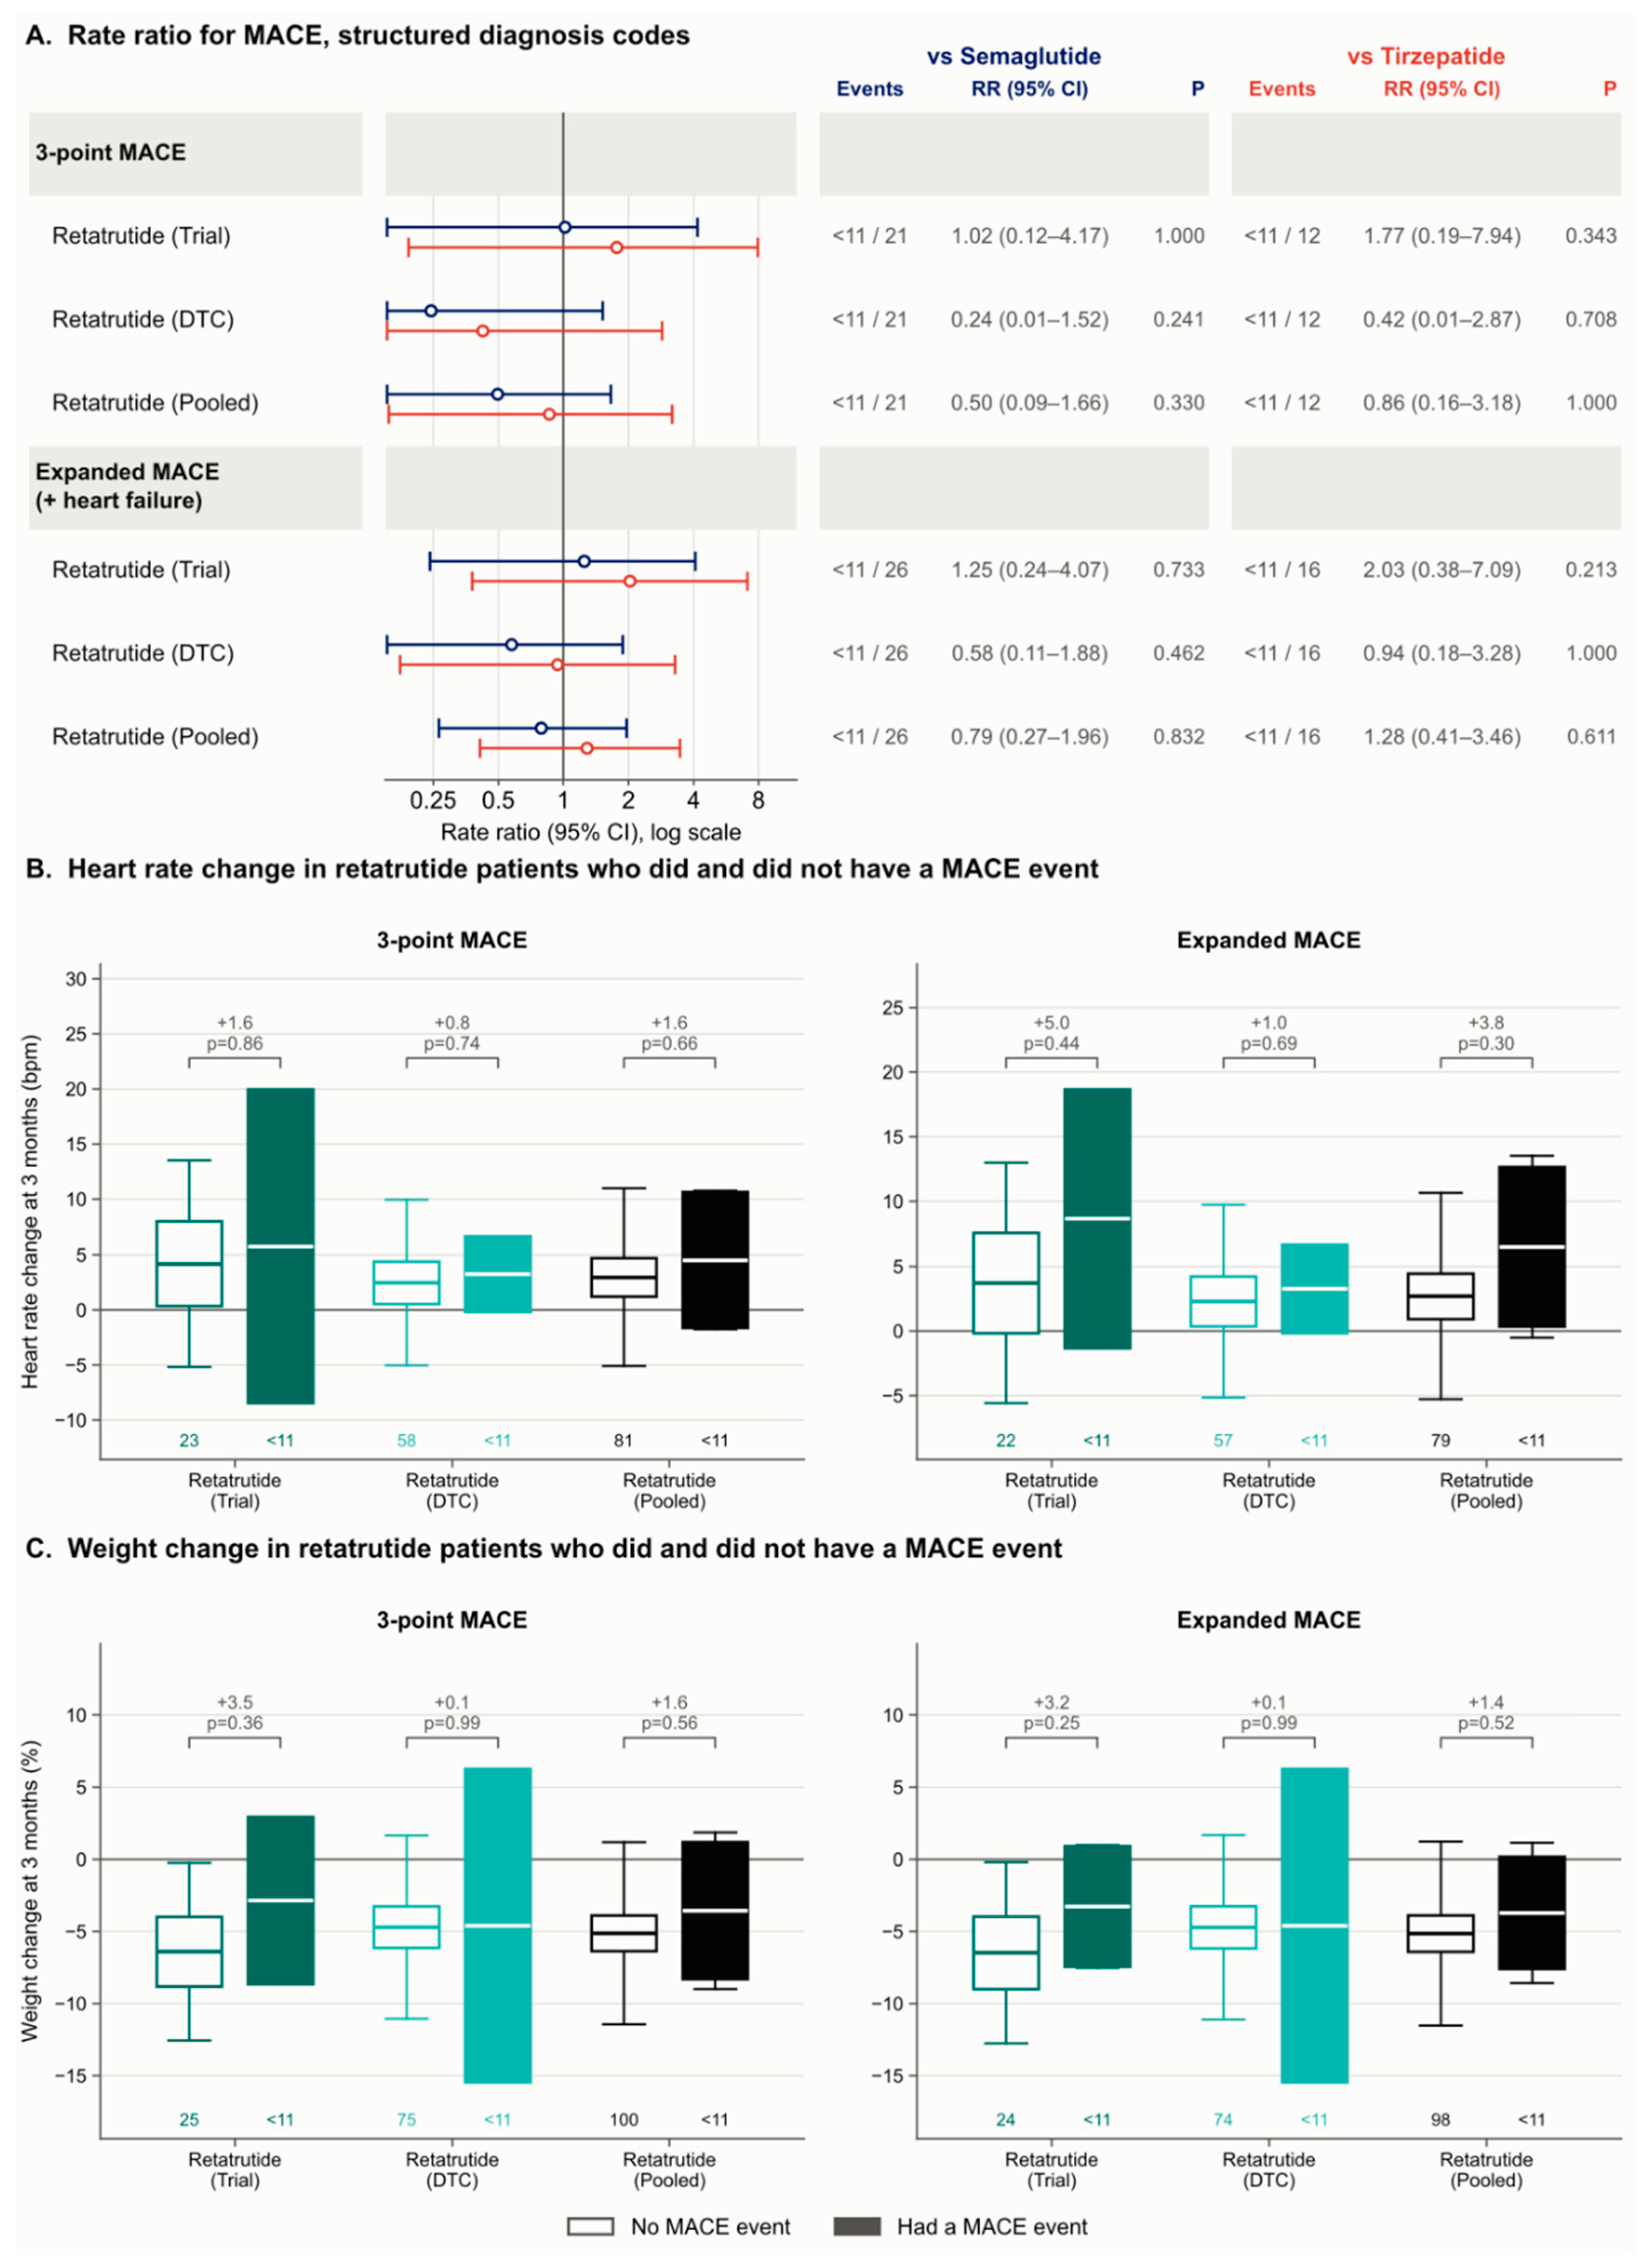
Within retatrutide users, patients who went on to an event showed directionally greater 3-month heart-rate rise (+5.0 bpm versus non-cases in the trial arm, P=0.44; +3.8 pooled, P=0.30) and less weight loss (gap of +3.2 percentage points in the trial arm, P=0.25), but no contrast was significant, and both patterns replicated inside the comparator arms, where events are more numerous (Figure 6B, 6C). Attenuated weight loss and a larger heart-rate rise mark patients doing poorly on any incretin, rather than identifying a retatrutide-specific mechanism at these counts.
Reasons for Initiation of or Treatment Switching to Retatrutide
Among the 385 users whose record stated a reason, 348 (90.4%) took retatrutide for weight management. Among 201 patients who discussed but did not take the drug, the leading documented reasons were its lack of FDA approval (88, 43.8%), a clinician advising against it (44, 21.9%), and supply problems (34, 16.9%) (Figure 7A, 7B). Initiation was more often patient-driven among those who obtained it via direct-to-consumer routes, with the patient first raising the drug in 67% of 260 direct-to-consumer cases against 53% of 57 trial cases (Figure 7C).
Figure 7.
Why patients took, declined, and switched to retatrutide. (A) Primary documented reason for use among 385 users whose record states one. (B) Documented reasons the drug was not taken among 201 patients who discussed it. (C) Whether the patient or the clinician first raised the drug, by supply route, among 317 patients with an identifiable initiator. (D) Last structured semaglutide or tirzepatide record before index by supply route; only these two agents were ascertained, so absence of a record does not establish incretin-naivety. (E) Documented reason for leaving prior incretin therapy among 83 switchers, with bars divided by the last agent recorded (navy semaglutide, red tirzepatide, gray none identified). Each panel's denominator is restricted to patients whose record addresses the question and is stated in its title.
Figure 7.
Why patients took, declined, and switched to retatrutide. (A) Primary documented reason for use among 385 users whose record states one. (B) Documented reasons the drug was not taken among 201 patients who discussed it. (C) Whether the patient or the clinician first raised the drug, by supply route, among 317 patients with an identifiable initiator. (D) Last structured semaglutide or tirzepatide record before index by supply route; only these two agents were ascertained, so absence of a record does not establish incretin-naivety. (E) Documented reason for leaving prior incretin therapy among 83 switchers, with bars divided by the last agent recorded (navy semaglutide, red tirzepatide, gray none identified). Each panel's denominator is restricted to patients whose record addresses the question and is stated in its title.
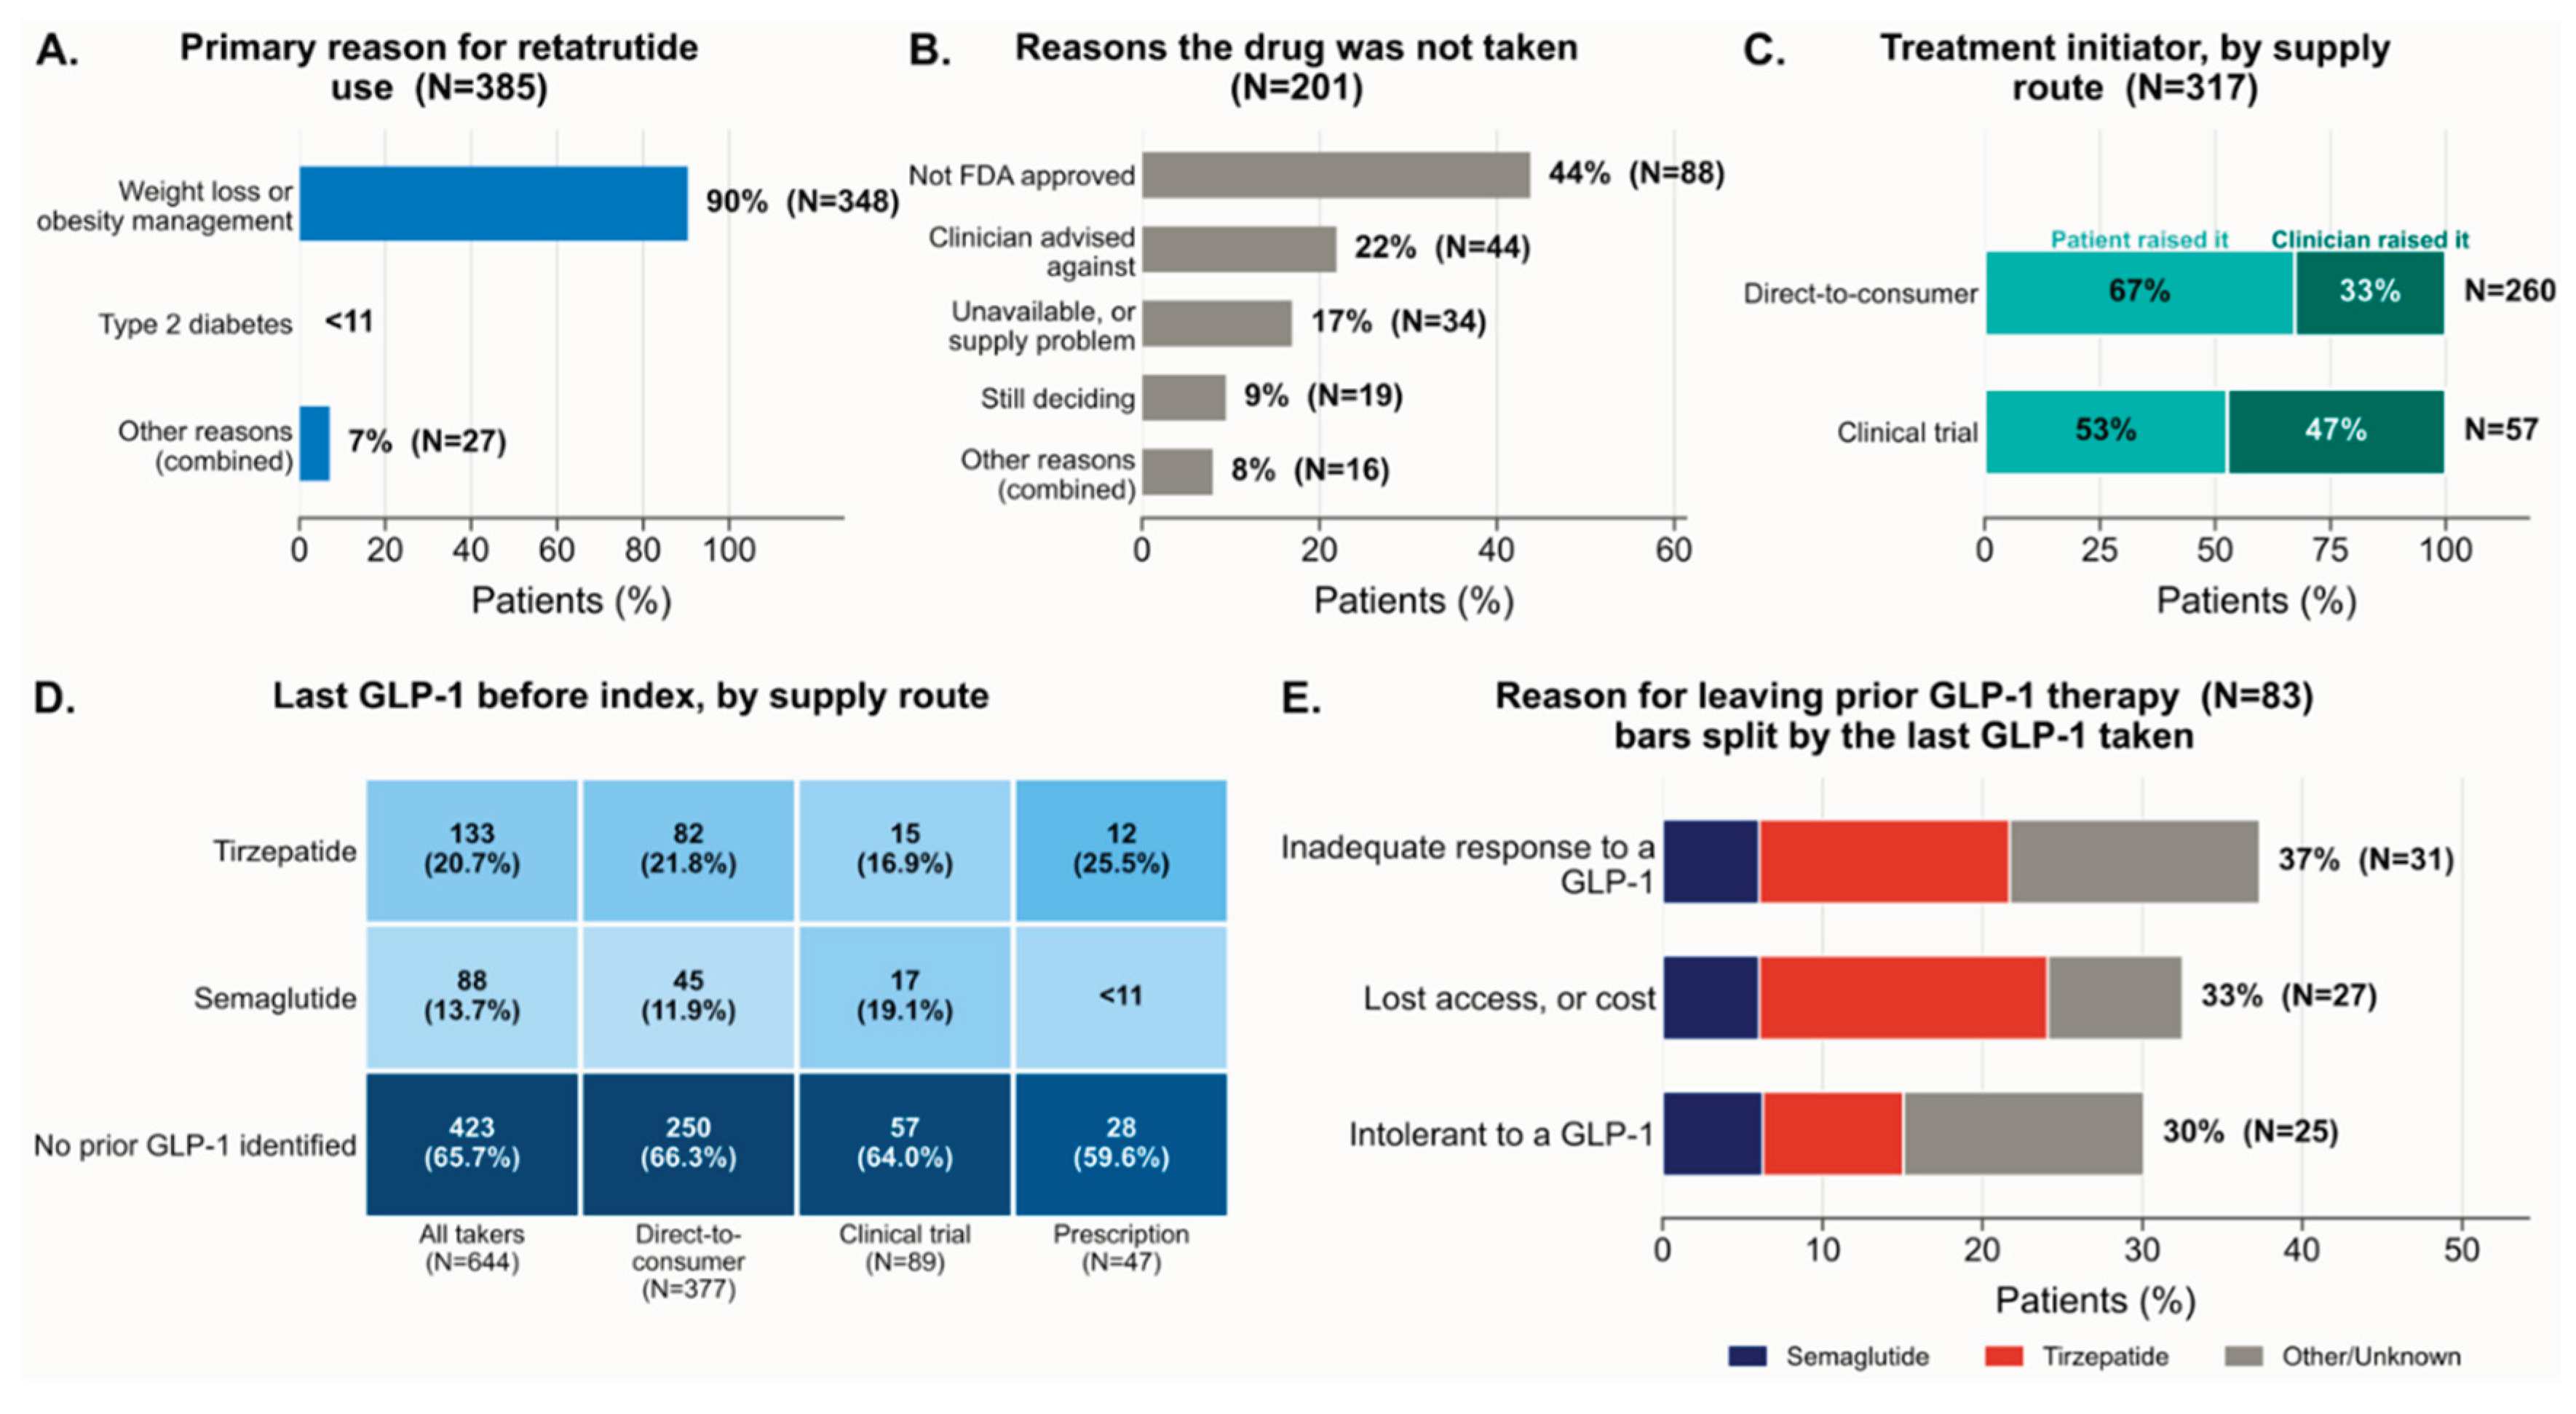
Approximately two-thirds of users (423 of 644 with an assignable index date, 65.7%) had no prior structured record of semaglutide or tirzepatide, while 133 (20.7%) had most recently received tirzepatide and 88 (13.7%) semaglutide (Figure 7D). Only these two comparators were ascertained, so absence of a record does not establish incretin-naivety, and a substantial fraction of patients who described switching from a prior incretin had no corresponding structured record at all, consistent with acquisition of the prior therapy outside the health system. Among the 83 switchers with documented rationale for switching from an approved therapy, inadequate response accounted for 31 (37.3%), loss of access or cost for 27 (32.5%), and intolerance for 25 (30.1%) (Figure 7E).
Manual Adjudication of 320 Extractions Confirms Exposure Classification with 99.8% Accuracy and Supply-Route Assignment with 90.3%
To assess the reliability of the language model extractions underlying the cohort definitions, a clinician reviewer manually adjudicated 320 randomly selected extractions against the source clinical notes at a single site, sampling each predicted class separately so that class-specific accuracy could be estimated directly (Table 2). Classification of retatrutide exposure, which defines both the confirmed-user cohort and the index date, agreed with manual review in 134 of 135 adjudicated notes, corresponding to a prevalence-weighted accuracy of 99.8%. Assignment of supply route agreed in 90.3% of cases overall, and specifically for the two analysed retatrutide arms, trial and direct-to-consumer, in 89.6% (95% CI 81.3–94.8%). Extraction of the reported treatment start date was correct in 90.0% of notes in which a start-date phrase was extracted, and no missed phrase was identified in any of the 40 notes for which the model reported none.
Discussion
This study documents, quantifies, and evaluates the real-world use of a drug that regulators have never reviewed. 652 patients had confirmed retatrutide exposure by mid-2026, initiation was growing 1.80-fold per quarter, and 71.2% of users with a known route obtained the drug through online vendors, compounding pharmacies, and wellness clinics. The analytic core of the study is a validation chain: patients receiving retatrutide under trial protocol reproduced trial-scale weight loss (15.5% at 6 to 12 months against the TRIUMPH trials' 80-week average of 16.94%), which establishes that the extraction, matching, and trajectory machinery recovers the randomized benchmark when the product is authentic and administration is supervised. This concordance is the more notable because the trial cohort remains blinded: in every reported TRIUMPH design, placebo was allocated to a single arm of three or four, roughly one quarter to one third of participants, so the cohort is inherently enriched for active-drug recipients, and its observed 15.5% loss, achieved with placebo recipients diluting the average, understates the effect of the active drug. Read against that internal control, the direct-to-consumer result becomes interpretable: the same machinery applied to the same drug obtained through gray-market channels found less than half the weight loss, statistically indistinguishable from approved tirzepatide.
The mechanism of that attenuation cannot be fully resolved from these data. What distinguishes the direct-to-consumer setting is product content that is unverifiable and sometimes explicitly adulterated (copreparations with cagrilintide, BPC-157, NAD+, and insulin-like growth factor 1 analogues), concentration accuracy known to be poor in no-prescription incretin purchases10, and administration without clinical support. An attenuation of this shape is familiar from the approved incretins, where real-world one-year weight reduction runs well below trial benchmarks and discontinuers lose roughly half of what persistent users lose6,7; the gray market adds unverified product content on top of those mechanisms. The finding inverts the gray market's implicit value proposition: patients pay out of pocket for a molecule whose trials promise 25% to 30% weight reduction and receive, on average, what a regulated tirzepatide prescription delivers4.
The pharmacodynamic and symptom findings show that the exposure is nonetheless real and biologically active. The transient 3-month heart-rate rise, +4.3 bpm in clinical trial and +2.5 bpm in direct-to-consumer users with flat comparators, reproduces both the magnitude and the rise-then-resolve time course of the phase 2 trial and the meta-analytic class estimate11,15, and is mechanistically expected from direct GLP-1 receptor agonism at the sinoatrial node16. Within the retatrutide cohorts the two effects moved together, heart-rate rise scaling with weight loss at 0.28 bpm per percent lost (P=0.099) with no such gradient in either comparator, the pattern a shared dependence on drug exposure would produce, although the difference in slope between cohorts did not reach significance. New-onset symptom burden ran 1.5- to 2.3-fold above both approved comparators across most clinical categories, with the note-derived tachycardia signal mirroring the measured chronotropy through an independent ascertainment route. Three features argue this excess is not an artifact of documentation intensity: the negative-control category was null against semaglutide, the elevation was consistent across two comparators with different documentation patterns, and the two retatrutide cohorts, whose note densities differ from each other, were near-identical against each other. Surveillance bias cannot be excluded entirely, since retatrutide users carry roughly 1.5-fold the note density of comparators and no adjustment for documentation volume was applied; the negative control bounds the generic component of that bias but not symptom-specific questioning.
The cardiovascular event analysis is reported for completeness and for its limits. At roughly 290 retatrutide person-years and single-digit event counts, every rate ratio spans unity widely, the trial and direct-to-consumer arms point in opposite directions, and the correlate patterns (less weight loss and more chronotropy in patients with events) replicate within the comparator arms, marking them as prognostic rather than drug-specific. The honest summary is that the chronotropic pharmacology is measurable now, and whether it translates into events is answerable only by the randomized program and by longer real-world follow-up as the exposed population compounds.
These observations coincide with a rapidly evolving regulatory landscape for incretin therapies. The FDA ended the shortage-based legal window for compounded semaglutide and tirzepatide by early 2025, yet secret-shopper and market-surveillance studies through 2026 find incretin products still marketed and prescribed online with minimal oversight9, poison-center exposures and compounded-product adverse-event reports continue to climb17,18, and this study finds initiation of a never-approved incretin accelerating quarter over quarter in the same period. A third of documented switchers left approved therapy over cost or access, which locates part of the demand inside the pricing and coverage of the approved agents rather than in exotic risk appetite, and which manufacturer-run direct-to-consumer channels address only for the drugs that already have approval8. If the exponential holds even approximately, several thousand patients per quarter within this network alone will be injecting an unapproved triple agonist by the time the TRIUMPH program completes; approval, conversely, would collapse the gray market this projection extrapolates, which is why it is conditional rather than a forecast. The same anticipatory dynamic should be expected for cagrilintide-semaglutide and orforglipron as their pivotal results circulate ahead of supply20,21.
The study's strengths are the validation chain anchored on the trial arm; exposure ascertainment that does not depend on any structured prescription record and therefore generalizes to any unapproved or diverted agent; matched comparators drawn from hundreds of thousands of contemporaneous incretin initiators; two independent ascertainment routes (measured vitals and note-derived symptoms) converging on the same pharmacology; and a prespecified negative control30. Several limitations warrant emphasis. First, the design is observational, and patients who seek an unapproved peptide differ from prescribed populations in ways seven matched covariates cannot capture; residual imbalance persisted for race, for recency of prior incretin exposure against semaglutide, and for pre-index weight trajectory: both retatrutide cohorts were already losing weight in the year before index, whereas the comparator arms were weight-stable. Second, exposure, and supply route are documented only when patients disclose them, so the 652 confirmed users are a floor, the direct-to-consumer arm is the least-documented stratum, and follow-up is short and uneven (median roughly 3 months in the retatrutide arms versus 6 months in comparators). Third, the index date derives from notes rather than dispensing records, and this error is directional rather than random: a patient discloses compounded retatrutide at whatever visit happens to follow initiation, so the true start almost always precedes the first note. Explicit start-date phrases were recovered and applied where documented, but for the majority in whom no phrase appears the index date remains the first confirming note, and the unobserved interval carries the earliest and steepest phase of weight loss. The direct-to-consumer arm is therefore biased toward underestimating its true weight loss, and the trial-versus-direct-to-consumer gap toward overstatement. The pre-index trajectories in Figure 2 bound this: both retatrutide cohorts were already losing weight before index, and even crediting the direct-to-consumer arm with that entire pre-index decline would leave it short of the trial arm. Fourth, the trial cohort includes undisclosed placebo recipients; as noted above, placebo was the minority allocation in every TRIUMPH design, so the cohort remains enriched for active drug use. Fifth, cardiovascular event counts fell below the small-cell reporting threshold in every retatrutide cohort, restricting the analysis to interval estimates that cannot exclude effects in either direction. This constraint is temporal rather than structural: with initiation compounding quarter over quarter, the exposed population and its accrued person-time will grow severalfold within the coming year, and the same surveillance framework, re-run as events accumulate, will progressively narrow these intervals toward statistically decisive estimates of cardiovascular risk.
Taken together, these results establish that the market for a next-generation incretin now precedes its approval, that patients in that market assume the drug's pharmacology and an excess symptom burden while realizing roughly half of its trial efficacy, and that the clinical record, read at scale by language models, is sufficient to see all of this happening in near real time. The framework demonstrated here, exposure adjudication from text, note-anchored indexing, matched approved-comparator benchmarking, and negative-control-bounded outcome scans, applies directly to the growing class of pre-approval and gray-market therapeutics for which no structured surveillance exists. For retatrutide specifically, the findings motivate explicit regulatory attention to direct-to-consumer peptide channels, sponsor and clinician awareness that trial candidates may already have gray-market exposure histories, and pricing and access decisions at approval that acknowledge how much of this demand is economic.
Data Availability
This study analyzed de-identified electronic health record data. The data were extracted under an established privacy-preserving protocol and cannot be shared beyond what is reported here due to the parameters of the expert determination.
Code Availability
The analysis code is not publicly available. Please contact the corresponding author for details.
Competing Interest Statement
The authors are employees of nference, inc., which conducts research collaborations with various biopharmaceutical companies whose therapeutic products are included in this study. None of these companies, nor any other nference collaborator, funded, supported, or had any role in the independent study design, data acquisition, analysis, interpretation, manuscript preparation, or the decision to submit this work for publication. All analyses were conducted by the authors using de-identified electronic health record data. The authors declare no additional competing interests.
Supplementary Materials
The following supporting information can be downloaded at the website of this paper posted on Preprints.org.
Author Contributions
Venky Soundararajan conceived and supervised the study. Karthik Murugadoss designed the study, performed the analyses, and prepared the visualizations. A.J. Venkatakrishnan contributed to analysis, interpretation, and manuscript preparation. All authors prepared, reviewed, and approved the final manuscript.
Funding
No external funding was received for this study.
Acknowledgments
The authors thank Patrick Lenehan for thorough review of the manuscript.
References
- GBD 2021 US Obesity Forecasting Collaborators. National-level and state-level prevalence of overweight and obesity among children, adolescents, and adults in the USA, 1990-2021, and forecasts up to 2050. Lancet 2024, 404, 2278–2298. [Google Scholar] [CrossRef] [PubMed]
- Pi-Sunyer, X.; et al. A randomized, controlled trial of 3.0 mg of liraglutide in weight management. N. Engl. J. Med. 2015, 373, 11–22. [Google Scholar] [CrossRef] [PubMed]
- Wilding, J. P. H.; et al. Once-weekly semaglutide in adults with overweight or obesity. N. Engl. J. Med. 2021, 384, 989–1002. [Google Scholar] [CrossRef] [PubMed]
- Jastreboff, A. M.; et al. Tirzepatide once weekly for the treatment of obesity. N. Engl. J. Med. 2022, 387, 205–216. [Google Scholar] [CrossRef] [PubMed]
- Lincoff, A. M.; et al. Semaglutide and cardiovascular outcomes in obesity without diabetes. N. Engl. J. Med. 2023, 389, 2221–2232. [Google Scholar] [CrossRef] [PubMed]
- Gasoyan, H.; et al. One-year weight reduction with semaglutide or liraglutide in clinical practice. JAMA Netw. Open 2024, 7, e2433326. [Google Scholar] [CrossRef] [PubMed]
- Gasoyan, H.; et al. Changes in weight and glycemic control following obesity treatment with semaglutide or tirzepatide by discontinuation status. Obesity 2025, 33, 1657–1667. [Google Scholar] [CrossRef] [PubMed]
- Rome, B. N. Direct-to-consumer drug company pharmacies. JAMA 2024, 331, 1003–1004. [Google Scholar] [CrossRef] [PubMed]
- Chetty, A. K.; Chen, A. S.; Ross, J. S.; Ramachandran, R. Online prescribing of GLP-1 receptor agonists. JAMA 2026, 336, 428–431. [Google Scholar] [CrossRef] [PubMed]
- Ashraf, A. R.; et al. Safety and risk assessment of no-prescription online semaglutide purchases. JAMA Netw. Open 2024, 7, e2428280. [Google Scholar] [CrossRef] [PubMed]
- Jastreboff, A. M.; et al. Triple-hormone-receptor agonist retatrutide for obesity - A phase 2 trial. N. Engl. J. Med. 2023, 389, 514–526. [Google Scholar] [CrossRef] [PubMed]
- Rosenstock, J.; et al. Retatrutide, a GIP, GLP-1 and glucagon receptor agonist, for people with type 2 diabetes: a randomised, double-blind, placebo and active-controlled, parallel-group, phase 2 trial conducted in the USA. Lancet 2023, 402, 529–544. [Google Scholar] [CrossRef] [PubMed]
- Sanyal, A. J.; et al. Triple hormone receptor agonist retatrutide for metabolic dysfunction-associated steatotic liver disease: a randomized phase 2a trial. Nat. Med. 2024, 30, 2037–2048. [Google Scholar] [CrossRef] [PubMed]
- Bajaj, H. S.; et al. Efficacy and safety of retatrutide, a GIP, GLP-1, and glucagon receptor agonist, in people with type 2 diabetes and inadequate glycaemic control with diet and exercise (TRANSCEND-T2D-1): a double-blind, randomised, phase 3 trial. Lancet 2026, 407, 2402–2413. [Google Scholar] [CrossRef] [PubMed]
- Zhang, Y.; et al. Effect of glucagon-like peptide-1 receptor agonists on heart rate in non-diabetic individuals with overweight or obesity: a systematic review and pairwise and network meta-analysis of randomized controlled trials. Eur. J. Med. Res. 2026, 31, 318. [Google Scholar] [CrossRef] [PubMed]
- Lubberding, A. F.; et al. Glucagon-like peptide-1 increases heart rate by a direct action on the sinus node. Cardiovasc. Res. 2024, 120, 1427–1441. [Google Scholar] [CrossRef] [PubMed]
- Miller, J.; Miller, R.; Varney, S. M.; Han, D. National poison center trends in GLP-1 receptor agonist exposures following FDA approval for weight loss. J. Med. Toxicol. 2026, 22, 275–285. [Google Scholar] [CrossRef] [PubMed]
- McCall, K. L.; et al. Safety analysis of compounded GLP-1 receptor agonists: a pharmacovigilance study using the FDA adverse event reporting system. Expert Opin. Drug Saf. 2026, 25, 581–588. [Google Scholar] [CrossRef] [PubMed]
- Hendrix, N.; Velásquez, E.; Pham, H.; Bazemore, A. Documentation of compounded GLP-1 receptor agonists in a large primary care dataset. medRxiv 2025. [Google Scholar] [CrossRef]
- Wharton, S.; et al. Orforglipron, an oral small-molecule GLP-1 receptor agonist for obesity treatment. N. Engl. J. Med. 2025, 393, 1796–1806. [Google Scholar] [CrossRef] [PubMed]
- Garvey, W. T.; et al. Coadministered cagrilintide and semaglutide in adults with overweight or obesity. N. Engl. J. Med. 2025, 393, 635–647. [Google Scholar] [CrossRef] [PubMed]
- Wagner, T.; et al. Augmented curation of clinical notes from a massive EHR system reveals symptoms of impending COVID-19 diagnosis. Elife 2020, 9, e58227. [Google Scholar] [CrossRef] [PubMed]
- Varma, G.; et al. Auditable LLM curation of clinical notes refines GLP-1 initiation, persistence ascertainment and compounding use beyond prescription records. Biol. Methods Protoc. 2026. [Google Scholar] [CrossRef] [PubMed]
- von Elm, E.; et al. The Strengthening the Reporting of Observational Studies in Epidemiology (STROBE) statement: guidelines for reporting observational studies. Lancet 2007, 370, 1453–1457. [Google Scholar] [CrossRef] [PubMed]
- Benchimol, E. I.; et al. The REporting of studies Conducted using Observational Routinely-collected health Data (RECORD) statement. PLoS Med. 2015, 12, e1001885. [Google Scholar] [CrossRef] [PubMed]
- Austin, P. C. Balance diagnostics for comparing the distribution of baseline covariates between treatment groups in propensity-score matched samples. Stat. Med. 2009, 28, 3083–3107. [Google Scholar] [CrossRef] [PubMed]
- Welch, B. L. The generalisation of student’s problems when several different population variances are involved. Biometrika 1947, 34, 28–35. [Google Scholar] [CrossRef]
- Przyborowski, J.; Wilenski, H. Homogeneity of results in testing samples from Poisson series. Biometrika 1940, 31, 313–323. [Google Scholar] [CrossRef]
- Benjamini, Y.; Hochberg, Y. Controlling the false discovery rate: A practical and powerful approach to multiple testing. J. R. Stat. Soc. Ser. B Stat. Methodol. 1995, 57, 289–300. [Google Scholar] [CrossRef]
- Lipsitch, M.; Tchetgen Tchetgen, E.; Cohen, T. Negative controls: a tool for detecting confounding and bias in observational studies. Epidemiology 2010, 21, 383–388. [Google Scholar] [CrossRef]
- Murugadoss, K.; et al. Building a best-in-class automated de-identification tool for electronic health records through ensemble learning. Patterns (N. Y.) 2021, 2, 100255. [Google Scholar] [CrossRef] [PubMed]
- Murugadoss, K.; et al. Scaling text de-identification using locally augmented ensembles. medRxiv 2024. [Google Scholar] [CrossRef]
Figure 2.
Weight change in the matched cohorts. (A) Mean percent weight change from baseline in windows from 12 months before to 6-12 months after the index date, in the four matched arms (89, 243, 890, and 890 patients); shaded bands denote 1 standard error of the mean, point labels give the mean at each post-index window, per-window patient counts appear beneath the axis, and the dotted reference line marks the 16.94% average weight loss across the TRIUMPH trial arms at 80 weeks. (B) Mean weight change at 3, 6, and 6-12 months with two-sided Welch t-tests comparing each arm against the direct-to-consumer cohort. Arm colors and marker shapes follow Figure 1.
Figure 2.
Weight change in the matched cohorts. (A) Mean percent weight change from baseline in windows from 12 months before to 6-12 months after the index date, in the four matched arms (89, 243, 890, and 890 patients); shaded bands denote 1 standard error of the mean, point labels give the mean at each post-index window, per-window patient counts appear beneath the axis, and the dotted reference line marks the 16.94% average weight loss across the TRIUMPH trial arms at 80 weeks. (B) Mean weight change at 3, 6, and 6-12 months with two-sided Welch t-tests comparing each arm against the direct-to-consumer cohort. Arm colors and marker shapes follow Figure 1.
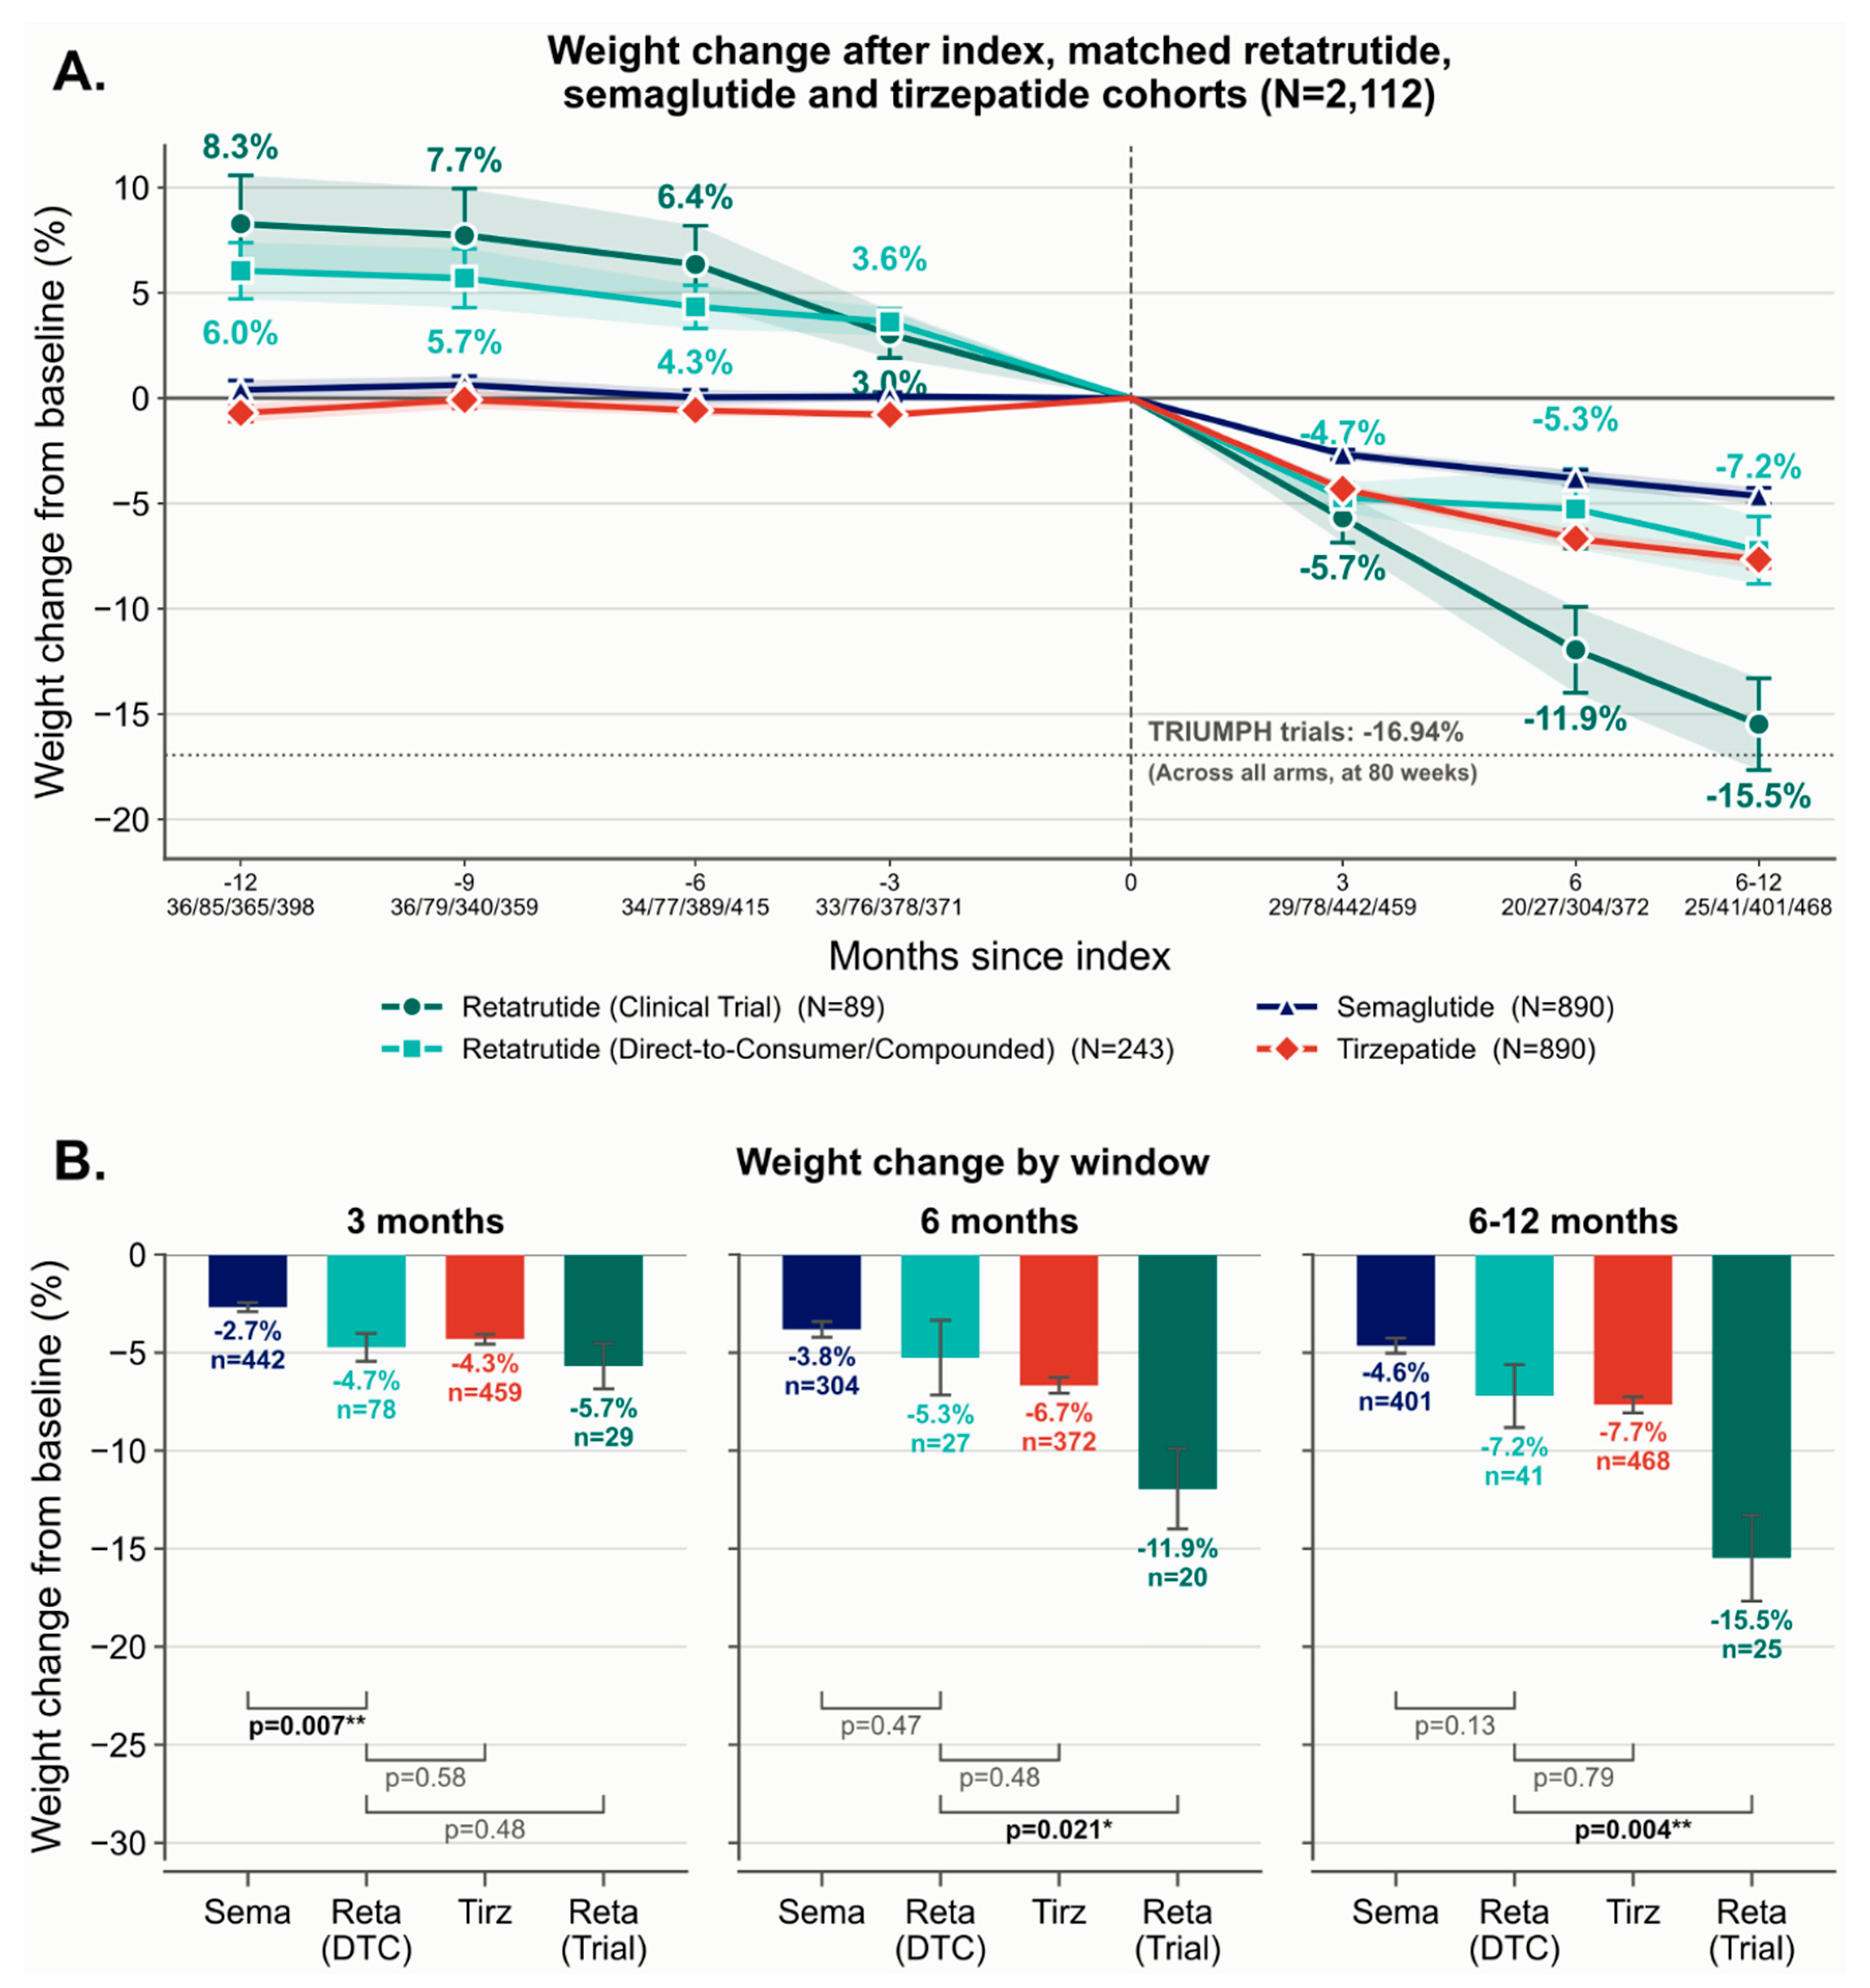
Figure 5.
New-onset symptom incidence across 16 clinical categories. (A) Rate ratios for pooled retatrutide (both cohorts) versus semaglutide (navy) and versus tirzepatide (red), with events, rate ratio, 95% exact Poisson confidence interval, raw P-value, and Benjamini-Hochberg q-value per row; a filled point marks an interval lying entirely above 1. (B) The same endpoint comparing the trial cohort against the direct-to-consumer cohort (teal). Rows are grouped by organ domain; the negative-control row at the foot (incidental findings with no plausible drug mechanism) is excluded from the correction family and reported with raw P-values only. The endpoint is the first post-index mention of a symptom with no pre-index mention, with person-time to each patient's last note and censoring at any incretin switch.
Figure 5.
New-onset symptom incidence across 16 clinical categories. (A) Rate ratios for pooled retatrutide (both cohorts) versus semaglutide (navy) and versus tirzepatide (red), with events, rate ratio, 95% exact Poisson confidence interval, raw P-value, and Benjamini-Hochberg q-value per row; a filled point marks an interval lying entirely above 1. (B) The same endpoint comparing the trial cohort against the direct-to-consumer cohort (teal). Rows are grouped by organ domain; the negative-control row at the foot (incidental findings with no plausible drug mechanism) is excluded from the correction family and reported with raw P-values only. The endpoint is the first post-index mention of a symptom with no pre-index mention, with person-time to each patient's last note and censoring at any incretin switch.
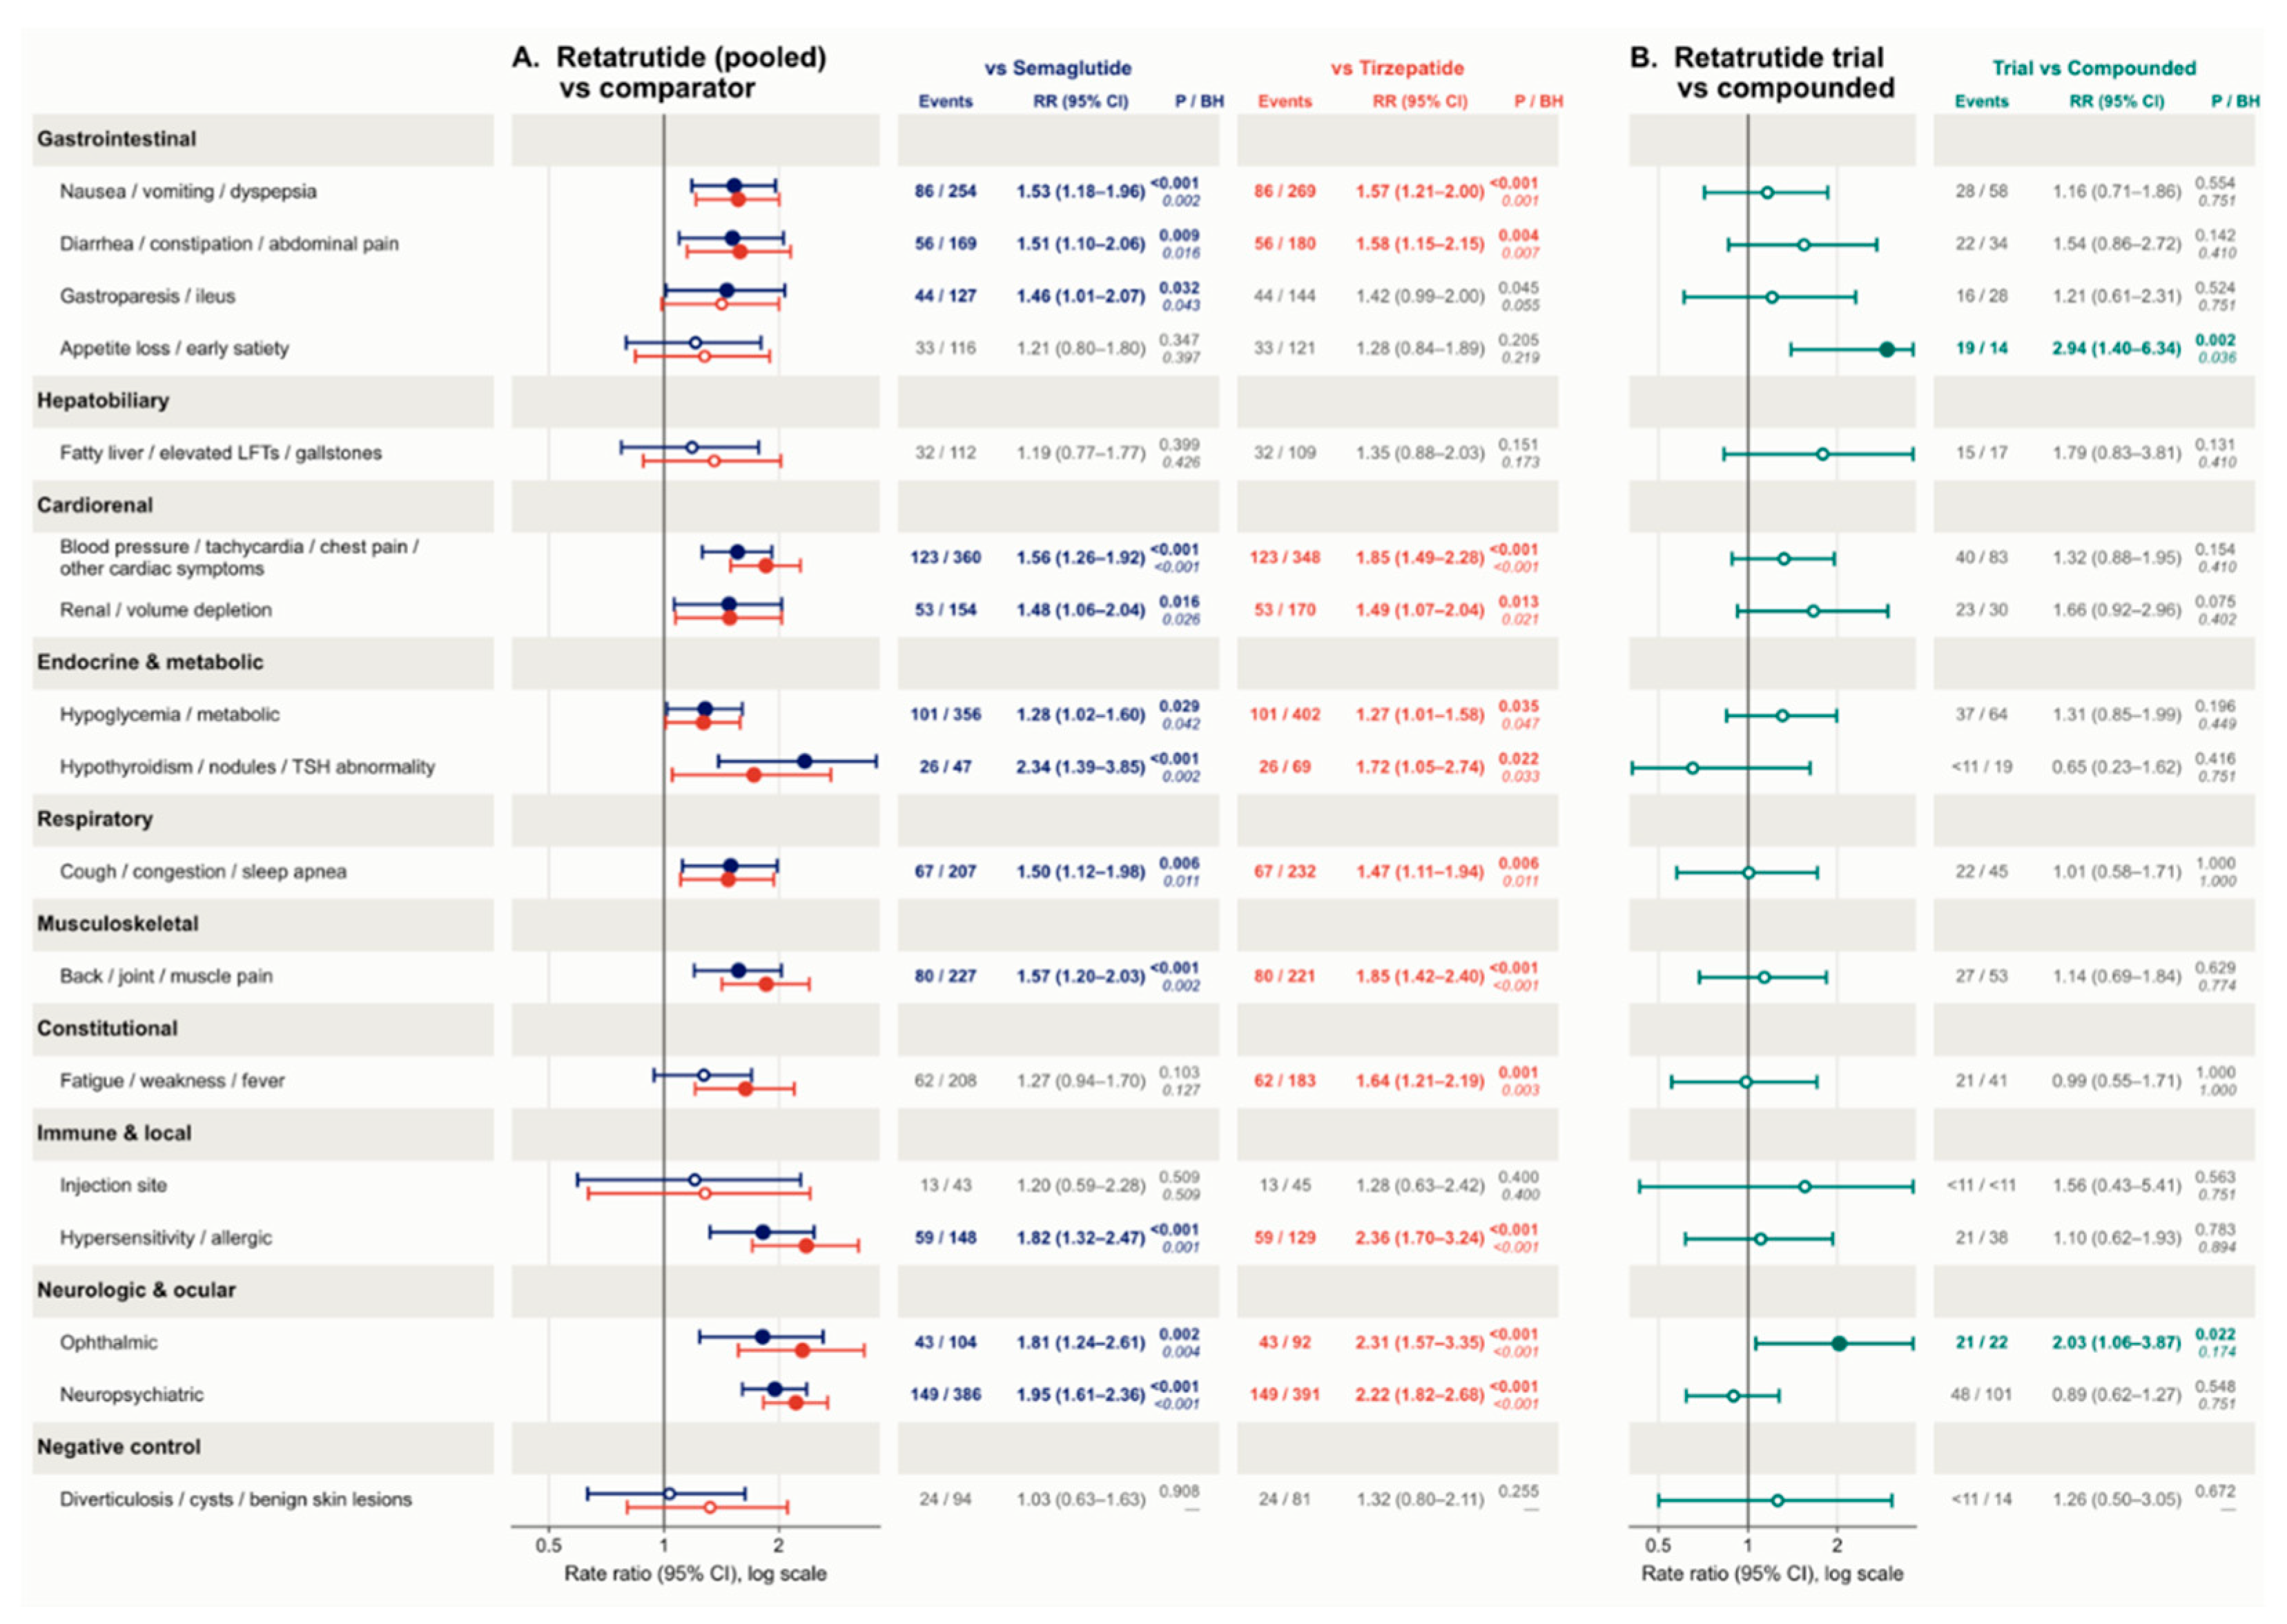

Table 1.
Baseline characteristics of the matched cohorts. Matched cohorts comprise 89 trial retatrutide, 243 direct-to-consumer retatrutide, 890 semaglutide, and 890 tirzepatide patients; the index date is the resolved treatment start for retatrutide users and the first 2025 prescription for comparators. Continuous variables are mean (standard deviation); categorical variables are count (column percentage). Rows are grouped into matching variables, other baseline characteristics, and comorbidities defined as at least one qualifying diagnosis code at any time before index. The SMD column reports the mean absolute SMD over all six pairwise arm comparisons. Cells with counts below 11 are reported as <11 with percentages suppressed, per the privacy convention adopted in this study (Figure 1E).
Table 1.
Baseline characteristics of the matched cohorts. Matched cohorts comprise 89 trial retatrutide, 243 direct-to-consumer retatrutide, 890 semaglutide, and 890 tirzepatide patients; the index date is the resolved treatment start for retatrutide users and the first 2025 prescription for comparators. Continuous variables are mean (standard deviation); categorical variables are count (column percentage). Rows are grouped into matching variables, other baseline characteristics, and comorbidities defined as at least one qualifying diagnosis code at any time before index. The SMD column reports the mean absolute SMD over all six pairwise arm comparisons. Cells with counts below 11 are reported as <11 with percentages suppressed, per the privacy convention adopted in this study (Figure 1E).
| Characteristic | Retatrutide, clinical trial (N=89) | Retatrutide, compounded (N=243) | Semaglutide (N=890) | Tirzepatide (N=890) | Standardized mean difference |
| Matching variables | |||||
| Age at index, years | 51.2 (13.6) | 49.0 (13.4) | 51.5 (13.3) | 51.4 (13.0) | 0.096 |
| Female | 57 (64.0) | 152 (62.6) | 575 (64.6) | 577 (64.8) | 0.026 |
| Race: White | 75 (84.3) | 217 (89.3) | 749 (84.2) | 750 (84.3) | 0.076 |
| Race: Black | <11 | 12 (4.9) | 103 (11.6) | 104 (11.7) | 0.125 |
| Race: other or unknown | <11 | 14 (5.8) | 38 (4.3) | 36 (4.0) | 0.042 |
| Body mass index at index, kg/m² | 33.0 (5.8) | 32.2 (5.7) | 33.7 (5.4) | 33.5 (5.4) | 0.144 |
| Type 2 diabetes | <11 | 11 (4.5) | 71 (8.0) | 70 (7.9) | 0.071 |
| Prior semaglutide or tirzepatide | 33 (37.1) | 89 (36.6) | 322 (36.2) | 330 (37.1) | 0.011 |
| Days since last prior GLP-1 (those with one) | 311.1 (262.5) | 307.1 (277.4) | 242.5 (199.4) | 294.6 (229.3) | 0.156 |
| Other baseline characteristics | |||||
| Baseline weight, kg | 100.1 (26.4) | 95.2 (24.0) | 101.2 (25.4) | 101.0 (24.8) | 0.127 |
| Index calendar year | 2025.1 | 2025.4 | 2025.0 | 2025.0 | 0.427 |
| Prior semaglutide | 24 (27.0) | 60 (24.7) | 0 | 330 (37.1) | 0.549 |
| Prior tirzepatide | 22 (24.7) | 68 (28.0) | 322 (36.2) | 0 | 0.543 |
| Comorbidities (>=1 diagnosis at any time before index) | |||||
| Hypertension | 37 (41.6) | 87 (35.8) | 443 (49.8) | 438 (49.2) | 0.168 |
| Hyperlipidemia | 45 (50.6) | 95 (39.1) | 472 (53.0) | 462 (51.9) | 0.146 |
| Coronary artery disease | <11 | 16 (6.6) | 123 (13.8) | 88 (9.9) | 0.122 |
| Heart failure | <11 | <11 | 49 (5.5) | 47 (5.3) | 0.095 |
| Atrial fibrillation or flutter | <11 | 11 (4.5) | 49 (5.5) | 50 (5.6) | 0.033 |
| Stroke or TIA | <11 | <11 | 46 (5.2) | 53 (6.0) | 0.085 |
| Peripheral arterial disease | <11 | <11 | 68 (7.6) | 65 (7.3) | 0.079 |
| Chronic kidney disease | <11 | <11 | 61 (6.9) | 62 (7.0) | 0.144 |
| Acute kidney injury (history) | <11 | 11 (4.5) | 43 (4.8) | 41 (4.6) | 0.111 |
| Depression | 28 (31.5) | 65 (26.7) | 271 (30.4) | 272 (30.6) | 0.052 |
| Anxiety disorder | 33 (37.1) | 82 (33.7) | 381 (42.8) | 377 (42.4) | 0.112 |
| Bipolar disorder | <11 | <11 | 41 (4.6) | 34 (3.8) | 0.070 |
| Substance use disorder | <11 | 19 (7.8) | 85 (9.6) | 66 (7.4) | 0.102 |
| Dementia or cognitive impairment | <11 | <11 | 14 (1.6) | <11 | 0.092 |
| Eating disorder | <11 | <11 | 19 (2.1) | 17 (1.9) | 0.042 |
| Prediabetes | 26 (29.2) | 60 (24.7) | 311 (34.9) | 345 (38.8) | 0.173 |
| Hypothyroidism | 19 (21.3) | 40 (16.5) | 122 (13.7) | 136 (15.3) | 0.106 |
| Polycystic ovary syndrome | <11 | <11 | 41 (4.6) | 27 (3.0) | 0.075 |
| Infertility | <11 | <11 | 26 (2.9) | 19 (2.1) | 0.092 |
| Obstructive sleep apnea | 32 (36.0) | 57 (23.5) | 277 (31.1) | 307 (34.5) | 0.150 |
| Asthma | 15 (16.9) | 40 (16.5) | 156 (17.5) | 154 (17.3) | 0.016 |
| COPD | <11 | <11 | 49 (5.5) | 28 (3.1) | 0.127 |
| MASLD / fatty liver | 14 (15.7) | 24 (9.9) | 96 (10.8) | 102 (11.5) | 0.092 |
| Cirrhosis or chronic liver disease | <11 | <11 | 20 (2.2) | 19 (2.1) | 0.057 |
| Gastro-oesophageal reflux disease | 31 (34.8) | 57 (23.5) | 284 (31.9) | 282 (31.7) | 0.127 |
| Inflammatory bowel disease | <11 | <11 | 16 (1.8) | 22 (2.5) | 0.026 |
| Pancreatitis | 0 | <11 | <11 | <11 | 0.071 |
| Gallbladder disease | <11 | 16 (6.6) | 68 (7.6) | 68 (7.6) | 0.101 |
| Gastroparesis | <11 | 0 | <11 | <11 | 0.083 |
| Osteoarthritis | 26 (29.2) | 52 (21.4) | 230 (25.8) | 248 (27.9) | 0.098 |
| Osteoporosis | <11 | <11 | 32 (3.6) | 31 (3.5) | 0.059 |
| Rheumatoid or inflammatory arthritis | <11 | <11 | 41 (4.6) | 33 (3.7) | 0.052 |
| Tobacco use disorder | <11 | 21 (8.6) | 140 (15.7) | 119 (13.4) | 0.120 |
| Malignancy (excluding non-melanoma skin) | <11 | 22 (9.1) | 72 (8.1) | 72 (8.1) | 0.041 |
| Venous thromboembolism | <11 | <11 | 34 (3.8) | 39 (4.4) | 0.019 |
| Migraine | 13 (14.6) | 34 (14.0) | 147 (16.5) | 161 (18.1) | 0.065 |
| Medullary thyroid carcinoma or MEN2 | 0 | <11 | <11 | <11 | 0.071 |
| Treatment and follow-up duration | |||||
| Treatment duration, days | 83 [14-185] | 56 [13-105] | 135 [77-225] | 155 [90-255] | - |
| Follow-up duration, days | 125 [57-390] | 130 [78-200] | 270 [165-360] | 255 [165-355] | - |
Table 2.
Manual validation of large language model extractions. Agreement is the proportion of reviewed items the reviewer judged correct, among those they were able to judge; Confidence intervals are Wilson score intervals.
Table 2.
Manual validation of large language model extractions. Agreement is the proportion of reviewed items the reviewer judged correct, among those they were able to judge; Confidence intervals are Wilson score intervals.
| Extraction task | Class | n reviewed | n judged | n correct | Agreement, % (95% CI) |
| Retatrutide exposure | Taking retatrutide | 74 | 74 | 74 | 100.0 (95.1–100.0) |
| Not taking | 50 | 50 | 50 | 100.0 (92.9–100.0) | |
| Unclear | 11 | 11 | 10 | 90.9 (62.3–98.4) | |
| Weighted overall | 99.8 | ||||
| Supply route | Direct-to-consumer / compounded | 60 | 60 | 53 | 88.3 (77.8–94.2) |
| Clinical trial | 20 | 19 | 18 | 94.7 (75.4–99.1) | |
| Other / unknown | 25 | 25 | 24 | 96.0 (80.5–99.3) | |
| Weighted overall | 90.3 | ||||
| Treatment start date | Start-date phrase extracted | 40 | 40 | 36 | 90.0 (76.9–96.0) |
| No start-date phrase | 40 | 40 | 40 | 100.0 (91.2–100.0) |
Disclaimer/Publisher’s Note: The statements, opinions and data contained in all publications are solely those of the individual author(s) and contributor(s) and not of MDPI and/or the editor(s). MDPI and/or the editor(s) disclaim responsibility for any injury to people or property resulting from any ideas, methods, instructions or products referred to in the content. |
© 2026 by the authors. Licensee MDPI, Basel, Switzerland. This article is an open access article distributed under the terms and conditions of the Creative Commons Attribution (CC BY) license (http://creativecommons.org/licenses/by/4.0/).
Copyright: This open access article is published under a Creative Commons CC BY 4.0 license, which permit the free download, distribution, and reuse, provided that the author and preprint are cited in any reuse.