

Submitted:
16 August 2026
Posted:
18 August 2026
You are already at the latest version
Abstract
This study investigated the meteorological factors influencing solar irradiance variability across eight sites in Zambia, using a 10-year monthly dataset covering 2014 to 2024. Ground-based solar irradiance and meteorological data from the Southern African Science Service Centre for Climate Change and Adaptive Land Management (SASSCAL) network, complemented by NASA POWER satellite data and Meteonorm sunshine duration data were used. Physical plausibility tests were performed on the SASSCAL records prior to analysis, after which temporal, spatial, worst-month, and correlation-based methods were used to characterise irradiance behaviour and its atmospheric controls. The results show a consistent annual irradiance cycle which reaches its peak in September-October and declines during the rainy season or cool-dry season depending on a specific location. Kalabo and Samfya showed the highest mean irradiance and seasonal stability, whereas Mpulungu and Mwinilunga recorded lower solar irradiance values and deeper wet-season minima. Worst-month analysis identified January as the critical low-resource month for northern and lake-proximate sites, and June-July for plateau, western, and southern locations. Cloud amount, precipitation and relative humidity emerged as the main suppressors of irradiance, while temperature showed a positive relation and wind speed exhibited site-dependent effects. Atmospheric transparency, as reflected in sunshine duration contrasts, rather than minor differences in astronomical day length, explained the observed spatial differences. These results demonstrate that Zambia's solar resource cannot be characterised by a single national baseline, and that site-specific meteorological conditions should be the basis for solar resource assessment and photovoltaic planning across the country.
Keywords:
solar resource variability
; meteorological drivers
; solar irradiance
; worst-month analysis
; sunshine duration
; photovoltaic energy
1. Introduction
Solar energy has become central to global efforts to expand electricity access, enhance energy security, and reduce dependence on fossil-based energy generation, especially in regions with strong photovoltaic (PV) potential and persistent energy shortfalls (Bowa, 2017; IEA, 2022; World Bank, 2019). In Zambia, this transition is critical and urgent because the national electricity system is heavily dependent on hydropower which is increasingly becoming vulnerable to climate induced shocks. As a result, the country has over the past six years, experienced recurring load-shedding which has intensified interest in PV systems for a more diversified and resilient generation mix (Katundu, 2021; Kapumpu et al., 2020). Similarly, several studies on African energy systems have stressed the need for integration of climate resilient energy systems when planning for reliable power supply systems (Bloomfield et al., 2022; Sarmah et al., 2023).
While there is clearly a global trend towards solar energy technology development and deployment, scientific work is still grappling with understanding factors that affect the variability of solar irradiance in different locations. The viability of solar energy for practical applications does not only depend on the magnitude of the resource but also on its temporal and spatial variability (Asian and Pacific Centre for Transfer of Technology [APCTT], 2009; Polo et al., 2020). Solar irradiance reaching the surface is controlled by atmospheric conditions, such as clouds, aerosols, humidity and precipitation (Barry et al., 2009). They all affect both the quantity and spectral quality of radiation available for PV conversion. Cloud-related processes represent the largest source of uncertainty in irradiance characterisation (Barry et al., 2023), while broader reviews on PV performance consistently identify irradiance level, ambient temperature, humidity, and atmospheric transmissivity as key drivers of the actual system output (Hassan et al., 2024; Sarmah et al., 2023).
Recent review studies further advance the case for evaluating meteorological drivers when investigating solar irradiance variability and its implications for solar PV energy applications. Bamisile et al. (2025) show that PV output is shaped by interacting environmental controls rather than by irradiance alone, with cloud cover, ambient temperature, humidity, wind, aerosols, and soiling influencing both solar resource availability and conversion efficiency. Similarly, Hasan et al. (2022) identify irradiance, temperature, humidity, and dust-related effects as key determinants of PV performance, noting that humid conditions may increase dust adhesion on module surfaces and thereby intensify output losses. All together, these studies indicate that site-specific meteorological conditions are central both to explaining solar irradiance variability and to assessing how that variability translates into PV energy performance across different environments (Bamisile et al., 2025; Hasan et al., 2022).
For solar energy planning, solar irradiance variability is a key design issue because it governs the sizing of both generation capacity and storage systems (APCTT, 2009; Khatib et al., 2016). Comparative studies of irradiance datasets have shown that reliable site-specific solar resource assessment requires local validation (Palmer et al., 2018). This is because the performance of satellite-derived, reanalysis, and interpolated datasets varies with terrain, station density, and latitude. Similar work on renewable variability in Africa shows that meteorologically driven fluctuations in solar generation carry direct implications for planning reliable energy systems by regions that need to diversify a climate-sensitive electricity supply (Bloomfield et al., 2022; World Bank, 2019).
This challenge is especially relevant in Zambia. Although the country is widely recognised as having favourable solar potential, with annual global horizontal irradiation ranging from approximately 1,900 to 2,100 kWh/m2 across much of the country (World Bank, 2019), strong mean availability does not suggest uniformity in conditions across the annual cycle or across locations. Kapumpu et al. (2020) predicted pronounced spatial differences in global irradiance among major Zambian cities, and the World Bank’s Zambia Solar Resource Atlas shows similar results at multiple reference stations (World Bank, 2019). In spite of these results, existing literature on Zambia has focused more on PV feasibility, techno-economic performance, and deployment potential (Bowa, 2017; Katundu, 2021). This has left a gap on empirical, multi-site evaluation of solar irradiance variability and its meteorological controls based on long-term ground-observed records.
In this context, worst-month analysis is valuable because it identifies the seasonal period during which solar availability is most constrained, thus serving as the reference condition for cautious and realistic PV and storage system design (APCTT, 2009; Markvart & Fragaki, 2011). Guidelines on solar resource assessment consistently emphasises that seasonal characterisation is critical for effective planning in environments where weather variability may affect monthly generation performance (APCTT, 2009; Polo et al., 2020). Yet for Zambia, there remains a scarcity of empirical evidence outside Lusaka on the timing and magnitude of worst-month conditions across differing climatic environments, and the meteorological factors that produce them.
Against this background, this study investigates the meteorological drivers of solar resource variability in Zambia using a 10 year monthly datasets from eight sites representing the country’s diverse geographical and environmental conditions. The study addresses three questions: (1) How does solar irradiance vary temporally and spatially across the selected sites? (2) Which meteorological variables are most strongly associated with that variability? (3) Which months represent the most critical seasonal constraints for solar energy applications at each site? The study advances existing literature by providing a distinct multi-site, observational grounded assessment of Zambia’s solar resource that links irradiance behaviour to locally relevant meteorological drivers and identifies site-specific worst-month conditions, offering evidence to support more climate-responsive PV planning in Zambia and other climatically diverse regions in sub-Saharan Africa.
2. Materials and Methods
2.1. Study Area
The study was carried out at eight sites distributed across varying climatic regimes in Zambia, including CBU (Kitwe), Kalabo, Mpulungu, Mwinilunga, Namwala, Samfya, Serenje, and UNZA (Lusaka). These sites were selected purposively to capture Zambia’s broad environmental diversity, covering northern and lake-influenced areas, the central plateau, and the relatively drier western and southern regions. Zambia’s climate gradient ranges from humid tropical conditions in the north, characterised by annual rainfall exceeding 1,200 mm, to drier savanna conditions in the south receiving as little as 600 mm per year, with attendant differences in cloud cover, humidity, and solar availability across Agro-ecological regions (Kapumpu et al., 2020; World Bank, 2019). The geographic spread of the eight sites was intended to capture these differences and provide a basis for assessing how regional climatic differences shape solar resource variability and its meteorological drivers.
2.2. Data Sources
The core dataset consisted of monthly global solar irradiance and associated meteorological records obtained from the SASSCAL automated weather station network in Zambia. This data was accessed through the University of Zambia’s Department of Geographical Sciences, Environmental and Planning. SASSCAL stations are equipped with calibrated pyranometers and automated data loggers that record solar irradiance and related meteorological parameters continuously, with data transmitted through remote terminal units (RTU) to centralised repositories (SASSCAL, 2024). Because the instruments operate on fully automated logging systems, data were received in their original recorded form without manual field transcription. The main variables used from SASSCAL were global solar irradiance, air temperature, relative humidity, wind speed, and precipitation. Site-specific records fell within the broader monitoring period of 2014-2024. However, the temporal coverage varied considerably across locations.
Complementary monthly data were sourced from NASA's Prediction of Worldwide Energy Resources (POWER) database, which included all-sky surface shortwave irradiance, air temperature, cloud amount, precipitation, and relative humidity. Owing to the absence of Cloud amount measurements from SASSCAL ground stations, the variable was sourced exclusively from NASA POWER. Sunshine duration estimates were obtained from Meteonorm software. This software is a widely used climatological tool that interpolates measured data to generate estimates of surface radiation and sunshine hours among others (Remund et al., 2020). In this study, the software was used to provide contextual characterisation of seasonal atmospheric transparency at selected sites using sunshine duration.
2.3. Data Handling
Because SASSCAL stations operate with automated logging and transmission, data were delivered in machine-recorded format and did not require transformation from manual records. Therefore, data handling was restricted to physical plausibility checks and consistency verification prior to analysis. These checks involved screening for values outside physically reasonable irradiance bounds, inspecting for timestamp inconsistencies, and identifying flagged observations noted in the original SASSCAL quality reports. Monthly records were subsequently organised into a unified format across sites, variable labels and units were standardised, and series were verified for completeness prior analysis. This degree of preprocessing was appropriate for the objectives of the present study because the analysis relied on monthly aggregates derived from automated observations and did not require high-frequency gap filling or imputation.
For the satellite-derived NASA POWER data, no further cleaning was undertaken. Verification was limited to confirming that the extracted monthly values corresponded accurately to the specific site coordinates and time periods under analysis.
2.4. Analytical Methods
Temporal analysis focussed on monthly and seasonal irradiance patterns at each site over a 10 year period. The objective was to identify the recurrent annual cycle and the timing of peak and minimum conditions. Spatial analysis assessed mean irradiance levels and relative variability across sites using descriptive statistics, including mean, standard deviation, and coefficient of variation (CV). These measures enabled systematic mapping of solar availability and differences among sites. To identify seasonally critical conditions relevant to PV system design, worst-month analysis was conducted by determining the calendar month with the lowest long-term mean irradiance at each site. The approach was applied in line with the methodology developed by Markvart and Fragaki (2011).
The potential influence of astronomical day length on solar irradiance was assessed by comparing the calculated maximum day-length differences across the eight study sites with the magnitude of the observed irradiance variations. Since the inter-site range in astronomical day length was found to be negligible (approximately 25.8 minutes), sunshine duration, which more accurately reflects the actual beam radiation fraction under prevailing local atmospheric conditions was adopted as the more informative contextual variable.
Meteorological controls on global solar irradiance were assessed through Pearson correlation analysis. This analysis examined the relationships between monthly global solar irradiance and five key covariates: air temperature, relative humidity, precipitation, wind speed, and cloud amount. Correlation coefficients were calculated for each variable–irradiance pair at each of the eight study sites. This approach, applied to the full available monthly time series, enabled the identification of both site-specific relationships and broader cross-site patterns of associations. The results were interpreted in terms of the direction and strength of each relationship, highlighting variables that demonstrated coherent and consistent patterns across multiple monitoring sites.
3. Results and Discussion
3.1. Temporal Variability of Solar Irradiance
Monthly solar irradiance across the eight sites exhibited a consistent and recurring annual cycle, with values rising towards the end of the rainy season (March/April) and decline during the cool dry season. The values peaked around September-October and decline during the first part of the rainy season (November – February) or parts of the cool-dry period depending on location. Figure 1 shows the monthly global solar irradiance patterns across all eight sites during the 2016-2017 comparison period.
The pattern shown in Figure 1, remained consistent across all the comparison periods (2014, 2015, 2016-2017, 2018, 2019, 2020, and 2021-2024). This demonstrates that the seasonal structure is governed by persistent atmospheric drivers rather than short-term year-to-year variability. The regularity of this cycle aligns with the prevailing Inter-Tropical Convergence Zone (ITCZ), which governs Zambia’s rainfall and cloud cover regime (Kapumpu et al., 2020; World Bank, 2019). It is also consistent with broader findings on solar generation seasonality in southern Africa (Bloomfield et al., 2022).
The September-October irradiance maximum corresponds to a period of dry, clear atmospheric conditions preceding the onset of the rainy season, during which atmospheric water vapour and cloud fraction are at seasonal minima (Kapumpu et al., 2020; Sarmah et al., 2023). In contrast, the wet season decline reflects the inverse pattern, with increased cloudiness, moisture loading, and precipitation associated with ITCZ, which progressively reduces surface irradiance from approximately November onward (Bloomfield et al., 2022; World Bank, 2019). Although the amplitude of the seasonal minima varied somewhat across years, the timing of both peaks and troughs remained broadly stable, supporting the use of monthly long-term averages as a reliable basis for seasonal solar resource characterisation in Zambia (APCTT, 2009; Palmer et al., 2018).
3.2. Spatial Contrasts in Solar Resource
Persistent spatial differences were observed across the eight sites. Kalabo and Samfya consistently recorded the highest mean irradiance at 253.1 W/m² and 258.0 W/m² respectively, while Mpulungu and Mwinilunga recorded the lowest at approximately 216-220 W/m². UNZA and Serenje occupied intermediate positions, and CBU and Namwala varied between intermediate and relatively higher irradiance levels depending on season. This spatial distribution of irradiance variability is further illustrated by the boxplots in Figure 2 and the variability ranking in Figure 3.
The figure above illustrates observed differences in tail behaviour, whiskers, mean values and interquartile ranges for the 2016-2017 comparison period. The results confirm that the spatial structure of Zambia’s solar resource constitutes a resilient climatological feature rather than a period-specific irregularity. The finding is consistent with long-term patterns identified in the World Bank Solar Resource Atlas (World Bank, 2019).
These rankings in variability remained stable across all comparison periods, indicating a persistent spatial structure in Zambia’s solar resource.
3.3. Worst-Month Conditions
The worst month of solar irradiance was location-specific, demonstrating that a single nationally prescribed design month would fail to capture the climatic diversity that characterises Zambia's solar resource. This finding is in line with the site-specific worst-month patterns predicted by both Kapumpu et al. (2020) and the World Bank (2019) for reference stations across Zambia. January emerged as the low-resource solar resource month at Mpulungu, Mwinilunga, Samfya, CBU in Kitwe, and Serenje, whereas June was the worst month at UNZA in Lusaka and Kalabo, and July at Namwala. This spatial differentiation reflects a systematic north-south contrast in the dominant seasonal drivers. In northern sites, ITCZ-related cloudiness and moisture loading are most pronounced, producing the strongest suppression of irradiance. By contrast, plateau, western, and southern sites reach their irradiance minimum during the June-July cool-dry period, when reduced solar elevation angles rather than cloud cover constitute the primary constraint on received solar radiation.
When viewed in terms of Agro-ecological regions, Table 1 indicates a distinct regional stratification in worst-month solar-resource conditions. The magnitude of the worst-month minima varied across sites as shown in Table 1 below.
All study sites located in Agro-ecological Region III experienced their lowest irradiance during the rainy season, whereas the Region II sites reached their minimum during the cold-dry season. This contrast suggests that the principal seasonal meteorological and astronomical drivers on irradiance differ across Zambia’s environmental zones, with wet-season cloud and moisture effects dominating in Region III and cold-season solar-geometry limitations becoming more influential in Region II. Kalabo maintained the highest worst-month irradiance of all sites, implying a relatively more resilient solar resource during its annual minimum period and a more favourable basis for PV system performance. The inter-site spread of solar irradiance, a range of approximately 48 W/m² between the highest and lowest worst-month values, is directly relevant to PV and storage system design. Sizing decisions anchored in worst-month conditions may differ substantially depending on which site is under consideration.
3.4. Day Length, Sunshine Duration, and Atmospheric Transparency
The Astronomical day length was calculated using:
where dn is daylength in days, ϕ latitude in degrees (positive north, negative south), and ẟ solar declination angle (in degrees),
The seasonal and spatial variation in daylight across the eight sites is shown in Figure 4 with the theoretical interval between sunrise and sunset dependent primarily on latitude and solar declination.
The Figure shows that day length does vary seasonally and therefore contributes to seasonal differences in potential surface irradiance. Although solar elevation angle and altitude may influence the intensity of radiation received at the surface by affecting atmospheric path length and attenuation (Roderick, 1992), the inter-site variation in astronomical day length across the eight study locations was very small, with a maximum difference of only about 25.8 minutes. This narrow range is insufficient to explain the pronounced spatial contrasts observed in solar irradiance variability across the eight sites.
As shown in Figure 5, sunshine duration varied much more strongly across seasons and sites than astronomical day length.
While Mwanza et al. (2017) recognise a December maximum and June minimum in sunshine hours at the national scale, the present results show that this pattern reflects astronomical sunshine duration rather than the actual duration of bright sunshine received at the surface. By distinguishing realised sunshine duration from theoretical day length, the Meteonorm outputs further demonstrate that sunshine availability is not nationally uniform but varies markedly across sites and seasons in response atmospheric transparency. By contrast, the onset of the hot season in September and October, despite coinciding with high global surface irradiance, is accompanied by a decline in sunshine duration, indicating that atmospheric transparency begins to deteriorate before the full onset of the rainy season. The present results from Meteonorm therefore help explain why locations with broadly similar day-length conditions can still exhibit substantial differences in observed irradiance and PV energy potential.
3.5. Meteorological Drivers of Solar Irradiance Variability
The solar irradiance variability in Zambia shows a direct relationship with atmospheric moisture and cloud-related processes, which function as the primary drivers. The study sites experienced continuous decreases in solar irradiance because of cloud cover and relative humidity and precipitation, which served as the primary factors that reduced sunlight exposure. The findings confirm existing research about PV and solar energy systems which demonstrates that atmospheric conditions, particularly cloud cover and humidity and aerosol levels and transmissivity changes, determine the amount of solar radiation that reaches the Earth surface, which affects photovoltaic energy production (Bamisile et al., 2025; Hasan et al., 2022; Sarmah et al., 2023). This study demonstrates that these drivers function as fundamental elements which establish direct links to the studied locations through their impact on controlling relationships between Northern Lake areas and areas with dryer Plateau Western territory.
(a) Cloud amount:Figure 6 shows the variation in cloud amount across the eight sites.
As shown in Figure 6, cloud amount exhibited the strongest and most direct negative relation with solar irradiance across the eight study sites. This observation confirms that cloudiness is the dominant immediate control on shortwave attenuation in Zambia. This is expected because increased cloud cover reduces the transmission of direct solar radiation through reflection, absorption, and scattering, thereby lowering the irradiance available at the surface. Similar results have been reported in studies that identify cloud processes as one of the principal sources of irradiance variability and PV output fluctuation (Barry et al., 2023; Bamisile et al., 2025). In the present Zambian context, the strong cloud–irradiance relationship provides the clearest explanation for the pronounced wet-season suppression observed at the more humid northern and lake-proximate sites, and it shows that spatial differences in solar resource performance are fundamentally linked to cloud persistence rather than to solar geometry alone.
(b) Relative humidity.Figure 7 shows that relative humidity also maintained a consistently negative relationship with irradiance across the sites.
cThe observed influence of relative humidity on solar irradiance variability can be interpreted as both a direct and indirect indicator of reduced atmospheric transmissivity. High humidity commonly coincides with air masses rich in moisture, enhanced cloud formation, and greater scattering conditions, all of which reduce the amount of solar radiation reaching the surface. This interpretation aligns with Hasan et al. (2022), who identify humidity as an important environmental determinant of PV performance, and with Sarmah et al. (2023), who show that humidity-related atmospheric effects can reduce PV-relevant irradiance conditions. In this study, the negative humidity relationship clarifies why sites exposed to stronger wet-season moisture loading experience deeper irradiance minima and lower effective solar availability than the drier western and plateau sites.
(c) Precipitation: The relationship between solar irradiance and precipitation across the eight sites.
As illustrated in Figure 8, precipitation was negatively correlated with irradiance at all eight sites, indicating that rainfall months correspond to periods of reduced solar-resource availability. This observation agrees with earlier studies that reported inverse relationships between rainfall and solar radiation, especially in tropical environments where wetter periods are accompanied by greater cloud cover, higher atmospheric moisture, and reduced transmissivity (Diagne et al., 2024; Al-Waeli et al., 2022). The stronger negative results observed at Mpulungu, Mwinilunga, and Samfya indicate that, in the wetter and more humid parts of Zambia, rainfall occurs within more persistent cloudy conditions that continue to suppress solar irradiance beyond the timing of individual rainfall events. Precipitation is not an isolated solar irradiance variability driver. It is a visible manifestation of the broader cloud-rich and moisture-rich atmospheric regime associated with irradiance suppression.
(d) Air temperature.Figure 9 indicates a positive relationship between air temperature and irradiance across the eight sites.
This observed positive correlation in Figure 9 reflects seasonal variation with highest-irradiance periods coincide with warmer conditions, especially during the dry and hot seasons preceding the rains. This means that temperature is not a driver of solar irradiance variability but can act as a climatic marker of high-solar irradiance resource periods. This aligns well with PV performance literature showing that irradiance and temperature often rise together seasonally, even though elevated module temperature can reduce electrical efficiency at the modular level (Hasan et al., 2022; Hassan et al., 2024).
(e) Wind speed.Figure 10 shows that wind speed had the most spatially heterogeneous association with irradiance.
Moderate positive correlations were observed at CBU (Kitwe), Serenje, Mpulungu, and Samfya. Whereas UNZA (Lusaka), Namwala, and Mwinilunga showed weak positive relationships. Kalabo showed a weak negative correlation. Moderate positive correlations indicate that stronger winds coincide with dry-season conditions and enhanced boundary-layer mixing that may promote aerosol dispersion and surface irradiance. The weaker and negative relationships at other sites may reflect local circulation effects including floodplain moisture recycling at Kalabo and mesoscale dynamics that decouple wind from cloud regimes. Wind therefore operates as a secondary and site-dependent influence rather than a systematic driver of irradiance variability.
The results show that irradiance variability in Zambia is controlled mainly by atmospheric transparency, especially cloud amount, relative humidity, and precipitation. Temperature and wind have more conditional effects. The findings further show that solar-resource variability cannot be explained adequately by annual mean values alone, because local meteorological regimes regulate the seasonal and spatial transmission of solar radiation. This clarifies why northern and lake-influenced sites experience deeper low-solar resource conditions than the drier western and plateau sites. The study therefore contributes new multi-site evidence from Zambia by linking meteorological drivers directly to spatial and seasonal irradiance variability across contrasting environments, rather than treating the country as a uniform solar-resource zone.
4. Conclusions
This study investigated the meteorological drivers of solar irradiance variability across eight sites in Zambia. It has revealed clear seasonal and spatial contrasts in solar-resource availability. Irradiance was generally higher and more stable at some western (Kalabo) and central sites, but lower and more strongly suppressed at northern (Mwinilunga) and lake-influenced locations (Mpulungu). The analysis further highlighted a regionally stratified worst-month pattern, with January emerging as the critical low-resource month at the wetter northern and lake-proximate sites, while June to July was more limiting at the plateau, western, and southern sites. Sunshine duration also followed a clear seasonal pattern, increasing from the rainy season into the dry season, implying that atmospheric transparency, rather than day length alone, is a key driver of irradiance availability. Cloud amount, relative humidity, and precipitation emerged as the principal negative drivers, showing that irradiance variability in Zambia is shaped mainly by spatial and seasonal differences in atmospheric transparency rather than by a uniform national solar-resource pattern.
The study is, however, was constrained by some missing data across some locations and by the absence of aerosol data, which may also act as important atmospheric drivers of solar irradiance variability. Future research should therefore incorporate longer and more spatially consistent observational records, aerosol-related variables, and ground-based higher-resolution cloud, sunshine-duration records to strengthen understanding of the drivers of local solar-resource variability and seasonal constraints. Future work should also examine how the identified worst-month patterns and sunshine-duration contrasts affect PV yield, storage requirements, and system reliability under different regional conditions. By showing that Zambia’s solar resource is spatially heterogeneous, seasonally stratified, and influenced by distinct meteorological drivers, this study provides an empirical foundation for more site-specific, climate-responsive, and reliable photovoltaic assessment and planning in the country.
Acknowledgments
The authors gratefully acknowledge the Southern African Science Service Centre for Climate Change and Adaptive Land Management (SASSCAL) for providing the ground-based meteorological and solar irradiance data used in this study. We also thank the Department of Geographical Sciences, Environmental and Planning, University of Zambia, for facilitating access to the SASSCAL dataset. We further acknowledge NASA POWER for providing satellite-derived meteorological data and Meteonorm for the sunshine duration data used to support the analysis.
References
- Asian and Pacific Centre for Transfer of Technology. Solar energy resource assessment handbook; APCTT, 2009. [Google Scholar]
- Bamisile, O.; Acen, C.; Cai, D.; Huang, Q.; Staffell, I. The environmental factors affecting solar photovoltaic output. Renew. Sustain. Energy Rev. 208 2025, 115073. [Google Scholar] [CrossRef]
- Hasan, D. S.; Farhan, M. S.; Alrikabi, H. T. S. Impact of cloud, rain, humidity, and wind velocity on PV panel performance. Wasit J. Eng. Sci. 2022, 10(2), 34–43. [Google Scholar] [CrossRef]
- Dramé, M. S.; N'Diaye, P. M.; Niang, S. A. A.; Diallo, I.; Sarr, A.; Gueye, A.; Niang, D. N. On the characterization of cloud occurrence and its impact on solar radiation in Mbour, Senegal. J. Atmos. Sol.-Terr. Phys. 261 2024, 106284. [Google Scholar] [CrossRef]
- Bloomfield, H. C.; Wainwright, C. M.; Drew, D. R.; Scholes, S. C.; Counselman, K. I. C. Characterizing the variability and meteorological drivers of wind power and solar power generation over Africa. Meteorol. Appl. 2022, 29(5), e2093. [Google Scholar] [CrossRef]
- Bowa, K. C. Solar photovoltaic energy progress in Zambia. In Proceedings of the 2017 Southern African Universities Power Engineering Conference (SAUPEC); IEEE, 2017; pp. 471–476. [Google Scholar]
- Hassan, A. A.; Atia, D. M.; El-Madany, H. T.; Eliwa, A. Y. Performance assessment of a 30.26 kW grid-connected photovoltaic plant in Egypt. Clean. Energy 2024, 8(6), 120–133. [Google Scholar] [CrossRef]
- Hasan, K.; Yousuf, S. B.; Tushar, M. S. H. K.; Das, B. K.; Das, P.; Islam, M. S. Effects of different environmental and operational factors on the PV performance: A comprehensive review. Energy Sci. Eng. 2022, 10(2), 656–675. [Google Scholar] [CrossRef]
- International Energy Agency. World energy outlook 2022 . IEA. 2022. Available online: https://www.iea.org/reports/world-energy-outlook-2022.
- Kapumpu, M.; Chabala, A.; Mwanza, M. Prediction of optimal solar PV battery sizing for off-grid residential use in Zambia. J. Energy South. Afr. 2020, 31(3), 14–26. [Google Scholar] [CrossRef]
- Katundu, I. A solar photovoltaic performance and financial modeling solution for grid-connected homes in Zambia. Int. J. Photoenergy 2021, 8870109. [Google Scholar] [CrossRef]
- Khatib, T.; Ibrahim, I. A.; Mohamed, A. A review on sizing methodologies of photovoltaic array and storage battery in a standalone photovoltaic system. Energy Convers. Manag. 2016, 120, 430–448. [Google Scholar] [CrossRef]
- Markvart, T.; Fragaki, A. PQS solar autonomy calculation method.; University of Southampton & World Health Organization Performance, Quality and Safety Programme, 2011; Available online: https://extranet.who.int/prequal/key-resources/documents/solar-autonomy-calculation-method.
- Mwanza, M.; Chachak, J.; Çetin, N. S.; Ülgen, K. Assessment of solar energy source distribution and potential in Zambia. Period. Eng. Nat. Sci. 2017, 5(2), 103–116. [Google Scholar] [CrossRef]
- NASA. POWER: Prediction of worldwide energy resources [Data set]. National Aeronautics and Space Administration. 2024. Available online: https://power.larc.nasa.gov.
- Palmer, D.; Huld, T.; Šúri, A.; Dunlop, E. D. Satellite or ground-based measurements for production of site specific typical meteorological years? Sol. Energy 2018, 173, 1240–1255. [Google Scholar] [CrossRef]
- Polo, J.; Martín-Pomares, L.; Sanfilippo, A. (Eds.) Solar resources mapping: Fundamentals and applications; Springer, 2020. [Google Scholar] [CrossRef]
- Remund, J.; Müller, S.; Schilter, C.; Rihm, B. Meteonorm handbook part I: Software (Version 8.0); Meteotest AG, 2020. [Google Scholar]
- Roderick, M. L. Methods for calculating solar position and day length including computer programs and subroutines. Department of Primary Industries and Regional Development, Western Australia, Perth. Report 137. 1992. Available online: https://library.dpird.wa.gov.au/rmtr/123.
- SASSCAL. SASSCAL weather net [Data set]; Southern African Science Service Centre for Climate Change and Adaptive Land Management, 2024; Available online: https://www.sasscalweathernet.org.
- Sarmah, P.; Das, D.; Saikia, M.; Kumar, V.; Yadav, S. K.; Paramasivam, P.; Dhanasekaran, S. Comprehensive analysis of solar panel performance and correlations with meteorological parameters. ACS Omega 2023, 8(50), 47897–47904. [Google Scholar] [CrossRef] [PubMed]
- https://doi.org/10.1021/acsomega.3c06442
- World Bank. Solar resource and PV potential of Zambia: Solar resource atlas; World Bank Group / ESMAP, 2019; Available online: https://documents1.worldbank.org/curated/en/139281556198757322/pdf/Solar-Resource-and-PV-Potential-of-Zambia-Solar-Resource-Atlas.pdf.
Figure 1.
Monthly global solar irradiance patterns across the eight study sites for the 2016–2017 comparison period.
Figure 1.
Monthly global solar irradiance patterns across the eight study sites for the 2016–2017 comparison period.
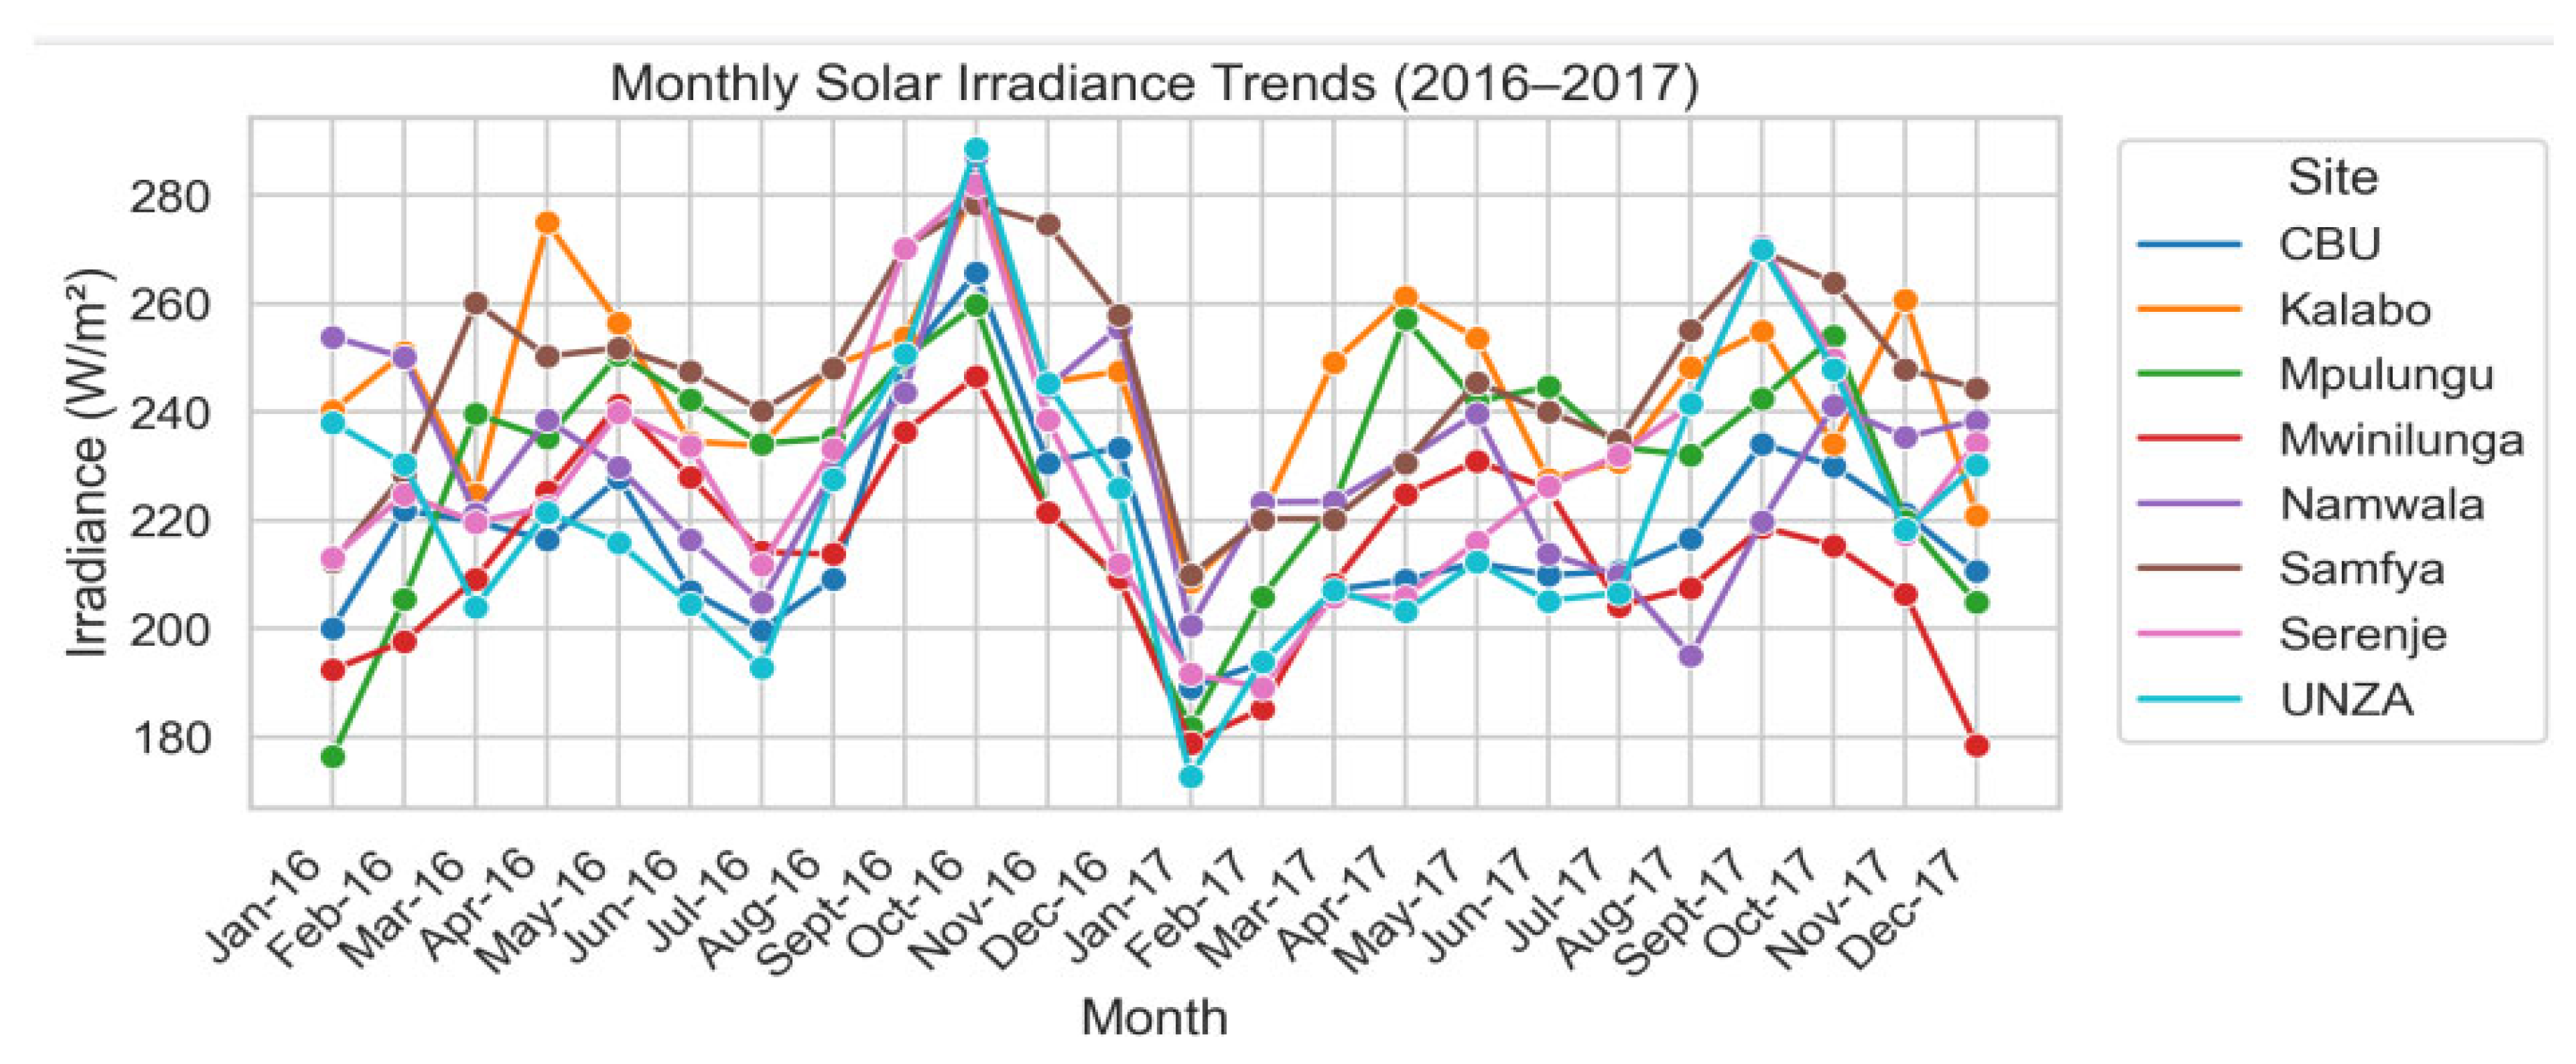
Figure 2.
Boxplot comparison of monthly global solar irradiance across the eight study sites for 2016-2017.
Figure 2.
Boxplot comparison of monthly global solar irradiance across the eight study sites for 2016-2017.
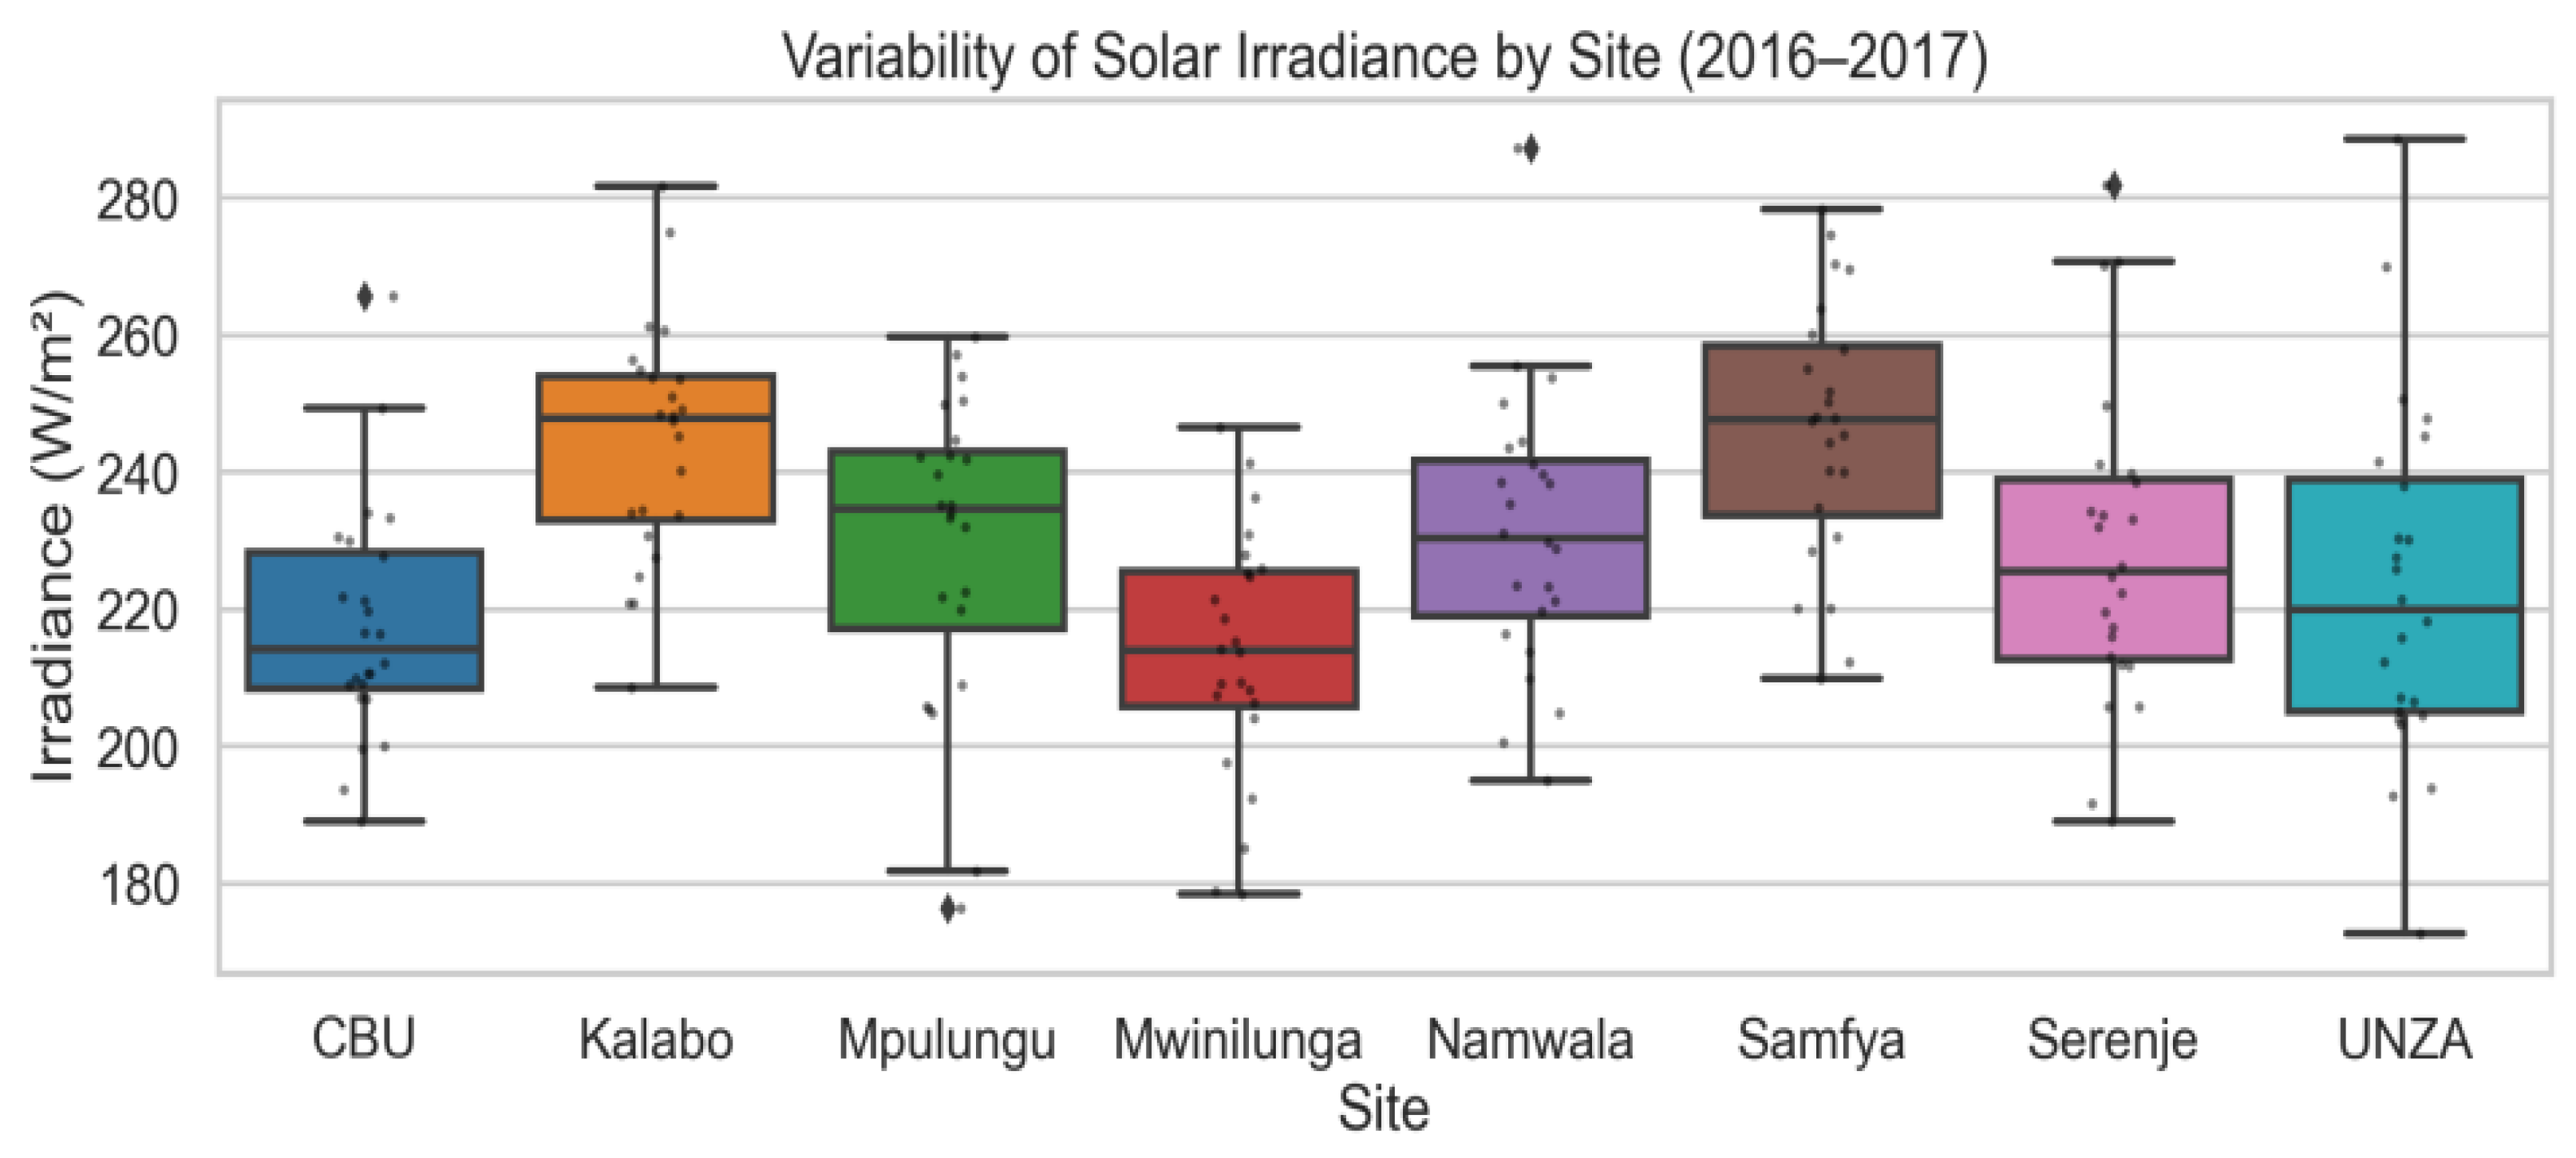
Figure 3.
Spatial variability of monthly solar irradiance across the study sites based on summary dispersion measures.
Figure 3.
Spatial variability of monthly solar irradiance across the study sites based on summary dispersion measures.
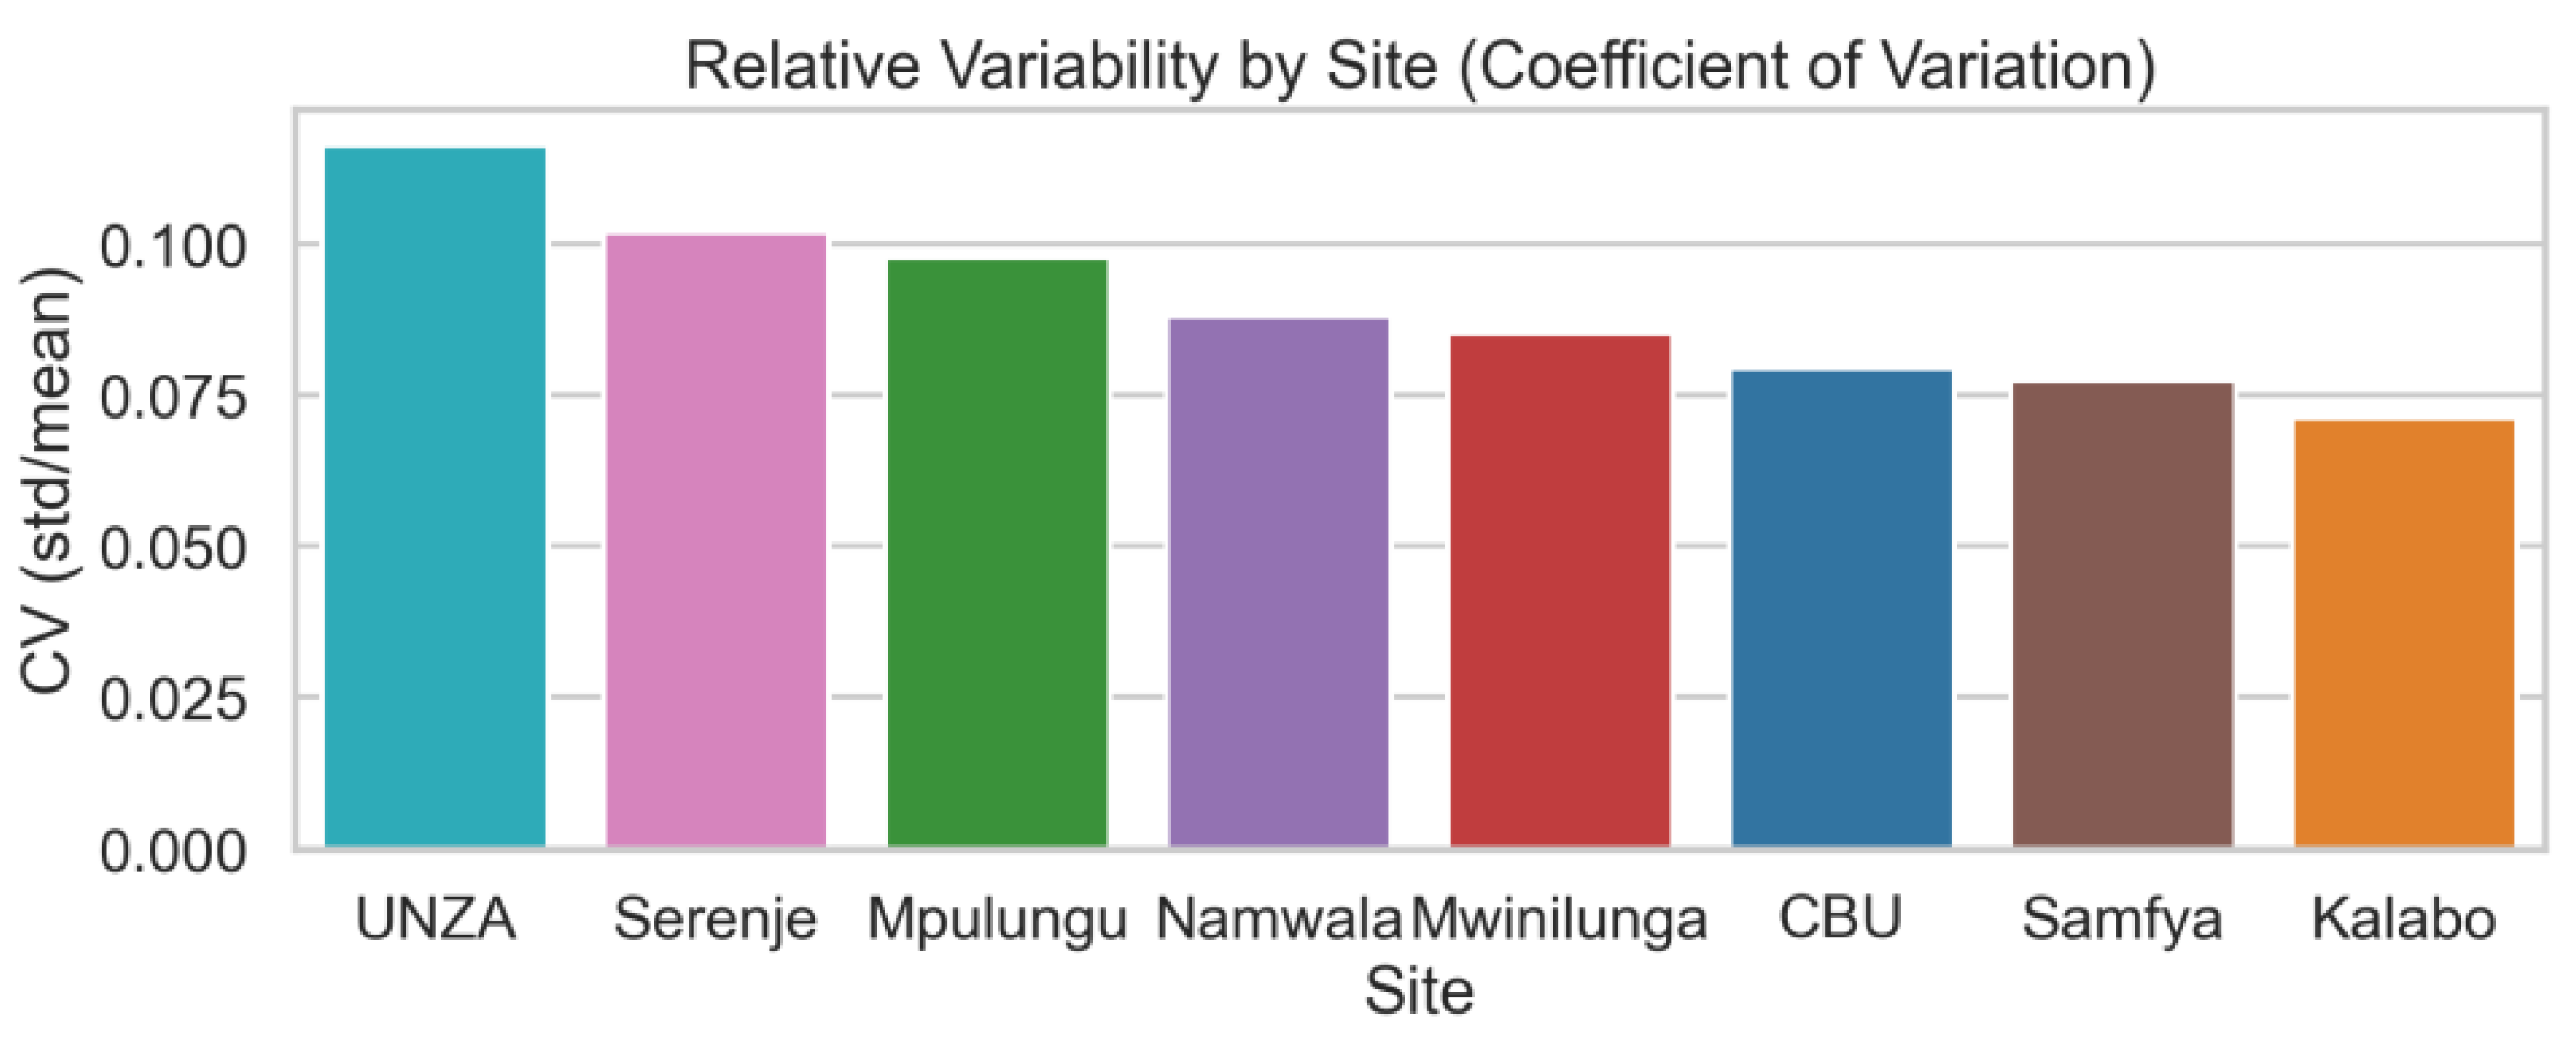
Figure 4.
Astronomical day length across the eight study sites, showing minimal inter-site variation.
Figure 4.
Astronomical day length across the eight study sites, showing minimal inter-site variation.
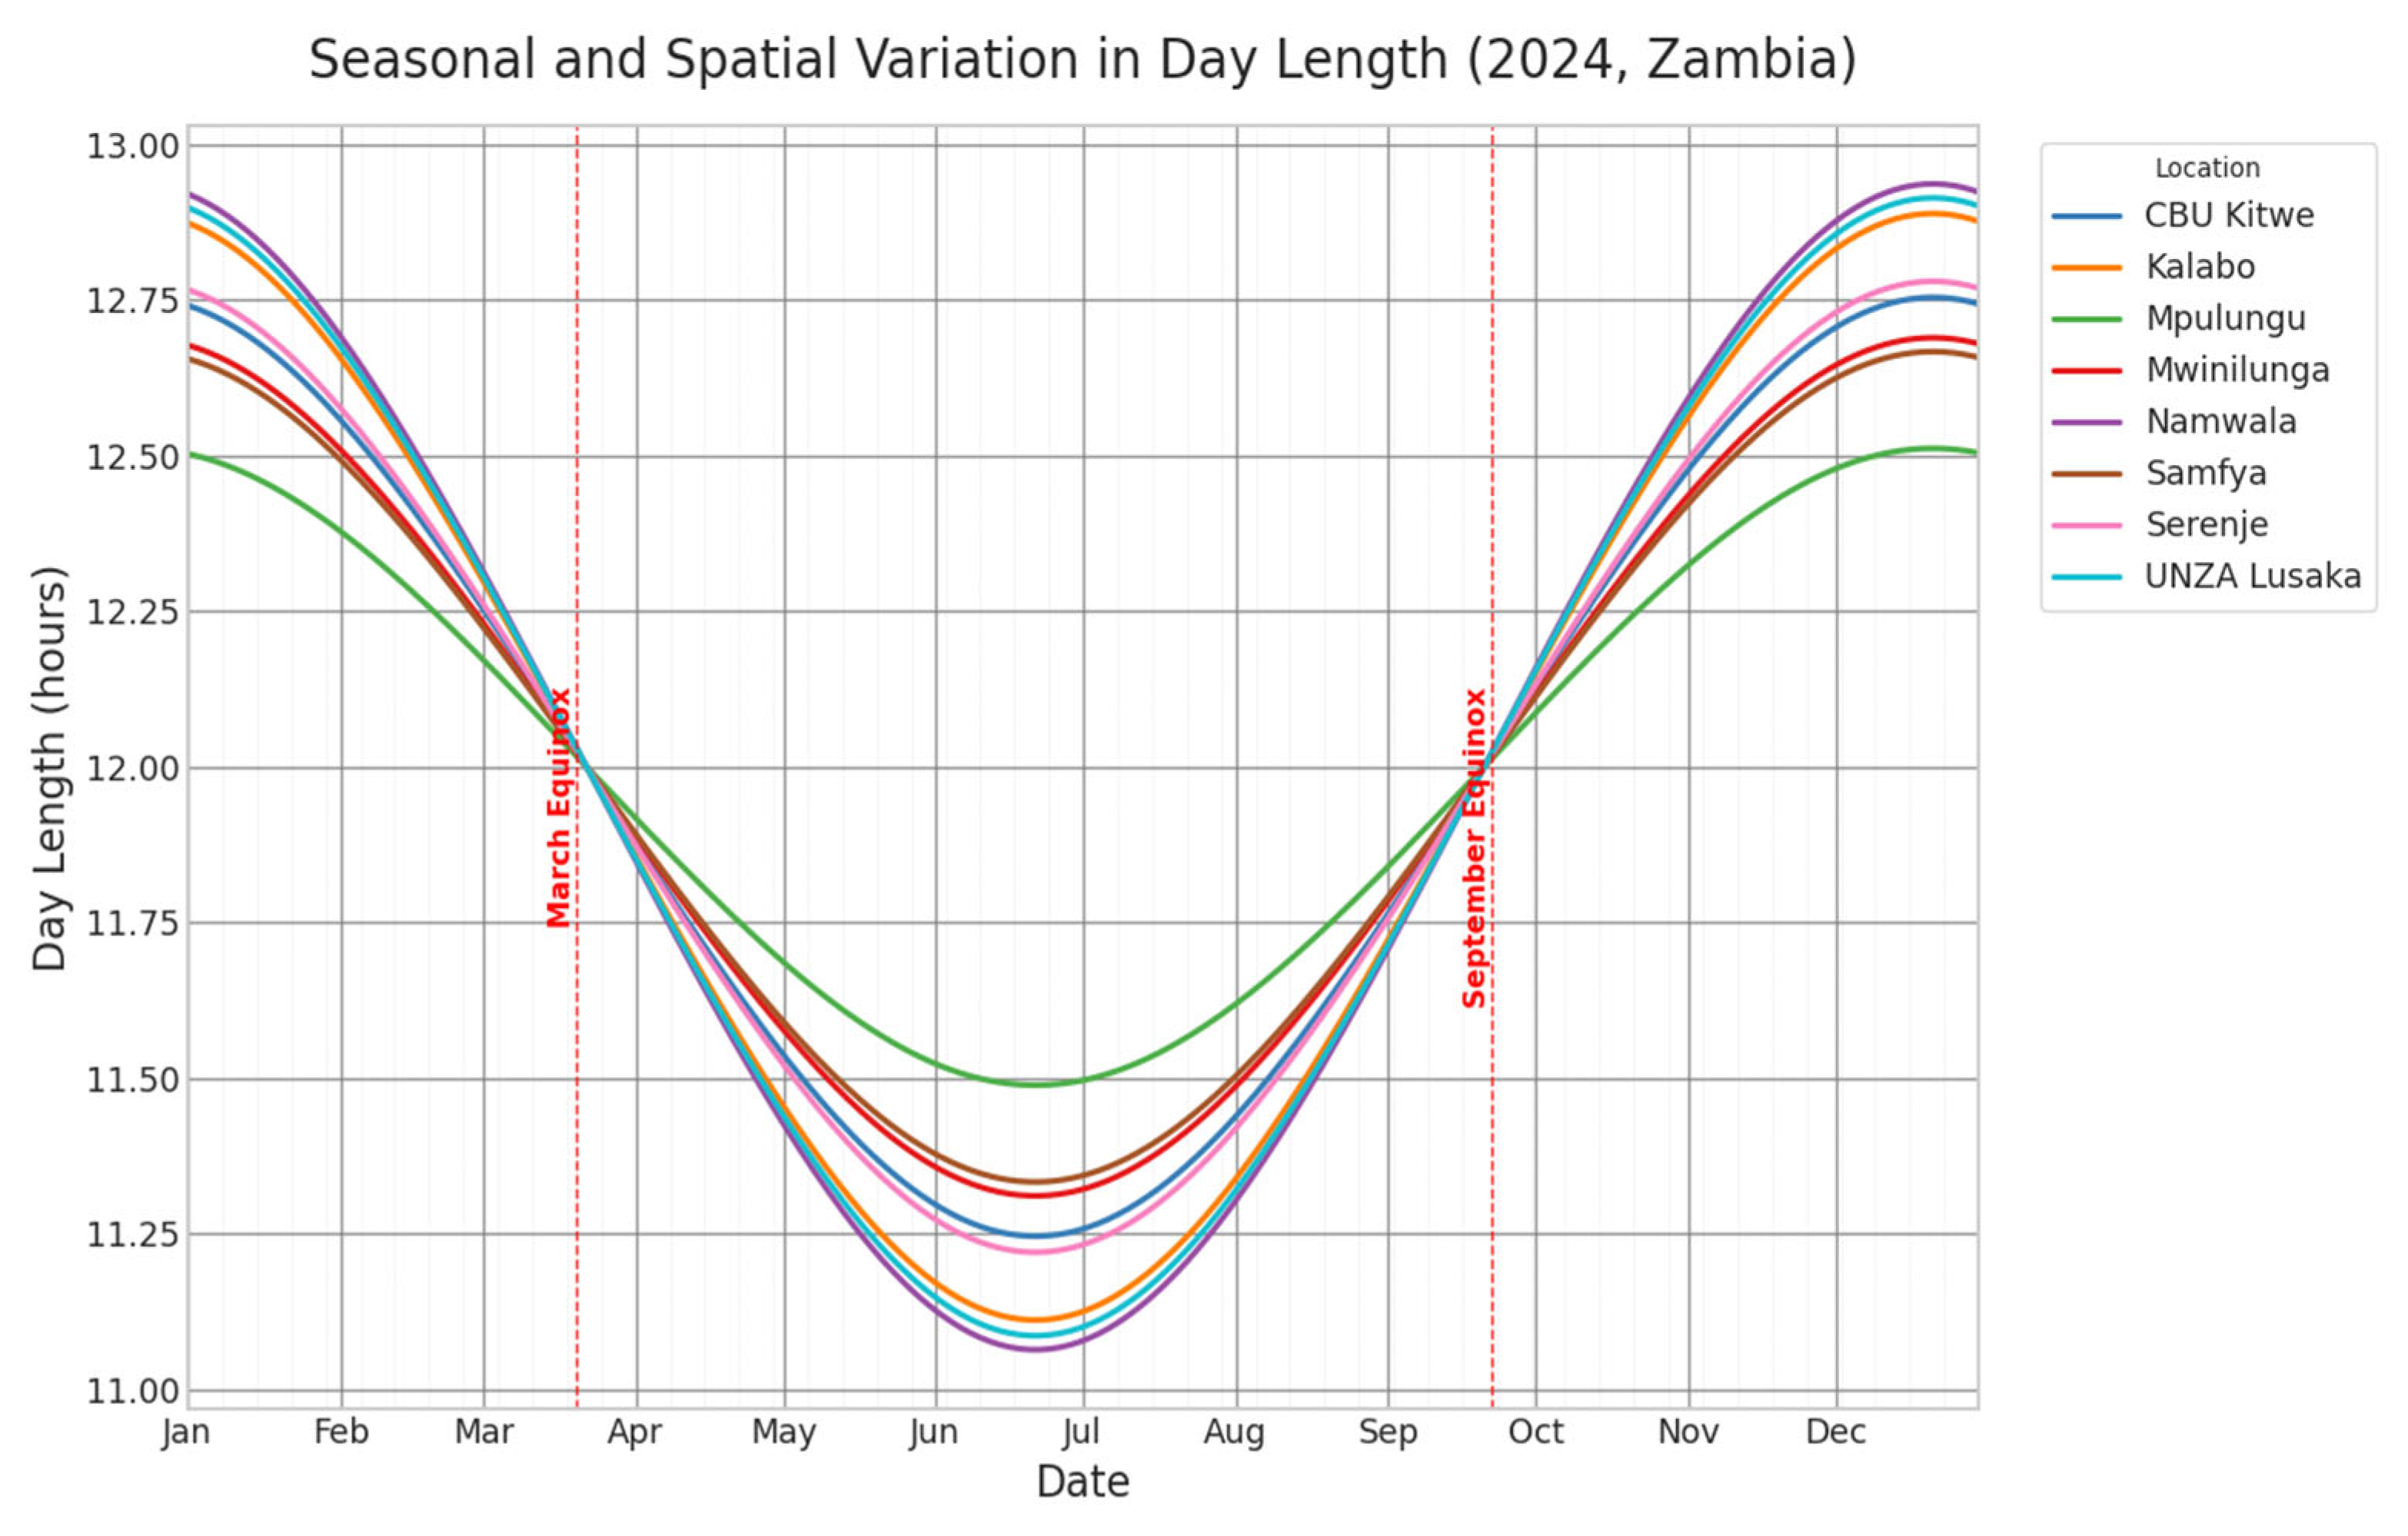
Figure 5.
Seasonal sunshine-duration profiles for the eight study sites: (a) Kalabo, (b) CBU Kitwe, (c) Mwinilunga, (d) Mpulungu, (e) Namwala, (f) Samfya, (g) Serenje, and (h) UNZA Lusaka.
Figure 5.
Seasonal sunshine-duration profiles for the eight study sites: (a) Kalabo, (b) CBU Kitwe, (c) Mwinilunga, (d) Mpulungu, (e) Namwala, (f) Samfya, (g) Serenje, and (h) UNZA Lusaka.
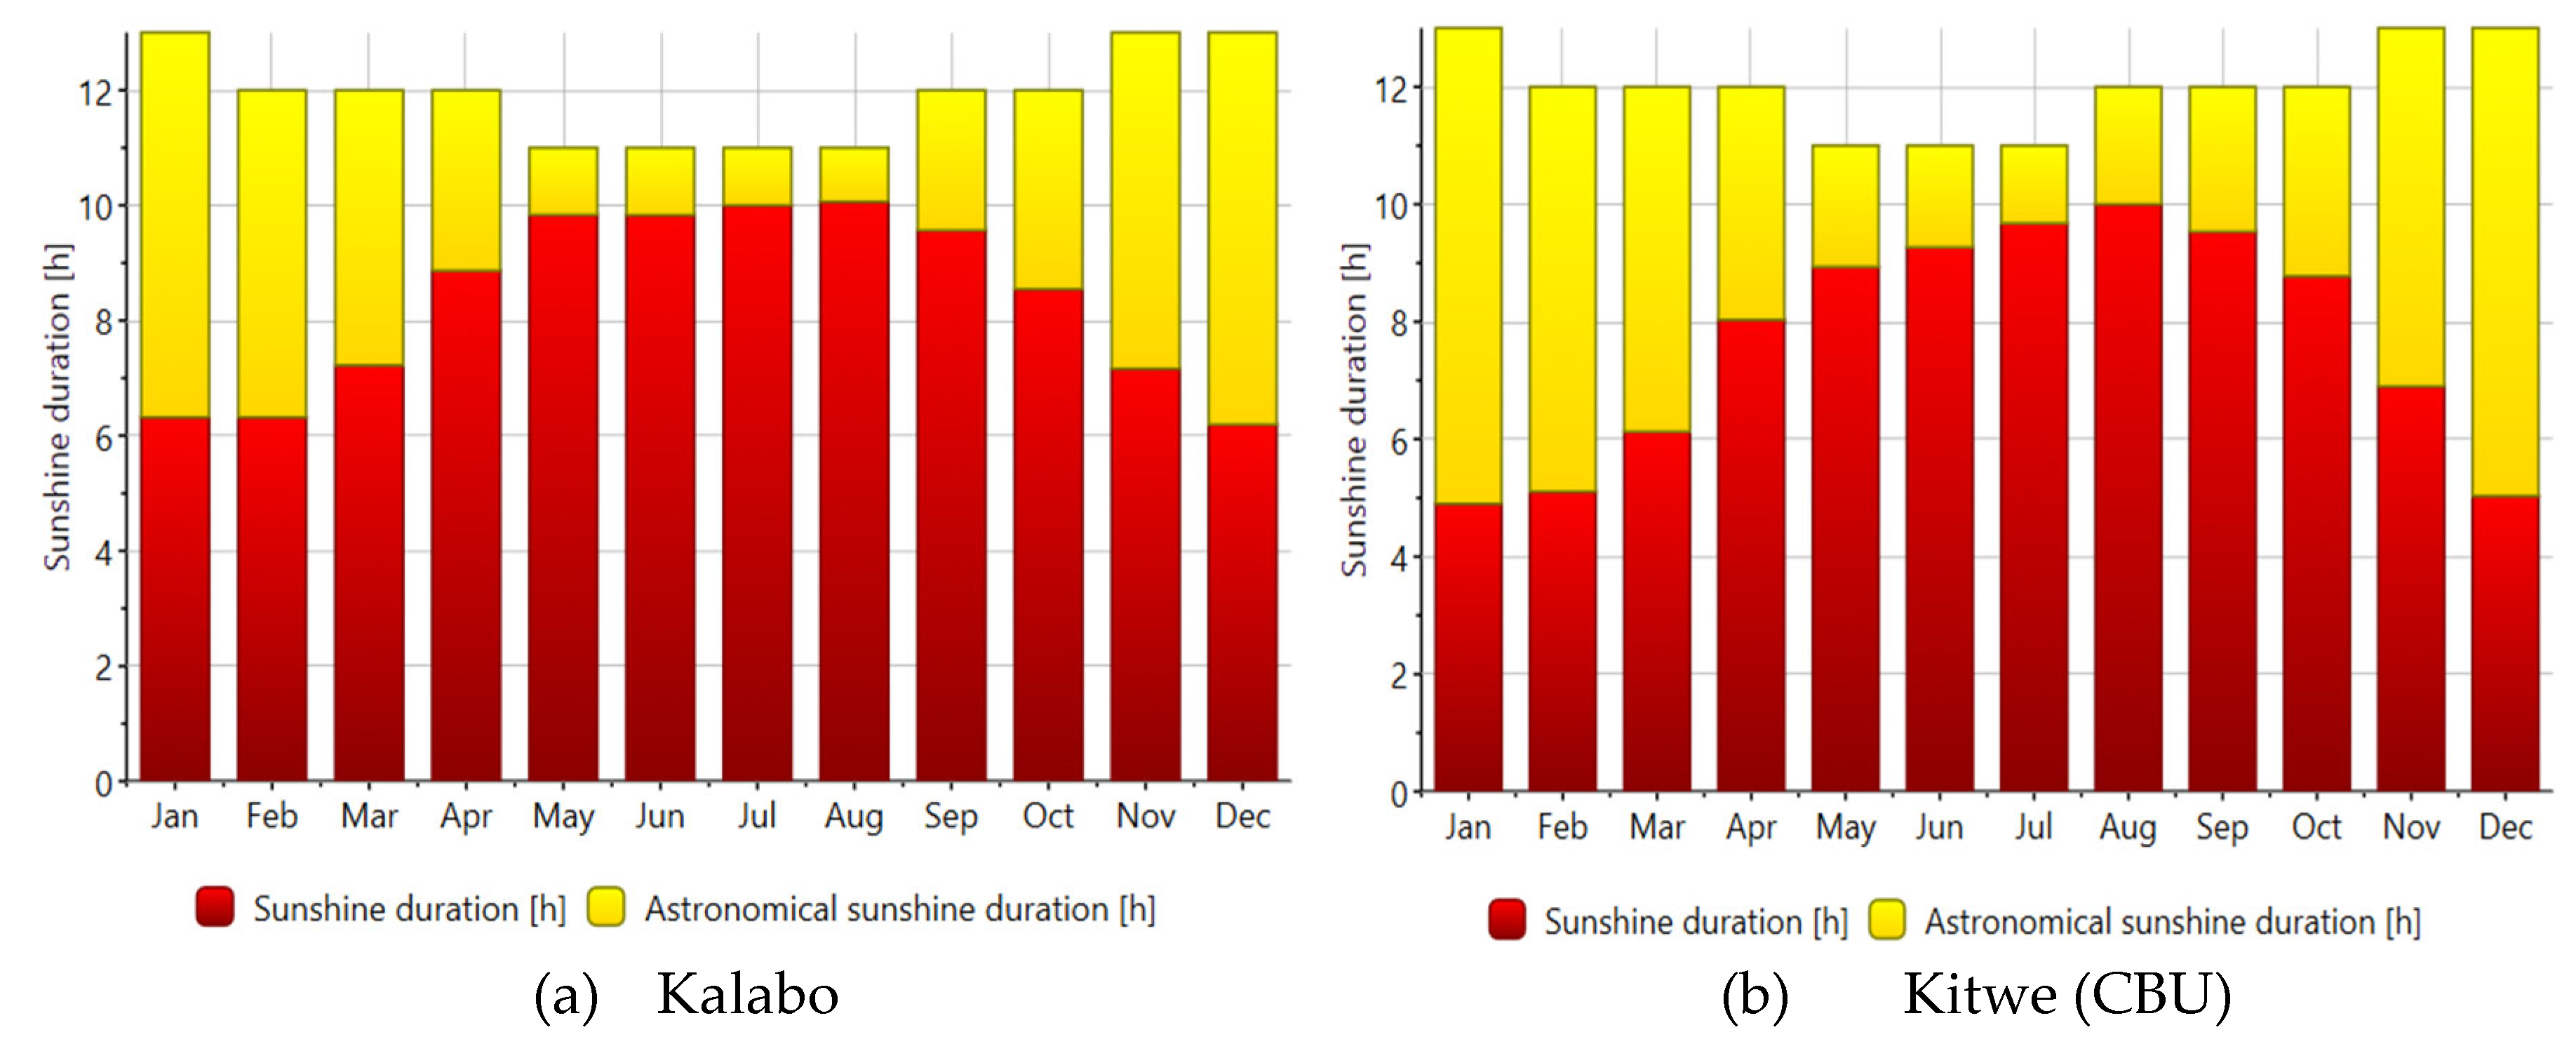
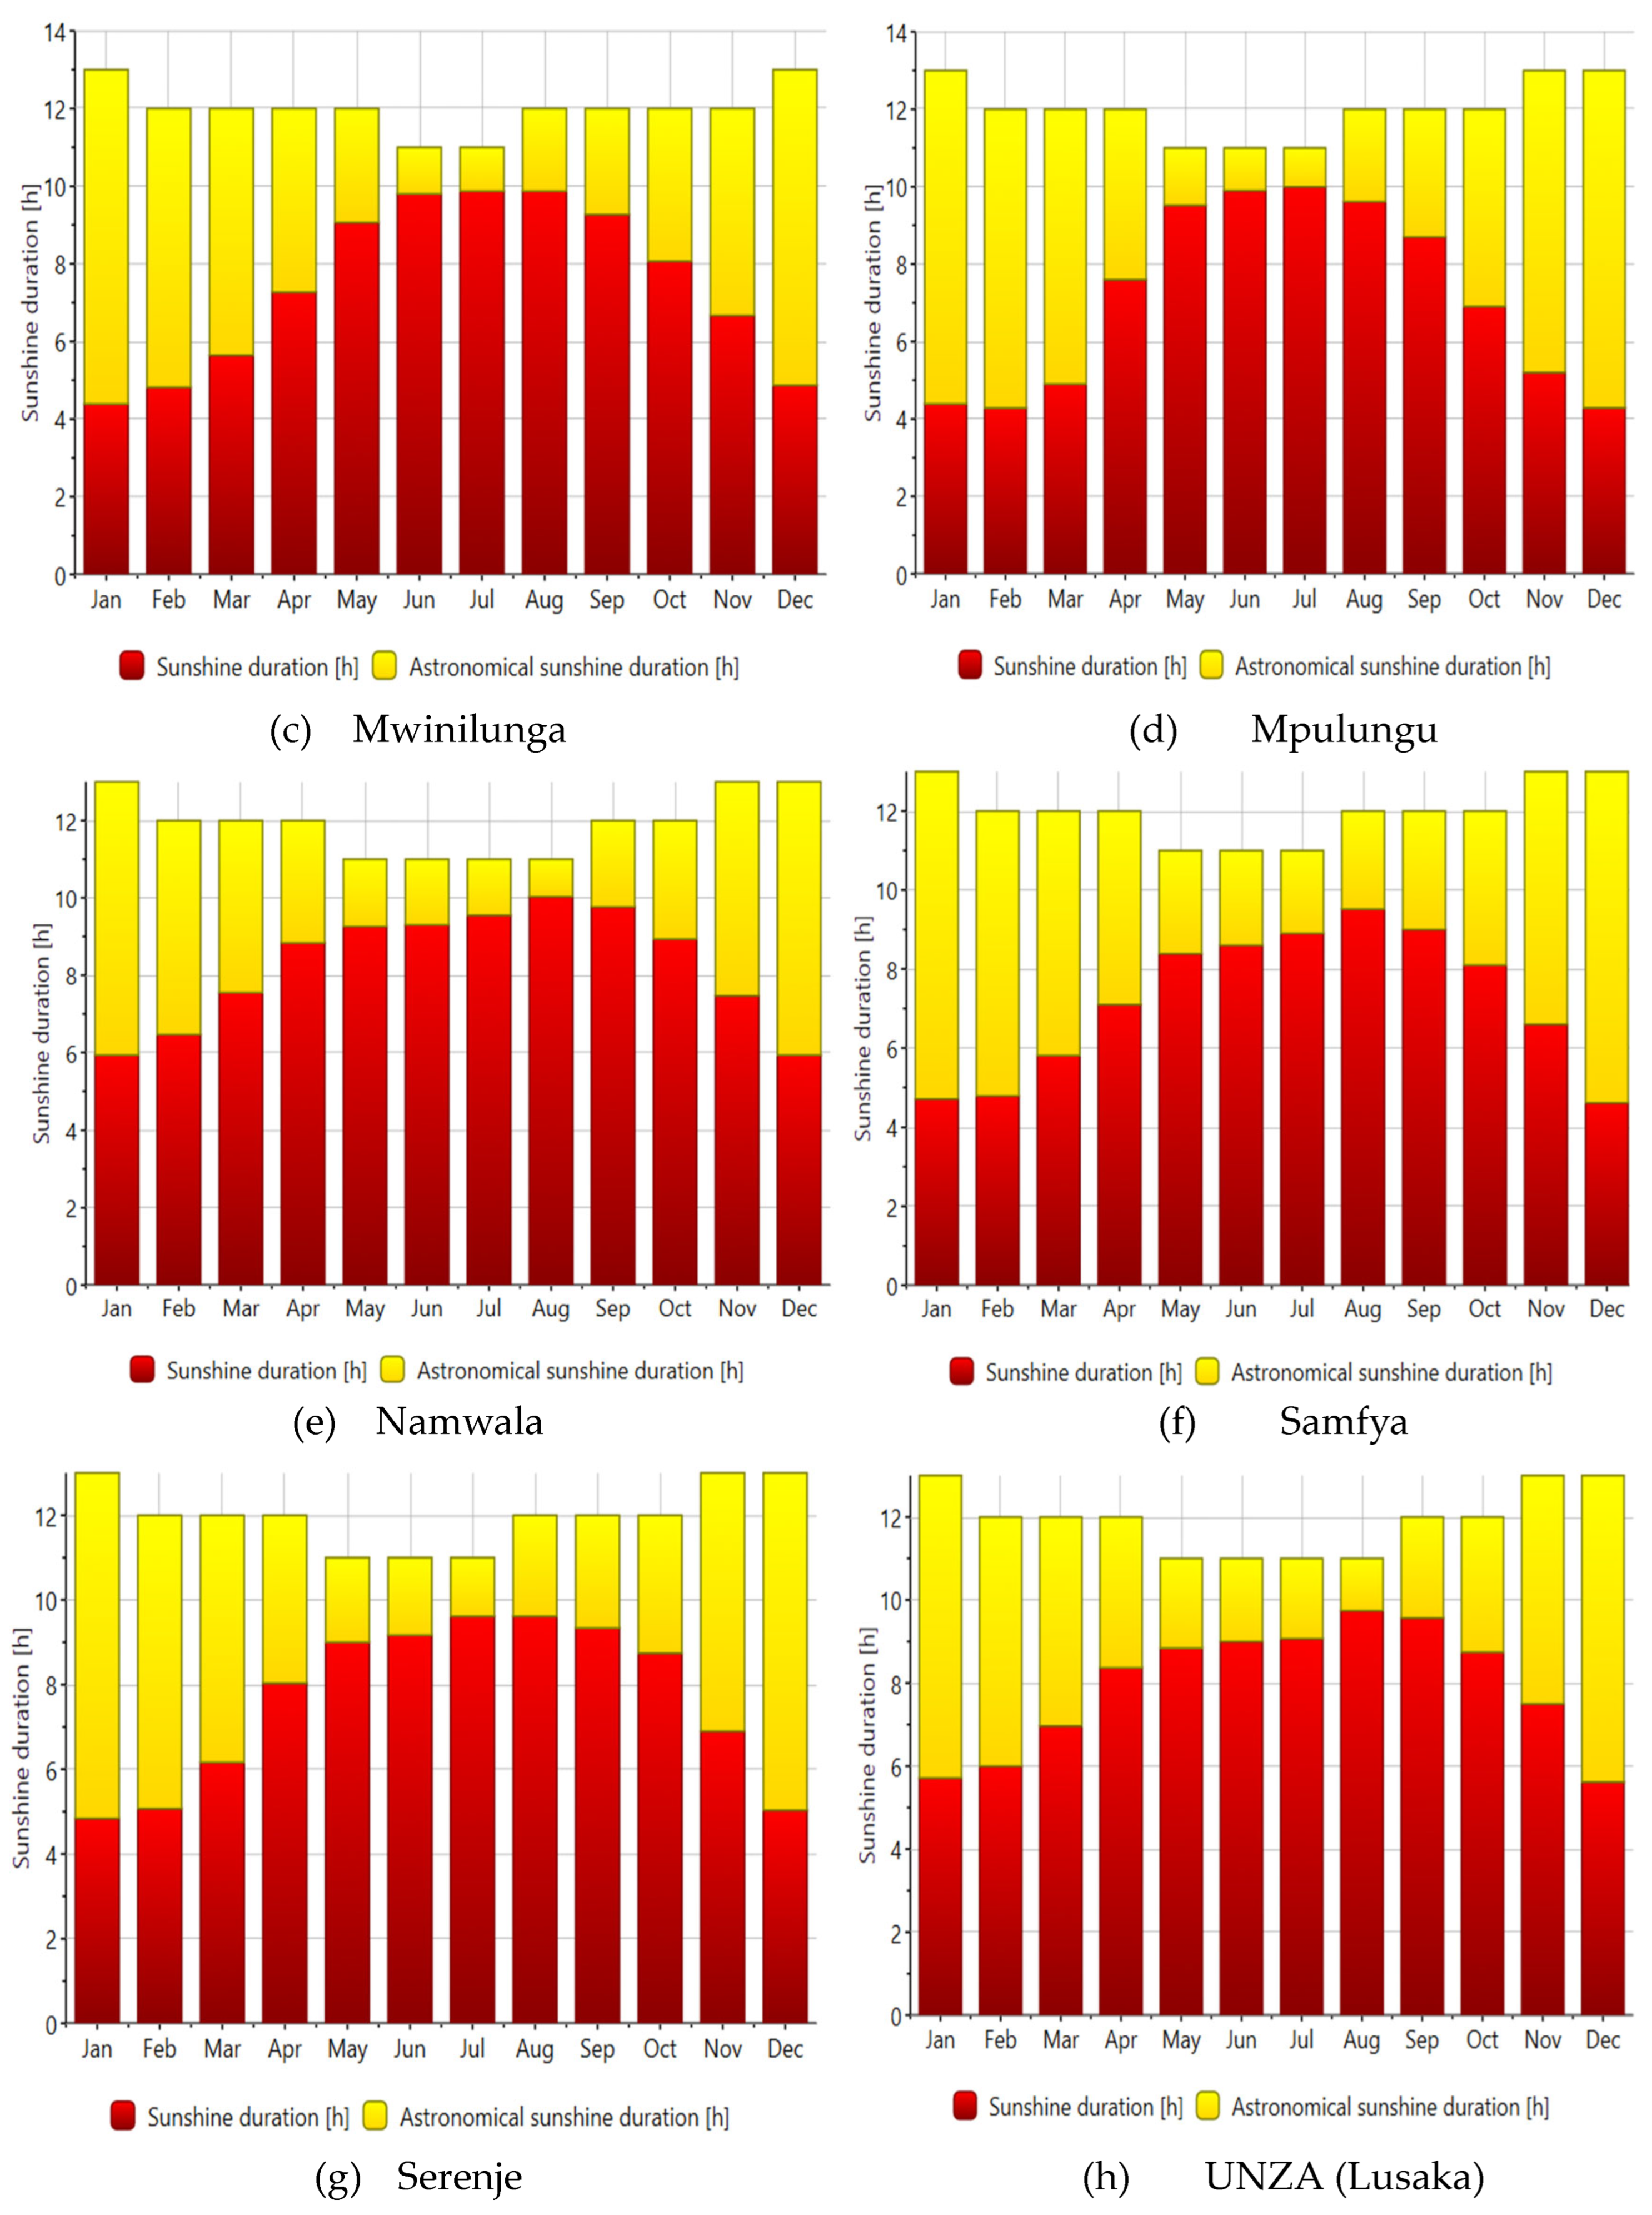
Figure 6.
Relationship between cloud amount and global solar irradiance across the study sites.
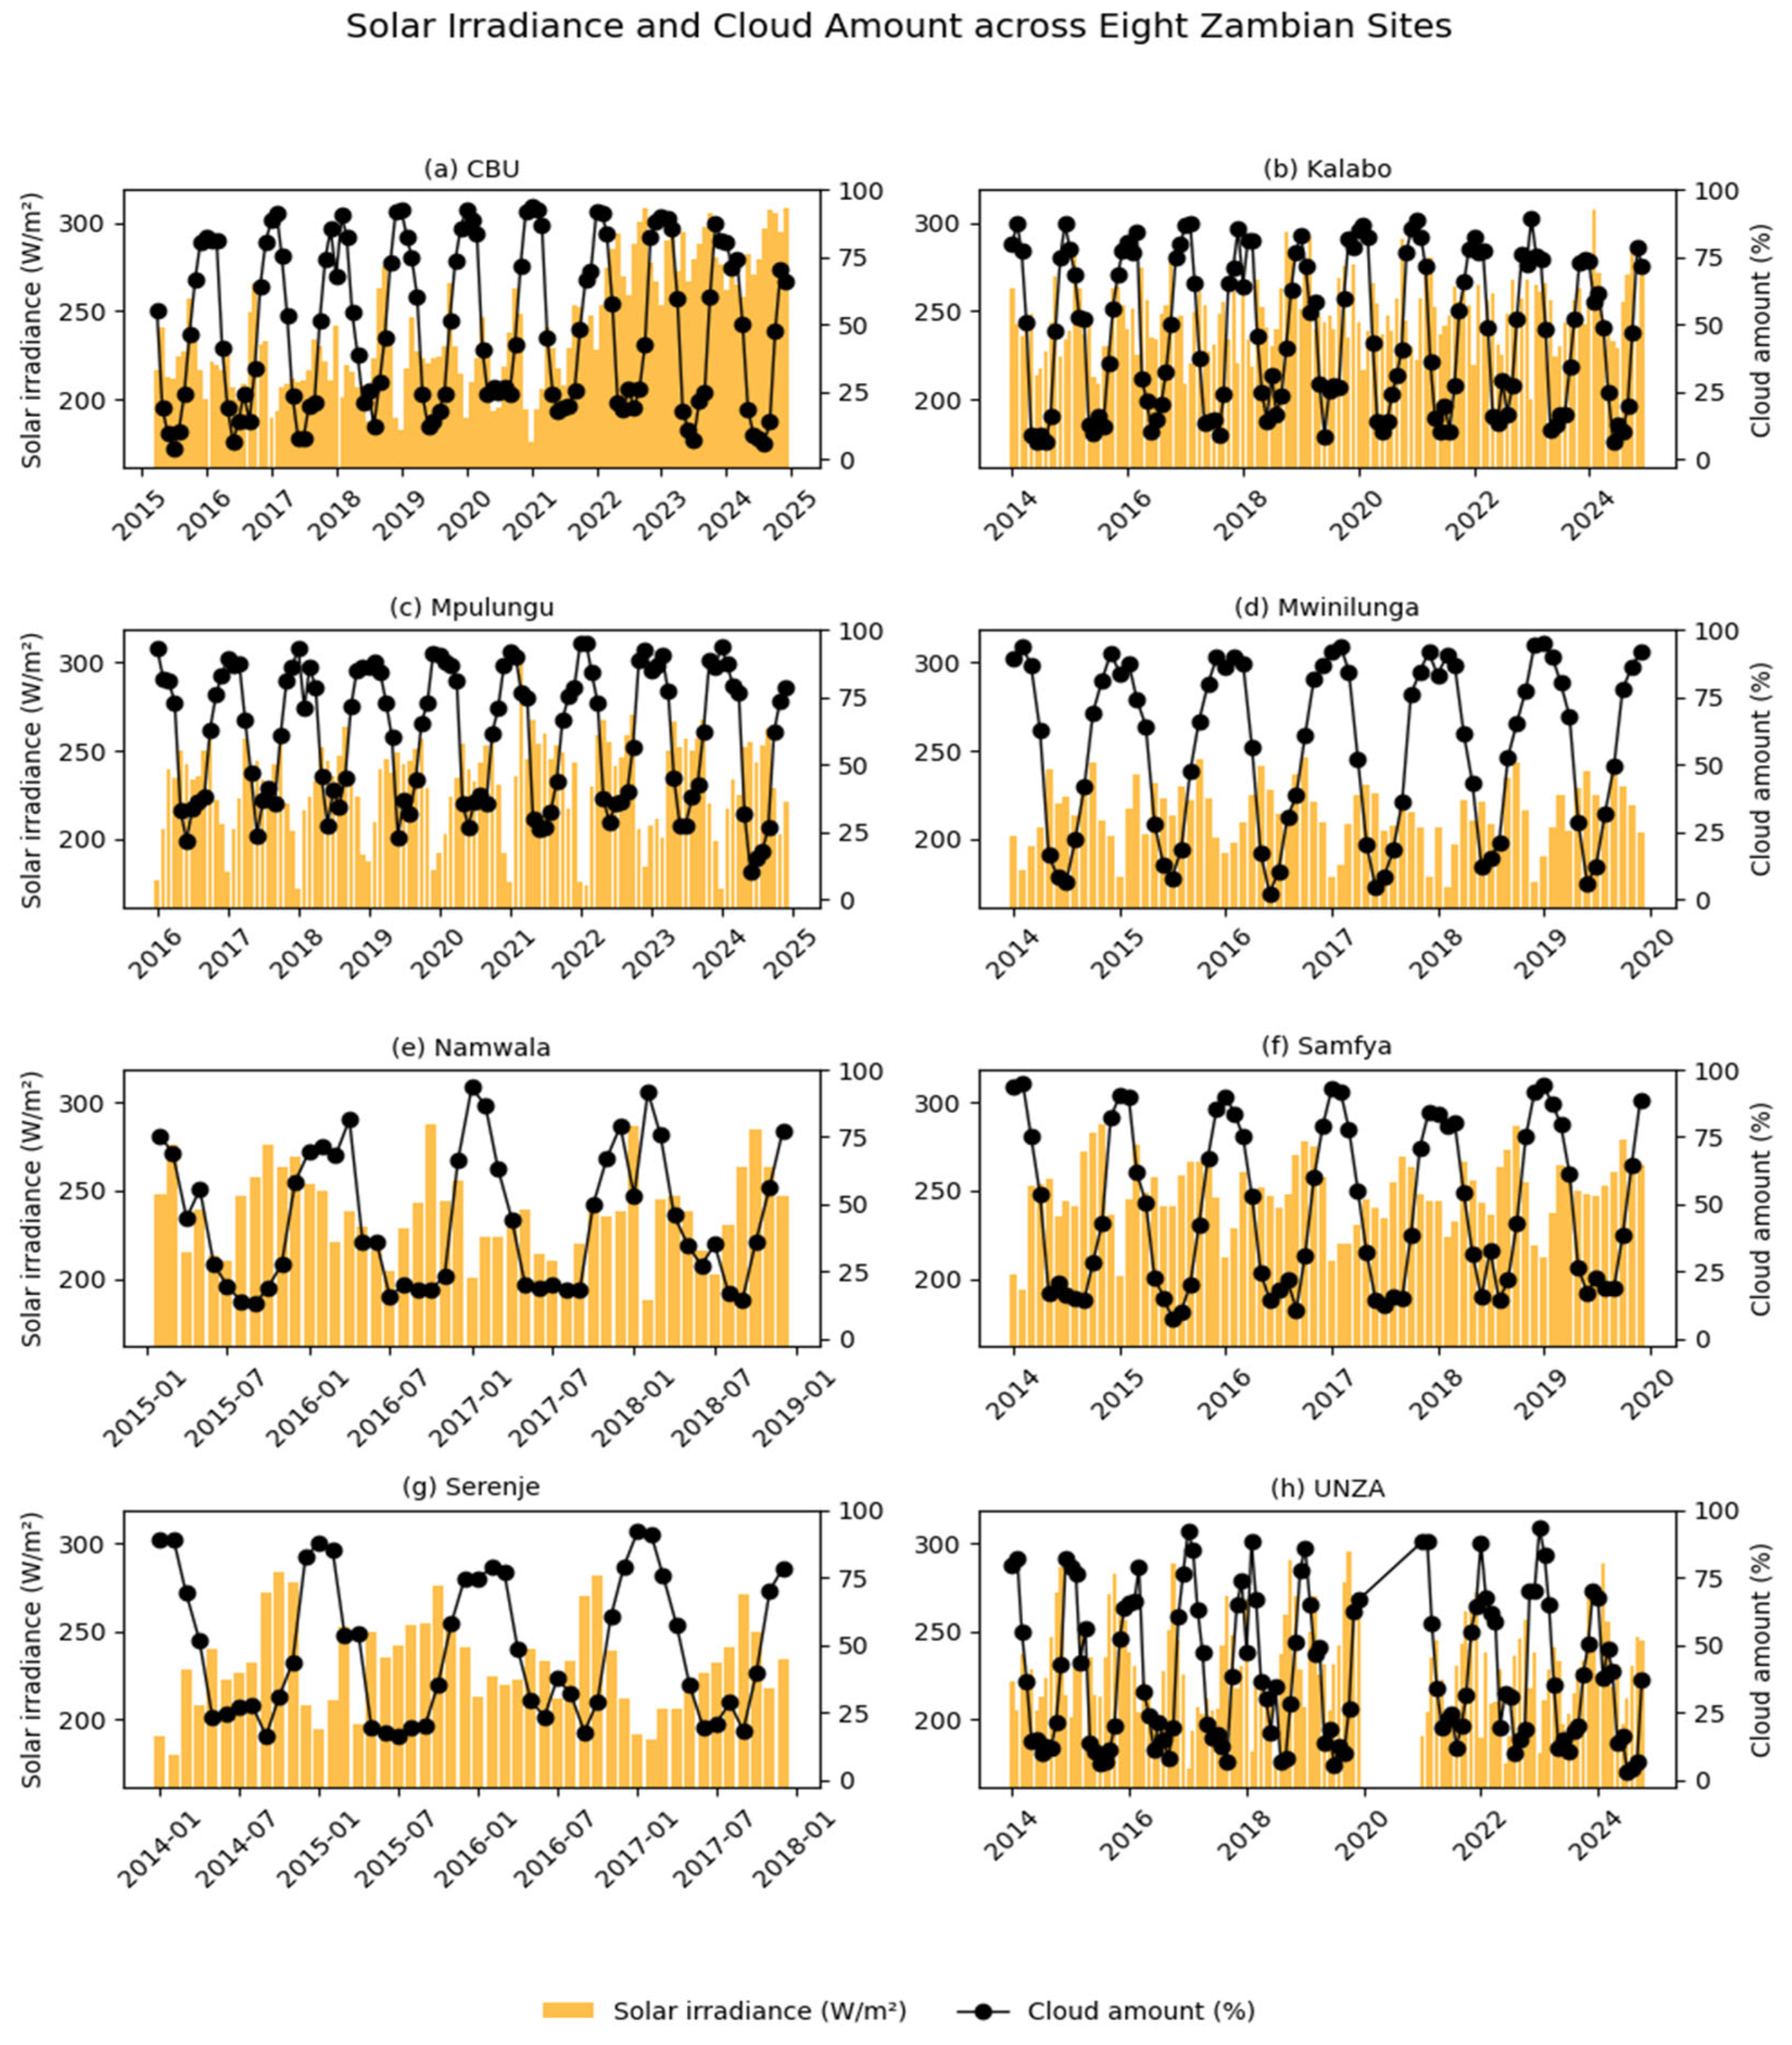
Figure 7.
Relationship between relative humidity and global solar irradiance across the study sites.
Figure 7.
Relationship between relative humidity and global solar irradiance across the study sites.
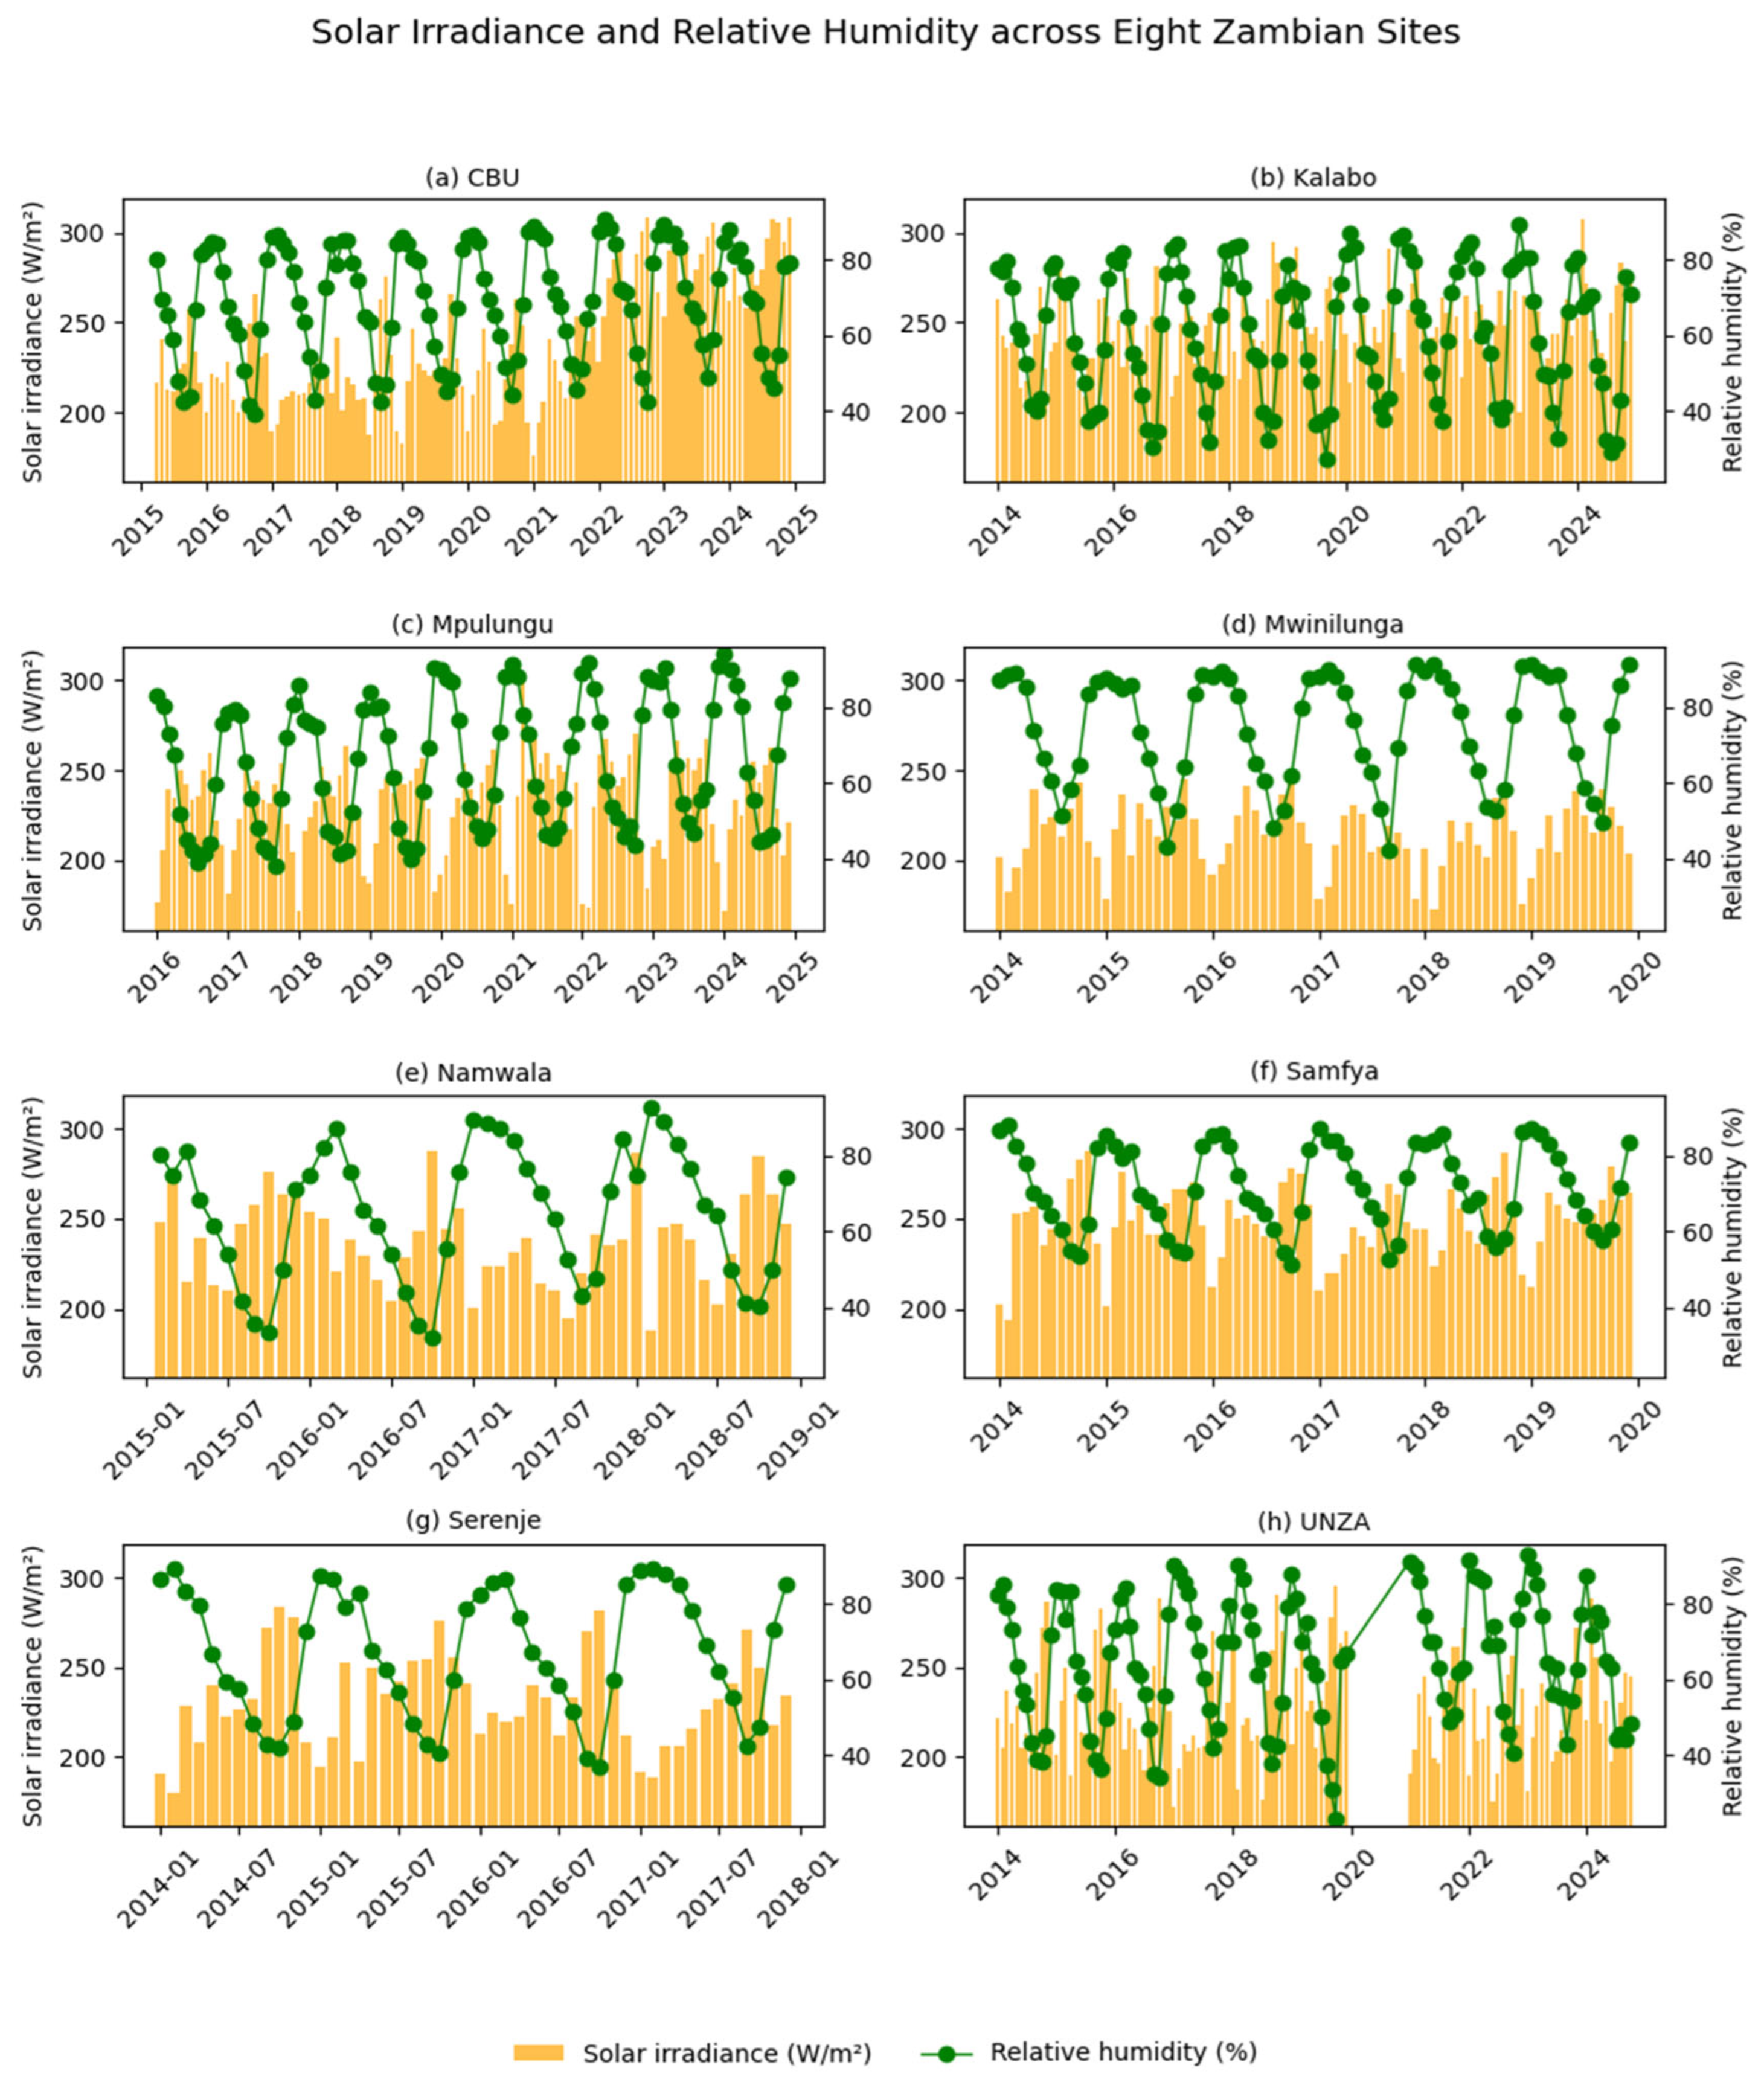
Figure 8.
Relationship between monthly precipitation and global solar irradiance across the study sites.
Figure 8.
Relationship between monthly precipitation and global solar irradiance across the study sites.
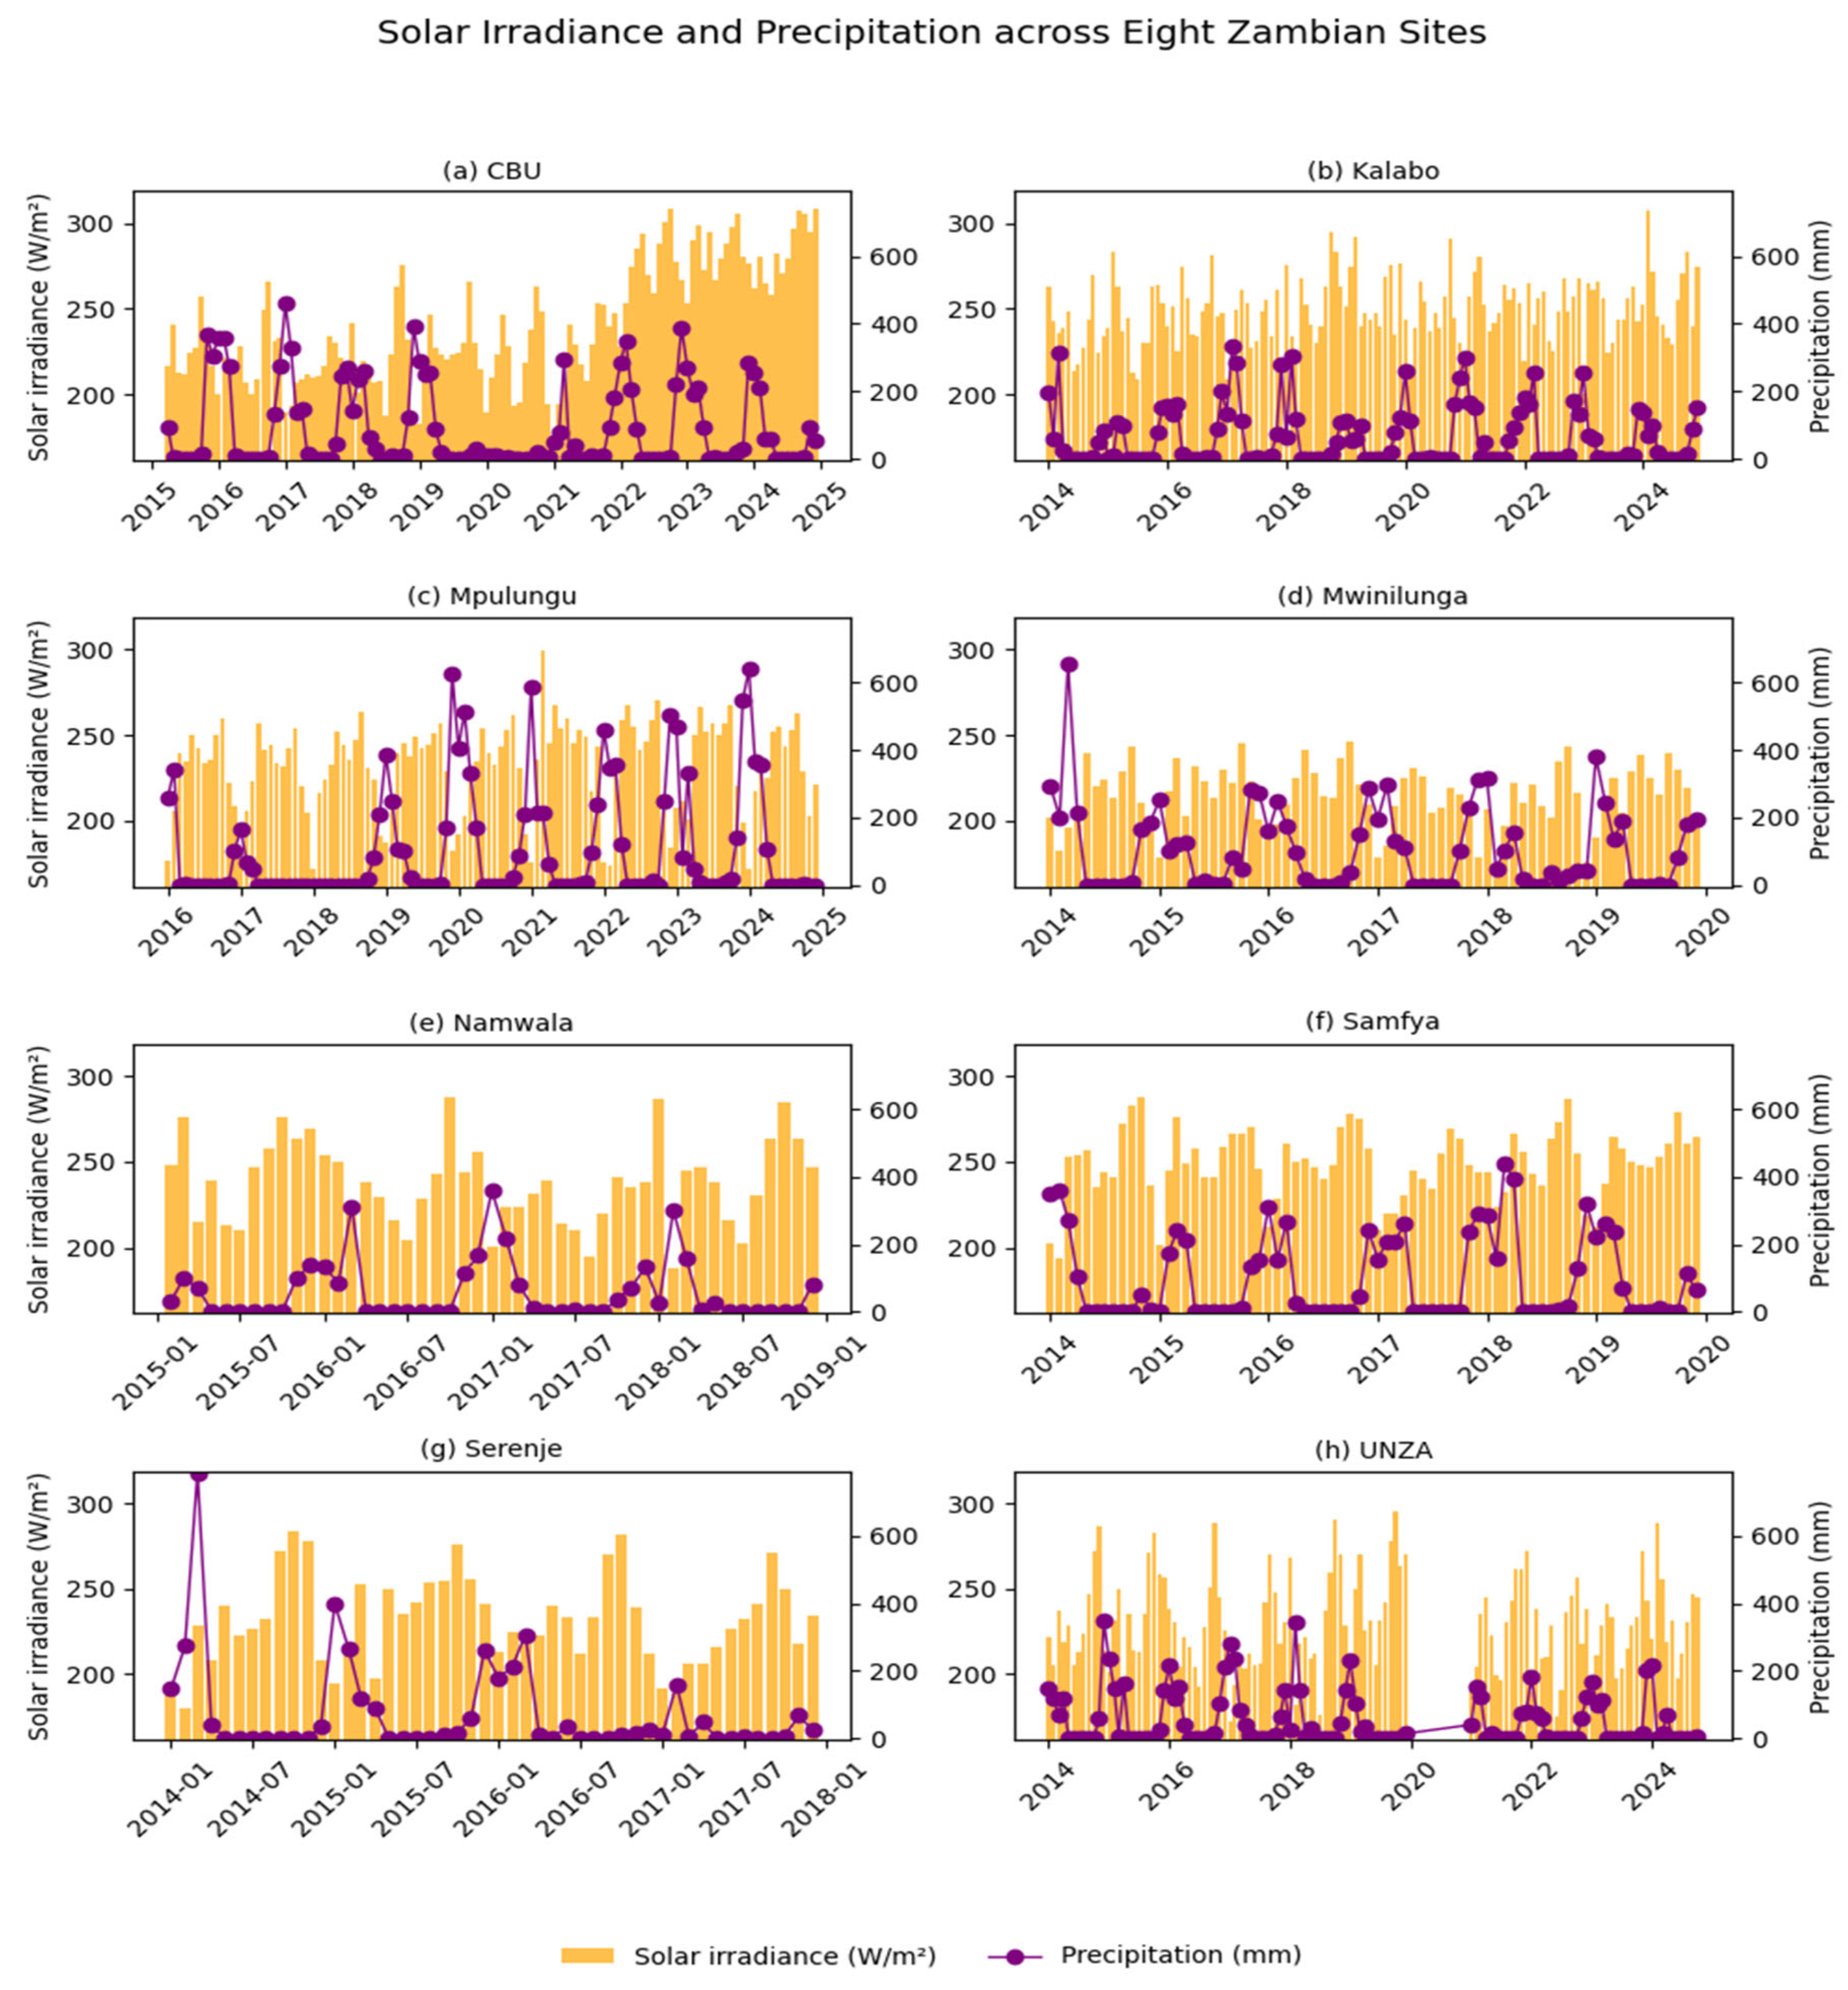
Figure 9.
Relationship between air temperature and global solar irradiance across the study sites.
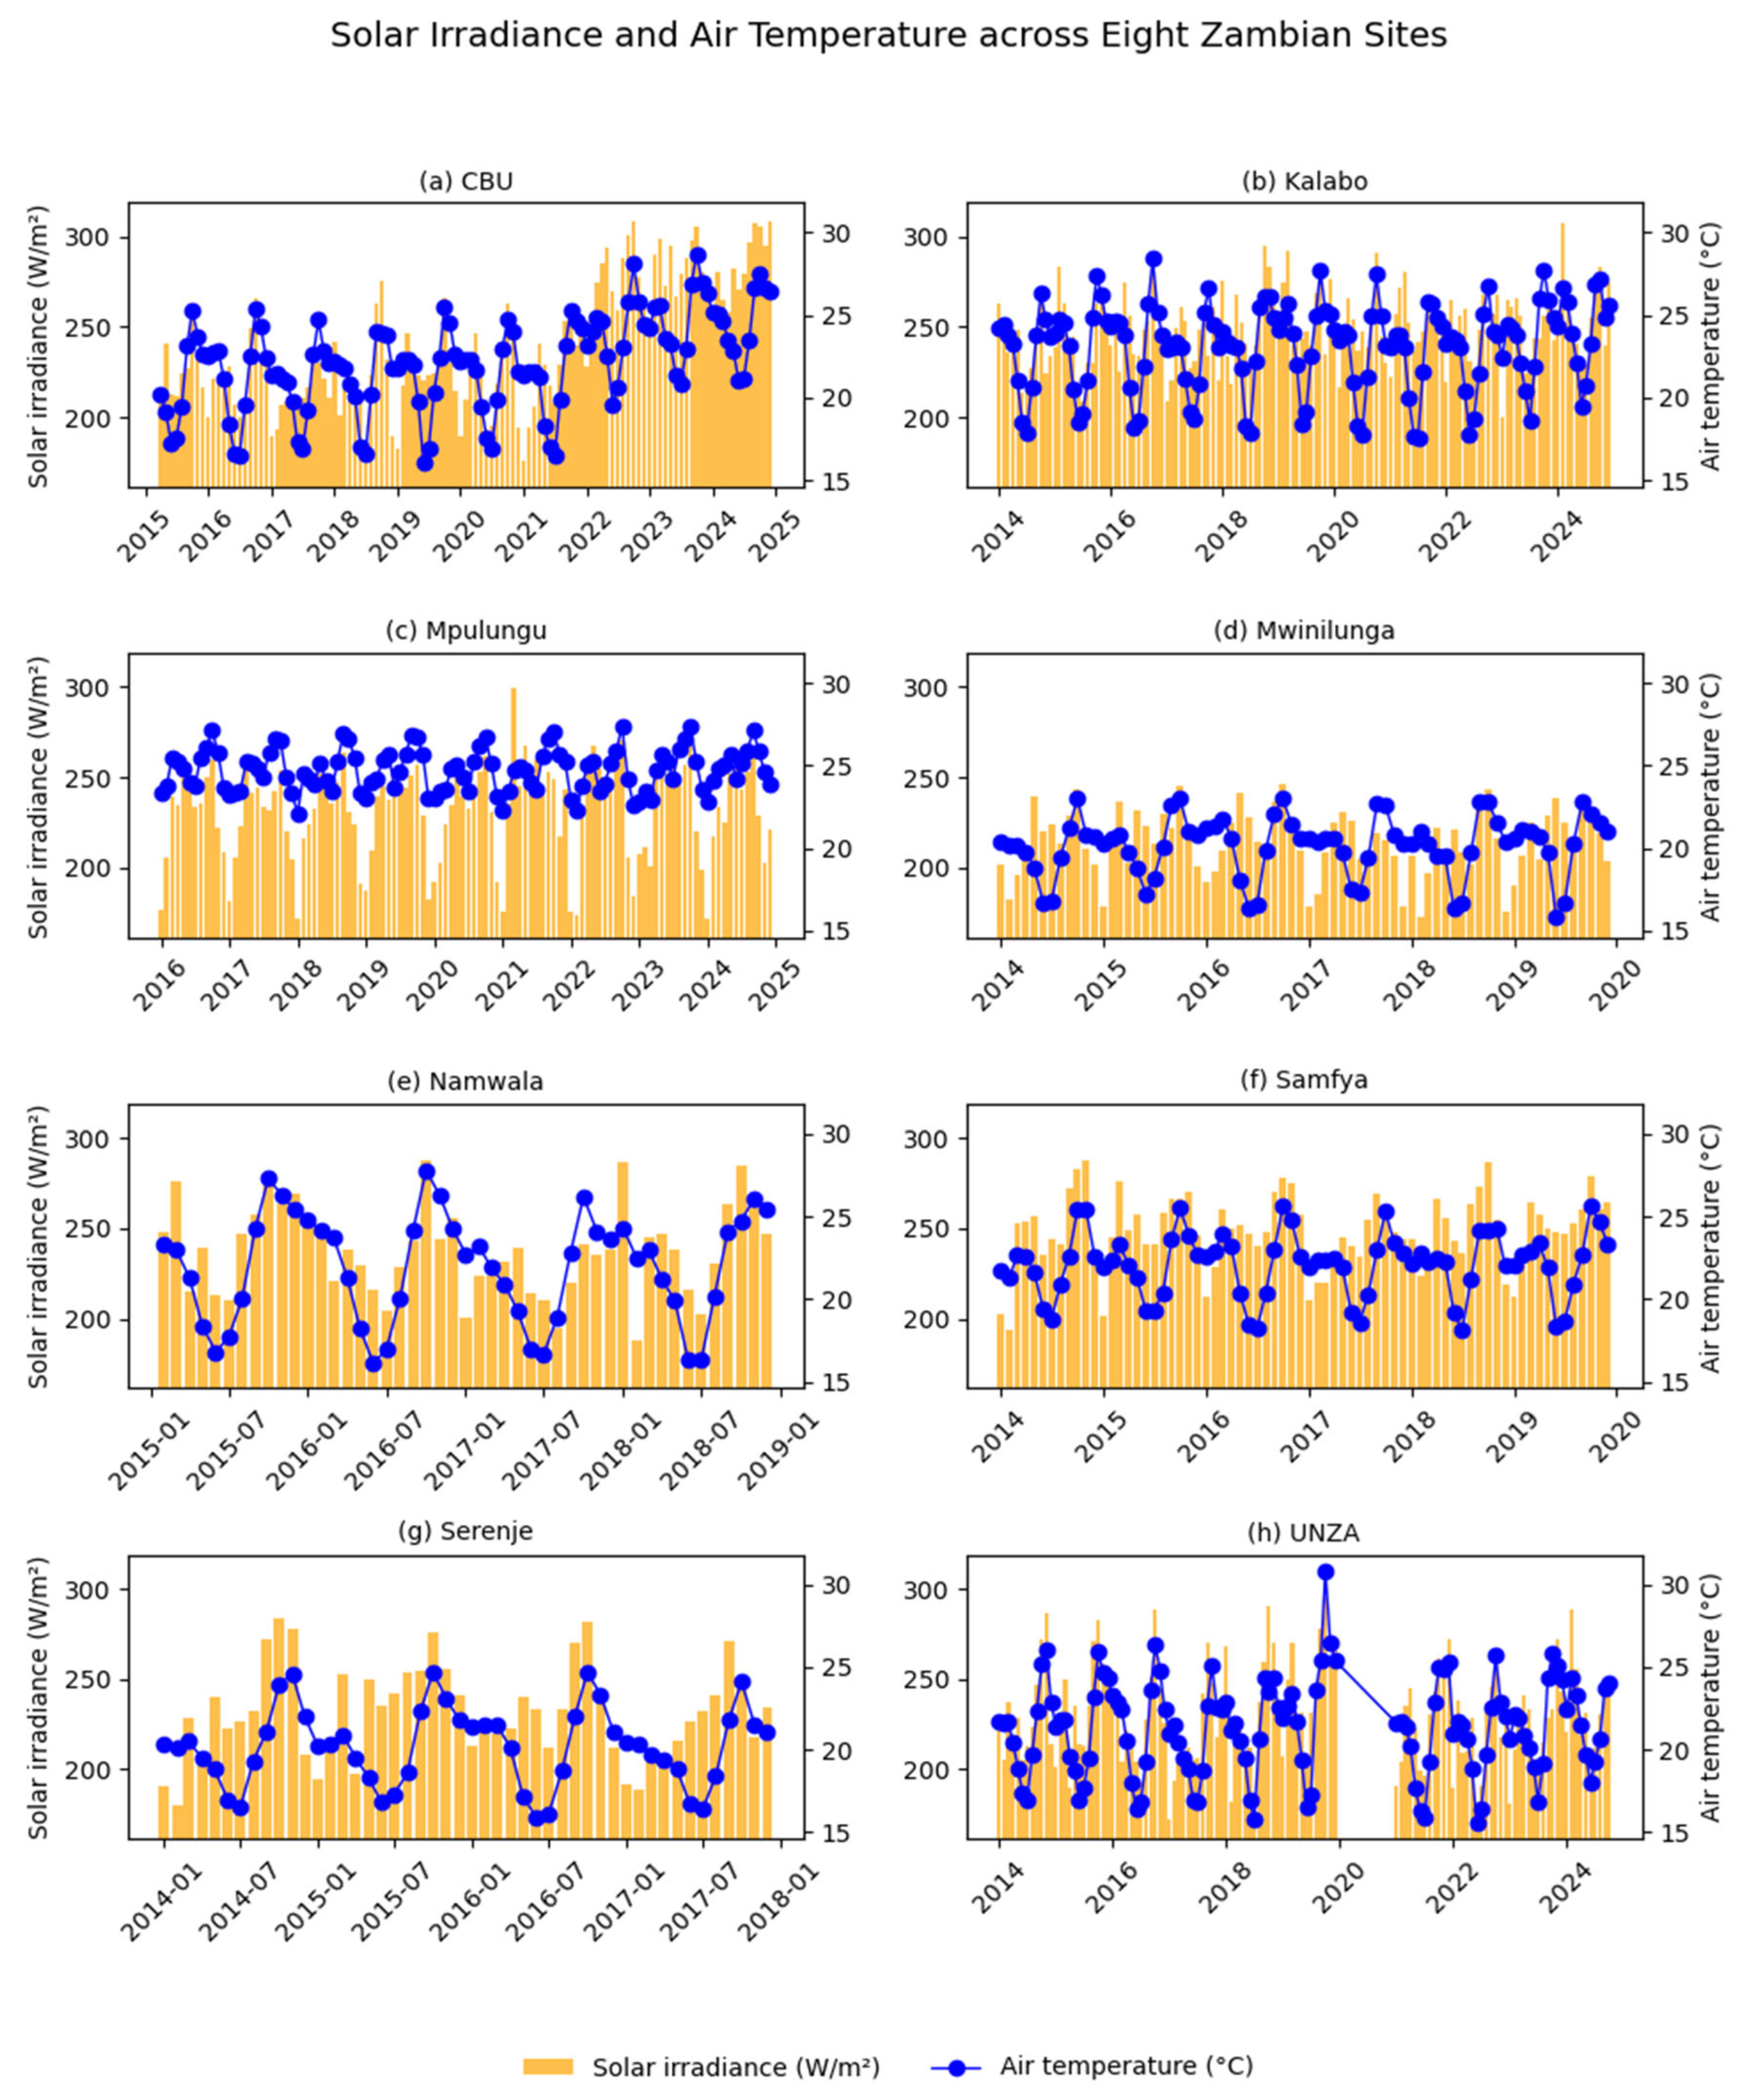
Figure 10.
Relationship between wind speed and global solar irradiance across the study sites.
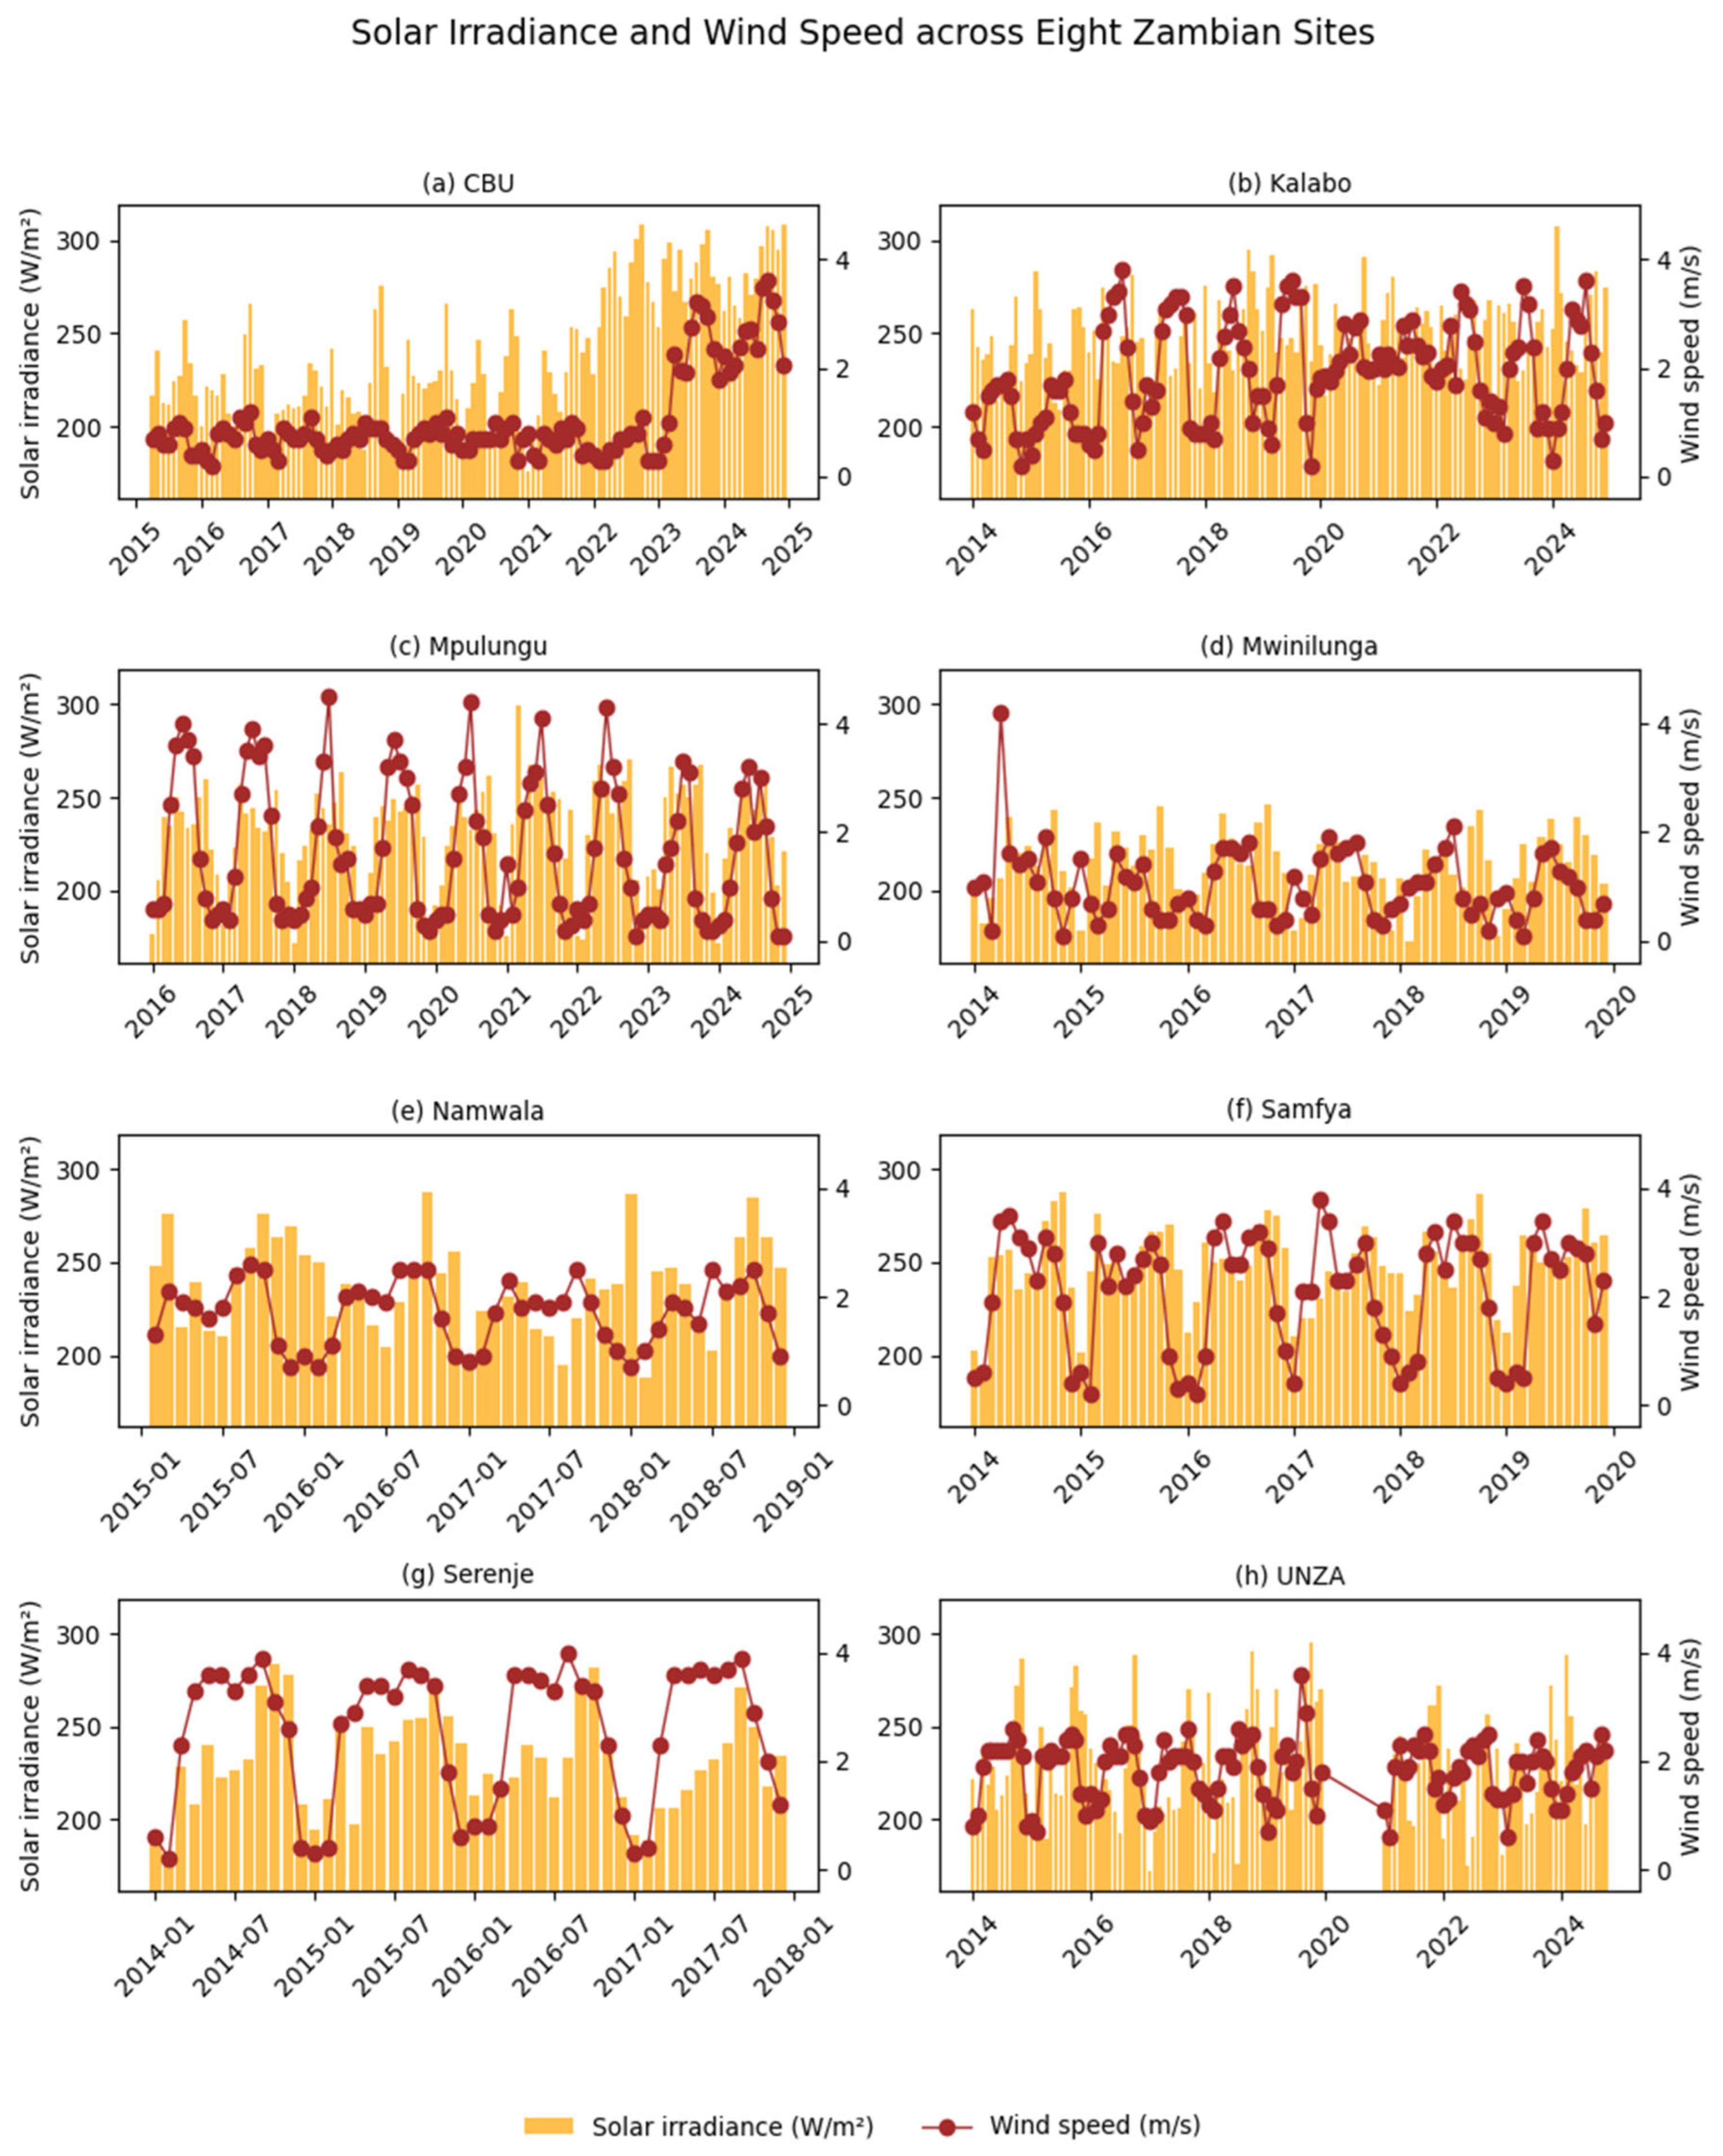

Table 1.
Worst-month solar irradiance by study site.
| Site | Worst Month | Min Irradiance (W/m2) | AER |
| Mpulungu | January | 182 | III |
| Mwinilunga | January | 191.5 | III |
| Samfya | January | 197.4 | III |
| UNZA-Lusaka | June | 202 | IIA |
| Namwala | July | 206.8 | IIA |
| CBU-Kitwe | January | 207.4 | III |
| Serenje | January | 213.8 | III |
| Kalabo | June | 230.3 | IIB |
Disclaimer/Publisher’s Note: The statements, opinions and data contained in all publications are solely those of the individual author(s) and contributor(s) and not of MDPI and/or the editor(s). MDPI and/or the editor(s) disclaim responsibility for any injury to people or property resulting from any ideas, methods, instructions or products referred to in the content. |
© 2026 by the authors. Licensee MDPI, Basel, Switzerland. This article is an open access article distributed under the terms and conditions of the Creative Commons Attribution (CC BY) license (http://creativecommons.org/licenses/by/4.0/).
Copyright: This open access article is published under a Creative Commons CC BY 4.0 license, which permit the free download, distribution, and reuse, provided that the author and preprint are cited in any reuse.