

Submitted:
16 August 2026
Posted:
18 August 2026
You are already at the latest version
Abstract
Background: Probiotics have been found to be beneficial for human beings through the modulation of intestinal bacteria and inhibition of pathogens. In light of the increased prevalence of multidrug resistant uropathogens, there is a need for alternative therapies than antibiotics. Objectives: This study assessed the capacity of three probiotics (Lactobacillus acidophilus, Lactic Acid Bacillus and Probiotic Consortium) to inhibit three important uropathogens; Escherichia coli, Klebsiella and Staphylococcus aureus with a view of understanding their antibacterial mechanism of action. Methods: In vitro co-cultures were set up to monitor the growth of the pathogens, the development of biofilms and acidification of the culture media for 24 hours. Biofilm biomass inhibition was assessed using crystal violet microtiter plate assays. The molecular responses to probiotics of Escherichia coli was also assessed by analysis of transcriptomics of cell envelope stress genes (omp) and molecular chaperones (dnaK, chap). Results: The efficacy of biofilm inhibition was highly strain-dependent, such that Lactobacillus acidophilus always showed significantly greater broad spectrum biofilm inhibition than both the probiotic consortium and Lactic Acid Bacillus. Escherichia coli Biofilm Inhibition: L. acidophilus gave the highest inhibition of 66.67%, whereas the probiotic consortium inhibited 59.05% of the biofilms and Lactic Acid Bacillus 3.81%. Klebsiella Biofilm Inhibition: The best biofilm inhibition was observed with L. acidophilus with 78.00% compared to the probiotic consortium (61.11%) and Lactic Acid Bacillus (42.50%). Staphylococcus aureus Biofilm Inhibition: L. acidophilus showed maximal biofilm inhibition of 69.09% compared to 54.55% inhibition from the probiotic consortium. Inhibition showed high correlation with medium acidification and antimicrobial metabolite production. Transcriptome analysis: treatment with L. acidophilus caused severe cell envelope stress in E. coli (5.4-fold increase in expression of omp) and impaired intracellular stress response in E. coli with the inhibition of molecular chaperone (dnaK -4.0-fold and chap -2.6-fold. Conclusion: Lactobacillus acidophilus is a strong broad spectrum antibiofilm agent that targets Gram-negative and Gram-positive uropathogens. Antimicrobial activity of this bacterium is exerted through acidification, metabolite production, cell envelope stress induction, and regulation of stress response mechanisms.
Keywords:
probiotics
; pathogens
; coculture
; antimicrobial activity
; gut microbiota
; short-chain fatty acids
; bacteriocins
Introduction
Human gut microbiota consists of a complex network of ecological trillions of cells that execute many physiological functions. The effect of conditions like infection, antibiotics, and behavioral changes can be very prevalent, resulting in the formation of resistant bacteria, ultimately causing AMR, which is among the most dangerous issues for the human population (Nazir et al., 2025). Some of these bacteria include K. pneumoniae, E. coli, S. aureus, Enterobacter spp., Pseudomonas aeruginosa, and Citrobacter spp. (Prajescu et al., 2023). The resistant behavior of the bacteria in combination with the capability to develop biofilms contributes significantly to the difficulty in eliminating the bacteria through medication as well as the body’s immune system (Sharma et al., 2023).
The rising use of antibiotics in different corners of the world, particularly in the developing nations, makes bacteria increasingly efficient in forming antibiotic resistance and causing serious health repercussions like high morbidity and mortality rates (Dadgostar, 2019) and the onset of a new era in the field of medicine. Due to the growing apprehensions regarding AMR, which will probably affect our capability to treat different infections, the scientists have recently shown interest in looking for possible replacements for antibiotics in UTIs by using non-antibiotic drugs like probiotics.
The fact that probiotics contain lactic acid bacteria does not pose any threats to the development of AMR and hence could be useful in addressing recurrent UTIs in women and individuals on prolonged antibiotic therapy. Probiotics offer numerous health benefits since they assist in recolonizing the vagina with lactic acid bacteria (Mishra et al., 2024).From the results of the cultures and biochemical tests, in addition to the in vitro tests of the antimicrobial activity and biofilm inhibition activity, it is clear that the probiotics have been successful in combating the pathogenic microorganisms and biofilms. From the results of this study, it is confirmed that the synergistic modulation approach has been used for gut microbiota modulation. In addition to increasing the possibility of achieving infection control, this synergistic modulation approach has wider implications in health terms, as it increases the immune response and reduces inflammation and microbial resistance.
Figure 1.
Diagram showing how probiotics provide protection against harmful effects inside the gut. Probiotics promote the activity of the epithelium and attach themselves to the intestinal mucosa, thereby blocking the pathogen’s binding and causing competitive exclusion. Probiotics produce antimicrobial factors and alter the immune response of the host through dendritic cells, macrophages, and cytokines such as IL-10 and TGF-β.
Figure 1.
Diagram showing how probiotics provide protection against harmful effects inside the gut. Probiotics promote the activity of the epithelium and attach themselves to the intestinal mucosa, thereby blocking the pathogen’s binding and causing competitive exclusion. Probiotics produce antimicrobial factors and alter the immune response of the host through dendritic cells, macrophages, and cytokines such as IL-10 and TGF-β.
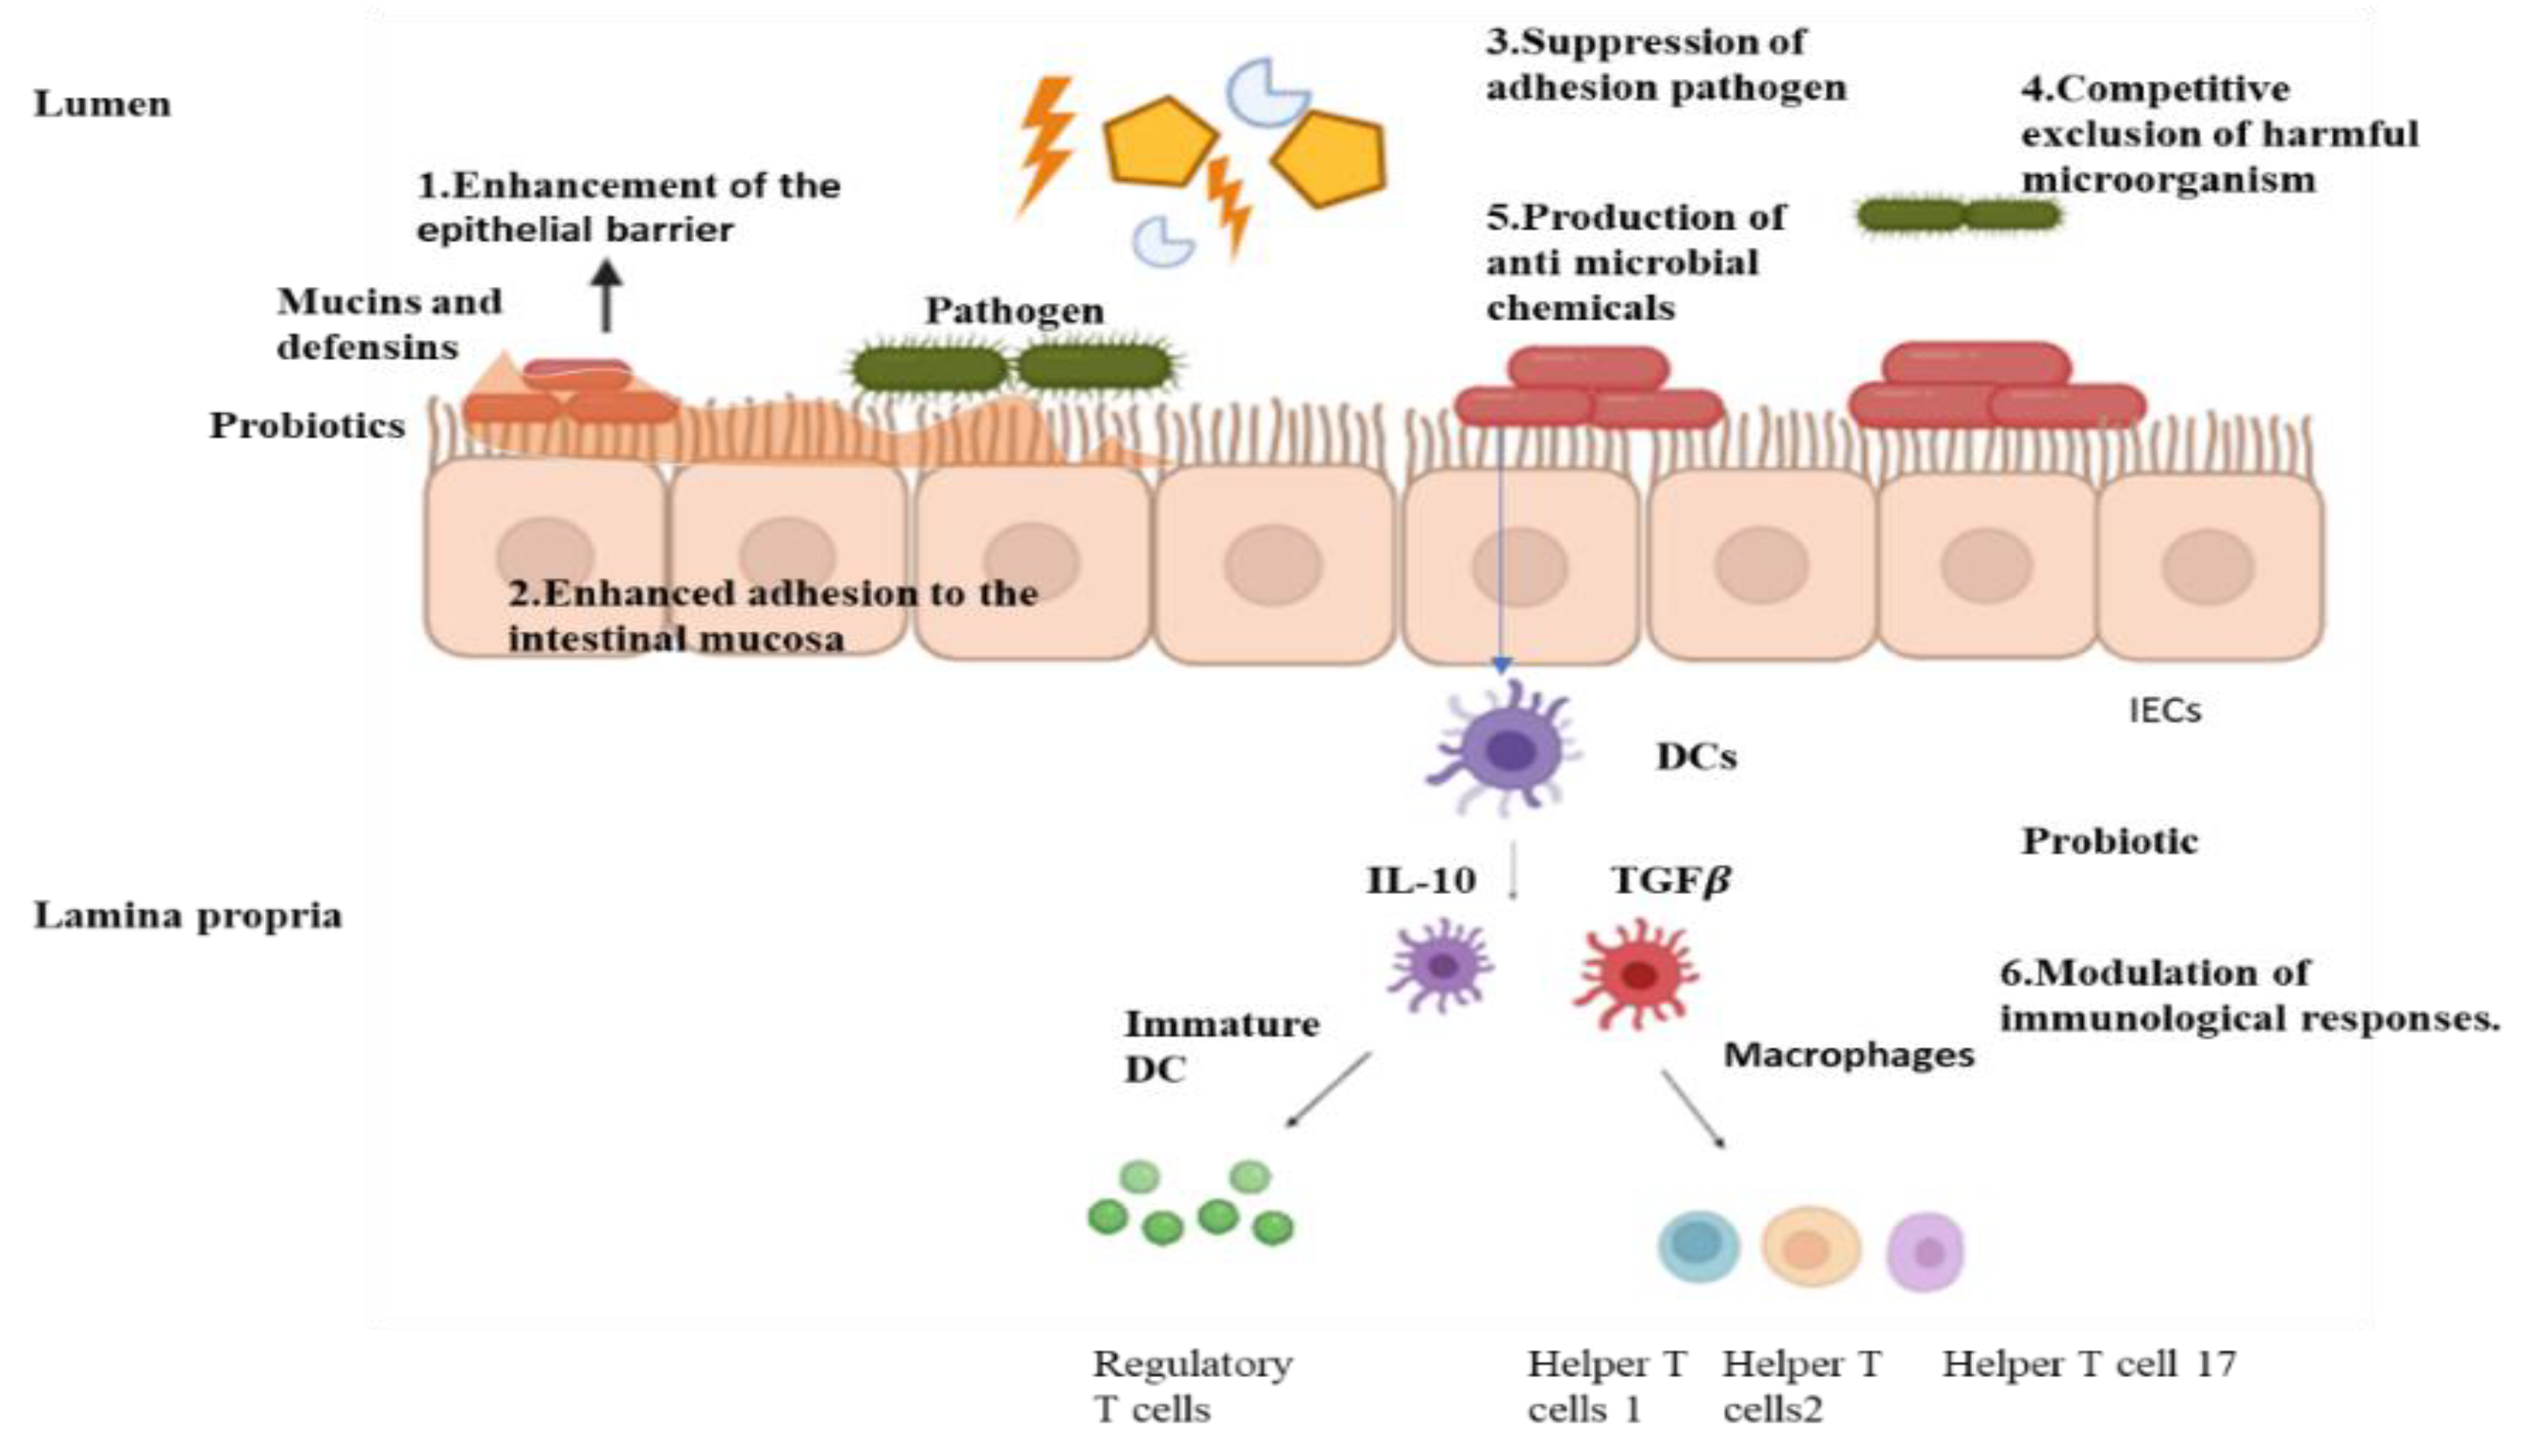
Probiotics alone offer limitless benefits; the new philosophy of synergistic modulation probiotics and bioactive peptides together would be a novel and successful approach for gut microbiota maximization and the battle against bacterial infections, as shown in Figure 1 (Wang & Zheng, 2025). Bioactive peptides, typically released from microbial fermentation or protein digestion of dietary protein, possess various biological activities such as antimicrobial, immunomodulatory, and prebiotic activity (Peres Fabbri et al., 2024). These peptides are able to selectively enhance the growth of health-promoting bacteria and inhibit the This study aims to reduce the growth of pathogens and enhance the function of the mucosal barrier (Johnstone & Herzberg, 2022). More importantly, probiotics themselves are able to release bioactive peptides from substrates and thus provide an amplifying feed-forward mechanism for their beneficial functions (Latif et al., 2023). Synergetic modulation involves both bioactive peptides and probiotics, which collectively lead to the inhibition of the pathogens as well as the formation of conditions suitable for colonization of beneficial microorganisms. In addition, the role of bioactive peptides includes improving the efficacy of probiotics, providing selective nutrition for probiotics, and killing the resilient pathogenic microbes (Mendis et al., 2025).
Methods
1. Biosafety Statement
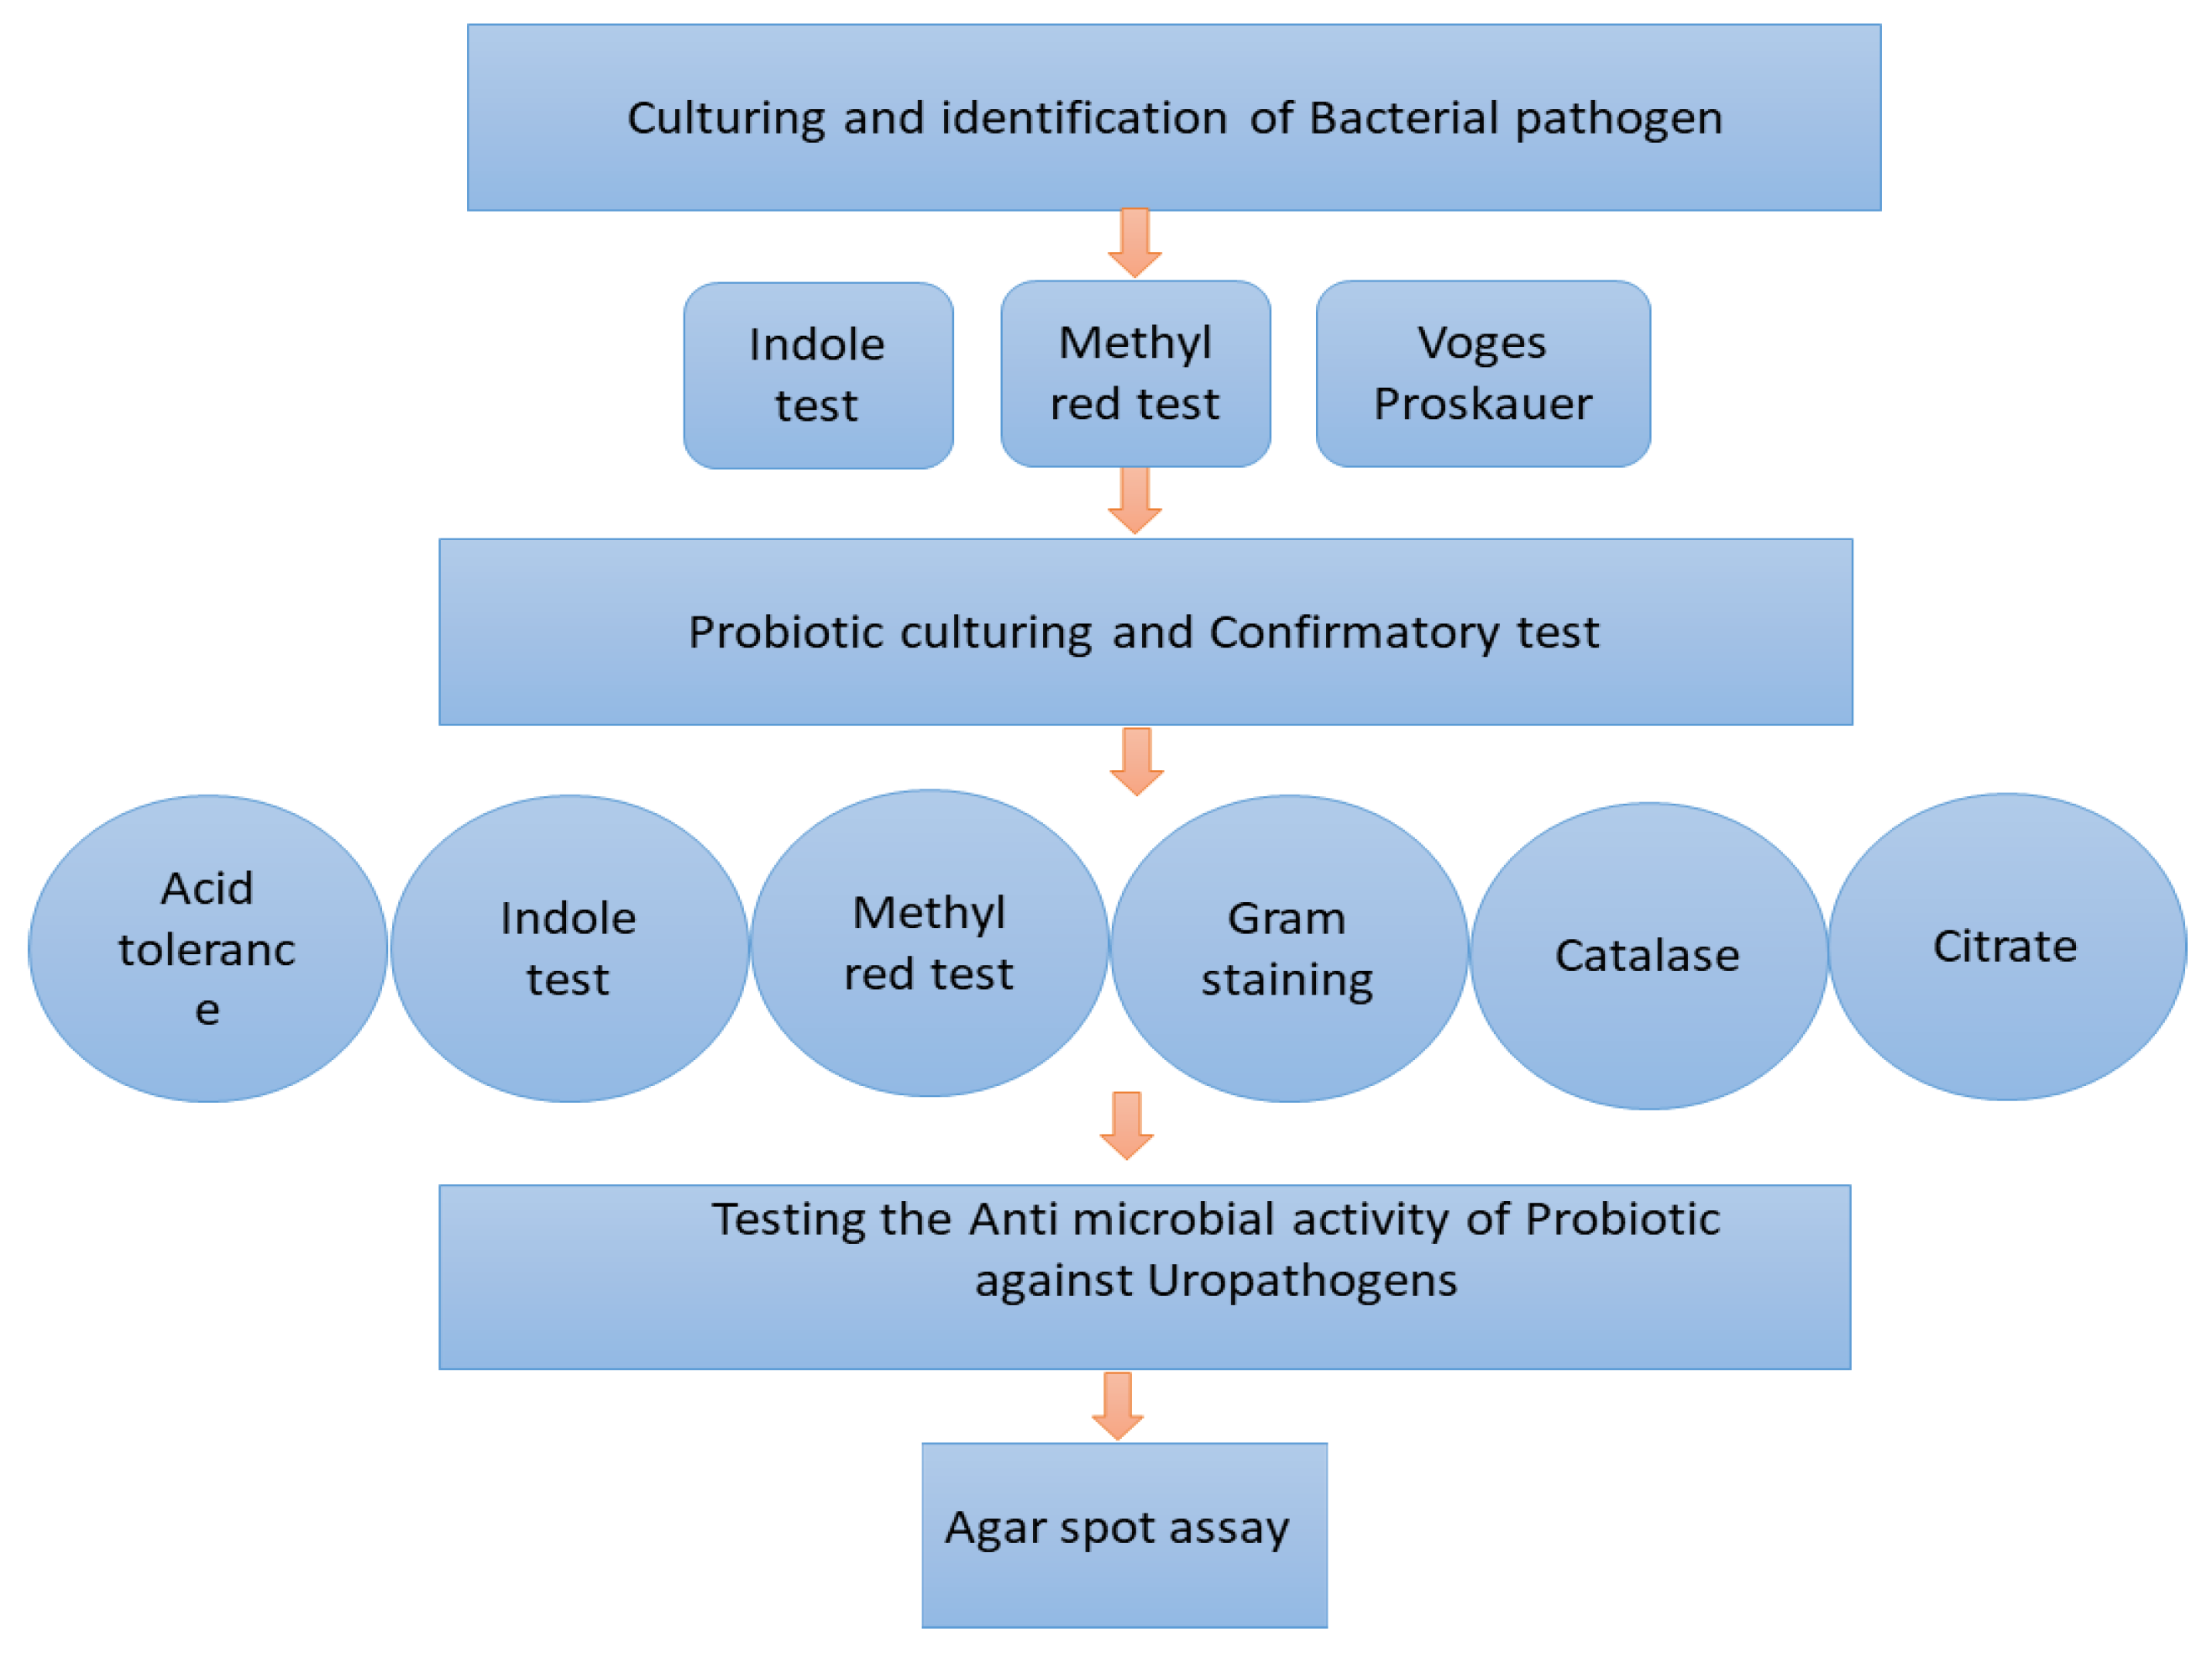
All the experiments were performed in the Biosafety Level 2 Laboratory (BSL-2) at the SRM University at the Center for Drug Designing and Discovery (C4D), as depicted in Figure 2 below.
Figure 2.
depicts the flowchart of the methodology and the tests utilized.
2. Study Group Selection
People of different ages and genders living both in rural and urban areas have participated in this study. Patients who were confirmed to have UTIs were identified by conducting regular urine analysis. Volunteers willing to participate in the study after diagnosis of UTIs were invited into the research study (Diriba et al., 2025).
A questionnaire was formulated to provide detailed insights on the reasons behind the prevalence of UTIs within the population. It will assist in collecting vital demographic, lifestyle, and health-related data of the respondents. The variables that will be analyzed in the research include age, gender, occupation, favorite food types, amounts of dairy intake, smokers, and other lifestyle patterns. Health records such as previous UTIs, antibiotic medication, diseases related to UTIs, and personal cleanliness routines are the major data points to be investigated. Data collected on prior surgeries performed in the urinary tract and outpatient UTI treatments as well. This will enable the researchers in establishing the risk factors for UTIs. (Mititelu et al., 2024).
All information collected using the questionnaire was anonymized and coded to maintain patient confidentiality and promote ethical standards of research.
3. Sample collection
Urine samples from patients visiting PRIMSR SRM Hospital were used in this study. In order to avoid contamination, as well as maintain sample integrity, midstream urine samples using a clean-catch sampling method were obtained. Instructions for the collection included washing the genitals with sterile water prior to urine collection and letting some urine pass in the beginning of the process before collecting it into sterile wide-mouth screw-cap containers made available at the hospital.
The samples were then tagged with the identification code of the patient, along with other demographic data such as the age and gender of the patient and the inpatient or outpatient status of the patient, as well as any diagnoses that could be made at the time of admittance to the facility. This procedure was done to make sure of the proper traceability without revealing the identity of the patient.
4. Culturing and Identification of Bacterial Specimen
The following procedure was done during the testing of the samples by the culture technique of 10 microliters. These were cultured using the quantitative inoculation loop of 10 microliters into three media: MacConkey Agar (BD BBL, Becton, Dickinson and Company, Sparks, MD, USA; REF: 211387), Nutrient Agar (HiMedia Laboratories Pvt. Ltd., Maharashtra, India; REF: M001-500G), and Cysteine Lactose Electrolyte Deficient (CLED) Agar (HiMedia Laboratories Pvt. Ltd., Maharashtra, India), after which they were incubated in an incubator at 37 °C for 1-2 days. The strains of the samples that gave positive results on the presence of pathogenic bacteria using quantitative inoculation loops were identified on the basis of such features as color and shape, among others. Some of the tests that were conducted included the catalase test, indole test, methyl red test, Voges-Proskauer test, and citrate test.
5. Micro-Broth Dilution Method
The MIC of the selected drugs was evaluated on the bacteria by utilizing the microbroth dilution technique as described by the CLSI guidelines for determination of the MIC of the selected drugs (Kowalska-Krochmal & Dudek-Wicher, 2021). Fresh cultures of bacteria were transferred into sterile normal saline to obtain an evenly suspended culture. This culture had a 0.5 McFarland turbidity equivalent to 1.5 x 10⁸ CFU/ml. Further dilution gave 5 x 10⁵ CFU/ml. The stock solutions were prepared according to the manufacturer’s guidelines. The above solution was then diluted twofold using the cation-adjusted Mueller-Hinton Broth (CAMHB; HiMedia Laboratories Pvt. Ltd., Maharashtra, India; REF: M391-500G) in a microtiter plate. Various concentrations above the breakpoints of all the antibiotics were used in the assay. A volume of one hundred microliters of the antibiotic stock was dispensed into each well of the microtiter plate. After that, fifty microliters of bacterial inoculum was added to each well, with the end result of obtaining 5 x 10⁶ CFU/ml. Besides, the positive and negative controls were included in the test, where the positive controls contained bacteria and broth without antibiotics, while the negative control contained only broth. The plates were incubated aerobically at 37 °C for 18-24 hours (Lipworth et al., 2024).
6. Probiotic culturing and identification test
6.1. Strain Selection:
The following were the probiotic strains used: Lactobacillus acidophilus, Lactic Acid Bacillus, and Lactobacillus rhamnosus and multi-strain probiotics.
6.2. Culturing Conditions
The identification of the bacterial strain was done using the procedure as outlined in Bergey’s Manual of Determinative Bacteriology. Screening of acid tolerance was performed through the growth of bacteria inde Man, Rogosa, and Sharpe (MRS) broth (Sisco Research Laboratories Pvt. Ltd. [SRL], Maharashtra, India; REF: 49190) modified at different pH values (2, 3, 4, and 5) for five hours, and then the bacteria were counted to assess their tolerance level towards acid. The biochemical tests that were carried out included the citrate test usingSimmons Citrate Agar (HiMedia Laboratories Pvt. Ltd., Maharashtra, India; REF: M099-500G), the catalase test using hydrogen peroxide, the Gram staining test, the indole test using Kovacs reagent, and the methyl red test(H.W. Deshpande & Bhate, 2017).
7. Antimicrobial testing against uropathogens
The experiment involved using a modified agar spot test to evaluate the antagonistic activity of the probiotics. Cultures of Lactic Acid Bacillus and Lactobacillus acidophilus were cultured separately using Mueller-Hinton II Agar (MHA; BD BBL, Becton, Dickinson and Company, Sparks, MD, USA; REF: 211438) under conditions of 37 °C for 24-48 hours. The colonies were counted by the aid of a hemocytometer, with the result revealing 109, 1010, and 1011 respectively. Each bacterium was seeded on MHA at count of 108(Shah et al., 2025).
8. Anti-biofilm testing against Uropathogens
The process of formation of biofilms was performed in the assay where bacteria grew on 96-well polystyrene microtiter plates. Overnight culture was obtained where growth of E. coli bacteria occurred in the Mueller-Hinton Broth (MHB; HiMedia Laboratories Pvt. Ltd., Maharashtra, India; REF: M391-500G) medium while growth of probiotics took place in MRS medium (Sisco Research Laboratories Pvt. Ltd. [SRL], Maharashtra, India; REF: 49190). Incubation was carried out in the shaking at 37 °C. After one day of incubation, dilutions will be made to obtain the concentration of 108 in their respective medium, after which co-culture was prepared by mixing both E. coli bacteria and probiotics in 96-well plates. Bacterial cultures growing independently will act as control samples. Once the process of biofilm formation has been done, washing of the wells was performed thrice in PBS so as to get rid of the planktonic cells. The biofilm was stained using 0.1% crystal violet solution for 15 minutes. After staining, the wells in the plate will be washed off and dried. The dye in the wells was extracted using 95% ethanol, and the absorbance was measured at 495 nm using a microplate reader. Inhibition of biofilm was evaluated by comparing the results of the control group with the pathogen alone(Lila et al., 2023).
9. Proteomic Insights into E. coli Adaptation: Comparative SDS-PAGE Analysis Under Antibiotic Resistance and Probiotic Intervention
9.1 Bacterial Growth Conditions and Cell Lysis
Cell pellets from Escherichia coli cultures under experimental conditions of either untreated controls (biological replicates 1 and 2), antibiotic-resistant, antibiotic-sensitive, probiotic-inhibited, or non-probiotic-inhibited were collected and processed for protein isolation from whole cells. Pellets were washed two times with ice-cold 1X PBS to remove all traces of culture medium.
Pellet was re-suspended in 100uL of freshly prepared lysis buffer (50 mM Tris-HCl pH 7.4, 150 mM NaCl, 1 mM EDTA, and 22 mM -mercaptoethanol; equating to 78.8 mg Tris-HCl, 87.7 mg NaCl, 3.7 mg EDTA, and 15.4 uL -mercaptoethanol per 10 mL ddH2O). After vortexing for 10 min, samples were subjected to ultrasonic disruption for 3 cycles (20 s ON, 40 s OFF). After ultrasonic disruption, samples were centrifuged at 15,000×g for 15 min at 4 °C(Hare et al., 2022).
9.2 Protein Quantification
The protein concentrations in the cell lysate were determined via the Bradford colorimetric method. The absorbance value at 595 nm was read from the microplate reader. Linear Regression Equation of the BSA standard curve: y = 0.1484x + 0.3243, where y is the A595 nm net and x is the protein concentration (mg/mL). Concentration of protein in the sample is determined using the following formula: x = (y - 0.3243)(0.1484)(Kielkopf et al., 2020).
9.3 Sodium Dodecyl Sulfate–Polyacrylamide Gel Electrophoresis (SDS-PAGE)
Protein separation was done using a vertical mini-gel electrophoresis system (10x7 cm). Discontinuous polyacrylamide gels were made using 30% (w/v) acrylamide/bis-acrylamide solution (29:1 cross-linking ratio). The 10% resolving gel (5 mL total volume) contained 1.9 mL double distilled water , 1.7 mL 30% acrylamide/bis mixture, 1.3 mL 1.5 M Tris-HCl (pH 8.8), 50 μL 10% (w/v) SDS, 50 μL 10% (w/v) ammonium persulfate (APS) and 2 μL TEMED and was allowed to polymerize for 30 minutes. The 5% stacking gel (3 mL total volume) was poured using 2.1 mL ddH2O, 0.5 mL acrylamide/bis mixture, 0.38 mL 1.0 M Tris-HCl (pH 6.8), 30 μL 10% (w/v) SDS, 30 μL 10% (w/v) APS and 3 μL TEMED. Samples containing proteins along with Laemmli sample buffer (containing SDS, beta-mercaptoethanol or DTT, glycerol, Tris-HCl pH 6.8, and bromophenol blue) were denatured at 95°C for 5 minutes, loaded into the wells, and run at a constant voltage (typically 80–120 V) in Tris-Glycine-SDS running buffer until the dye front reached the bottom of the gel(Arakawa et al., 2026; Gallagher, 2012).
9.4 Silver Staining:
Polyacrylamide gels were stained by the silver staining method according to the protocol of Blum with slight modifications. The procedure was carried out at room temperature in constant orbital shaking.
The gels were taken out of glass cassettes, washed in ddH2O (5 min), and fixed for 1 hour in 50 mL of fixing solution consisting of 50% v/v methanol and 12% v/v acetic acid supplemented with 0.018% v/v formaldehyde (25uLof 37% formaldehyde added immediately before use).
Gels were subjected to washing in 50% (v/v) ethanol (three times for 20 minutes) and were sensitized for two minutes in 50 ml of 0.8 mM sodium thiosulfate. Gels were subsequently washed in ddH2O (three times 30 seconds) and were immersed in 50 ml of 0.2% (w/v) silver nitrate solution containing 0.028% (v/v) formaldehyde (38 ul of 37% formaldehyde were added just before use) in the dark for 15 minutes.
Gel Development & Stop Page: Gels were then washed in ddH2O (three times) and developed in 50 ml of 6% (w/v) sodium carbonate (Na2CO3) to which one milliliter of 0.8 mM sodium thiosulfate was freshly added, along with 25 ul of 37% formaldehyde until the protein bands become visible. The development reaction was stopped using washing in ddH2O (two times 60 seconds) and soaking the gel in stoppage solution (50% v/v methanol, 12% v/v acetic acid) for 15 minutes.
Storage: Gels were then washed in 50% v/v methanol (20 minutes) and stored in preservation solution (40% v/v methanol, 5% v/v glycerol)(Chevallet et al., 2006; Jiang et al., 2022; Nadin et al., 2001).
10. RNA Extraction, cDNA Synthesis, and Quantitative Real-Time PCR (qRT-PCR)
Gene expression analysis was done through RNA (1.5 μg) that was reverse-transcribed into cDNA using the RevertAid First Strand cDNA Synthesis Kit from Thermo Fisher Scientific. PerlPrimer software was used to generate gene-specific primers, which included the reference gene 16S rRNA. Quantitative RT-PCR was done on a CFX 96 Real-Time PCR System (Bio-Rad) with KAPA SYBR Green Master Mix (Sigma-Aldrich). All reactions were triplicate and performed two times. Relative gene expression was determined using the 2^-ΔΔCt technique(Bustin et al., 2005; Fleige & Pfaffl, 2006; Heid et al., 1996).
Results
1. Patient Demographics, Socioeconomic Profile, Prescription Patterns, and Clinical History in Urinary Tract Infections (UTIs)
A comprehensive analysis of 50 patient medical records was conducted to delineate the epidemiological, socioeconomic, and clinical factors influencing the occurrence and management of urinary tract infections (UTIs). The data we have gathered in relation to our study comes from the 50 records of the patients with respect to demographics, previous illnesses, and use of antibiotics—to identify key risk patterns and therapeutic trends.
1.1 Demographic Profile and Sex-Based UTI Prevalence
Most of the patients included in this research are female; in fact, 40 of the 50 patients belong to this category, while their ages varied from 3 to 83 years old. In addition, most of these patients come from the rural areas, where their occupations include being housewives as well as industrial/construction workers.
It was found that UTIs were more common among females, as shown in 72.5% of the females based on Graph 1. The prevalence of UTIs among the females aged between 20 and 40 is high, and it indicates that gender and lifestyle may become etiological factors. The males were few in numbers and showed no clustering tendencies within age groups, indicating gender-specific differences in UTI prevalence.
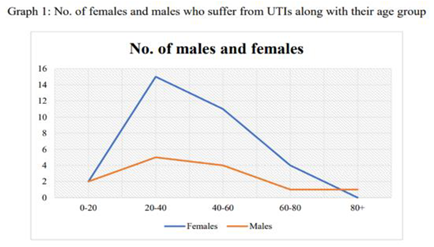
Graph 1: No. of females and males who suffer from UTIs along with their age group
1.2 Socioeconomic and Occupational Distribution
There were notable trends within the work history of the patients (Table 2). There were more housewives (n=32,64%) than any other occupation, representing nearly two-thirds of the study participants. The next group was general workers, who formed the second largest group (n = 8, 16.0%), students, (n=4, 8%), followed by factory workers (n=5, 10%), and drivers,(n=1, 2.0%), who were minorities within the sample group. The results indicate that socio-economic factors, responsibilities within the family, and possibly hygiene practices could be the reasons for the high prevalence of non-working females, as shown in Graph 2.
| Occupation | No of Patients |
| Housewife | 32 |
| Student | 4 |
| Worker | 8 |
| Industrial worker | 5 |
| Driver | 1 |
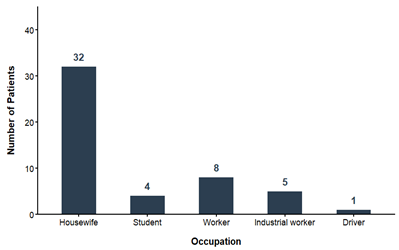
Table 2 and Graph 2: Occupational distribution among the study population can be illustrated using Graph 2 below, showing that the largest number of the total study population consists of housewives, followed by students, workers, and industrial workers.
1.3 Antibiotic Prescription Patterns
Regarding antibiotic usage, a large prevalence of the fluoroquinolone class was noted. For instance, the count of Norflox was 35, making it the largest. Other antibiotics like T. Gerpes (8) and T. PAN (7) were used in small quantities, as shown below in Graph 3. Large consumption parasitized by Norflox indicates that the medication is extensively used in the treatment of UTIs.
| Antibiotic Prescribed | Usage count |
| Norflox | 35 |
| T.PAN | 7 |
| T.Gerpes | 8 |
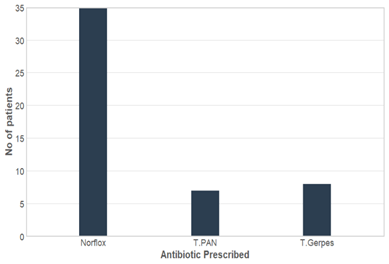
Table 3 and Graph 3: The antibiotic used to treat the patients is shown on Graph 3. Antibiotic prescription revealed Norflox to be the most frequently used antibiotic with 35 prescriptions, followed by T.Gerpes with 8 prescriptions, and T.PAN with 7 prescriptions, showing a marked preference for Norflox.
1.4 Clinical History and Comorbidity Profile
Clinical history showed underlying diseases (Table 4). Surprisingly, more than half of the patients (19 patients) had no history at all, and the infections can therefore be considered as primary infections. However, the most frequently reported history was repeat UTI in 12 patients, followed by fever in 8 patients, abdominal pain in 6 patients, and kidney stones in 5 patients (table and graph 4). From this study, it is clear that even though UTIs are mostly primary infections, recurrence and other comorbidities cannot be overlooked.
| Clinical History | No of patients |
| Nil (no history) | 19 |
| UTI | 12 |
| Fever | 8 |
| Abdominal pain | 6 |
| Renal stone | 5 |
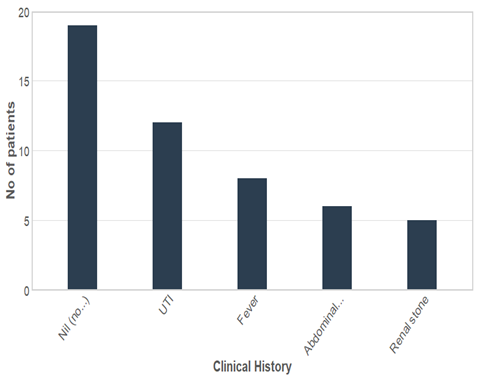
Table 4 and Graph 4: Background of clinical history for study subjects, indicating a preponderance of patients who had never been infected before, with UTI and fever being the most common diseases associated with it.
1.5 Geographic and Area Type Distribution
In total, the combined findings suggest that UTIs are mainly a rural disease affecting women, more specifically, women of reproductive age, particularly those who are homemakers. With regard to treatment, there is an overall tendency toward using drugs containing fluoroquinolones. The common complications include recurrence and other secondary diseases like kidney stones.
| Area Type | No of patient |
| Rural | 44 |
| Urban | 6 |
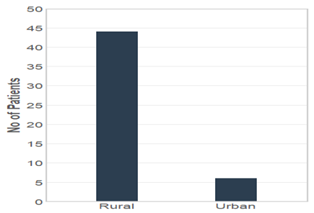
Table 5 and Graph 5: Distribution of participants according to area type, revealing dominance of the rural category (n = 44) over urban areas (n = 6).
2. Culturing and Identification of Bacterial Specimen
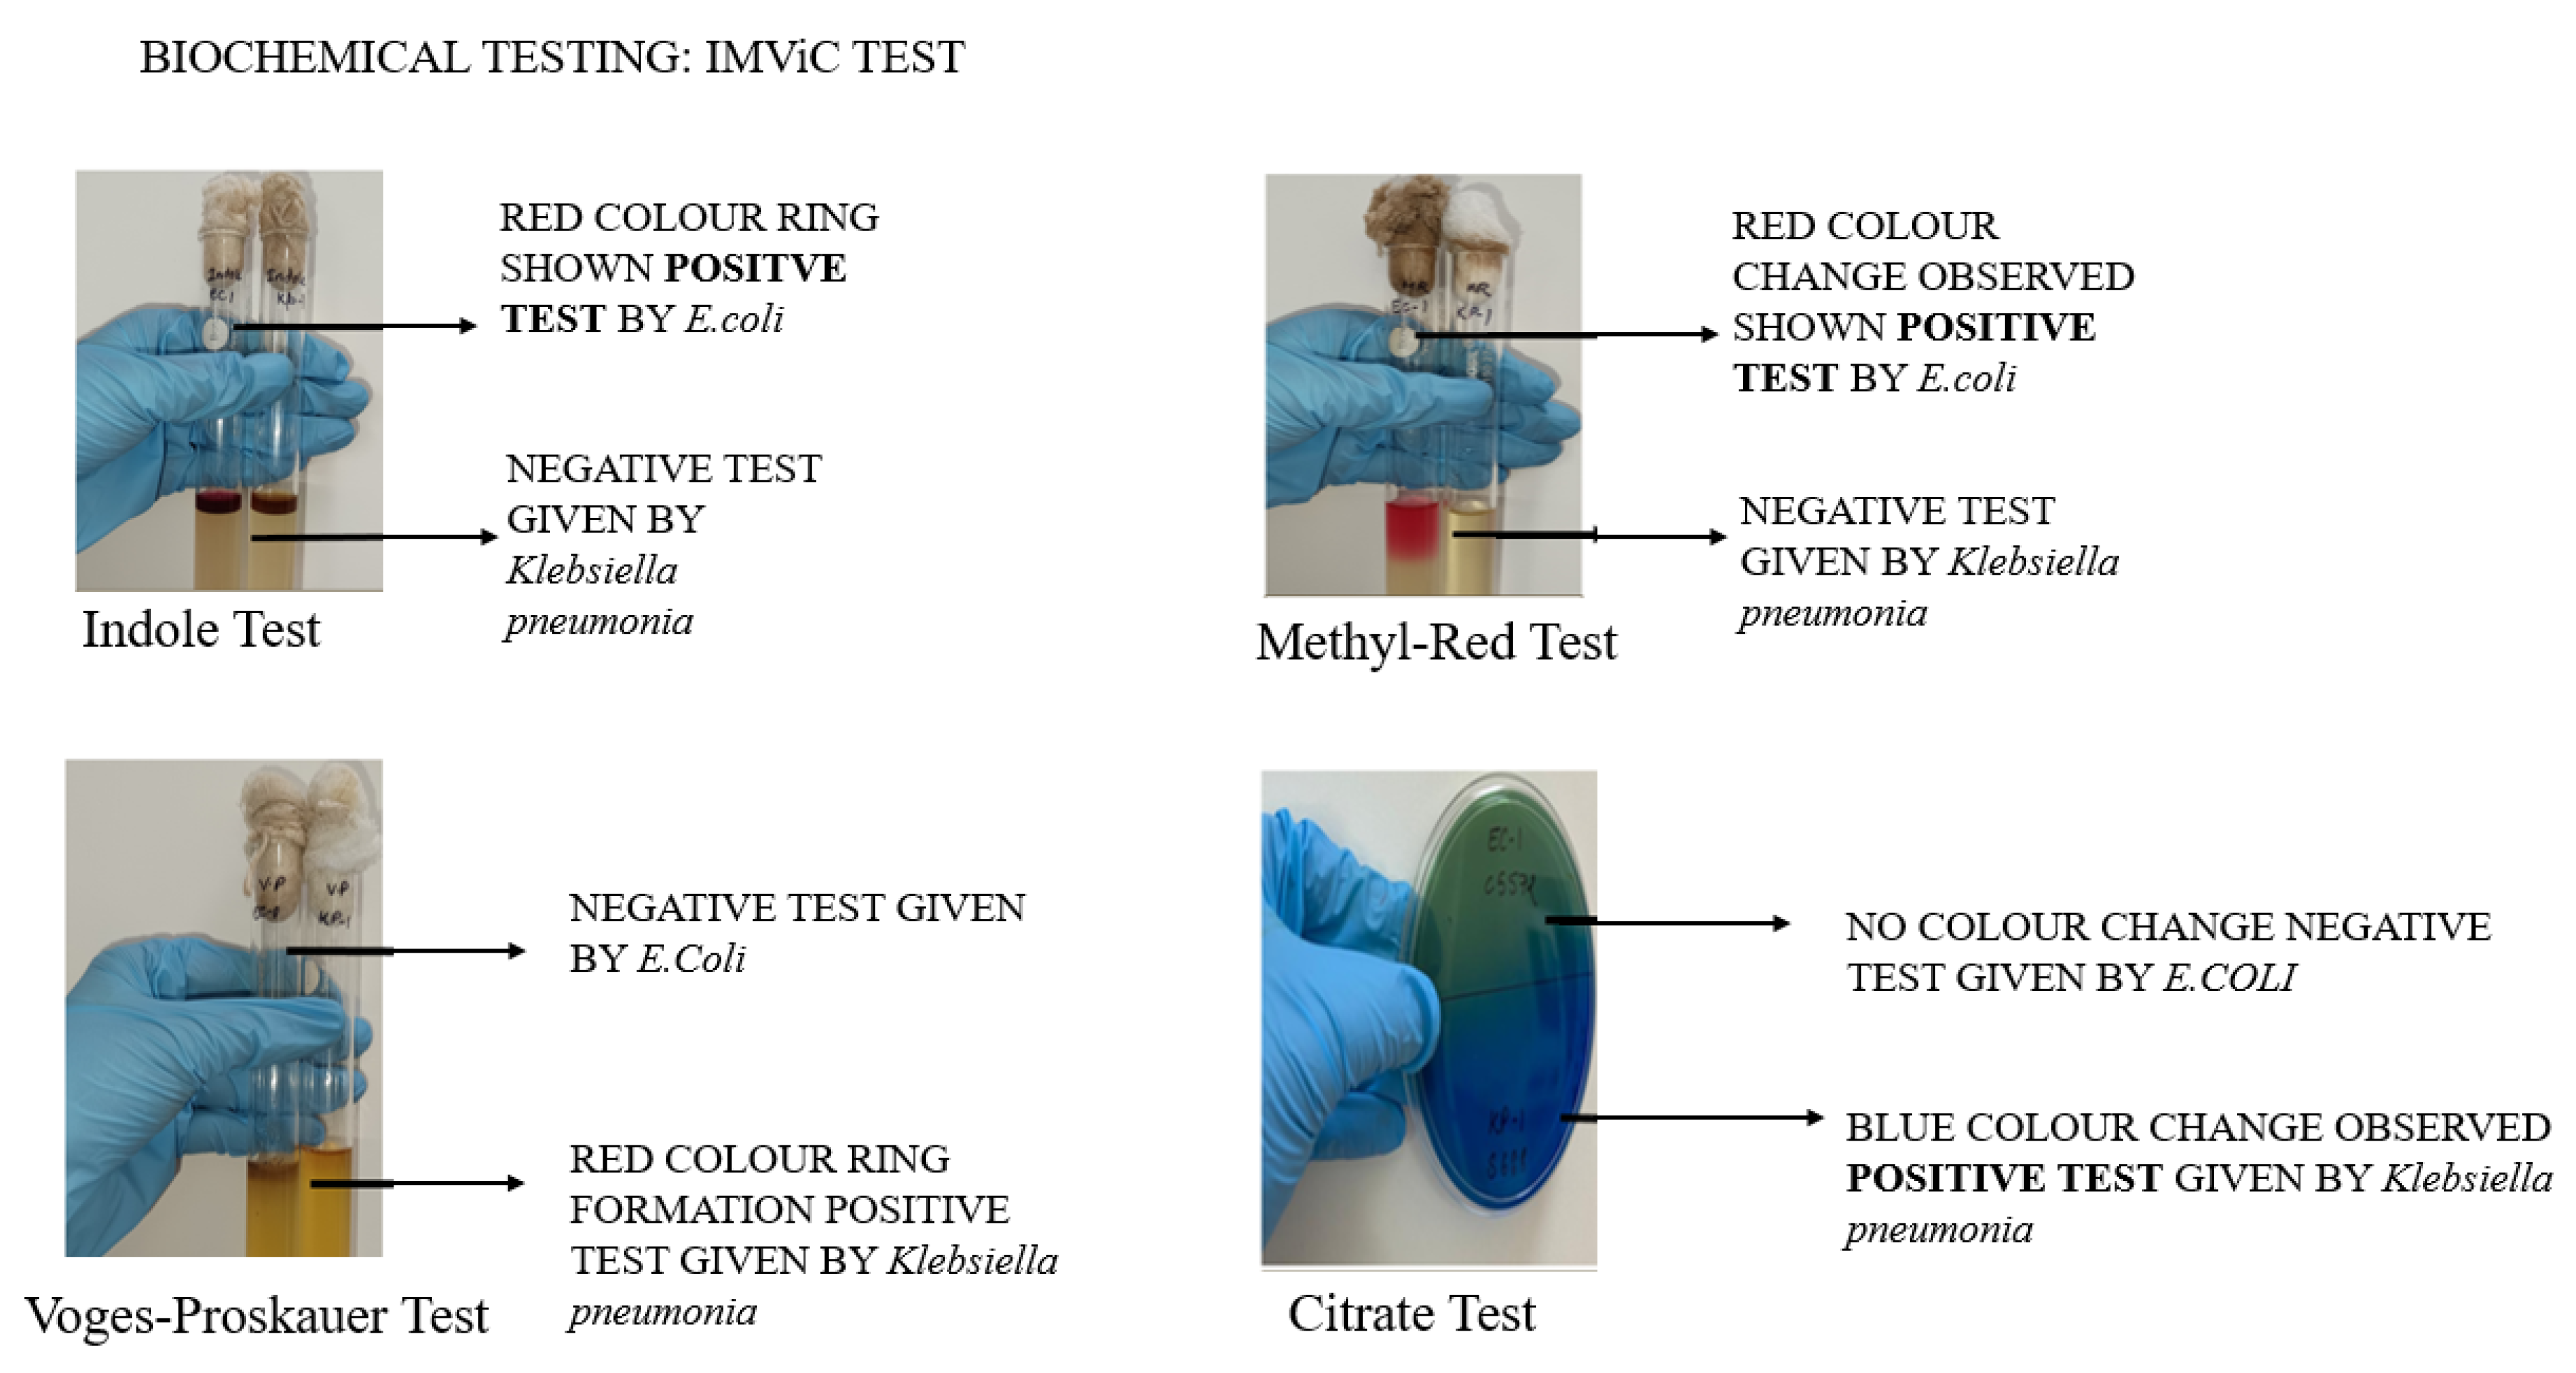
Biochemical analysis through IMViC tests was used to differentiate the enteric pathogens that belong to the Enterobacteriaceae family. As depicted in Figure 3, Escherichia coli had typical indole-positive results, and thus, the formation of a red-colored ring was evident during the reaction, demonstrating the presence of an enzyme capable of breaking down tryptophan to indole. For Klebsiella pneumoniae, an indole-negative reaction occurred. Furthermore, differentiation of the organisms was achieved by their metabolic properties of acids and bases, where Escherichia coli underwent mixed acid fermentation and, thus, lowered the pH level to less than 4.4. This was evident when it had a positive (red) result to the methyl red (MR) test, while Klebsiella pneumoniae gave a negative (yellow) result. Differentiation was noted in the Voges-Proskauer (VP) test, where the formation of a ketone acid compound of acetoin/2,3-butanediol resulted in a cherry-red coloration. The process was not observed in Escherichia coli because the organism lacked the capacity to form such compounds.
Such data, presented as an IMViC (+ + --) profile for E. coli and (- - ++) for K. pneumoniae, provide a strong biochemical foundation for the unambiguous identification of both bacteria. Biochemical tests were expanded to cover Staphylococcus aureus, whose identification among was based on a enzymatic tests, Catalase activity was very pronounced for the isolate, which resulted in effervescence when H_2O_2 was added, making it possible to exclude all Streptococcus species and therefore placed under the genus Staphylococcus.
Figure 3.
Biochemical Characterization IMViC Tests. The figure illustrates the comparative results of the IMViC series (Indole, Methyl Red, Voges-Proskauer, and Citrate utilization) for Escherichia coli and Klebsiella pneumonia.
Figure 3.
Biochemical Characterization IMViC Tests. The figure illustrates the comparative results of the IMViC series (Indole, Methyl Red, Voges-Proskauer, and Citrate utilization) for Escherichia coli and Klebsiella pneumonia.
3. Minimum inhibitory concentrations (MICs)
The sensitivity of the isolates to the antibiotics was determined by estimating the minimum inhibitory concentration (MIC) of the isolates against several antibiotics, as shown in Table 6 . The Gram-positive isolate (Staphylococcus aureus) was found to be strongly multidrug resistant since it exhibited resistance to macrolides (azithromycin and erythromycin), tetracycline and aminoglycosides (neomycin) with an MIC of 128 ug/ml for each of the corresponding antibiotic. It is important to highlight that the value of MIC 64 ug/ml of cefoxitine conclusively confirmed the presence of MRSA.

Table 6.
MIC Values and Clinical Interpretation for S. aureus Isolate
| Antibiotic | MIC Value (ug/ml) | Interpretation |
| Azithromycin | 128 | Resistant |
| Erythromycin | 128 | Resistant |
| Cefoxitine | 64 | Resistant |
| Tetracycline | 128 | Resistant |
| Neomycin | 128 | Resistant |
Table 6b.
MIC Values and Clinical Interpretation for E. coli and Klebsiella Isolates
| Antibiotic |
E. coli (1) ( ug/ml ) |
E. coli (2) ( ug/ml ) |
Klebsiella ( ug/ml ) |
E. coli (3) ( ug/ml ) |
Interpretation |
| Ampicillin | 128 | 128 | 128 | 128 | Resistant |
| Imipenem | 128 | 128 | 128 | 128 | Resistant |
| Ciprofloxacin | 128 | 128 | 128 | 128 | Resistant |
| Colistin | 16 | 32 | 64 | 64 | Resistant |
Similarly, Gram-negative isolates (3 Escherichia coli and 1 Klebsiella) were observed to have carbapenem-resistant enterobacteriaceae or multidrug-resistant (MDR) in terms of their resistance towards the antibiotics. For instance, the isolates had an MIC of 128 ug/mL for ampicillin, imipenem, and ciprofloxacin for all isolates, classifying the organisms as CRE.
4. Probiotic culturing and identification test
We cultured and identified Lactobacillus acidophilus, Lactic Acid Bacillus, Multi-Strain Probiotic, and Lactobacillus rhamnosus using standard biochemical tests. These strains were chosen based on their acid-tolerance activity, Gram-positive characteristic, and lack of catalase activity. It is believed that these strains can live and flourish in the gastrointestinal tract.
Probiotic strains were identified based on unique biochemical and morphological characteristics. All probiotic strains presented themselves with Gram-positive (+) characteristics. The probiotic strains had rod-like cells. In order to ensure that probiotic strains would survive in the harsh environment inside the gastrointestinal track, each of these strains was tested for acidity resistance (+).
In addition, various biochemical tests were conducted. Each of these strains failed the catalase and citrate tests but succeeded in the methyl-Red (MR) tests. The absence of catalase activity, along with acid tolerance, was the key factor used to determine that these strains can live and flourish in the gastrointestinal tract.
Table 7.
Morphological and Biochemical Characteristics of Select Probiotic Strains. The table summarizes the phenotypic and biochemical profiling of Lactobacillus acidophilus, Lactobacillus rhamnosus, Lactic acid bacillus, and a multi-strain probiotic.
Table 7.
Morphological and Biochemical Characteristics of Select Probiotic Strains. The table summarizes the phenotypic and biochemical profiling of Lactobacillus acidophilus, Lactobacillus rhamnosus, Lactic acid bacillus, and a multi-strain probiotic.
| Properties | L. acidophilus | L. rhamnosus | Lactic acid bacillus | Multi-strain Probiotic |
|---|---|---|---|---|
| Gram Staining | Positive (+) | Positive (+) | Positive (+) | Positive (+) |
| Acid Tolerance | Positive (+) | Positive (+) | Positive (+) | Positive (+) |
| Catalase Test | Negative (-) | Negative (-) | Negative (-) | Negative (-) |
| Citrate Test | Negative (-) | Negative (-) | Negative (-) | Negative (-) |
| Methyl Red (MR) | Positive (+) | Positive (+) | Positive (+) | Positive (+) |
| Cell Shape | Rods with rounded ends | Rod | Rods | Rods (Mixed) |
5. Anti-Microbial testing against Uropathogens
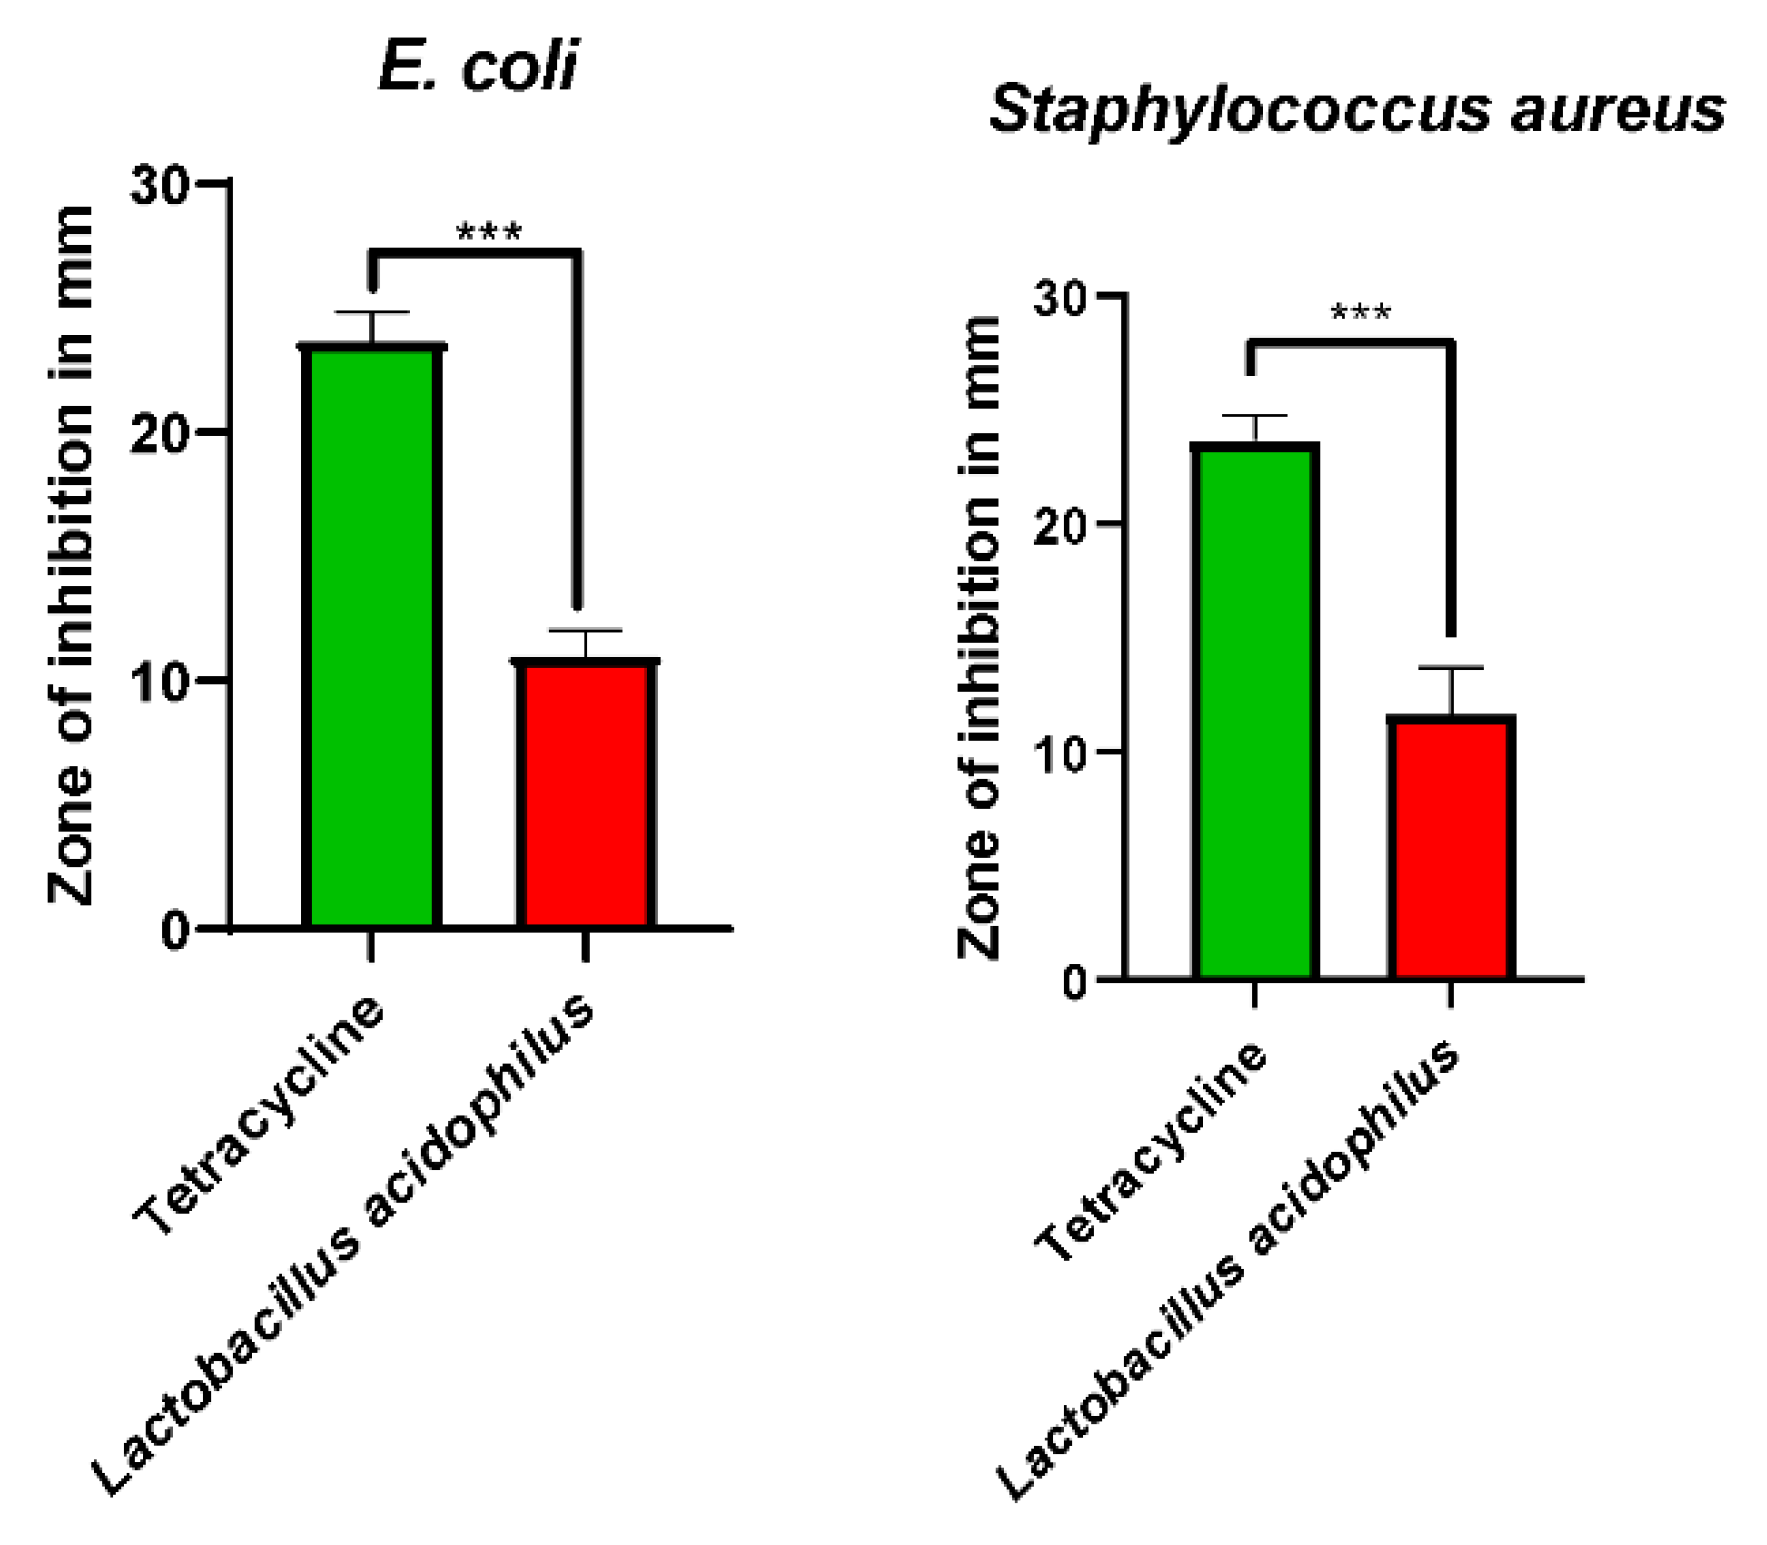
The antimicrobial effect of the probiotics, L. acidophilus, was shown by independent testing of its antimicrobial effect on Gram-negative and Gram-positive organisms (Figure 4).
5.1 Antimicrobial Efficacy of Lactobacillus acidophilus Against Clinical Isolates
When tested against E. coli, L. acidophilus was seen to have a ZOI of 11.00 ± 0.88 mm (p = 0.0001, t = 14.36, R2 = 0.9810; Figure 4a). Testing the probiotics against a Gram-positive isolate of S. aureus, the probiotics were seen to have a ZOI of 11.67 ± 1.37 mm (p = 0.0009, t = 8.73; Figure 4b). Although there is a significant increase in the ZOI of the positive control (Tetracycline, 23.67 ± 1.15 mm), the probiotics also showed highly statistically significant antimicrobial properties (p < 0.001).
Figure 4.
Antibacterial activity of Lactobacillus acidophilus against clinical isolates. Bar charts represent the Zone of Inhibition (ZOI) in mm of Tetracycline (positive control, green) and L. acidophilus (test strain, red). (a) Inhibition of E. coli (p = 0.0001, t = 14.36, R2 = 0.9810). (b) Inhibition of S. aureus (p = 0.0009, t = 8.73). Values are expressed as mean ± SD (n = 3). Statistical significance was calculated using an unpaired two-tailed t-test (*** p < 0.001).
Figure 4.
Antibacterial activity of Lactobacillus acidophilus against clinical isolates. Bar charts represent the Zone of Inhibition (ZOI) in mm of Tetracycline (positive control, green) and L. acidophilus (test strain, red). (a) Inhibition of E. coli (p = 0.0001, t = 14.36, R2 = 0.9810). (b) Inhibition of S. aureus (p = 0.0009, t = 8.73). Values are expressed as mean ± SD (n = 3). Statistical significance was calculated using an unpaired two-tailed t-test (*** p < 0.001).
5.2 Antimicrobial Efficacy of Lactic Acid Bacillus Against Gram- Negative Enteric Isolates
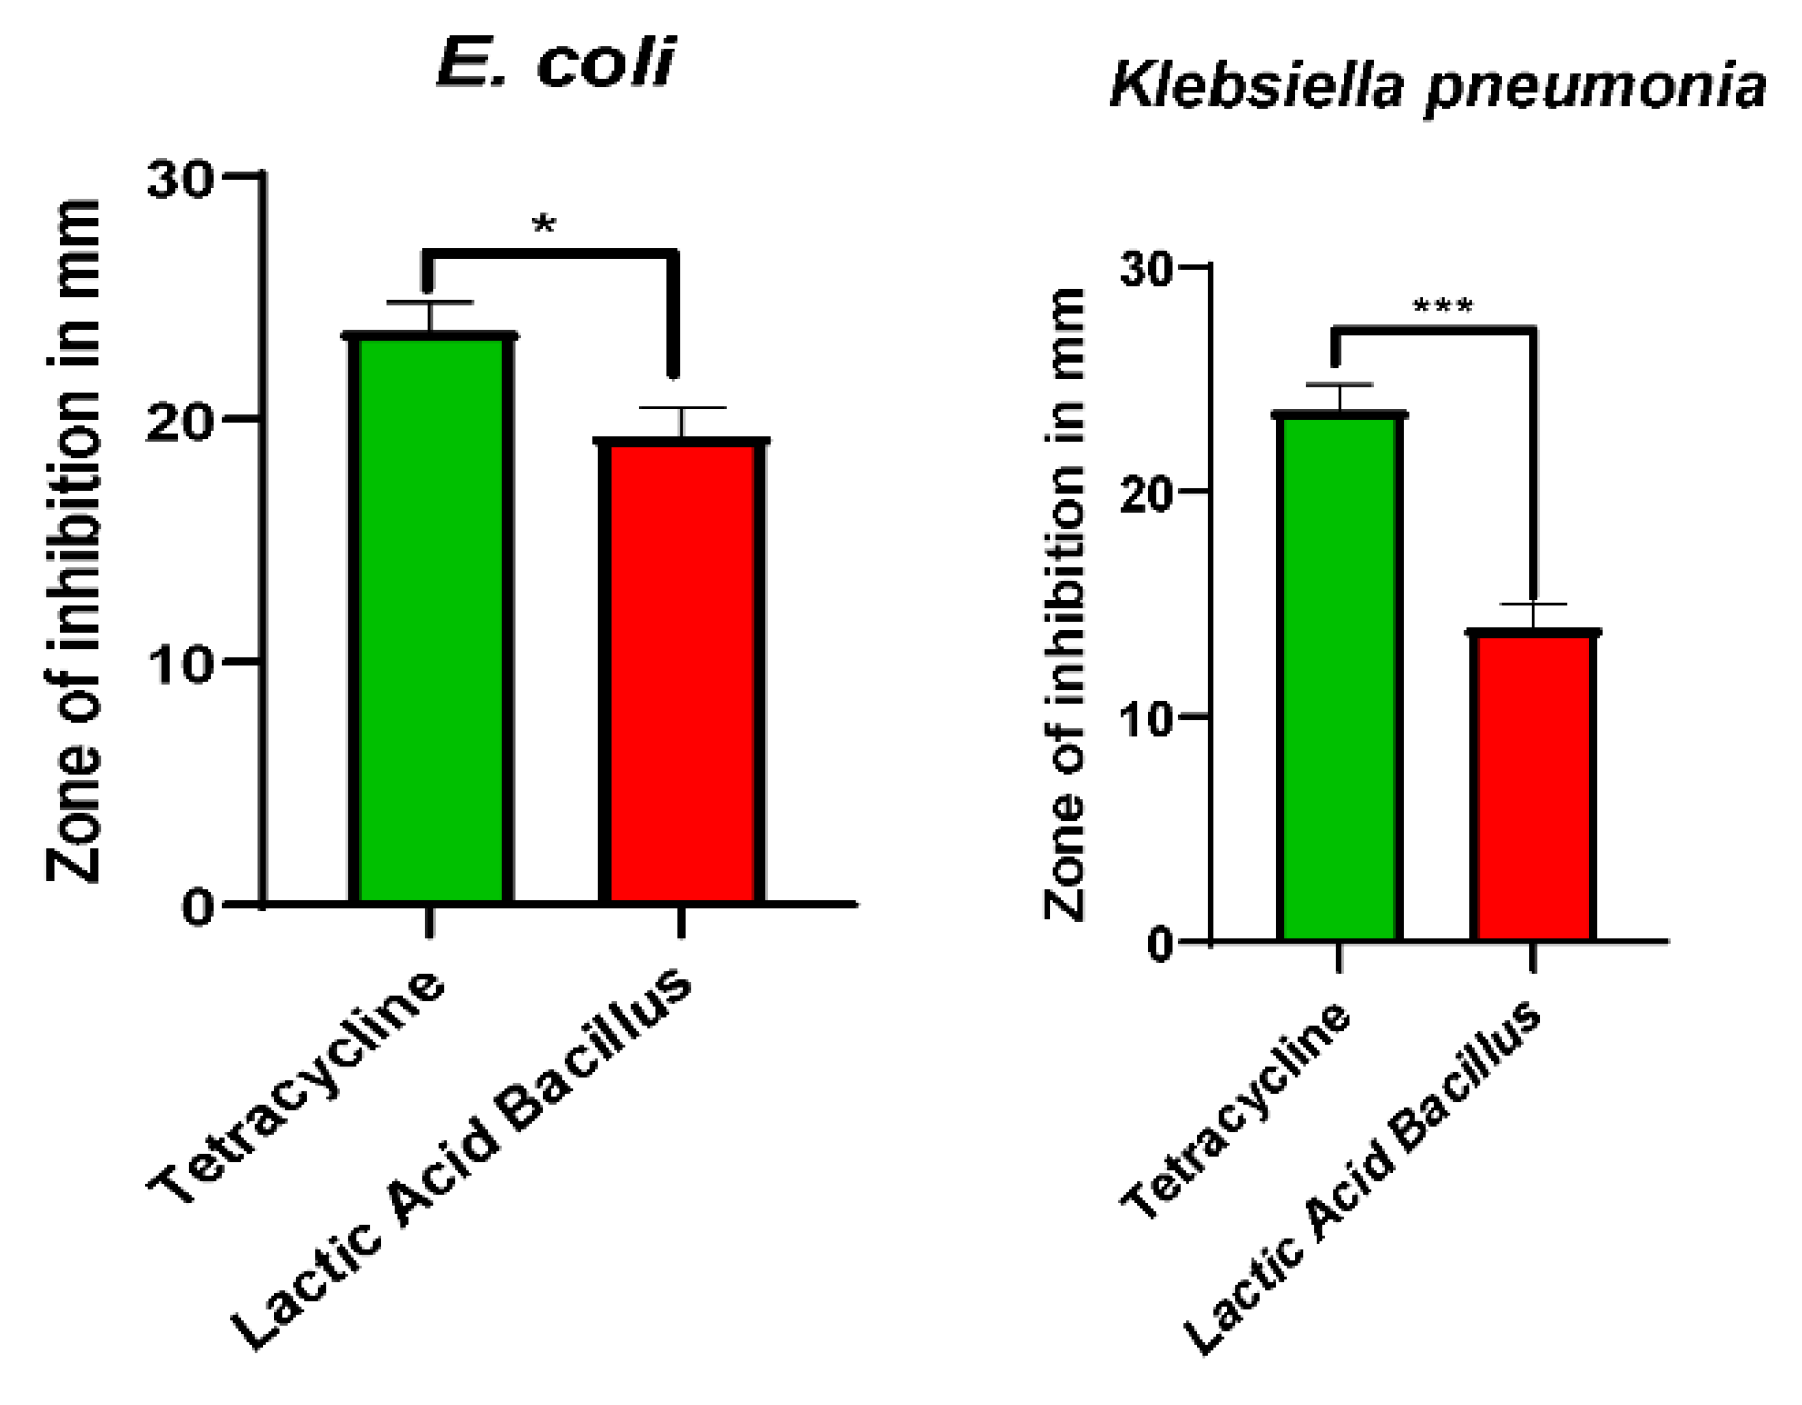
Antimicrobial activities of Lactic Acid Bacillus were carried out on the Gram-negative enteric bacteria strains such as E. coli and K. pneumoniae through the use of the agar well diffusion method. Culture of Lactic Acid Bacillus caused growth inhibition of E. coli with a zone of inhibition (ZOI) of 19.33 ± 1.15 mm. While Tetracycline exhibited higher antimicrobial activities with a ZOI of 23.67 ± 1.15 mm, the probiotic exhibited highly significant ZOI (p = 0.0101, R2 = 0.9810; Figure 5a).An antimicrobial activity similar to that of the previous one was also evident in the case of K. pneumoniae. The ZOI of Lactic Acid Bacillus was 14.00 ± 1.00 mm while that of Tetracycline was 23.67 ± 1.15 mm. Highly significant inhibition of growth was evident using statistical analysis with unpaired t-test (p = 0.0001; Figure 5b).
Figure 5.
Inhibitory activity of Lactic Acid Bacillus against Gram negative enteropathogens. Bar charts indicate Zone of Inhibition (ZOI) in mm for tetracycline (positive control) and Lactic Acid Bacillus (test strain). (a) Inhibitory activity against Escherichia coli with statistical significance (p = 0.0101, R2 = 0.9810). (b) Inhibitory activity against Klebsiella pneumoniae with highly significant activity (p = 0.0001). Standard deviation (n = 3) is shown as error bars and asterisks indicate statistical significance (*** p < 0.001).
Figure 5.
Inhibitory activity of Lactic Acid Bacillus against Gram negative enteropathogens. Bar charts indicate Zone of Inhibition (ZOI) in mm for tetracycline (positive control) and Lactic Acid Bacillus (test strain). (a) Inhibitory activity against Escherichia coli with statistical significance (p = 0.0101, R2 = 0.9810). (b) Inhibitory activity against Klebsiella pneumoniae with highly significant activity (p = 0.0001). Standard deviation (n = 3) is shown as error bars and asterisks indicate statistical significance (*** p < 0.001).
5.3 Synergistic Antagonistic Activity of Probiotic Combination Against E. coli
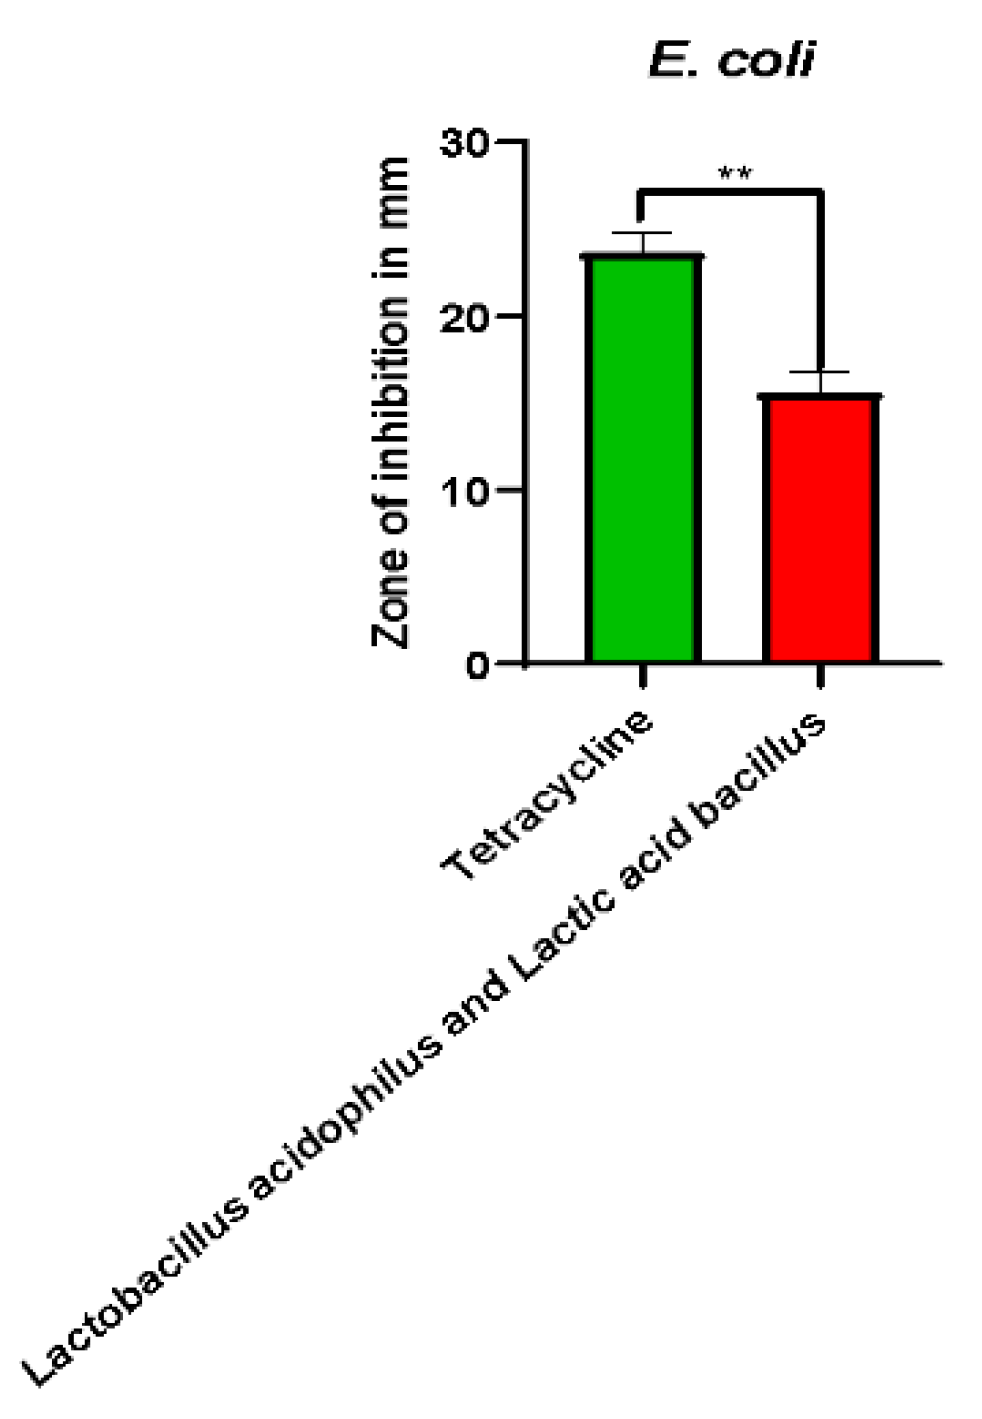
The antagonistic activity of the mixture of Lactobacillus acidophilus and Lactic Acid Bacillus against Escherichia coli was tested and compared with the standard antibiotic, tetracycline, as shown in Figure 6. The probiotic combination showed a mean zone of inhibition (ZOI) of 15.67 ± 1.15 mm. While the positive control antibiotic showed a significantly high ZOI of 23.67 ± 1.15 mm, there was still strong antagonistic activity shown by the probiotic combination. Statistical significance of the antimicrobial activity was obtained using an unpaired t-test (p = 0.001; Figure 6).
Figure 6.
Antimicrobial assay of the combination of Lactobacillus acidophilus and Lactic Acid Bacillus against Escherichia coli. The graph shows the mean Zone of Inhibition (ZOI) in mm for Tetracycline (positive control; green bar) and the experimental combination of Lactobacillus acidophilus and Lactic Acid Bacillus (red bar). Standard deviation is shown by error bars (n=3). Statistical test used was the independent two-tailed t-test (*** p = 0.001).
Figure 6.
Antimicrobial assay of the combination of Lactobacillus acidophilus and Lactic Acid Bacillus against Escherichia coli. The graph shows the mean Zone of Inhibition (ZOI) in mm for Tetracycline (positive control; green bar) and the experimental combination of Lactobacillus acidophilus and Lactic Acid Bacillus (red bar). Standard deviation is shown by error bars (n=3). Statistical test used was the independent two-tailed t-test (*** p = 0.001).
5.4 Strain-Dependent Efficacy Against ATCC Reference Strains
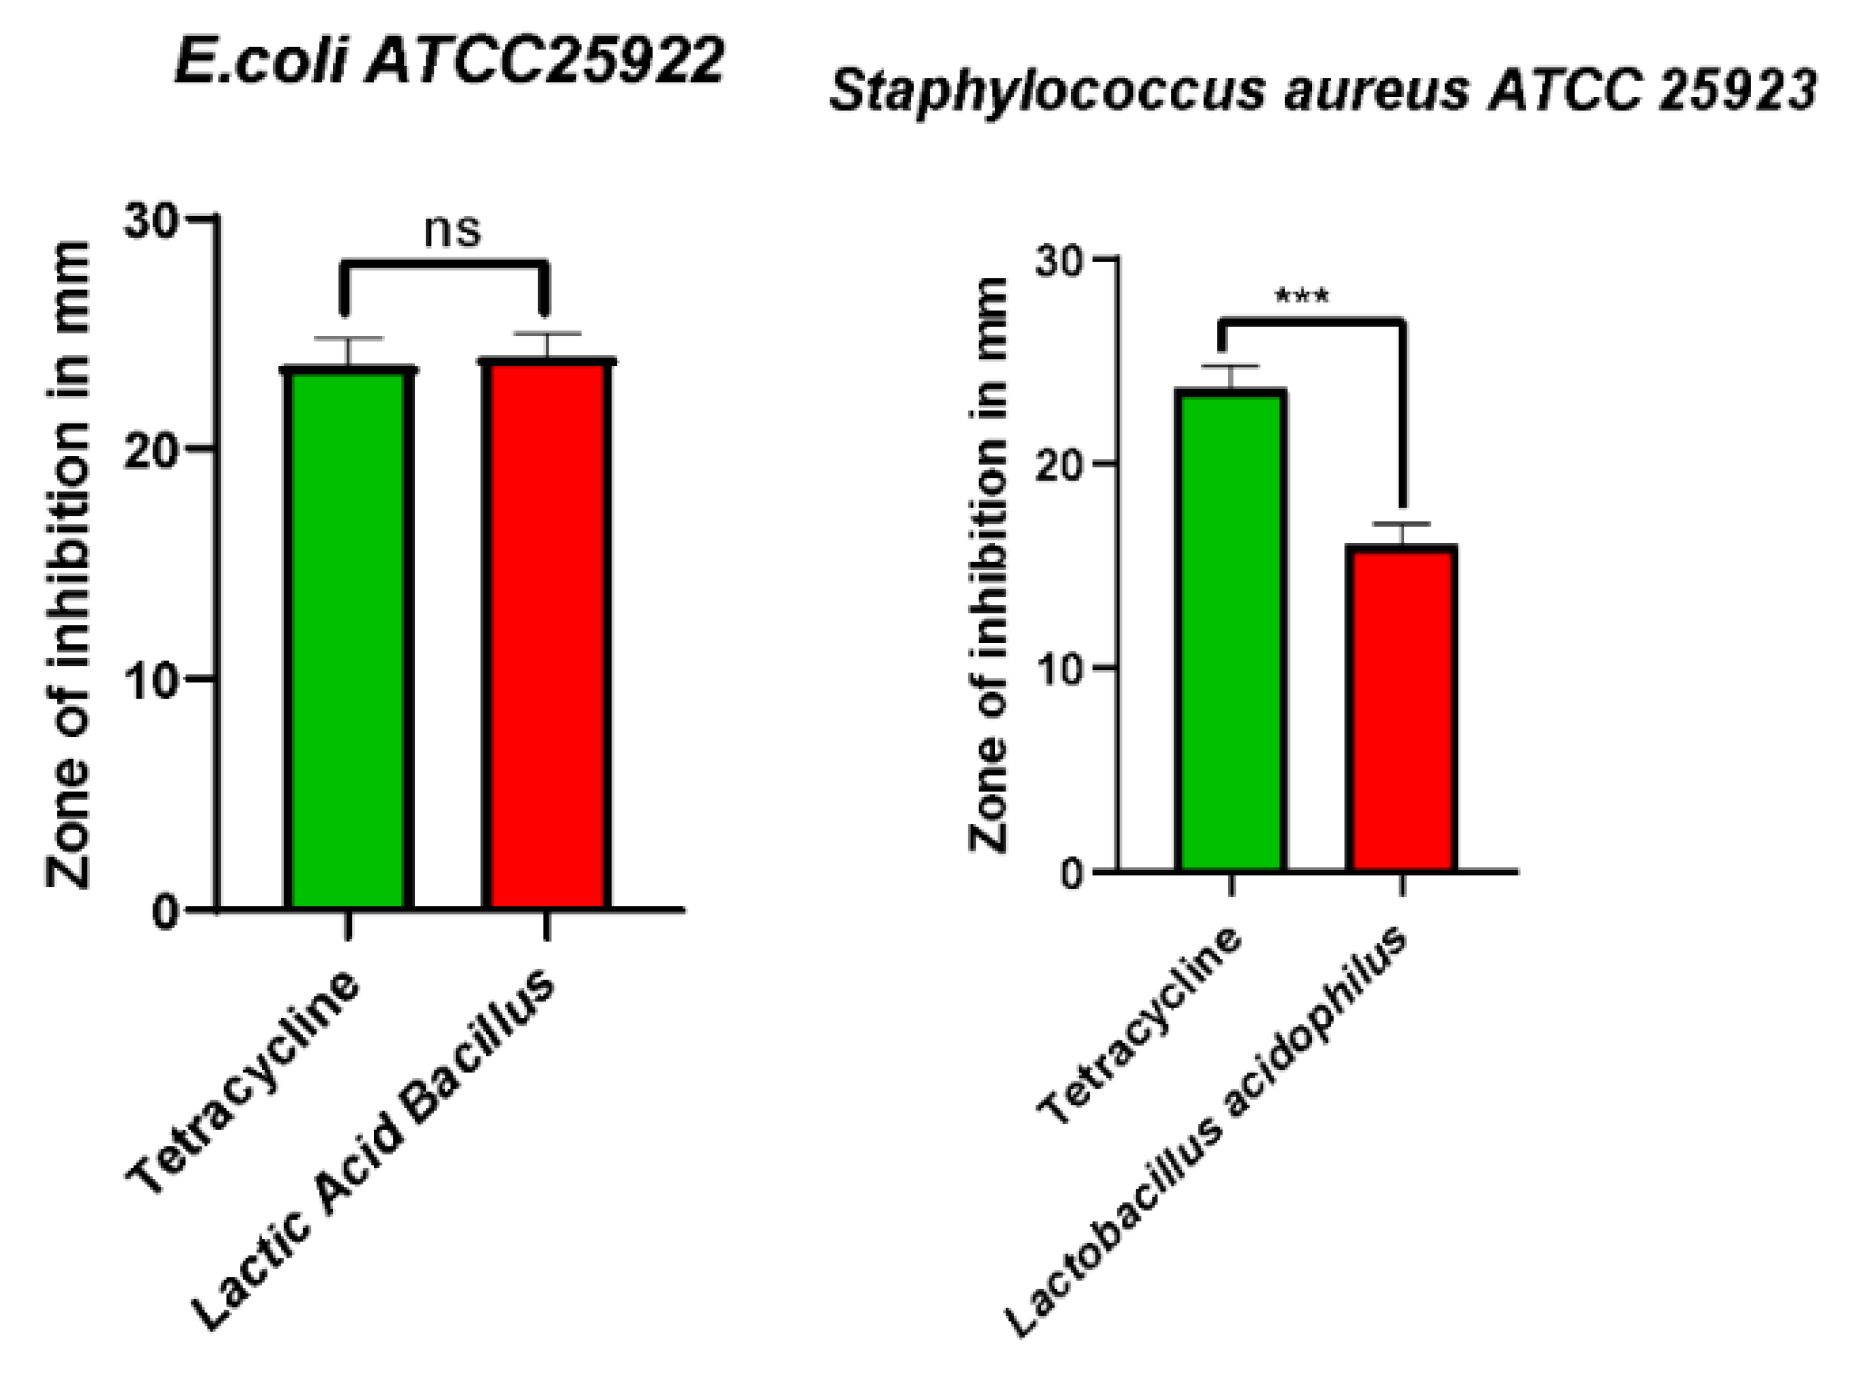
The antagonistic efficacy of Lactic Acid Bacillus and Lactobacillus acidophilus was performed using Escherichia coli ATCC 25922 and Staphylococcus aureus ATCC 25923 as reference strains. Of particular interest is the fact that Lactic Acid Bacillus inhibited growth of E. coli ATCC 25922, producing a zone of inhibition of 24.00 ± 1.15 mm. This activity is statistically indistinguishable from the one demonstrated by the positive control antibiotic – Tetracycline (23.67 ± 1.15 mm; p = 0.7247; Figure 7a).
In turn, L. acidophilus displayed a significant antibacterial activity towards S. aureus ATCC 25923 (p < 0.001; Figure 7b). The ZOI was smaller than that for Tetracycline (16.00 ± 1.00 mm compared to 23.67 ± 1.15 mm). However, it clearly retained its antagonistic activity. Thus, it is evident that antagonism of probiotics is strain-dependent, with Lactic Acid Bacillus exhibiting equivalent to antibiotics efficacy against a reference strain.
Figure 7.
Antibacterial activity of probiotic strains against ATCC reference isolates. Bar charts represent the Zone of Inhibition (ZOI) in mm for Tetracycline (positive control) and probiotic test strains. (a) Lactic Acid Bacillus against Escherichia coli ATCC 25922, showing strong inhibition with no statistically significant difference compared to Tetracycline (ns, p = 0.7247). (b) Lactobacillus acidophilus against Staphylococcus aureus ATCC 25923, showing statistically significant antagonism compared to control (*** p < 0.001). Error bars represent standard deviation (n = 3).
Figure 7.
Antibacterial activity of probiotic strains against ATCC reference isolates. Bar charts represent the Zone of Inhibition (ZOI) in mm for Tetracycline (positive control) and probiotic test strains. (a) Lactic Acid Bacillus against Escherichia coli ATCC 25922, showing strong inhibition with no statistically significant difference compared to Tetracycline (ns, p = 0.7247). (b) Lactobacillus acidophilus against Staphylococcus aureus ATCC 25923, showing statistically significant antagonism compared to control (*** p < 0.001). Error bars represent standard deviation (n = 3).
6. Anti-biofilm testing against uropathogens
The ability of Lactobacillus acidophilus, a multi-strain probiotic , and an isolate of lactic acid bacteria (LAB) to inhibit the biofilms formed by Uropathogenic Escherichia coli, Klebsiella pneumoniae, and Staphylococcus aureus was assessed using crystal violet biofilm assay (OD570).
6.1 Anti-Biofilm Activity Against Uropathogenic Escherichia coli (UPEC)
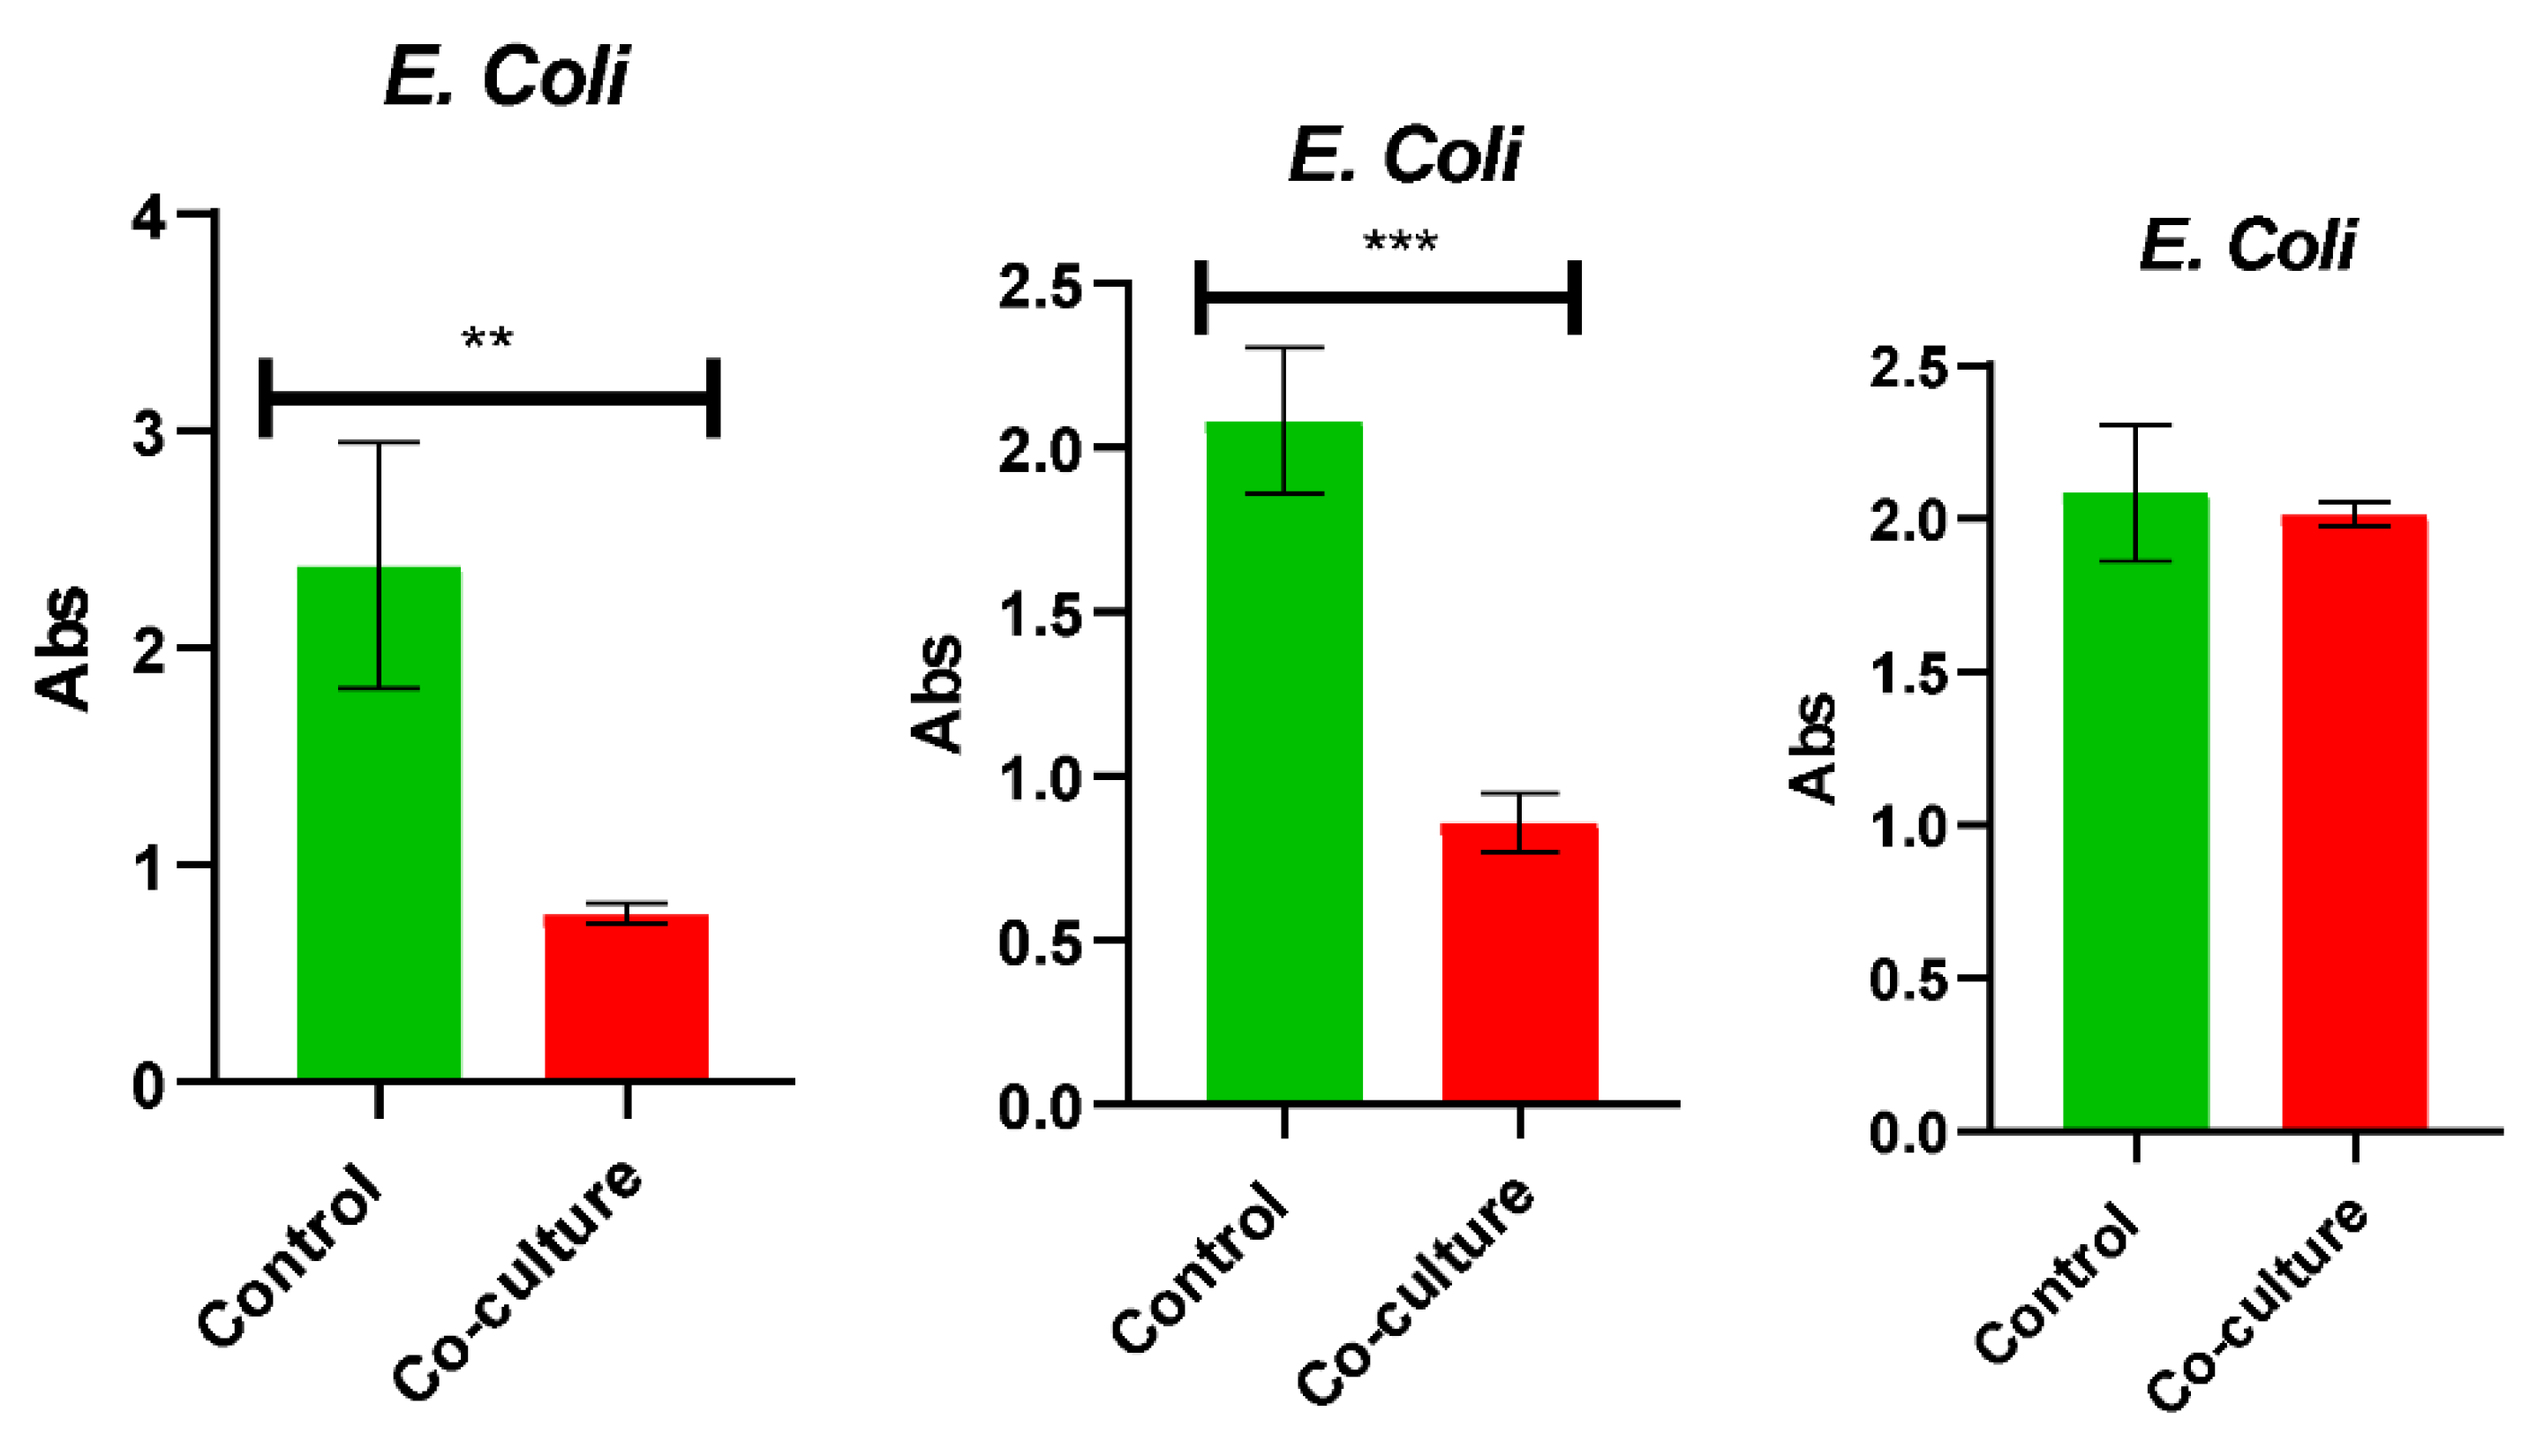
The effect of the tested strains on biofilm biomass showed strain-specific differences in the effectiveness of their anti-biofilm activity. Against the UPEC strain, the anti-biofilm activity was highest for the single-strain Lactobacillus acidophilus, which significantly reduced the biofilm formation of UPEC by lowering OD570 value from 2.40 ± 0.58 for the control culture to 0.80 ± 0.05 in co-culture (66.67% inhibition; p < 0.01; Figure 8). The multi-strain probiotic consortium also had high anti-biofilm activity, resulting in decrease in OD570 value from 2.10 ± 0.22 to 0.86 ± 0.09 (59.05% inhibition; p < 0.001). However, co-culture with the tested with the LAB strain produced no statistically significant reduction in biofilm biomass (control OD 2.10 ± 0.23 vs. co-culture OD 2.02 ± 0.04; 3.81% inhibition; p > 0.05).
Figure 8.
Inhibition by various probiotics on biofilm formation of Uropathogenic Escherichia coli (UPEC). Biofilm biomass of UPEC cultured alone (green bars) and in combination with various probiotics (red bars) was measured using crystal violet method (OD570). Bars show results for co-cultures with Lactobacillus acidophilus (inhibition 66.67%), multi-strain probiotics (inhibition 59.05%), and lactic acid bacteria (inhibition 3.81%). Data are shown as means ± SD (n = 3) and were tested using the unpaired Student’s t-test ( p < 0.01, *** p < 0.001, ns = non-significant).
Figure 8.
Inhibition by various probiotics on biofilm formation of Uropathogenic Escherichia coli (UPEC). Biofilm biomass of UPEC cultured alone (green bars) and in combination with various probiotics (red bars) was measured using crystal violet method (OD570). Bars show results for co-cultures with Lactobacillus acidophilus (inhibition 66.67%), multi-strain probiotics (inhibition 59.05%), and lactic acid bacteria (inhibition 3.81%). Data are shown as means ± SD (n = 3) and were tested using the unpaired Student’s t-test ( p < 0.01, *** p < 0.001, ns = non-significant).
6.2 Inhibition of Uropathogenic Klebsiella pneumoniae Biofilms
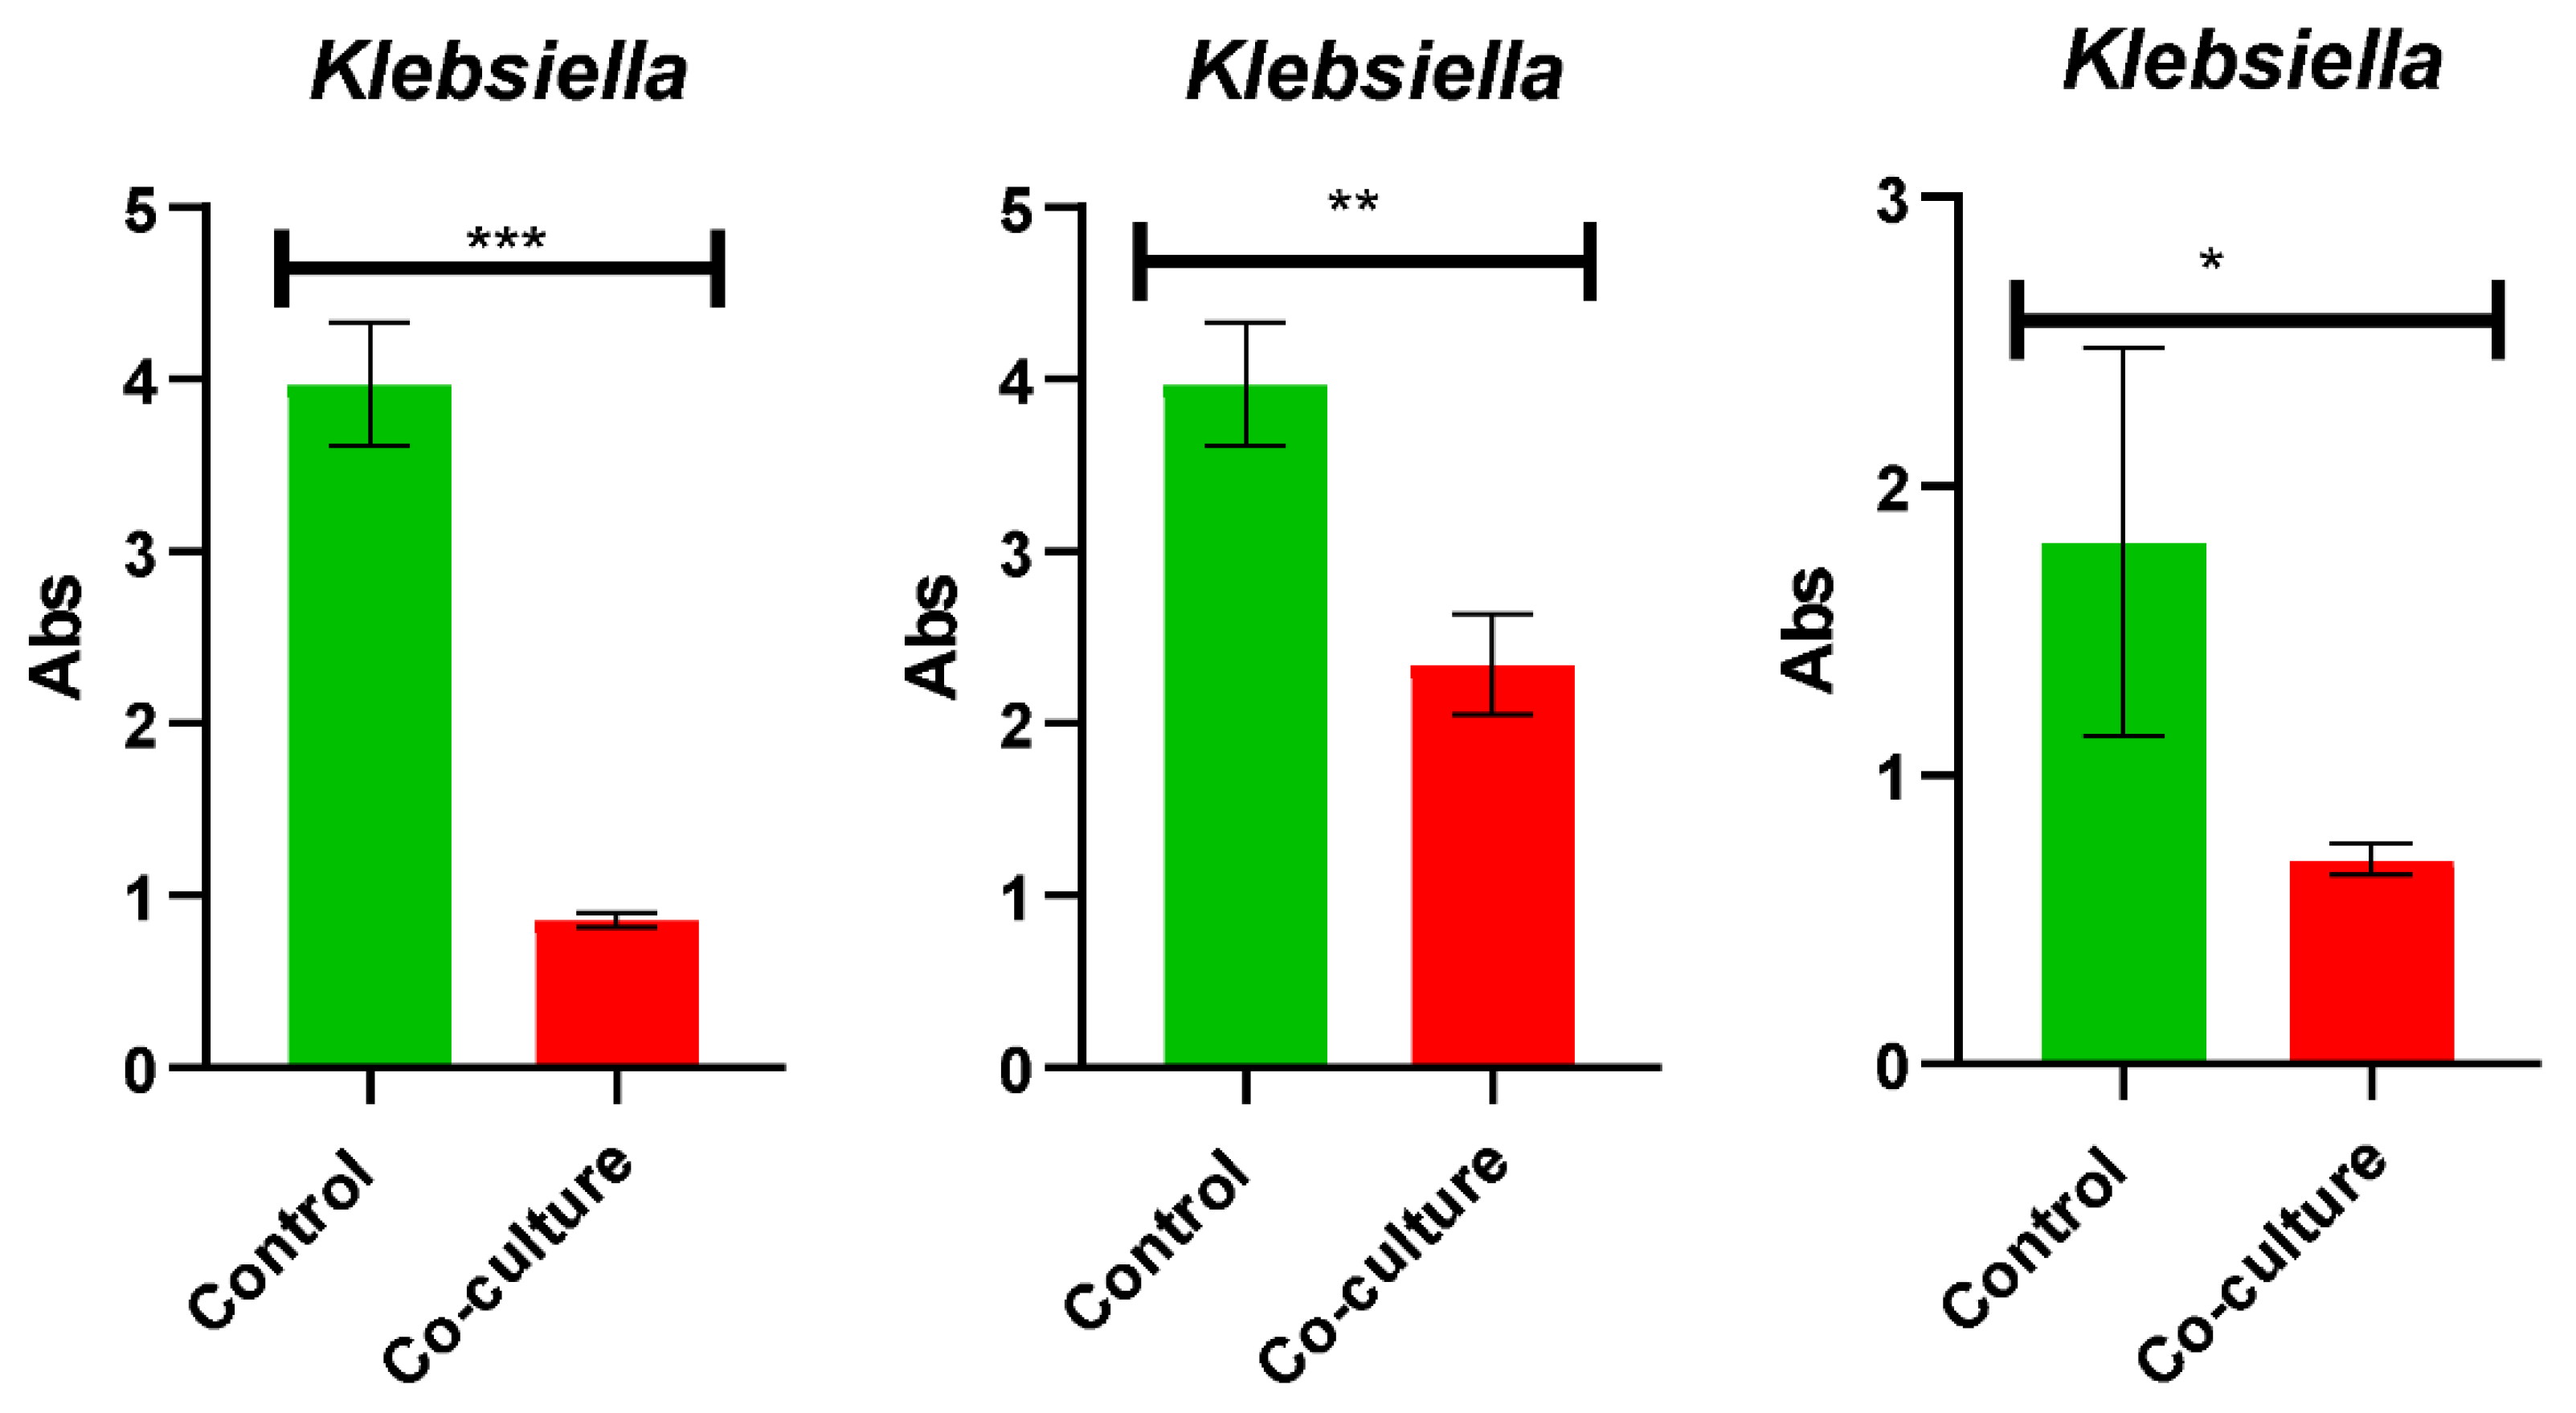
In co-cultures with Uropathogenic K. pneumoniae, all probiotic strains significantly inhibited biofilm biomass formation when compared to the monoculture. Monoculture strain of L. acidophilus showed the most powerful inhibitory properties, resulting in reduction of mean OD570 from 4.00 ± 0.35 to 0.88 ± 0.04 (78.00% inhibition; p < 0.001; Figure 9). Multi-strain probiotics in co-culture reduced OD570 from 1.80 ± 0.67 to 0.70 ± 0.05 (61.11% inhibition; p < 0.05), while isolate of LAB decreased OD570 from 4.00 ± 0.35 to 2.30 ± 0.31 (42.50% inhibition; p < 0.01).
Figure 9.
Inhibitory effect of probiotic formulations on formation of uropathogenic biofilm of Klebsiella pneumoniae. Biofilm biomass estimation of K. pneumoniae with probiotics – Lactobacillus acidophilus (left graph, 78.00% inhibition), multi-strain probiotics (middle graph, 61.11% inhibition), and LAB isolate (right graph, 42.50% inhibition) by crystal violet assay (OD570). Graph bars represent mean OD ± SD for single culture (green bars) and probiotic co-culture (red bars). Values obtained are mean of three biologically independent samples, analyzed using two-tailed unpaired Student’s t-test (* p < 0.05, p < 0.01, *** p < 0.001).
Figure 9.
Inhibitory effect of probiotic formulations on formation of uropathogenic biofilm of Klebsiella pneumoniae. Biofilm biomass estimation of K. pneumoniae with probiotics – Lactobacillus acidophilus (left graph, 78.00% inhibition), multi-strain probiotics (middle graph, 61.11% inhibition), and LAB isolate (right graph, 42.50% inhibition) by crystal violet assay (OD570). Graph bars represent mean OD ± SD for single culture (green bars) and probiotic co-culture (red bars). Values obtained are mean of three biologically independent samples, analyzed using two-tailed unpaired Student’s t-test (* p < 0.05, p < 0.01, *** p < 0.001).
6.3 Antagonistic Effects on Staphylococcus aureus Biofilm Formation
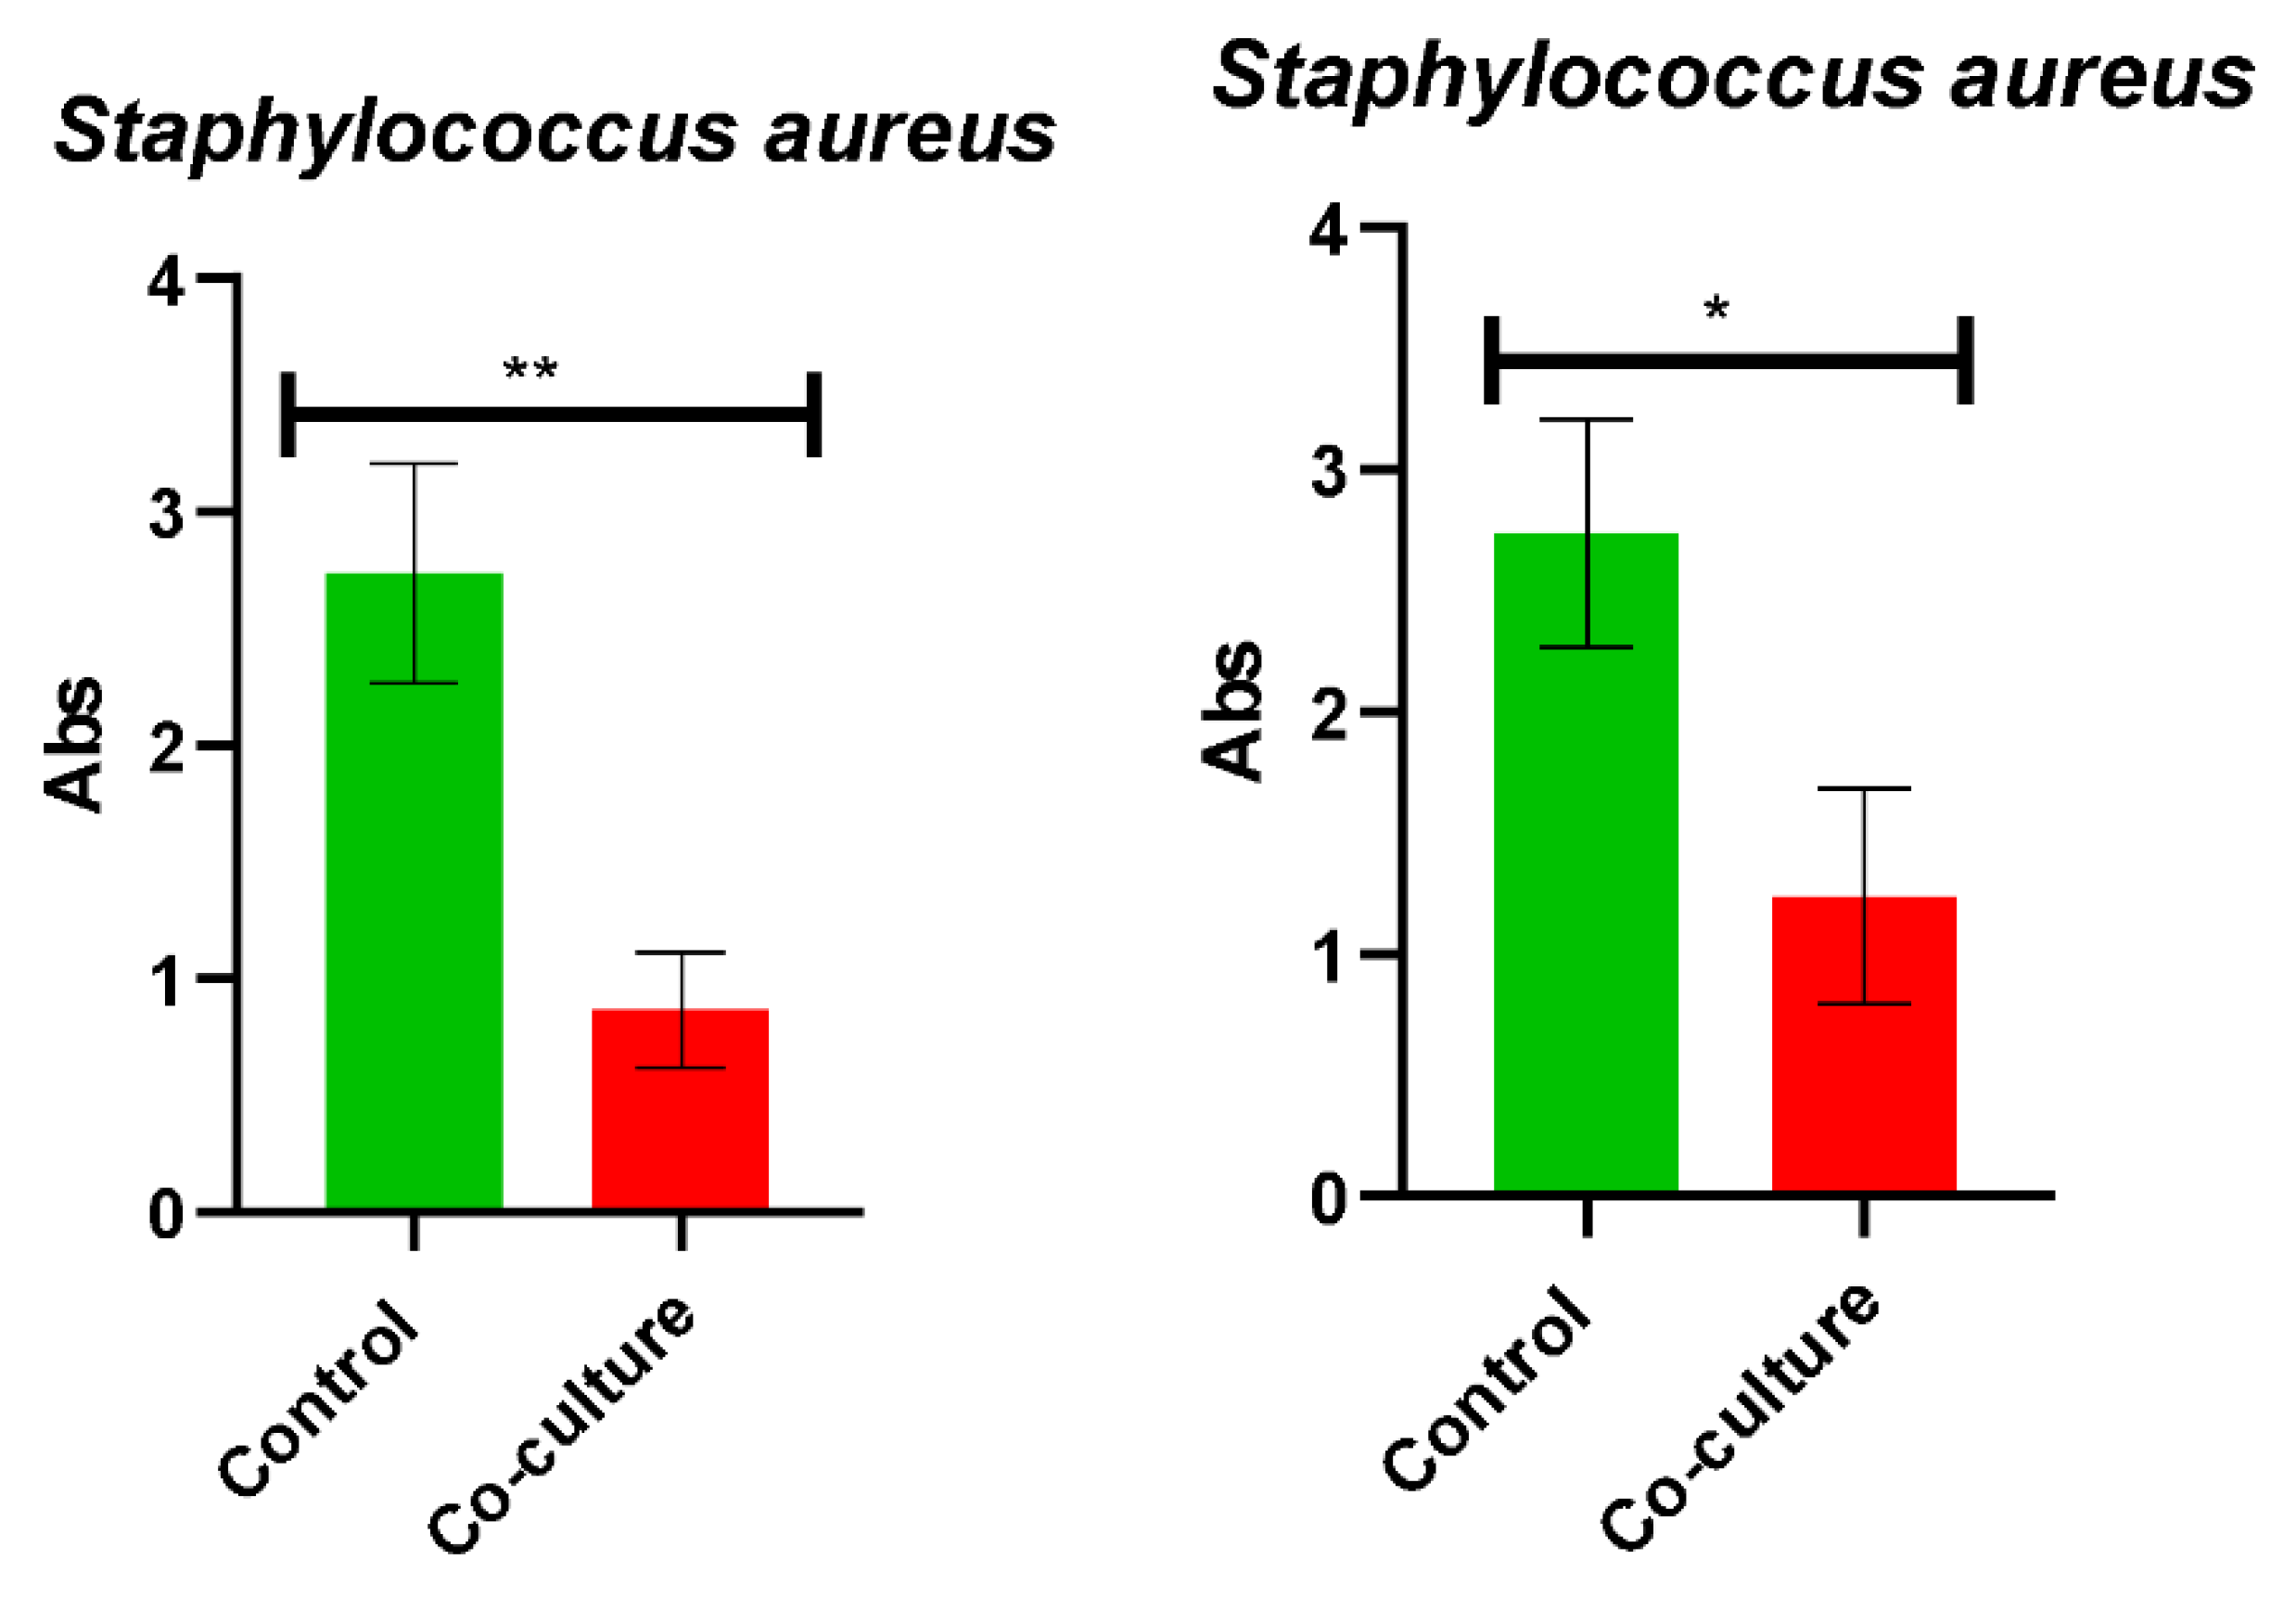
In case of competition between the Gram-positive S. aureus biofilm and probiotics, considerable interference with bacterial biofilm structure was noted. L. acidophilus showed higher inhibitory activity compared with the multi-strain probiotic, and it inhibited OD570 from 2.75 ± 0.48 to 0.85 ± 0.24 (69.09% inhibition; p < 0.01; Figure 10). With the multi-strain probiotics, OD570 was decreased from 2.75 ± 0.46 to 1.25 ± 0.44 (54.55% inhibition; p < 0.05). Overall, L. acidophilus exhibited superior inhibitory capacity against all tested uropathogenic biofilms.
Figure 10.
Antagonistic ability of probiotic preparations on uropathogenic Staphylococcus aureus biofilm formation. Biofilm formation by Staphylococcus aureus in mono- and co-culture with probiotics, measured via crystal violet assay (OD570) for Lactobacillus acidophilus (left panel; 69.09% inhibition) and multi-strain probiotics (right panel; 54.55% inhibition). Experiments conducted in triplicate (n = 3), results were subjected to statistical analysis by two-tailed unpaired Student’s t-test (* p < 0.05, p <0.01).
Figure 10.
Antagonistic ability of probiotic preparations on uropathogenic Staphylococcus aureus biofilm formation. Biofilm formation by Staphylococcus aureus in mono- and co-culture with probiotics, measured via crystal violet assay (OD570) for Lactobacillus acidophilus (left panel; 69.09% inhibition) and multi-strain probiotics (right panel; 54.55% inhibition). Experiments conducted in triplicate (n = 3), results were subjected to statistical analysis by two-tailed unpaired Student’s t-test (* p < 0.05, p <0.01).
7. Quantification of Whole-Cell Soluble Protein Recovery
The concentration of total soluble protein present in clarified extracts of E. coli cells was measured using the Bradford assay under six different experimental conditions to ensure equal loadings for the electrophoretic experiments. The absorbance readings were recorded at 620 nm and were then plotted on a calibration curve of bovine serum albumin (BSA) using the following linear regression equation: y = 0.1484x + 0.3243.
The protein concentrations interpolated from individual measurements of aliquots ranged from 0.0465 µg/µL to 1.2540 µg/µL. The mean total protein obtained under each experimental condition was different. The mean protein concentrations obtained from control untreated E. coli cells (P2) and (P7) were 0.3985 µg/µL and 0.4558 µg/µL, respectively. In terms of the treatments, the resistant to antibiotics group had a lower mean protein yield of 0.2185 µg/µL when compared to the sensitive group of 0.4285 µg/µL. In the probiotics experiment, the mean protein yield of the inhibition group was 0.3705 µg/µL while that of the resistant group was 0.4981µg/µL.
Table 8.
Absorbance (620 nm) and calculated protein concentrations across experimental conditions.
| Aliquot / Reading | P2 Untreated (µg/µL) | P7 Untreated (µg/µL) | Antibiotic Resistance (µg/µL) | Antibiotic Sensitive (µg/µL) | Probiotic Inhibition (µg/µL) | Probiotic Resistance (µg/µL) |
|---|---|---|---|---|---|---|
| Reading 1 | ND | ND | ND | ND | ND | ND |
| Reading 2 | ND | ND | ND | ND | ND | ND |
| Reading 3 | 0.4666 | 0.2706 | 0.4912 | 0.5411 | 0.4454 | 0.8521 |
| Reading 4 | 0.6860 | 0.7972 | 0.6880 | 0.6897 | 0.7018 | 0.9084 |
| Reading 5 | 0.8595 | 1.0708 | 1.0115 | 1.0098 | 1.0721 | 1.0431 |
| Reading 6 | 1.2540 | 1.1873 | 1.2675 | 1.1809 | 1.2217 | 1.2156 |
| Mean Yield | 0.3985 | 0.4558 | 0.2185 | 0.4285 | 0.3705 | 0.4981 |
8. Comparative SDS-PAGE Proteomic Profiling and Band Intensity Analysis
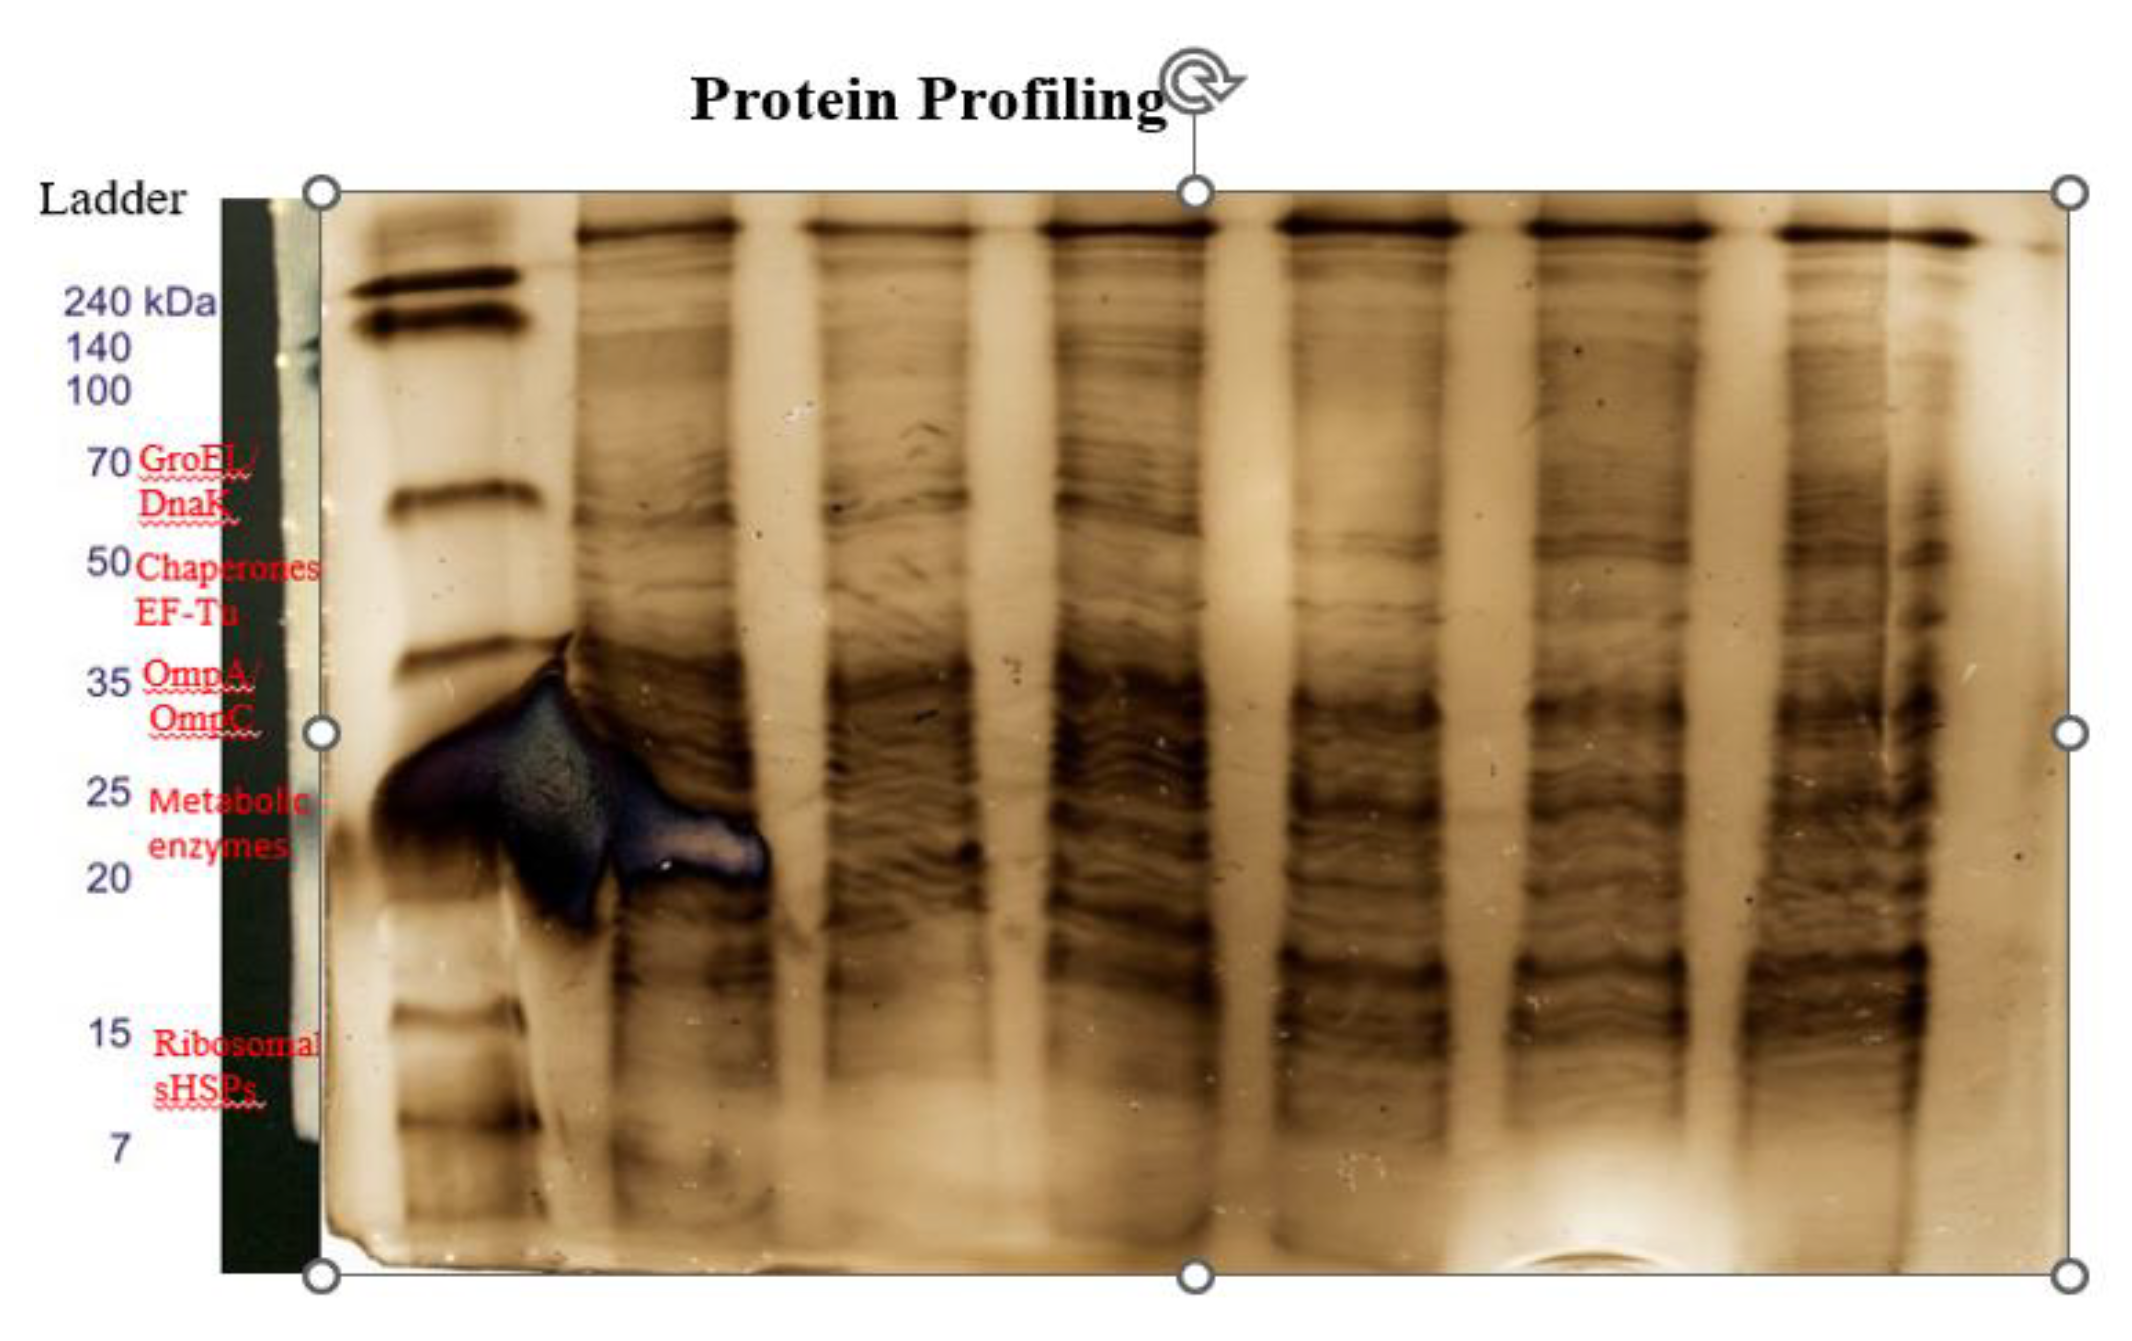
Following the Bradford assay standardization, an equal volume of 20 µL from the heat-denatured lysates was loaded on 10% SDS-PAGE gel and run at 90 volts for 90 minutes. Visualization of proteins was achieved through a slightly altered method of Blum’s silver staining technique and resulted in the detection of sharp and clearly distinguishable bands with a molecular weight range of about 10 to 100 kDa (Figure 11).
Ungrown E. coli samples (Lanes 1 and 2) acted as the controls for defining the base-line bacterial proteomic profile. These control lanes showed high reproducibility with dense banding pattern and prominent darker bands in the middle and high molecular weight bands (40 – 80 kDa) which represented molecular chaperones (groel/dnak, ~70 kDa) and elongation factor Tu (EF-Tu, ~50 kDa).Probiotic induced changes in the intensities of the bands were evident in relation to the inhibitory property of the strain.The Probiotic Non-inhibition (Lane 6) sample had a dense banded pattern in both high and low molecular weights.
Changes in proteomics due to antibiotic treatment were also evident. The Antibiotic-Resistant (Lane 3) strain had fewer bands on the gel in general compared to the control sample. Although the low to mid molecular weight bands were faint, there was still one high molecular weight band (70-80 kDa, groel/dnak) that could be seen. On the other hand, the antibiotic-sensitive (Lane 4) sample had fewer high molecular weight bands but maintained clear low to mid molecular weight bands (20-45 kDa, OmpA/OmpC).
Figure 11.
Whole-cell protein expression profiles of E. coli obtained through 10% SDS-PAGE and silver staining. Equal volumes (20 µL) of clarified lysates were loaded into each lane. Lanes: M - Molecular Weight Marker; Lane 1 - Untreated E. coli (Replicate 1); Lane 2 - Untreated E. coli (Replicate 2); Lane 3 - Antibiotic-Resistant E. coli; Lane 4 - Antibiotic-Sensitive E. coli; Lane 5 - Probiotic Inhibition Treatment; Lane 6 - Probiotic Non-inhibition Treatment.
Figure 11.
Whole-cell protein expression profiles of E. coli obtained through 10% SDS-PAGE and silver staining. Equal volumes (20 µL) of clarified lysates were loaded into each lane. Lanes: M - Molecular Weight Marker; Lane 1 - Untreated E. coli (Replicate 1); Lane 2 - Untreated E. coli (Replicate 2); Lane 3 - Antibiotic-Resistant E. coli; Lane 4 - Antibiotic-Sensitive E. coli; Lane 5 - Probiotic Inhibition Treatment; Lane 6 - Probiotic Non-inhibition Treatment.
9. Transcriptional Modulation of Membrane and Stress Response Genes in Escherichia coli Under Probiotic and Antibiotic Stress
Relative gene expression levels of mRNA were determined using the qRT-PCR method with the use of 16S rRNA as the normalization factor.
9.1 Outer Membrane Protein (omp) Gene Expression Profile
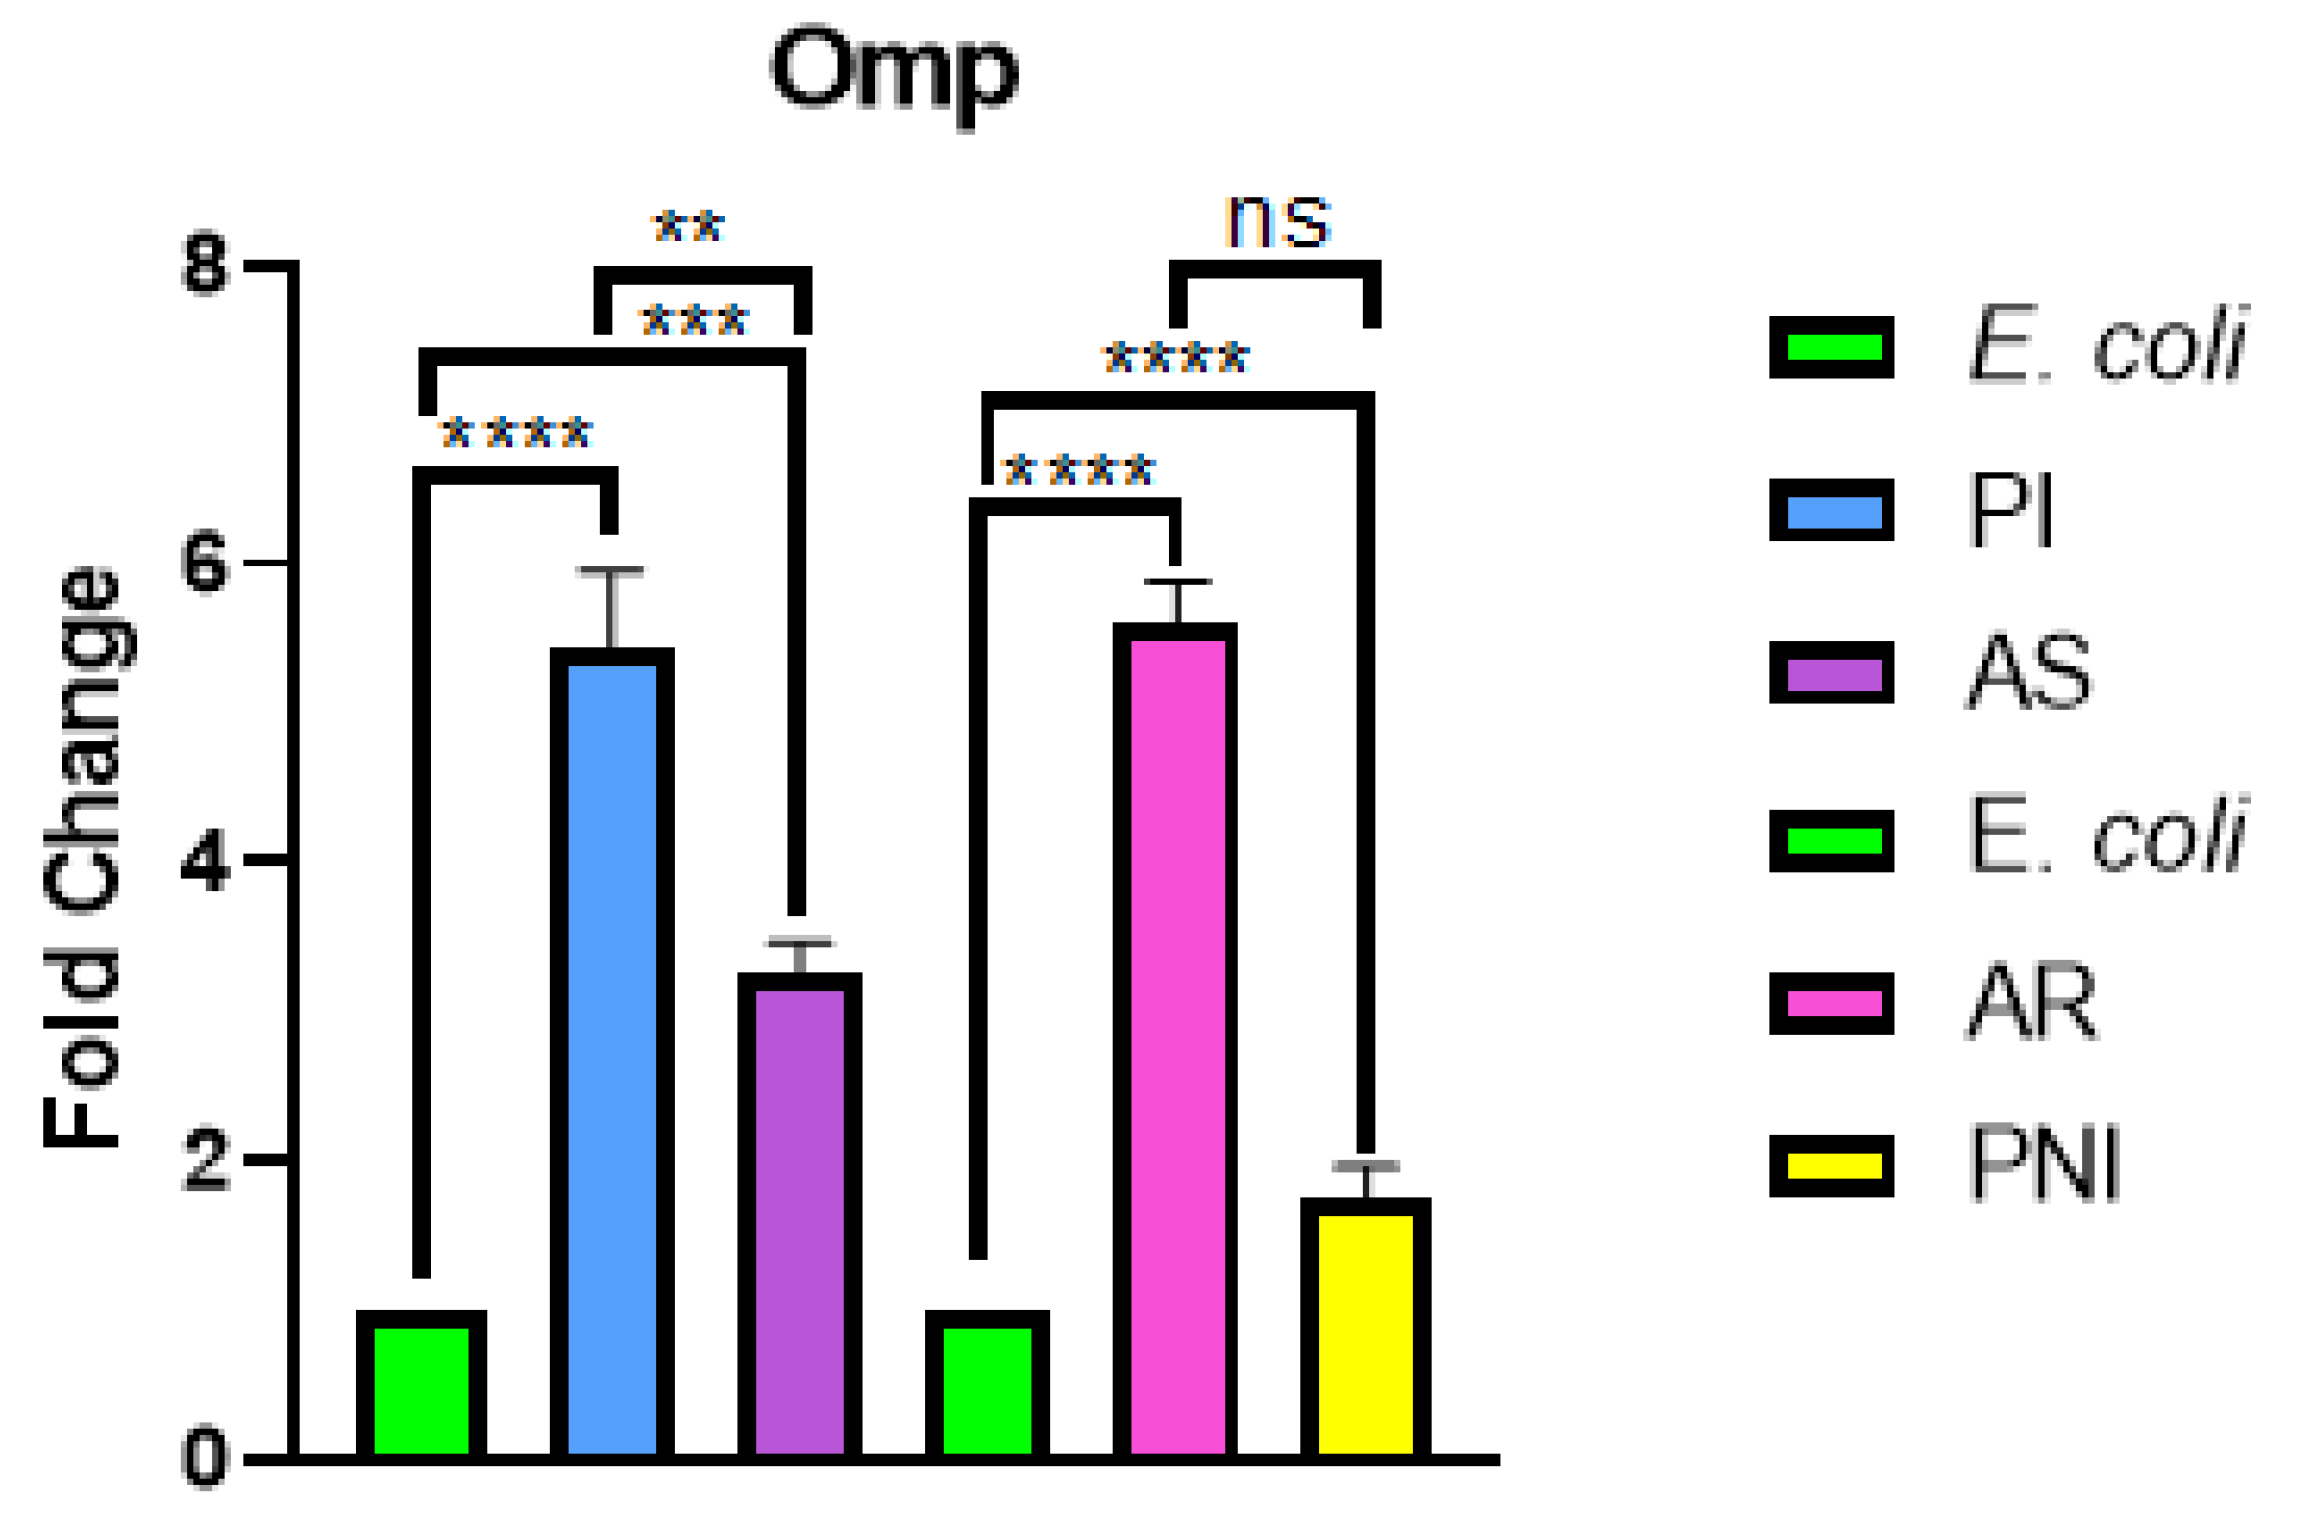
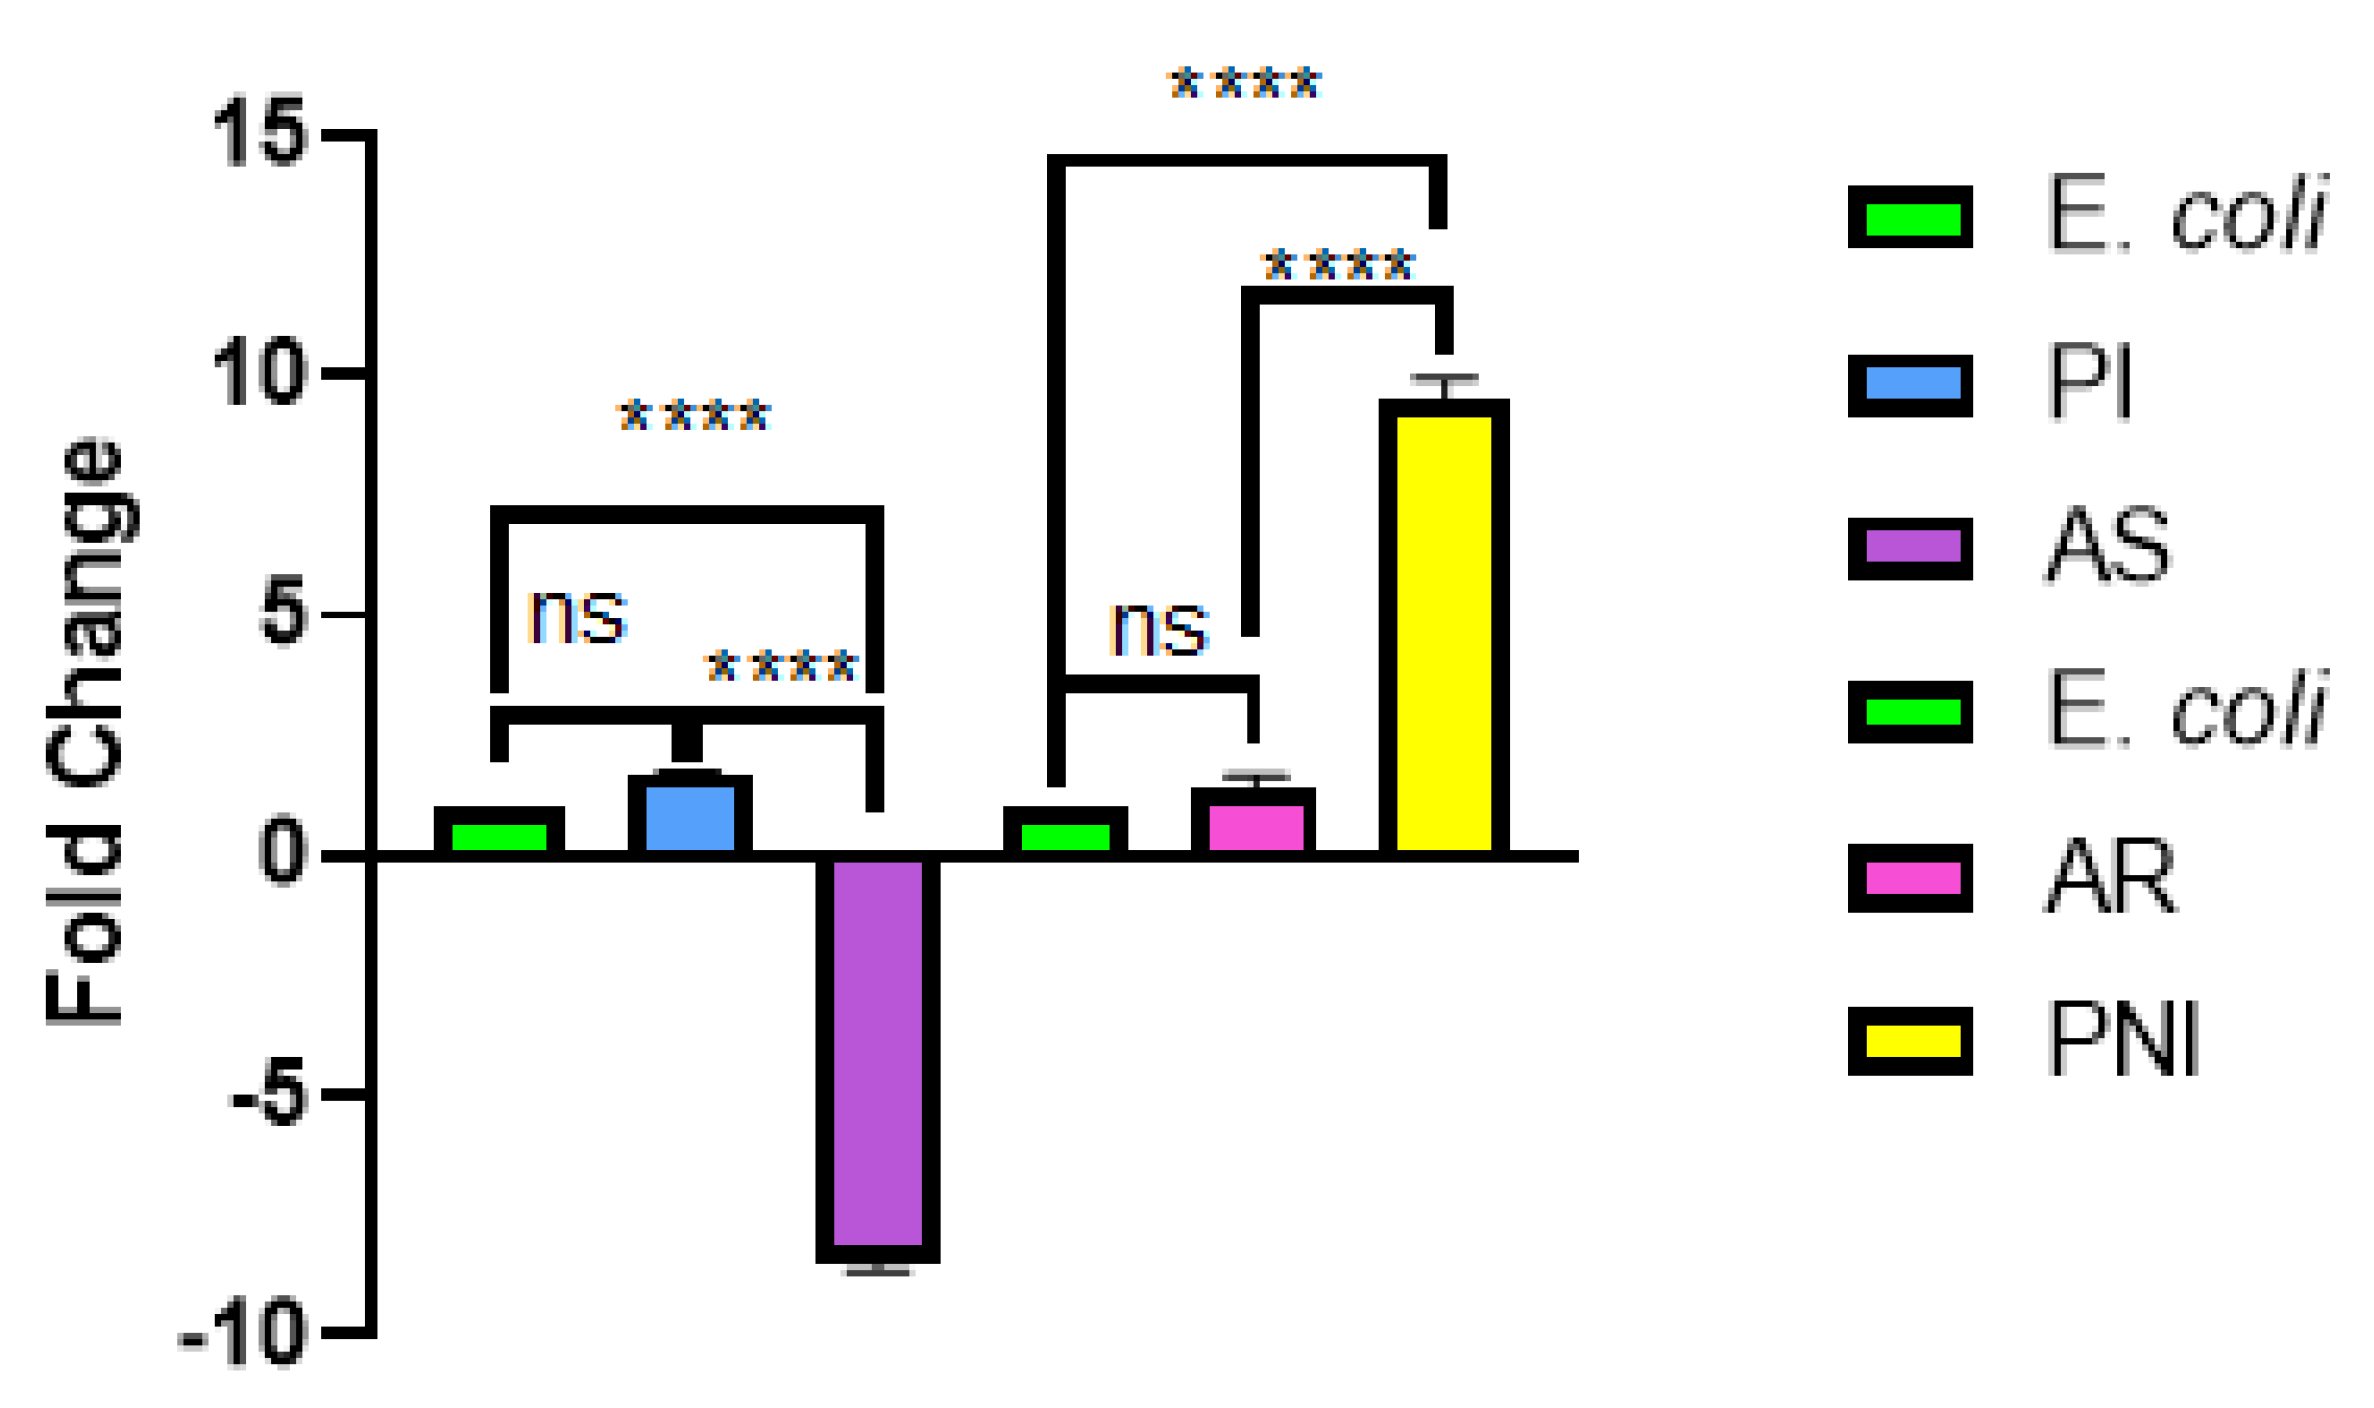
The results obtained from the first experiment indicate that the treatment with probiotic inhibition (PI) caused a highly significant increase in the expression of omp genes by 5.44-folds more than the control E. coli (p < 0.0001). Moreover, the expression of the omp genes in the antibiotic-sensitive strain (AS) was significantly increased (by 3.25 folds more compared to the control) (p < 0.001). Also, the gene expression of omp in the PI group is significantly higher than in the AS group (p < 0.01).
In the second experiment, the expression of omp genes was significantly increased (by 5.60 folds more compared to the control) in the antibiotic resistant group (AR) (p < 0.0001). However, the gene expression in the non-inhibitory probiotic group (PNI) was lower (by 1.75 folds more compared to the control) (p > 0.05, ns). Comparison between these two groups shows that the gene expression of omp in the AR group was significantly higher compared to the PR group (p < 0.001)
Figure 12.
Relative mRNA expression of the omp gene in Escherichia coli under various experiment conditions. Values were normalized to the 16S rRNA reference gene and presented as fold change expression relative to the untreated E. coli control group, set to 1.00. Statistical significance was tested by one-way ANOVA and Šídák’s multiple comparisons test (α = 0.05). Abbreviations: Control: Untreated E. coli (P2 & P7 control); PI: Probiotic Inhibition treatment; AS: Antibiotic-Sensitive E. coli; AR: Antibiotic-Resistant E. coli; PNI: Probiotic Non-Inhibition treatment (* p < 0.05, p < 0.01, *** p < 0.001, **** p < 0.0001, ns = not significant).
Figure 12.
Relative mRNA expression of the omp gene in Escherichia coli under various experiment conditions. Values were normalized to the 16S rRNA reference gene and presented as fold change expression relative to the untreated E. coli control group, set to 1.00. Statistical significance was tested by one-way ANOVA and Šídák’s multiple comparisons test (α = 0.05). Abbreviations: Control: Untreated E. coli (P2 & P7 control); PI: Probiotic Inhibition treatment; AS: Antibiotic-Sensitive E. coli; AR: Antibiotic-Resistant E. coli; PNI: Probiotic Non-Inhibition treatment (* p < 0.05, p < 0.01, *** p < 0.001, **** p < 0.0001, ns = not significant).
9.2 Molecular Chaperone (dnaK) Gene Expression Profile
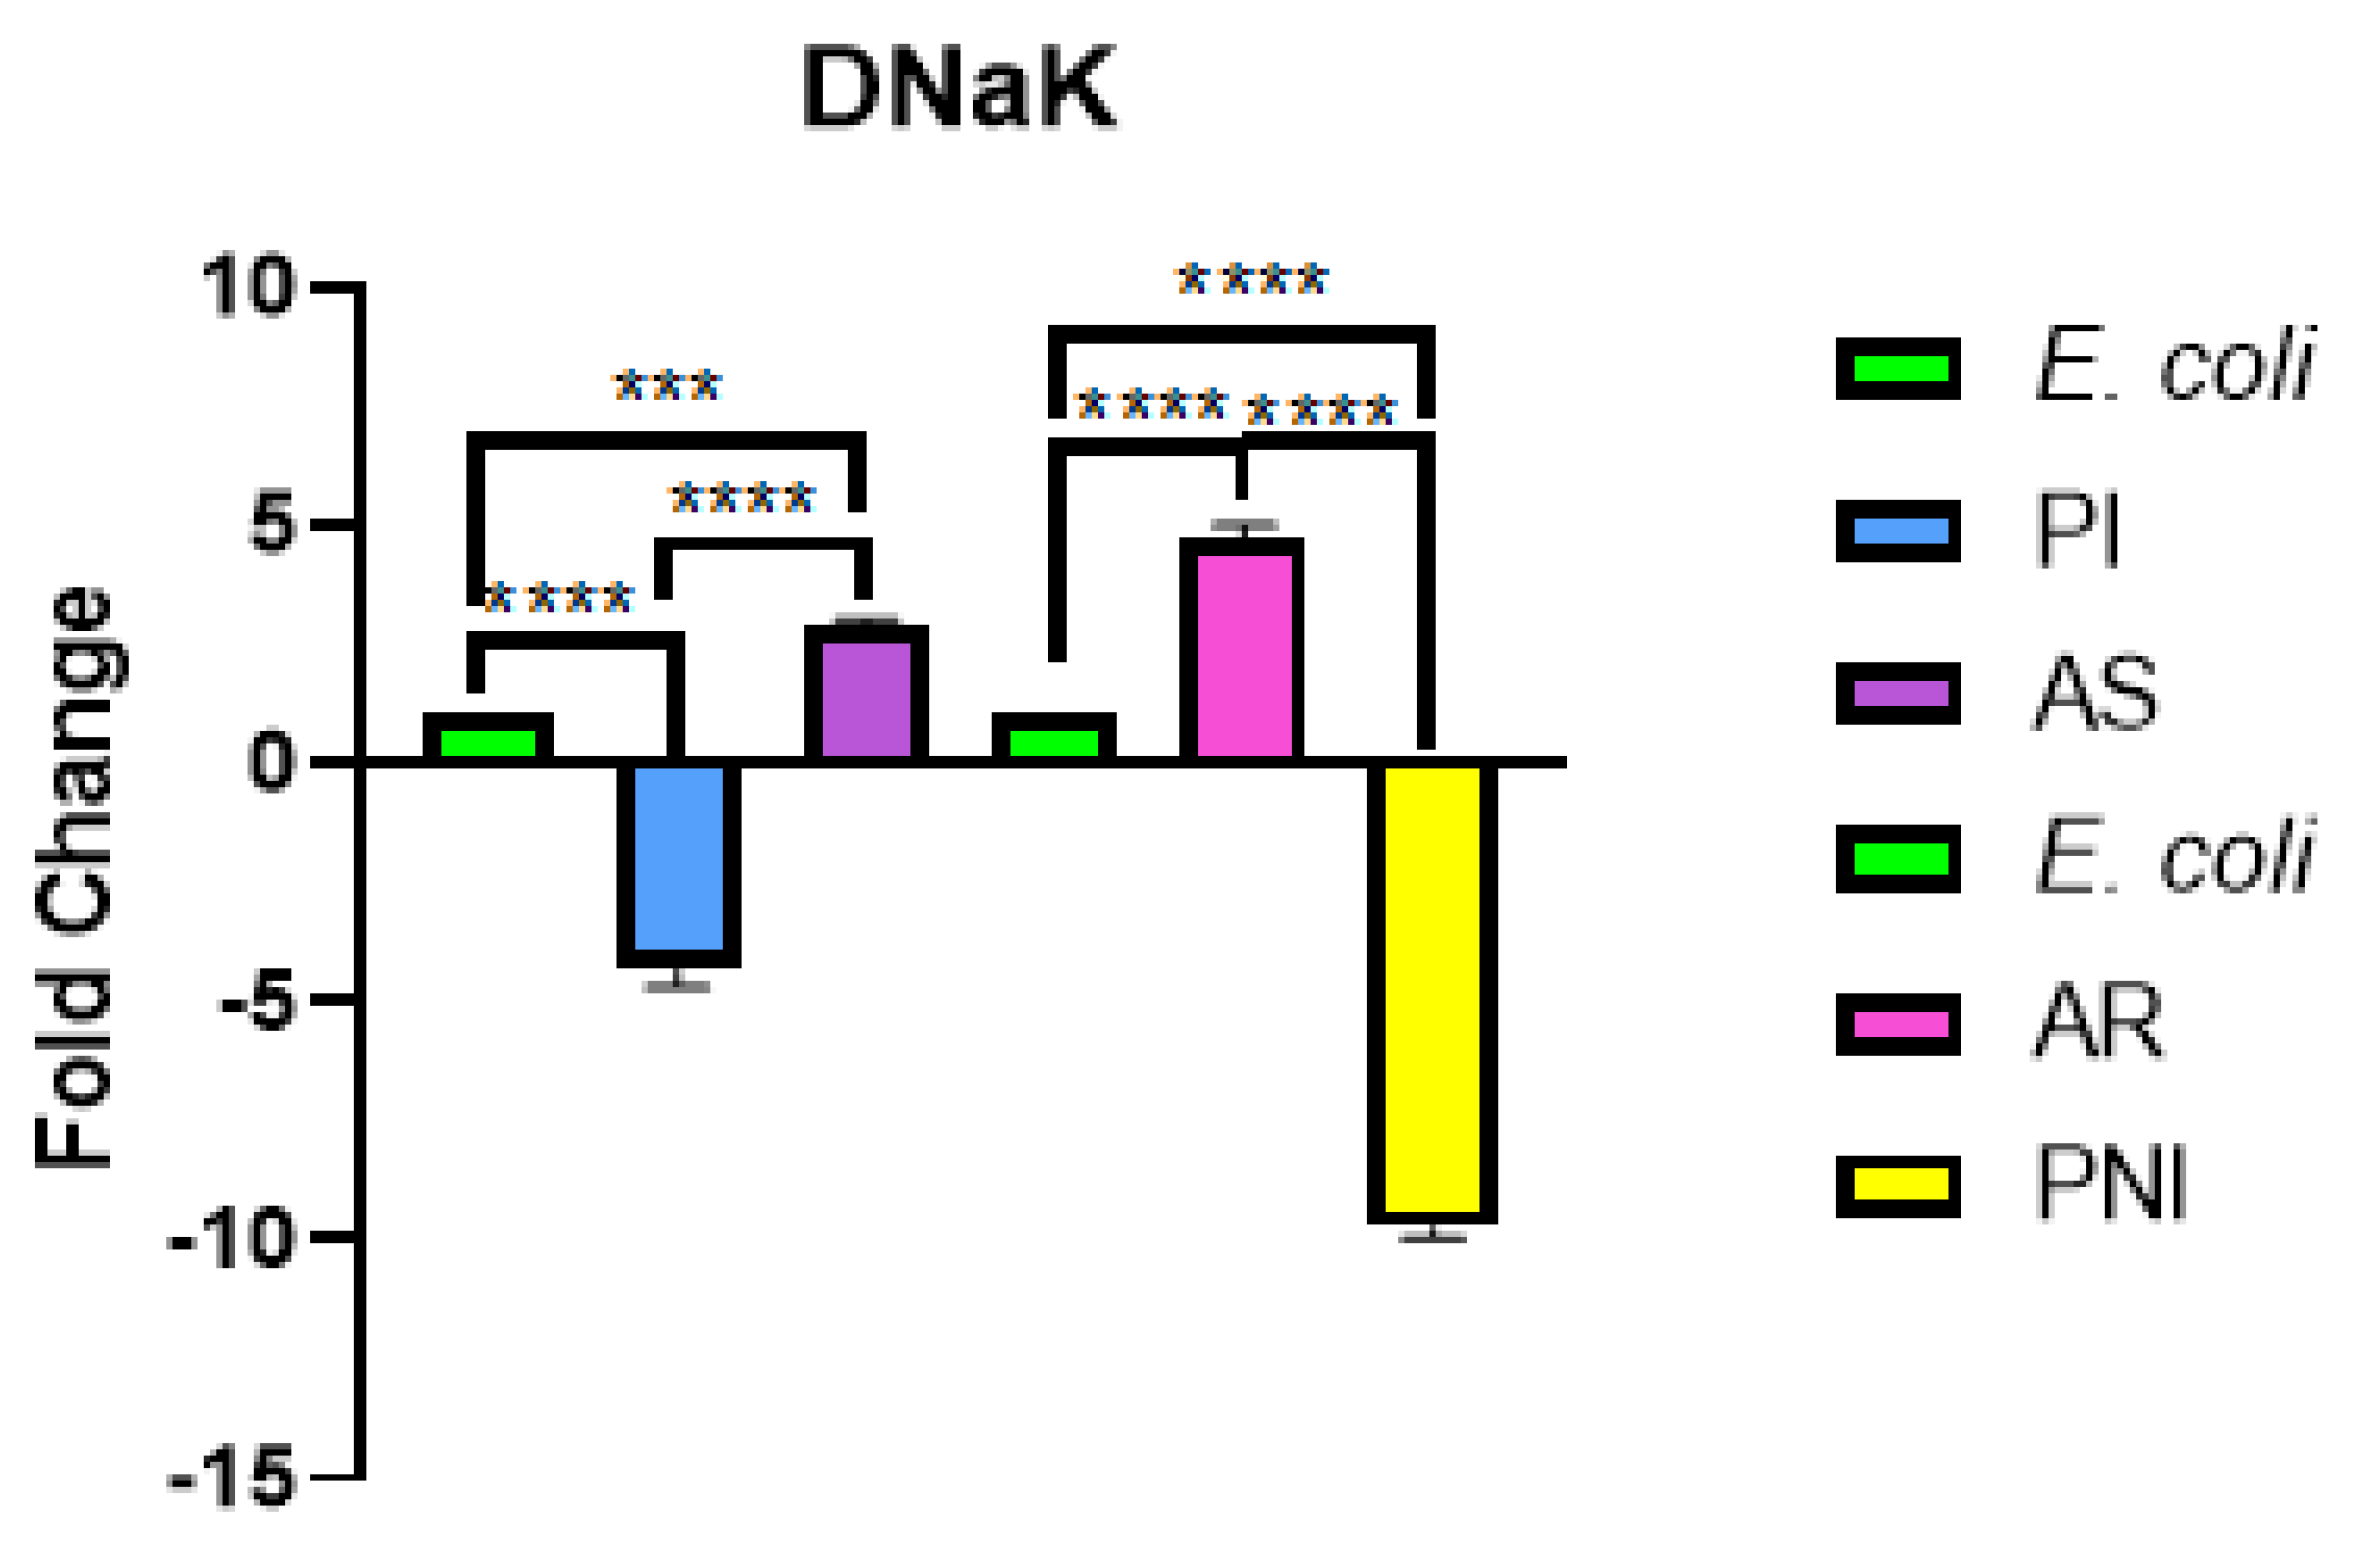
The relative fold-change in the level of mRNAs encoding heat-shock protein and chaperones under stress was evaluated for the chaperone protein dnaK using qRT-PCR, which was normalized for 16S rRNA as internal control (Figure 13).
Exposure of the bacteria to probiotic inhibitory compound in the first series of experiments led to a considerable down-regulation of the dnaK gene expression (4.350 fold change; 4.350-fold reduction relative to the untreated control 1.000 vs 0.230, mean difference = 5.350, 95% CI: 4.551 – 6.149, t = 25.74, p < 0.0001). At the same time, in the case of an antibiotic-sensitive strain (E. coli AS), there was a significant up-regulation of the dnaK mRNA (2.922 fold change; 2.922-fold increase relative to untreated control 1.000 vs 2.922, mean difference = -1.922,95% CI: -2.721 – -1.123, t = 9.246, p < 0.001).
In the second experiment, the expression of dnaK gene was increased by 4.700 folds in the antibiotic-resistant strain (E. coli AR) compared to its basal control (1.000 vs. 4.700; mean difference = -3.700, 95% CI: -4.499 to -2.901, t = 17.80, p < 0.0001). In contrast, the treatment of E. coli cells with the non-inhibitory probiotics (PNI) resulted in a highly significant down-regulation of dnaK mRNA expression (9.750 fold change; 9.750 fold decrease relative to the control 1.000 vs. 0.103; mean difference = 10.75, 95% CI: 9.951 to 11.55, t = 51.71, p <0.0001). In addition, the difference in expression profile between the antibiotic-resistant strain (AR) and the non-inhibitory probiotics (PNI) showed a statistically very significant difference (mean difference = 14.45, 95% CI: 13.65-15.25, t = 69.51, p < 0.0001).
Figure 13.
Relative fold change in the expression of dnaK mRNA in Escherichia coli during stress exposure. Values are shown as normalized fold changes compared with 16S rRNA, with untreated E. coli set as 1.000 (P2 and P7). The values have been analyzed using one-way ANOVA and Šídák’s multiple comparison tests (significance level of 0.05). Abbreviations: Untreated E. coli: Control (P2 and P7); PI: Probiotic Inhibition; AS: Antibiotic-Sensitive; AR: Antibiotic-Resistant; PNI: Probiotic Non-Inhibition.
Figure 13.
Relative fold change in the expression of dnaK mRNA in Escherichia coli during stress exposure. Values are shown as normalized fold changes compared with 16S rRNA, with untreated E. coli set as 1.000 (P2 and P7). The values have been analyzed using one-way ANOVA and Šídák’s multiple comparison tests (significance level of 0.05). Abbreviations: Untreated E. coli: Control (P2 and P7); PI: Probiotic Inhibition; AS: Antibiotic-Sensitive; AR: Antibiotic-Resistant; PNI: Probiotic Non-Inhibition.
9.3 General Chaperone (chap) Gene Expression Profile
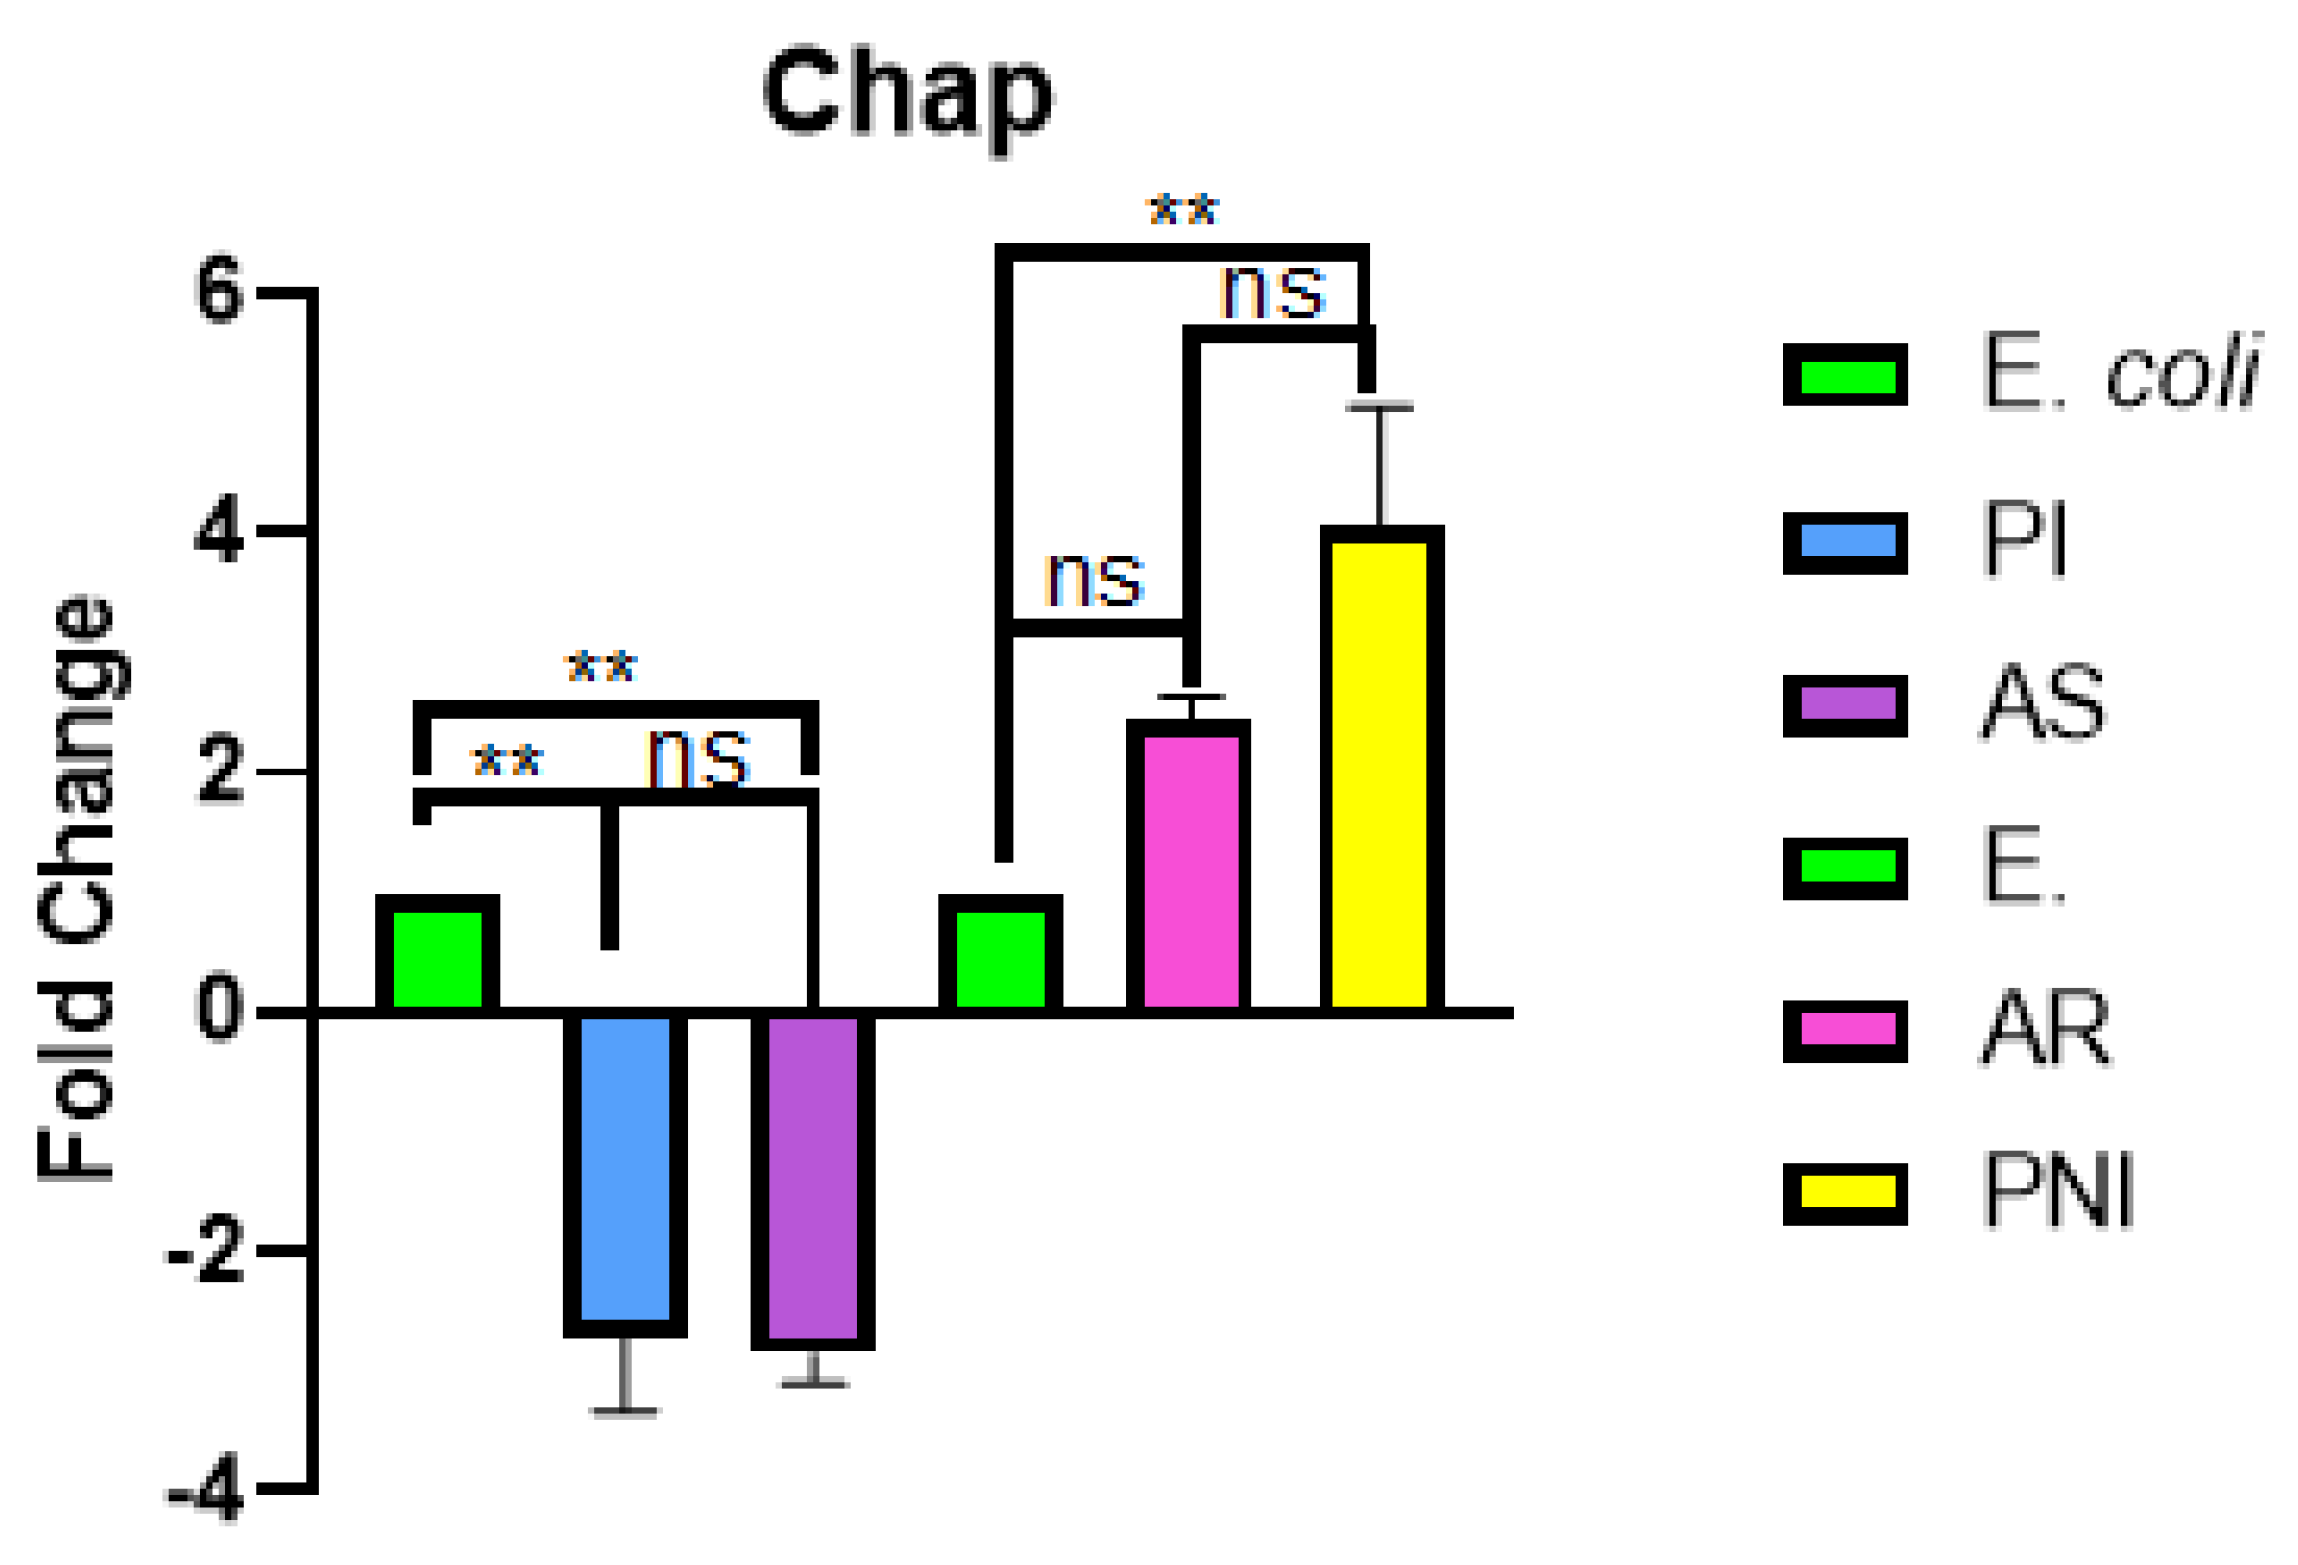
Fold changes of chap expression level of the gene coding for molecular chaperones under various treatments were determined using qRT-PCR experiments with 16S rRNA as the internal control (Figure 14).
According to the first experiment, both probiotic inhibition (E. coli PI) and antibiotic sensitivity (E. coli AS) resulted in significantly lower expression level of chap when compared to the control group (1.000). Expression level of chap under probiotic inhibition condition (PI) was reduced by 2.693 folds (1.000 vs. 0.371; mean difference = 3.693, 95% CI: 1.766-5.621, t = 7.366, p = 0.0019). Also, the expression level of chap under antibiotic sensitivity condition (AS) was significantly reduced by 2.842 folds (1.000 vs. 0.352; mean difference = 3.842, 95% CI: 1.914-5.769, t = 7.662, p = 0.0015).
For the second experiment, both antibiotic resistance (E. coli AR) and non-inhibition of probiotics (E. coli PR) were found to be linked to increased chap expression in comparison with the controls (1.000). For the group AR, there was an increase in the fold change of 2.451, although it did not differ significantly from the control value (1.000 vs. 2.451; mean difference = -1.451, 95% CI = -3.378 to 0.4770, t = 2.893, p = 0.1544, ns). Conversely, in the case of group PNI, there was an increase in the fold change which showed a significant difference of 4.044 (1.000 vs. 4.044; mean difference = -3.044, 95% CI: -4.972 to -1.116, t = 6.072, p = 0.0054).
Figure 14.
Relative fold change of chap mRNA expression in Escherichia coli in various experimental treatments. The data shown are normalized fold changes in relation to 16S rRNA compared with untreated controls (P2 and P7, value 1.000). Analysis of the data is done by using One-Way ANOVA with Šídák’s multiple comparison test (α=0.05). Acronyms: Untreated E. coli: Control samples (P2 and P7); PI: Probiotic Inhibition; AS: Antibiotic Sensitive; AR: Antibiotic Resistant; PNI: Probiotic Non-inhibition (* p<0.05, p<0.01, ns=non-significant).
Figure 14.
Relative fold change of chap mRNA expression in Escherichia coli in various experimental treatments. The data shown are normalized fold changes in relation to 16S rRNA compared with untreated controls (P2 and P7, value 1.000). Analysis of the data is done by using One-Way ANOVA with Šídák’s multiple comparison test (α=0.05). Acronyms: Untreated E. coli: Control samples (P2 and P7); PI: Probiotic Inhibition; AS: Antibiotic Sensitive; AR: Antibiotic Resistant; PNI: Probiotic Non-inhibition (* p<0.05, p<0.01, ns=non-significant).
9.4 Small Heat-Shock Protein (shsp) Gene Expression Profile.
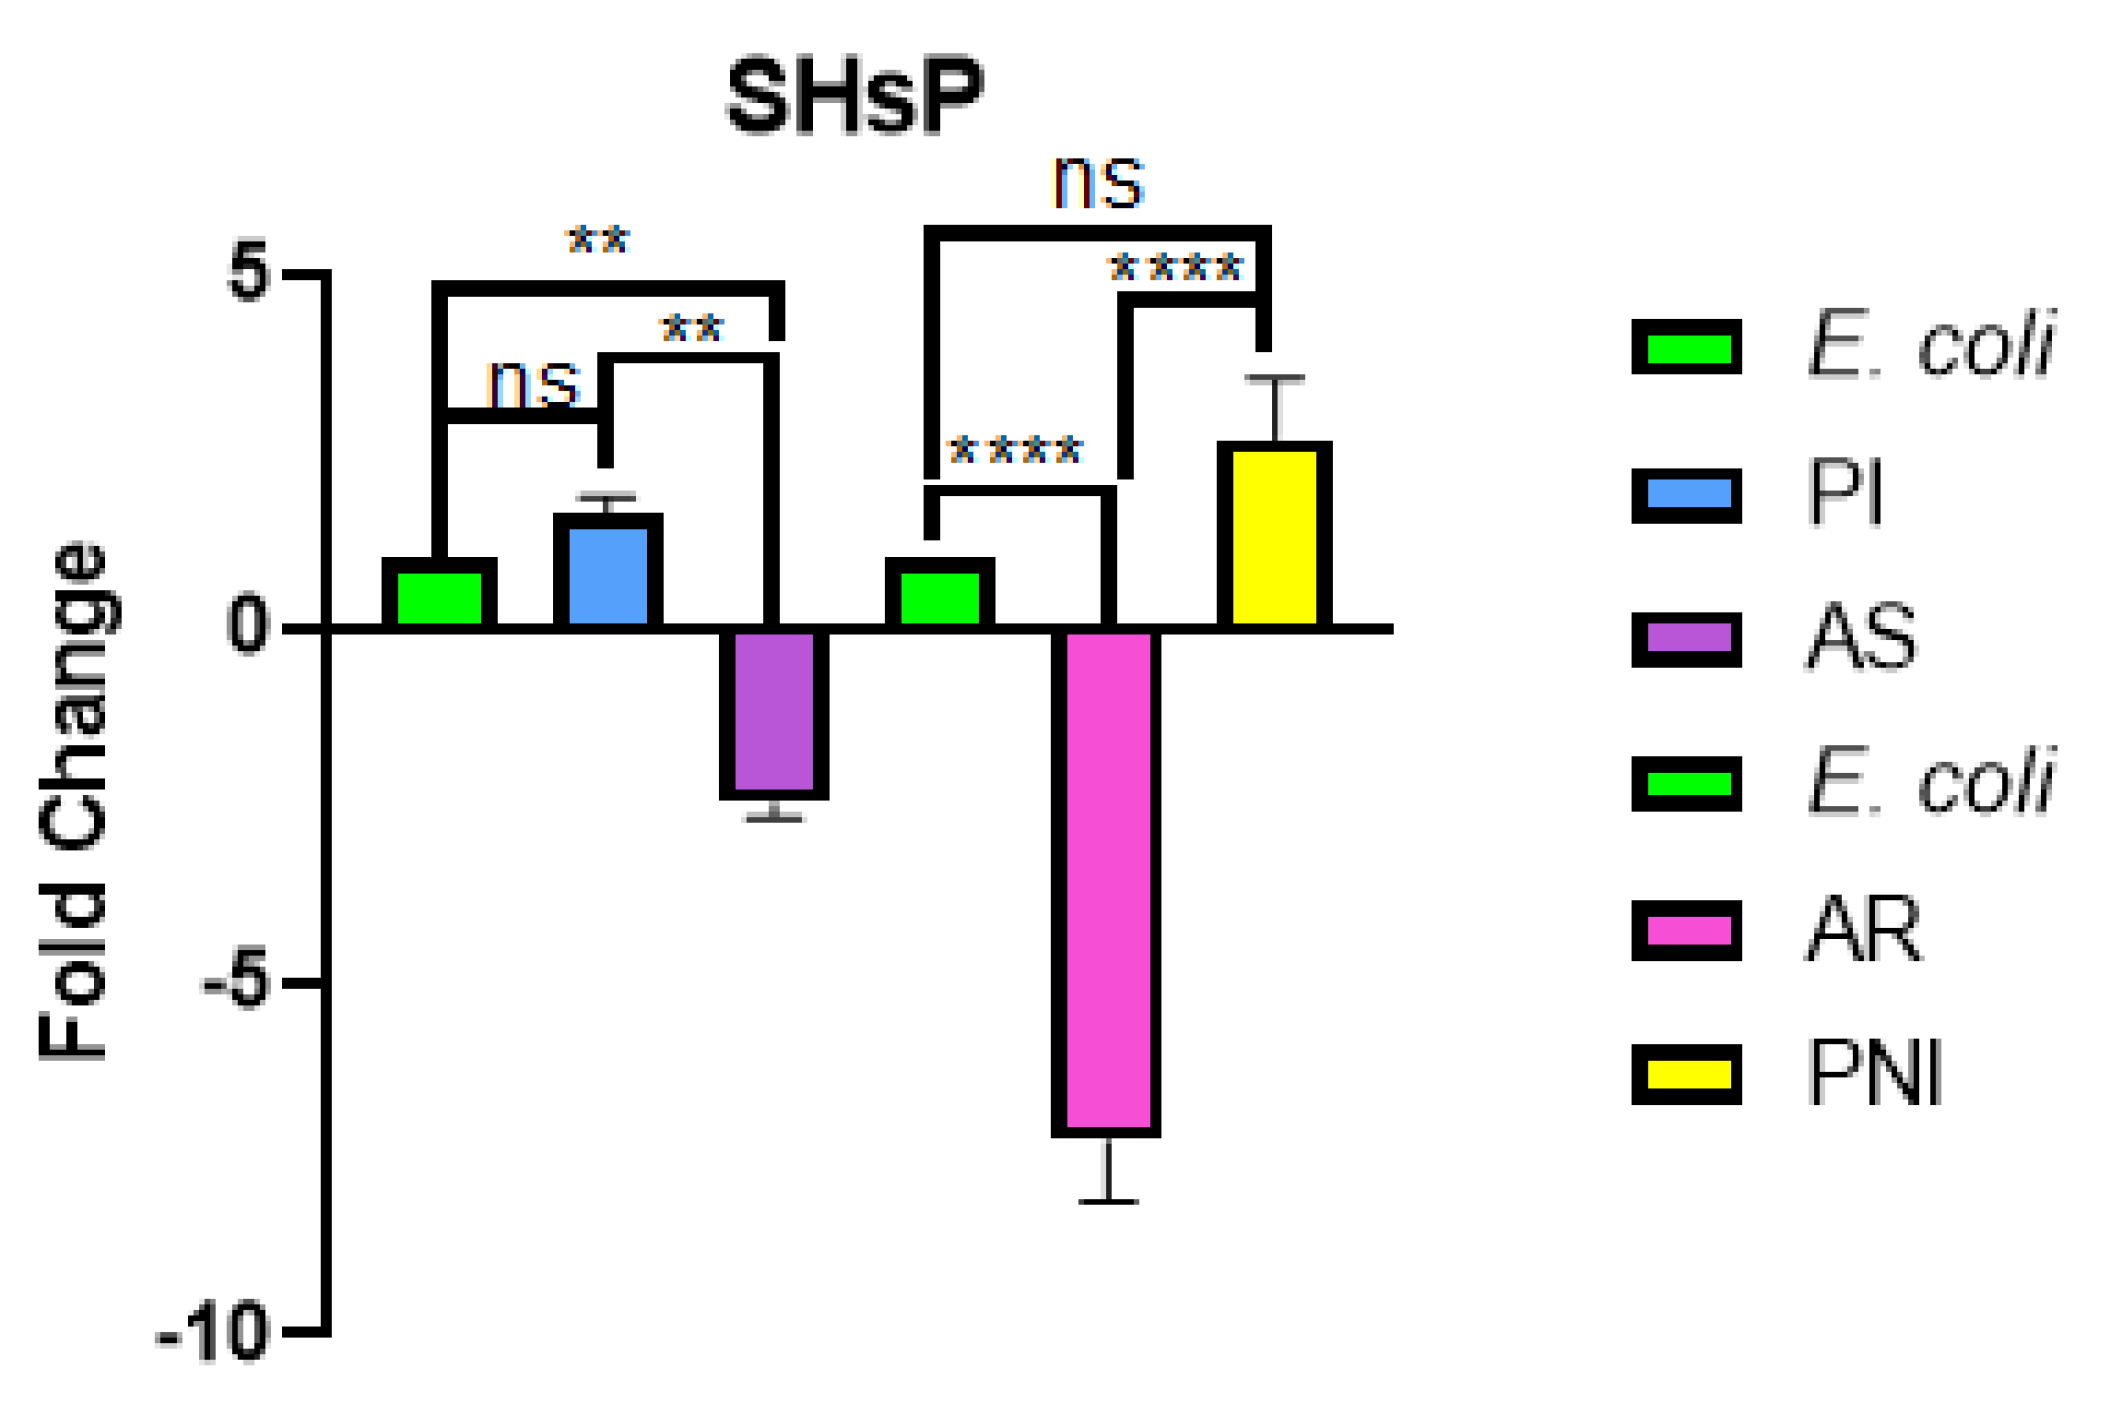
Relative gene expression levels of shsp mRNA were determined using qRT-PCR method with the use of 16S rRNA as the normalization factor (Figure 15).
In the first approach to the experiment, treatment with probiotic-inhibited bacteria (E. coli PI) resulted in a non-significant increase in shsp gene expression compared to control (1.000 vs. 1.600; mean difference = -0.5998, 95% CI: -2.584 to 1.385, t = 1.162, p = 0.8712, ns). On the other hand, antibiotic-sensitive bacteria (E. coli AS) had a significant decrease in shsp gene expression compared to the control, and its expression level was 2.484-fold lower than the control one (1.000 vs. 0.403; mean difference = 3.484, 95% CI: 1.499 to 5.469,t = 6.750, p = 0.0031).
In the second experiment, the antibiotic resistance strain (E. coli AR) showed high down-regulation of the shsp mRNA expression with a decrease of 7.250 folds compared to the control (1.000 vs 0.138; mean difference = 8.250, 95% CI: 6.266 to 10.23, t = 15.98, p < 0.0001). In contrast, the non-inhibiting probiotic strain (E. coli PNI) displayed 2.676 fold increase in expression compared to control but was not statistically significant (1.000 vs 2.676; mean difference = -1.676, 95% CI: -3.660 to 0.3089, t = 3.246, p = 0.1008, ns)
Figure 15.
Relative fold change of shsp mRNA expression in Escherichia coli under stress conditions. Data represent relative expression normalized against 16S rRNA compared to untreated controls (P2 and P7, set at 1.000). Statistical analysis was performed using a one-way ANOVA followed by Šídák’s multiple comparisons test (alpha = 0.05). Abbreviations: Untreated E. coli: Control baseline (P2 and P7); PI: Probiotic Inhibition; AS: Antibiotic-Sensitive; AR: Antibiotic-Resistant; PNI: Probiotic Non-Inhibition ( p < 0.01, **** p < 0.0001, ns = non-significant).
Figure 15.
Relative fold change of shsp mRNA expression in Escherichia coli under stress conditions. Data represent relative expression normalized against 16S rRNA compared to untreated controls (P2 and P7, set at 1.000). Statistical analysis was performed using a one-way ANOVA followed by Šídák’s multiple comparisons test (alpha = 0.05). Abbreviations: Untreated E. coli: Control baseline (P2 and P7); PI: Probiotic Inhibition; AS: Antibiotic-Sensitive; AR: Antibiotic-Resistant; PNI: Probiotic Non-Inhibition ( p < 0.01, **** p < 0.0001, ns = non-significant).
9.5 Tetracycline Resistance (tet) Gene Expression Profile.
Transcription of the tetracycline resistance determinants was measured by qRT-PCR with the 16S rRNA endogenous control used for normalization (Figure 16).
In the first experiment, use of the probiotic inhibition (E. coli PI) treatment caused insignificant increase in the transcription of tet genes compared to control (1.000 vs. 1.730; mean difference = -0.7300, 95% CI: -1.605 to 0.1450, t = 3.207, p = 0.1056, ns). In contrast, antibiotic sensitive E. coli (AS) revealed high inhibition of tet genes transcription, and the level was 8.500 times lower than in the control (1.000 vs. 0.118; mean difference = 0.8820, 95% CI: 0.007 to 1.757, t = 32.95, p < 0.0001). Difference in the tet genes transcription between two experimental groups is statistically significant (mean difference = -6.770, 95% CI: -7.645 to -5.895, t = 29.75, p < 0.0001
In the second set of experiment, up-regulation of tet gene expression was seen in antibiotic resistant strain (E. coli AR), though statistically insignificant (control value of 1.000 versus test value of 1.450; mean difference = -0.4500, 95% CI: -1.325 to 0.4250, t = 1.977, p = 0.4520, ns). Conversely, application of the non-inhibiting probiotic strain (E. coli PNI) resulted in highly significant up-regulation of tet gene expression, showing an increase of 9.450-fold compared to the control baseline (1.000 versus 9.450; mean difference = -8.450, 95% CI: -9.325 to -7.575, t = 37.13, p < 0.0001)
Figure 16.
Fold change relative expression of tet gene in Escherichia coli strains under experimental conditions. The data show the relative expression changes normalized against 16S rRNA in comparison to untreated controls (P7 and P2 = 1.000). Statistical analysis was performed by using one-way ANOVA with Šídák’s post-hoc test (α=0.05). Abbreviations: Untreated E. coli strains: Control strains (P7 and P2); PI: Probiotic Inhibition; AS: Antibiotic Sensitive; AR: Antibiotic Resistant; PNI: Probiotic Non-Inhibition.
Figure 16.
Fold change relative expression of tet gene in Escherichia coli strains under experimental conditions. The data show the relative expression changes normalized against 16S rRNA in comparison to untreated controls (P7 and P2 = 1.000). Statistical analysis was performed by using one-way ANOVA with Šídák’s post-hoc test (α=0.05). Abbreviations: Untreated E. coli strains: Control strains (P7 and P2); PI: Probiotic Inhibition; AS: Antibiotic Sensitive; AR: Antibiotic Resistant; PNI: Probiotic Non-Inhibition.
Discussion
Urinary tract infections continue to be amongst the most common bacterial infections around the world, with management of UTIs now being severely threatened by a rise in the number of multidrug-resistant and extensively drug-resistant isolates. In this study, an assessment of the therapeutic efficacy of lactic acid bacteria (namely Lactobacillus acidophilus and Lactic Acid Bacillus) was conducted through the combination of clinical epidemiology, phenotypic resistance profiling, in vitro antagonism, SDS-PAGE-based proteomics, and gene expression analysis using qRT-PCR technique.
The results obtained from the clinical epidemiology portion of this study coincide with the known trends in the demography of UTIs globally; however, acute weaknesses in the local demographic were revealed, which are associated with rural communities. Females comprised eighty percent (n=40) of the total population in this study; the highest prevalence rate for UTIs was seen in females of reproductive age living in a rural area (88%, n=44). The largest class in terms of occupation included homemakers (64%, n=32), followed by workers (n=8), industrial workers (n=5), students (n=4), and drivers (n=1).It is crucial to emphasize that the clinical treatment of this group of patients was predominantly based on empirical monotherapy using fluoroquinolones, where Norfloxacin constituted 70% (n=35) of all medications prescribed. This continuous selective pressure is directly associated with the recurrence rate of infections, which is 24% (n=12) and secondary complications, like renal stones (n=5).
Biochemical identification via the IMViC test and enzymes confirmed the clinical isolates of Escherichia coli, Klebsiella pneumoniae, and Staphylococcus aureus as the major causative organisms. Susceptibility phenotypes and determination of the minimum inhibitory concentrations identified the important threshold levels of resistance by these organisms. All clinical Gram-negative organisms showed extended-spectrum resistance and resistance to carbapenem Enterobacteriaceae, showing maximal resistance threshold (128 μg/mL) to ampicillin, imipenem, and ciprofloxacin with increased resistance threshold to colistin (16--64 μg/mL). At the same time, the clinical isolate of Staphylococcus aureus showed a multidrug-resistant profile, with high-level resistance threshold (128 μg/mL) to macrolides, tetracycline, and aminoglycosides with increased resistance to cefoxitin (64 μg/mL) confirming the methicillin-resistant Staphylococcus aureus.
To combat these resistant strains, we isolated and screened acid-tolerant, catalase-negative, gram-positive rod probiotics for their antibacterial and antibiofilm activities. From agar well diffusion assays on bacterial strains, both probiotic strains showed clear zones of growth inhibition against the clinical isolates of Escherichia coli, Klebsiella pneumoniae, and Staphylococcus aureus. It is important to note that Lactic Acid Bacillus showed antibacterial activity against Escherichia coli ATCC 25922 reference that is equal to the broad spectrum tetracycline, signifying high strain-dependent production of metabolites. Quantitative crystal violet biofilm assays (OD570) of Lactobacillus acidophilus in single strains showed higher antibiofilm efficacy compared to multi-strain consortium and generic lactic acid bacteria isolates against all test pathogens. Specifically, single strain Lactobacillus acidophilus inhibited uropathogenic Escherichia coli biofilm formation by 66.67%, Klebsiella pneumoniae biofilm formation by 78.00%, and Staphylococcus aureus biofilm formation by 69.09%, demonstrating superior performance over both multi-strain consortia and isolates. This significant performance advantage suggests that competitive exclusion, organic acid production and biosurfactants synthesis by particular single strains are more efficient in disrupting the resistant biofilms than the mixture of strains due to microbial competition between species in consortia.
In order to elucidate the molecular mechanism behind probiotic inhibition, an integrated mechanism was observed which involved envelope damage, protein landscape alteration, and chaperone inhibition. Through Bradford quantitative analysis and SDS-PAGE with silver staining, distinct proteomic changes were evident in which probiotic inhibition resulted in a specific decrease in protein band density (~60-100 kDa) of high molecular weight than those seen in the control samples and non-inhibitory sample conditions. Quantitative real time PCR analysis standardized with 16S rRNA analysis indicated that there was a significant up-regulation of outer membrane protein gene (Omp) expression to a 5.44-fold change due to probiotic inhibition against the control and a significantly higher level of cell envelope stress than that seen in antibiotic sensitive samples (3.25-fold). Also, probiotic inhibition through inhibitory probiotic strains resulted in a decrease in the transcription of molecular chaperones (Chap, -2.693-fold) similar to the effect seen in antibiotic sensitive strains (-2.842-fold) to prevent protein refolding. Finally, there was no up-regulation of tetracycline resistance (TET, 9.450-fold) in inhibitory probiotic samples.Combined, these results demonstrate that certain Lactobacillus strains reduce uropathogenic virulence by employing both cell envelope stress induction and suppression of internal protein folding machinery.
Conclusions
The current research presents a comprehensive study demonstrating the effectiveness of probiotics as potential bio-therapeutics against MDR/XDR uropathogens. From a clinical standpoint, high usage rates of empiric monotherapy with fluoroquinolones among rural women contribute to serious resistance problems and frequent reinfections; therefore, the urgent need for novel, non-antibiotic treatments is evident. In terms of phenotype, isolated Lactobacillus acidophilus and Lactic Acid Bacillus species were superior in demonstrating a powerful antimicrobial and antibiofilm dominance, defeating recalcitrant biofilms generated by uropathogenic Escherichia coli, Klebsiella pneumoniae, and Staphylococcus aureus more effectively than any other multi-strain mixtures of lactic acid bacteria. On the mechanistic level, proteomics and transcriptomics showed that the inhibitory effect of Lactobacillus isolates works through the two-way pathway of the induction of the cell envelope stress due to up-regulation of the outer membrane protein genes along with inhibition of the internal protein repair system through the suppression of molecular chaperones.
Author contributions
Baby Kataria: Contributed to the overall design of the research, conducted the experiments, analyzed the data, evaluated statistics, and prepared the manuscript draft. Sheetal Kundu: Participated in conducting the experiments, performed the data analysis, curated the data, and helped prepare the manuscript. Rohit Kumar: Contributed to the computational aspects of the work and performed data validation and helped prepare the manuscript. Ruby Dhiman: Participated in the administration of the project, provided the laboratory facilities, and validated experimental results. Anjali Priyadarshini: Conceived and coordinated the project, provided financial support, academically oversaw the project, and critically reviewed the manuscript. All authors read and approved the final manuscript.
Ethics Approval and Consent to Participate
This research was performed in compliance with the Declaration of Helsinki. Ethical clearance for the isolation of bacterial strains in addition to the collection of demographic information in regard to patients’ urine samples was taken from the Institutional Ethics Committee (IEC) of PRIMSR, SRM University Delhi-NCR. Informed written consent was obtained from all subjects before sampling.
Availability of Data
Data sets that have been used and/or analyzed in the present study are available from the corresponding author on reasonable request.
Conflict of Interest
Authors have declared no conflict of interest.
References
- Ahmed, S. K.; Hussein, S.; Qurbani, K.; Ibrahim, R. H.; Fareeq, A.; Mahmood, K. A.; Mohamed, M. G. Antimicrobial resistance: Impacts, challenges, and future prospects. J. Med. Surg. Public Health 2024, 2. [Google Scholar] [CrossRef]
- Balakrishnan, R.; Kang, S. Il; Lee, J. Y.; Rho, Y. K.; Kim, B. K.; Choi, D. K. Gut Microbiota-Immune System Interactions in Health and Neurodegenerative Diseases: Insights into Molecular Mechanisms and Therapeutic Applications. Aging Dis. 2025, 16(6). [Google Scholar] [CrossRef] [PubMed]
- Cao, Y.; Gao, F.; Chen, W. Comparison of different urine culture methods in urinary tract infection. Transl. Androl. Urol. 2022, 11(2). [Google Scholar] [CrossRef] [PubMed]
- Dadgostar, P. Antimicrobial resistance: implications and costs. In Infection and Drug Resistance; 2019; Vol. 12. [Google Scholar] [CrossRef] [PubMed]
- Diriba, A.; Gizaw, S.; Alemu, F.; Tesfaye, K.; Tesfaye, E.; Chali, M.; Jobir, G. Prevalence, antimicrobial sensitivity patterns and associated factors of urinary tract infection among patients attending Nekemte Comprehensive Specialized Hospital, Western Ethiopia, 2024: a cross-sectional study. BMC Infect. Dis. 2025, 25(1). [Google Scholar] [CrossRef] [PubMed]
- Ferrara, F.; Castagna, T.; Pantolini, B.; Campanardi, M. C.; Roperti, M.; Grotto, A.; Fattori, M.; Dal Maso, L.; Carrara, F.; Zambarbieri, G.; Zovi, A.; Capuozzo, M.; Langella, R. The challenge of antimicrobial resistance (AMR): current status and future prospects. Naunyn-Schmiedeberg’s Arch. Pharmacol. 2024, Vol. 397, Number 12. [Google Scholar] [CrossRef] [PubMed]
- Fijan, S. Probiotics and Their Antimicrobial Effect. In Microorganisms; 2023; Vol. 11. [Google Scholar] [CrossRef] [PubMed]
- Huligere, S. S.; Chandana Kumari, V. B.; Alqadi, T.; Kumar, S.; Cull, C. A.; Amachawadi, R. G.; Ramu, R. Isolation and characterization of lactic acid bacteria with potential probiotic activity and further investigation of their activity by α-amylase and α-glucosidase inhibitions of fermented batters. Front. Microbiol. 2023, 13. [Google Scholar] [CrossRef] [PubMed]
- Johnstone, K. F.; Herzberg, M. C. Antimicrobial peptides: Defending the mucosal epithelial barrier. In Frontiers in Oral Health; 2022; Vol. 3. [Google Scholar] [CrossRef] [PubMed]
- Kowalska-Krochmal, B.; Dudek-Wicher, R. The minimum inhibitory concentration of antibiotics: Methods, interpretation, clinical relevance. In Pathogens; 2021; Vol. 10. [Google Scholar] [CrossRef] [PubMed]
- Latif, A.; Shehzad, A.; Niazi, S.; Zahid, A.; Ashraf, W.; Iqbal, M. W.; Rehman, A.; Riaz, T.; Aadil, R. M.; Khan, I. M.; Özogul, F.; Rocha, J. M.; Esatbeyoglu, T.; Korma, S. A. Probiotics: mechanism of action, health benefits and their application in food industries. Front. Microbiol. 2023, Vol. 14. [Google Scholar] [CrossRef] [PubMed]
- Lipworth, S.; Chau, K.; Oakley, S.; Barrett, L.; Crook, D.; Peto, T.; Walker, A. S.; Stoesser, N. Estimating the effect of antimicrobial resistance genes on minimum inhibitory concentration in Escherichia coli. MedRxiv 2024. [Google Scholar] [CrossRef]
- Mahmood, A. A.; Qadir, B. M.; Muhammad, J. A.; Abdulla, H. T.; Thomas, N. V.; Diyya, A. S. M. Community-Acquired Infection among the Hospitalized Renal Stone Patients. J. Health Allied Sci. NU 2024, 14(04). [Google Scholar] [CrossRef]
- Mendis, B. I. L. M.; Sarvananda, L.; Jayasinghe, T. N.; Rajapakse, I. H.; Dissanayake, A. S. Mechanisms and key mediators of gut microbiota and type 2 diabetes mellitus: A comprehensive overview. Med. Microecol. 2025, Vol. 26. [Google Scholar] [CrossRef]
- Mishra, A.; Jena, S. K.; Srinivasan, A.; Tripathy, A.; Maiti, R.; Hota, D. Effect of an Add-On Multi-Strain Probiotic Formulation in the Prevention of Recurrent Urinary Tract Infections: A Double-Blind Randomized Placebo-Controlled Trial. Microbiol. Res. 2024, 15(4). [Google Scholar] [CrossRef]
- Mititelu, M.; Olteanu, G.; Neacșu, S. M.; Stoicescu, I.; Dumitrescu, D. E.; Gheorghe, E.; Tarcea, M.; Busnatu, Ștefan S.; Ioniță-Mîndrican, C. B.; Tafuni, O.; Belu, I.; Popescu, A.; Lupu, S.; Lupu, C. E. Incidence of Urinary Infections and Behavioral Risk Factors. Nutrients 2024, 16(3). [Google Scholar] [CrossRef] [PubMed]
- Nazir, A.; Nazir, A.; Zuhair, V.; Aman, S.; Sadiq, S. U. R.; Hasan, A. H.; Tariq, M.; Rehman, L. U.; Mustapha, M. J.; Bulimbe, D. B. The Global Challenge of Antimicrobial Resistance: Mechanisms, Case Studies, and Mitigation Approaches. Health Sci. Rep. 2025, 8(7). [Google Scholar] [CrossRef] [PubMed]
- Peres Fabbri, L.; Cavallero, A.; Vidotto, F.; Gabriele, M. Bioactive Peptides from Fermented Foods: Production Approaches, Sources, and Potential Health Benefits. In Foods; 2024; Vol. 13. [Google Scholar] [CrossRef] [PubMed]
- Prajescu, B.; Gavriliu, L.; Iesanu, M. I.; Ioan, A.; Boboc, A. A.; Boboc, C.; Galos, F. Bacterial Species and Antibiotic Resistance—A Retrospective Analysis of Bacterial Cultures in a Pediatric Hospital. Antibiotics 2023, 12(6). [Google Scholar] [CrossRef] [PubMed]
- Shaaban, M. T.; Khalil, F. O.; Hamdy, E.; Ahmed, A. A. M. Antimicrobial and antibiofilm activities of culture filtrates from Lactiplantibacillus plantarum isolated from traditional dairy products in Menoufia, Egypt. BMC Microbiol. 2025, 25(1). [Google Scholar] [CrossRef] [PubMed]
- Sharma, S.; Mohler, J.; Mahajan, S. D.; Schwartz, S. A.; Bruggemann, L.; Aalinkeel, R. Microbial Biofilm: A Review on Formation, Infection, Antibiotic Resistance, Control Measures, and Innovative Treatment. Microorganisms 2023, Vol. 11, Number 6. [Google Scholar] [CrossRef] [PubMed]
- Wang, Q.; Zheng, Y. Bioactive Peptides and Probiotic Bacteria: Modulators of Human Health. Foods 2025, 15(1). [Google Scholar] [CrossRef] [PubMed]
- Arakawa, T.; Ejima, D.; Ura, T.; Akuta, T.; Oh-Ishi, M. SDS protein interactions. In Biophysical Chemistry; 2026; Vol. 328. [Google Scholar] [CrossRef] [PubMed]
- Bustin, S. A.; Benes, V.; Nolan, T.; Pfaffl, M. W. Quantitative real-time RT-PCR - A perspective. J. Mol. Endocrinol. 2005, Vol. 34, Number 3. [Google Scholar] [CrossRef] [PubMed]
- Chevallet, M.; Luche, S.; Rabilloud, T. Silver staining of proteins in polyacrylamide gels. Nat. Protoc. 2006, 1(4). [Google Scholar] [CrossRef] [PubMed]
- Fleige, S.; Pfaffl, M. W. RNA integrity and the effect on the real-time qRT-PCR performance. Mol. Asp. Med. 2006, Vol. 27, Numbers 2–3. [Google Scholar] [CrossRef] [PubMed]
- Gallagher, S. R. SDS-polyacrylamide gel electrophoresis (SDS-PAGE). Curr. Protoc. Essent. Lab. Tech. 2012, (SUPPL.6), 2012. [Google Scholar] [CrossRef]
- Hare, P. J.; Englander, H. E.; Mok, W. W. K. Probiotic Escherichia coli Nissle 1917 inhibits bacterial persisters that survive fluoroquinolone treatment. J. Appl. Microbiol. 2022, 132(6). [Google Scholar] [CrossRef] [PubMed]
- Heid, C. A.; Stevens, J.; Livak, K. J.; Williams, P. M. Real time quantitative PCR. Genome Res. 1996, 6(10). [Google Scholar] [CrossRef] [PubMed]
- Thakur, M.; Deshpande, H.W.; Bhate, M. A. Isolation and Identification of Lactic Acid Bacteria and their Exploration in Non-Dairy Probiotic Drink. Int. J. Curr. Microbiol. Appl. Sci. 2017, 6(4). [Google Scholar] [CrossRef]
- Jiang, Y.; Zheng, L.; Lin, L.; Lin, S.; Xu, K.; Deng, S.; Zhang, Q. Modification in Silver Staining Procedure for Enhanced Protein Staining. In BioMed Research International; 2022; Vol. 2022. [Google Scholar] [CrossRef] [PubMed]
- Kielkopf, C. L.; Bauer, W.; Urbatsch, I. L. Bradford assay for determining protein concentration. Cold Spring Harb. Protoc. 2020, 2020(4). [Google Scholar] [CrossRef] [PubMed]
- Lila, A. S. A.; Rajab, A. A. H.; Abdallah, M. H.; Rizvi, S. M. D.; Moin, A.; Khafagy, E. S.; Tabrez, S.; Hegazy, W. A. H. Biofilm Lifestyle in Recurrent Urinary Tract Infections. In Life; 2023; Vol. 13. [Google Scholar] [CrossRef] [PubMed]
- Nadin, S. B.; Vargas-Roig, L. M.; Ciocca, D. R. A silver staining method for single-cell gel assay. J. Histochem. Cytochem. 2001, 49(9). [Google Scholar] [CrossRef] [PubMed]
- Shah, V.; Soni, R.; Dabhi, M.; Goswami, D.; Joshi, R. Antimicrobial activity of reference Lactobacillus strains against WHO priority drug-resistant pathogens through an integrated in vitro and bacteriocin gene clusters analysis. Microbe (Netherlands) 2025, 7. [Google Scholar] [CrossRef]
Disclaimer/Publisher’s Note: The statements, opinions and data contained in all publications are solely those of the individual author(s) and contributor(s) and not of MDPI and/or the editor(s). MDPI and/or the editor(s) disclaim responsibility for any injury to people or property resulting from any ideas, methods, instructions or products referred to in the content. |
© 2026 by the authors. Licensee MDPI, Basel, Switzerland. This article is an open access article distributed under the terms and conditions of the Creative Commons Attribution (CC BY) license (http://creativecommons.org/licenses/by/4.0/).
Copyright: This open access article is published under a Creative Commons CC BY 4.0 license, which permit the free download, distribution, and reuse, provided that the author and preprint are cited in any reuse.