Preprint
Communication

This version is not peer-reviewed.

Optimization and Validation of the QuEChERS-GC-MS Method for the Analysis of Dieldrin in Fillets of Nile Tilapia Oreochromis niloticus

Submitted:

15 August 2026

Posted:

18 August 2026

You are already at the latest version

Abstract

Organochlorine pesticides (OCPs) residues act as critical drivers of environmental impacts and pose significant risks to human and animal health. This scenario is further exacerbated by their high environmental persistence, marked bioaccumulative potential, and chronic toxicity. The International Agency for Research on Cancer (IARC) classifies dieldrin as well as aldrin, when metabolized into this substance, as probably carcinogenic to humans (Group 2A). OCPs can accumulate in the fatty tissue of fish. Therefore, when consumed, fish can become a route of human exposure to OCPs, such as dieldrin. A novel method for determining dieldrin in Fillets of Nile tilapia (Oreochromis niloticus) using GC/MS and the original QuEChERS was developed and validated. The optimization of chromatographic parameters resulted in an appropriate retention time (Rt) for dieldrin. Matrix-matched calibration was established to correct the matrix effect (ME) in the quantitative analysis of the pesticide. Dieldrin showed matrix-induced signal suppression of -21.17%. The pesticide studied showed good linearity with a coefficient of determination (R²) of 0.9918. According to the analytical validation standards established by ANVISA, concentrations above the LOQ (50 μg L-1) can be used as a linear working range with high reliability.

Keywords: 
;  ;  ;  

1. Introduction

Organochlorine pesticides (OCPs) are still used to control pests that threaten agricultural production because, when compared to other agrochemicals, they offer superior efficacy and environmental persistence (Sun et al., 2025). Although pesticides are used to minimize losses in agriculture, residues remain a significant concern for food security (Ikebudi et al., 2025). OCPs are classified as persistent organic pollutants (POPs). They continue to cause concern both due to their indiscriminate use throughout history and in vector control programs (Soman et al., 2026). The high stability of OCPs allows them to remain in the environment for decades, contaminating soil, groundwater, surface water, and aquatic organisms (Balamunt; Milyukin, 2025). The environmental and human health impacts associated with OCPs have become a growing concern due to their high persistence, bioaccumulative potential, and toxicity.
Many OCPs, including dieldrin, have been banned globally since the 1980s (Castaneda et al., 2025). Aldrin is an OCP that was widely used until the 1970s, but was subsequently banned in most countries (Aminininejad; Movassaghghazani, 2025). Dieldrin is closely related to aldrin, as it is a metabolite resulting from the oxidation of Aldrin after long periods (Castaneda et al., 2025; Alencar; Fernandes, 2025). In soil, the conversion of aldrin to dieldrin occurs slowly under moderate conditions, at a rate of approximately 75% per year, but higher oxidation rates occur in tropical climates (Kumari; Arfin, 2024). Dieldrin is more stable and bioaccumulative; thus, its presence is detected even in the absence of Aldrin (Omoding et al., 2026). Even long after the release of the parent compound, dieldrin persists in ecosystems, representing a toxicological concern (Alencar; Fernandes, 2025).
In Brazil, the use, commercialization, and production of dieldrin are prohibited (Conama, 2009). Although the use of dieldrin has been banned in Brazil, it is still detected in different samples, such as water, sediments, foods, demonstrating its environmental persistence (Botato et al., 2011; Pourhadi; Movassaghghazani, 2024; Lourenson et al., 2024; Da Silva et al., 2024; Menezes et al., 2025; Gil et al., 2026). The persistence of dieldrin in the environment is associated with their historical use (Pourhadi; Movassaghghazani, 2024). Dieldrin has a high potential for bioaccumulation (log Kow value that ranges from 4.32 to 6.2). Because it is highly lipophilic, dieldrin tends to accumulate in the adipose tissue of animals (Da Silva et al., 2024). Therefore, fish tend to show more frequent detections and higher levels of dieldrin (Caldas et al., 1999).
Dieldrin concentration can increase as it moves up the food chain (bio-magnify) (Botato et al., 2011). The bioaccumulation and bioconcentration of a pesticide in aquatic organisms, such as fish, can result in chronic toxicity (Carneiro et al., 2025). Upon entering the human body, aldrin rapidly transforms into dieldrin (Kumar; Gupta; Soni, 2025). Inefficient metabolism and sequestration in adipose tissue cause dieldrin to be slowly excreted in humans (IARC, 2019). Dieldrin is classified as endocrine-disrupting chemical (EDC) (Soto; Chung; Sonnenschein 1994; Feijó et al., 2025). The International Agency for Research on Cancer (IARC) lists dieldrin and aldrin metabolized to dieldrin as probably carcinogenic to humans (Group 2A).
Brazil is among the world's largest producers of Nile tilapia (Oreochromis niloticus) (Mastrochirico-Filho et al., 2025; Perazza et al., 2025). In Brazil, the main places to buy fish for human consumption are supermarkets. Nile tilapia (Oreochromis niloticus) is the most consumed fish species among Brazilians (St. Louis; Pedroza Filho; Flores, 2022). Since Brazil is a major consumer of fish, studies on pesticide residues in this type of food are crucial. Thus, regulatory strategies to reduce contamination can be subsidized, promoting ecosystem health, public health, and food security (Carneiro; Mariotto; Bragotto, 2025).
The detection and quantification of pesticide residues in food matrices require highly sensitive and reliable analytical techniques (Munir et al., 2024; Jan et al., 2025). For the target compound to be correctly identified and quantified, it is necessary to isolate it and remove interfering substances from the sample extract (Buah-Kwofie; Humphries, 2019). The QuEChERS (Quick, Easy, Cheap, Rugged, and Safe) method emerged as a promising alternative for extracting pesticide residues from fruits and vegetables (Anastassiades; Mastovská; Lehotay, 2003; Bruzzoniti et al., 2014; Tong et al., 2025). However, its application has expanded to other types of food matrices (Xu et al., 2018; Buah-Kwofie; Humphries, 2019; Li et al., 2025). The QuEChERS method is a simple, rapid, cost-effective, and green analytical approach (Buah-Kwofie; Humphries, 2019; Deore; Shabeer, 2025).. The combination of the QuEChERS method with Gas Chromatography coupled to Mass Spectrometry (GC-MS) proves to be a powerful tool for extracting and separating a wide range of organic contaminants from complex sample matrices, such as fish muscle tissue (Buah-Kwofie; Humphries, 2019).
This study aimed to optimize and validate an analytical method that combines the original QuEChERS extraction and GC-MS analysis for the determination of dieldrin in fish. Evaluating the matrix effect and optimizing chromatographic conditions minimized interferences and maximized quantification accuracy. This methodology can help identify dieldrin contamination in fish, allowing for targeted interventions to minimize risks to the environment and human health.

2. Materials and Methods

2.1. Chemicals and Reagents

The analytical standard for dieldrin (purity greater than 99.9%) was purchased from (Sigma-Aldrich, Brazil). The acetonitrile (ACN) HPLC grade used was (Tedia, Brazil). ACN was used as extraction solvent and to prepare a stock solutions of 10 mg L-1 and 1 mg L-1. From these solutions several levels of analytical standards (50, 100, 300, 600, 1000, 1500, and 2000 µg L−1) were obtained and used for the construction of calibration curves in the solvent and the matrix. The reagents anhydrous magnesium sulfate P.A. (Vetec, Brazil), sodium chloride P.A. (Vetec, Brazil), Bondesil Primary Secondary Amine (PSA) 40 μm (Supelco, EUA) were of analytical grade. All standard working solutions were stored at 4 °C.

2.2. Sampling and Preparation

The fish samples (tilapia fillets) were purchased from a local market in Araguaína city (Tocantins, Brazil). The samples were previously weighed, crushed manually, and priorly homogenized using a vortex mixer. Then, the partitioning salts (analytical grade anhydrous magnesium sulfate and sodium chloride) were added, and the mixture was vortexed again, followed by centrifugation, and stored under freezing conditions until extraction for analysis.. For samples processing and storage, the procedures recommended by the SANTE/11312/2021 guideline was used (European Commission, 2021). The extraction of dieldrin from the samples was prepared using the original QuEChERS protocol described by Anastassiades et al. (2003).

2.3. Apparatus

The analytical instrumentation used consisted of a gas chromatography system (GC, 7890B model, Agilent Technologies) coupled to a single quadrupole mass spectrometer (MS, 5977B model, Agilent Technologies). The dieldrin analysis was performed using an Agilent HP-5MS capillary column (30m x 0.25 mm I.D. x 0.25 μm thickness). The carrier gas used was Helium (99,999%) with a flow rate of 1.24 mL min-1. The injection temperature was 240°C with an injection volume of 1 µL (splitless mode). The MassHunter Qualitative Analysis software (Agilent Technologies) was used for data analysis.

2.4. Optimization of GC/MS Conditions

The chromatographic conditions were optimized to reduce analysis time without compromising the resolution of the dieldrin peak. The oven temperature optimization was performed based on Sousa et. at. (2025) study. The standard solution of dieldrin (1500 μg L-1) was injected in full-scan mode. The ionization system was operated in electron ionization (EI) mode with an energy of 70 eV. The temperatures of the ion source, the transfer line, and the injector were maintained at 150 °C, 250 °C, and 240 °C, respectively. The full scan mode was used for the identification of the target analyte (scan range: 40 – 500 m/z).

2.5. Method Validation

The validation parameters (selectivity, linearity, precision, accuracy, matrix effect, limits of detection (LOD), and quantification (LOQ)) were determined in accordance with the SANTE/11312/2021 and ANVISA guidelines (ANVISA, 2017; European Commission, 2021).
The selectivity of the method was verified by its ability to identify and quantify dieldrin in the presence of other matrix compounds. This confirmation was obtained by comparing the analytical standard with the spiked fish sample. Linearity was determined by the calibration curve (50 μg L-1 to 2000 μg L-1). Precision was assessed using the relative standard deviation (RSD) after independent injection of each standard solution in triplicate. The curves prepared in matrix-matched and solvent were compared to study the matrix effect using the equation described by Fernandes et al. (2020). The LOD and LOQ were estimated based on the signal-to-noise ratio (S/N) from successive injections of dilutions of the standard solution. The statistical calculations and the construction of the calibration curve graph were carried out using Microsoft Excel, utilizing its integrated functions for statistical data analysis, including curve plotting, linear regression fitting, and R2 value calculation.

3. Results and Discussion

3.1. Optimization of GC/MS Conditions

Figure 1 present the injection of the standard dieldrin solution (1500 μg L-1) in full scan mode allowed to find the appropriate settings for analyte analysis. The analysis was performed in total ion chromatogram (TIC) mode (40 – 500 m/z). The chromatogram produced a sharp and well-resolved peak with low noise, indicating good resolution and sensitivity.
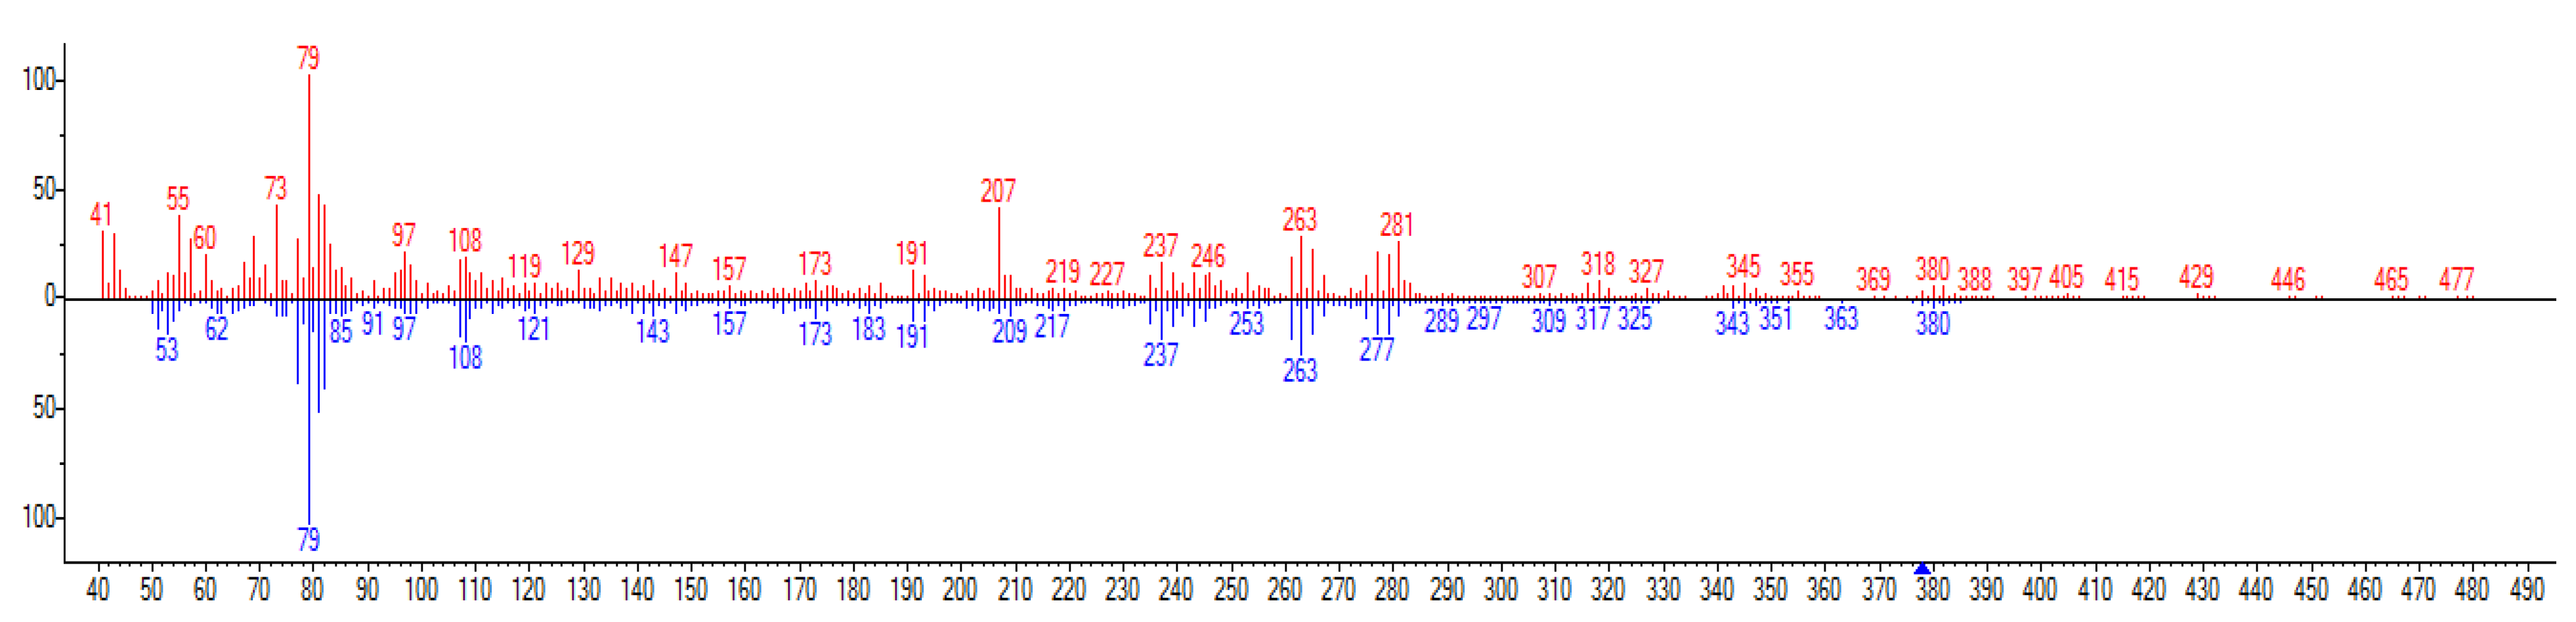
The comparison of the mass spectrum data of the dieldrin standard with those from the NIST (National Institute of Standards and Technology) Mass Spectrum Library was performed to confirm that the observed peak corresponded to dieldrin. Figure 2 illustrates this match, where the red spectrum represents the experimental result of the run, and the blue spectrum corresponds to the reference standard from the NIST library. The comparison of the data showed a probability of 89.7%, which is considered good (Amirav et al., 2024).
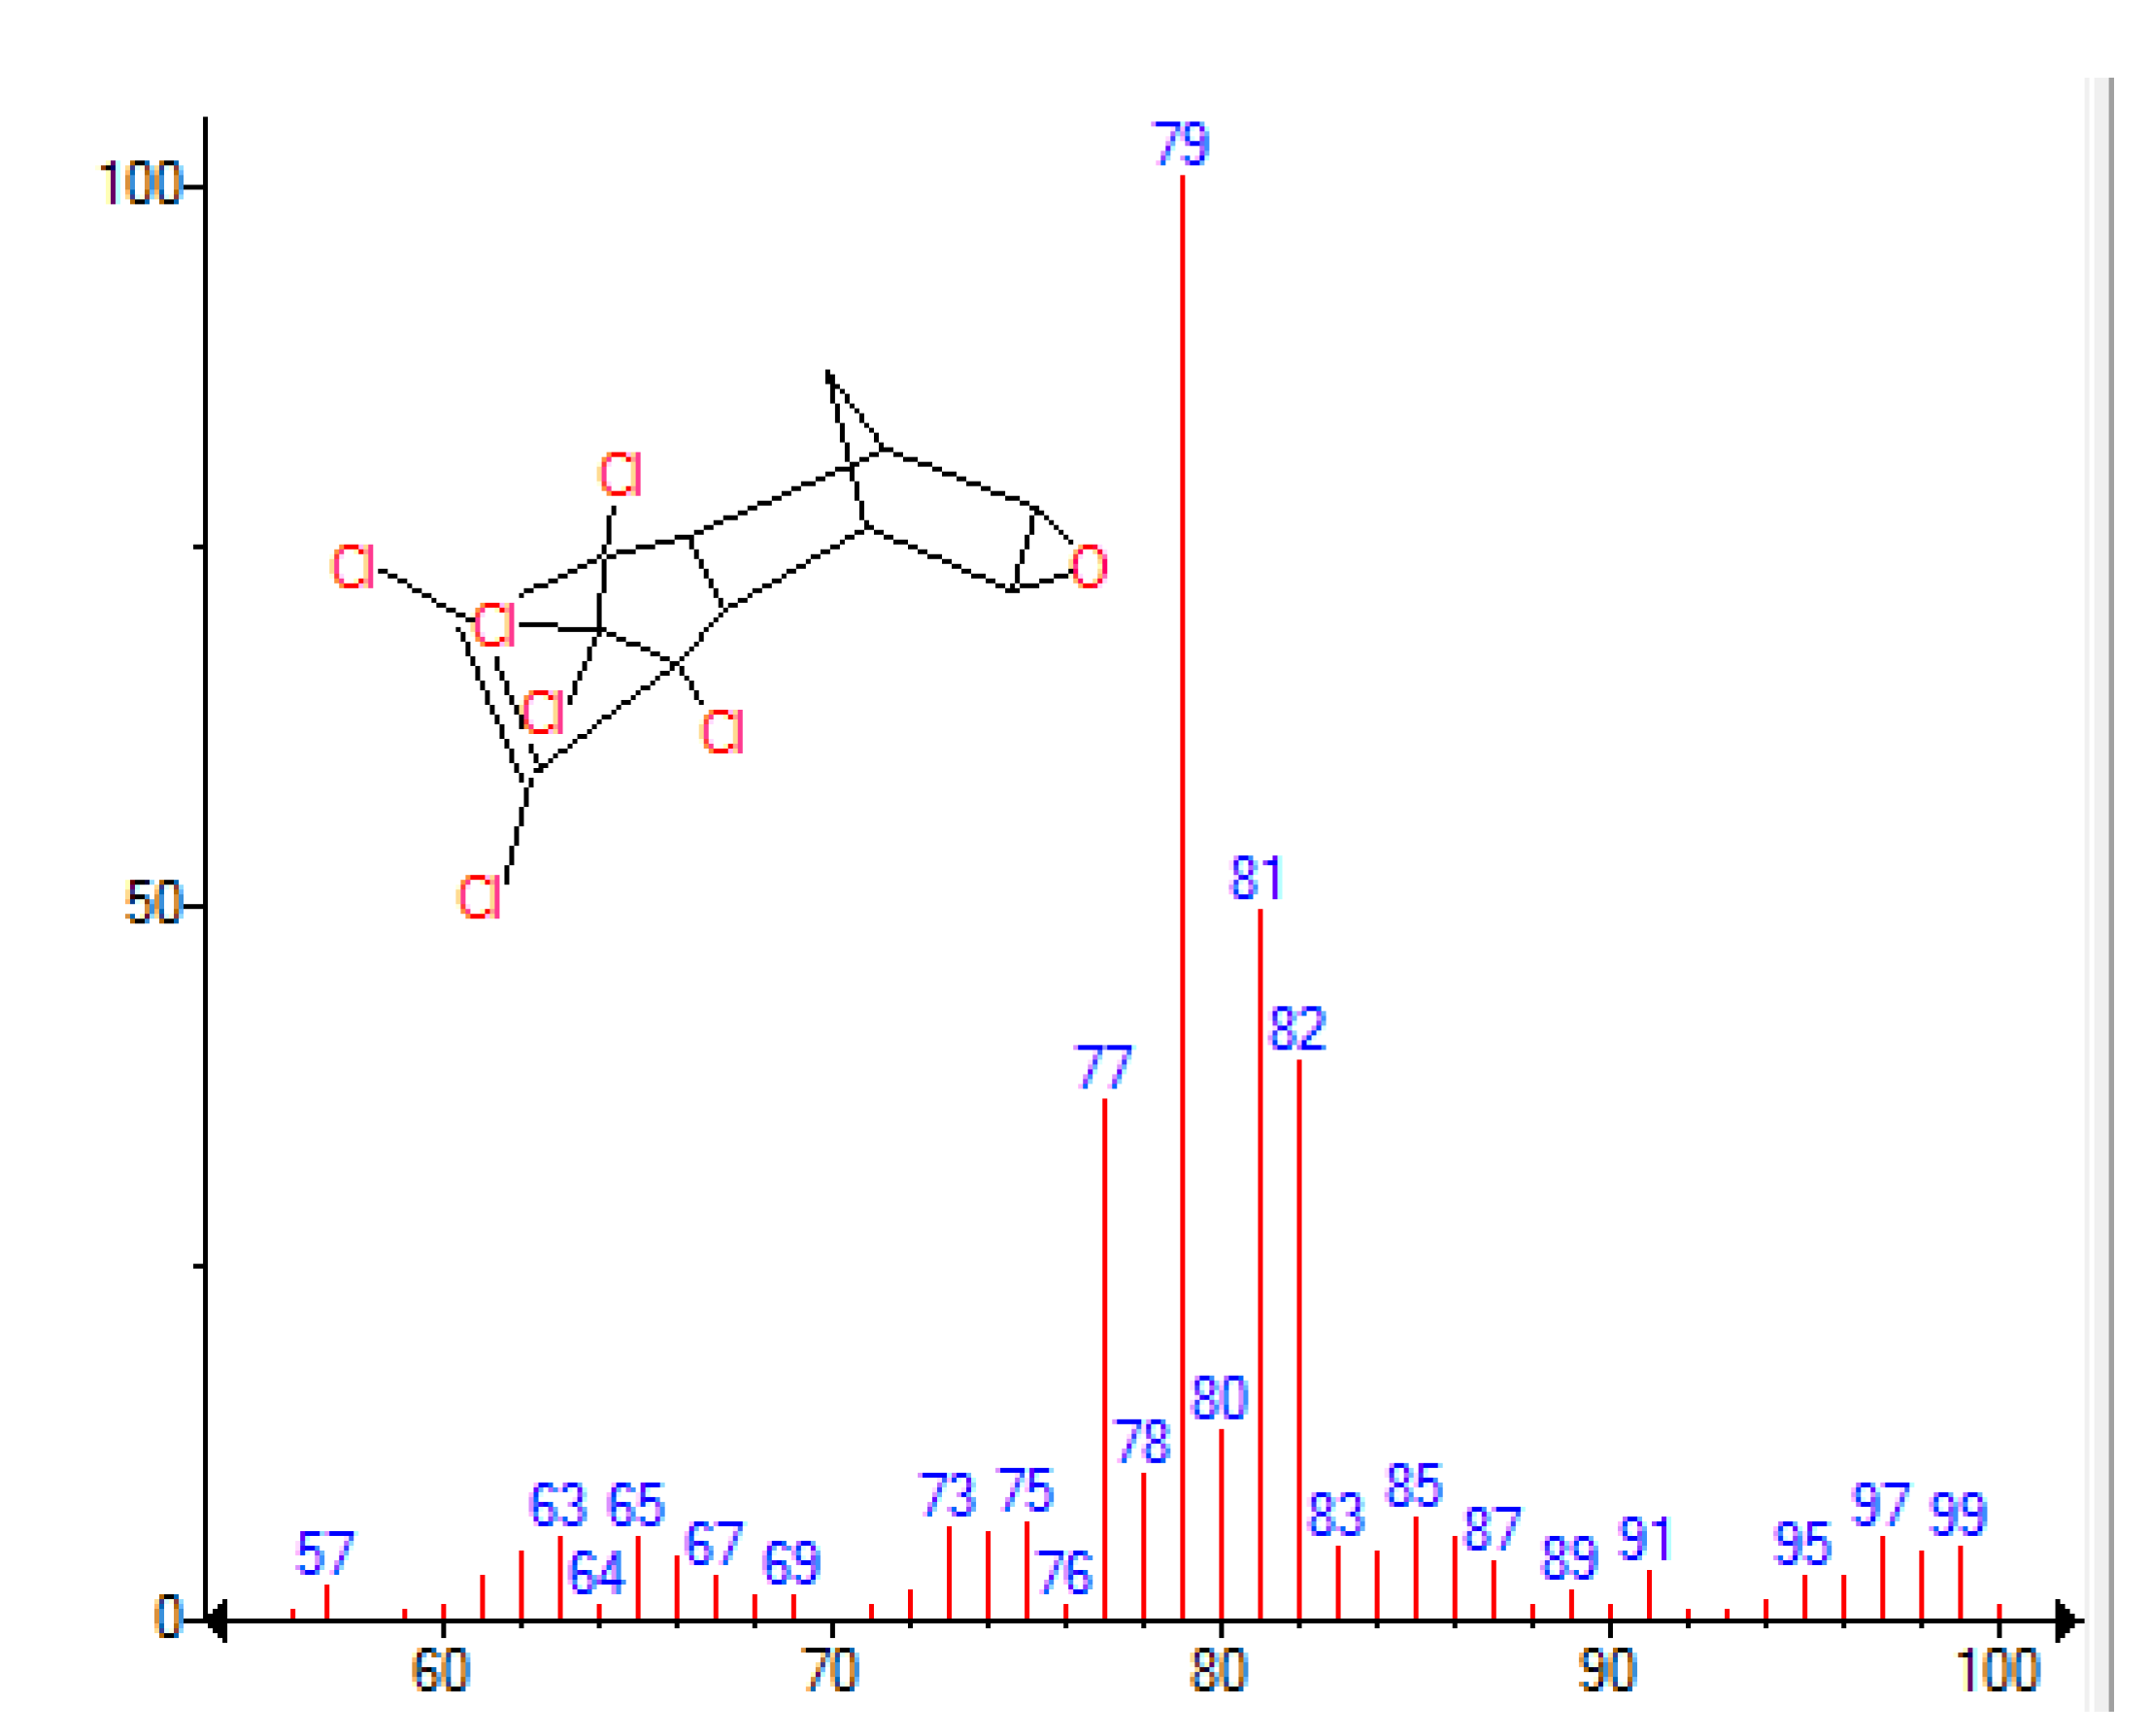
Figure 3 presents the most intense characteristic ions obtained for dieldrin. For ions selection, the highest signal intensity and the least interference from surrounding ions or background noise were considered. Two fragment ions were selected, m/z 79 (quantification) and m/z 81 (confirmation). These values ​​were used to operate in selective ion monitoring (SIM) mode for quantification of dieldrin. This approach significantly reduced interference, ensuring greater selectivity and reproducibility of results (Jia; Batterman; Chernyak, 2006; Fialkov et al., 2007).
For optimization of the chromatographic method, the oven temperature was programmed with an initial temperature ramp from 50 °C to 180 °C at 15 °C/min, followed by a faster increase of 35 °C/min up to 280 °C, with a solvent delay of 4.0 min. The SIM mode was used, emphasizing the characteristic ions m/z 79 and 81, in order to highlight the analyte resolution in the chromatogram.
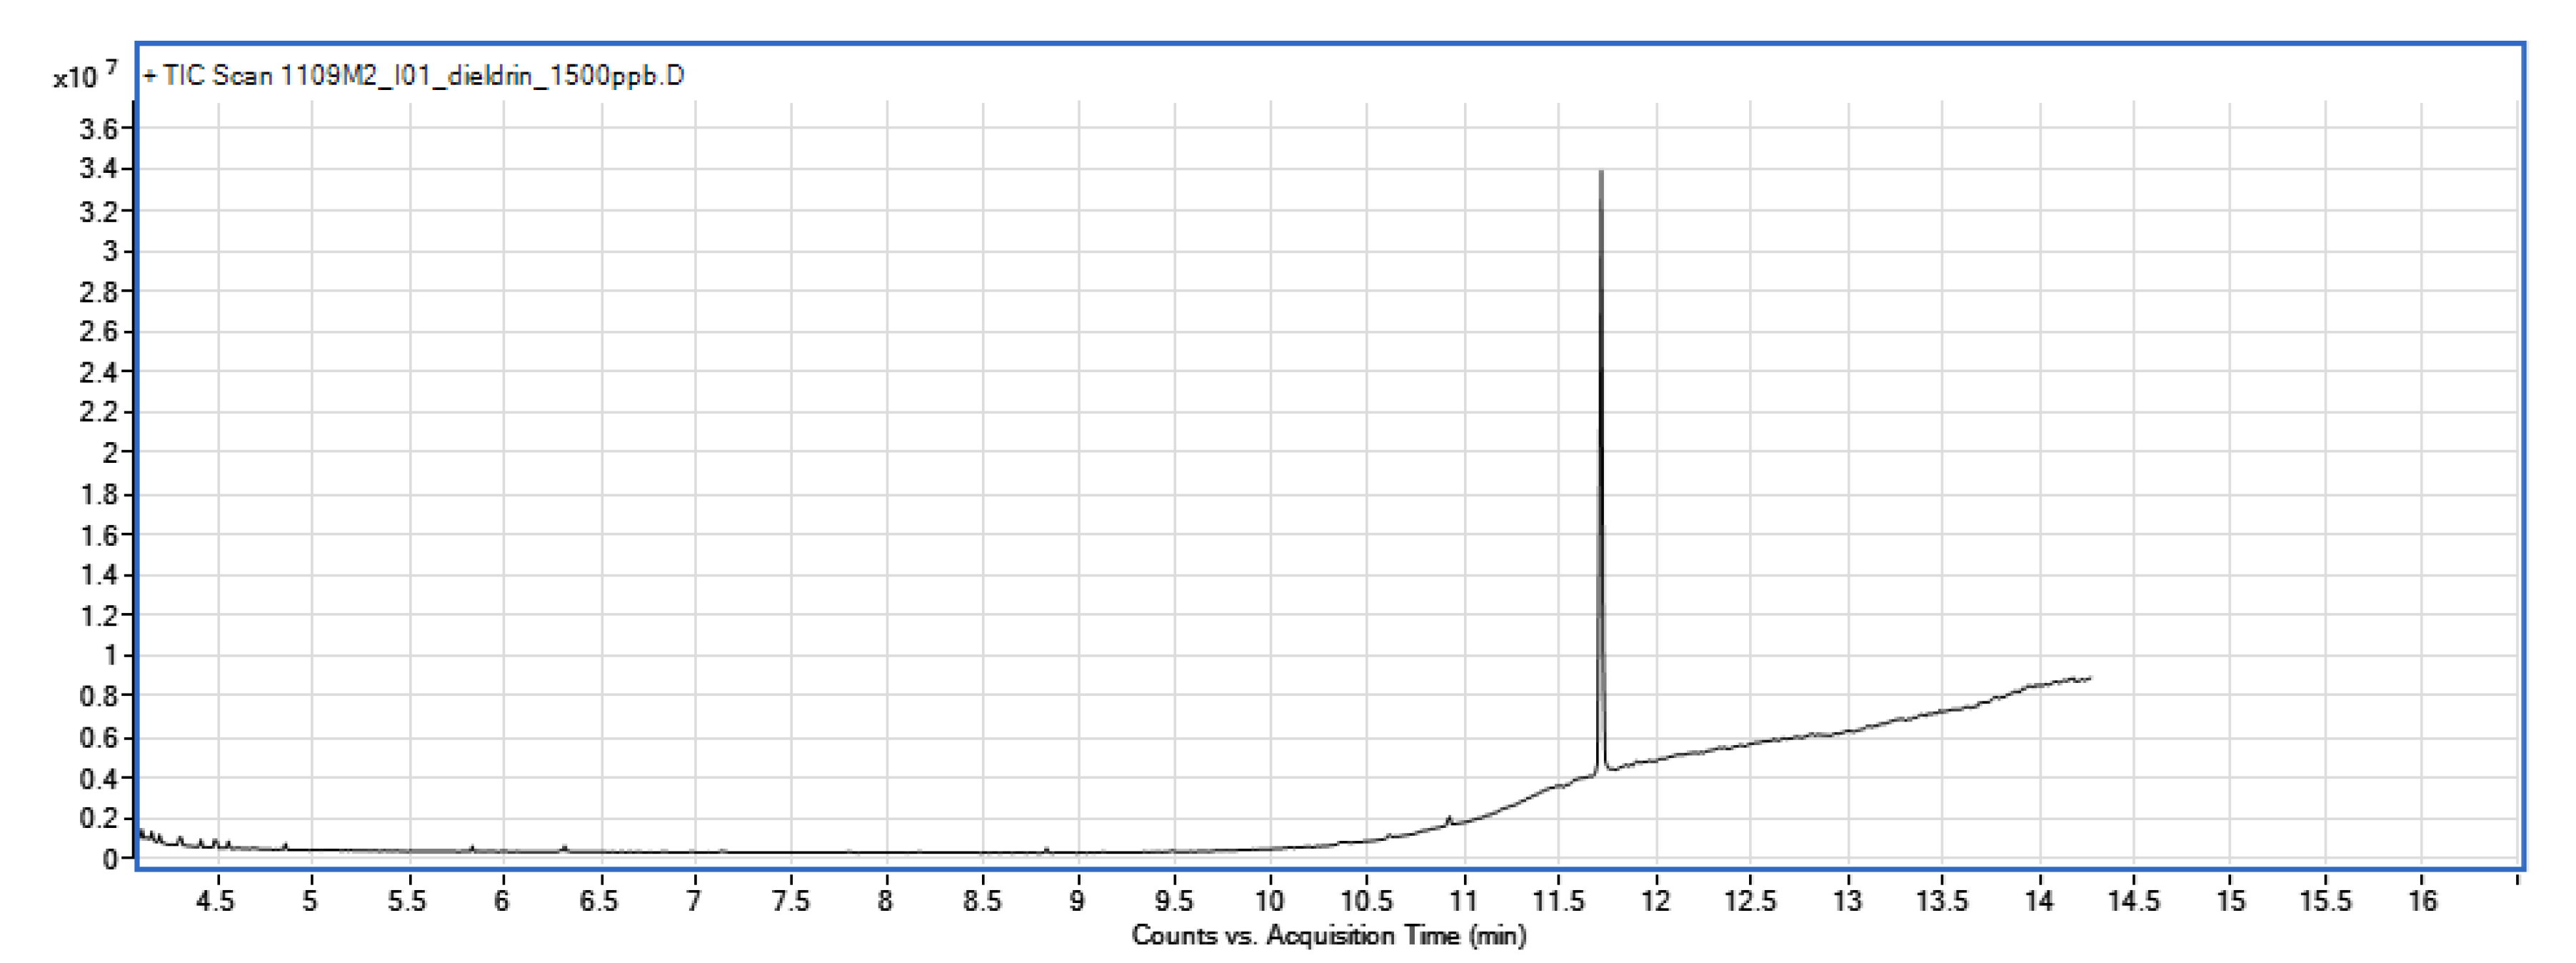
These improved settings resulted in a reduction in Rt of dieldrin from 16.78 min (Figure 1) to 11.72 min (Figure 4). This resulted in a 30% decrease in the Rt e of dieldrin. The Rt of each compound is unique, but also depends on the instrument settings and maintenance (Gregg; Boyer; Berry, 2026). Furthermore, there was an improvement in the intensity of the dieldrin peak (an increase of approximately 16.4%), demonstrating greater detection efficiency. Thus, it was possible to determine the ideal oven temperature conditions for dieldrin analysis, avoiding high temperatures that could cause thermal degradation of the analyte and excessive run time. The optimized oven temperature was used in all subsequent analyses.

3.2. Selectivity

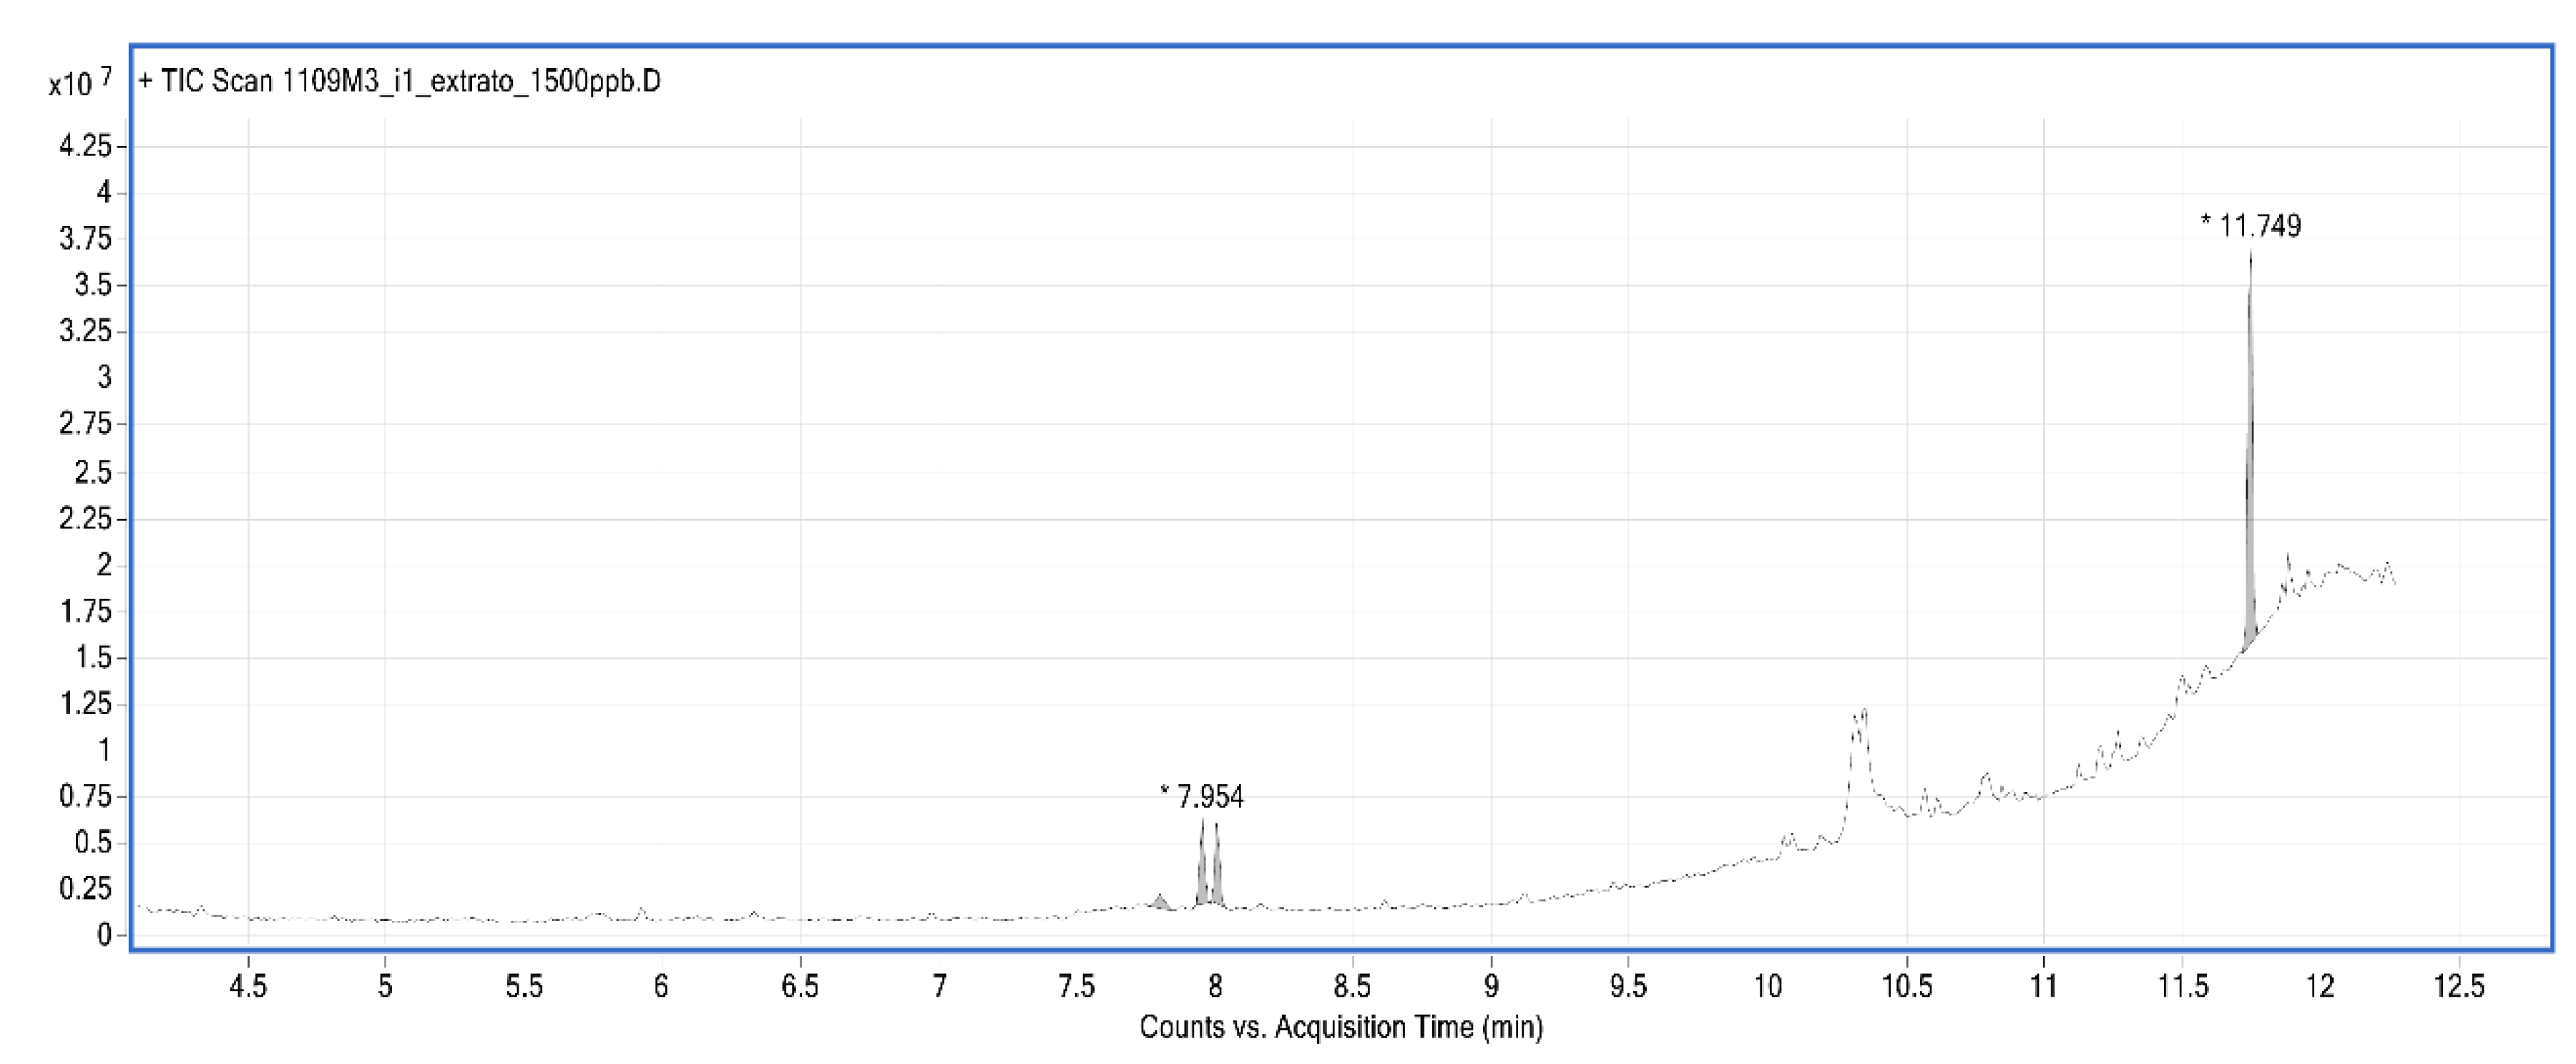
Figure 5 shows the chromatogram of the fish matrix doped with a 1500 µg L−1 standard solution of dieldrin. TIC in full scan mode was used. This procedure was performed to identify the compounds present in the fish sample, detect possible contaminants, and confirm the presence of the analyte at this concentration. It can be observed that there was adequate selectivity, with the resolution of the dieldrin peak not compromised by the presence of other peaks related to co-extractives from the complex matrix of the fish. Therefore, the matrix did not cause any significant shift in the Rt of dieldrin, confirming the chromatographic stability of the method.

3.3. Matrix Effect (ME)

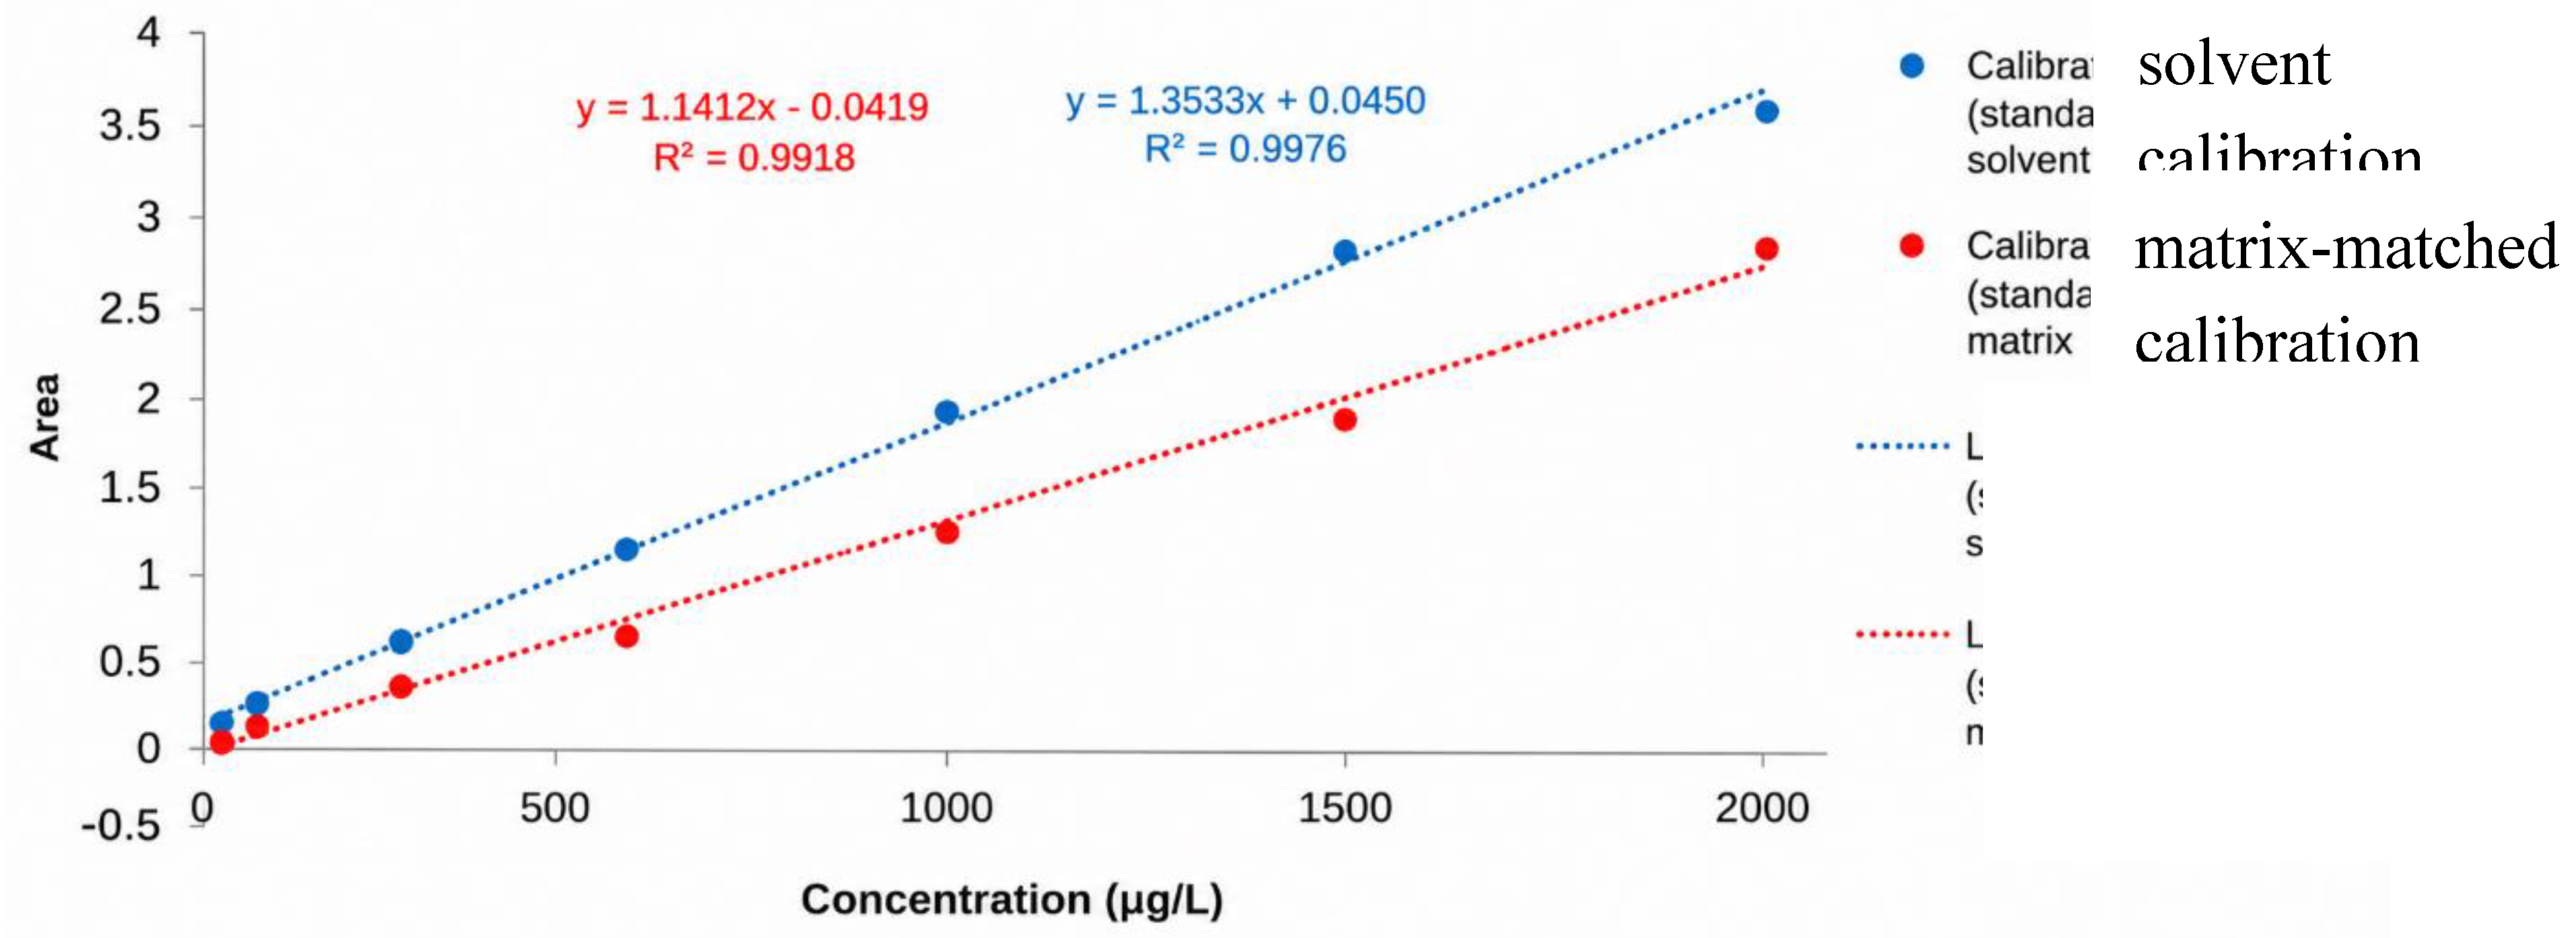
The influence of the matrix is ​​as important as the nature of the pesticide (González-Curbelo et al., 2017). Matrix effect (ME) evaluation allows us to verify if other components (co-extractives) present in the matrix may interfere with the determination of the target analyte (Alcântara et al., 2018; Fernandes et al., 2020; Williams et al., 2023). Low sensitivity and imprecise quantification in GC analysis are frequently associated with ME (Liu et al., 2025). The analyte analytical signal can be suppressed or enhanced, impairing the selectivity and specificity of the method (Fernandes et al., 2020). Spiked matrix-matched standards to solvent-based standards can be used to compensate for any matrix affects when an isotope internal standard is not available (Cieslik et al., 2011). The analytical curves prepared in solvent and matrix-matched were compared to study the ME. The concentration levels corresponding to 50, 100, 300, 600, 1000, 1500, and 2000 μg L−1 were used. All concentrations were injected in triplicate.
Figure 6 shows the evaluation of the ME investigated for the dieldrin in the fish sample. The calibration curve was obtained using (Ordinary Least Squares (OLS) regression) least squares linear regression analysis of peak area versus concentration. Dieldrin exhibited a medium (between -50 and -20%) matrix-induced signal suppression of -21.17% (Liu et al., 2016). In addition to reducing sample microelements, sample preparation methods are essential for improving sensitivity and reproducibility in pesticide determination (Raoufi et al., 2023).

3.4. Linearity

The matrix-matched calibration at 50 to 2000 μg L−1 was used to assess linearity (Figure 6). The coefficient of determination (R2) was 0.9918, indicating good linear correlation and reliability of the experimental points. Thus, the curve constructed from the matrix can be used for quantitative analyses of dieldrin.
The limit of quantification (LOQ) was determined by means of successive dilutions, resulting in a value of 50 μg L⁻¹ for dieldrin. From this point, the linear working range was defined, with high confidence in the concentration values obtained.

3.5. Precision

The relative standard deviation (RSD) was below 5 % for higher concentrations (1000 μg L-1 and 1500 μg L-1) and below 10 % for concentrations close to the limit of quantification.
Precision was assessed by calculating the relative standard deviation (RSD), yielding an average value of 2.2 % for the calibration curve of the analytical standard in ACN and 4.8 % for the dieldrin samples in the matrix extract. RSD values below 20 % are considered acceptable, while values below 5 % indicate excellent precision.

4. Conclusions

A method combining the QuEChERS original with GC-MS for the analysis of dieldrin in fish was developed and validated. The optimized oven temperature conditions resulted in a significant reduction in analysis time, without compromising analyte resolution. The method validation showed excellent results for linearity, precision, and accuracy. The matrix-induced signal suppression of -21.17% was observed. The observed ME did not compromise the reliability of the measurements, highlighting that the method remains efficient, even in the presence of typical interferents from complex matrices, such as fish. A LOQ of 50 μg L-1 was reached for dieldrin. The application of this method represents an effective analytical tool for monitoring dieldrin residues in fish, which are one of the main sources of human exposure to environmental contaminants.

Acknowledgments

The authors thank the Chromatography Laboratory (LabCrom) of the Federal University of Northern Tocantins (UFNT) for providing the infrastructure necessary to carry out the research. The Trace Analysis Laboratory (LAT) of the Federal University of Ceará (UFC) for donating some reagents for the QuEChERS method and the analytical standard of dieldrin. The authors are thankful to CNPq (406760/2022–5). The authors are thankful to INCT-ALIM - CNPq nº 58/2022, process 406760/2022-5.

Conflicts of Interest

The authors declare that they have no conflict of interest.

References

  1. Alcântara, D. B.; Paz, M. S.; Rodrigues, T. H.; Fernandes, T. S.; Barbosa, P. G.; Loiola, A. R.; Nascimento, R. F. D. Organophosphorus pesticide in sapodilla (Manilkara zapota) fruit . J. Braz. Chem. Soc. 2018, 29(10), 2180–2188. [Google Scholar] [CrossRef]
  2. Amininejad, A. H.; Movassaghghazani, M. Risk assessment and daily intake of aldrin, dieldrin, and dichloro-diphenyl-trichloroethane through milk in Tehran, Iran. J. Food Compos. Anal. 2025, 143, 107583. [Google Scholar] [CrossRef]
  3. Anastassiades, M.; Maštovská, K.; Lehotay, S. J. Evaluation of analyte protectants to improve gas chromatographic analysis of pesticides . J. Chromatogr. A 2003, 1015(1-2), 163–184. [Google Scholar] [CrossRef] [PubMed]
  4. Anastassiades, M.; Lehotay, S. J.; Štajnbaher, D.; Schenck, F. J. Fast and easy multiresidue method employing acetonitrile extraction/partitioning and “dispersive solid-phase extraction” for the determination of pesticide residues in produce. J. AOAC Int. 2003, 86(2), 412–431. [Google Scholar] [CrossRef]
  5. ASTDR. Toxicological Profile for Aldrin and Dieldrin ; Agency for Toxic Substances and Disease Registry: Atlanta, GA, USA, 2022. [Google Scholar]
  6. Balamut, V. I.; Milyukin, M. V. Seasonal Dynamics of Organochlorine Pesticides in River Water: Influence of Physicochemical Properties and Transformation Processes. J. Water Chem. Technol. 2025, 47(6), 598–611. [Google Scholar] [CrossRef]
  7. Botaro, D.; Torres, J. P. M.; Malm, O.; Rebelo, M. F.; Henkelmann, B.; Schramm, K. W. Organochlorine pesticides residues in feed and muscle of farmed Nile tilapia from Brazilian fish farms . Food Chem. Toxicol. 2011, 49(9), 2125–2130. [Google Scholar] [CrossRef] [PubMed]
  8. BRASIL. Agência Nacional de Vigilância Sanitária. Resolução RDC nº 166, de 24 de julho de 2017. Dispõe sobre a validação de métodos analíticos e dá outras providências; Diário Oficial da União: seção 1. Brasília, DF, 25 jul 2017; n. 141, pp. 87–89.
  9. Bruzzoniti, M. C.; Checchini, L.; De Carlo, R. M.; Orlandini, S.; Rivoira, L.; Del Bubba, M. QuEChERS sample preparation for the determination of pesticides and other organic residues in environmental matrices: a critical review. Anal. Bioanal. Chem. 2014, 406(17), 4089–4116. [Google Scholar] [CrossRef] [PubMed]
  10. Buah-Kwofie, A.; Humphries, M. S. Validation of a modified QuEChERS method for the analysis of organochlorine pesticides in fatty biological tissues using two-dimensional gas chromatography. J. Chromatogr. B 2019, 1105, 85–92. [Google Scholar] [CrossRef] [PubMed]
  11. Caldas, E. D.; Coelho, R.; Souza, L. C. K. R.; Silva, S. C. Organochlorine pesticides in water, sediment, and fish of Paranoá Lake of Brasilia, Brazil . Bull. Environ. Contam. Toxicol. 1999, 62(2), 199–206. [Google Scholar] [CrossRef] [PubMed]
  12. Carneiro, D. D.; Mariotto, S.; Sousa, D. A.; Bragotto, A. P. Presence of pesticide residues in water resources and fish in Brazil: Narrative bibliographic review . ACS Food Sci. Technol. 2025, 5(5), 1785–1797. [Google Scholar] [CrossRef]
  13. Castaneda, M.; Avila, B. S.; Rios, S. E. G.; Penuela, G. A. Analysis of organochlorine pesticides and polychlorinated biphenyls in tropical fruits and soils from Antioquia, Colombia and health risk assessment by consumption. J. Food Compos. Anal. 2025, 142, 107428. [Google Scholar] [CrossRef]
  14. Cieślik, E.; Sadowska-Rociek, A.; Ruiz, J. M. M.; Surma-Zadora, M. Evaluation of QuEChERS method for the determination of organochlorine pesticide residues in selected groups of fruits. Food Chem. 2011, 125(2), 773–778. [Google Scholar] [CrossRef]
  15. CONAMA. Conselho Nacional do Meio Ambiente (2009) Resolução Nº 420, de 28 de dezembro de 2009. Dispõe sobre critérios e valores orientadores de qualidade do solo quanto à presença de substâncias químicas e estabelece diretrizes para o gerenciamento ambiental de áreas contaminadas por essas substâncias em decorrência de atividades antrópicas. Diário Oficial da União: Brasília, DF. Available online: http://www.mma.gov.br/port/conama/legiabre.cfm?codlegi=620.
  16. da Silva, T. M.; Seabra, L. M. A. J.; Colares, L. G. T.; de Araújo, B. L. P. C.; Pires, V. C. D. C.; Rolim, P. M. Risk assessment of pesticide residues ingestion in food offered by institutional restaurant menus . PLoS ONE 2024, 19(12), e0313836. [Google Scholar] [CrossRef] [PubMed]
  17. de Alencar, M. S.; Fernandes, F. A. N. Comparative Efficacy of Ultrasound and Cold Plasma (DBD, Glow, Corona) for the Simultaneous Degradation of Aldrin and Dieldrin. Processes 2025, 13(12), 3982. [Google Scholar] [CrossRef]
  18. Deore, P.; Shabeer, A. Green Analytical Techniques for Pesticide Residue Analysis in Food: Recent Advances and Future Perspectives. Green Chem. Food Anal. 2025, 289–313. [Google Scholar] [CrossRef]
  19. European Commission. Analytical quality control and method validation procedures for pesticide residues analysis in food and feed. SANTE 2021, 11312 v2. [Google Scholar]
  20. Available online: http://food.ec.europa.eu/system/files/2023-11/pesticides_mrl_guidelines_wrkdoc_2021-11312.pdf.
  21. Feijó, M.; Carvalho, T. M.; Fonseca, L. R.; Vaz, C. V.; Pereira, B. J.; Cavaco, J. E. B.; Socorro, S. Endocrine-disrupting chemicals as prostate carcinogens . Nat. Rev. Urol. 2025, 22(9), 609–631. [Google Scholar] [CrossRef] [PubMed]
  22. Fernandes, T. S. M.; Alcântara, D. B.; Barbosa, P. G. A.; Paz, M. S. D. O.; Zocolo, G. J.; Nascimento, R. F. D. Matrix effect evaluation and method validation of organophosphorus pesticide residues in bell peppers (Capsicum annuum L.) by GC–MS determination. Int. J. Environ. Anal. Chem. 2020, 100(15), 1691–1706. [Google Scholar] [CrossRef]
  23. Fialkov, A. B.; Steiner, U.; Lehotay, S. J.; Amirav, A. Sensitivity and noise in GC–MS: Achieving low limits of detection for difficult analytes . Int. J. Mass Spectrom. 2007, 260(1), 31–48. [Google Scholar] [CrossRef]
  24. Gregg, M.; Boyer, G.; Berry, J. Quantifying pairwise similarity of ignitable liquids analyzed by GC–MS: A comparison of four methods . J. Forensic Sci. 2026, 00, 1–10. [Google Scholar] [CrossRef] [PubMed]
  25. Gil, M. L.; Bila, D. M.; Fonseca, E. M.; Neto, J. A.; Moreira, L. B.; Cavalcante, R. M. Impacts of Rapid Development in a Subtropical Region of South America (Rio de Janeiro, Brazil): Insights from Emerging Contaminants Across Various Chemical Classes. Water Air Soil Pollut. 2026, 237(2), 1–28. [Google Scholar] [CrossRef]
  26. González-Curbelo, M. Á.; Socas-Rodríguez, B.; Herrero, M.; Herrera-Herrera, A. V.; Hernández-Borges, J. Dissipation kinetics of organophosphorus pesticides in milled toasted maize and wheat flour (gofio) during storage . Food Chem. 2017, 229, 854–859. [Google Scholar] [CrossRef] [PubMed]
  27. IARC Working Group on the Evaluation of Carcinogenic Risks to Humans. Pentachlorophenol and some related compounds . 2019. Available online: https://publications.iarc.who.int/574.
  28. Ikebudu, S. O.; Bada, B. S.; Adekola, M. B.; Adewuyi, S.; Taiwo, A. M. Health Risk Assessment of Pesticide Residues in Soil and Rice From Rainfed Floodplains of Anambra State, Nigeria . J. Appl. Toxicol. 2025. [Google Scholar] [CrossRef] [PubMed]
  29. Jan, I.; Rashied, F.; Malik, N. A.; Mukhtar, M.; Dudwal, R.; Kataria, A. Detection of Pesticide Residues in Fruits and Vegetables Involving Different Chromatographic Techniques (LC–MS/MS, GC–MS/MS, GC and HPLC). Biomed. Chromatogr. 2025, 39(11), e70224. [Google Scholar] [CrossRef] [PubMed]
  30. Jia, C.; Batterman, S.; Chernyak, S. Development and comparison of methods using MS scan and selective ion monitoring modes for a wide range of airborne VOCs. J. Environ. Monit. 2006, 8(10), 1029–1042. [Google Scholar] [CrossRef] [PubMed]
  31. Kumar, N.; Gupta, K. S.; Soni, R. K. Health risk assessment and toxicity management of organochlorine pesticide: With the reference to Aldrin. In Hazardous Chemicals; Academic Press, 2025; pp. 43–55. [Google Scholar]
  32. Kumari, K.; Arfin, T. Pollutants of global concern ; Springer International Publishing, 2024. [Google Scholar]
  33. Li, X.; Yang, R.; Gan, P.; Bai, Z.; Peng, R.; Li, J.; Yuan, J. A modified QuEChERS method coupled with GC–MS/MS for the rapid and simultaneous analysis of polybrominated diphenyl ethers and novel brominated flame retardant residues in animal-derived foods. Food Chem. X 2025, 29, 102649. [Google Scholar] [CrossRef] [PubMed]
  34. Liu, M.; Xie, Y.; Li, H.; Meng, X.; Zhang, Y.; Hu, D.; Xue, W. Multiresidue determination of 29 pesticide residues in pepper through a modified QuEChERS method and gas chromatography–mass spectrometry. Biomed. Chromatogr. 2016, 30(10), 1686–1695. [Google Scholar] [CrossRef] [PubMed]
  35. Liu, R.; Pan, L.; Qin, Y.; Xie, F.; Nie, C.; Wang, X.; Cui, H. Systematic investigation into matrix effect compensation in the GC-MS analysis of flavor components using analyte protectants. Talanta 2025, 291, 127818. [Google Scholar] [CrossRef] [PubMed]
  36. Lourenson, A. P.; Reis, F. O.; Corrêa, É. K.; da Silva Júnior, F. M. R. Potential risk of organochlorine regulation limits in Brazilian soils . Arab. J. Geosci. 2024, 17(6), 185. [Google Scholar] [CrossRef]
  37. Martyniuk, C.J.; Mehinto, A.C.; Denslow, N.D. Organochlorine pesticides: Agrochemicals with potent endocrine-disrupting properties in fish. Mol. Cell. Endocrinol. 2020, 507, 110764. [Google Scholar] [CrossRef] [PubMed]
  38. Mastrochirico-Filho, V. A.; Garcia, B. F.; Lira, L. V. G.; do Amaral Neto, A. R.; Marín-Nahuelpi, R.; Gallardo-Hidalgo, J.; Hashimoto, D. T. Evaluating the genetic diversity in farmed populations of Nile tilapia (Oreochromis niloticus) from Brazil using SNP markers . Aquac. Fish. 2025. [Google Scholar] [CrossRef]
  39. Menezes, H. C.; Orlando, R. M.; Augusti, R.; de Macedo, A. N.; Almeida, M. R.; de Lourdes Cardeal, Z.; de Sousa, D. V. M. Analysis of contaminants in surface water after the collapse of the Córrego do Feijão mine dam in Brumadinho, Brazil . Sci. Total Environ. 2025, 990, 179954. [Google Scholar] [CrossRef] [PubMed]
  40. Munir, S.; Azeem, A.; Zaman, M. S.; Haq, M. Z. U. From field to table: Ensuring food safety by reducing pesticide residues in food . Sci. Total Environ. 2024, 922, 171382. [Google Scholar] [CrossRef] [PubMed]
  41. Omoding, D.; Nantume, T.; Wasswa, J.; Odongo, S.; Kyarimpa, C.; Karume, I.; Ssebugere, P. Organochlorine pesticides in placenta, blood and breast milk of mothers in Uganda: Concentrations and health risks to breast fed infants. J. Hazard. Mater. Adv. 2026, 21, 100949. [Google Scholar] [CrossRef]
  42. Perazza, C. A.; da Fonseca, F. S.; Máximo Tagashira, L. A.; Onaka, E. M.; dos Santos, V. B.; Reis Neto, R. V.; Hilsdorf, A. W. S. Genetic and phenotypic characterization of Nile tilapia (Oreochromis niloticus) in Brazil: implications for germplasm conservation and selective breeding programs . Crit. Insights Aquac. 2025, 1(1), 2560212. [Google Scholar] [CrossRef]
  43. Pourhadi, M.; Movassaghghazani, M. Quantification of pesticide residues in milk by HPLC-UV analysis in Gilan province, Iran . Int. J. Environ. Stud. 2024, 81(5), 2334–2342. [Google Scholar] [CrossRef]
  44. Raoufi, A.; Raoufi, A. M.; Ismailzadeh, A.; Soleimani Rad, E.; Kiaeefar, A. Application of hollow fiber-protected liquid-phase microextraction combined with GC-MS in determining Endrin, Chlordane, and Dieldrin in rice samples. Environ. Geochem. Health 2023, 45(7), 5261–5277. [Google Scholar] [CrossRef] [PubMed]
  45. Soman, S.; Rex, K. R.; Baek, K.; Bharat, G. K.; Mohanty, S.; Hurley, R.; Chakraborty, P. Spatial distribution and sediment-water fluxes of organochlorine pesticides in Daman Ganga and Tapi rivers, Gujarat, India . Sci. Total Environ. 2026, 1011, 181075. [Google Scholar] [CrossRef] [PubMed]
  46. Soto, A. M.; Chung, K. L.; Sonnenschein, C. The pesticides endosulfan, toxaphene, and dieldrin have estrogenic effects on human estrogen-sensitive cells. Environ. Health Perspect. 1994, 102(4), 380. [Google Scholar] [CrossRef] [PubMed]
  47. St. Louis, T. J.; Pedroza Filho, M. X.; Flores, R. M. V. Consumption frequencies, determinants, and habits of aquaculture species in Brazil . Aquac. Int. 2022, 30(2), 919–936. [Google Scholar] [CrossRef]
  48. Sun, L. K.; Fu, J.; Zhao, M. L.; Wang, W. Q.; He, Z.; Yang, G. P. Spatial distribution, source, and ecological risk of organochlorine pesticides (OCPs) in the Yellow and Bohai Seas . Mar. Environ. Res. 2025, 107619. [Google Scholar] [CrossRef] [PubMed]
  49. Tong, L.; Li, G.; Xiao, Z.; Luo, X.; Gong, Y.; Liu, H. Rapid determination of polybrominated diphenyl ethers in animal-derived foods using QuEChERS d SPE EMR-Lipid combined with GC-MS/MS. CyTA-J. Food 2025, 23(1), 2587499. [Google Scholar] [CrossRef]
  50. Williams, M. L.; Olomukoro, A. A.; Emmons, R. V.; Godage, N. H.; Gionfriddo, E. Matrix effects demystified: Strategies for resolving challenges in analytical separations of complex samples . J. Sep. Sci. 2023, 46(23), 2300571. [Google Scholar] [CrossRef] [PubMed]
  51. Xu, Y.; Weng, R.; Lu, Y.; Wang, X.; Zhang, D.; Li, Y.; Qian, Y. Evaluation of phthalic acid esters in fish samples using gas chromatography tandem mass spectrometry with simplified QuEChERS technique. Food Anal. Methods 2018, 11(12), 3293–3303. [Google Scholar] [CrossRef]
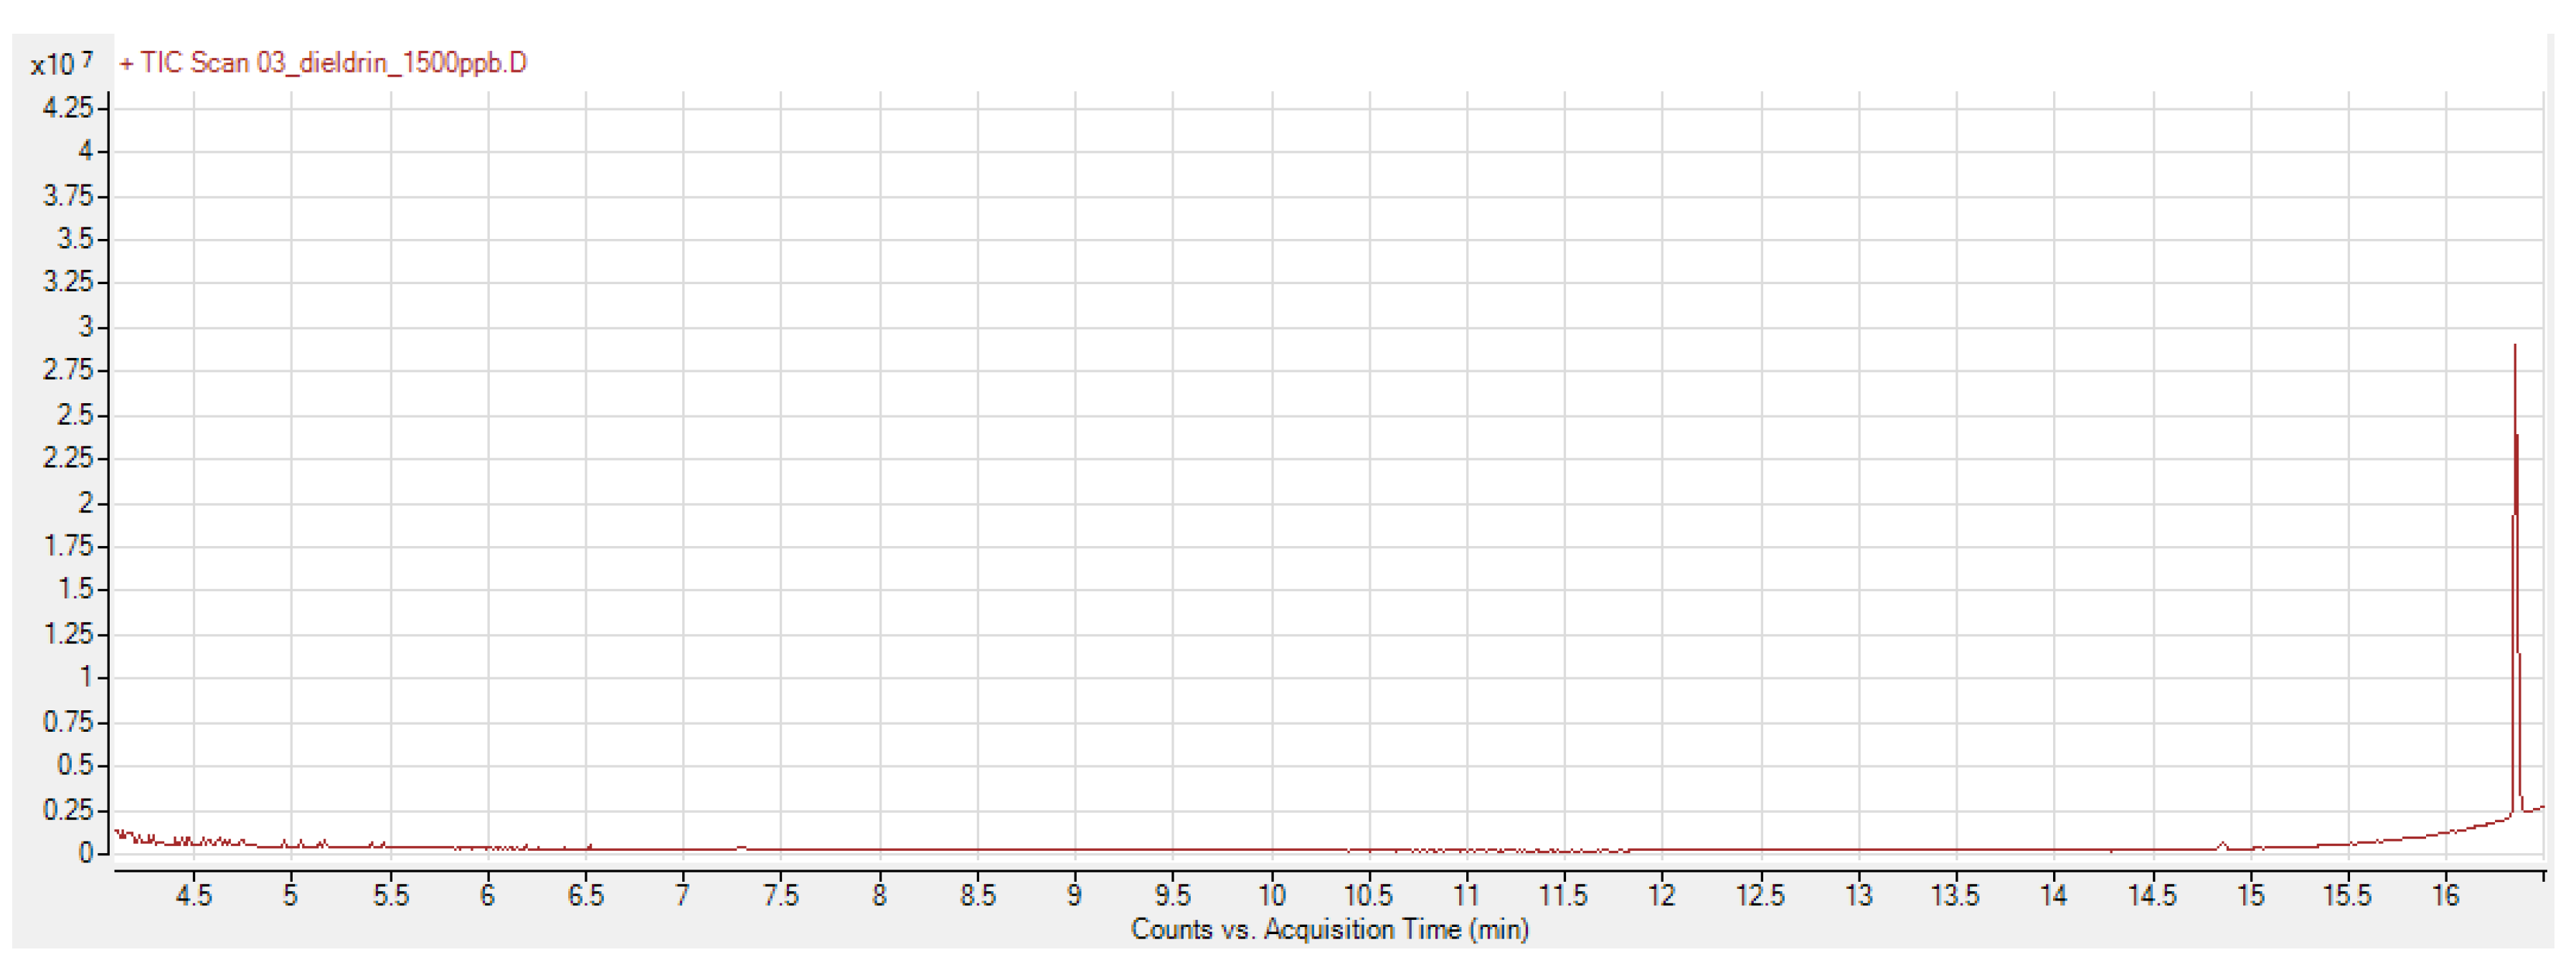
Figure 1. TIC in full scan mode after the injection of 1 μL of the standard solution of dieldrin at 1500 µg L−1.
Preprints 228558 g001
Figure 2. The mas spectral comparison between the obtained experimentally (1 μL of the standard solution of dieldrin at 1500 µg L−1) and those recorded in the NIST library.
Preprints 228558 g002
Figure 3. Mass spectrum of dieldrin with the injection of 1 μL of the standard solution of dieldrin at 1500 µg L−1.
Preprints 228558 g003
Figure 4. TIC in full scan mode of dieldrin (injection of 1 μL of the standard solution at 1500 µg L−1) obtained after optimizing the oven temperature.
Preprints 228558 g004
Figure 5. TIC in full scan mode of the fish sample spiked with 1500 μg L-1 of dieldrin (Rt = 11.749).
Preprints 228558 g005
Figure 6. External Standardization, Matrix-Matched Calibration and Matrix effect (%) determination for the dieldrin in the fish matrix.
Preprints 228558 g006
Disclaimer/Publisher’s Note: The statements, opinions and data contained in all publications are solely those of the individual author(s) and contributor(s) and not of MDPI and/or the editor(s). MDPI and/or the editor(s) disclaim responsibility for any injury to people or property resulting from any ideas, methods, instructions or products referred to in the content.
Copyright: This open access article is published under a Creative Commons CC BY 4.0 license, which permit the free download, distribution, and reuse, provided that the author and preprint are cited in any reuse.