

Submitted:
14 August 2026
Posted:
17 August 2026
You are already at the latest version
Abstract
Dietary composition is a major driver of the ruminal and intestinal microbiomes in dairy cows and is implicated in digestive disorders such as subacute ruminal acidosis (SARA), which can be triggered by high-concentrate diets. Here, we used a longitudinal shotgun metagenomic approach to investigate the dynamics of ruminal and fecal microbiomes in seven dairy cows subjected to a controlled bidirectional dietary transition from low- to high-concentrate diets and back over two months. Samples were collected at three key stages of dietary modulation, enabling the assessment of temporal changes in microbial composition and function in relation to diet-associated physiological fluctuations. Shotgun metagenomic sequencing enabled a comprehensive characterization of community structure and functional potential across compartments and time, revealing a strong location effect with clear segregation between ruminal and fecal microbiomes, as well as diet-associated differences in diversity and composition. Our results highlight how gradual dietary concentrate transitions induce coordinated taxonomic and functional remodelling of the digestive microbiome in dairy cows and suggest that these responses may not be fully reversible over the course of a short experimental time frame.
Keywords:
dietary shifts
; rumen
; ruminant
; microbiome
; metagenome-assembled genomes
1. Introduction
Dairy cows play a central role in global food production systems ever since the early days of human societies (Diamond 2002). As a result, optimizing the animal’s health and productivity is essential to meet growing food demand. In modern intensive dairy production systems, nutritional strategies are often designed to maximize milk yield by including high levels of rapidly fermentable carbohydrates (Plaizier et al. 2008). Even though this practice is effective in improving productivity, it can also lead to metabolic disorders, including subacute ruminal acidosis (SARA) (Zebeli and Metzler-Zebeli 2012). SARA is characterized by a sustained decrease in ruminal pH without the acute clinical signs observed in severe acidosis (Plaizier et al. 2018). This condition is associated with multiple adverse effects, including reduced feed intake, decreased milk fat content, impaired ruminal function, and an increased risk of secondary disorders such as laminitis and liver abscesses (Nagaraja and Titgemeyer 2007; Plaizier et al. 2018).
Although several studies have described microbiota changes associated with dietary transitions in dairy cows, the vast majority have relied on 16S rRNA gene sequencing approaches, which provide little functional insight (Khafipour et al. 2009). Moreover, the interplay between the ruminal and intestinal microbiota in this context has also been poorly explored even though the intestine is a major component of the GI tract, where water and nutrient absorption occurs (Moran 2005; Bergmann 2017), and a key niche for the colonization of animal pathogens that can impact the animal’s health and well-being (Sapountzis et al. 2020).
To address these limitations, approaches such as shotgun metagenomics have been used to gain a more comprehensive understanding of microbial ecosystems by facilitating both taxonomic and functional characterization. In dairy cows, seasonal diet rotation can remodel the microbiome and virulome, with consequences for the metabolic and digestive potential of the microbial community (Teseo et al. 2022), and a similar contrast has been observed when comparing forage-fed and grain-fed animals (Lin et al. 2023). In dairy goats, specific microbial profiles (such as those enriched with Bifidobacterium adolescentis) can maintain ruminal stability, promote epithelial cell proliferation, and enhance volatile fatty acid (VFA) absorption to confer SARA tolerance (X. Chen et al. 2025).
In our study, we employed a bidirectional dietary manipulation to investigate the dynamics of the digestive microbiome in seven lactating dairy cows over a two-month period. During the experiment, the animals were progressively fed increasing concentrate-to-hay ratios over a one-month period. After the one-month period, the animals reverted to their standard diets. Samples from both the rumen and feces were collected longitudinally to examine changes in pH and VFA content, and a subset of both rumen and fecal samples was used for shotgun metagenomics. A dual bioinformatics strategy was implemented to characterize antibiotic resistance genes (ARGs), virulence factors, and construct metagenome-assembled genomes (MAGs). Our study aimed to characterize the taxonomic and functional dynamics of the ruminal and intestinal microbiomes across both dietary transitions in relation to fluctuations in both pH and VFAs.
2. Methods
Experimental procedures took place from October - December 2022 at an INRAE experimental farm (Herbipôle) at Marcenat, France. All experimental protocols were approved by the Regional Ethics Committee for Animal Experimentation (C2EA-02) and authorized by the French Ministry of Agriculture (authorization number #37961-2022070609451631 v6).
A total of seven lactating cows (parity number 1 to 4, 216.3±24 days in milk (DIM), milk production: 20.1±2.6 kg/d) were housed in the same pen and, prior to the experiment, fed a high forage diet. At the start of the experiment, the cows received a basic ration of hay and concentrate (hay:conc. 80%:20%, starch content 5%) for 4 weeks, which mirrored the standard diet for those cows at the farm (Table S1). A transition was performed by increasing concentrate proportion through the addition of a 50/50% wheat barley concentrate over 3 days to reach 21% total starch for one week (hay:conc. 62%:38%). Finally, the basic ration was offered again for an additional month, marking the end of the experiment.
Ruminal and fecal samples were collected at the beginning of the experiment, during the week with the highest starch/hay ratio, and at the end of the experiment (hereafter referred to as beginning, midpoint and endpoint). Rumen and fecal samples were also collected at two additional time points, one between the beginning and midpoint and the other between the midpoint and endpoint. The samples from these additional time points were used exclusively for pH and VFA measurements and are therefore not mentioned or taken into account in any of the microbiome-related analyses. Ruminal pH was measured using spot rumen samples that were collected before the morning feeding with a gastro-oesophageal probe (Dunière et al. 2025; Boudon et al. 2026). Briefly, oesophageal tube placement was performed via a PVC tube 2.5 cm in diameter. A vacuum pump equipped with a glass container was connected to the tube, and the rumen content was collected through vacuum pressure in the tube. The first 200 mL were discarded to avoid contamination with saliva and mucus. Then, approximately 500 mL of rumen content was collected. The quality of the sample was visually checked (absence of visible amount of saliva, no trace of blood) and pH was recorded immediately on a subsample. Fecal samples were collected via rectal sampling, the pH was measured immediately, and then they were transferred into sterile Falcon tubes (~50 mL). Samples were stored on ice and then at -80C until DNA extraction. Volatile fatty acids (VFA) were analyzed by sampling two mL- from rumen and feces content. Samples were centrifuged for 10 minutes at 10000 rpm at +4°C, and 800 μL of rumen fluid supernatant was then added to 500 μL of 0.5 N HCl containing 2% (w/v) metaphosphoric acid and 0.4% (w/v) crotonic acid before storage at −20°C. Samples were further analyzed by GC (Silberberg et al. 2013).
DNA from ruminal fluid was extracted with the Quick DNA/RNA MAGBead kit (Zymo Research) and from 300mg of fecal material using the QIAmp Fast DNA Stool kit (Qiagen). DNA concentrations were quantified using a Qubit Fluorometer (Thermo Fisher Scientific). Metagenomic libraries were prepared from the 42 fecal and rumen samples from the seven dairy cows using the PCR-free KAPA HyperPrep Kit (Roche) and sequenced on an Illumina NovaSeq 6000 S4 platform using 2 × 150-bp paired-end sequencing, yielding an average of approximately 46 million reads per sample, similar to (Sommer et al. 2026).
For the 42 samples that were sequenced, read quality was first evaluated using FastQC v0.11.7 (Andrews 2010, 201), and then filtered and trimmed using Trimmomatic v0.38 (Bolger et al. 2014) with default parameters to remove low-quality databases and adapter sequences. The quality of the cleaned reads was checked again with FastQC, and the reports were aggregated using MultiQC.
An assembly-free approach was used to characterize antimicrobial resistance genes (ARGs) and virulence factors. The latest versions of the ResFinder (version 2.6.0) and VFDB (Virulence Factor Database) (version 2025) databases were indexed with KMA (L. Chen et al. 2005; Clausen et al. 2018), and the filtered reads were aligned to these databases using the following parameters: -ipe -mem_mode, -ef, -1t1, -cge, -nf, and -t 8. The output files (.mapstat and .res) were used to extract the abundance, length, and coverage for each database. Only genes for which read coverage was >90% of the gene length were retained to ensure reliable detection. Sample counts were normalized using MicrobeCensus to correct for biases related to differences in sequencing depth and genome sizes (Nayfach and Pollard 2015). Tables were subsequently imputed using the CZM (Count Zero Multiplicative) method in the zCompositions package and centered-log ratio (CLR) transformed.
An assembly-based approach was implemented to reconstruct Metagenome Assembled Genomes (MAGs). Quality-filtered paired-end reads were assembled into contigs using MEGAHIT (Li et al. 2015), with default parameters and a minimum contig length threshold of 300 bp , and the '−meta-large' option. Using the assembled contigs as a reference, quality-filtered reads were mapped with Bowtie2 v2.3.4.3 to estimate coverage depth, which was subsequently used as input for metagenomic binning. MAGs were binned by grouping contigs with MetaBAT2 using a minimum contig length of 1500bp (Kang et al. 2019). Due to the limited number of MAGs recovered in our dataset, publicly available rumen MAGs from previous studies (Stewart et al. 2018, 2019; Tong et al. 2022; Conteville et al. 2024) were additionally incorporated to expand the MAG catalogue used in all downstream analyses. MAG quality of the generated MAG catalogue was assessed using CheckM (Parks et al. 2015), and only genomes with completeness greater than 85% and contamination lower than 5% were retained. Dereplication was then performed using dRep (Olm et al. 2017) (ANI > 97%, ANIm > 99%) to obtain a non-redundant MAG catalogue, and open reading frames (ORFs) were identified with Prodigal (Hyatt et al. 2010).
Predicted proteins were functionally annotated using a two-step approach: first we performed a diamond BLAST (Buchfink et al. 2015)(v2.0.5.143) against the eggNOG protein database (v2020-11-12) with a 1e-15 E-value cutoff, and then the best match of each query was used as input for eggNOG-mapper (version 2.0.4) (Cantalapiedra et al. 2021). KEGG orthologs were then extracted to characterize the metabolic potential and reconstruct metabolic pathways for our MAGs. Taxonomic assignment was performed using Sourmash (Pierce et al. 2019) (k = 31, scaled = 1000) against the GTDB representative genome database, applying a minimum 10 kb alignment threshold. MAGs were further filtered based on maximum containment ANI (>95%). Filtered reads were mapped to the dereplicated MAG catalogue using KMA to estimate relative abundances and the resulting abundance profiles were converted into tables and imported into R. A coverage-based filtering step was applied to consider positive matches only those that showed greater than 25% MAG genome coverage, and abundances were normalized using the same approach as in the read-based (VFDB and Resfinder mapping) analysis to ensure comparability between methods (imputed and CLR-transformed). The final dataset was used for downstream statistical analyses.
All statistical analyses were performed in Rstudio (version 4.5.2). Statistical analysis of microbial diversity reconstructed from MAGs. Alpha diversity was assessed using the Shannon index and observed richness (Sobs), and compared across experimental states (beginning, midpoint, and endpoint) and compartments (feces and rumen) using Kruskal–Wallis tests. These trends were also evaluated using mixed linear models that included the compartment, the dietary phase, and their interaction as fixed effects, with animal identity included as a random effect to account for repeated sampling from the same seven animals.
Beta diversity (community structure) was evaluated using PERMANOVA (adonis2) on Euclidean distances computed from CLR-transformed data, with marginal effects (by = "margin") and permutations restricted within individuals (strata = animal, 999 permutations). Homogeneity of multivariate dispersions was assessed using PERMDISP.
To identify differential representation patterns, we used the `multipatt` function from the `indicspecies` R package (Cáceres et al. 2023). MAG relative abundances (not imputed and not CLR transformed) were used as input, and permutations were constrained by animal identity to account for the repeated sampling design, as the same seven animals were sampled across compartments and experimental states. A total of 999 permutations was used, and p-values were adjusted using the false discovery rate (FDR) correction.
Three complementary analyses examined MAG distribution across compartments and time. First, compartment-associated MAGs were identified by comparing fecal and ruminal samples across all experimental states. Second, experimental state-associated MAGs were examined within each compartment separately, comparing samples collected before, during, and after the high-concentrate period. Third, compartment differences were tested within each experimental state independently (beginning, midpoint and endpoint), to assess whether compartment-specific MAG signatures were temporally stable. Core MAGs were defined separately for fecal and ruminal compartments based on their prevalence across the 21 samples available for each compartment. For each MAG, prevalence was calculated as the number of samples in which the MAG was detected with a non-zero relative abundance. A MAG was considered feces-core when it was detected in at least 17 of the 21 fecal samples and in fewer than 5 ruminal samples (>80% and <25% respectively). A MAG was considered rumen-core when it was detected in at least 17 of the 21 ruminal samples and in fewer than 5 fecal samples. MAGs detected in at least 17 samples in both compartments were considered shared core MAGs. This prevalence-based definition was applied after coverage filtering and relative-abundance normalization.
Functional annotation of the main MAGs allowed for a comparison of the predicted metabolic potential of fecal and ruminal MAGs. Predicted amino acid sequences of the MAGs were first used as input to perform a diamond BLAST search against the eggNOG database using as cutoff an evalue of 1e-15, percent identity and cover identity of 70%. We then used the best match to identify the eggNOG annotation using the eggNOG mapper tool and the output tables were imported into Rstudio for further processing. The eggNOG results were used to extract the KEGG orthology (KO) annotations and link them to KEGG modules. Functional richness was first assessed by counting the number of unique KOs and KEGG modules in each major group. An abundance-weighted functional analysis was performed by linking KEGG module annotations to the relative abundance profiles of the MAGs. For each sample, the relative abundances of the core MAGs carrying a given KEGG module or a relevant functional group were summed, with each MAG counted only once per module or functional group. The average functional abundance was then compared across compartments and experimental conditions. The targeted functional groups included methanogenesis, and carbohydrate, short-chain fatty acid/fatty acid, amino acid, vitamin/cofactor, energy, nitrogen and sulfur metabolism. The functional groups were assigned to KEGG modules using a keyword-based search on module names, with each module classified into a single group by the first matching keyword: methanogenesis (methanogenesis, coenzyme M, methane); vitamin/cofactor metabolism (cobalamin, vitamin, cofactor, biotin, riboflavin, folate, thiamine, menaquinone, siroheme); carbohydrate metabolism (galacturonate, cellulose, xylan, starch, pectin, carbohydrate, glycolysis, gluconeogenesis, pentose phosphate); short-chain fatty acid/fatty acid metabolism (butanoate, butyrate, propanoate, propionate, acetate, acetyl-CoA, fatty acid); amino acid metabolism (amino acid, tryptophan, leucine, lysine, arginine, histidine, valine, isoleucine, phenylalanine, tyrosine, methionine); nitrogen metabolism (nitrogen, nitrate, nitrite, ammonia, ammonium, urea, urease); sulfur metabolism (sulfur, sulfate, sulfite, sulfide, thiosulfate); and energy metabolism (NADH, quinone, oxidoreductase, electron transport, ATP synthase, oxidative phosphorylation, reductive citrate cycle, TCA, Krebs). This keyword-based classification was exploratory and focused on the aforementioned functional groups, chosen to highlight functions of biological interest related to nutrient production, relevant metabolism etc.
The pH values across all five sampling time points were compared using a one-way repeated-measures ANOVA, with sampling time as the within-subject factor and animal as the repeated subject. To investigate the potential relationship between the composition of the microbial community and physicochemical parameters, we examined the cosine indices and performed an RDA analysis. In short, imputed CLR abundances of MAGs were compared to the pH and VFA values for each animal, which were treated as continuous traits and analyzed as temporal change profiles. For the microbial and chemical profiles we then computed cosine similarity for each animal, which captures directional concordance of temporal variation independent of magnitude. For each MAG and animal, temporal response vectors were calculated from CLR abundance changes between beginning-midpoint and midpoint-endpoint. Similar response vectors were generated for pH and VFA variables. Persistent associations were defined as MAG–chemical pairs present in at least 4 out of the 7 animals with consistent directional alignment and moderate-to-strong mean cosine similarity and low SD across animals (mean/sd>1). The redundancy analyses (RDA) were performed using the vegan package. The MAG abundance profiles in the 21 rumen and 21 feces samples (7 cows × 3 sampling points) were transformed using the Hellinger method (decostand()) prior to analysis. The explanatory variables included ruminal pH and eight volatile fatty acids (VFAs): acetate, propionate, isobutyrate, butyrate, isovalerate, valerate, caproate, and the acetate-to-propionate ratio. To separate the independent contributions of pH and VFA, a variance partitioning analysis was performed (varpart()). This function decomposes the explained variance into fractions attributable to pH alone [a], VFA alone [c], and their combined effect [b]. The statistical significance of the overall model and each block of variables was assessed using permutation tests (999 permutations). anova.cca() The adjusted R² was used as a measure of effect size.
3. Results
3.1. Experimental Overview
Ruminal pH was maintained at values higher than 5.9 in all cows and thoughout the experiment, except for one mid-term measurement in a single animal, where the rumen pH dropped to 5.8. Nevertheless, the high starch diet induced a significant decrease in pH (p<0.05), which was then restored back to initial level when cows were shifted to the high forage diet. In fecal samples, the pH ranged between 6.46 and 7.73; the decrease in pH values observed with the high starch diet was not significant but pH significantly increased when cows were fed the high forage diet again (Figure S1).
VFA concentrations were altered across the dietary scheme, with a stark increase in butyrate, valerate and caproate when the highest level of starch was applied and these changes were measured in all cows (Figure S1). Total VFA concentrations tended to increase as well during this period. Fecal VFA concentrations showed fluctuations over time as well, and tVFA, acetate, butyrate, propionate and caproate concentrations were the highest during the high starch feeding period.
3.2. Resistome and Virulome
Shotgun metagenomics of the rumen and fecal samples resulted in a total of 246.30 GB of filtered data which represented 4.055 billion reads.
Mapping of the filtered reads against the ResFinder database revealed 31 antimicrobial resistance genes (ARGs) after applying a 90% cutoff minimal gene coverage. The global composition of the resistome, was dominated by beta-lactam resistance genes, which constituted the most abundant class across all samples, followed by tetracycline and lincosamide resistance genes. A similar approach by mapping against the virulence factor database (VFdb) identified only a single virulence-associated gene (Hcp family typeVI secretion system; VFG035808).
Ruminal samples were primarily enriched in tetracycline-associated resistance genes across all experimental states, whereas fecal samples exhibited a higher relative abundance of beta-lactam macrolide, streptogramin B and lincosamide resistance classes, while nitroimidazole resistance displayed relatively similar values between compartments (Figure 1). Aminoglycoside resistance showed low abundance in both compartments, with limited variation across experimental states.
Comparing the three time points representing the changes in dietary regimes, the overall structure of the resistome remained relatively stable, with only minor variations of specific resistance classes. Shannon diversity was consistently higher in ruminal samples than in fecal samples, regardless of the experimental stage (Figure 1 compartment: F = 137.21, p = 1.02 × 10⁻¹²; stage: F = 3.21, p = 0.054; compartment × stage: F = 1.65, p = 0.208), while the observed richness (Sobs) was higher in fecal samples than in ruminal samples, suggesting a greater number of ARGs (Figure 1; compartment F = 10.04, p = 0.0035; stage: F = 4.40, p = 0.021). Temporal variations in abundance did not appear compartment-specific (compartment × state: F = 0.70, p = 0.505; Table S2). Beta diversity also revealed a clear separation by compartment, while the dietary phase showed no effect on the overall resistome composition (compartment: R² = 0.789; F = 157.87; p = 0.001; state: R² = 0.018; F = 1.76; p = 0.216; compartment × state: R² = 0.014; F = 1.37; p = 0.307; Table S2).
Boxplots show the mean CLR-transformed abundance of the major antibiotic resistance classes detected following ResFinder mapping and coverage filtering. Samples are grouped by experimental phase and colored according to digestive compartment (blue for feces and salmon for rumen). Points represent individual samples, boxes indicate the interquartile range, and the horizontal line within each box represents the median. The dashed horizontal line corresponds to a CLR value of zero. Positive CLR values indicate resistance classes that are relatively enriched compared with the average ARG composition of the sample, whereas negative values indicate relatively depleted classes. The bottom-right panel shows resistome alpha diversity across digestive compartments and experimental phases (beginning, midpoint and endpoint), represented by the Shannon diversity index and observed richness (Sobs). Violin plots illustrate the distribution of the data, boxplots indicate the median and interquartile range, and points represent individual samples.
3.3. MAG-Based Profiling of Microbial Communities
We used a non-redundant catalog of 3,012 MAGs, consisting of 72 MAGs from our dataset and 2,940 public MAGs. After removing MAGs that showed a breadth of coverage of 25% or less across all samples, we were left with 1,395 MAGs selected for further analysis (72 MAGs reconstructed in this study and 1,323 publicly available). Of those, 632 MAGs (45.3%) were taxonomically classified.
Mapping of the MAGs to the samples showed that ruminal samples were largely dominated by Prevotella across the three experimental states (Figure S2), with additional contributions from Cryptobacteroides, Fibrobacter and other lower-abundance genera. In contrast, fecal samples displayed a more heterogeneous taxonomic profile, including genera such as Physcosia, Alistipes, Onthomorpha, Cryptobacteroides, Dialister, Colicola and Tidjanibacter (Figure S2). Compartment-specific (core) MAGs were identified based on their prevalence in fecal and ruminal samples (>80% and <25%, respectively). Using the selected prevalence thresholds, no shared core MAGs were detected between the two compartments. In contrast, 171 MAGs were identified as feces-core MAGs, whereas 134 MAGs were identified as rumen-core MAGs. In parallel, indicator species analysis identified 448 feces-specific MAGs and 234 rumen-specific MAGs (Figure S2). Indicator species analyses performed within each digestive compartment to identify MAGs associated with the experimental states detected no indicator MAGs. Likewise, separate comparisons of ruminal and fecal samples at each experimental state revealed no significant compartment-specific indicator MAGs.
Both the Shannon and Sobs indices were significantly higher in fecal samples than in ruminal samples (Figure 2, Table S3), while the effect of diet or the interaction between compartment and diet were significant when comparing the Shannon diversity, but not the observed (Sobs) richness (Table S3). Alpha diversity in feces showed a subtle but steady temporal increase, which did not reflect our 2-step diet manipulation, while ruminal alpha diversity was lower during the midpoint compared to the beginning and endpoint. Temporal variation across the dietary phase had a limited effect on the number of MAGs (Sobs). Beta diversity using the CLR-transformed MAG abundance profiles revealed again a strong separation of samples according to compartment (R² = 0.320; F = 23.50; p = 0.001, Table S3), with fecal and ruminal samples forming two clearly distinct clusters along the first principal component (PC1), which explained 32.91% of the total variance (Figure 2). The experimental state and the compartment × state interaction were significant as well (Table S3). A separate analysis of individual trajectories across experimental states further highlighted this compartment-specific structure (Figure 2). Fecal samples showed broader intra-individual shifts across the experimental phases, whereas ruminal samples remained more tightly grouped, suggesting a more stable MAG composition in the ruminal compartment.
3.4. Metabolic Function
Functional annotation was focused on the prevalence-defined core MAGs. Although slightly fewer rumen-core MAGs were identified when comparing to feces-core MAGs (134 vs 171), the rumen-core group displayed a higher number of annotated functional features. Rumen-core MAGs were associated with 2,464 unique KOs and 230 KEGG modules, and feces-core with 2,019 unique KOs and 205 KEGG modules (Figure 3A). To identify the functions contributing to the differences between fecal and ruminal MAGs, the most highly represented KEGG functional subcategories were compared between the two groups (Table S4).
Both rumen- and feces-core MAGs encoded the major central metabolic pathways, including glycolysis, gluconeogenesis, fatty acid and amino acid biosynthesis. However, the rumen core MAGs consistently exhibited greater functional diversity, with higher KO richness across most KEGG metabolic categories such as amino acid metabolism, metabolism of cofactors and vitamins, the TCA cycle, cobalamin biosynthesis and NADH oxidoreductase (Figure 3A and Table S4).
To complement the KO counts, an abundance-weighted functional profiling of the compartment-core MAGs was carried out on methanogenesis, carbohydrate metabolism, short-chain fatty acid/fatty acid metabolism, amino acid metabolism, vitamin/cofactor metabolism, energy metabolism, nitrogen metabolism and sulfur metabolism (Table S5). These functional groups were selected a priori based on their known relevance to rumen physiology and fermentation (see also Methods). Across most functional groups, the majority of the abundance-weighted signal was carried by MAGs that could not be resolved to the genus level or fell outside the top five contributors ("Other MAGs"), while classified genera such as Prevotella and Fibrobacter contributed comparatively modest, but consistent, fractions across experimental states (Figure 3B).
3.5. Codirectional Changes Between VFAs, pH and Microbial Communities
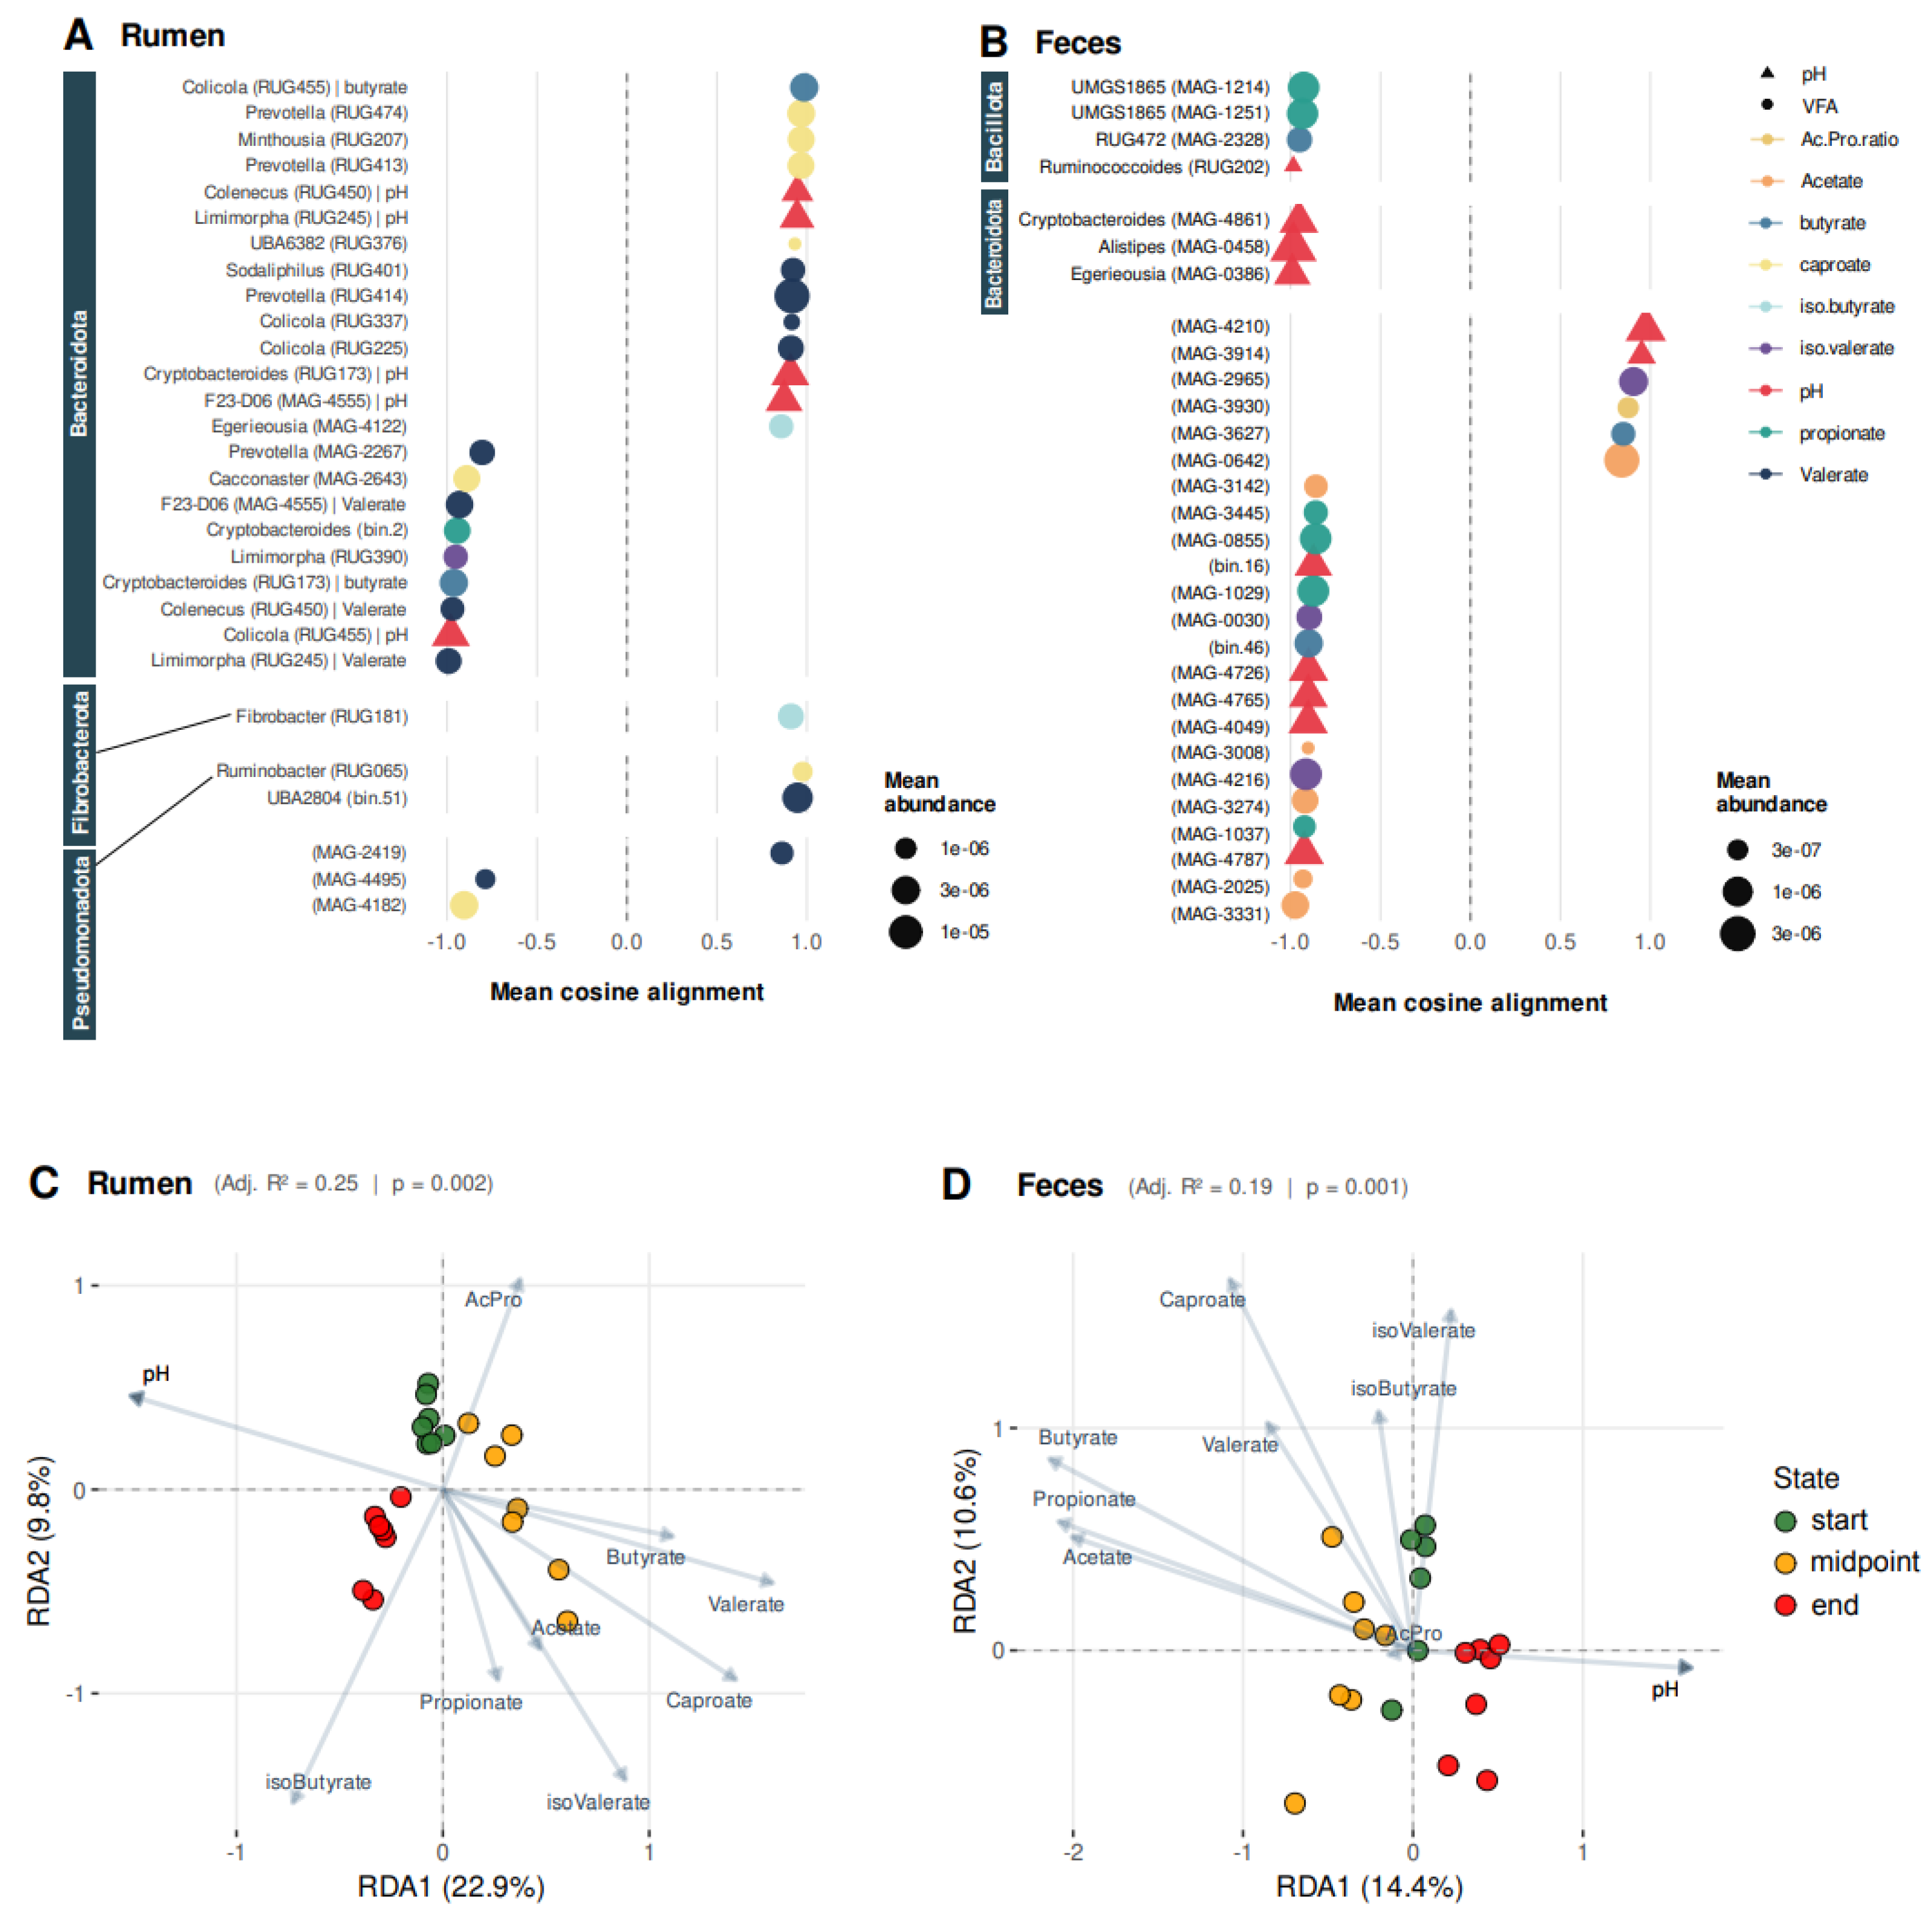
Cosine similarity index highlighted several Bacteroideta MAGs, a few firmicutes and a Fibrobacter MAG as microbial units showing changes in the same direction when examining the pH and several VFA temporal changes. These associations were observed in both ruminal and fecal samples, although many of the fecal MAGs remained taxonomically unclassified. Compounds that showed codirectional changes with microbial profiles included the pH, valerate, butyrate, caproate and iso-butyrate in rumen, and pH, acetate, butyrate, iso-valerate and the acetate/propionate ratio in feces which matched changes in Bacteroidota genera, including Prevotella, Colicola, Limimorpha, Cryptobacteroides and Egerieousia, as well as Fibrobacter which showed a positive association to isobutyrate levels (Figure 4A, 4B). The functional annotation of these MAGs suggested diverse functions related to glycolysis/central carbon metabolism, branched-chain amino acid biosynthesis, fatty acid biosynthesis, acetyl-CoA/acetate handling, pyruvate oxidation and 3-hydroxypropionate/dicarboxylate metabolism.
Redundancy analysis (RDA) showed that physicochemical parameters significantly explained variation in MAG composition in both the rumen (adj. R² = 0.25, p = 0.002) and feces (adj. R² = 0.19, p = 0.001). In both compartments, VFAs and pH were strongly collinear: VFAs alone explained a modest fraction of the variance (9% in rumen, 4% in feces), while pH contributed negligibly on its own ([a] ≈ −0.01 to −0.02), consistent with the expected pH drop driven by VFA accumulation. The RDA biplots (Figure 4C, 4D) showed a clear temporal separation of samples in both compartments. In the rumen, samples taken at the beginning of the experiment clustered homogeneously along RDA1 (22.9%), midpoint samples shifted toward higher butyrate, valerate, caproate and isovalerate, and endpoint samples separated along RDA2 (9.8%) in association with isobutyrate indicating incomplete recovery of the ruminal community. Feces showed a broadly similar temporal trajectory along RDA1 (14.4%) and RDA2 (10.6%): midpoint samples shifted toward butyrate, propionate, acetate and caproate, while endpoint samples moved toward the pH vector rather than returning to baseline, again indicating incomplete recovery.
4. Discussion
In this study the dietary shifts applied to the animals by gradually increasing the concentrate-to-forage ratio did not trigger a sustained SARA state. Nevertheless, our observed contrasting fermentation conditions generated sufficiently distinct contrasts to investigate structured responses in the resistome, virulome and microbiome throughout the experiment. As expected, ruminal pH generally decreased during the first phase (transition towards a concentrate-rich diet), before rising significantly during the second phase (return to the baseline diet) in nearly all animals. However, this variation remained moderate: the pH remained above 5.9 for almost the entire experiment, with the exception of a single measurement of 5.8. On the other hand, our gradual model is more applicable to seasonal transitions (even though the duration of the transition may be short) in the field, as gradual adaptation typically results in less heterogeneity between animals. Dietary shift triggered changes in rumen fermentations, with increases in most of VFA concentrations when cows were fed the high starch diet and a decrease during the second phase, even though the pattern was not consistent across all VFAs measured.
The distinct separation between ARGs in rumen and feces which was observed in our study, has been demonstrated before; Xue et al. (2021) showed that the bovine ruminal resistome is highly individualized and not affected by feed intake. Gaeta et al. (2020) reported progressively higher ARG abundance along the gastrointestinal tract (GIT) (nasopharynx < rumen < feces). Conversely, in a study where SARA was induced, Mu et al. (2021) reported an enrichment in ARGs with a concentrate-rich diet. Thus, the mild dietary effect observed here may reflect the weak impact of our challenge, rather than the resilience of the resistome to dietary variations. These results suggest that compartment-specific factors exert a stronger influence on the composition of the resistome than our dietary manipulation.
There was a notable absence of virulence features suggesting a generally low prevalence of virulence factors within the ruminal and fecal microbiota. This result, although surprising, is consistent with the nature of the bovine gut microbiota under non-intensive farming conditions and in the absence of infection: the rumen and intestine are dominated by non-pathogenic commensal taxa, and virulence genes often carried by sparse pathobiont taxa which are generally below the detection threshold of untargeted metagenomic approaches, as reported before (Teseo et al. 2022). Additionally, it highlights a methodological sensitivity limitation inherent in shotgun sequencing for the detection of rare traits (e.g. STEC or other pathotypes which are usually below the detection limit of shotgun metagenomics) rather than an actual absence of pathogenic potential in these communities.
Similar to the resistome results, compartment was also the primary factor structuring alpha diversity in MAG-based microbial communities. Dietary state had a limited impact on the overall community diversity under the studied conditions, although the latter and the compartment × state interaction were also marginally significant. This contrast suggests that the resistance reservoir (at the class level) remained relatively stable over time, whereas the overall taxonomic structure responded, albeit modestly, to the dietary transition. Beta-diversity suggested that fecal samples showed more pronounced changes than rumen samples, however while rumen samples showed a more subtle but consistent change, fecal samples showed a more variable pattern across animals. Kibegwa et al. (2023) showed that the rumen responds more consistently to the diet than feces, whose changes are often inconsistent with feeding, suggesting that the observed fecal dispersion reflects individual variability instead. The rumen has a more direct link to feed intake, as it is the primary site of feed digestion and nutrient absorption, whereas the intestine is more closely involved in residual nutrient assimilation (Moran 2005). Finally, as dietary transitions in our study occurred more rapidly than the 5–8 weeks possibly required for the microbial community to re-establish equilibrium (Clemmons et al. 2019; Teseo et al. 2022), the ruminal and fecal microbiomes likely did not have sufficient time to fully adapt to either dietary phase before the next transition occurred, thereby attenuating the compositional shifts detected in our analyses.
Our formal statistical comparisons did not identify any MAGs specific to an experimental state, despite the significant condition effect in PERMANOVA. This suggests that the changes we observed were not driven by a handful of bacteria whose abundances changed profoundly, but likely by many small shifts in multiple community members, consistent with a mild dietary perturbation. Additionally, a previous study (Petri et al. 2013), which induced a severe acidosis challenge, showed that microbiome changes were exclusively related to shifts in relative proportions of bacterial genera that were already present in the community. In contrast, prevalence analysis reveals a well-differentiated “core” based on compartment (171 feces-core MAGs, 134 rumen-core MAGs), with no shared core MAGs, confirming strong compartmental specialization consistent with a previous report (Jami and Mizrahi 2012) which showed that the rumen possesses a core set of microbes shared by all cows, though their abundance varies greatly from one animal to another. The above findings are corroborated by the fact that not all animals showed the same changes in pH and VFAs, suggesting host-associated microbial and fermentation patterns. Nevertheless, some MAGs tended to be more associated with some dietary states, such as members of the Fibrobacter, which was not detected during the high concentrate period. Additionally, our exploratory correlation analyses between VFAs and MAGs, identified a codirectional association between Fibrobacter and isobutyrate, a VFA which is known to favour the growth of Fibrobacter in the rumen (Wang et al. 2015). Although this association does not necessarily reflect a consistent decrease in isobutyrate concentrations across all animals, the coordinated variation between these two variables raises the possibility that changes in isobutyrate availability may have contributed to the lower abundance of Fibrobacter observed at the midpoint of our experiment. Considering the importance of Fibrobacter in rumen fiber degradation and digestion (Kobayashi et al. 2008; Suen et al. 2011), these findings highlight that even subtle perturbations of the rumen microbiome, such as those observed in our study, may affect key microbial players and, consequently have meaningful consequences for animal health and productivity.
Despite identifying fewer core MAGs in the rumen than in feces, the rumen core encoded a broader functional repertoire compared to the fecal core. Functional attribution of these pathways to individual taxa further supported that rumen-core MAGs consistently contributed more to the targeted metabolic functions than fecal-core MAGs. At the genus level, Prevotella and Fibrobacter were the most consistent contributors to this functional signal, further highlighting the importance of the Fibrobacter‘s disappearance at the midpoint. Wirth et al. (2018) demonstrated that the rumen functional core of dairy cattle is dominated by members of the genus Prevotella, which covers a large fraction of the essential metabolic functions despite representing a relatively small set of conserved genes. However, a substantial proportion of the predicted functions originated from MAGs that could not be confidently assigned to a known genus. This underscores a limitation of current reference databases for the bovine microbiome, as a substantial proportion of taxa remain unclassified, particularly in compartments other than the rumen.
Finally, our exploratory correlational approaches (cosine index and RDA) suggested that changes in the dietary regime, which resulted in altered physicochemical parameters in the rumen and intestine, may have impacted specific MAGs including some belonging to key taxa (e.g. Fibrobacter). The constrained RDA test suggested that approximately 25% of the variance in the rumen and 19% in feces can be explained by the pH and VFA changes. The pH and VFA were also closely linked (when VFAs accumulate, pH drops), so it is difficult to separate their respective effects. The ordination further suggested that in both rumen and feces, the animal microbiomes moved to opposite directions, when comparing the first (beginning to midpoint) and second phase (midpoint to endpoint). This return trajectory during the second phase resulted in a partial return toward the initial microbiome state, even though the recovery was incomplete, as endpoint samples did not fully overlap with samples collected at the beginning of the experiment in either compartment. We identified several MAGs, including Bacteroidota, Firmicutes, and Fibrobacter, whose variations were consistently associated with those of pH and VFA concentrations across multiple cows, both in the rumen and feces. These MAGs carried genes consistent with VFA production, including pathways involved in glycolysis, branched-chain amino acid and fatty acid biosynthesis, and acetyl-CoA/acetate metabolism, which may contribute to the observed codirectional patterns, although this remains to be determined.
Overall, our results show that altering the forage-to-concentrate ratio, as often occurs in dairy farms, induces subtle but measurable changes in ruminal pH and VFA profiles. These changes took place primarily in the rumen but extended to the intestine and are associated with shifts in the resident microbial communities, suggesting potential consequences for nutrient utilization and digestive function. Although the observed microbial changes were identified through correlational analyses, several affected taxa are known to play key functional roles within the gastrointestinal ecosystem, indicating that even modest alterations in community composition may have important implications for animal health and productivity. Future studies are needed to establish the causal relationships between dietary composition, microbial community dynamics, and host physiological outcomes.
Supplementary Materials
The following supporting information can be downloaded at the website of this paper posted on Preprints.org.
Funding
The project was partially supported by Lallemand SAS in the frame of the Lallemand-INRAE Medis Associated Partnership Laboratory (France).
Ethical Approval
Animal manipulation was conducted in accordance with protocols approved by the French Ministry of Agriculture (authorization number #37961-2022070609451631 v6).
Conflicts of Interests
No competing interests.
Data Availability Statement
Raw sequencing reads are available in the NCBI Sequence Read Archive (https://www.ncbi.nlm.nih.gov/sra) under BioProject accession number PRJNA1475213. Scripts used for analysis and figure generation are available at https://forge.inrae.fr/sapountzis0454medis/dietary-concentrate-shifts-microbiome-changes.
Acknowledgments
The authors would like to thank Matthieu Bouchon, Emilie Raspaille and the staff from UE Herbipôle Marcenat for their very valuable help in the animal experiment.
References
- Andrews, Simon. FastQC A Quality Control Tool for High Throughput Sequence Data. 2010. Available online: http://www.bioinformatics.babraham.ac.uk/projects/fastqc/.
- Bergmann, Gaddy T. Microbial Community Composition along the Digestive Tract in Forage- and Grain-Fed Bison. BMC Veterinary Research 2017, 13. [Google Scholar] [CrossRef] [PubMed]
- Bolger, Anthony M.; Lohse, Marc; Usadel, Bjoern. Trimmomatic: A Flexible Trimmer for Illumina Sequence Data. Bioinformatics (Oxford, England) 2014, 30(15), 2114–20. [Google Scholar] [CrossRef] [PubMed]
- Boudon, Anne; Kwiatkowski, Dimitri; Niderkorn, Vincent; Forano, Evelyne; Nozière, Pierre; Silberberg, Mathieu. Oral-Stomach Sampling to Replace Rumen-Fistulated Lactating Dairy Cows in an Experimental Model of Rumen Dysfunction from High Energy Diet. Veterinary and Animal Science 2026, 33 (September), 100674. [Google Scholar] [CrossRef] [PubMed]
- Buchfink, Benjamin; Xie, Chao; Huson, Daniel H. Fast and Sensitive Protein Alignment Using DIAMOND. Nature Methods 2015, 12(1), 59–60. [Google Scholar] [CrossRef] [PubMed]
- De Cáceres, Miquel; Jansen, Florian; Dell, Noah. Indicspecies: Relationship Between Species and Groups of Sites. V. 1.7.14. 20 July 2023. Available online: https://cran.r-project.org/web/packages/indicspecies/index.html.
- Cantalapiedra, Carlos P.; Hernández-Plaza, Ana; Letunic, Ivica; Bork, Peer; Huerta-Cepas, Jaime. “eggNOG-Mapper v2: Functional Annotation, Orthology Assignments, and Domain Prediction at the Metagenomic Scale.”. Molecular Biology and Evolution 2021, 38(12), 5825–29. [Google Scholar] [CrossRef] [PubMed]
- Chen, Lihong; Yang, Jian; Yu, Jun; et al. VFDB: A Reference Database for Bacterial Virulence Factors. Nucleic Acids Research 2005, 33 (Database issue), D325–328. [Google Scholar] [CrossRef] [PubMed]
- Chen, Xiaodong; Xu, Jingyi; Zhang, Lei; et al. Altered Ruminal Microbiome Tryptophan Metabolism and Their Derived 3-Indoleacetic Acid Inhibit Ruminal Inflammation in Subacute Ruminal Acidosis Goats. Microbiome 2025, 13(1), 215. [Google Scholar] [CrossRef] [PubMed]
- Clausen, Philip T. L. C.; Aarestrup, Frank M.; Lund, Ole. Rapid and Precise Alignment of Raw Reads against Redundant Databases with KMA. BMC Bioinformatics 2018, 19(1), 307. [Google Scholar] [CrossRef] [PubMed]
- Clemmons, Brooke A.; Martino, Cameron; Schneider, Liesel G.; Lefler, Josh; Embree, Mallory M.; Myer, Phillip R. Temporal Stability of the Ruminal Bacterial Communities in Beef Steers. Scientific Reports 2019, 9(1), 9522. [Google Scholar] [CrossRef] [PubMed]
- Conteville, Liliane Costa; da Silva, Juliana Virginio; Andrade, Bruno Gabriel Nascimento; Coutinho, Luiz Lehmann; Palhares, Julio Cesar Pascale; Regitano, Luciana Correia de Almeida. Recovery of Metagenome-Assembled Genomes from the Rumen and Fecal Microbiomes of Bos Indicus Beef Cattle. Scientific Data 2024, 11(1), 1385. [Google Scholar] [CrossRef] [PubMed]
- Diamond, Jared. Evolution, Consequences and Future of Plant and Animal Domestication. Nature 2002, 418(6898), 700–707. [Google Scholar] [CrossRef] [PubMed]
- Dunière, Lysiane; Ruiz, Philippe; Chaucheyras-Durand, Frédérique; et al. Evaluation of Esophageal Tubing and Buccal Swabbing versus Rumen Cannula to Characterize Ruminal Microbiota in Cows Fed Contrasting Diets. Scientific Reports 2025, 15(1), 34582. [Google Scholar] [CrossRef] [PubMed]
- Gaeta; Carrillo, Natalia; Bean, Emily; Miles, Asha Marie; et al. A Cross-Sectional Study of Dairy Cattle Metagenomes Reveals Increased Antimicrobial Resistance in Animals Farmed in a Heavy Metal Contaminated Environment. Frontiers in Microbiology 2020, 11, 590325. [Google Scholar] [CrossRef] [PubMed]
- Hyatt, Doug; Chen, Gwo-Liang; LoCascio, Philip F.; Land, Miriam L.; Larimer, Frank W.; Hauser, Loren J. Prodigal: Prokaryotic Gene Recognition and Translation Initiation Site Identification. BMC Bioinformatics 2010, 11(1), 119. [Google Scholar] [CrossRef] [PubMed]
- Jami, E.; Mizrahi, I. Similarity of the Ruminal Bacteria across Individual Lactating Cows. Anaerobe 2012, 18(3), 338–43. [Google Scholar] [CrossRef]
- Kang, Dongwan D.; Li, Feng; Kirton, Edward; et al. MetaBAT 2: An Adaptive Binning Algorithm for Robust and Efficient Genome Reconstruction from Metagenome Assemblies. PeerJ 2019, 7 (July), e7359. [Google Scholar] [CrossRef] [PubMed]
- Khafipour, Ehsan; Li, Shucong; Plaizier, Jan C.; Krause, Denis O. Rumen Microbiome Composition Determined Using Two Nutritional Models of Subacute Ruminal Acidosis. Applied and Environmental Microbiology 2009, 75(22), 7115–24. [Google Scholar] [CrossRef] [PubMed]
- Kibegwa, Felix M.; Bett, Rawlynce C.; Gachuiri, Charles K.; Machuka, Eunice; Stomeo, Francesca; Mujibi, Fidalis D. Diversity and Functional Analysis of Rumen and Fecal Microbial Communities Associated with Dietary Changes in Crossbreed Dairy Cattle. PLOS ONE 2023, 18(1), e0274371. [Google Scholar] [CrossRef] [PubMed]
- Kobayashi, Y.; Shinkai, T.; Koike, S. Ecological and Physiological Characterization Shows That Fibrobacter Succinogenes Is Important in Rumen Fiber Digestion - Review. Folia Microbiologica 2008, 53(3), 195–200. [Google Scholar] [CrossRef] [PubMed]
- Li, Dinghua; Liu, Chi-Man; Luo, Ruibang; Sadakane, Kunihiko; Lam, Tak-Wah. MEGAHIT: An Ultra-Fast Single-Node Solution for Large and Complex Metagenomics Assembly via Succinct de Bruijn Graph. Bioinformatics 2015, 31(10), 1674–76. [Google Scholar] [CrossRef] [PubMed]
- Lin, Limei; Lai, Zheng; Zhang, Jiyou; Zhu, Weiyun; Mao, Shengyong. The Gastrointestinal Microbiome in Dairy Cattle Is Constrained by the Deterministic Driver of the Region and the Modified Effect of Diet. Microbiome 2023, 11(1). [Google Scholar] [CrossRef] [PubMed]
- Moran, John. “How the Rumen Works.” In Tropical Dairy Farming: Feeding Management for Small Holder Dairy Farmers in the Humid Tropics; CSIRO Publishing, 2005. [Google Scholar]
- Mu, Y. Y.; Qi, W. P.; Zhang, T.; Zhang, J. Y.; Mao, S. Y. Gene Function Adjustment for Carbohydrate Metabolism and Enrichment of Rumen Microbiota with Antibiotic Resistance Genes during Subacute Rumen Acidosis Induced by a High-Grain Diet in Lactating Dairy Cows. Journal of Dairy Science 2021, 104(2), 2087–105. [Google Scholar] [CrossRef] [PubMed]
- Nagaraja, T. G.; Titgemeyer, E. C. Ruminal Acidosis in Beef Cattle: The Current Microbiological and Nutritional Outlook. Journal of Dairy Science 2007, 90 Suppl 1 (June), E17-38. [Google Scholar] [CrossRef] [PubMed]
- Nayfach, Stephen; Pollard, Katherine S. Average Genome Size Estimation Improves Comparative Metagenomics and Sheds Light on the Functional Ecology of the Human Microbiome. Genome Biology 2015, 16(1), 51. [Google Scholar] [CrossRef] [PubMed]
- Olm, Matthew R.; Brown, Christopher T.; Brooks, Brandon; Banfield, Jillian F. dRep: A Tool for Fast and Accurate Genomic Comparisons That Enables Improved Genome Recovery from Metagenomes through de-Replication. The ISME Journal 2017, 11(12), 12. [Google Scholar] [CrossRef] [PubMed]
- Parks, Donovan H.; Imelfort, Michael; Skennerton, Connor T.; Hugenholtz, Philip; Tyson, Gene W. CheckM: Assessing the Quality of Microbial Genomes Recovered from Isolates, Single Cells, and Metagenomes. Genome Research 2015, 25(7), 1043–55. [Google Scholar] [CrossRef] [PubMed]
- Petri, Renee M.; Schwaiger, Tyler; Penner, Greg B.; et al. Characterization of the Core Rumen Microbiome in Cattle during Transition from Forage to Concentrate as Well as during and after an Acidotic Challenge. PloS One 2013, 8(12), e83424. [Google Scholar] [CrossRef] [PubMed]
- Pierce, N. Tessa; Irber, Luiz; Reiter, Taylor; Brooks, Phillip; Brown, C. Titus. Large-Scale Sequence Comparisons with Sourmash. F1000Research 2019, 8 (July), 1006. [Google Scholar] [CrossRef] [PubMed]
- Plaizier, J. C.; Mesgaran, M. Danesh; Derakhshani, H.; et al. Review: Enhancing Gastrointestinal Health in Dairy Cows. Animal: An International Journal of Animal Bioscience 2018, 12(s2), s399–418. [Google Scholar] [CrossRef] [PubMed]
- Plaizier, J. C.; Krause, D. O.; Gozho, G. N.; McBride, B. W. Subacute Ruminal Acidosis in Dairy Cows: The Physiological Causes, Incidence and Consequences. Veterinary Journal (London, England 2008, 176(1), 21–31. [Google Scholar] [CrossRef] [PubMed]
- Sapountzis, Panagiotis; Segura, Audrey; Desvaux, Mickaël; Forano, Evelyne. An Overview of the Elusive Passenger in the Gastrointestinal Tract of Cattle: The Shiga Toxin Producing Escherichia Coli. Microorganisms 2020, 8(6), 6. [Google Scholar] [CrossRef] [PubMed]
- Silberberg, M.; Chaucheyras-Durand, F.; Commun, L.; et al. Repeated Acidosis Challenges and Live Yeast Supplementation Shape Rumen Microbiota and Fermentations and Modulate Inflammatory Status in Sheep. Animal: An International Journal of Animal Bioscience 2013, 7(12), 1910–20. [Google Scholar] [CrossRef] [PubMed]
- Sommer, Andrew J.; Ferrandis-Vila, Marta; Mamerow, Svenja; et al. Impact of Ceftiofur Administration and Escherichia Coli Inoculation on the Calf Fecal Microbiome. mSystems 2026, 11(7), e00501-26. [Google Scholar] [CrossRef] [PubMed]
- Stewart, Robert D.; Auffret, Marc D.; Warr, Amanda; et al. Assembly of 913 Microbial Genomes from Metagenomic Sequencing of the Cow Rumen. Nature Communications 2018, 9. [Google Scholar] [CrossRef] [PubMed]
- Stewart, Robert D.; Auffret, Marc D.; Warr, Amanda; Walker, Alan W.; Roehe, Rainer; Watson, Mick. Compendium of 4,941 Rumen Metagenome-Assembled Genomes for Rumen Microbiome Biology and Enzyme Discovery. Nature Biotechnology 2019, 37(8), 8. [Google Scholar] [CrossRef] [PubMed]
- Suen, Garret; Weimer, Paul J.; Stevenson, David M.; et al. The Complete Genome Sequence of Fibrobacter Succinogenes S85 Reveals a Cellulolytic and Metabolic Specialist. PLoS ONE 2011, 6(4), e18814. [Google Scholar] [CrossRef] [PubMed]
- Teseo, S.; Otani, S.; Brinch, C.; et al. A Global Phylogenomic and Metabolic Reconstruction of the Large Intestine Bacterial Community of Domesticated Cattle. Microbiome 2022, 10(1), 155. [Google Scholar] [CrossRef] [PubMed]
- Tong, Feng; Wang, Teng; Gao, Na L.; et al. The Microbiome of the Buffalo Digestive Tract. Nature Communications 2022, 13(1), 823. [Google Scholar] [CrossRef] [PubMed]
- Wang, C.; Liu, Q.; Zhang, Y. L.; et al. Effects of Isobutyrate Supplementation on Ruminal Microflora, Rumen Enzyme Activities and Methane Emissions in Simmental Steers. Journal of Animal Physiology and Animal Nutrition 2015, 99(1), 123–31. [Google Scholar] [CrossRef] [PubMed]
- Wirth, Roland; Kádár, Gyula; Kakuk, Balázs; et al. The Planktonic Core Microbiome and Core Functions in the Cattle Rumen by Next Generation Sequencing. Frontiers in Microbiology 2018, 9. [Google Scholar] [CrossRef] [PubMed]
- Xue, Ming-Yuan; Xie, Yun-Yi; Zhong, Yi-Fan; Liu, Jian-Xin; Guan, Le Luo; Sun, Hui-Zeng. Ruminal Resistome of Dairy Cattle Is Individualized and the Resistotypes Are Associated with Milking Traits. Animal Microbiome 2021, 3(1), 18. [Google Scholar] [CrossRef] [PubMed]
- Zebeli, Q.; Metzler-Zebeli, B. U. Interplay between Rumen Digestive Disorders and Diet-Induced Inflammation in Dairy Cattle. Research in Veterinary Science 2012, 93(3), 1099–108. [Google Scholar] [CrossRef] [PubMed]
Figure 1.
Resistome structure across digestive compartments and experimental phases.
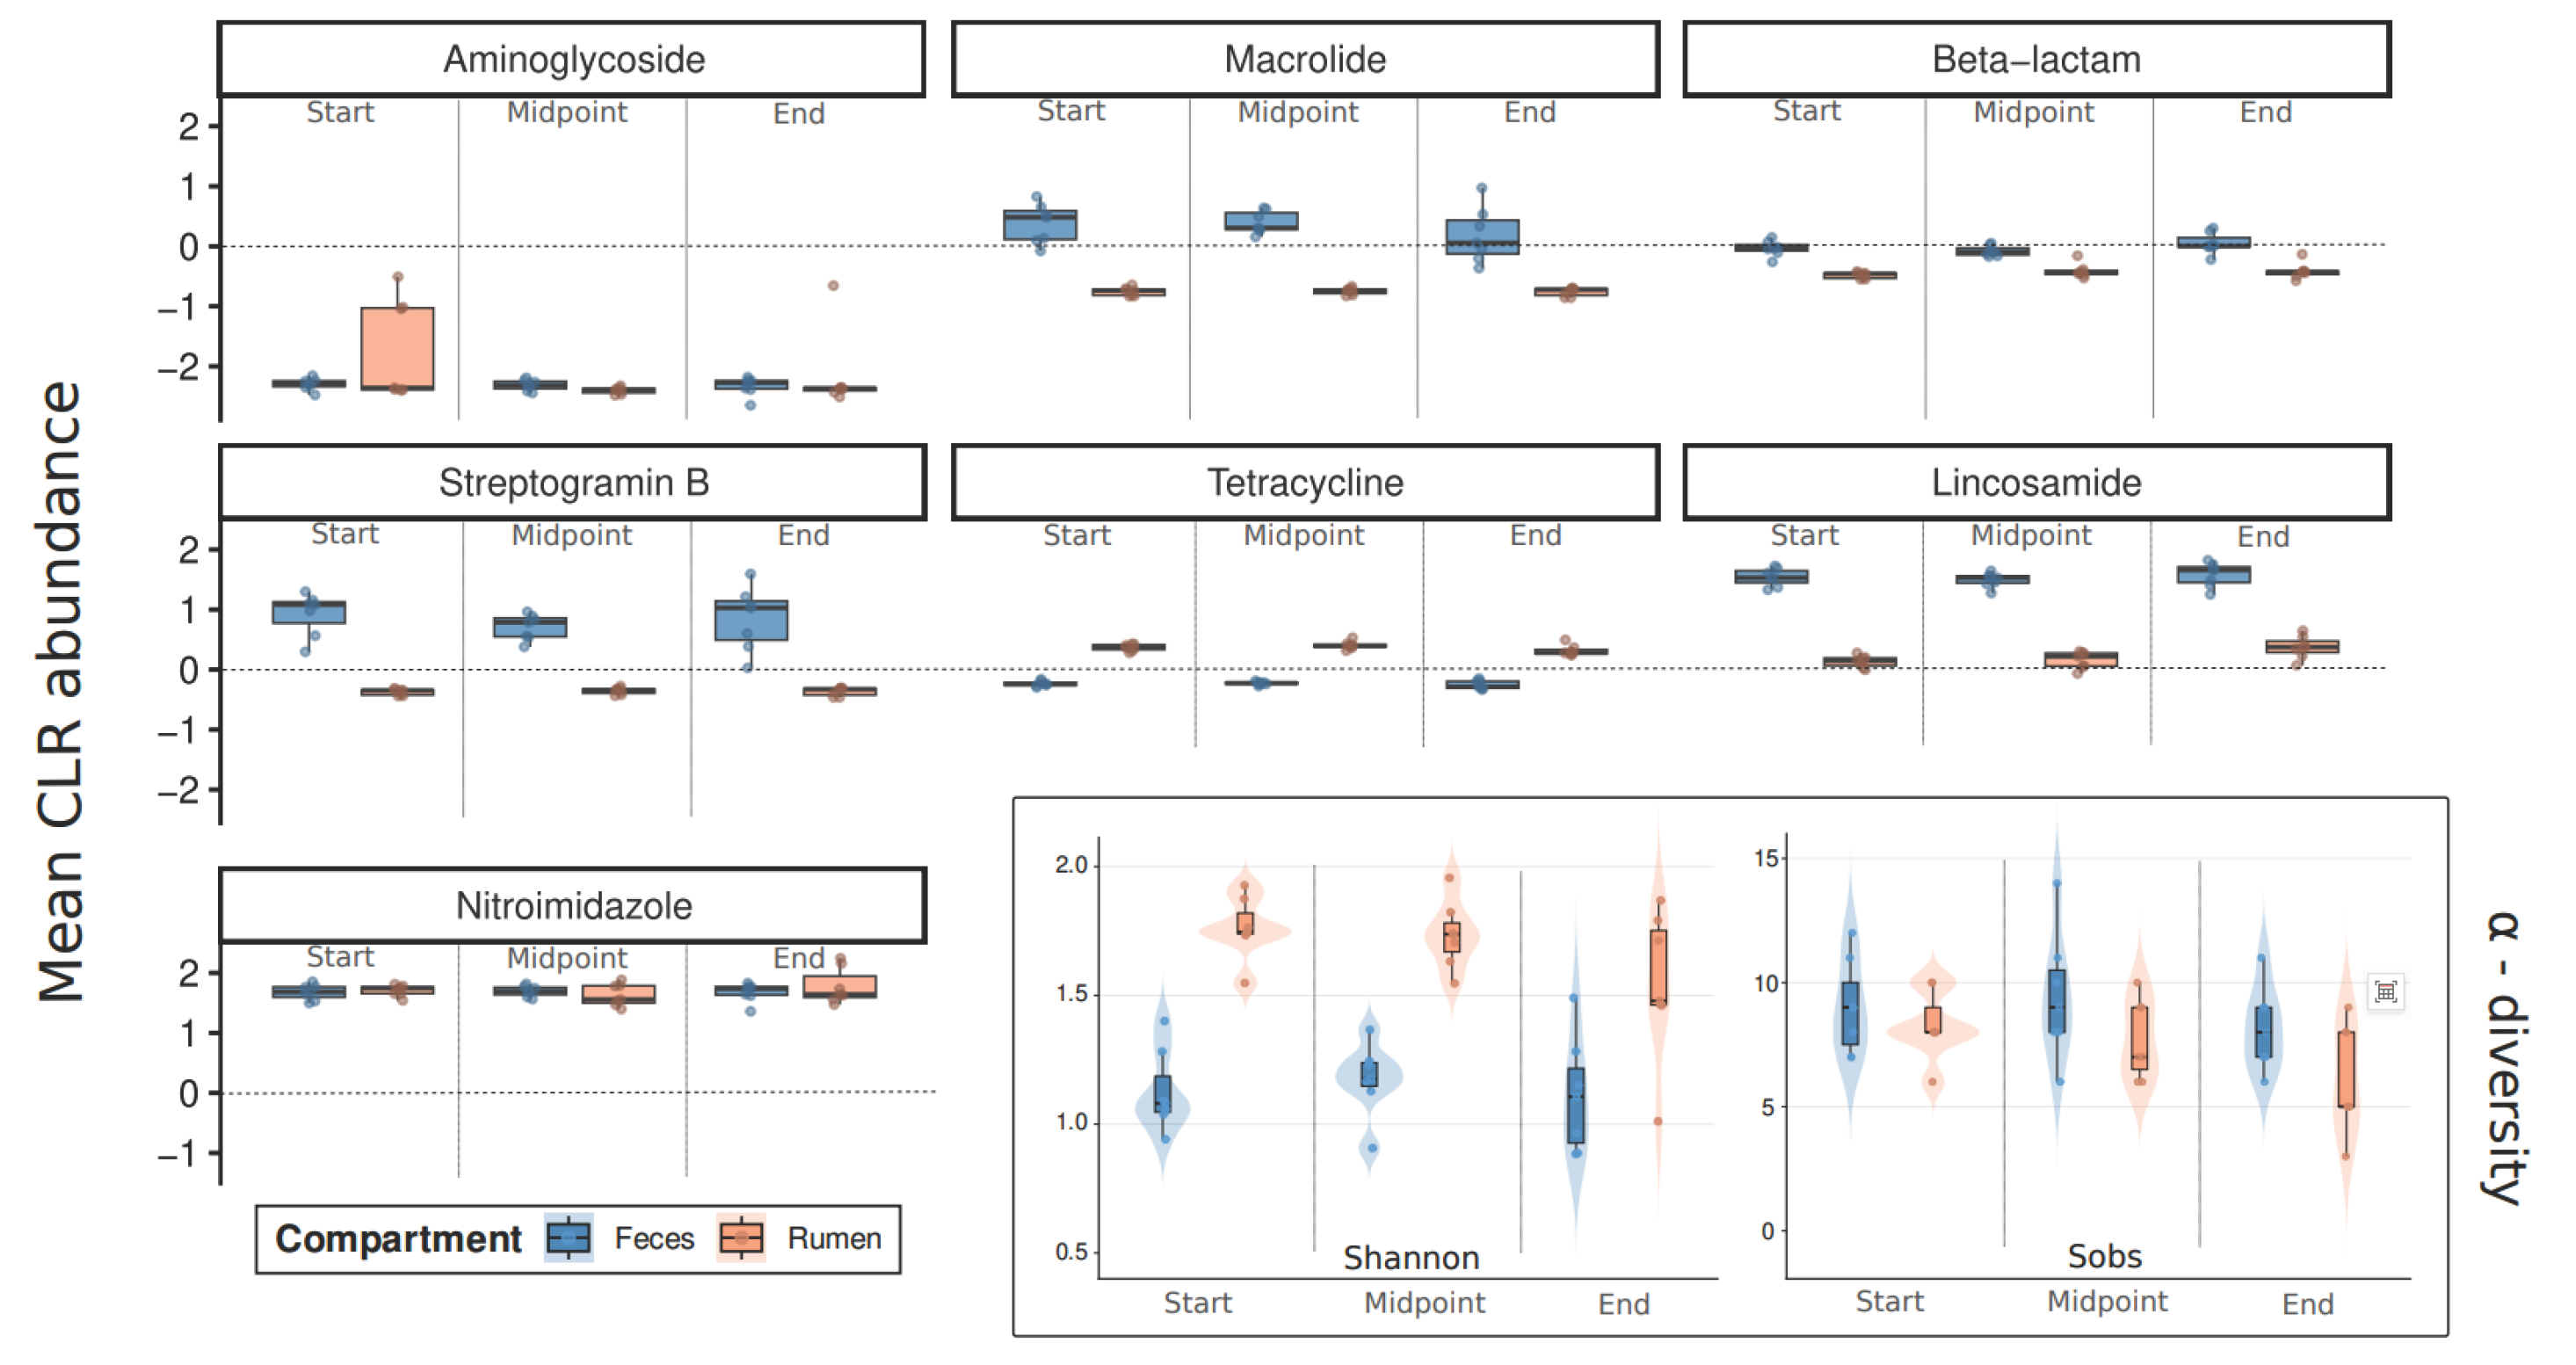
Figure 2.
Composition and diversity of microbial communities reconstructed from metagenome-assembled genomes (MAGs). (A) Principal component analysis (PCA) of microbial communities based on centered log-ratio (CLR)-transformed MAG abundances. Each point represents an individual sample, colored by experimental phase: start (beginning of the experiment), midpoint (end of the first dietary treatment phase and immediately before the second phase), and end (completion of the dietary challenge). Gray lines connect samples from the same animal, illustrating intra-individual changes from the start, through the midpoint, and to the end of the dietary challenge. (B) Alpha diversity of microbial communities reconstructed from MAGs. Diversity was assessed using the Shannon diversity index and observed richness (Sobs) across digestive compartments (feces and rumen) and experimental phases (start, midpoint, and end). Violin plots illustrate the distribution of the data, boxplots indicate the median and interquartile range, and points represent individual samples.
Figure 2.
Composition and diversity of microbial communities reconstructed from metagenome-assembled genomes (MAGs). (A) Principal component analysis (PCA) of microbial communities based on centered log-ratio (CLR)-transformed MAG abundances. Each point represents an individual sample, colored by experimental phase: start (beginning of the experiment), midpoint (end of the first dietary treatment phase and immediately before the second phase), and end (completion of the dietary challenge). Gray lines connect samples from the same animal, illustrating intra-individual changes from the start, through the midpoint, and to the end of the dietary challenge. (B) Alpha diversity of microbial communities reconstructed from MAGs. Diversity was assessed using the Shannon diversity index and observed richness (Sobs) across digestive compartments (feces and rumen) and experimental phases (start, midpoint, and end). Violin plots illustrate the distribution of the data, boxplots indicate the median and interquartile range, and points represent individual samples.
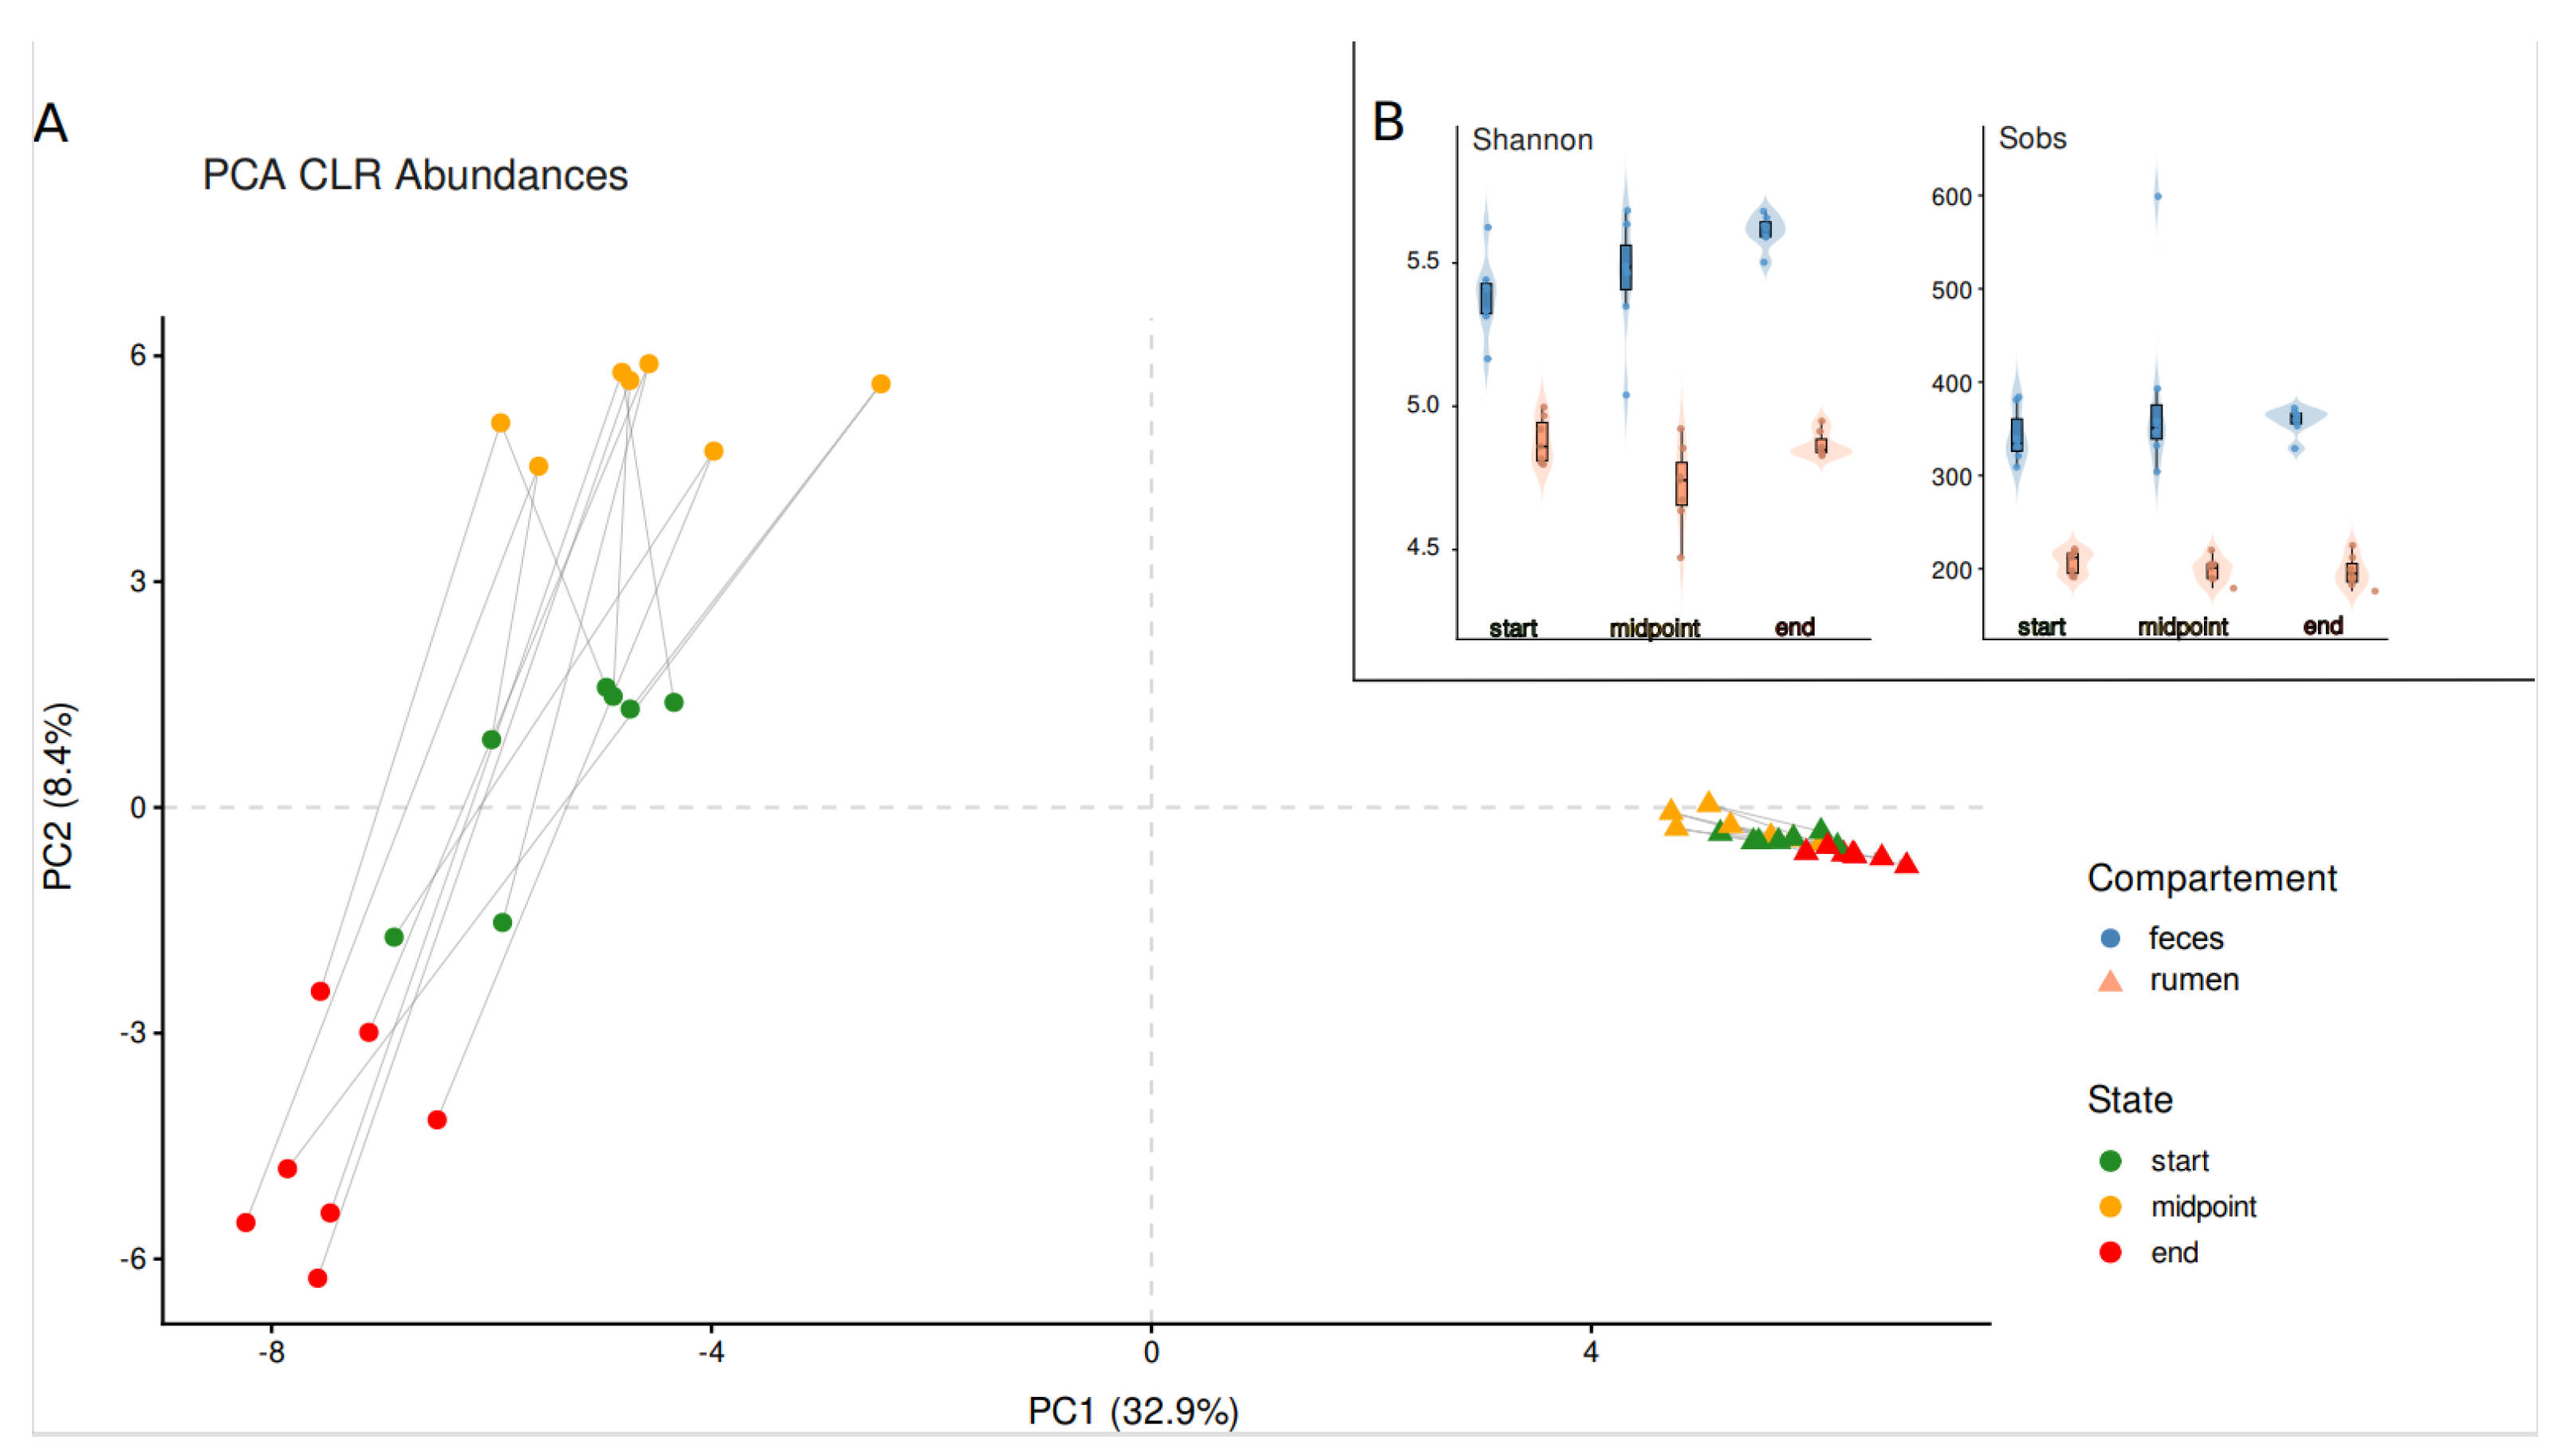
Figure 3.
Functional potential of core MAGs. (A) Functional potential of prevalence-defined feces-core and rumen-core MAGs based on KEGG annotation. Bar plots show the number of unique KEGG Orthology (KO) identifiers assigned to each KEGG functional subcategory in feces-core and rumen-core MAGs. Values indicate the number of unique KOs detected within each core MAG group. Colors denote the digestive compartment (feces or rumen). The total number of core MAGs and unique KOs identified in each compartment-specific core MAG group is indicated in the legend. (B) Abundance-weighted functional profiles of selected relevant functions (see Methods) in prevalence-defined core MAGs. Bars represent the mean abundance-weighted contribution of feces-core (F) and rumen-core (R) MAGs carrying KEGG modules associated with each functional group. The total height of each bar represents the summed abundance of all core MAGs carrying the selected KEGG modules within the corresponding functional group. In each panel, the three pairs (F and R MAGs) of barplots are always ordered by experimental phase (beginning, midpoint, and endpoint) in the same order. To identify the taxa underlying these functional profiles, the five MAGs contributing most to the mean abundance-weighted signal were identified separately for each compartment × experimental phase × functional group combination and were annotated at the genus level. The top five MAGs are shown as the colored portions of the bars, while all other core MAGs are grouped in the light gray portions.
Figure 3.
Functional potential of core MAGs. (A) Functional potential of prevalence-defined feces-core and rumen-core MAGs based on KEGG annotation. Bar plots show the number of unique KEGG Orthology (KO) identifiers assigned to each KEGG functional subcategory in feces-core and rumen-core MAGs. Values indicate the number of unique KOs detected within each core MAG group. Colors denote the digestive compartment (feces or rumen). The total number of core MAGs and unique KOs identified in each compartment-specific core MAG group is indicated in the legend. (B) Abundance-weighted functional profiles of selected relevant functions (see Methods) in prevalence-defined core MAGs. Bars represent the mean abundance-weighted contribution of feces-core (F) and rumen-core (R) MAGs carrying KEGG modules associated with each functional group. The total height of each bar represents the summed abundance of all core MAGs carrying the selected KEGG modules within the corresponding functional group. In each panel, the three pairs (F and R MAGs) of barplots are always ordered by experimental phase (beginning, midpoint, and endpoint) in the same order. To identify the taxa underlying these functional profiles, the five MAGs contributing most to the mean abundance-weighted signal were identified separately for each compartment × experimental phase × functional group combination and were annotated at the genus level. The top five MAGs are shown as the colored portions of the bars, while all other core MAGs are grouped in the light gray portions.
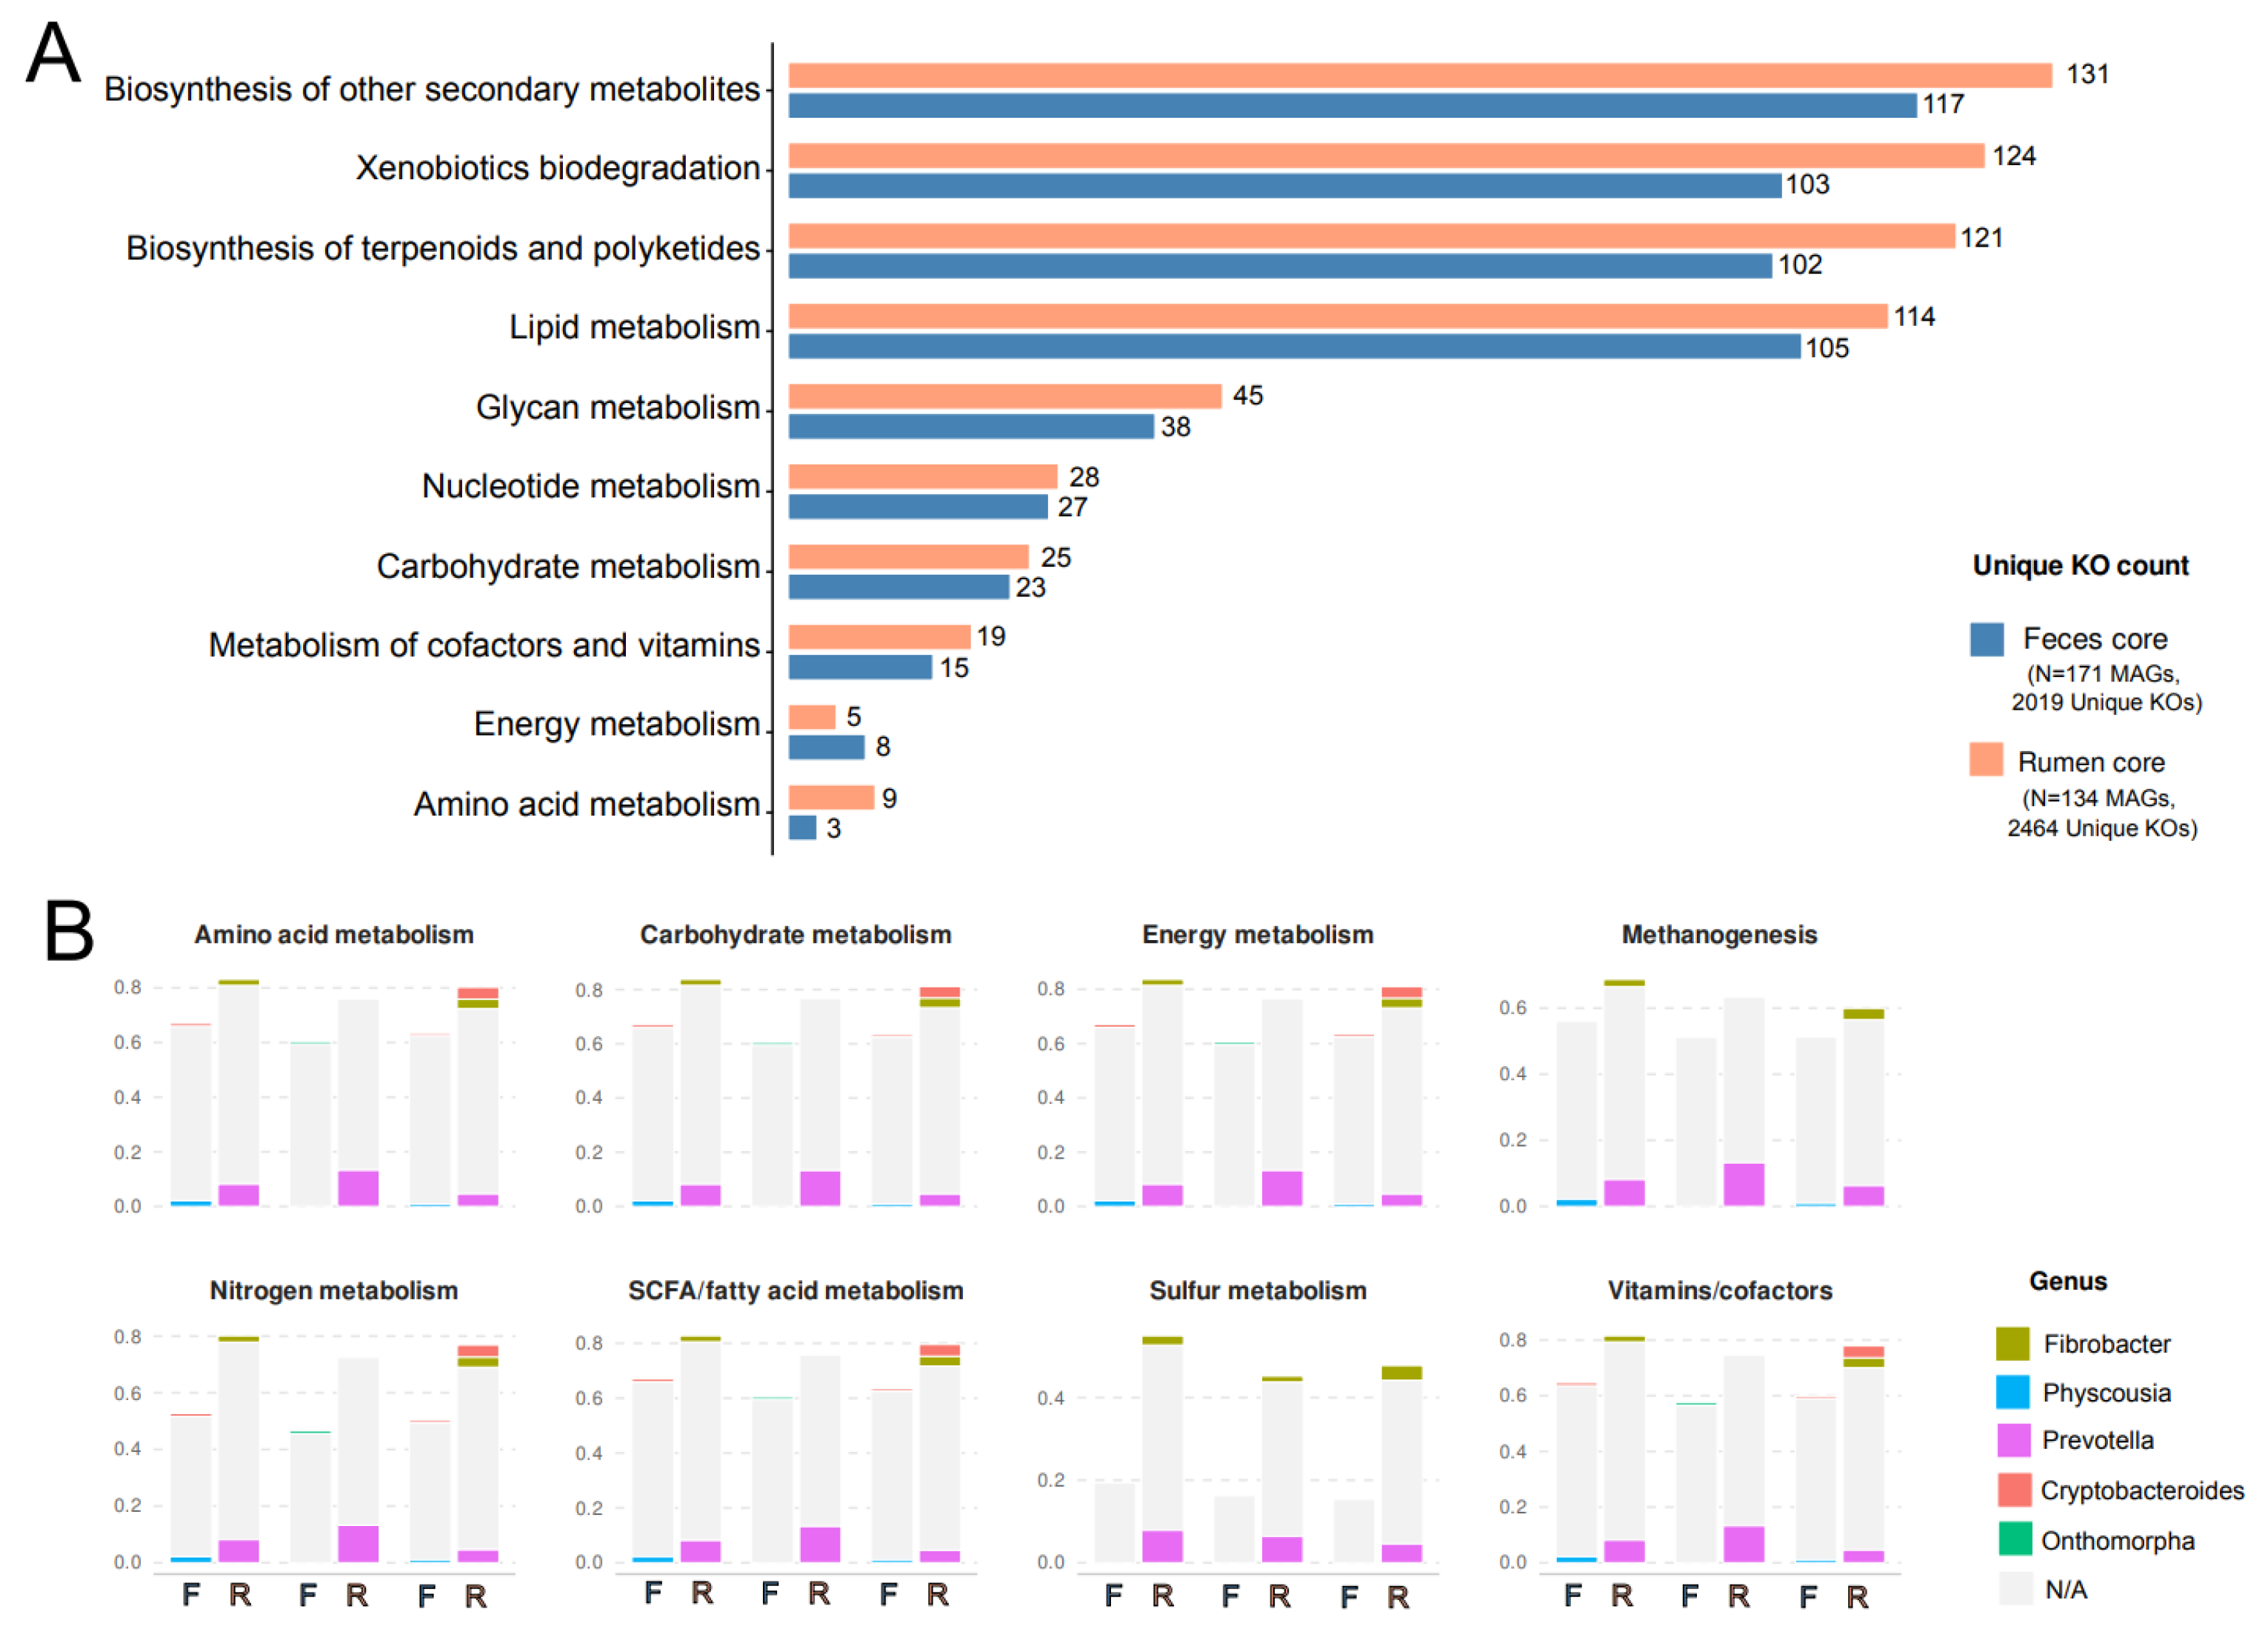
Figure 4.
Associations between MAG dynamics and ruminal fermentation parameters. (A–B) Cosine similarity analysis comparing temporal response vectors of MAG abundances with those of pH and volatile fatty acid (VFA) variables in the rumen (A) and feces (B). MAG trajectories were calculated from CLR-transformed abundances using two consecutive temporal changes: start to midpoint and midpoint to end. Positive cosine values indicate codirectional changes between a MAG and a chemical variable, whereas negative values indicate opposite temporal trajectories. MAG–chemical associations were retained when observed in at least four cows (n = 4), with |mean cosine| > 0.6 and a standard deviation < 0.25. For clarity, only the strongest (highest cosine values) MAG–chemical associations, together with the top pH-associated MAGs, are displayed. Point size represents the mean non-CLR MAG abundance in the corresponding digestive compartment, colors indicate the associated chemical variable, and MAGs are grouped by phylum. (C–D) Redundancy analysis (RDA) of MAG community composition constrained by pH and VFA variables in the rumen (C) and feces (D). Points represent individual samples based on Hellinger-transformed MAG abundances and are colored according to experimental phase (start, midpoint, and end). Arrows indicate the direction and relative strength of each explanatory variable. Percentages on the axes indicate the proportion of constrained variance explained by each RDA axis. The adjusted R² and significance of the global model (999 permutations) are shown above each panel.
Figure 4.
Associations between MAG dynamics and ruminal fermentation parameters. (A–B) Cosine similarity analysis comparing temporal response vectors of MAG abundances with those of pH and volatile fatty acid (VFA) variables in the rumen (A) and feces (B). MAG trajectories were calculated from CLR-transformed abundances using two consecutive temporal changes: start to midpoint and midpoint to end. Positive cosine values indicate codirectional changes between a MAG and a chemical variable, whereas negative values indicate opposite temporal trajectories. MAG–chemical associations were retained when observed in at least four cows (n = 4), with |mean cosine| > 0.6 and a standard deviation < 0.25. For clarity, only the strongest (highest cosine values) MAG–chemical associations, together with the top pH-associated MAGs, are displayed. Point size represents the mean non-CLR MAG abundance in the corresponding digestive compartment, colors indicate the associated chemical variable, and MAGs are grouped by phylum. (C–D) Redundancy analysis (RDA) of MAG community composition constrained by pH and VFA variables in the rumen (C) and feces (D). Points represent individual samples based on Hellinger-transformed MAG abundances and are colored according to experimental phase (start, midpoint, and end). Arrows indicate the direction and relative strength of each explanatory variable. Percentages on the axes indicate the proportion of constrained variance explained by each RDA axis. The adjusted R² and significance of the global model (999 permutations) are shown above each panel.
Disclaimer/Publisher’s Note: The statements, opinions and data contained in all publications are solely those of the individual author(s) and contributor(s) and not of MDPI and/or the editor(s). MDPI and/or the editor(s) disclaim responsibility for any injury to people or property resulting from any ideas, methods, instructions or products referred to in the content. |
© 2026 by the authors. Licensee MDPI, Basel, Switzerland. This article is an open access article distributed under the terms and conditions of the Creative Commons Attribution (CC BY) license (http://creativecommons.org/licenses/by/4.0/).
Copyright: This open access article is published under a Creative Commons CC BY 4.0 license, which permit the free download, distribution, and reuse, provided that the author and preprint are cited in any reuse.