

Submitted:
14 August 2026
Posted:
17 August 2026
You are already at the latest version
Abstract
Ultrasonic communication enables data to be transmitted through electrically conductive barriers where radio-frequency transmission is significantly attenuated. The energy consumption of the communication system is a primary design constraint for the integration into sensor nodes with limited energy resources. Therefore, this contribution presents a low-power, half-duplex ultrasonic transceiver for through-metal communication. Suitable modulation schemes are evaluated on the basis of the acoustic channel impulse response, and a differential phase-shift keying (DPSK) is implemented on an embedded platform. The system establishes a communication link with a data rate of 202 kbps at a carrier frequency of 1.2 MHz through a 1.6 mm thick metal barrier. The experimental results demonstrate an energy efficiency of 233 nJ/bit for the transmitter and 342 nJ/bit for the receiver with a bit error rate of 2.5×10⁻⁷.
Keywords:
acoustic communication
; ultrasonic transducer
; low-power implementation
; through-metal communication
; acoustic channel impulse response
; differential phase-shift keying (DPSK)
; low-power embedded transceiver
; energy per bit
1. Introduction
The global transport of goods relies on standardized shipping containers, which account for a substantial share of freight movement. In recent years, shipping companies have shown growing interest in monitoring these ISO shipping containers with smart sensor systems to improve end-to-end supply chain visibility. Commercially available tracking solutions such as CT 1000 (Orbcomm Inc., Rochelle Park, New Jersey, USA) [1] or Edge (Nexxiot AG, Zurich, Switzerland) [2] are mounted on the outside of a container. Typical functionalities include global positioning and shock detection via acceleration sensing, which can be obtained from the outside. If conditions from inside the container, such as temperature, brightness and further cargo conditions, need to be monitored, a wireless connection from inside to outside of the container is favorable to further transfer data from ISO containers to web-based services. However, when sensors are located inside the metallic enclosure, conventional radio-frequency links are strongly attenuated by the container walls and thus are only feasible to a limited extent [3].
In such cases, acoustic transmission through the container structure represents a promising solution for data transfer. Acoustic communication, combined in some cases with acoustic energy transfer, is being investigated in research for various fields of application. These include energy supply and communication through tissue for biomedical implants [4,5,6,7], underwater communication [8,9,10,11] or through other electrically conductive media such as metals or carbon fiber reinforced polymers (CFRP) [12,13]. In recent research, current systems predominantly utilize laboratory equipment, software-defined radios (SDR), or field-programmable gate arrays (FPGA), for which an estimation of the power requirement is not or only partially possible.
Therefore, our contribution proposes a concept for ultrasonic communication with a low-power implementation for both the transmitter and receiver. We also present a concept for an acoustic transceiver and provide detailed information on the implementation and relevant measurement results. In addition, the energy requirement per bit, as one of the key performance indicators for low-power communication, is evaluated separately for both the transmitter and receiver.
2. Related Work
For battery-operated wireless sensor nodes, minimizing energy consumption is essential to achieve a long operating lifetime. As the communication subsystem is commonly one of the most power-intensive components of a sensor node, examining technologies that enable low-power data transmission in challenging environments is crucial.
For acoustic communication through metal, there are numerous scientific studies, as reviewed by Yang et al. [12], Zhang et al. [14] and recently by Oppermann et al. [15]. These reviews include mostly investigations based on laboratory equipment and provide only partial or no information on energy consumption.
Therefore, the following section reviews studies featuring higher implementation levels of ultrasonic communication through metallic structures that are suitable for low-power operation.

Table 1.
Comparison of ultrasonic communication techniques through metallic structures.
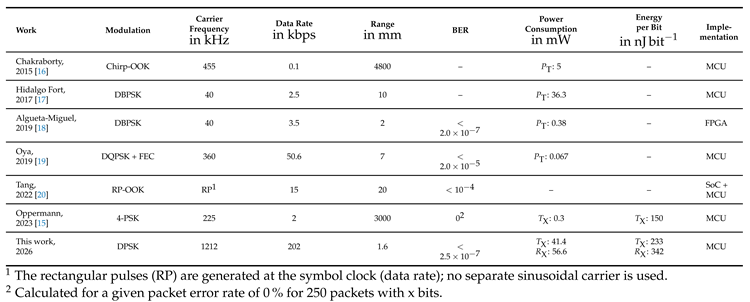 |
In [18], differential phase shift keying (DPSK) was implemented on an FPGA with a final data rate of 1 kbps through a 2 thick steel plate at a carrier frequency of .
Despite the desired power-saving operation, only the power requirement of the transmitting ultrasonic transducer is specified as at .
In [16], energy-saving data transmission was achieved along a meter long steel tube featuring a diameter of meters and a wall thickness of millimeters. For this purpose, a transverse wave was excited and a data rate of 100 bps was achieved with the microcontroller unit (MCU) of the MSP430F2619 (Texas Instruments Inc., Dallas, TX, USA). The carrier frequency of 455 was modulated with chirp-on-off keying (C-OOK), with a chirp bandwidth of 10 , and was non-coherently demodulated after bandpass filtering and amplification. A transmission power of approximately 5 was measured, without further information on the energy requirements of the transmitter or receiver. A minimum bit error rate (BER) of exponent-mode = scientific 0.000001exponent-mode = input is reported from a Monte Carlo simulation, assuming a frequency-independent transmission channel.
In [15], power-saving acoustic simplex communication was implemented using a modulated backscattering with 2-bit phase shift keying (4-PSK). Communication via a 3 long metal carrier achieved a data rate of 2 kbps with a continuous power consumption of less than 300 at the backscattering transponder. This results in an energy requirement of per-mode = symbol 150 /, which was derived for the modulated backscatter of the transmitter by the provided data. However, due to the generation of the carrier signal for the modulated backscatter and the increased complexity of the demodulation, the energy requirement of the receiver will be significantly higher.
Tang et al. developed a system-on-chip (SoC) for structural health monitoring (SHM) of CFRP [20]. The custom SoC with additional MCU uses guided waves for active SHM and integrates ultrasonic power and data transfer. An uplink acoustic communication with a rectangular pulse-based OOK modulation achieves a data rate of 15 kbps up to a distance of 200 with a BER of exponent-mode = scientific 0.00001exponent-mode = input.
Hildago Fort et al. designed and implemented an acoustic communication as a wireless sensor node for intelligent container applications [17]. The prototype realizes a DPSK modulation on an MCU, and demonstrates reliable data transmission at kbps through a 10 mm steel plate. A piezoelectric transducer at a carrier frequency of 40 with an excitation power of is reported.
In an extension to [17], Oya et al. implemented an enhanced ultrasonic communication system based on an orthogonal frequency division multiplexing with 128 carriers (128-OFDM) [19]. It is efficiently realized on an MCU by leveraging harmonic generation and undersampling. On the transmitter side, a 72 excitation is shaped to exploit its 5th-order harmonic, yielding an effective 360 carrier with a reported bandwidth. On the receiver side, the 360 carrier is processed via bandpass filtering and 6th-order subsampling. The system achieves a data rate of kbps through a 7 steel plate with an transmitted power of .
Table 1 provides a detailed overview of these investigations. These studies did not quantify the energy consumption of the entire communication chain, including the transmitter with modulation and the receiver with demodulation, and therefore do not allow for an assessment of the energy requirements. Only one study reported sufficient data on power consumption to allow a calculation of the energy requirement normalized per bit [15].
3. System Overview
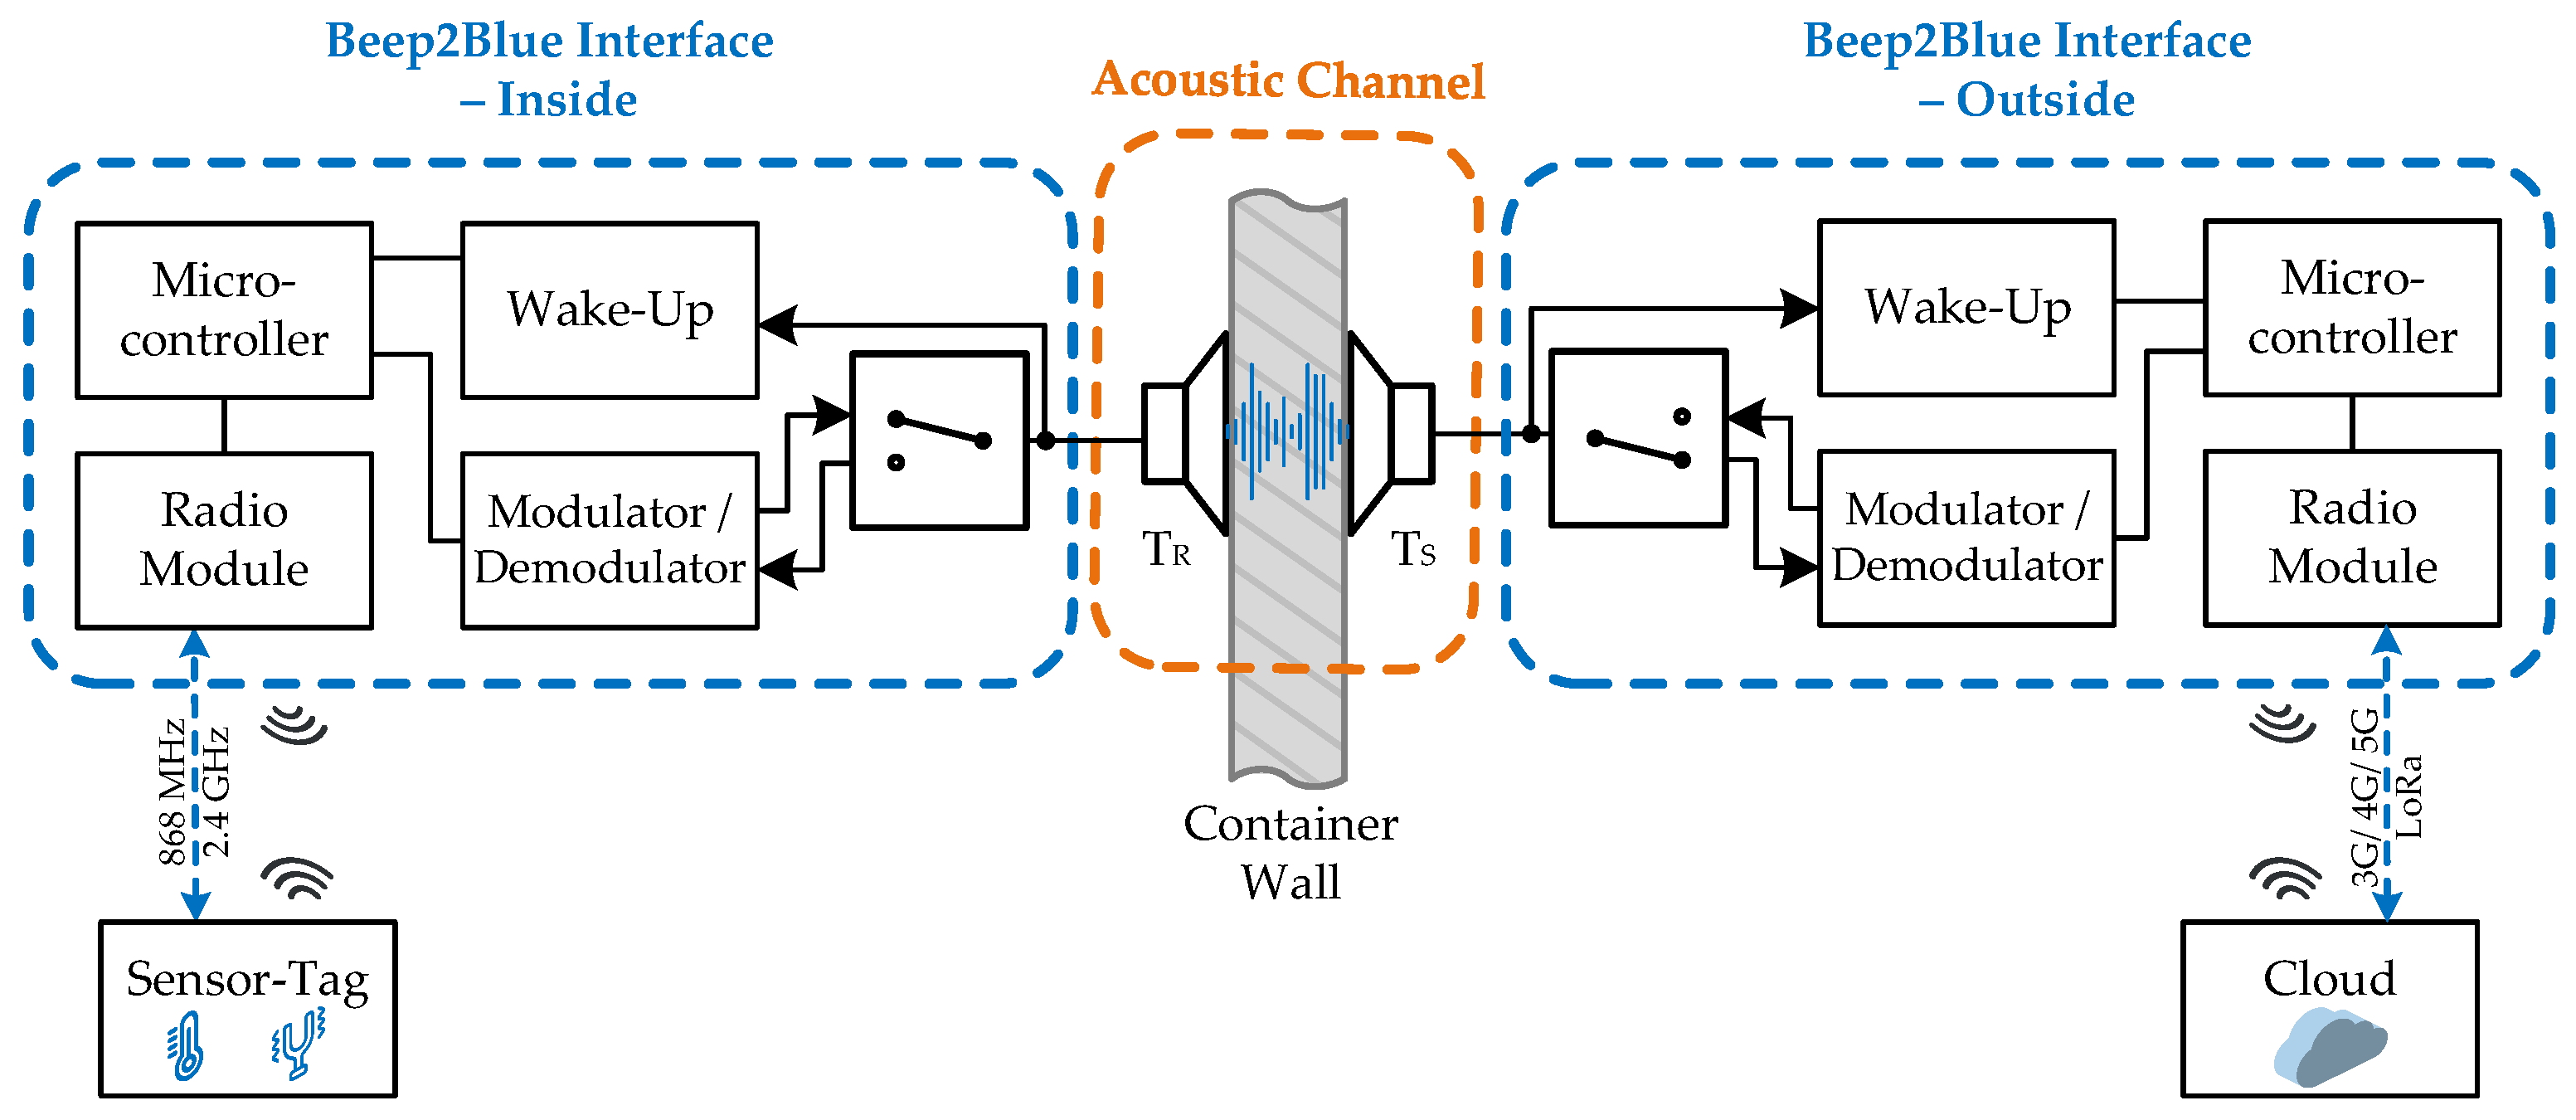
The system architecture that is considered in this contribution is illustrated in Figure 2. A wireless sensor tag located inside the container transmits measurement data to the so called Beep2Blue interface, using either Bluetooth Low Energy (BLE) or a proprietary 868 radio link. This information is then relayed across the metallic container wall via an acoustic communication channel to the exterior environment. On the outside, the ultrasonic interface receives and demodulates the acoustic signal, subsequently forwarding the data via cellular network to a web-based service. Accordingly, the ultrasonic interface is designed to exceed the minimum BLE data rate of 125 /, thereby ensuring sufficient throughput for the communication chain. This approach enables continuous, end-to-end monitoring of containerized supply chains and subsequent data processing for predictive maintenance and event-driven alert detection.
Figure 1.
Schematic overview of the Beep2Blue system concept with the acoustic interface including a high data rate acoustic communication with low power consumption and an acoustic wake-up receiver.
Figure 1.
Schematic overview of the Beep2Blue system concept with the acoustic interface including a high data rate acoustic communication with low power consumption and an acoustic wake-up receiver.
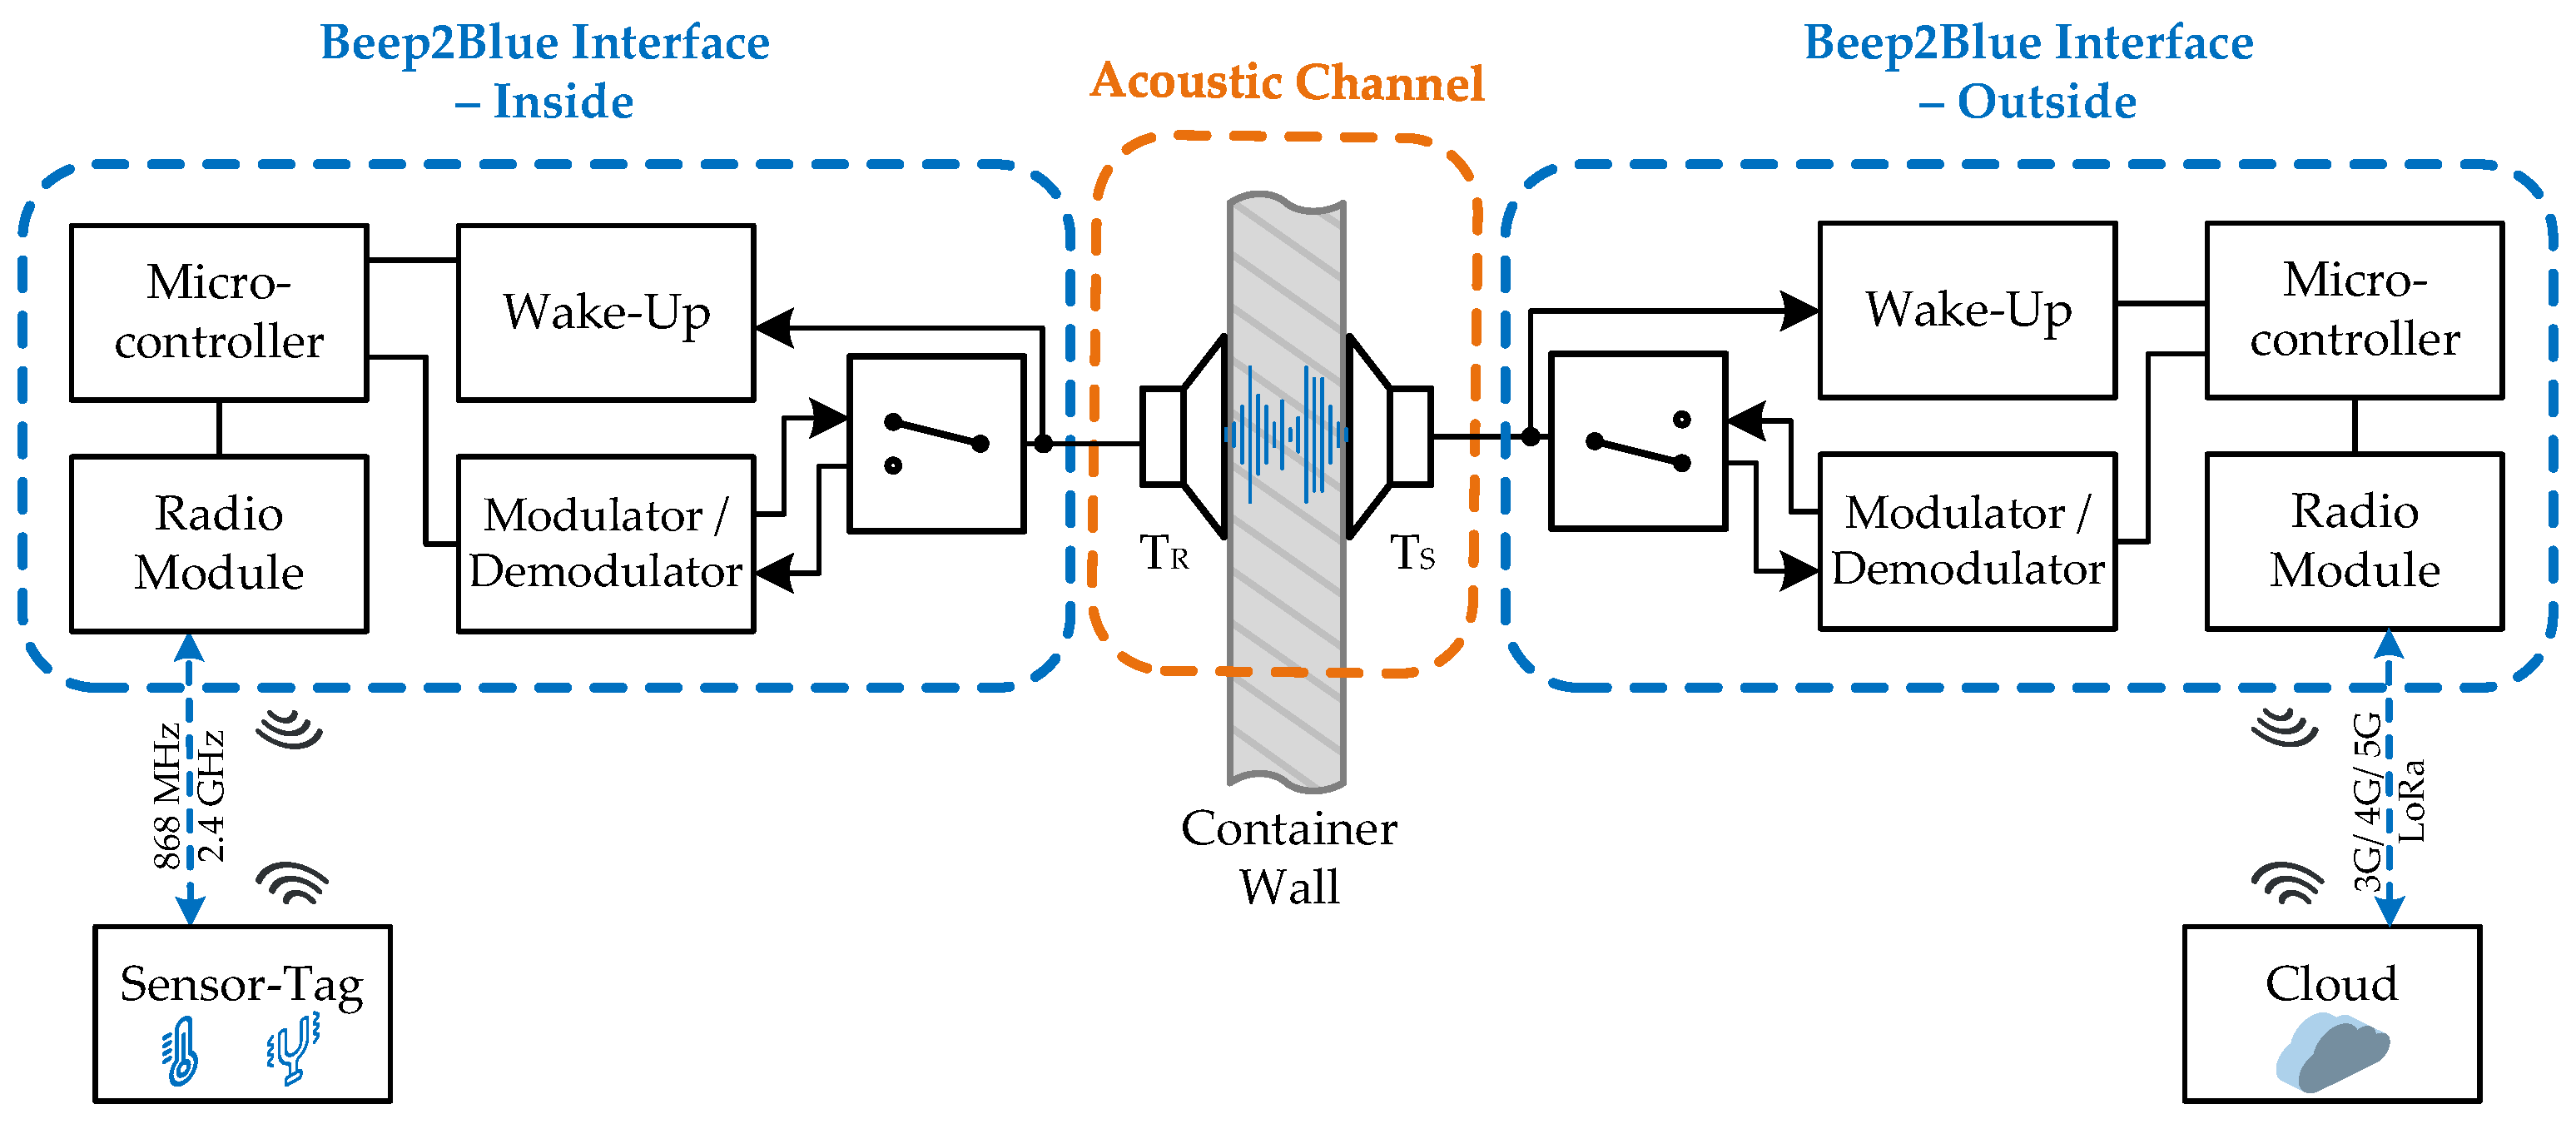
Figure 2.
Schematic overview of the Beep2Blue system concept with the acoustic interface including a high data rate acoustic communication with low power consumption and an acoustic wake-up receiver.
Figure 2.
Schematic overview of the Beep2Blue system concept with the acoustic interface including a high data rate acoustic communication with low power consumption and an acoustic wake-up receiver.
The ultrasonic interface consists of two identical modules. Each module integrates a radio transceiver, an acoustic wake-up receiver, and a microcontroller responsible for the modulation and demodulation of acoustic signals. A compact analog front-end, incorporating a transmit/receive (T/R) switch and a low-noise amplifier, supports the acoustic interface. A bidirectional, half-duplex design with wake-up functionality enables on-demand data acquisition, providing a higher temporal resolution of sensor information when required by advanced analytical algorithms. The low-power wake-up functionality has been reported in [3] through a steel plate with two operation modes at an energy consumption of . A frequency-based wake-up operates up to a sensitivity of at a radial distance of . Furthermore, an ID-based wake-up with OOK modulation yields a sensitivity of at a data rate of kbps and exploits a subcarrier modulation.
Considering that the Beep2Blue interface operates on battery power, its energy resources are limited for both the transmitting and receiving side. Consequently, the system design emphasizes an energy-efficient implementation of a bidirectional, half-duplex communication.
This contribution extends the wake-up functionality in [3] with a low-power, high data rate acoustic communication implemented on an MCU. Therefore, the choice of this hardware and the ultrasonic transducer is constrained by mutual dependencies on previous work.
3.1. Acoustic Communication Channel
The acoustic communication channel is for the system design approximated as a linear time-invariant (LTI) system with
where refers to the transmitted signal, * is the convolution operator, denotes the channel impulse response (CIR) and describes residual additive noise. By applying the Fourier transform operator to both sides of Equation (1), the convolution reduces to a multiplication in the frequency domain with
where , , and denote the Fourier transforms of , , and , respectively.
Channel Impulse Response
An acoustic channel is typically established by two piezoelectric ceramic transducers attached to the transmission medium [21]. In our previous work, this piezoelectric disc transducer had a diameter of 10 and a thickness of 2 [3]. In this prior contribution, the transducer was examined in a finite element simulation and further experimentally evaluated by measuring the insertion loss using a vector network analyzer. A radial mode was obtained at 220 , exhibiting a comparatively broad radiation pattern with 55∘. However, its low center frequency limits the achievable symbol rate, making it unsuitable for the desired data rate. The disc transducer further exhibits a thickness extension mode at with a directive radiation pattern, featuring a focused main lobe and a beamwidth of ∘. This directive behavior requires precise lateral alignment of the transducers on opposite sides of the metal plate within a millimeter range and the influence of lateral misalignment shown in [3].
In this contribution, a time-domain characterization of the channel impulse response was performed using the measurement setup shown in Figure 3. The setup consists of a signal generator, an acoustic channel incorporating two piezoelectric transducers coupled to a metal plate, and an oscilloscope for signal acquisition. Accordingly, the measured CIR describes the complete electro-acoustic channel, whose overall transfer function is given by the product of the transfer functions of the transmitting transducer, the acoustic transmission through the metallic medium, and the receiving transducer. This time-domain CIR approach was selected to support rapid iteration and increased flexibility during system development. Moreover, the same setup enables end-to-end evaluation of modulation schemes by generating modulated waveforms, transmitting them through the acoustic channel, and recording the received signals for subsequent offline demodulation.
A time-domain response has been captured for each of 1000 transmitted impulses. The impulses have been set to a duration of at an amplitude of 10 . Due to the signal generator’s limited excitation bandwidth, the pulse duration was chosen to place the maximum of the first sidelobe of its sinc-shaped spectrum close to the desired carrier frequency. The time domain approach facilitates the separation of the direct response from multipath and ringing effects, and enables statistical evaluation with coherent averaging.
The time-domain response and its corresponding short-time Fourier transform (STFT) in Figure 4 exhibit a highly frequency-dependent channel characteristic with significant multipath interference. The excitation at produces a broadband response, followed by a mode-dependent decay mainly associated with the thickness extension mode at and the radial mode at 220 .
Due to the pronounced directivity of the thickness extension mode, the acoustic energy is primarily reflected along the plate’s thickness. This yields a reverberation time of separate-uncertainty=true , where is defined as the time required for the amplitude to decay by 40 . In contrast, the radial mode couples more efficiently into lateral wave propagation along the metal plate. Consequently, pronounced multipath components caused by reflections at the boundaries of the cutout sample, located at distances of approximately 75 and 150 , are visible as recurrent wave packets. The radial mode exhibits a substantially longer reverberation time of separate-uncertainty=true . The extended decay indicates the comparatively low acoustic attenuation of structural metals, typically on the order of 5/–30/ at 1 [22]. In combination with strong reflections at material boundaries, this creates a confined, highly reflective propagation environment and results in a strongly reverberant acoustic communication channel.
The derived frequency transfer function with magnitude is shown in Figure 4 with its mean frequency response and its standard deviation. A minimum transmission loss can be observed at the thickness extension mode at around with a full width at half maximum bandwidth of 56 . The derived frequency response is consistent with the obtained insertion loss of a vector network analyzer measurement of the same setup, previously reported in [3].
Further environmental influences, such as mechanical vibration and temperature variations, may disturb the acoustic channel. In our previous work in [3], mechanical impulses were applied with a metallic rod to the cutout of the container wall to evaluate mechanically induced interference in the acoustic channel. The mechanically induced disturbances decreased significantly with increasing frequency. For the thickness extension mode at , the noise level increased by less than 4 relative to a noise floor of approximately dBm.
Temperature-dependent measurements of an acoustic channel with a 6 stainless-steel barrier show only minor changes in insertion loss , with variations below 1 at 1 over the temperature range from 30∘C–140∘. The reported setup used a comparable PZT-4 piezoelectric material [23].
3.2. Simulation
The performance of different modulation schemes for ultrasonic acoustic communication is investigated in simulation. The acoustic channel was modeled as a linear time-invariant (LTI) system as described in Equation (1), where modulated transmit signals are convolved with the measured CIR to obtain the received signal. Modulation and demodulation were implemented in MATLAB for each scheme.
The simulation parameters were selected to reflect constraints imposed by a later embedded implementation. In particular, a rectangular waveform with an amplitude of is employed in the simulation, reflecting a direct digital output as typically provided by embedded hardware. Additionally, a comparatively low sampling frequency of 5 was assumed, representing a realistic upper bound for low-power microcontroller-based systems. The performance was evaluated in terms of achievable throughput, while signal robustness was qualitatively assessed using eye diagrams as an indicator of effective signal-to-noise ratio (SNR) after propagation through the acoustic channel.
In the following, three modulation schemes are investigated, namely multiple frequency-shift keying (MFSK), quadrature multiple frequency-shift keying (Q-MFSK), and differential phase-shift keying (DPSK), with the parameter sets summarized in Table 2.
3.2.1. Multiple Frequency-Shift Keying
For the MFSK investigation, a pseudo-random bit sequence was mapped onto M orthogonal sinusoidal frequency tones. The number of tones was gradually increased to . Orthogonality between adjacent tones was ensured by selecting a frequency spacing of , with a symbol duration of 100 , resulting in a of 10 for the 16-FSK configuration.
The resulting signal exhibits an occupied bandwidth of 160 , centered at a carrier frequency of . With a symbol rate of , the achievable bit rate
is 40 kbps [24]. Figure 5 illustrates the simulated received time-domain response for a sequence of symbols with increasing frequency tones. The frequency-dependent transfer characteristic of the acoustic channel is clearly observable, displaying the selective attenuation across the MFSK tones.
At the receiver, a non-coherent demodulation scheme was implemented. For each of the M frequency tones, the received signal is processed by in-phase (I) and quadrature (Q) correlators. The resulting components are squared and summed, yielding a non-coherent energy detector. The energy outputs are normalized per frequency tone with the obtained CIR, and, in the final decision stage, the tone corresponding to the maximum normalized energy is selected, resulting in a successful detection of all symbols. The output of all energy detectors are visualized in an eye diagram over two symbol durations in Figure 5 for 100 transmitted symbols, computed for a sliding window over each sample. The eye diagram shows a clear vertical opening, indicating a high noise margin and reliable symbol detection.
3.2.2. Quadrature Multiple Frequency-Shift Keying
A higher bit rate can be achieved by employing a multitone MFSK scheme, in which Q out of M frequencies are transmitted per symbol. In simulation, the number of simultaneously transmitted frequencies was gradually increased to 5 out of 16 frequency tones (5-16-FSK), resulting in the binomial coefficient with 4369 possible symbols. Therefore, during one symbol interval T,
bits can be transmitted, mapping to 12 bits per symbol for the 5-16-FSK configuration. The frequency spacing, symbol duration, and carrier frequency were kept equal.
Furthermore, the demodulation can be implemented in the same way as in the MFSK scheme, with the exception that the quadrature receiver selects the Q highest values. Figure 6 shows the channel output in the time-domain. Furthermore, the normalized output signal of the non-coherent receiver is visualized in an eye diagram for 130 symbols. All bits were successfully demodulated. However, the eye diagram is significantly degraded, indicating a reduced noise margin at the sampling point and increased horizontal distortion.
3.2.3. Differential Phase-Shift Keying
In addition, a phase-based modulation is evaluated. The sampling rate and carrier frequency are kept constant, while the symbol duration is set by the number of carrier periods per symbol. This parameter is gradually reduced to six, resulting in a symbol duration of and a corresponding bit rate of 208 kbps. A pseudo-random bit sequence is differentially encoded and modulated onto the carrier, and the resulting signal is convolved with the measured channel impulse response. In Figure 7, the time-domain signal can be observed. Due to the high mechanical quality factor of the piezoelectric transducer, a strong transient response can be observed, especially when the phase remains constant over several symbols.
At the receiver, demodulation is performed in a non-coherent and correlation-based method. The received signal is correlated with the previous symbol to obtain the differential phase between adjacent symbols. A phase shift of 180∘ relative to the previous symbol results in a negative correlation value. The correlation output is visualized in the eye diagram in Figure 7 for 300 symbols, normalized to the maximum obtained correlation value. The correlation output is computed for a sliding window over each of the 24 samples per symbol. All bits have been successfully demodulated and the eye remains open in both the horizontal and vertical directions. The transient response of the CIR is clearly visible in the correlation output: when the phase remains constant over two or more consecutive symbols, uncompensated time-domain amplitude variations lead to increased correlation magnitudes. This effect is particularly pronounced for bit sequences such as or , and vice versa.
Discussion
Three modulation schemes with respect to the data rate and the qualitative robustness were examined. Based on these observations, MFSK exhibits a comparatively low bit rate and, therefore, serves primarily as a robust baseline scheme. The improved 5-16-FSK variant increases the achievable bit rate close to the intended minimum data rate of BLE. However, this improvement is accompanied by a noticeably degraded eye diagram. Furthermore, the transmission requires a more complex modulation process and a significantly increased computational effort at the receiver.
In contrast, DPSK enables the highest transmission rates, reaching up to 208 kbps in simulation, which allows dynamic adjustment of the data rate when there is increased interference detected in the communication channel. Although the substantially shorter symbol duration requires more precise sampling timing and synchronization than frequency based modulation methods, it enables a significantly simplified transmitter and receiver algorithm for efficient embedded implementation.
3.3. Implementation Concept of Differential Phase-Shift Keying
The concept of an ultrasonic transceiver with transmit and receive paths is shown schematically in Figure 8. The DPSK modulation is selected, as it allows low-power implementation of modulation and demodulation on an MCU with minimal analog circuitry.
On the transmit path, the XOR gate receives the serial data for modulation on one input and the returned output signal of the gate, delayed by 1 bit, on the second input. The resulting signal is mixed with a carrier frequency . Due to the strong bandpass characteristic of the acoustic channel, a digital output can directly drive the ultrasonic transducer with a rectangular signal shape.
The acoustic signal is received by an identical transceiver in receive mode. After low-pass filtering, amplification, and digitization of the signal, the signal is demodulated. Thereby, the sampled signal is processed with in-phase and quadrature correlators at the carrier frequency to obtain the complex baseband sample for each symbol. For differential demodulation, the current I and Q symbol is multiplied with the previous symbol . The sign of the sum determines the phase change. A constant phase results in a positive value and is coded as the binary value , a negative value determines a change in phase as .
4. System Realization
The concept is implemented on an STM32L476 evaluation board from STMicroelectronics N.V. (Schiphol, Netherlands) with low-power consumption capabilities. Figure 9 shows a photo of two identical acoustic transceivers with coaxially aligned piezoelectric transducers. For evaluation, the transceivers are configured in the firmware as transmitter and receiver, respectively.
Since efficient ultrasonic transmission requires the removal of air between the transducer and the transmission medium, materials such as medical coupling gel, glycerin, honey, and petroleum jelly (Vaseline) are commonly used for temporary coupling, whereas stiff and thin adhesive bond lines are favorable for permanent mounting because they support efficient transfer of elastic waves and limit the aging influence of the coupling layer [22,25,26,27]. Accordingly, the transducers are permanently mounted to a cutout of corrugated sheet metal from a wall of an ISO shipping container with cyanoacrylate adhesive, as its thinner bond line has been shown to yield better ultrasonic coupling than epoxy-based adhesives [27]. For long-term operation under real-world conditions, the adhesive should be selected with respect to its resistance to environmental changes, thermal expansion mismatch, mechanical stability, and aging behavior.
Modulation
The carrier frequency is selected based on the CIR obtained in Figure 4 and on an integer divisor of the MCU’s clock rate with resulting in . The carrier frequency is generated on the MCU by a timer function with pulse width modulation (PWM) at a duty cycle of 50 . The selected carrier remains within the measured channel bandwidth. A digital output is switched at between the supply voltage and ground. Using a self-incrementing register, six periods of a symbol with the same phase are implemented, yielding a data rate of 202 kbps. An interrupt routine is called for the last period of a symbol. The phase to be modulated is calculated from the serial data with XOR and the previous symbol. In the interrupt routine, the polarity of the PWM signal is manipulated accordingly at the end of each symbol to achieve a phase shift, which corresponds to 180∘ in case of a logic to be transmitted. A preamble consisting of a 5-bit Barker sequence is used for initial synchronization, followed by a 500-bit packet with a pseudo-random bit sequence.
Demodulation
In the receiver, direct sampling at is performed with an Analog to Digital Converter (ADC) set to a resolution of 8 bit. The data are stored via direct memory access (DMA). For representation, the received ADC values were retrieved from the MCU and further processed.
A threshold detection is first applied to identify the start of the preamble block with relevant signals shown in Figure 10. The carrier amplitude of the noise floor is determined for 10 symbol periods each consisting of 36 samples with a correlation of the k’s sample of in-phase and quadrature signal with the product to be
The threshold is set to three times the maximum of the carrier amplitude of the noise floor. After the initial threshold detection, a synchronization is achieved with a correlation of a 5-bit Barker sequence consisting of with the received signal. This correlation reaches its maximum at the end of the preamble sequence, defining the subsequent symbol timing reference.
For the demodulation in Figure 11, the I and Q components are computed for each symbol k by correlation. The phase change between two consecutive symbols is then obtained from the dot product of the corresponding components,
which is proportional to and therefore indicates the differential phase. In DPSK demodulation, this sign information is sufficient to decide the transmitted bit, allowing non-coherent detection without carrier phase recovery.
Figure 12 shows the eye diagram obtained after synchronization and symbol alignment at the correlator output for a received power of and . The correlation output is calculated offline with the received ADC samples for a sliding window over each of the 6 periods per symbol. A still clearly open eye can be observed for 6 periods per symbol. Given the transient conditions of the acoustic channel, this data rate provides a sufficient noise margin while maintaining an adequate timing synchronization. The implementation of allows for a lightweight embedded computation, entirely in fixed-point arithmetic.
To mitigate amplitude invariance caused by the channel’s transient response, we employ the normalized differential metric , obtained by scaling the inter-symbol dot product with the magnitudes of the current and previous symbol, with
This normalization removes the amplitude dependence of and yields a robust eye diagram shown in Figure 13, at the expense of additional computational effort due to the required magnitude, square-root, and division operations. Consequently, can be applied selectively at reduced received power levels, where the additional computational effort is traded for improved demodulation robustness. Furthermore, adaptive data-rate reduction could be employed to enhance reliability under low-SNR conditions by increasing the number of carrier periods per symbol and thereby reducing the BER.
5. Results
This section presents the experimental results of the ultrasonic DPSK communication system, including the bit error rate and energy efficiency based on the implementation of . All results were obtained with the measurement setup depicted in Figure 9. For subsequent measurements, the transmitted power was reduced by inserting an adjustable attenuator HP 8494B (Keysight Technologies Inc., Santa Rosa, CA, USA) into the transmitting signal path. The resulting received power was measured at the carrier frequency using an ESU EMI test receiver (Rohde & Schwarz GmbH & Co. KG, Munich, Germany), further described in [3].
Figure 14 presents the measured BER as a function of the received power. For each data point, 2500 packets with each 200 bytes were transmitted. A 95 confidence interval (CI) is indicated, derived from the finite number of observed bit errors assuming a binomial distribution. In the receiver, a demodulation is computed per symbol based on the lightweight implementation of . With a receiver sensitivity of , a BER below is achieved.
The potential communication range is evaluated from the available link margin and the simulated propagation loss of the elastic wave. For this purpose, a finite-element simulation based on [3] was performed for the thickness extension mode to determine the losses caused by both geometrical spreading and material damping. The model consists of a piezoelectric disc transducer with a thickness of 2 and a radius of 5 , coupled to a rotationally symmetric hemispherical solid-metal domain with a radius of 250 . A perfectly matched boundary constraint is applied to eliminate reflections. Since structural metals exhibit attenuation of approximately 5/–30/ at around 1 according to [22], an intermediate damping value of 20 / is modeled. Figure 15 shows the normalized elastic wave’s intensity in the metal as a function of axial distance from the transducer, i.e., along the symmetry axis normal to the transducer’s surface. Since the radius of the planar disc spans several acoustic wavelengths at the thickness extension mode, the emitted wave field is affected by the disc aperture. Contributions from the disc constructively interfere near the transducer surface, producing an apparent focusing behavior before beam spreading and material damping dominate the further decay [21].
With a BER of at a received power of , a link margin of approximately 26 is available relative to the receiver-sensitivity threshold of , corresponding to a BER below . Combining this link margin with the simulated attenuation in Figure 15 results in an estimated communication distance of approximately 205 under free-field condition. The communication distance can be further extended by increasing the transmit power, which can be realized with a low-complexity amplifier stage at the transmitter. In an actual metallic structure, the losses are expected to vary significantly depending on position and frequency due to reflections at material boundaries, mode conversion, and multipath propagation. For practical deployment, this can be addressed by channel sounding techniques to characterize the acoustic channel and enable adaptive adjustment of operating frequency, data rate, and transmit power.
Finally, the energy consumption for the acoustic communication is recorded for a packet with 200 bytes, as shown in Figure 16 at the receiving side. For this purpose, the total consumption is measured separately for the transmitter and receiver. The energy consumption includes modulation and transmission power, respectively, reception, amplification, and demodulation. For the receiver, the power consumption shows a base load dominated by digitization and DMA-based buffering, with an additional increase during batch processing for demodulation. The first processing block is slightly longer due to the initial threshold detection and preamble synchronization. For the transmitter, the power consumption follows a comparatively simple profile, with an approximately constant contribution from the MCU and the transmit path during packet generation. The transmitted electrical power at was calculated to be approximately 8 dBm for the PWM excitation, considering the complex transducer impedance with a magnitude of at . The results of the measurements are summarized in Table 2 with the energy requirement normalized per bit based on the implementation of .
Discussion
Table 1 summarizes the key performance and energy requirements of this contribution. Among the related studies, only [15] reports a power consumption for the complete transmitter, enabling a direct comparison in terms of energy per bit. However, the backscattering approach is limited to a simplex operation and requires the continuous generation of an acoustic carrier signal, resulting in increased computational and energy demand at the receiver. In contrast, the proposed architecture implements a low-power half-duplex transceiver with energy-efficient operation for both the transmitter and receiver, achieving a normalized energy consumption within a similar range. While the demonstrated system is currently limited in operating range and by the transducer’s directivity, these constraints can be addressed by increasing the acoustic transmission power. Furthermore, exploiting the radial mode of an ultrasonic disc transducer enables a more omnidirectional beam pattern, as demonstrated in [3], relevant for a potential deployment.
Moreover, the communication systems can be compared with the spectral efficiency . Since carrier frequencies and data rates span a wide range, the metric is additionally normalized to a fractional-bandwidth to enable a carrier-relative comparison. The fractional-bandwidth is defined as the occupied bandwidth B normalized by the carrier frequency with . As the occupied bandwidth is not reported consistently, it is estimated using the common assumption . Accordingly, the spectral efficiency is defined as , relating the achievable bit rate to the occupied bandwidth B. Consequently, the fractional spectral efficiency expresses the information rate normalized to the carrier frequency and can be interpreted as bits transmitted per carrier cycle.
Across the surveyed studies, the spectral efficiency is primarily dictated by the modulation order: OOK and DBPSK cluster around , whereas QPSK-based schemes reach under the above bandwidth approximation. In contrast, highlights the impact of widely separated carrier frequencies to the achieved data rates. For short communication ranges, low-frequency links exhibit modest due to limited data rates in [17,18,20]. Higher-frequency designs, however, can substantially increase , as shown in [19], indicating higher density of symbol packing relative to the carrier frequency . Among the compared studies, this contribution achieves the highest of 0.167, demonstrating the most efficient normalized spectral bandwidth.
6. Conclusions
In this contribution, suitable methods for wireless acoustic communication through a metallic barrier were examined. For this investigation, the acoustic channel impulse response was measured in the time domain, and MFSK, QMFSK, and DPSK were qualitatively assessed in simulation. Consequently, a half-duplex ultrasonic transceiver was implemented on low-power embedded hardware.
For modulation, an energy-efficient PWM scheme was used to excite the thickness extension mode of a piezoelectric transducer at a carrier frequency of , employing six carrier periods per symbol. At the receiver, the sampled waveform was processed with a non-coherent differential phase demodulator. The energy consumption was averaged over the duration of the transmission and reception of a 1600-bit packet. The resulting energy consumption was measured separately for the transmitter and receiver, including all hardware components. In conclusion, the implemented system achieved an energy efficiency of 233 / for transmission and 342 / for reception at a BER of , enabling battery-powered low-power acoustic communication at a data rate of 202 kbps.
Future work will focus on improving the robustness and reliability of the proposed acoustic communication. In particular, channel sounding techniques will be investigated to enable the system to automatically adapt to a time-varying and frequency-dependent acoustic channel. Furthermore, dynamic data rate adaptions will be incorporated to address degraded channel conditions. Additionally, lightweight error correction techniques to improve link robustness will be implemented. Furthermore, suitable intersymbol interference (ISI) mitigation strategies will be investigated, including nonlinear equalization approaches to compensate for observed transient channel responses.
Author Contributions
Conceptualization, T.S., G.K.J.F. and F.H.; methodology, T.S., G.K.J.F. and F.H.; software, T.S. and T.B.; validation, T.S.; formal analysis, T.S., G.K.J.F and L.M.R.; investigation, T.S. and T.B.; data curation, T.S.; writing—original draft preparation, T.S.; writing—review and editing, T.S., G.K.J.F., J.H., B.S., F.H., L.M.R. and S.J.R.; visualization, T.S.; supervision, F.H., L.M.R. and S.J.R.; project administration, T.S.; funding acquisition, G.K.J.F. and F.H. All authors have read and agreed to the published version of the manuscript.
Funding
This work was supported by the KMU-innovativ initiative of German Federal Ministry of Education and Research (BMBF) under Grant (FKZ) 01IS22005 “Beep2Blue”.
Institutional Review Board Statement
Not applicable.
Informed Consent Statement
Not applicable.
Data Availability Statement
Not specified.
Acknowledgments
Not specified.
Conflicts of Interest
The authors declare no conflicts of interest.
References
- ORBCOMM Inc. CT 1000 Container Monitoring - Datasheet. 2025. [Google Scholar] [PubMed]
- Nexxiot, A.G. Edge - Datasheet. 2023. [Google Scholar] [CrossRef]
- Schaechtle, T.; Fischer, G.K.J.; Helmerich, J.; Häring, I.; Höflinger, F.; Rupitsch, S.J. Advancements in Low-Power Ultrasonic-Based Wake-Up Through Metal. IEEE J. Radio Freq. Identif. 2025, 9, 956–966. [Google Scholar] [CrossRef]
- Basaeri, Hamid; Christensen, David B; Roundy, Shad. A review of acoustic power transfer for bio-medical implants. Smart Mater. Struct. 2016, 25, 123001. [Google Scholar] [CrossRef]
- Helmerich, J.; Schaechtle, T.; Wich, M.; Szabo, B.; Stieglitz, T.; Rupitsch, S.J. Implementation of an Ultrasonic-Based Link for Percutaneous Communications. Curr. Dir. Biomed. Eng. 2023, 9, 170–173. [Google Scholar] [CrossRef]
- Holzapfel, L.; Giagka, V. A Robust Backscatter Modulation Scheme for Uninterrupted Ultrasonic Powering and Back-Communication of Deep Implants. IEEE Trans. Ultrason. Ferroelectr. Freq. Control 2024, 71, 1897–1905. [Google Scholar] [CrossRef] [PubMed]
- Szabo, B.; Helmerich, J.; Schaechtle, T.; Amado-Rey, A.B.; Rupitsch, S.J.; Stieglitz, T. Challenges and Opportunities in Combining Ultrasound and Inductive Coupling for Energy Supply and Bidirectional Data Exchange in Bioelectronics Medicine Implant Networks. Adv. Intell. Syst. 2025. [Google Scholar] [CrossRef]
- Stojanovic, M.; Catipovic, J.A.; Proakis, J.G. Phase-coherent digital communications for underwater acoustic channels. IEEE J. Ocean. Eng. 1994, 19, 100–111. [Google Scholar] [CrossRef]
- Sendra, S.; Lloret, J.; Jimenez, J.M.; Parra, L. Underwater Acoustic Modems. IEEE Sens. J. 2016, 16, 4063–4071. [Google Scholar] [CrossRef]
- Schott, D.J.; Gabbrielli, A.; Xiong, W.; Fischer, G.; Höflinger, F.; Wendeberg, J.; Schindelhauer, C.; Rupitsch, S.J. Asynchronous Chirp Slope Keying for Underwater Acoustic Communication. Sensors 2021, 21, 3282. [Google Scholar] [CrossRef] [PubMed]
- Muzzammil, M.; Kouzayha, N.; Saeed, N.; Al-Naffouri, T.Y. Toward Sustainable Internet of Underwater Things: Unmanned Aerial Vehicle-Aided Energy-Efficient Wake-Up Solutions. IEEE Syst. Man. Cybern. Mag. 2025, 11, 50–60. [Google Scholar] [CrossRef]
- Yang, D.X.; Hu, Z.; Zhao, H.; Hu, H.F.; Sun, Y.Z.; Hou, B.J. Through-Metal-Wall Power Delivery and Data Transmission for Enclosed Sensors: A Review. Sensors 2015, 15, 31581–31605. [Google Scholar] [CrossRef] [PubMed]
- Schaechtle, T.; Aftab, T.; Reindl, L.M.; Rupitsch, S.J. Wireless Passive Sensor Technology through Electrically Conductive Media over an Acoustic Channel. Sensors 2023, 23, 2043. [Google Scholar] [CrossRef] [PubMed]
- Zhang, J.; Yu, Z.; Yang, H.; Wu, M.; Yang, J. Ultrasonic Wireless Communication Through Metal Barriers. Sound&Vibration 2019, 53, 2–15. [Google Scholar] [CrossRef]
- Oppermann, P.; Renner, B.C. Acoustic Backscatter Communication and Power Transfer for Batteryless Wireless Sensors. Sensors 2023, 23, 3617. [Google Scholar] [CrossRef] [PubMed]
- Chakraborty, S.; Saulnier, G.J.; Wilt, K.W.; Curt, E.; Scarton, H.A.; Litman, R.B. Low-power, low-rate ultrasonic communications system transmitting axially along a cylindrical pipe using transverse waves. IEEE Trans. Ultrason. Ferroelectr. Freq. Control 2015, 62, 1788–1796. [Google Scholar] [CrossRef] [PubMed]
- Hidalgo Fort, E.; Garcia Oya, J.R.; Munoz Chavero, F.; Gonzalez Carvajal, R. Intelligent Containers Based on a Low-Power Sensor Network and a Non-Invasive Acquisition System for Management and Tracking of Goods. IEEE Trans. Intell. Transp. Syst. 2018, 19, 2734–2738. [Google Scholar] [CrossRef]
- Algueta-Miguel, J.M.; Garcia-Oya, J.R.; Lopez-Martin, A.J.; de La Cruz Blas, C.A.; Munoz Chavero, F.; Hidalgo-Fort, E. Low-Power Ultrasonic Front End for Cargo Container Monitoring. IEEE Trans. Instrum. Meas. 2020, 69, 3348–3358. [Google Scholar] [CrossRef]
- Garcia Oya, J.R.; Algueta Miguel, J.M.; Garcia Doblado, J.; Munoz Chavero, F.; Hidalgo Fort, E.; Baena Lecuyer, V.; Lopez Martin, A.J. Subsampling OFDM-Based Ultrasonic Data Communication Through Metallic Channels for Monitoring of Cargo Containers. IEEE Trans. Intell. Transp. Syst. 2019, 20, 4245–4250. [Google Scholar] [CrossRef]
- Tang, X.; Mandal, S.; Ozdemir, T. A CMOS SoC for Wireless Ultrasonic Power/Data Transfer and SHM Measurements on Structures. IEEE Access 2022, 10, 110163–110180. [Google Scholar] [CrossRef]
- Rupitsch, S.J. Piezoelectric Sensors and Actuators: Fundamentals and Applications; SpringerLink Bücher, Springer Berlin Heidelberg: Berlin, Heidelberg, 2019. [Google Scholar] [CrossRef]
- Ono, K. A Comprehensive Report on Ultrasonic Attenuation of Engineering Materials, Including Metals, Ceramics, Polymers, Fiber-Reinforced Composites, Wood, and Rocks. Appl. Sci. 2020, 10, 2230. [Google Scholar] [CrossRef]
- Camerini, I.G.; de Souza, L.P.B.; Gouvea, P.M.P.; Braga, A.M.B. Mechanical Strain, Temperature, and Misalignment Effects on Data Communication between Piezoceramic Ultrasonic Transducers. Sensors 2024, 24, 5561. [Google Scholar] [CrossRef] [PubMed]
- Sklar, B. Digital Communications: Fundamentals and Applications; Pearson, 2021. [Google Scholar]
- Gao, W.; Chen, Y.; Liu, W. Research and optimum selection of coupling agent materials in ultrasonic measurement. J. Mater. Res. Technol. 2023, 26, 1006–1015. [Google Scholar] [CrossRef]
- Xu, R.; Beltrán-Gutiérrez, R.E.; Käding, M.; Lange, A.; Marx, S.; Ostermann, J. Frequency dependent amplitude response of different couplant materials for mounting piezoelectric sensors. NDT E Int. 2024, 141, 102993. [Google Scholar] [CrossRef]
- Mustapha, S.; Ye, L. Bonding Piezoelectric Wafers for Application in Structural Health Monitoring–Adhesive Selection. Res. Nondestruct. Eval. 2015, 26, 23–42. [Google Scholar] [CrossRef]
Figure 3.
Measurement setup for channel impulse response characterization of the acoustic channel in time domain.
Figure 3.
Measurement setup for channel impulse response characterization of the acoustic channel in time domain.
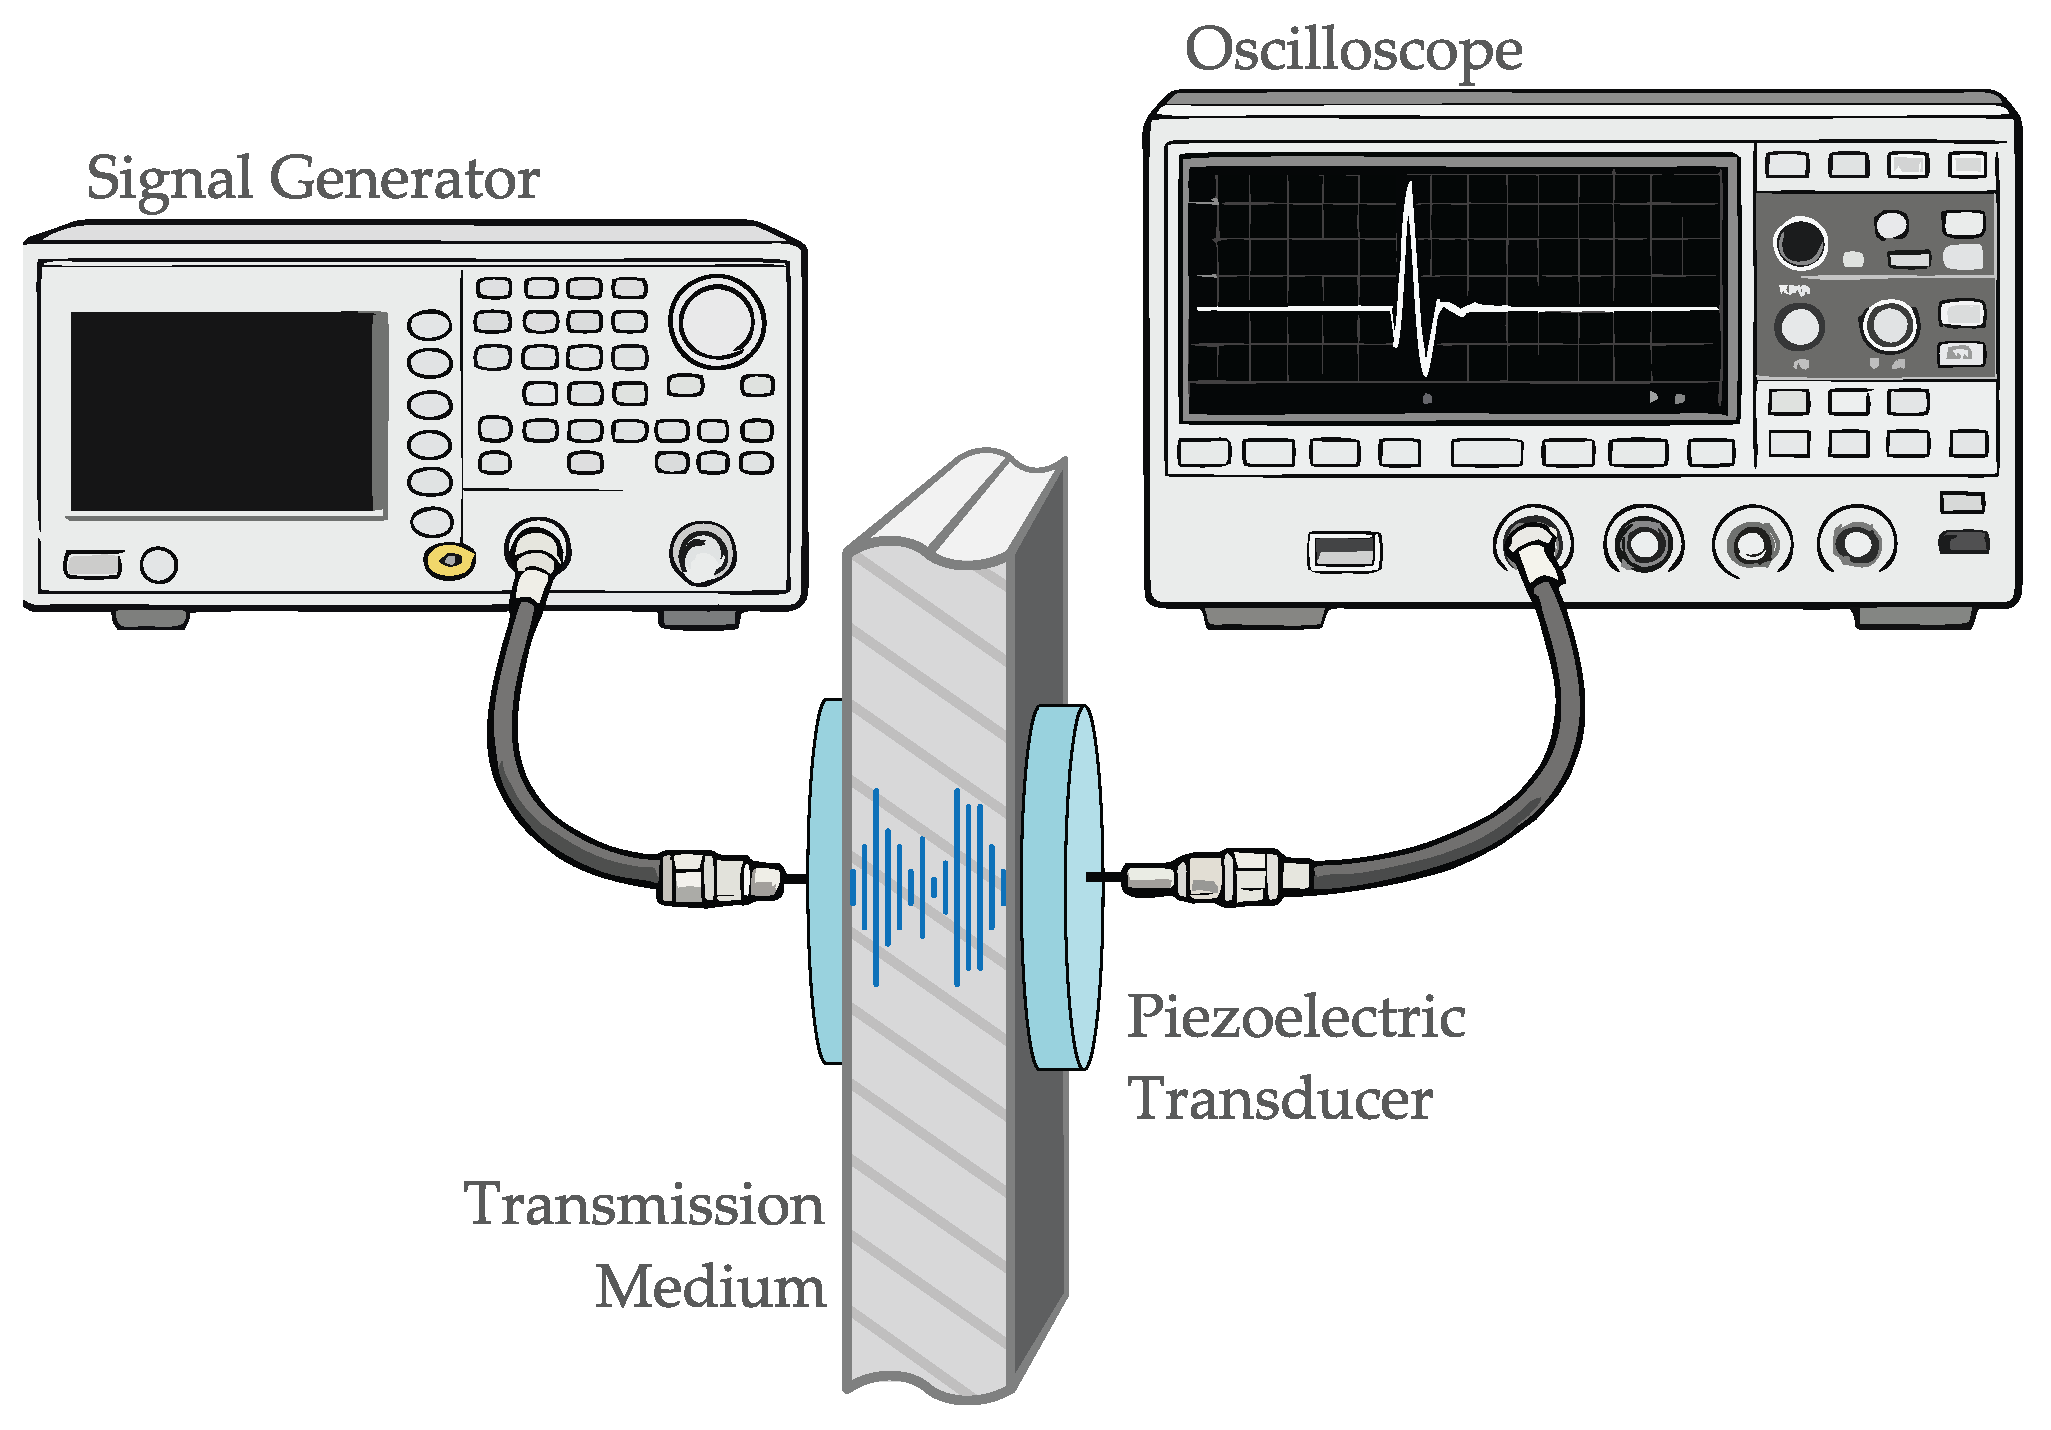
Figure 4.
Measurement result of the channel impulse response with the time domain signal of one impulse (top), its short-time Fourier transform (middle), and the frequency response of 1000 impulses with its mean and standard deviation (re 1 V) (bottom).
Figure 4.
Measurement result of the channel impulse response with the time domain signal of one impulse (top), its short-time Fourier transform (middle), and the frequency response of 1000 impulses with its mean and standard deviation (re 1 V) (bottom).
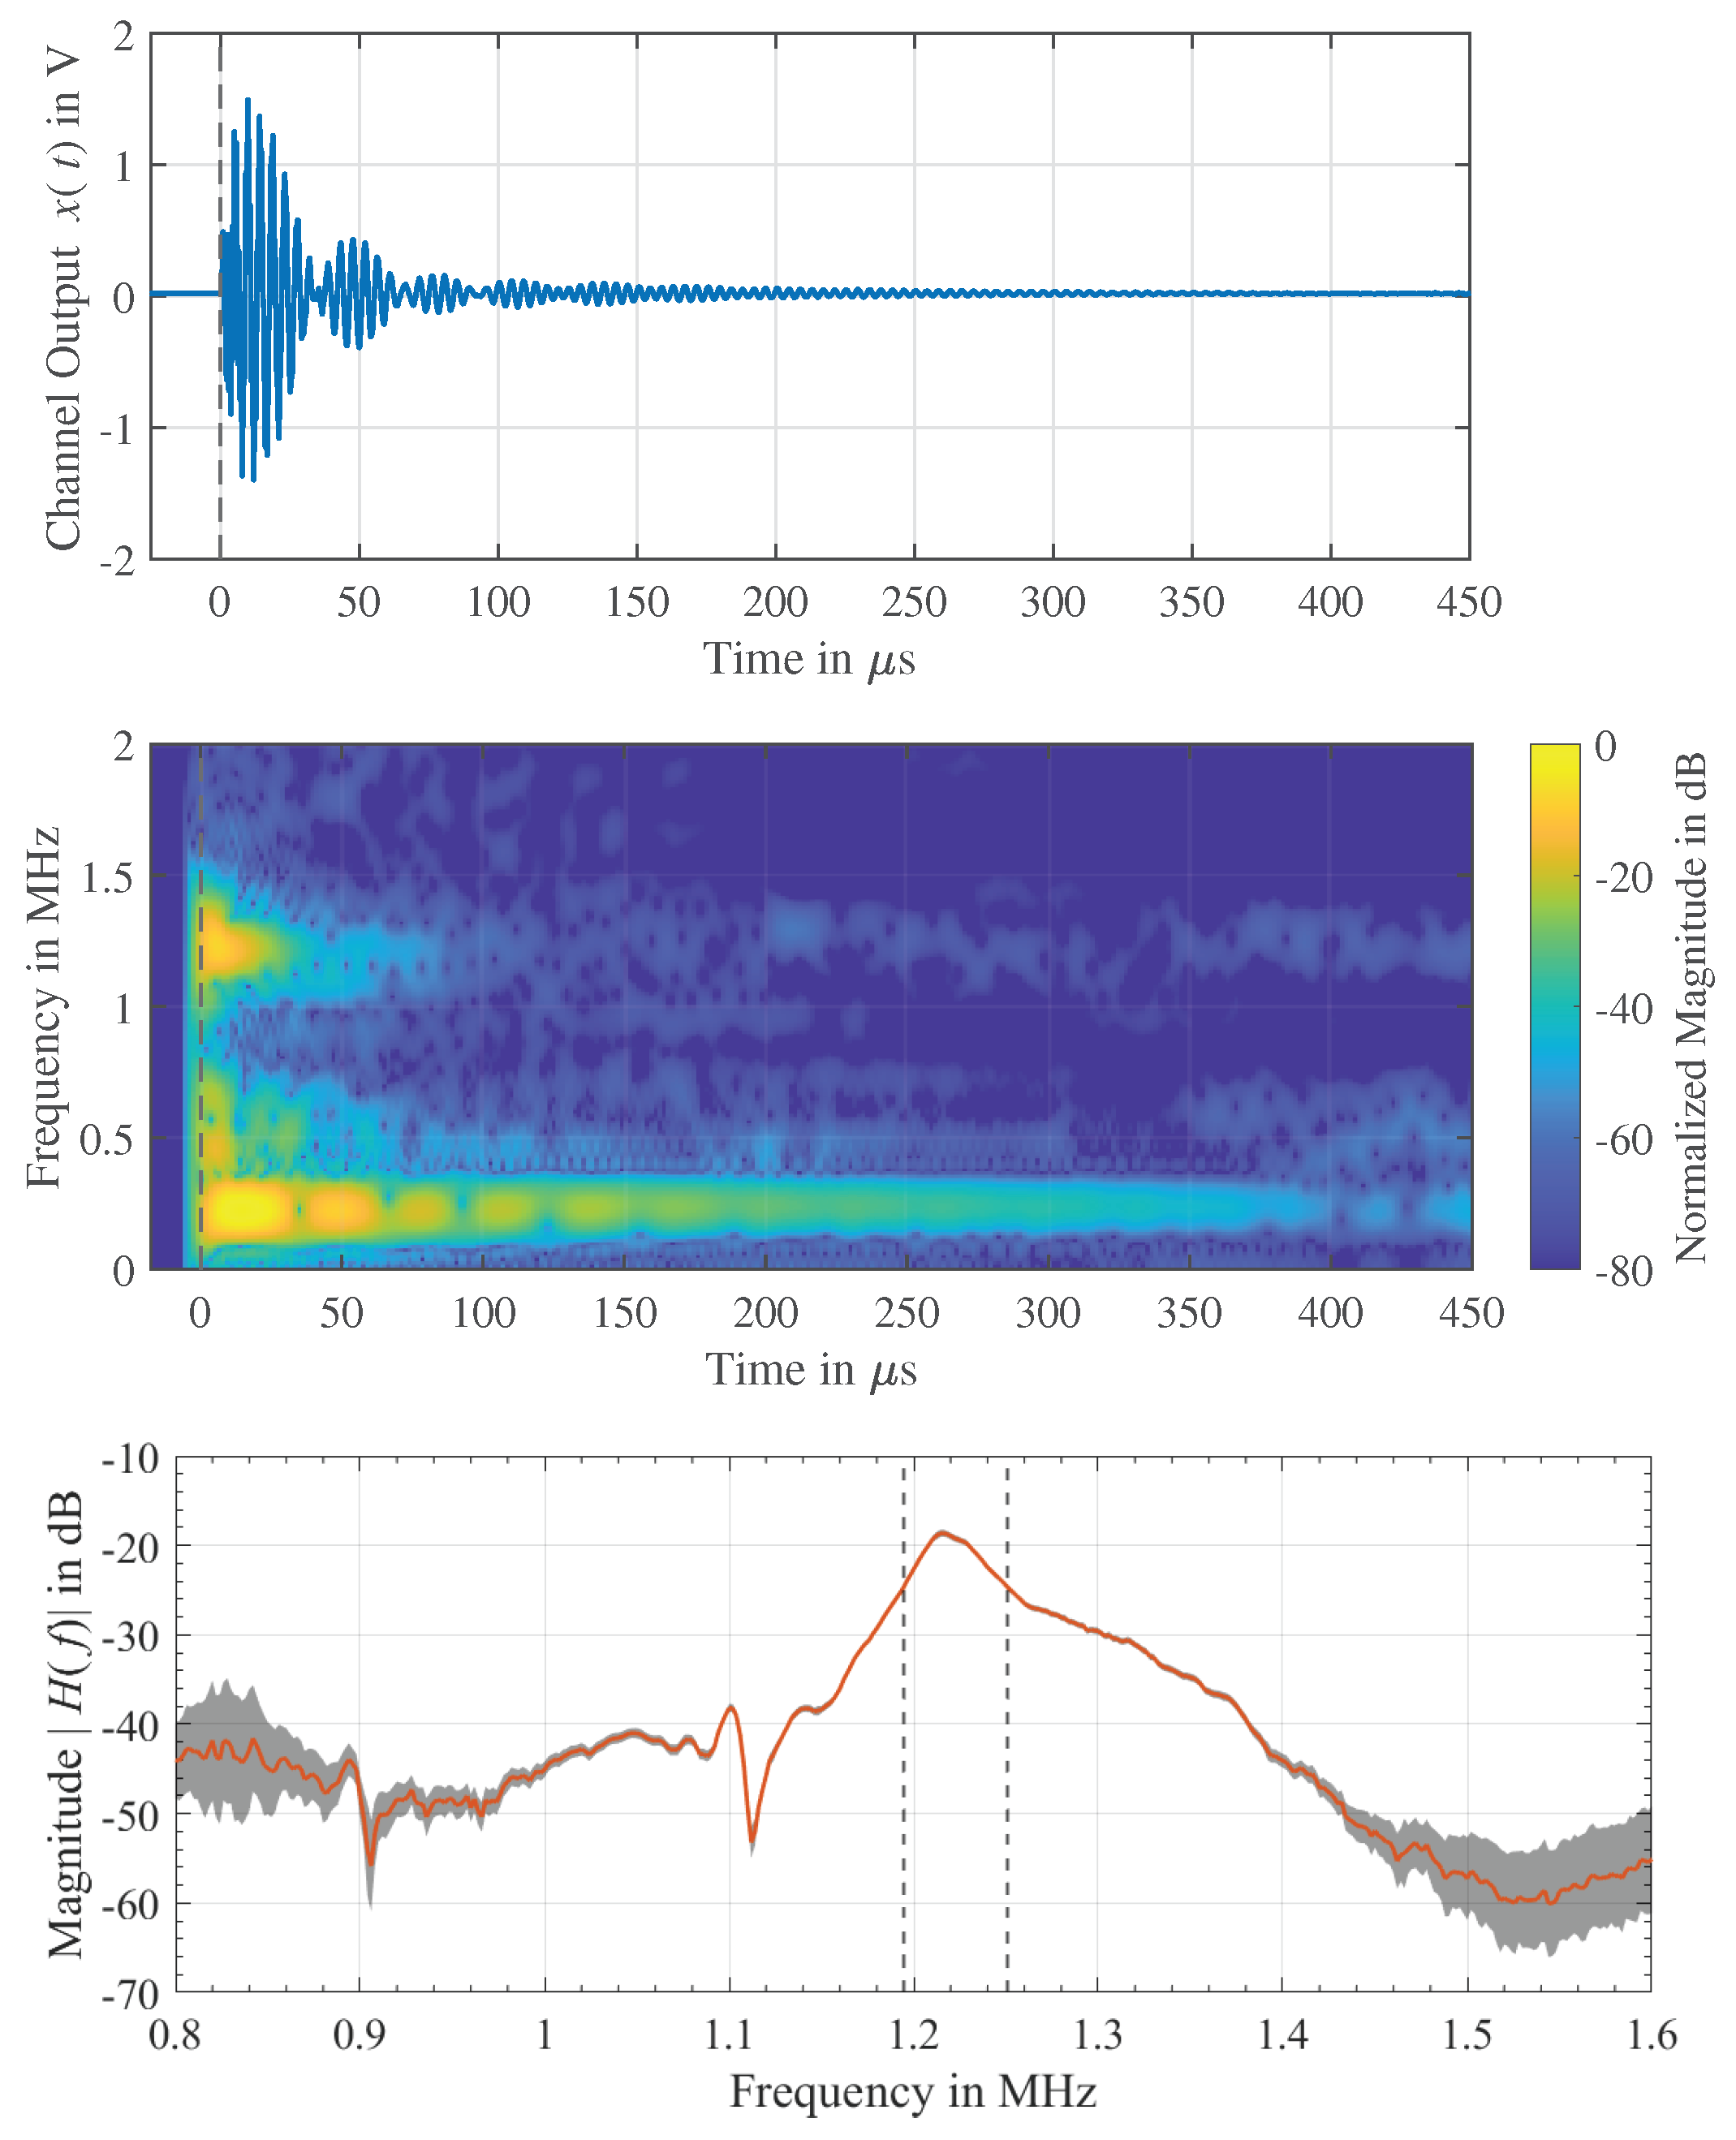
Figure 5.
Simulation of an MFSK (16-FSK) signal with the channel output (left) and corresponding normalized eye diagram of the demodulated signal (right).
Figure 5.
Simulation of an MFSK (16-FSK) signal with the channel output (left) and corresponding normalized eye diagram of the demodulated signal (right).
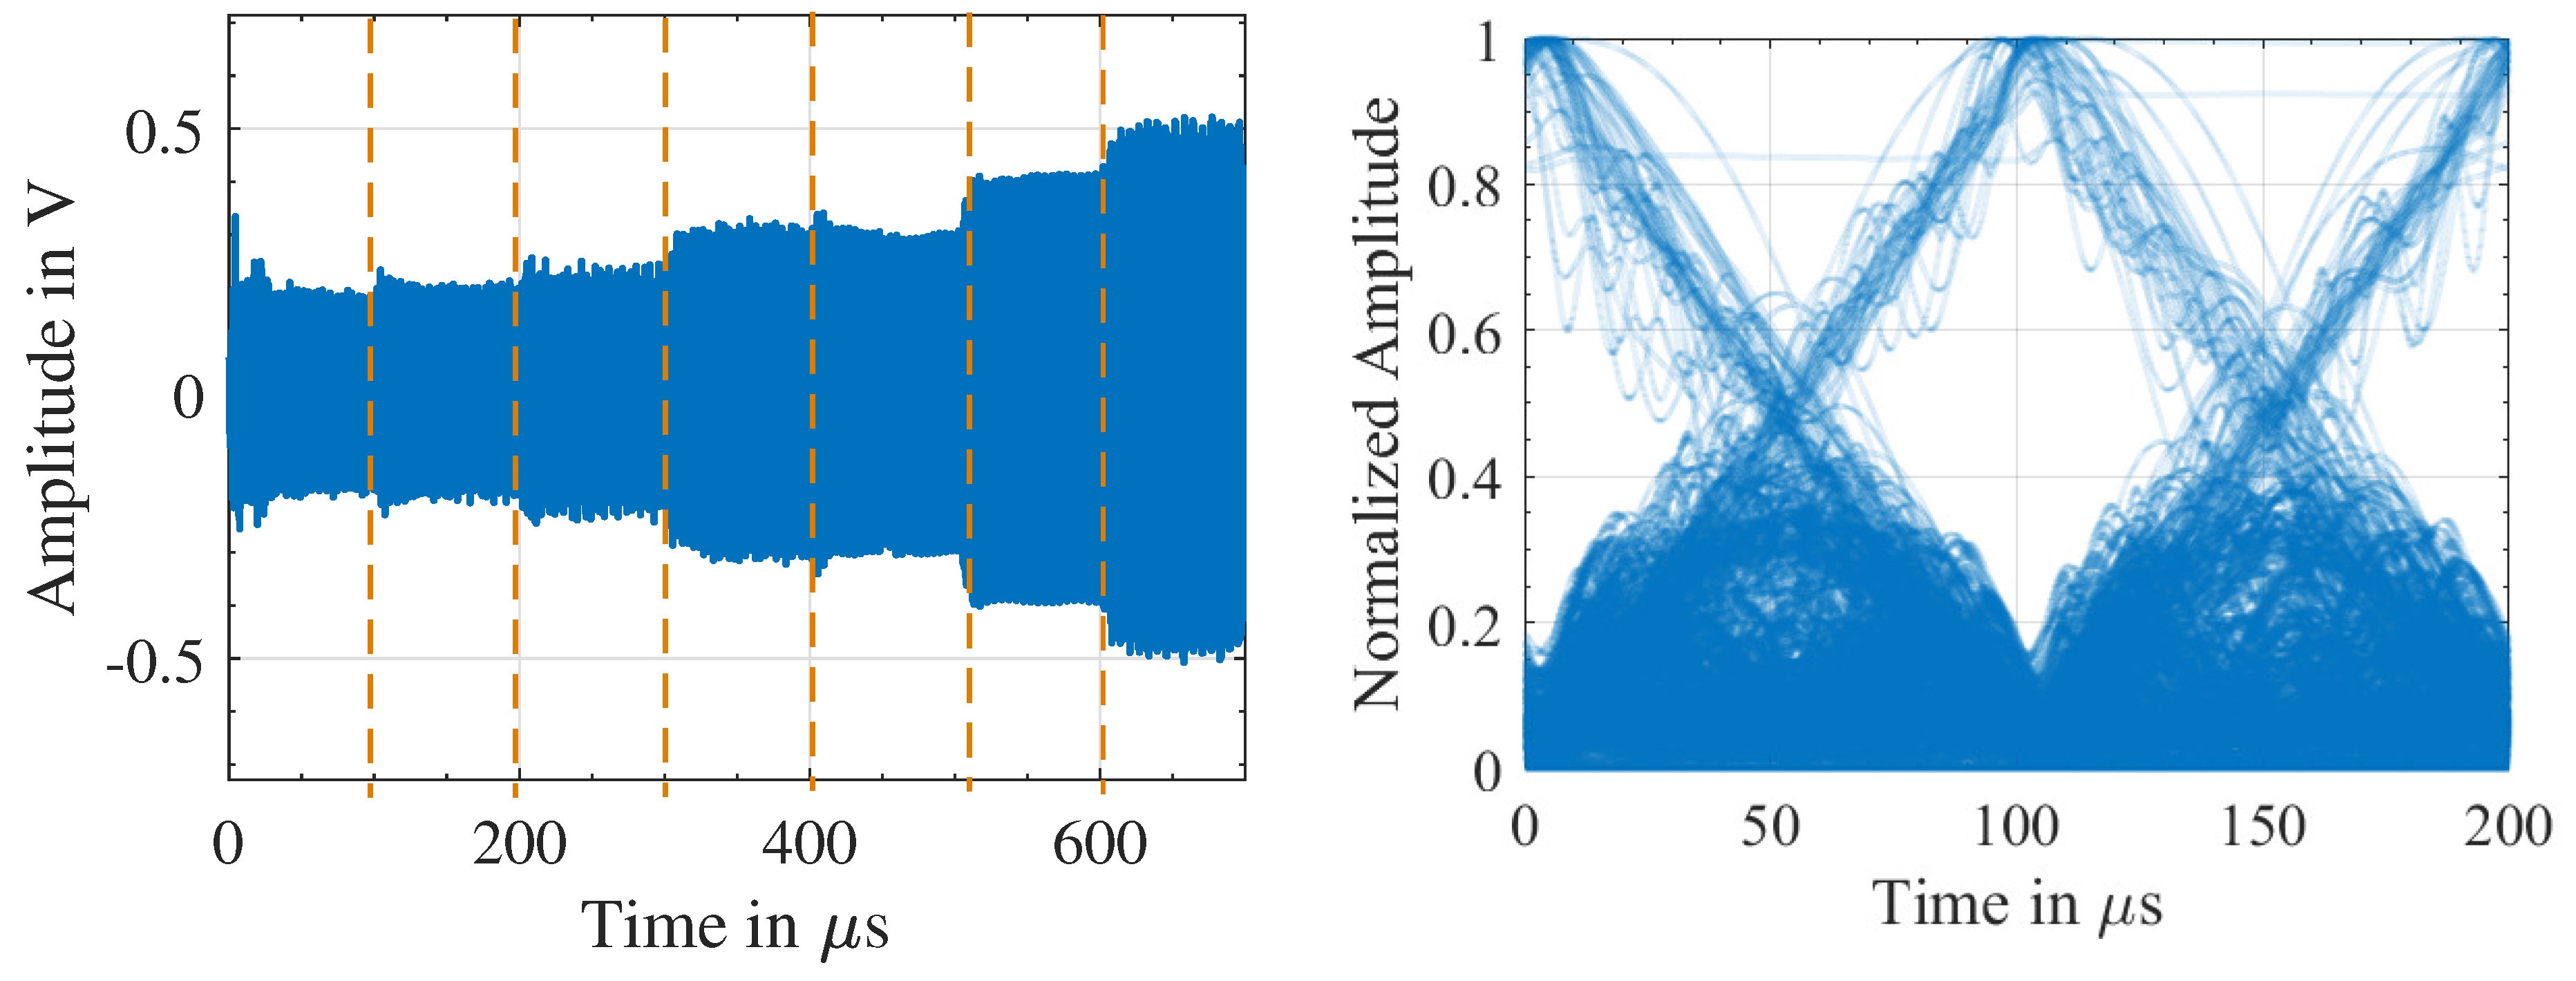
Figure 6.
Simulation of an Q-MFSK (5-16-FSK) signal with the channel output (left) and corresponding normalized eye diagram of the demodulated signal (right).
Figure 6.
Simulation of an Q-MFSK (5-16-FSK) signal with the channel output (left) and corresponding normalized eye diagram of the demodulated signal (right).
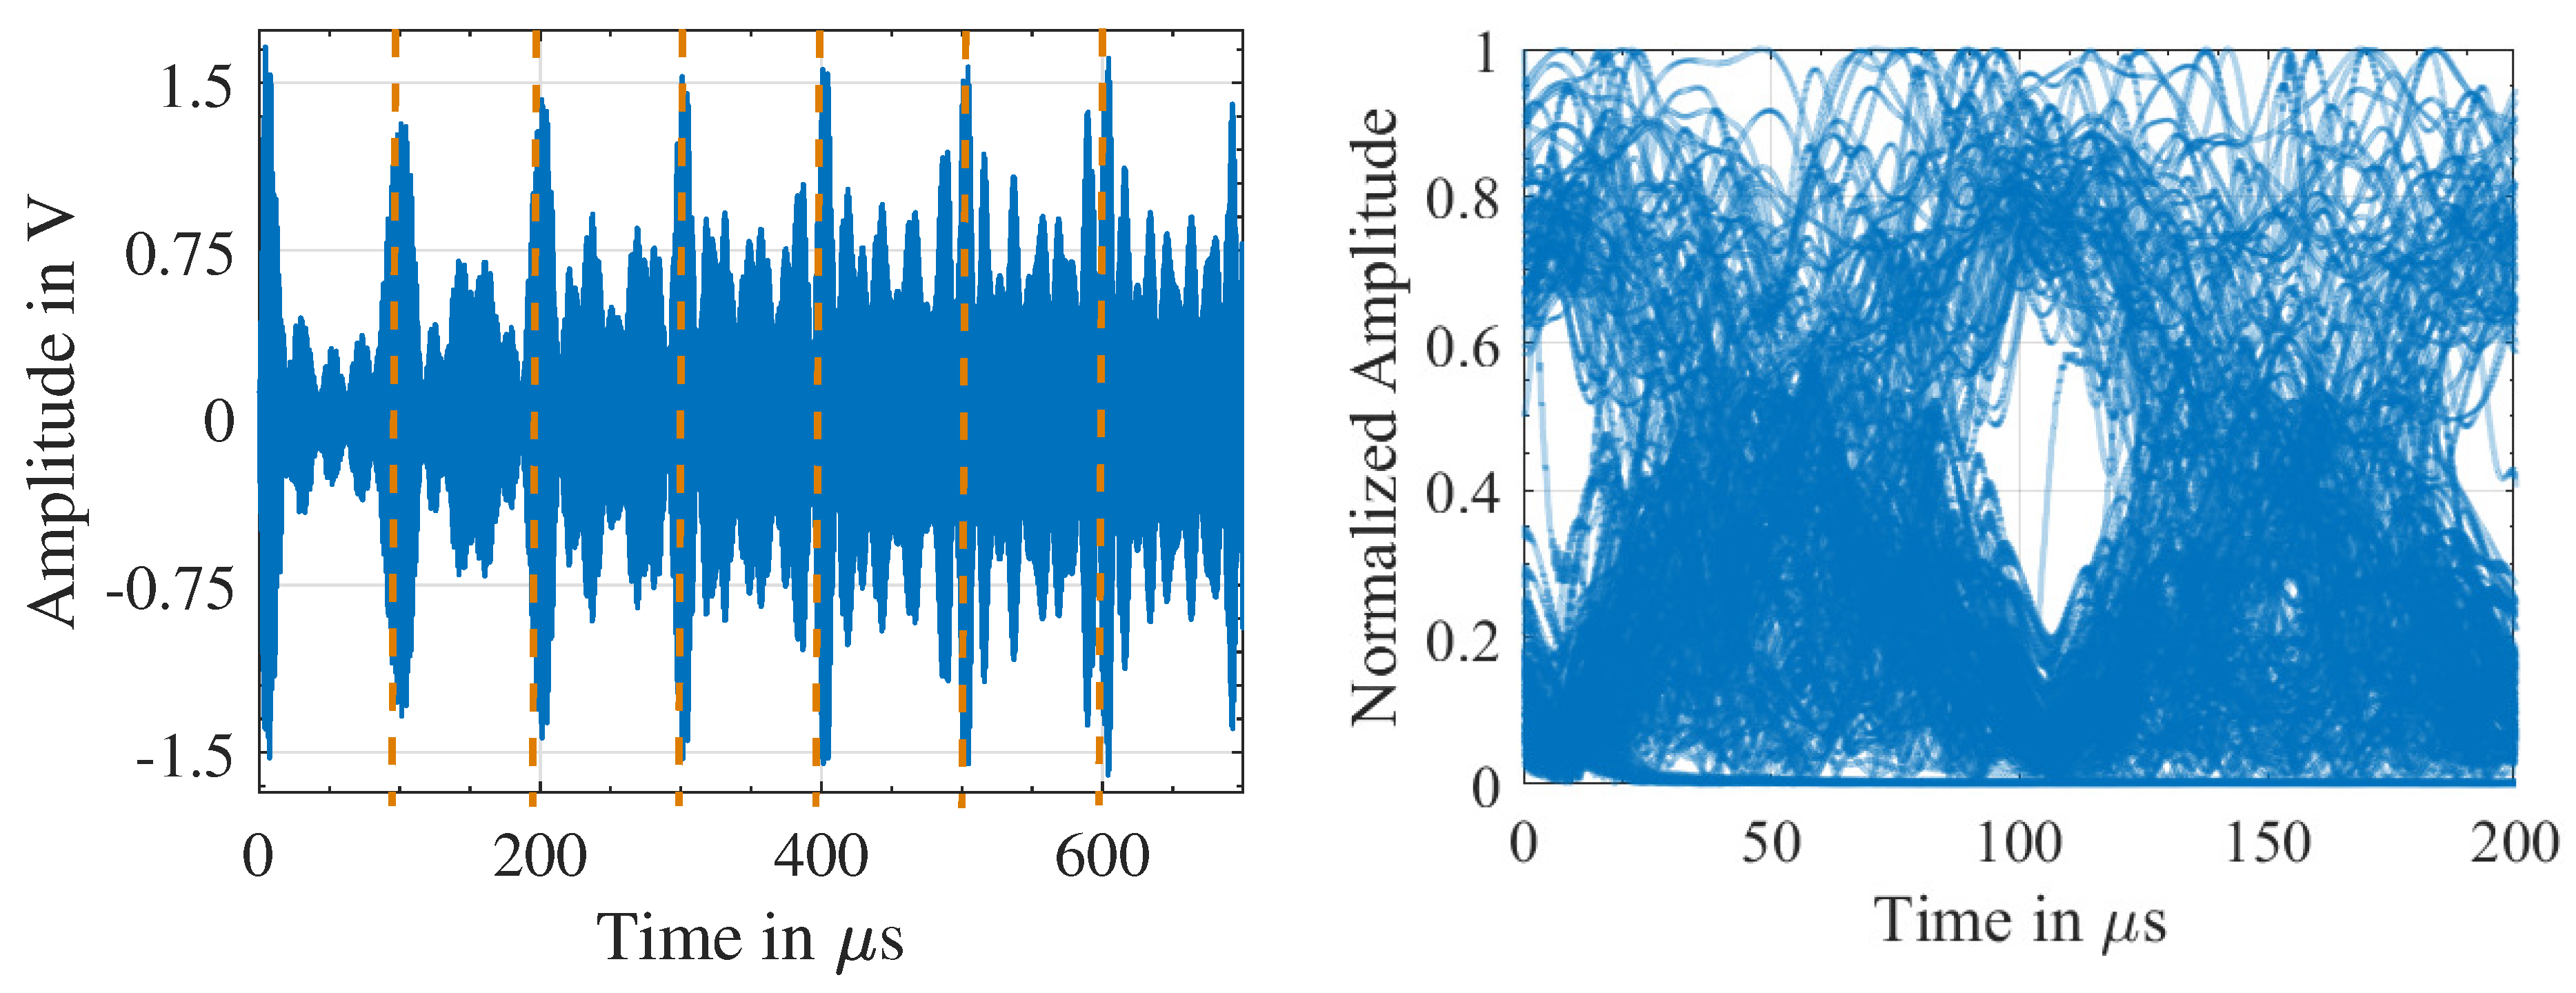
Figure 7.
Simulation of an DPSK signal with the channel output (left) and corresponding normalized eye diagram of the demodulated signal (right).
Figure 7.
Simulation of an DPSK signal with the channel output (left) and corresponding normalized eye diagram of the demodulated signal (right).
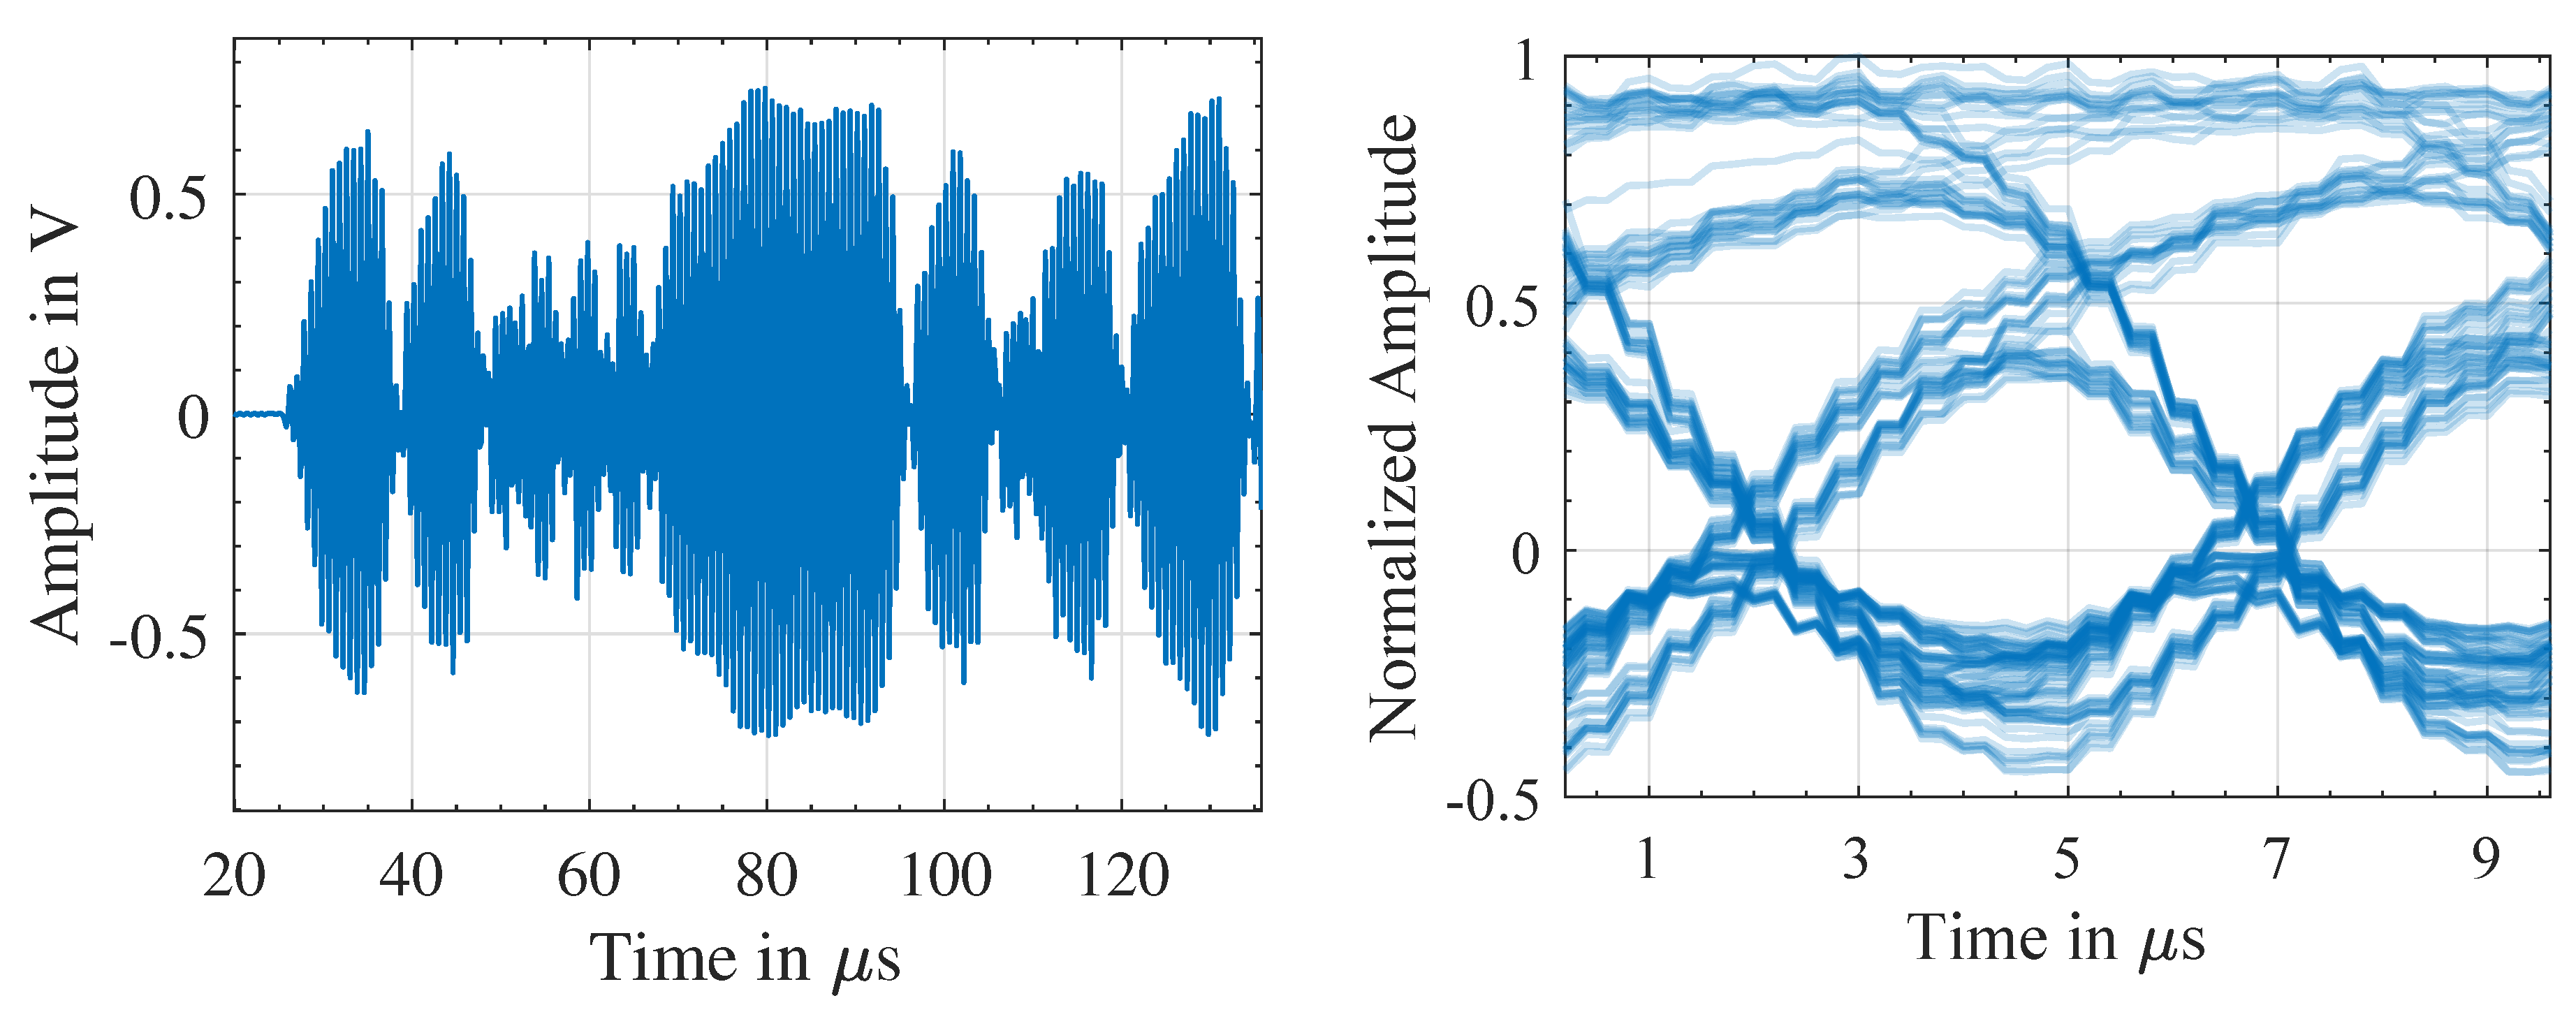
Figure 8.
Concept of the low-power ultrasonic transceiver with transmit and receive path for implementing the modulation and demodulation of a differential phase shift keying (DPSK) on a MCU.
Figure 8.
Concept of the low-power ultrasonic transceiver with transmit and receive path for implementing the modulation and demodulation of a differential phase shift keying (DPSK) on a MCU.
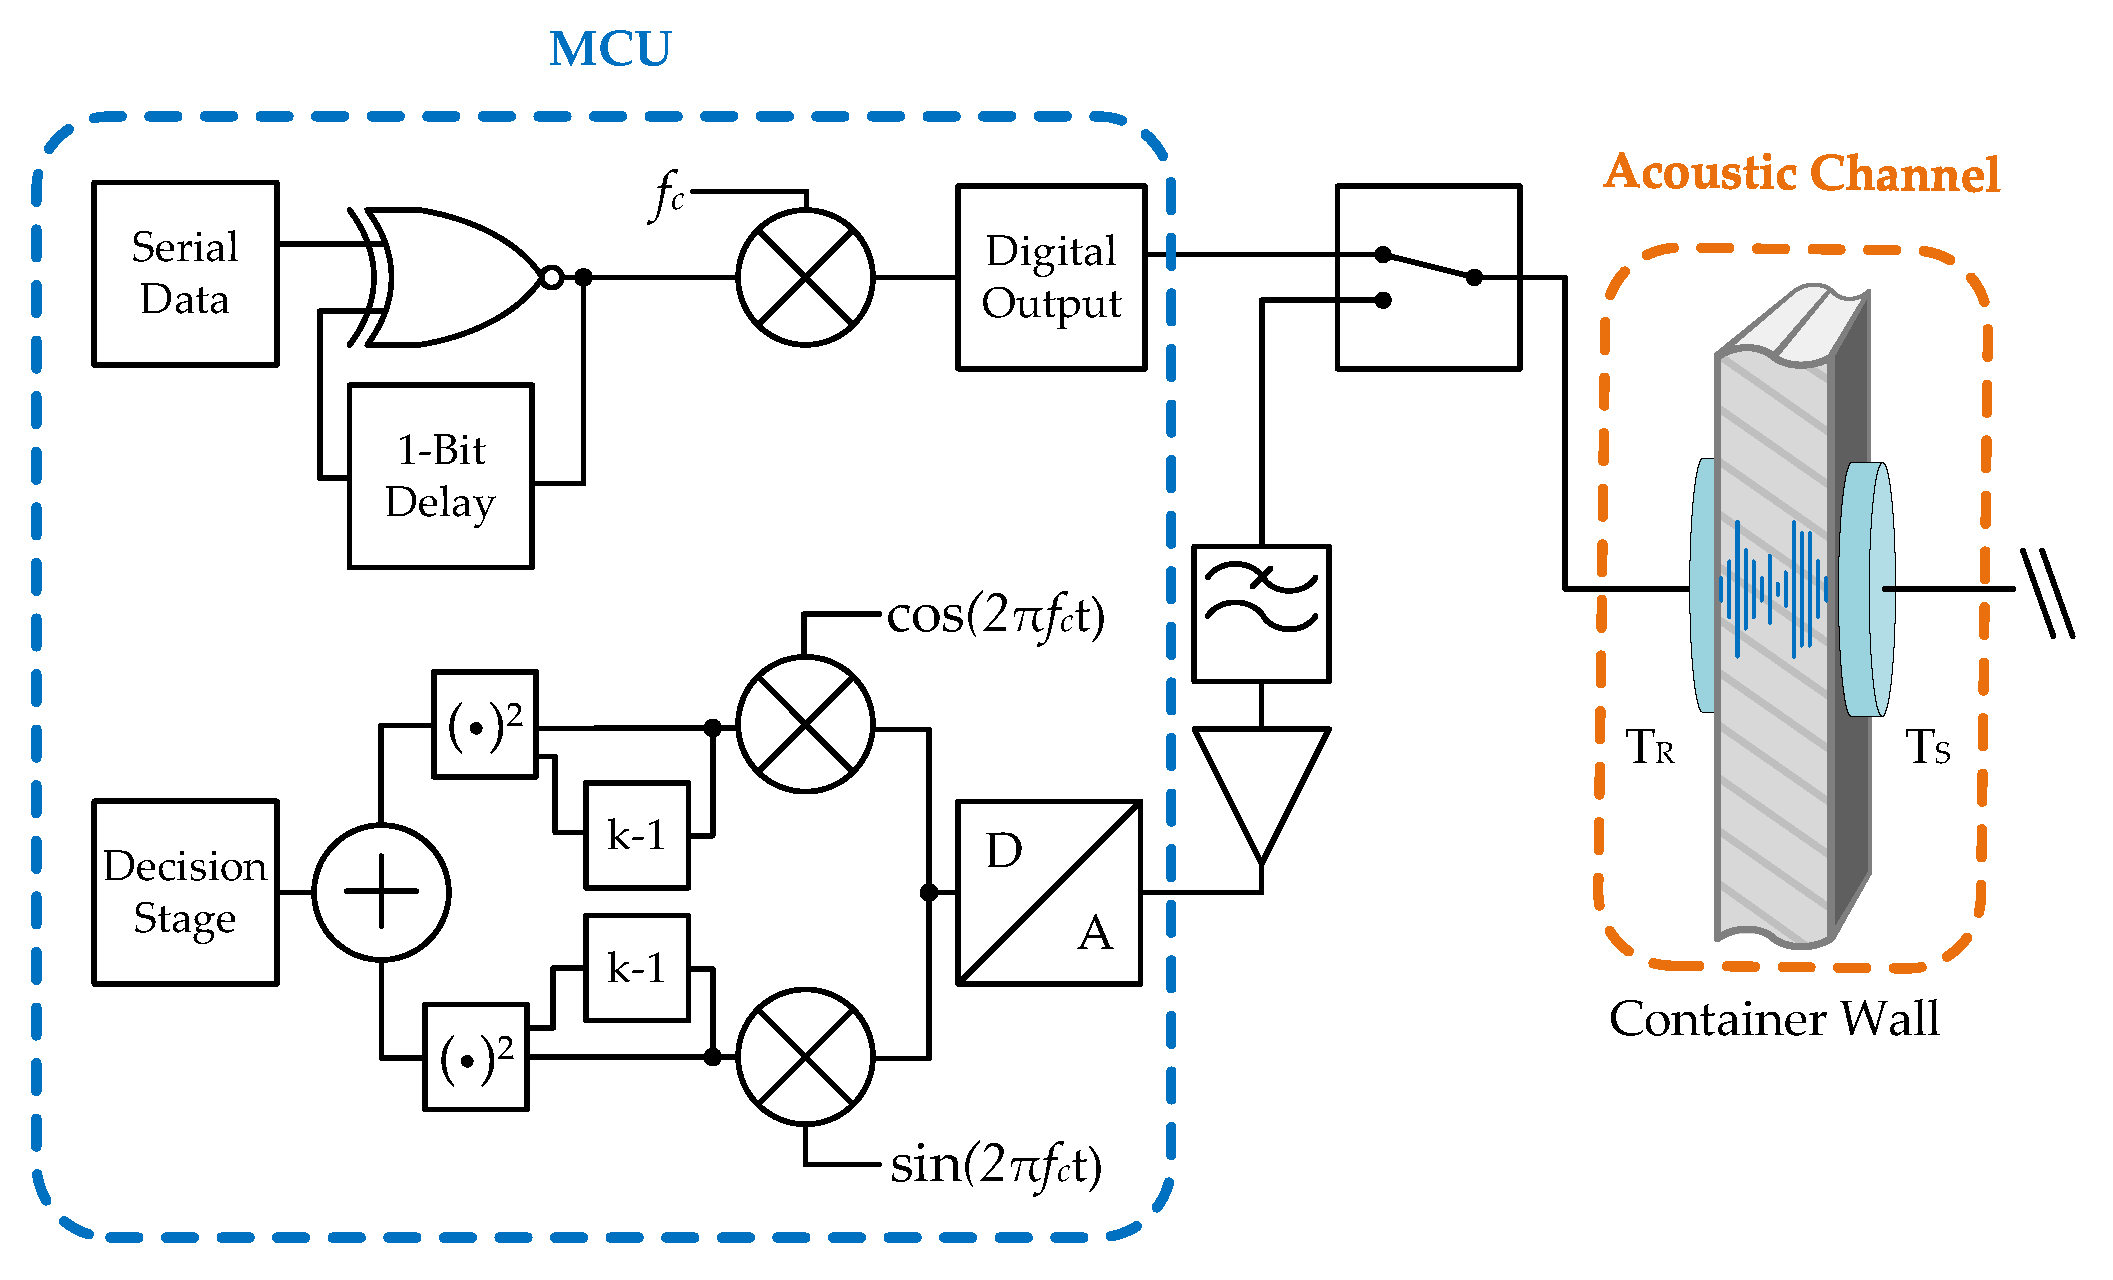
Figure 9.
Photo of the measurement setup to evaluate the acoustic communication through a 1.6 mm thick cutout of a container wall.
Figure 9.
Photo of the measurement setup to evaluate the acoustic communication through a 1.6 mm thick cutout of a container wall.
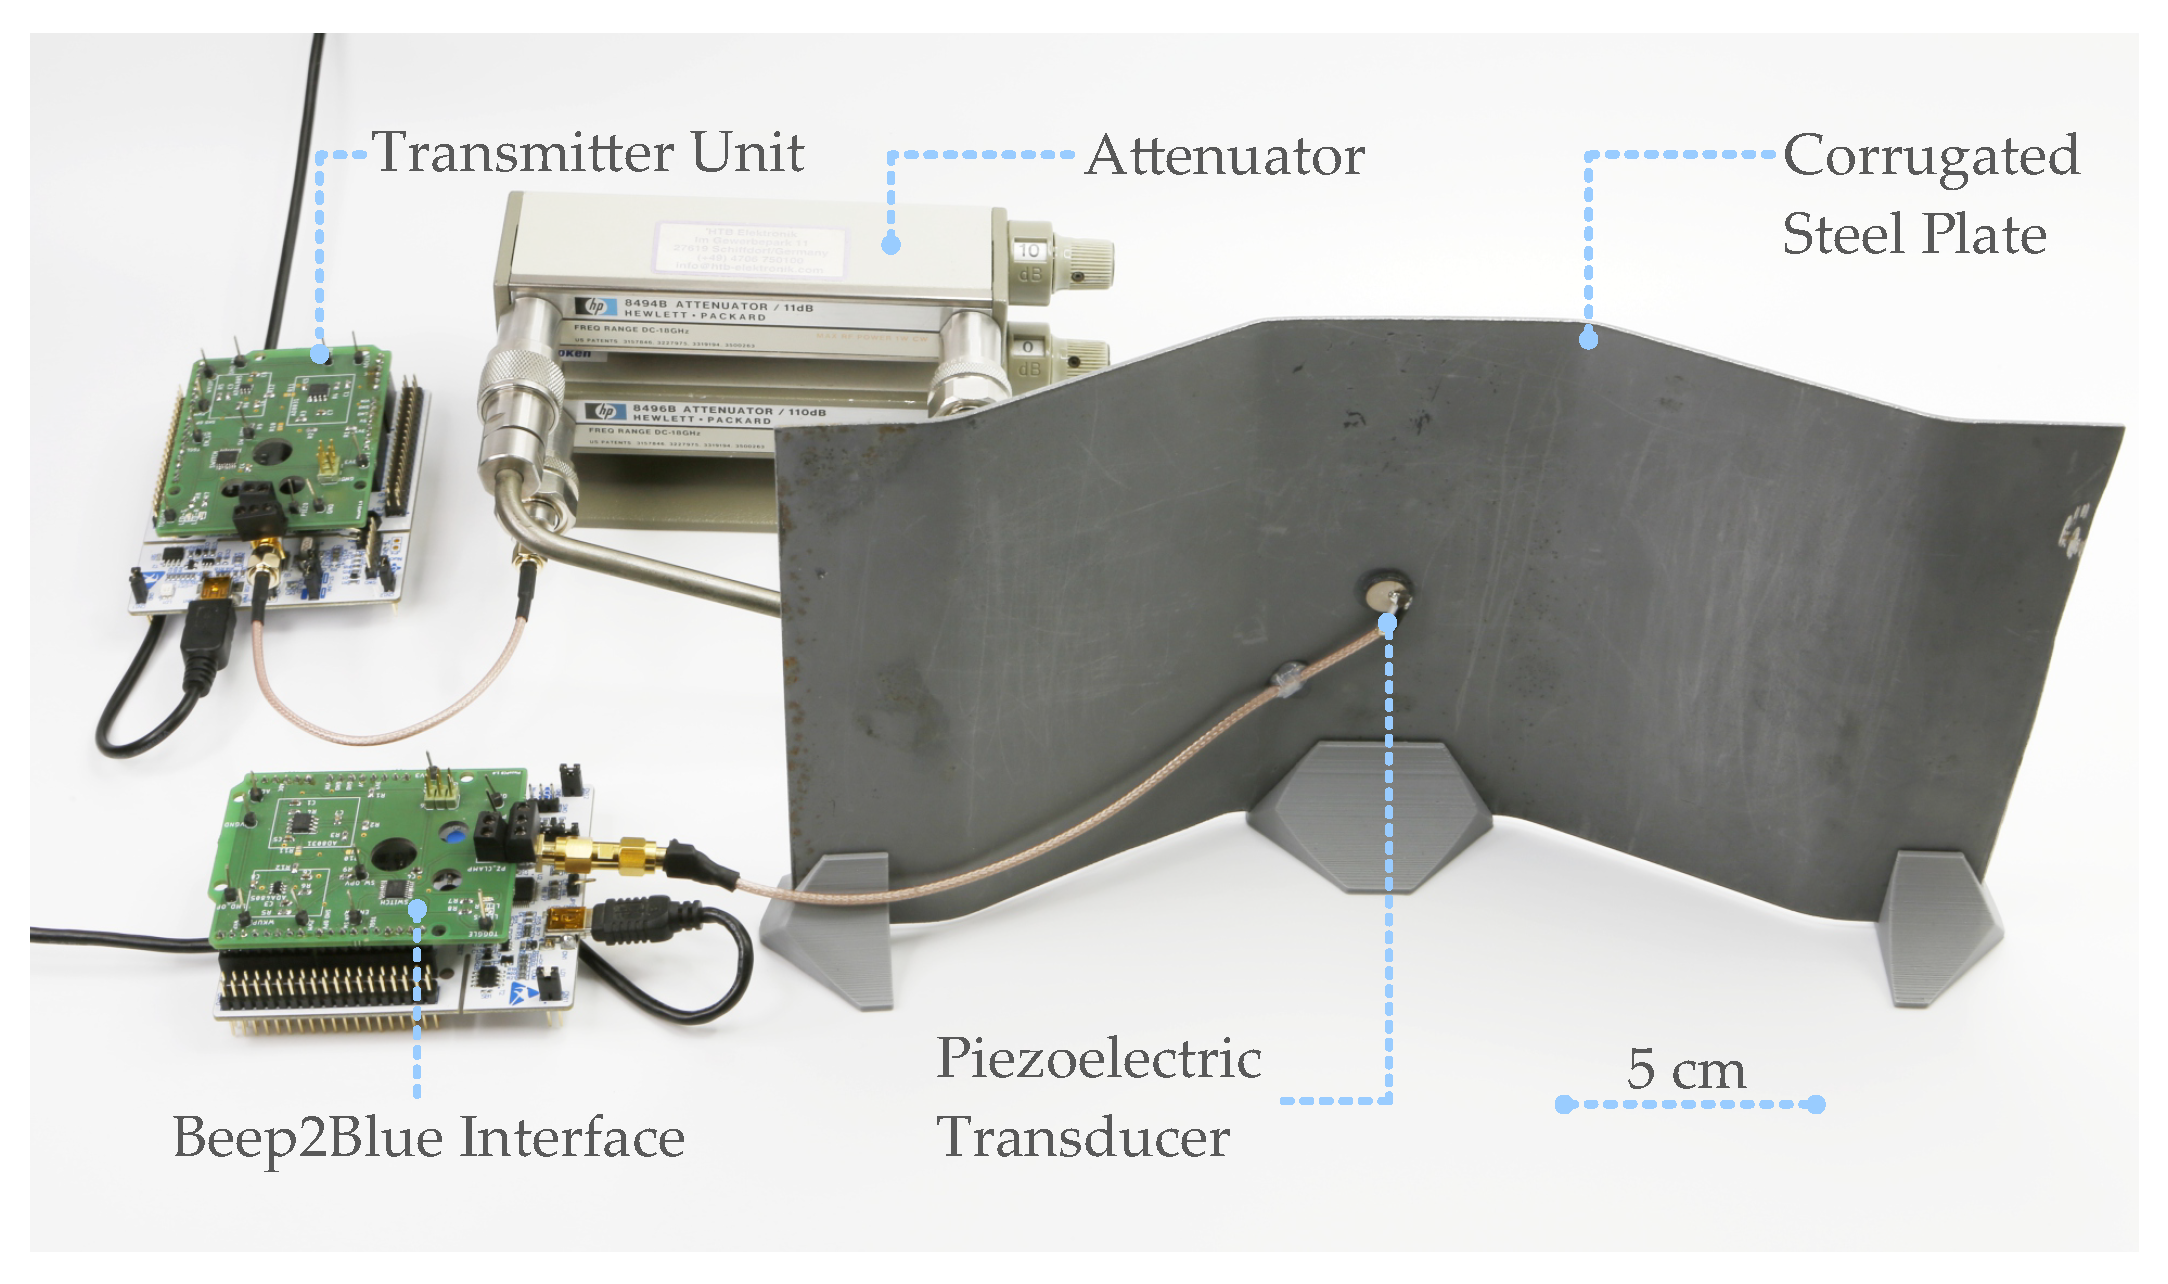
Figure 10.
Synchronization process with received ADC samples (top), estimated carrier amplitude used for initial threshold detection (middle), and correlation with the 5-bit Barker sequence for fine synchronization (bottom).
Figure 10.
Synchronization process with received ADC samples (top), estimated carrier amplitude used for initial threshold detection (middle), and correlation with the 5-bit Barker sequence for fine synchronization (bottom).
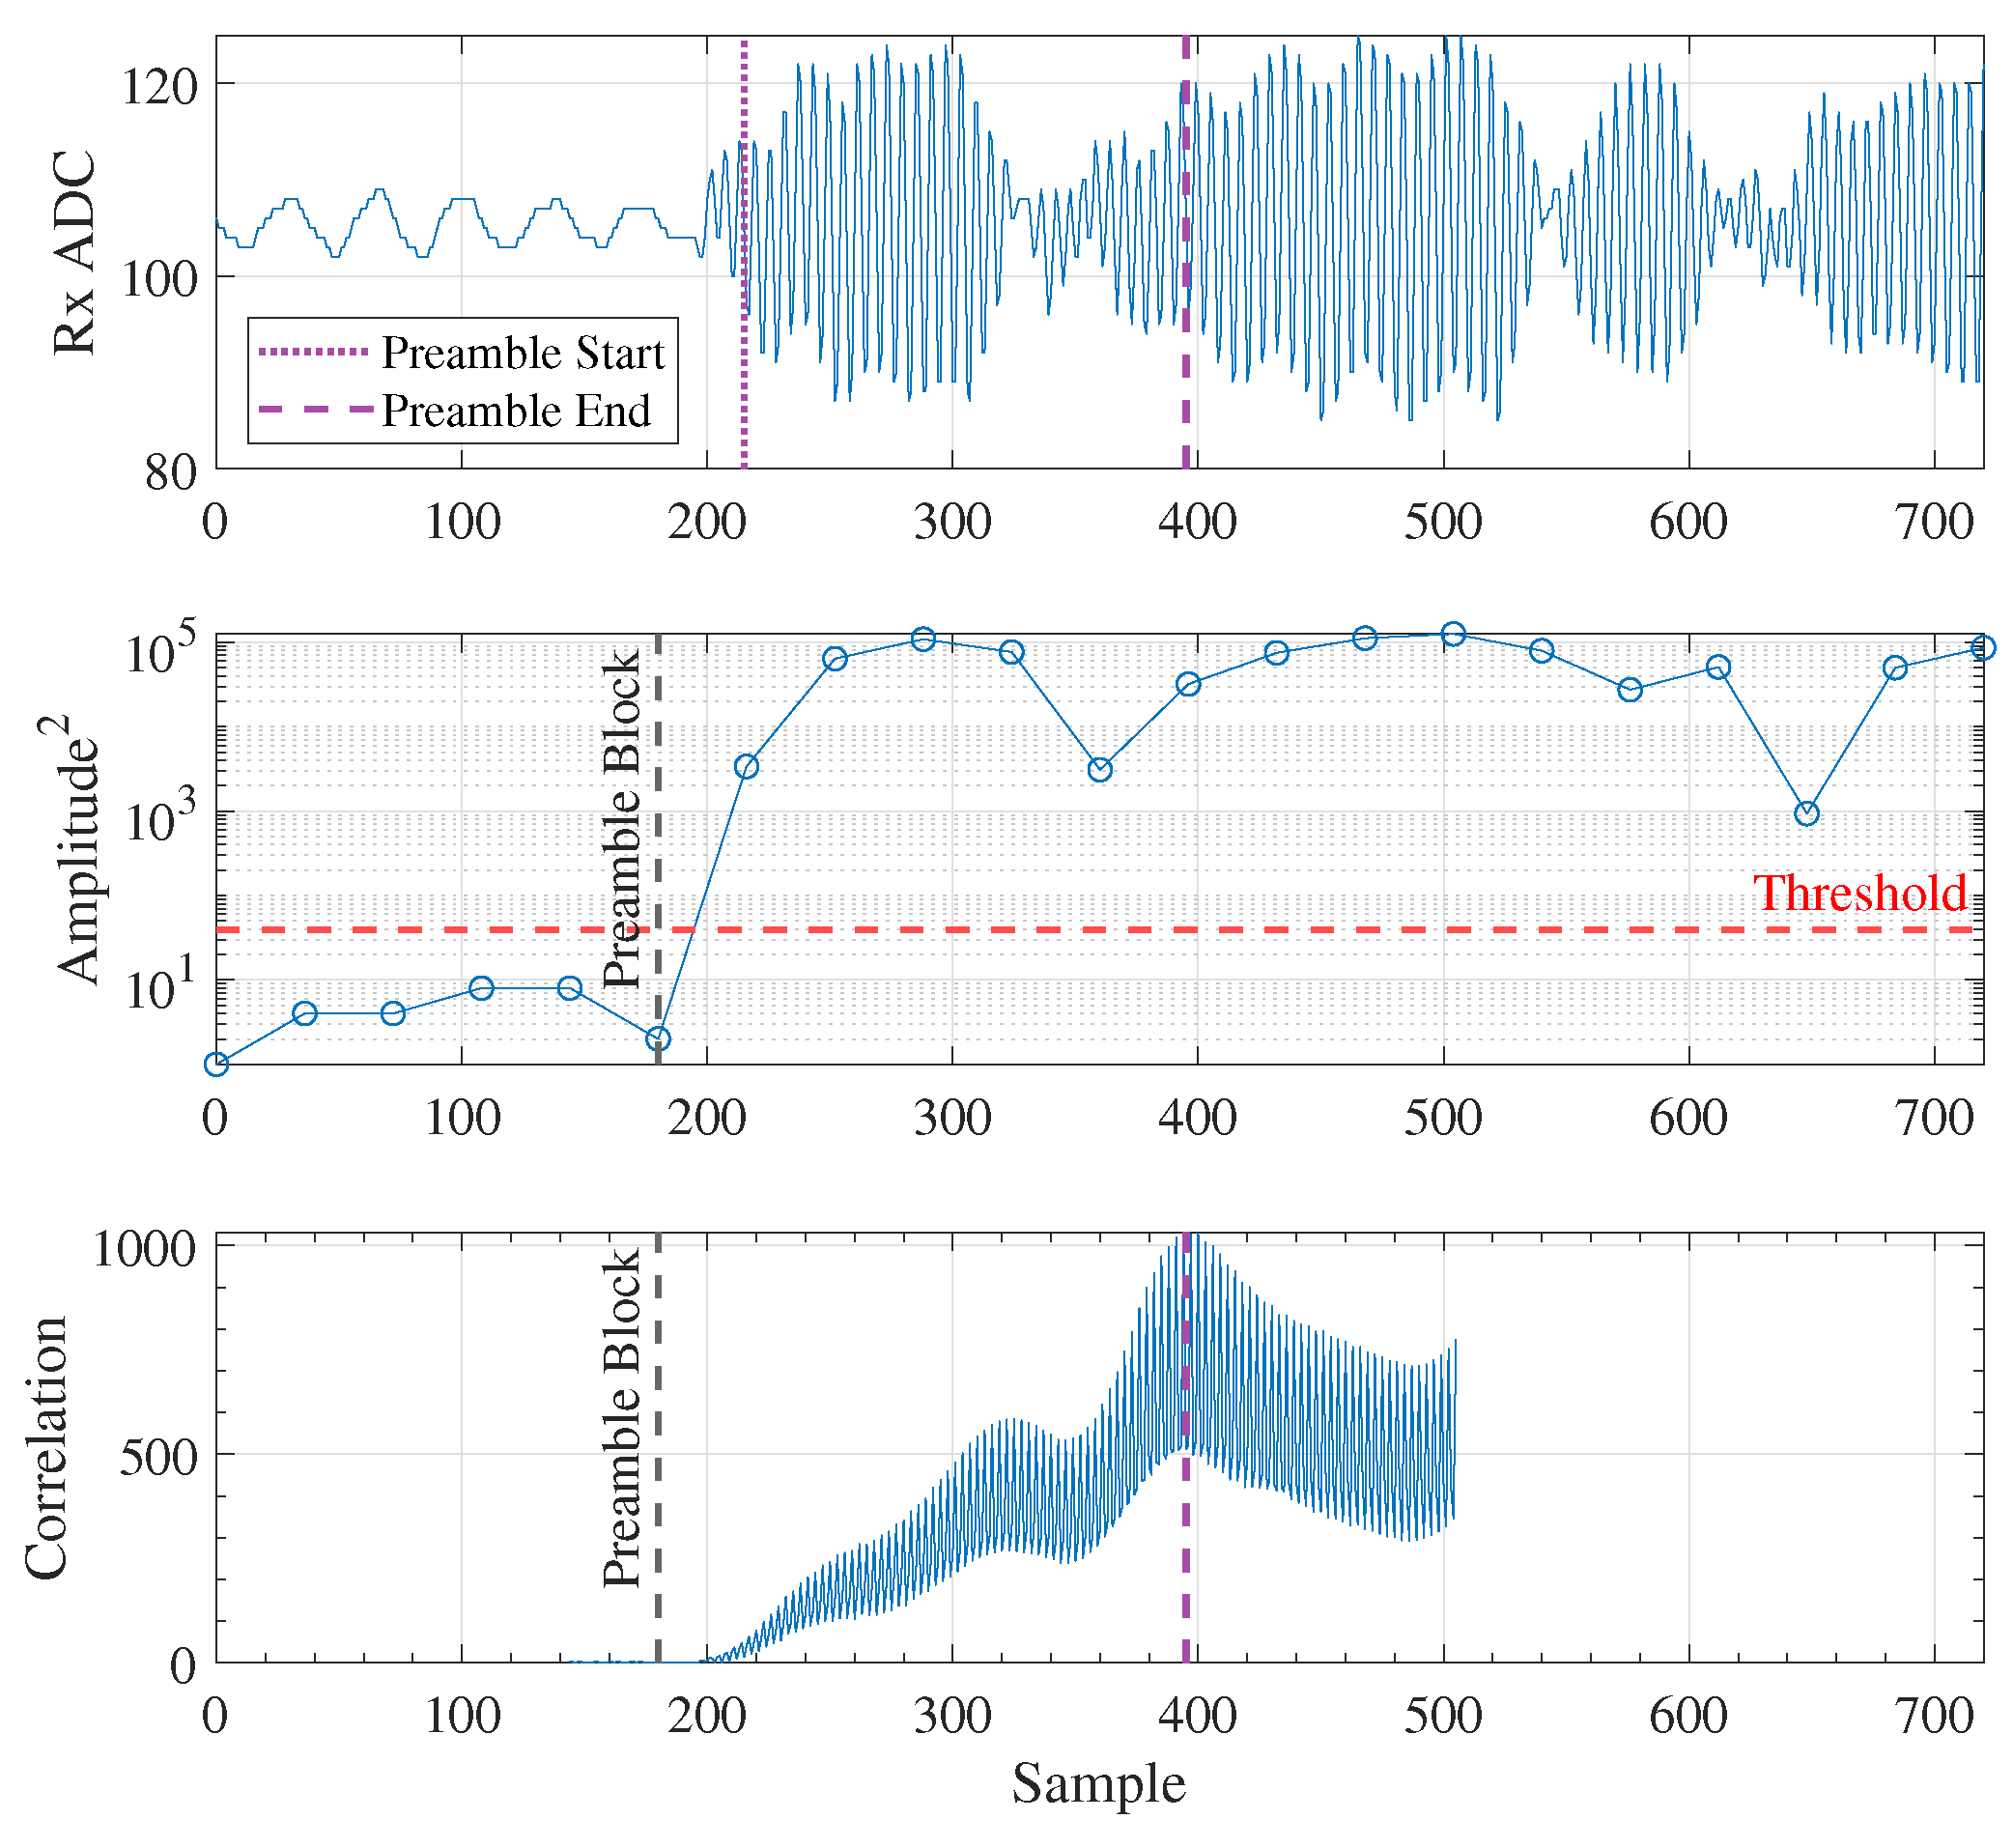
Figure 11.
Demodulation results with received ADC samples (top), the differential dot product used for phase detection (middle), and the decoded received bit sequence (bottom).
Figure 11.
Demodulation results with received ADC samples (top), the differential dot product used for phase detection (middle), and the decoded received bit sequence (bottom).
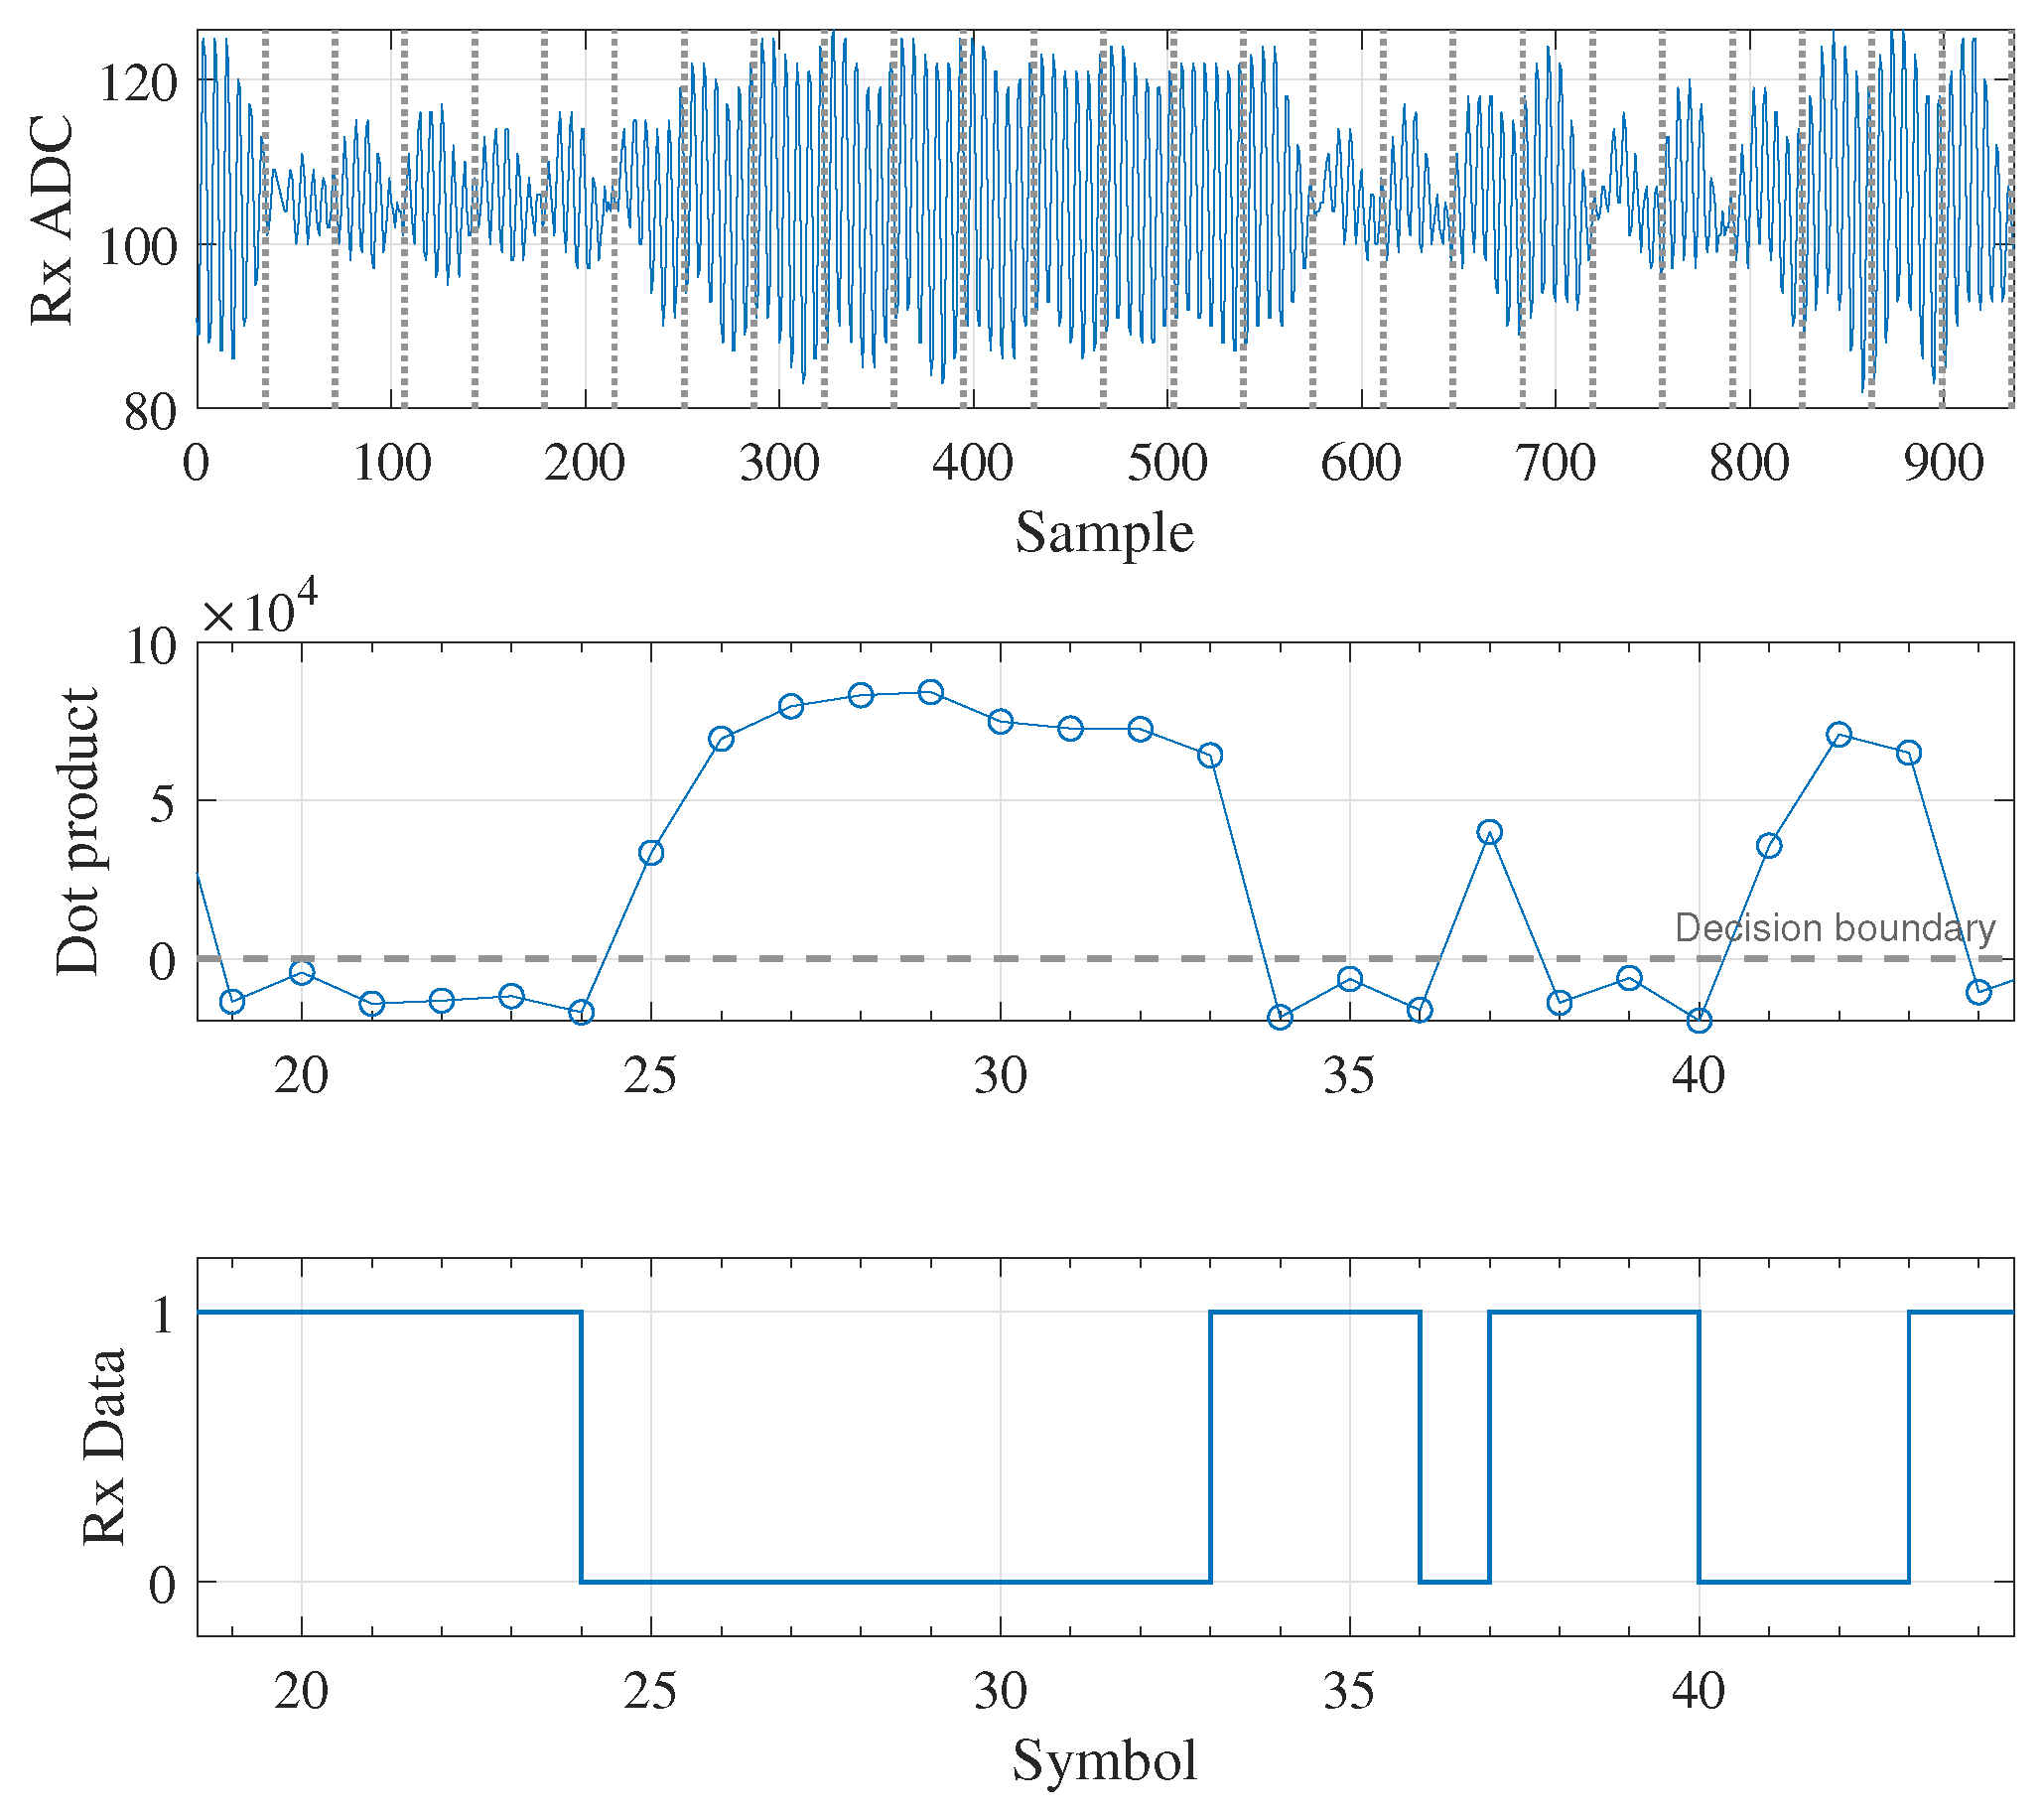
Figure 12.
Normalized eye diagram of an DPSK signal with 330 symbols sampled on the MCU at a received signal strength of −32 dBm (left) and −42 dBm (right).
Figure 12.
Normalized eye diagram of an DPSK signal with 330 symbols sampled on the MCU at a received signal strength of −32 dBm (left) and −42 dBm (right).
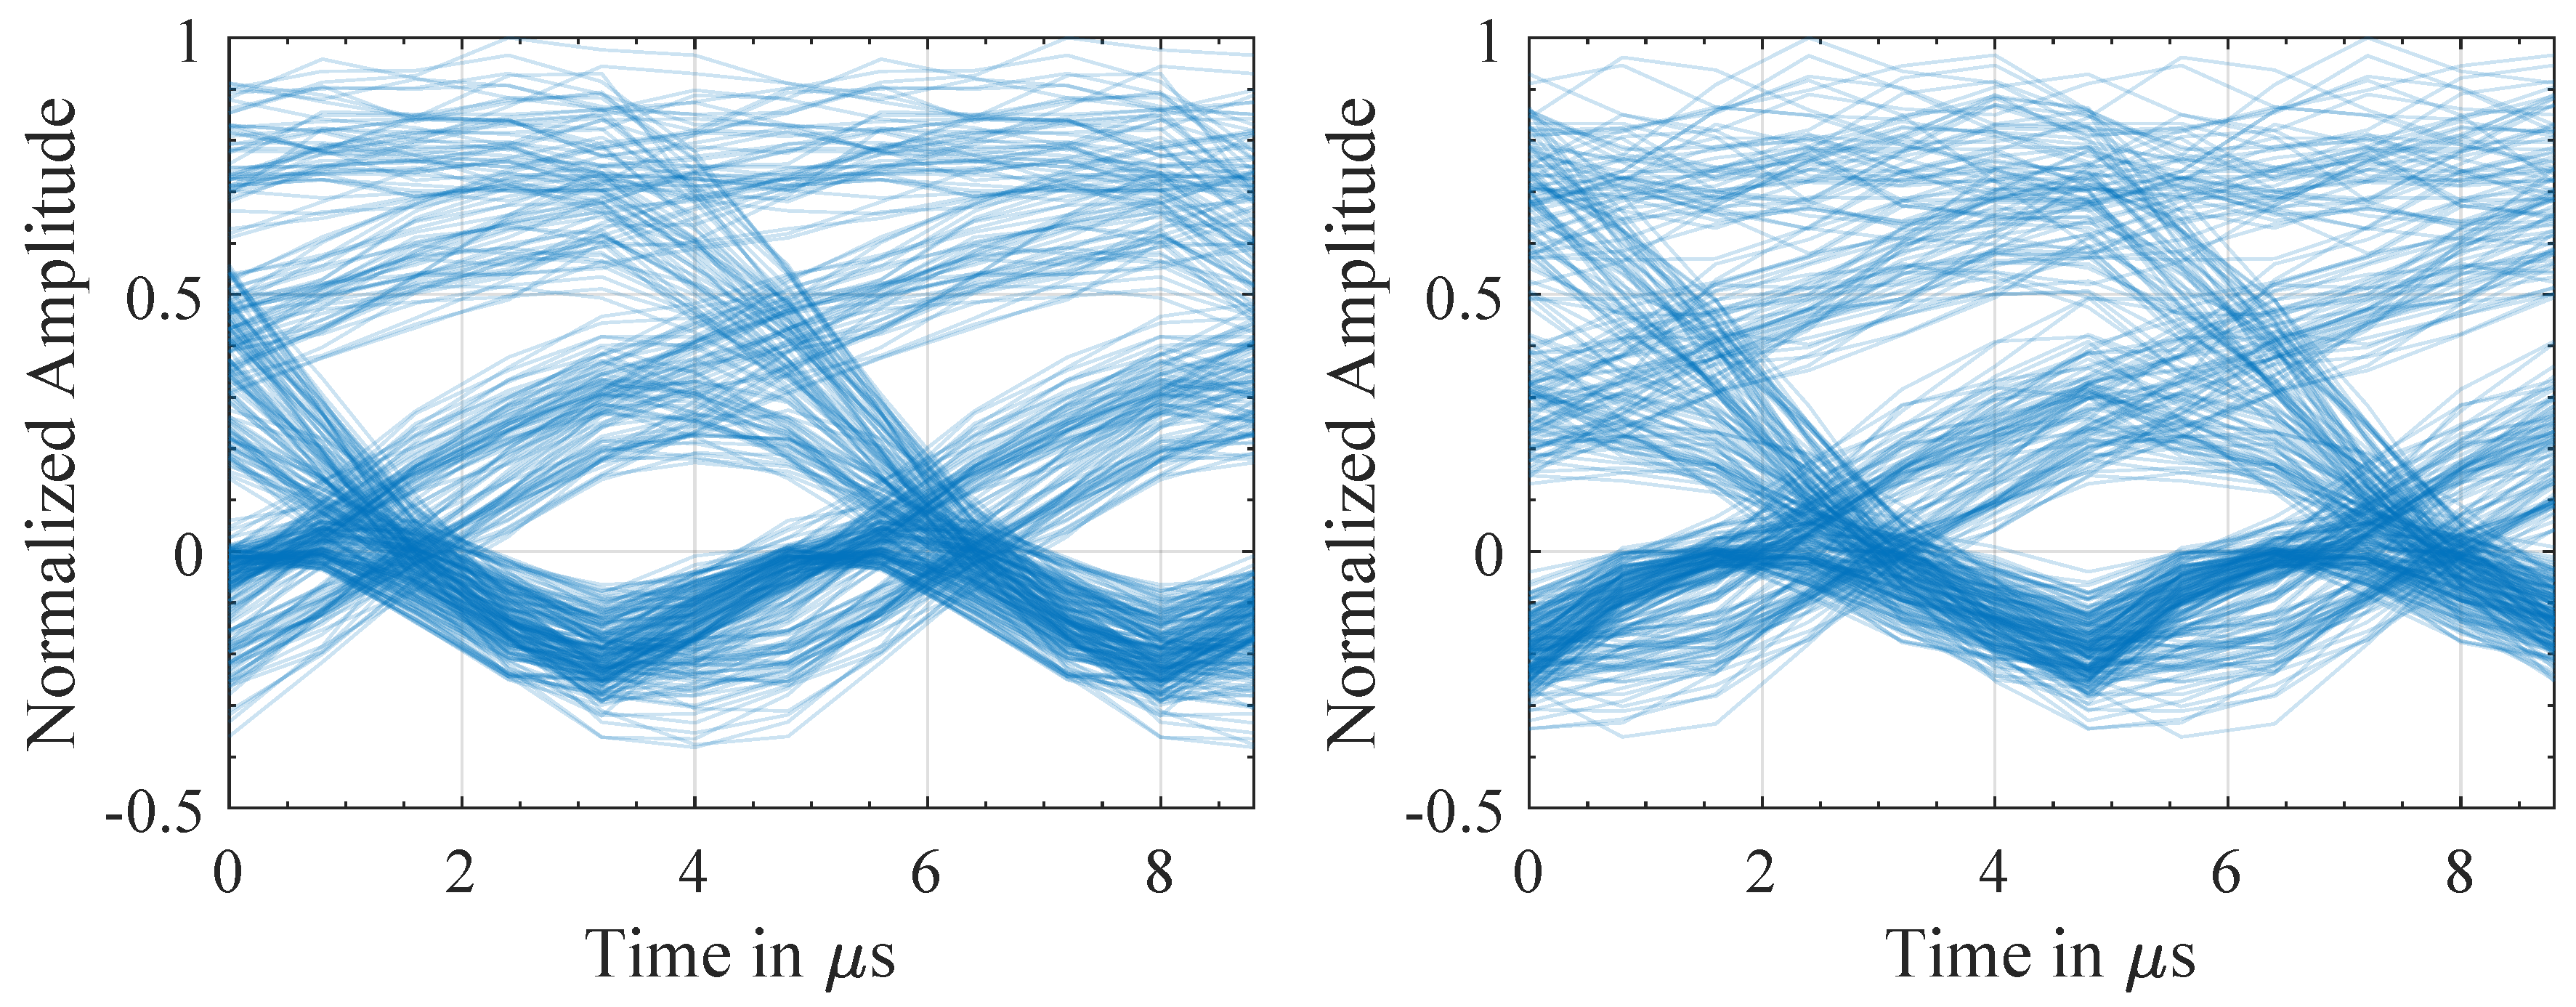
Figure 13.
Normalized eye diagram of an DPSK signal with 330 symbols sampled on the MCU at a received signal strength of −32 dBm (left) and −42 dBm (right)
Figure 13.
Normalized eye diagram of an DPSK signal with 330 symbols sampled on the MCU at a received signal strength of −32 dBm (left) and −42 dBm (right)
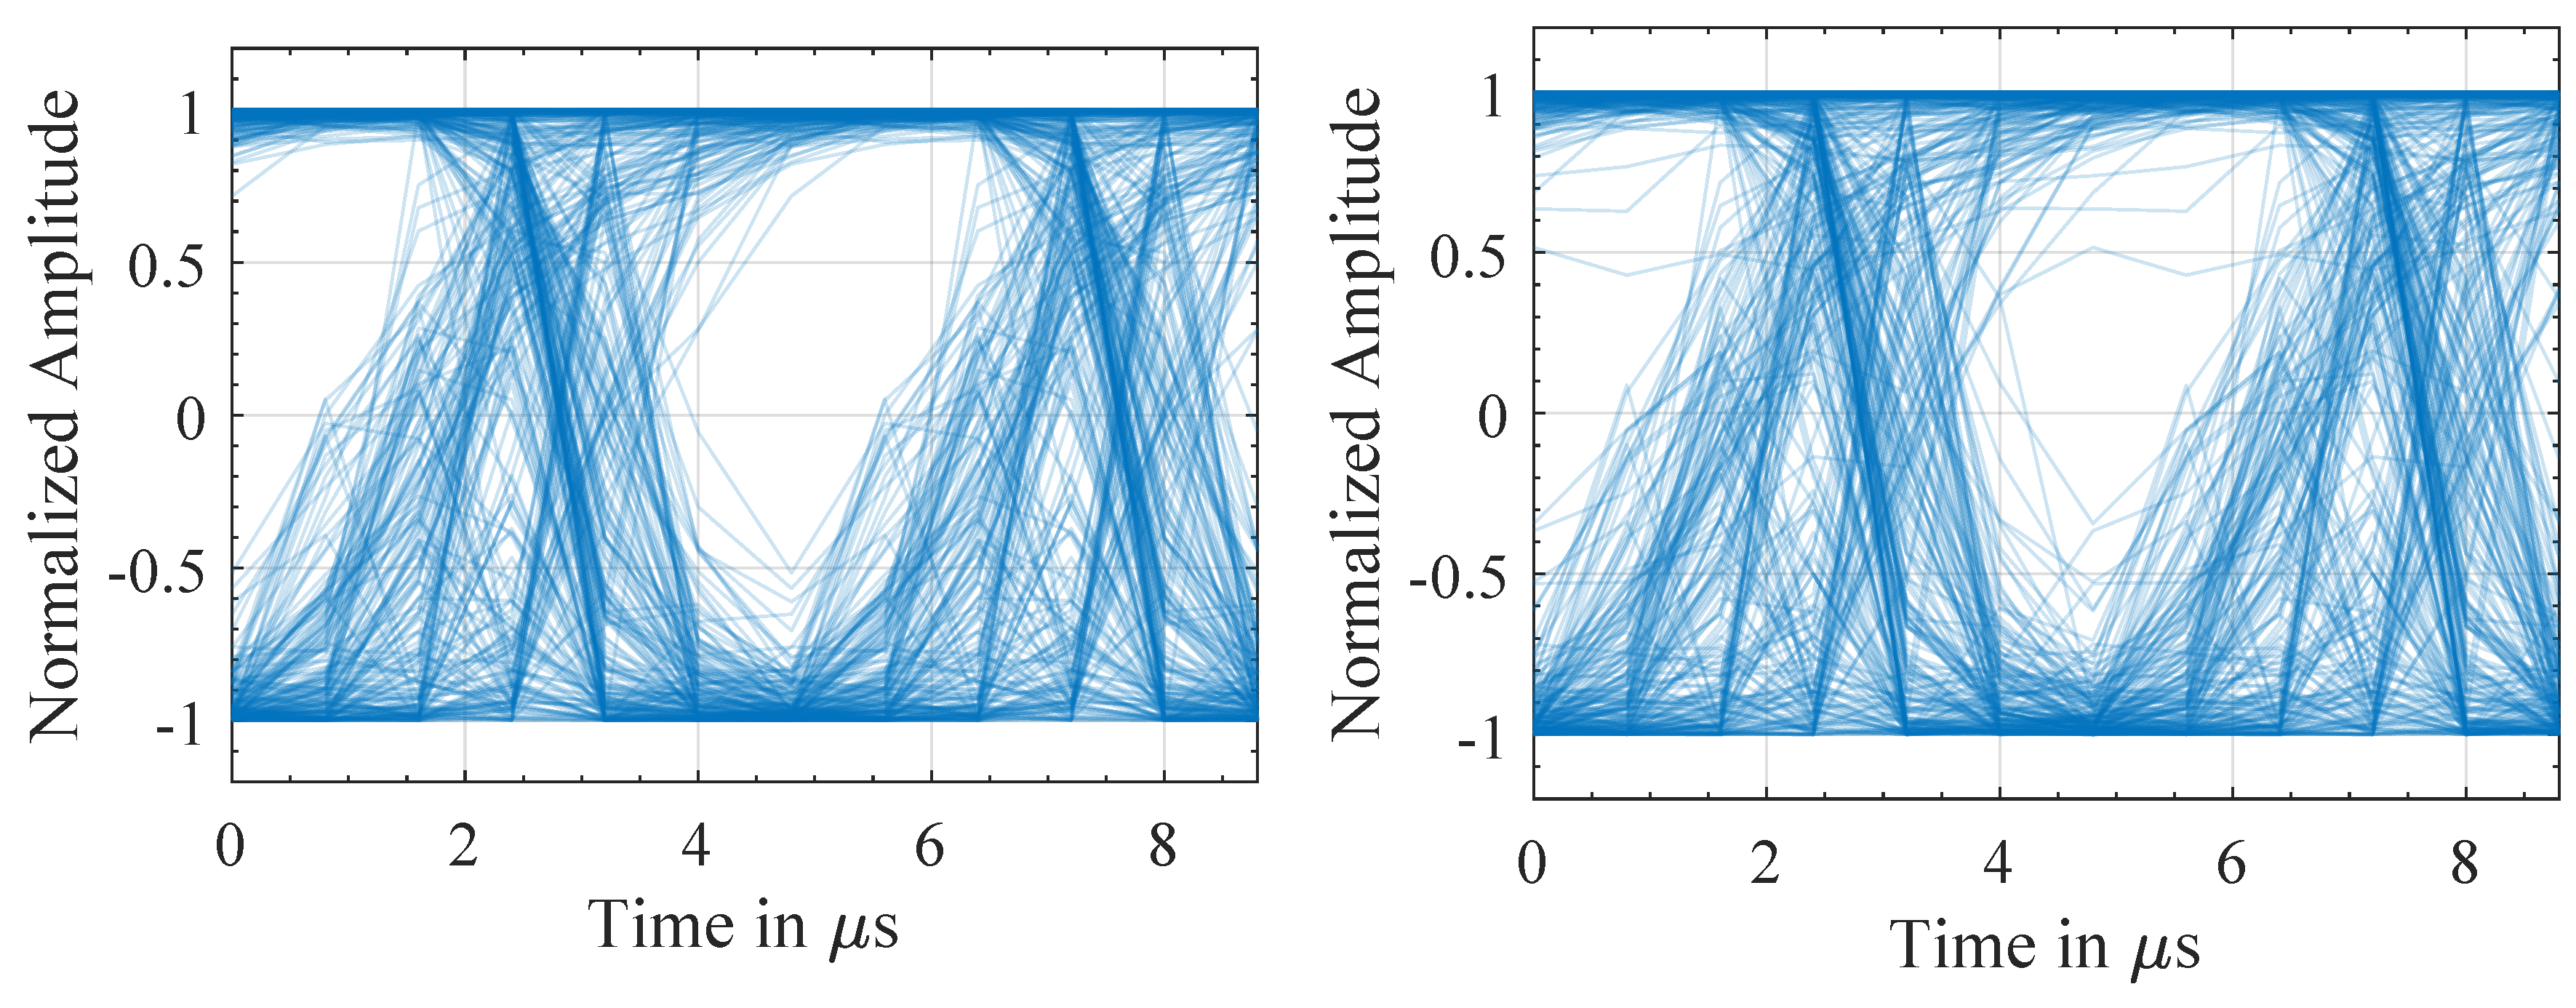
Figure 14.
Measurement of BER for 2500 packets each consisting of 200 bytes.
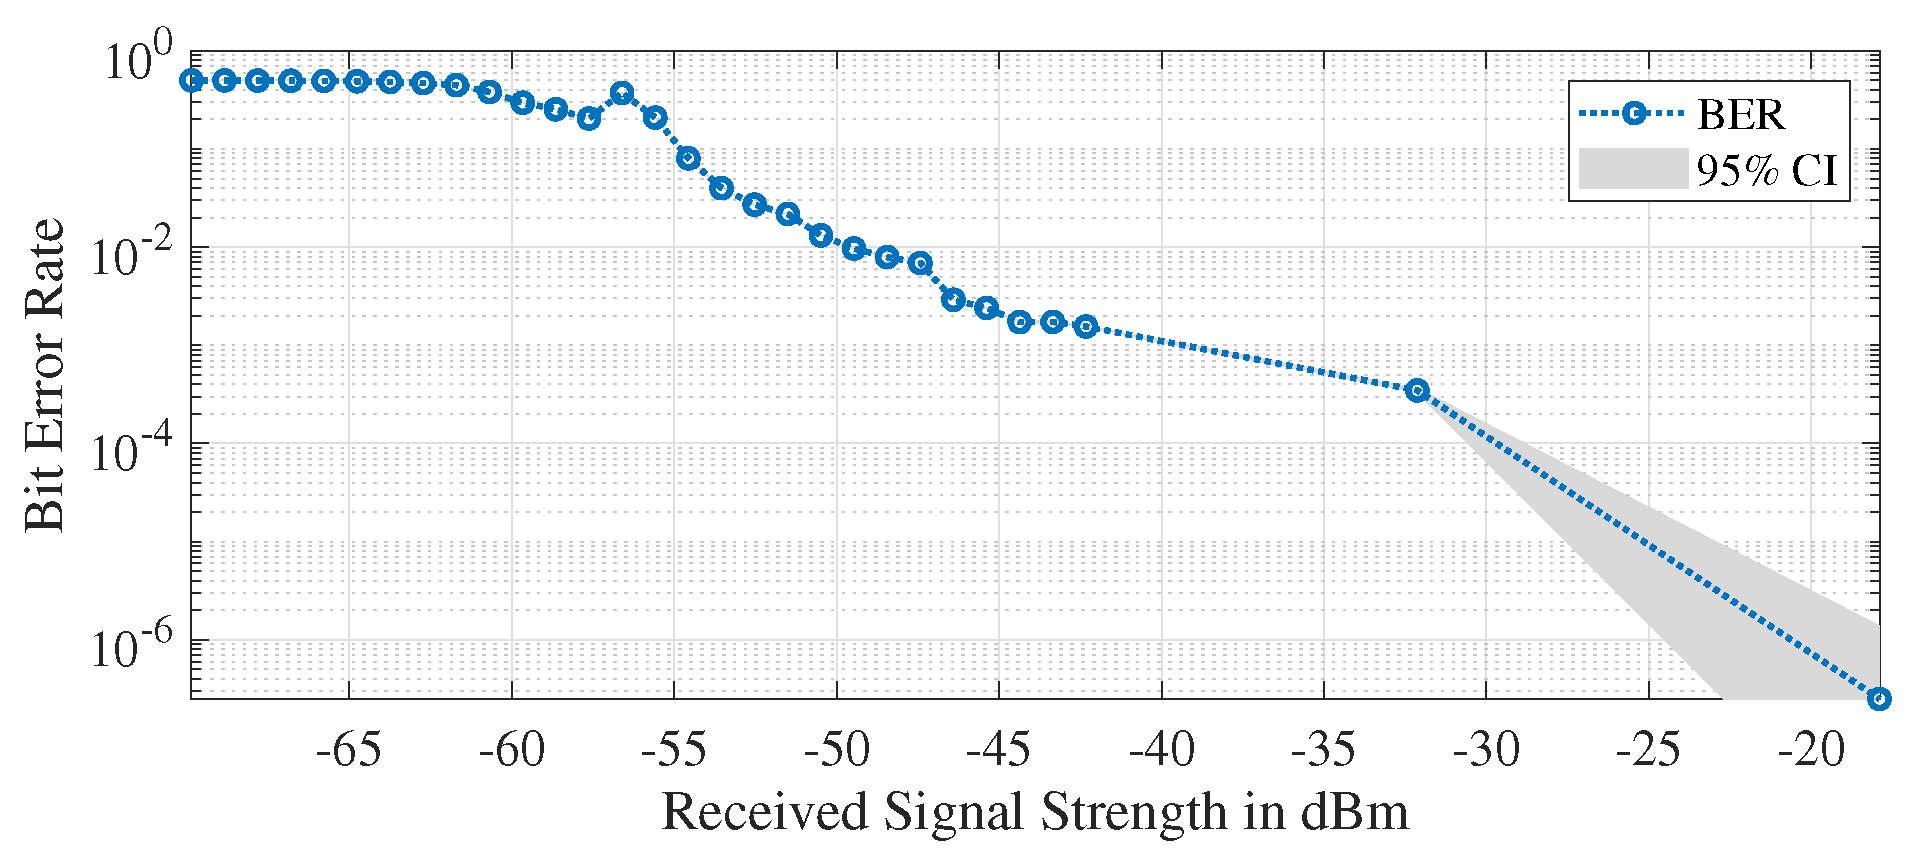
Figure 15.
Simulation of the normalized pressure intensity in a metallic hemisphere of a piezoelectric disc transducer with a diameter of 10 mm and a thickness of 2 mm (PZT-4) at its thickness extension mode along its axis of symmetry (re 20 µPa).
Figure 15.
Simulation of the normalized pressure intensity in a metallic hemisphere of a piezoelectric disc transducer with a diameter of 10 mm and a thickness of 2 mm (PZT-4) at its thickness extension mode along its axis of symmetry (re 20 µPa).
Figure 16.
Measurement of current consumption for receiving one packet of 200 bytes with (1) MCU startup phase, (2) ADC and DMA-buffering and (3) block-wise demodulation.
Figure 16.
Measurement of current consumption for receiving one packet of 200 bytes with (1) MCU startup phase, (2) ADC and DMA-buffering and (3) block-wise demodulation.
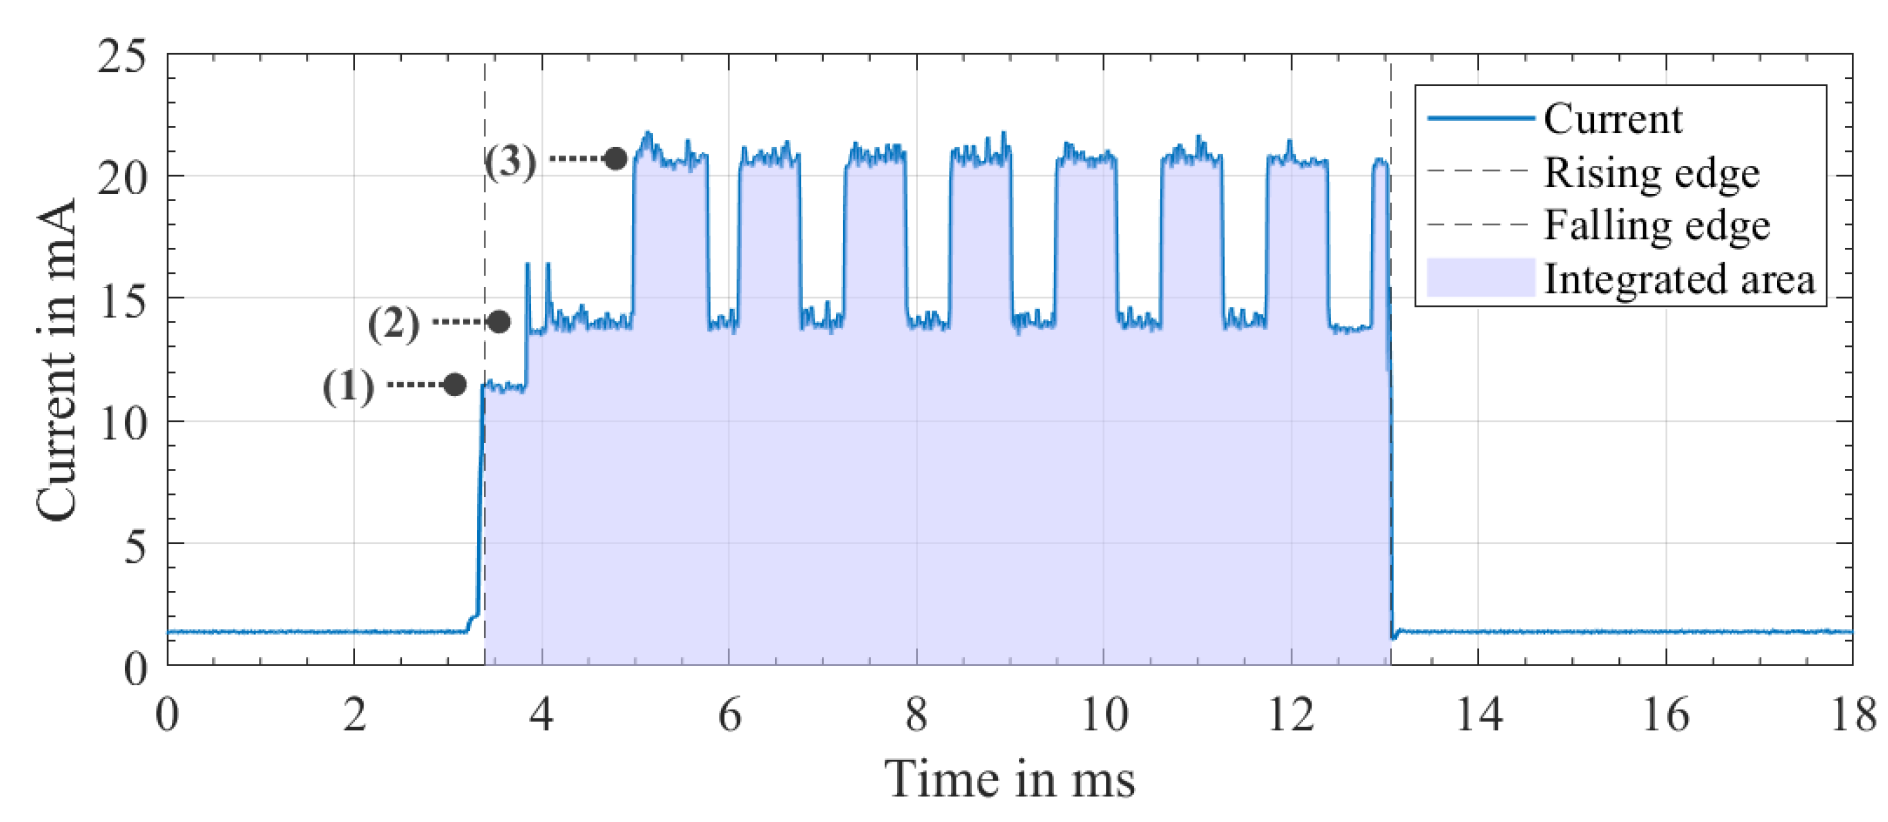
Table 2.
Evaluated modulation schemes in simulation exploiting the measured acoustic CIR with of 1.25 MHz and a low sampling rate of 5 MS/s.
Table 2.
Evaluated modulation schemes in simulation exploiting the measured acoustic CIR with of 1.25 MHz and a low sampling rate of 5 MS/s.
| Modulation | Symbol duration in |
Bits per Symbol | Data rate in |
|---|---|---|---|
| 16-FSK | 100 | 4 | 40 |
| 5-16-FSK | 100 | 12 | 120 |
| DPSK | 4.8 | 1 | 208 |
Table 3.
Measured energy consumption for transmission and reception at a supply voltage of 3.3 V.
| Duration | Charge | Energy Consumption | |
|---|---|---|---|
| in ms | in mC | in nJ/bit | |
| Transmitter | 9 | 0.113 | 233 |
| Receiver | 9.68 | 0.166 | 342 |
Disclaimer/Publisher’s Note: The statements, opinions and data contained in all publications are solely those of the individual author(s) and contributor(s) and not of MDPI and/or the editor(s). MDPI and/or the editor(s) disclaim responsibility for any injury to people or property resulting from any ideas, methods, instructions or products referred to in the content. |
© 2026 by the authors. Licensee MDPI, Basel, Switzerland. This article is an open access article distributed under the terms and conditions of the Creative Commons Attribution (CC BY) license (http://creativecommons.org/licenses/by/4.0/).
Copyright: This open access article is published under a Creative Commons CC BY 4.0 license, which permit the free download, distribution, and reuse, provided that the author and preprint are cited in any reuse.