
Submitted:
15 August 2026
Posted:
17 August 2026
You are already at the latest version
Abstract
This study investigates the sensitivity of hurricane track and intensity forecasts to various cumulus parameterization schemes with scale-awareness, including the Simplified Arakawa-Schubert (SAS), Relaxed Arakawa-Schubert (RAS), and Chikira-Sugiyama Arakawa-Wu (CSAW), within the NOAA Global Forecast System (GFS) version 17 framework. Using a set of nine initial conditions for Hurricane Ian (2022), we demonstrate that schemes utilizing a spectrum of cloud types (RAS and CSAW) produce westward-shifted trajectories compared to the single-cloud SAS scheme, which exhibits an eastward track bias. For intensity forecasts, SAS was more closely aligned with observations over RAS and CSAW. When testing the sensitivity of the CSAW convective parameterization with Wb (cloud-base vertical velocity) spectrum and entrainment rates, a critical inverse relationship was revealed between parameterized convective strength and resolved storm intensity.
Specifically, reducing the Wb range or increasing entrainment attenuates the sub-grid scale convective response, facilitating a compensatory intensification of the resolved-scale vortex and kinetic energy. Spectral analysis indicates that cloud-spectrum schemes exhibit reduced energy variance in low-frequency modes, which directly impacts large-scale steering. Furthermore, potential vorticity (PV) analysis at 500 hPa confirms that track divergence is governed by the spatial orientation of PV anomalies, with the storm propagating toward regions of maximum PV gradient. These findings underscore that the representation of the cloud spectrum and the subsequent energy partitioning between parameterized and resolved scales are fundamental controls on tropical cyclone evolution in high-resolution numerical weather prediction models.
Keywords:
cumulus parameterization
; scale-awareness
; hurricane track and intensity
; potential vorticity
; cloud spectrum
; UFS
1. Introduction
Hurricanes represent some of the most frequent and catastrophic natural hazards globally. High-fidelity forecasts of their trajectories and intensities, generated via numerical weather prediction (NWP) models, are essential for mitigating the loss of life and property. Within these models, the cumulus parameterization scheme exerts a profound influence on the simulated storm evolution. Specifically, deep convection modulates the large-scale and mesoscale steering flows through processes of detrainment and compensating subsidence ([1]; hereafter AS).
However, the underlying physical processes remain highly complex. Bassill[2] demonstrated that the trajectory of Hurricane Sandy could be realistically reproduced within the Global Forecast System (GFS) by adopting the cumulus parameterization from the European Centre for Medium-Range Weather Forecasts (ECMWF) model. This finding suggests that the historical discrepancies between GFS and ECMWF track forecasts may stem primarily from differing deep convective parameterization schemes rather than variations in initial conditions or spatial resolution. Specifically, the ECMWF scheme appears to facilitate a more accurate representation of the interaction between the cyclone and the mid-latitude trough to its west.
Recent research has further explored the sensitivity of hurricane forecast skill to various cumulus parameterization schemes. For instance, Biswas[3] conducted a comprehensive suite of test forecasts for Atlantic and Eastern North Pacific storms using a nested subdomain where convection was explicitly resolved without parameterization. Their findings indicate that intensity forecasts within this convection-permitting nest remain sensitive to the specific cumulus parameterization employed on the coarser outer grids. Similarly, Lim[4]demonstrated that in models with ~25 km horizontal grid spacing, attenuating the strength of parameterized deep convection induces mid-to-upper tropospheric cooling and drying, alongside lower-tropospheric warming and moistening. This shift enhances conditional instability, thereby creating an environment more conducive to tropical cyclone intensification.
The AS parameterization categorizes various cloud types based on their fractional entrainment rates. Specifically, cloud types characterized by weaker entrainment can attain higher altitudes before their positive buoyancy is neutralized. Subsequent variants of the AS scheme, including the Relaxed Arakawa–Schubert (RAS; [5]) and Simplified Arakawa–Schubert (SAS; [6]) models, similarly differentiate convective elements by their entrainment characteristics. In some formulations, the entrainment rate is parameterized as being inversely proportional to the updraft velocity. Supporting this mechanism, Neggers[7] found that cloud parcels with greater cloud-base vertical velocity, higher moist static energy, and increased total water content exhibit reduced entrainment, thereby maintaining higher buoyancy and reaching greater vertical extents.
In contrast, the Chikira-Sugiyama[8] scheme distinguishes cloud types by their cloud-base vertical velocities (Wb). In this parameterization, Wb values are constrained within a spectrum defined by specified minimum (zero) and maximum thresholds, with the latter reaching several meters per second. This study demonstrates that by modulating these velocity boundaries, we can significantly influence both hurricane trajectory and intensity forecasts. Consequently, the primary objectives of this paper are threefold: (1) to investigate the sensitivity of hurricane evolution to variations in Wb limits; (2) to perform a comparative analysis of tracks simulated by the CS, RAS, and SAS parameterizations; and (3) to propose pathways for future enhancements in cumulus parameterization modeling.
The remainder of this paper is structured as follows: Section 2 details the numerical model configuration and the design of the experiments. The simulation results and their implications are analyzed in Section 3. Finally, Section 4 provides a summary of our findings and offers concluding remarks on future research direction.
2. Model Descriptions and Experiment Design
We conducted atmospheric-only forecast experiments using the NOAA Global Forecast System version 17 (GFS.v17; [9]) framework. This experimental model shares the same atmospheric component as the coupled GFS.v17, which is scheduled for operational implementation in December 2026. Due to computational cost constraints, we used the C768L127 version at about 13km horizontal resolution instead of the C1152L127 version at about 9-km horizontal resolution planned for the operational implementation. GFS.v17 utilizes the Thompson microphysics suite [10]—a hybrid single and double-moment scheme that advects and predicts the mixing ratios and number concentrations of both condensates and hydrometeors, with exceptions for snow and graupel for single moments with computation considerations . At the ~13 km horizontal spacing of the C768 grid, deep convection is partially resolved within the “gray zone”; consequently, the implementation of scale-aware cumulus parameterizations is essential to maintain model consistency across varying resolutions.
The current operational GFS utilizes the scale-aware SAS cumulus parameterization, which features a single cloud type determined by the maximum attainable cloud-top level. While a spectrum of clouds may emerge over successive time steps, the instantaneous entrainment rate is governed by environmental relative humidity and cloud height [11], consistent with the ECMWF formulation [Bechtold et al., 2014]. Scale awareness is incorporated into SAS by defining the updraft fractional area as inversely proportional to the grid-cell area and proportional to the updraft radius—a parameter determined by cloud-base height [17]. Within this framework, the downdraft mass flux is maintained as a fixed fraction of the updraft mass flux. Entrainment and detrainment rates remain constant with height between the lifting condensation level (LCL) and the downdraft origination level. These rates are further parameterized based on the LCL-to-surface layer thickness, ensuring that approximately 5% of the mass flux at the LCL penetrates to the surface.
The RAS cloud model was simplified by assuming that the normalized updraft mass flux varies linearly with height and by neglecting the thermodynamic effects of cloud condensate loading and moisture content in buoyancy calculations. The quasi-equilibrium closure is achieved via an iterative process that “relaxes” the atmospheric profile toward an equilibrium state over a prescribed timescale, rather than requiring an instantaneous adjustment of the environment by all cloud ensembles. Additionally, a downdraft formulation based on Cheng and Arakawa [18] was implemented in RAS, in which downdrafts—either saturated or unsaturated—are driven by precipitation loading and evaporative cooling. The scale-aware implementation in RAS is conceptually similar to that of the SAS scheme.
In the CS scheme, the number of cloud types is an adjustable parameter. While a spectrum of 10–20 cloud types typically suffices for simulating climate and seasonal variability—including the Madden–Julian Oscillation [19]—this study utilizes 50 cloud types to provide higher spectral resolution. The entrainment rate is dynamically determined by the relationship between vertical velocity and buoyancy; specifically, higher vertical velocities result in reduced entrainment, as parcels traverse layers more rapidly, limiting environmental mixing. Unlike the SAS, detrainment in CS occurs exclusively at the cloud top. Furthermore, the quasi-equilibrium assumption is relaxed through the implementation of a prognostic convective kinetic energy (CKE) framework [20]. Downdrafts are initiated by precipitation, with mass-conserving phase changes occurring throughout the hydrometeor descent.
Scale-awareness is incorporated following the framework of Arakawa and Wu (AW, [21]), applied at every vertical level and across all cloud types. This modified version of the CS scheme is designated as CSAW (pronounced “see-saw”). Within the CSAW framework, the convective fluxes are parameterized by accounting for the sub-grid scale fraction of the total convective area. The convective fluxes in CSAW are parameterized as
where and represent convective perturbation of vertical velocity and scalar, respectively. There is a value of and a value of for each cloud type. An equation of the form (1) is used for each cloud type separately. The convective transport is parameterized in terms of , which is determined from the conventional CS cumulus parameterization. As increases toward 1 when grid-size decreases, the convective flux gradually decreases and the dynamical core begins to explicitly resolve updrafts in a grid cell, resulting in a smooth transition from conventional cumulus parameterization to explicit simulation. Larger Wb usually corresponds to a spectrum convective cloud with larger vertical transport and less entrainments. A short comparison of the three schemes is listed in Table 1 below.
Hurricane Ian (2022) was selected for this study due to its immense scale and catastrophic impact, eventually becoming the third costliest weather disaster on record globally. The system originated from a tropical wave that propagated off the West African coast, traversing the central tropical Atlantic toward the Windward Islands. By the morning of September 23, the wave exhibited sufficient organization for designation as a tropical depression. The system subsequently intensified into a tropical storm before undergoing further strengthening to become a Category 4 hurricane. At its peak, Ian ranked as the fifth-strongest hurricane to make landfall in the state of Florida, U.S.A.
To take into account of the uncertainties in initial conditions (ICs), we conducted a suite of 240-hour simulations with a set of nine distinct ICs for each scheme (SAS, RAS, and CSAW), with cycles initiated every 6 hours from 00:00 UTC on September 22, 2022, to 00:00 UTC on September 24, 2022. The members are assembled to follow targeted observation time for analysis. Additionally, a series of sensitivity experiments was performed to evaluate the specific impacts of spectral representation and entrainment rate formulations on hurricane intensification and trajectory.
3. Results
3.1. Tracks and Intensities from Ensemble Simulations
This section evaluates the aggregated results for the three deep convective parameterizations across varying initial conditions. Regarding the simulated tracks (Figure 1a), the single-cloud-type SAS scheme exhibits an eastward bias, whereas the RAS and CSAW schemes—which both employ cloud spectra—produce similar westward-shifting trajectories. During the initial forecast period, the SAS track remains north of both RAS and CSAW; however, this relationship reverses post-landfall. Notably, CSAW displays the largest ensemble spread among the three schemes. In terms of intensity, as measured by minimum sea-level pressure (Figure 1b), CSAW generates the deepest intensification during the first 125 hours, while SAS produces the strongest storm between hours 125 and 175. Overall, the SAS intensity forecasts align most closely with observations. It should be noted that intensity can be tuned via specific parameters, as demonstrated in subsequent sections. Furthermore, none of the schemes successfully captured the abrupt weakening of the hurricane at hour 180—an analytical gap that warrants future investigation. Ultimately, the schemes utilizing a spectrum of cloud types (CSAW and RAS) yield more similar results in both track and intensity.
To investigate the relationship between hurricane trajectory and intensification, representative west-northward and east-southward tracks were selected for each scheme (Figure 2). Across all parameterizations, the west-northward track is consistently associated with greater intensity and a delayed peak in storm strength. For example, the east-southward track in the SAS ensemble reaches its peak intensity at hour 122 with a minimum sea-level pressure (MSLP) of 950 mb; in contrast, the west-northward track peaks significantly later at hour 180, reaching a deeper MSLP of 930 mb (Figure 2e). It is important to note that multiple factors—including entrainment and detrainment rates—concurrently influence these forecast outcomes. Track discrepancies heavily modulate intensity through land and sea surface interactions: west-northward tracks allow the storm to remain over warm waters longer to gain energy and intensify, whereas east-southward tracks force interactions with the Cuban landmass, rapidly weakening the system. Furthermore, the SAS scheme remains a highly optimized operational framework whose convection parameters have undergone extensive tuning over several decades.
3.2. Influence from Different Spectrum
To further explore the influence of the cloud spectrum on hurricane trajectory, a representative initial condition (September 23 00UTC) was selected such that the resulting tracks for SAS, RAS, and CSAW closely replicate the ensemble mean (Figure 3). Under these conditions, the RAS and CSAW trajectories are nearly coincident and closer to observation before landing, positioned westward of the SAS track. This spatial divergence persists despite the fact that CSAW generates the highest peak intensity among the three schemes, suggesting that the structural differences in cloud representation significantly modulate the steering flow.
Utilizing the initial conditions from 00:00 UTC on September 23, 2022, we conducted two additional sensitivity experiments to evaluate the impact of the cloud spectrum’s velocity range. These experiments, EXP SP1 and EXP SP2, defined the Wb range from 0–0.26 m s⁻¹ and 0–0.48 m s⁻¹, respectively. For comparison, the control run (EXP CTL) utilized a Wb range of 0–0.30 m s⁻¹. The results indicate that EXP SP1, characterized by a narrower Wb range, favors a more west-northward trajectory. Furthermore, this configuration yields a more intense hurricane, evidenced by a significantly lower minimum sea-level pressure (MSLP) (Figure 4).
3.3. Influence from Different Entrainment Parameters and Energy Spectrum
Shin et al. [22] examined how adjusting the entrainment rate in the SAS convection scheme influences Hurricane Analysis and Forecast System-A (HAFS-A) forecast performance. The research demonstrated that refining the entrainment formulation was crucial to the deployment of HAFS-A, as it substantially reduced intensity forecast errors. Given that modulating Wb and the entrainment rate exerts analogous effects on convective transport, we conducted two additional sensitivity experiments using the same configuration as EXP CTL. These experiments, designated CSAW-be and CSAW-se, represent configurations with a larger and smaller entrainment rate magnitude, respectively. This approach allows us to determine if the sensitivities observed in the Wb spectrum are consistent with those driven by direct modifications to the entrainment formulation.
In CSAW, the entrainment is written as:
where a is a constant between 0 and 1 and is set to 0.15, B is the buoyancy of the parcel, w is the vertical velocity of each cloud type. Cε is a constant between 0 and 1, and is set to 0.6 as default. The big entrainment case (CSAW-be) is set to 0.9 while the small entrainment case (CSAW-se) is set to 0.3. This formula means that more energy from large buoyancy is needed to accelerate entrained air into a strong updraft represented by large velocity.
The CSAW-be configuration, characterized by an increased entrainment rate, exhibits reduced vertical transport and an attenuated parameterized convective response. Paradoxically, this results in a significantly more intense hurricane with a pronounced westward and northward track bias (Figure 5). These results are qualitatively similar to those observed in EXP SP1 with a reduced Wb range. This suggests that when the cumulus parameterization is less active or “weaker,” the model relies more heavily on explicitly resolved processes, which in this case facilitates more robust intensification and a shifting trajectory.
The observed relationship between hurricane intensity and parameterized deep convection is consistent with the findings of [4]. In EXP SP1, the parameterized convection is weakened due to the combination of lower vertical velocities and increased entrainment rates across the cloud spectrum. This suppression of sub-grid scale activity leads to a compensatory increase in the resolved-scale intensification. This phenomenon—where a reduction in parameterized or sub-grid scale kinetic energy facilitates the intensification of resolved kinetic energy—aligns with the mechanisms reported by [23] in the context of stratocumulus and cumulus cloud regimes. The other possible reason is that reducing parameterized convection makes the atmosphere less stable, facilitating the resolved convection.
To further elucidate how different schemes and parameter configurations influence energy distribution, we present the energy spectra for the various parameterizations in Figure 6a, and for the CSAW sensitivity tests (spectrum and entrainment adjustments) in Figure 6b. The two schemes employing a cloud spectrum (RAS and CSAW) exhibit reduced energy variance in the low-frequency domain; this shared spectral characteristic likely underpins their similar performance in hurricane track and intensity forecasting. Notably, modulating the entrainment rate appears to have a less pronounced effect on the energy distribution than adjusting Wb, particularly at low frequencies. While a reduction in entrainment produces negligible changes in the energy spectrum, increasing the Wb range induces a significant rise in energy variance across the spectral profile.
3.4. Heat Fluxes, and Hurricane Intensity
Wind-Induced Surface Heat Exchange (WISHE) is the classical theory for tropical cyclone intensification, which posits that an increase in surface wind speed facilitates greater energy transfer from the ocean to the atmosphere. This enhanced flux leads to a more intense storm, which in turn drives further energy transfer in a positive feedback loop ([24]and [25]). While some studies suggest this wind-driven mechanism may not be strictly essential (e.g., [26]; [27]), they propose that intensification instead occurs through deep convective vortex structures fueled by sea-to-air moisture fluxes, even under low-wind conditions. Our results show that EXP SP1 produced a robust hurricane with a minimum center pressure below 985 hPa and a regional mean kinetic energy of 163.6 m² s⁻² (Figure 7). This corresponds to a mean wind speed of 12.7 m s⁻¹, representing a 30% increase over EXP SP2, alongside a 28% increase in regional mean surface latent heat flux. While these increases in wind speed and latent heat flux align with WISHE theory, the variations in the cloud spectrum within the CSAW scheme likely play a critical role in modulating the hurricane’s vortex structure and overall intensity.
3.5. Impact of Potential Vorticity and Steering Winds on Hurricane Tracks
Potential Vorticity (PV) has been widely utilized to analyze hurricane steering flows and the interaction between a tropical cyclone and its environment (e.g., [28]). PV anomalies significantly influence storm motion, though their quantitative impact depends heavily on their spatial orientation relative to the vortex center. Figure 8 illustrates the 500 hPa PV fields on Septermber 28 00UTC prior to the divergence of the simulated tracks in EXP SP1 and EXP SP2. EXP SP1 exhibits a larger positive PV anomaly situated to the northwest of the storm center compared to EXP SP2. At the steering level (500 hPa), EXP SP2 is characterized by stronger westerly winds that drive the hurricane further eastward (Figure 9). In EXP SP1, the PV maximum leads the geopotential center toward the north and east, whereas in EXP SP2, the lead is primarily eastward. Specifically, the 500 hPa geopotential centers are located at 26°N, 84°W for EXP SP1 and 27°N, 81°W for EXP SP2 (Figure 9), while the corresponding PV maxima are situated at 26.5°N, 83.5°W and 27°N, 80°W, respectively (Figure 8). These results demonstrate that the hurricane consistently propagates along the direction of the local PV gradient.
4. Discussion and Conclusions
This study investigated the sensitivity of hurricane track and intensity forecasts to different cumulus parameterization schemes—SAS, RAS, and CSAW—using the GFS.v17 model at a horizontal resolution of 13 km. Our results demonstrate that schemes incorporating a spectrum of cloud types (RAS and CSAW) produce westward-shifted trajectories compared to the single-cloud SAS scheme, which exhibited at eastward bias. While SAS provided intensity forecasts most closely aligned with observations for Hurricane Ian, it was noted that the intensity in the CSAW framework is highly sensitive to internal parameters, specifically the cloud-base vertical velocity (Wb) and entrainment rates.
The investigation into the Wb spectrum revealed a critical inverse relationship between parameterized convective strength and resolved hurricane intensity. Experiments with a narrower Wb range (EXP SP1) or increased entrainment (CSAW-be) resulted in a weaker parameterized convective response. Paradoxically, this suppression of sub-grid scale activity facilitated a more robust intensification of the resolved vortex, consistent with the energy partitioning theories of [4] and [23]. Specifically, a reduction in parameterized kinetic energy allowed for a compensatory increase in resolved-scale kinetic energy, leading to a deeper and more organized storm. Spectral analysis further elucidated the dynamical drivers of these track deviations. Schemes with a cloud spectrum showed reduced energy variance in low-frequency modes, which are closely associated with large-scale easterly steering flows.
Furthermore, Potential Vorticity (PV) analysis at the 500 hPa level confirmed that the hurricane trajectory is governed by the spatial orientation of PV anomalies. In cases where the parameterization generated larger PV anomalies to the storm’s northwest (right-ward), the storm followed this gradient, whereas stronger westerlies in other configurations drove the storm further eastward. These findings underscore that the representation of the cloud spectrum is a fundamental control on both the thermodynamic intensification and the dynamical steering of tropical cyclones in high-resolution NWP models.
Although we present results exclusively for Hurricane Ian in the Atlantic basin, these findings are consistent with analysis for Hurricanes Harvey, Irma, and Matthew. Nevertheless, further investigation across different seasons and ocean basins is required, which we reserve for future work.
Data: Availability Statement
The data presented in this study are available downloading at https://www.nhc.noaa.gov/gis/archive_besttrack.php.
Acknowledgments
This work was supported by the US National Weather Service Next Generation Global Prediction System project. Computational resources were provided by the Office of Modeling and Development’s CRAY and DELL cluster. Chiritain Boyer and Junghoon Shin performed OMD internal review of the paper and led to the improvement of the manuscript. Discussions with Jongil Han, Zhan Zhang, Weiguo Wang, Shrinivas Moorthi, Bin Liu, Jiayi Peng, and our colleagues in NOAA and University are beneficial for this work.
References
- Arakawa, A. and W. H. Schubert (1974), Interaction of a cumulus cloud ensemble with the large-scale environment, Part I. J. Atmos. Sci., 31, 674–701. [CrossRef]
- Bassill, N. P. (2014), Accuracy of early GFS and ECMWF Sandy (2012) track forecasts: Evidence for a dependence on cumulus parameterization, Geophys. Res. Lett., 41, 3274–3281. [CrossRef]
- Biswas, M. K., L. Bernardet, and J. Dudhia (2014), Sensitivity of hurricane forecasts to cumulus parameterizations in the HWRF model, Geophys. Res. Lett., 41, 9113–9119. [CrossRef]
- Lim, Y. K., S. D. Schubert, O. Reale, M. I. Lee, A. M. Molod, and M. J. Suarez (2015), Sensitivity of tropical cyclones to parameterized convection in the NASA GEOS-5 model, J. Clim., 28 (2), 551-573. [CrossRef]
- Moorthi, S., and M. J. Suarez, 1992: Relaxed Arakawa-Schubert: A parameterization of moist convection for general circulation models. Mon. Wea. Rev., 120, 978-1002. [CrossRef]
- Pan, H.-L., and W.-S. Wu, 1995: Implementing a mass flux convective parameterization package for the NMC Medium- Range Forecast model. NMC Office Note 409, 40 pp.
- Neggers, R. A. J., A. P. Siebesma, and H. J. J. Jonker, 2002: A multiparcel method for shallow cumulus convection. J. Atmos. Sci., 59 , 1655–1668. [CrossRef]
- Chikira, M., and M. Sugiyama (2010a), A cumulus parameterization with state-dependent entrainment rate. Part I: Description and sensitivity to temperature and humidity profiles. J. Atmos. Sci., 67, 2171–2193. [CrossRef]
- Yang et al., 2020: Model Upgrade Plan and Initial Results from a Prototype NCEP Global Forecast System Version 16, 10th Conference on Transition of Research to Operations, 100th AMS Annual Meeting, Boston. https://ams.confex.com/ams/2020Annual/meetingapp.cgi/Paper/362797.
- Thompson, G., Field, P. R., Rasmussen, R. M., and Hall, W. D. (2008): Explicit forecasts of winter precipitation using an improved bulk microphysics scheme. Part II: Implementation of a new snow parameterization. Mon. Wea. Rev., 136, 5095-5115. [CrossRef]
- Han, J., W. Wang, Y. C. Kwon, S.-Y. Hong, V. Tallapragada, and F. Yang, 2017: Updates in the NCEP GFS Cumulus Convection Schemes with Scale and Aerosol Awareness. Wea. and Forecasting, 32, 2005-2017. [CrossRef]
- Cheng, M.-D., and A. Arakawa, 1997: Inclusion of rain water budget and convective downdrafts in the Arakawa-Schubert cumulus parameterization. J. Atmos. Sci., 54, 1359-1378. [CrossRef]
- Chikira, M., and M. Sugiyama (2010b), A cumulus parameterization with state-dependent entrainment rate. Part II: Impact on climatology in a general circulation model. J. Atmos. Sci., 67, 2194–2211. [CrossRef]
- Pan, D.-M., and D. A. Randall, 1998: A Cumulus Parameterization with a Prognostic Closure. Quart. J. Roy. Met. Soc., 124, 949-981. [CrossRef]
- Arakawa, A. and C.-M. Wu (2013), A unified representation of deep moist convection in numerical modeling of the atmosphere. J. Atmos. Sci., 70,1977-1992. [CrossRef]
- Shin, J. H., B. Liu, Z. Zhang, J. Han, A. Mehra, V Tallapragada, 2024: The impact of adjusting the deep convection parameterization on HAFS intensity forecast improvement. 104th Annual meeting, Baltimore, MD, Amer. Meteor. Soc., 5A.6, https://ams.confex.com/ams/104ANNUAL/webprogram/Paper433739.html.
- Cheng A., and K.-M. Xu (2008), Simulation of boundary-layer cumulus and stratocumulus clouds using a cloud-resolving model with low- and third-order turbulence closures. J. Meteor. Soc. Jpn., 86A, 67-86. [CrossRef]
- Emanuel, K. A., 1986: An air–sea interaction theory for tropical cyclones. Part I: Steady-state maintenance. J. Atmos. Sci., 43, 585–605. [CrossRef]
- Emanuel, K. A.,, 2003: Tropical cyclones. Annu. Rev. Earth Planet. Sci., 31, 75–104. [CrossRef]
- Van Sang, N.,R. K. Smith, and M. T. Montgomery, 2008: Tropical cyclone intensification and predictability in three dimensions. Quart. J. Roy. Meteor. Soc., 134, 563–582. [CrossRef]
- Montgomery, M. T., N. V. Sang, R. K. Smith, and J. Persing, 2009: Do tropical cyclones intensify by WISHE? Quart. J. Roy. Meteor. Soc., 135, 1697–1714. [CrossRef]
- Wu, C.-C., and K. A. Emanuel,1995: Potential vorticity diagnostics of hurricane movement. Part I: A case study of Hurricane Bob (1991). Mon. Wea. Rev., 123, 69–92. [CrossRef]
Figure 1.
Forecasted hurricane (a) tracks and (b) intensity, represented by minimum central sea-level pressure (hPa). The horizontal axis is the forecast hour in (b). Results are shown for three deep convective schemes: CSAW (green), SAS (blue), and RAS (red). Solid lines indicate the ensemble mean across nine initial conditions, while shaded regions represent ±1 standard deviation. The black solid line is the track and intensity from (National Hurricane Center ) NHC Best Track.
Figure 1.
Forecasted hurricane (a) tracks and (b) intensity, represented by minimum central sea-level pressure (hPa). The horizontal axis is the forecast hour in (b). Results are shown for three deep convective schemes: CSAW (green), SAS (blue), and RAS (red). Solid lines indicate the ensemble mean across nine initial conditions, while shaded regions represent ±1 standard deviation. The black solid line is the track and intensity from (National Hurricane Center ) NHC Best Track.
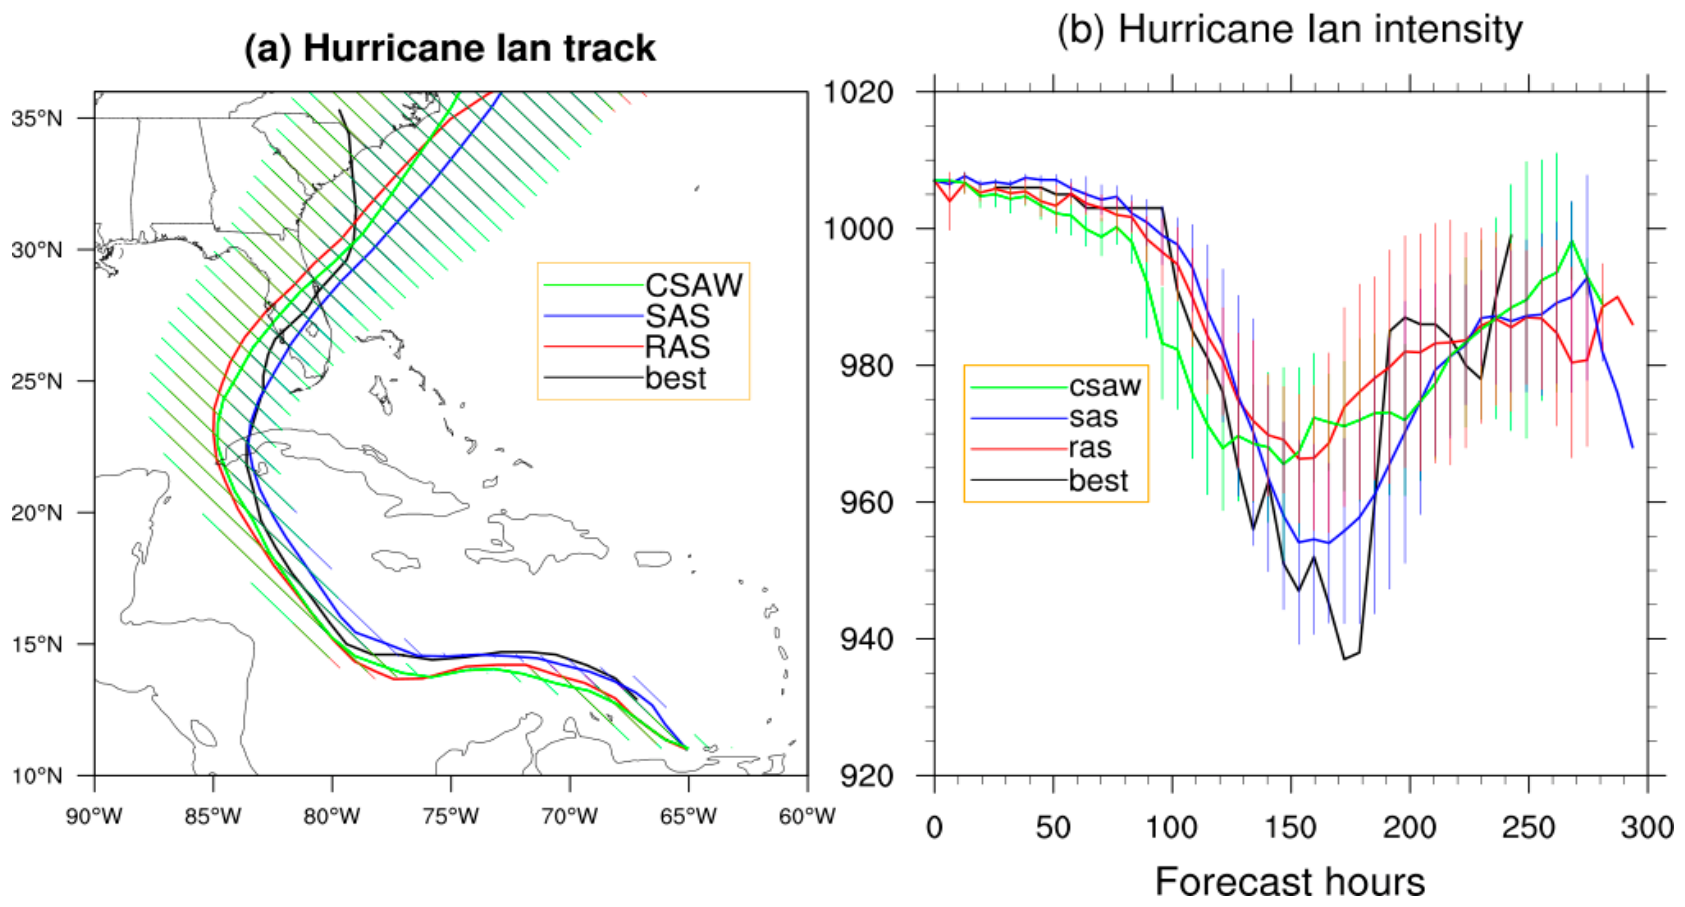
Figure 2.
Hurricane (left column) tracks and central sea-level pressure (right column) for the CSAW (green), SAS (blue), and RAS (red) convection schemes. Results are shown for two distinct initial conditions, producing west-northward (solid colored lines) and east-southward (dashed colored lines) trajectories.
Figure 2.
Hurricane (left column) tracks and central sea-level pressure (right column) for the CSAW (green), SAS (blue), and RAS (red) convection schemes. Results are shown for two distinct initial conditions, producing west-northward (solid colored lines) and east-southward (dashed colored lines) trajectories.
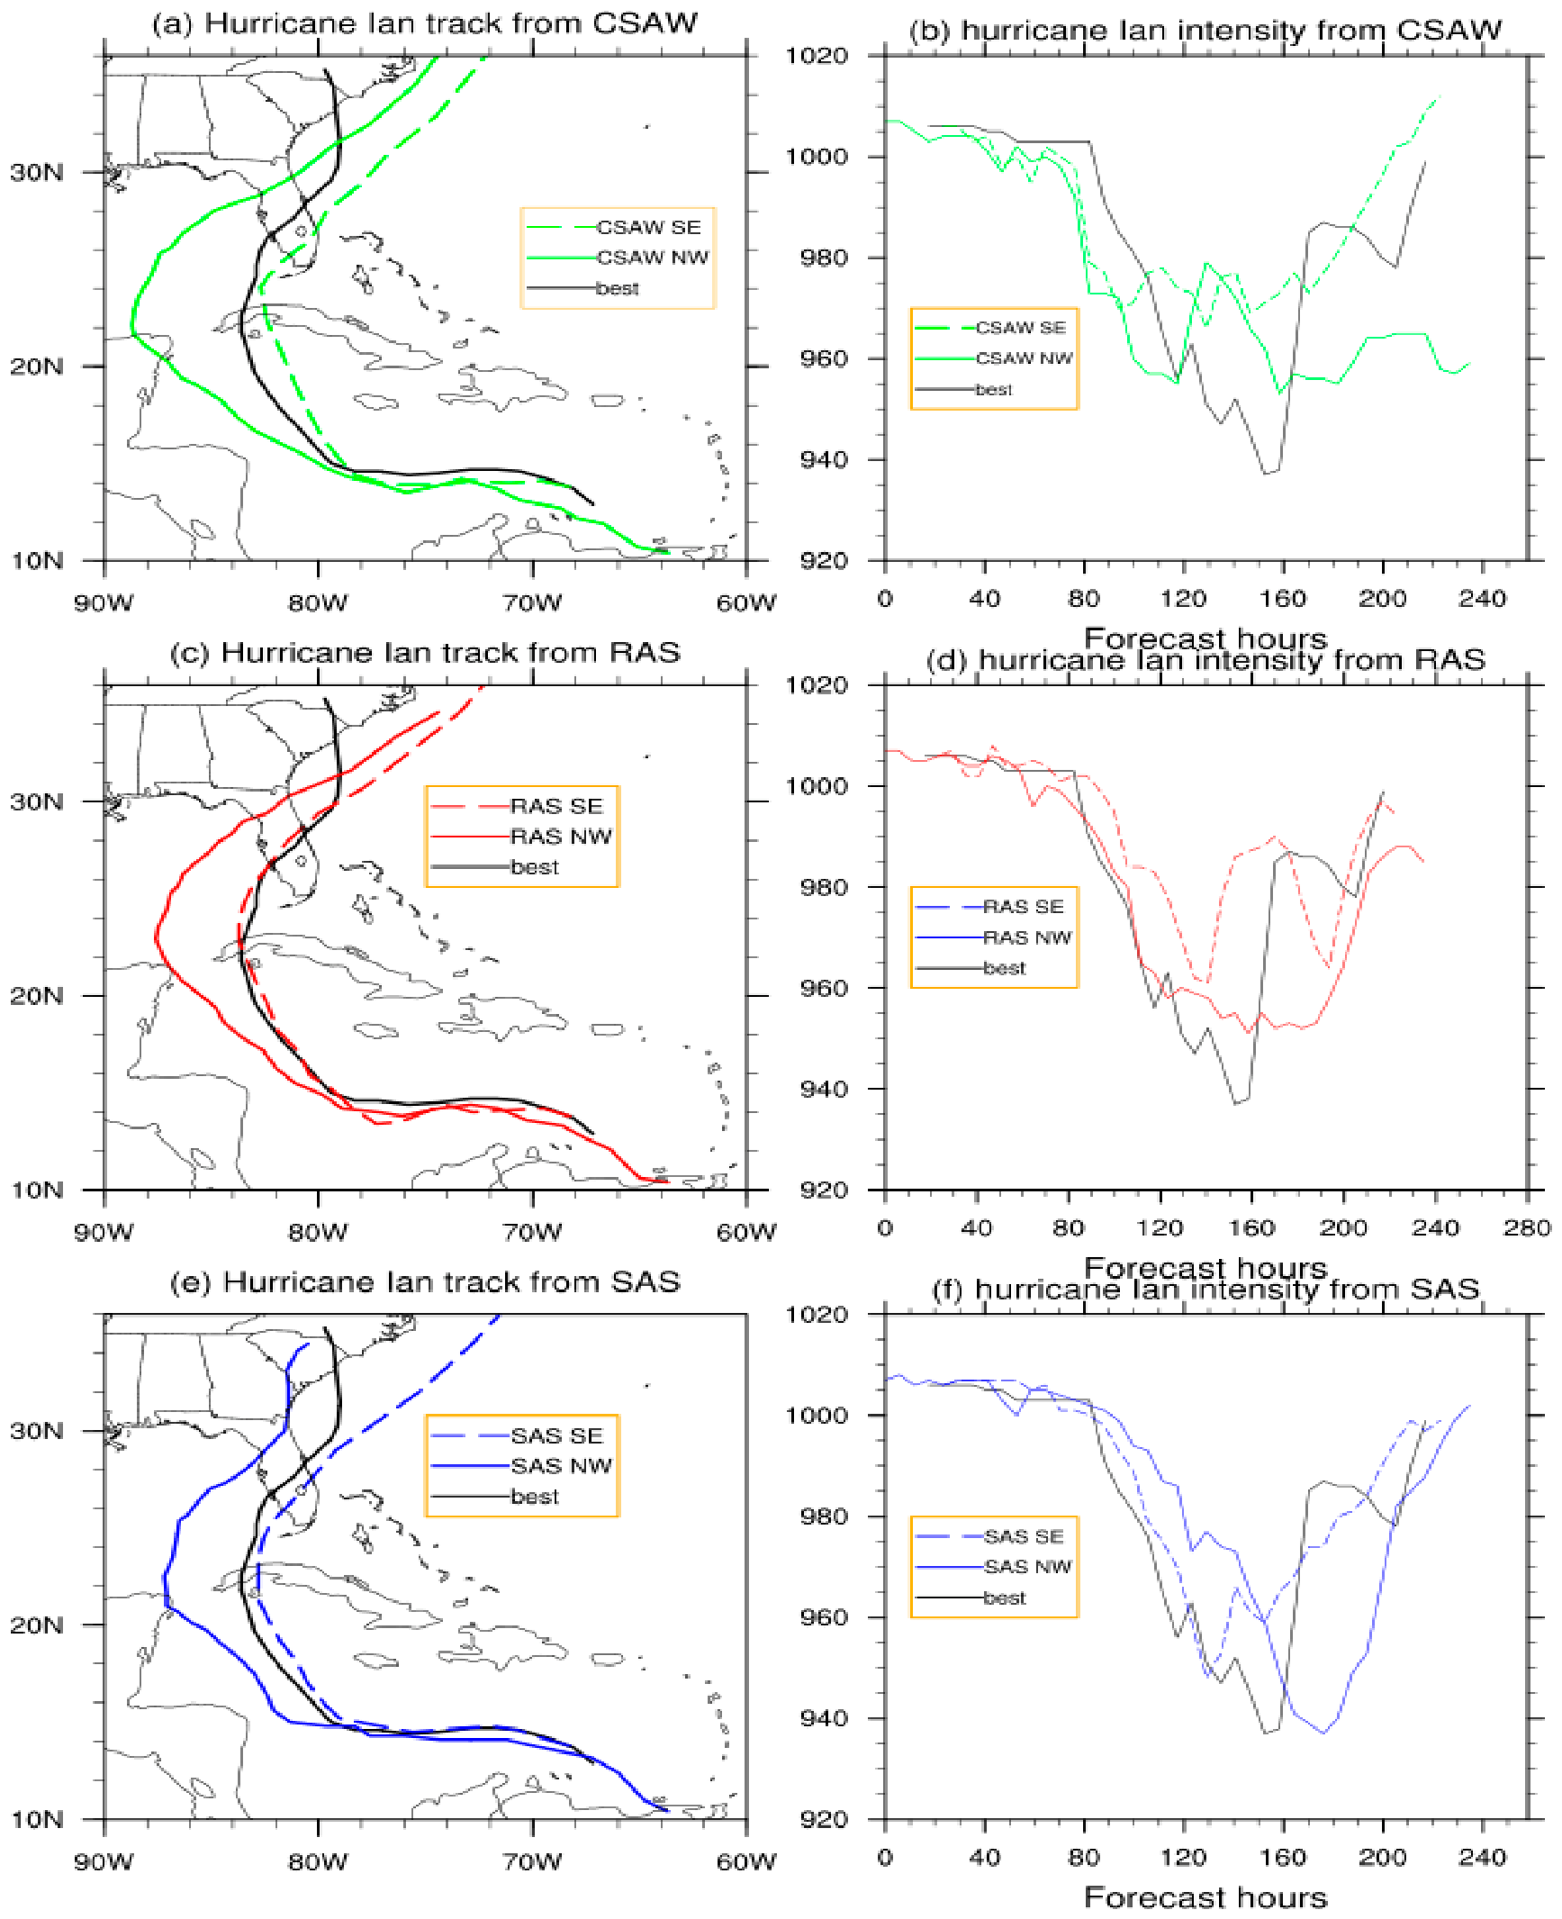
Figure 3.
Hurricane (a) tracks and (b) intensity for the CSAW (green), SAS (blue), and RAS (red) schemes. These simulations use specific initial conditions at September 23 00UTC selected to represent the respective ensemble mean track and intensity for each scheme.
Figure 3.
Hurricane (a) tracks and (b) intensity for the CSAW (green), SAS (blue), and RAS (red) schemes. These simulations use specific initial conditions at September 23 00UTC selected to represent the respective ensemble mean track and intensity for each scheme.
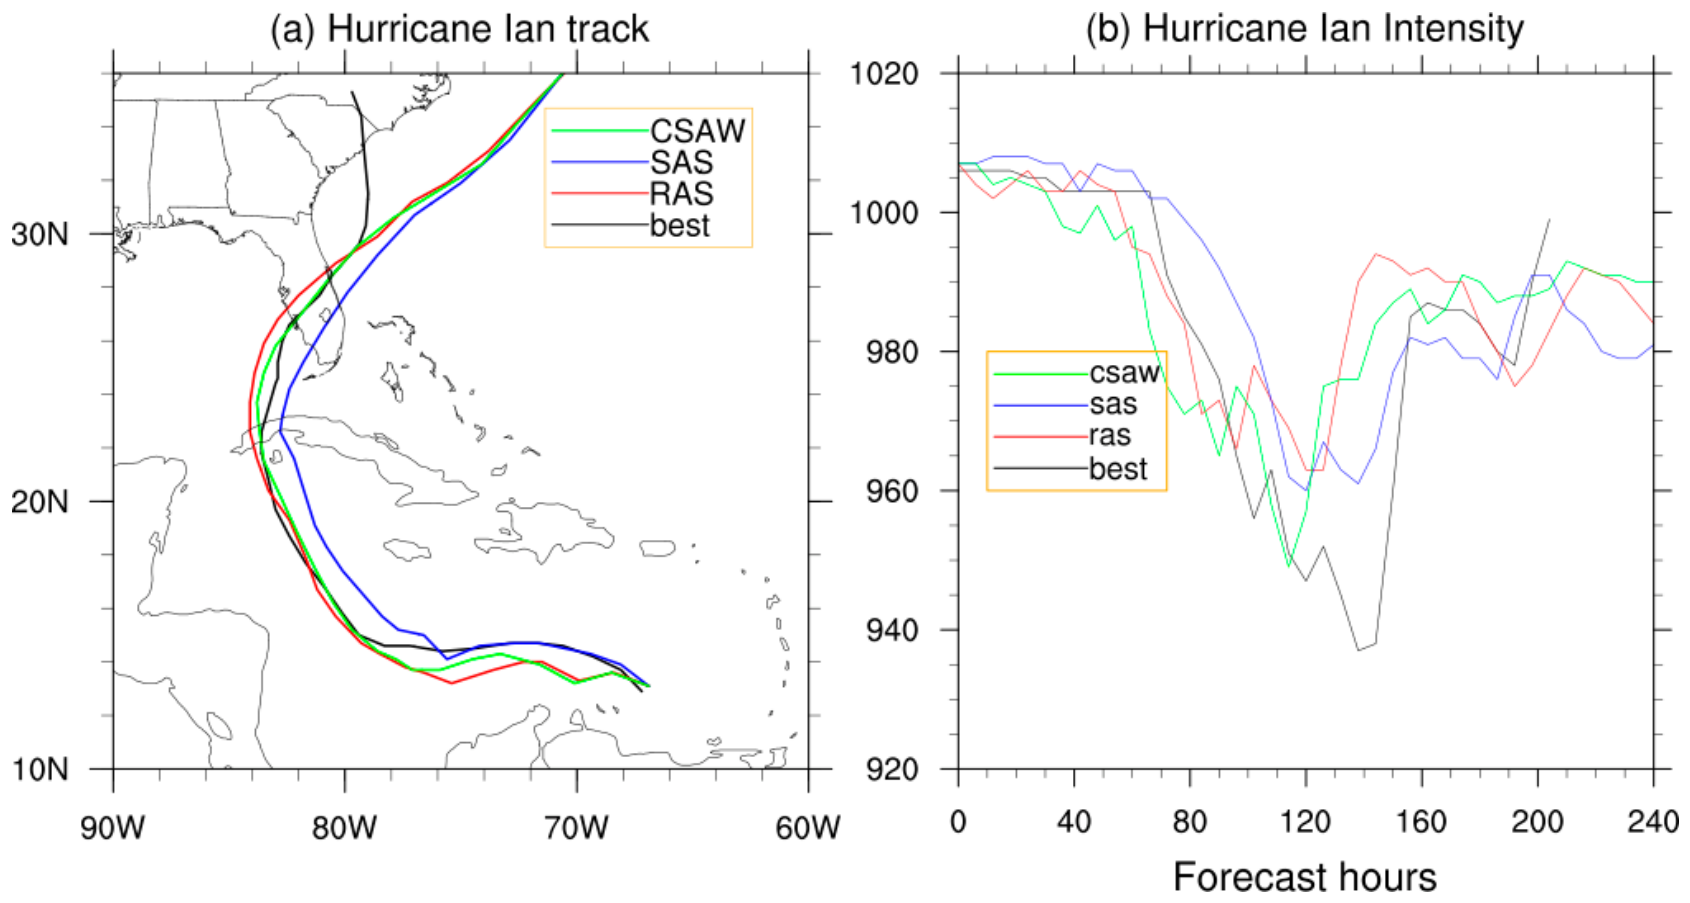
Figure 4.
Hurricane Ian (a) tracks and (b) intensities for the CSAW scheme under three experimental configurations: CTL (blue), SP1 (red), and SP2 (green). The black line denotes the NHC Best Track observations. The horizontal axis is the forecast hour in (b).
Figure 4.
Hurricane Ian (a) tracks and (b) intensities for the CSAW scheme under three experimental configurations: CTL (blue), SP1 (red), and SP2 (green). The black line denotes the NHC Best Track observations. The horizontal axis is the forecast hour in (b).
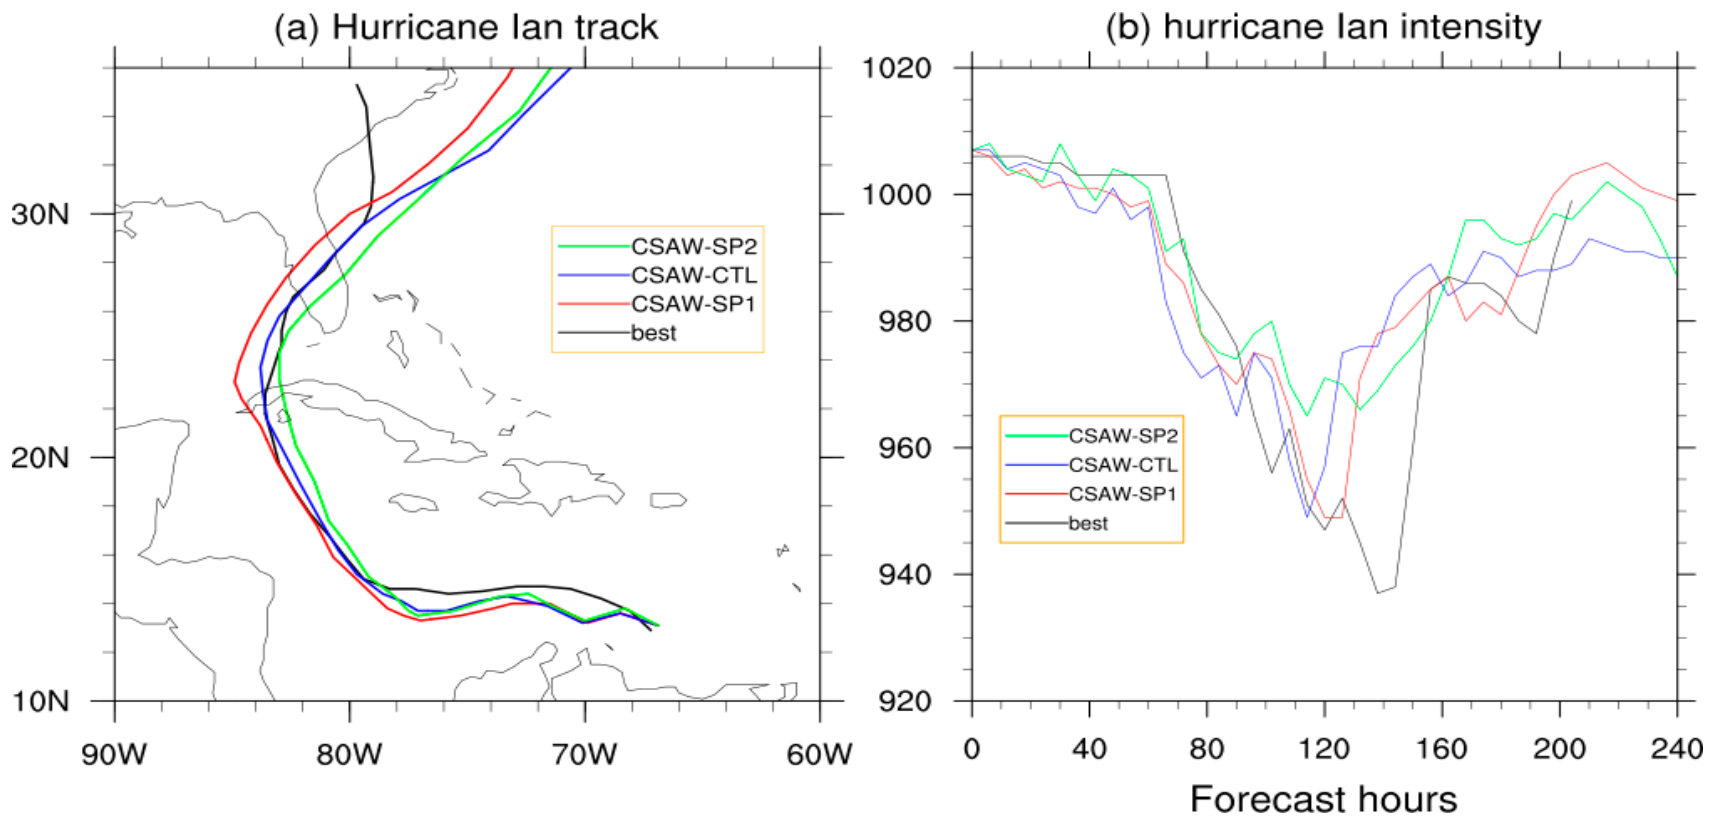
Figure 5.
Hurricane Ian (a) tracks and (b) intensity for CSAW experiments: CTL (solid blue), SP1 (red), and SP2 (green). Additional sensitivity runs are shown for CSAW-be (dotted blue) and CSAW-se (dashed blue). The black line denotes the observed NHC Best Track. The horizontal axis is the forecast hour in (b).
Figure 5.
Hurricane Ian (a) tracks and (b) intensity for CSAW experiments: CTL (solid blue), SP1 (red), and SP2 (green). Additional sensitivity runs are shown for CSAW-be (dotted blue) and CSAW-se (dashed blue). The black line denotes the observed NHC Best Track. The horizontal axis is the forecast hour in (b).
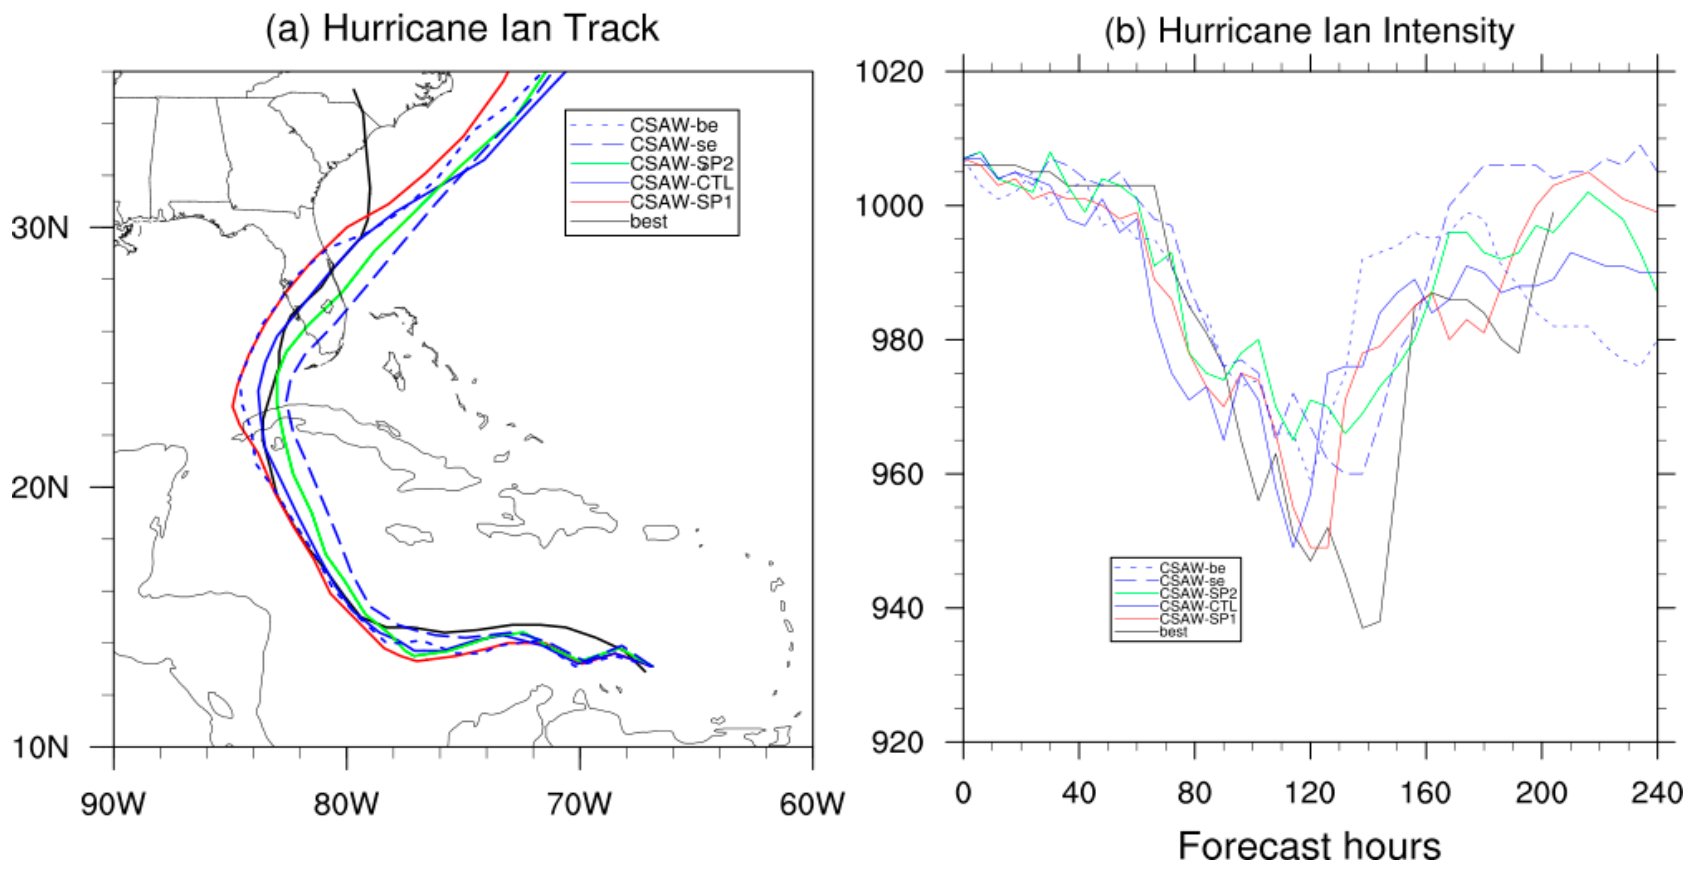
Figure 6.
Kinetic energy spectra for Hurricane Ian: (a) comparison of the CSAW (green), SAS (blue), and RAS (red) deep convection schemes; and (b) sensitivity within the CSAW scheme for EXP CTL (solid blue), SP1 (red), SP2 (green), CSAW-be (dotted blue), and CSAW-se (dashed blue).
Figure 6.
Kinetic energy spectra for Hurricane Ian: (a) comparison of the CSAW (green), SAS (blue), and RAS (red) deep convection schemes; and (b) sensitivity within the CSAW scheme for EXP CTL (solid blue), SP1 (red), SP2 (green), CSAW-be (dotted blue), and CSAW-se (dashed blue).
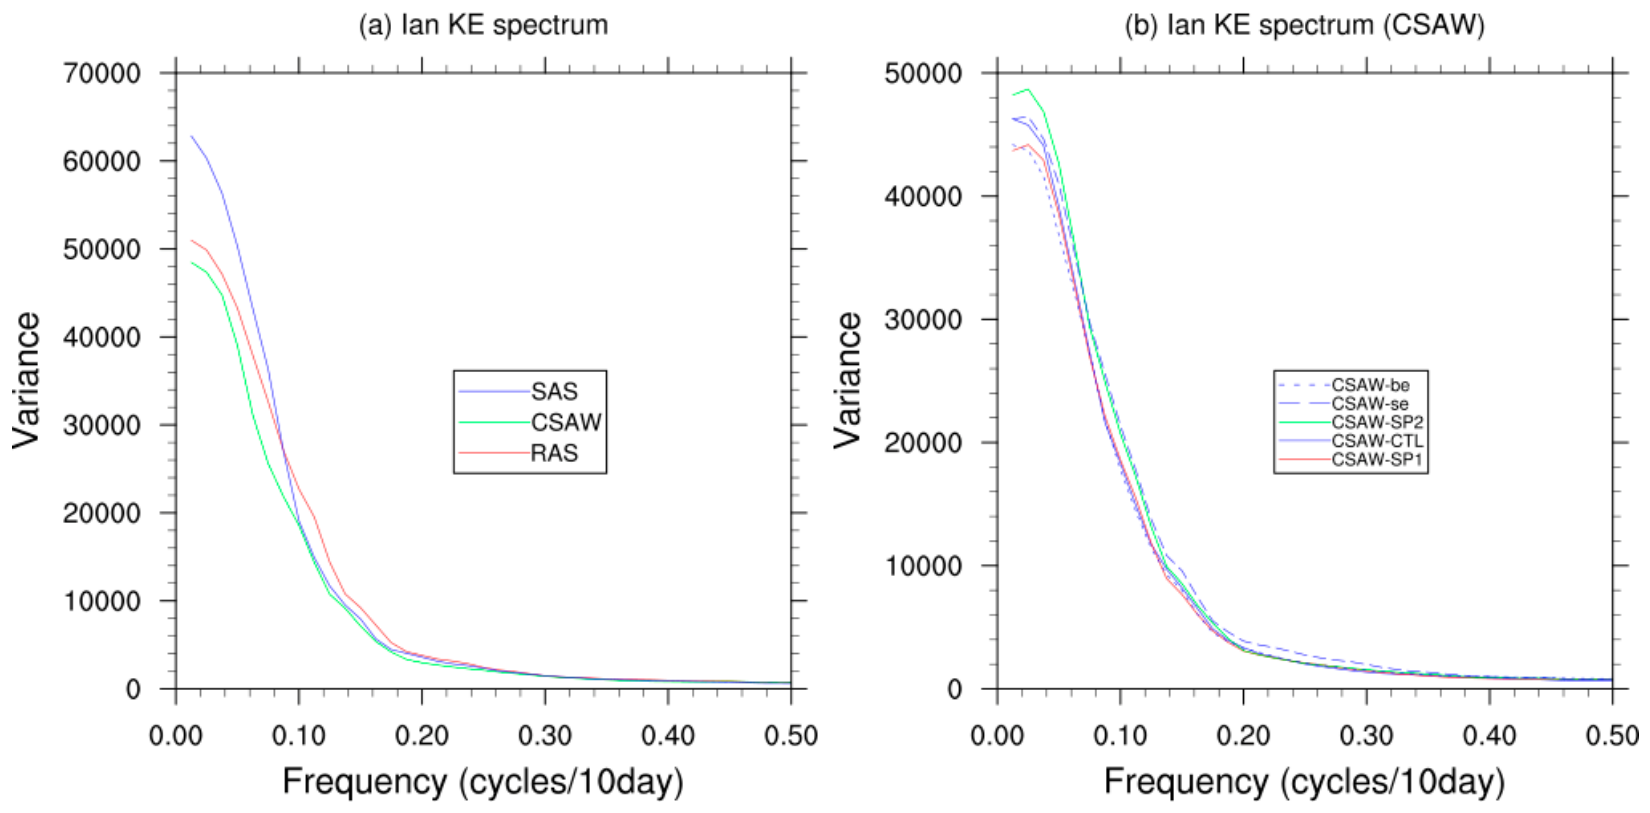
Figure 7.
Comparison of surface variables for EXP CSAW SPC1 and SPC2 prior to the divergence of hurricane tracks on September 28 00UTC. (a, b) Surface latent heat fluxes (W m-2) and (c, d) sea-level pressure (hPa) overlaid with wind vectors (arrows) for SPC1 and SPC2, respectively. .
Figure 7.
Comparison of surface variables for EXP CSAW SPC1 and SPC2 prior to the divergence of hurricane tracks on September 28 00UTC. (a, b) Surface latent heat fluxes (W m-2) and (c, d) sea-level pressure (hPa) overlaid with wind vectors (arrows) for SPC1 and SPC2, respectively. .
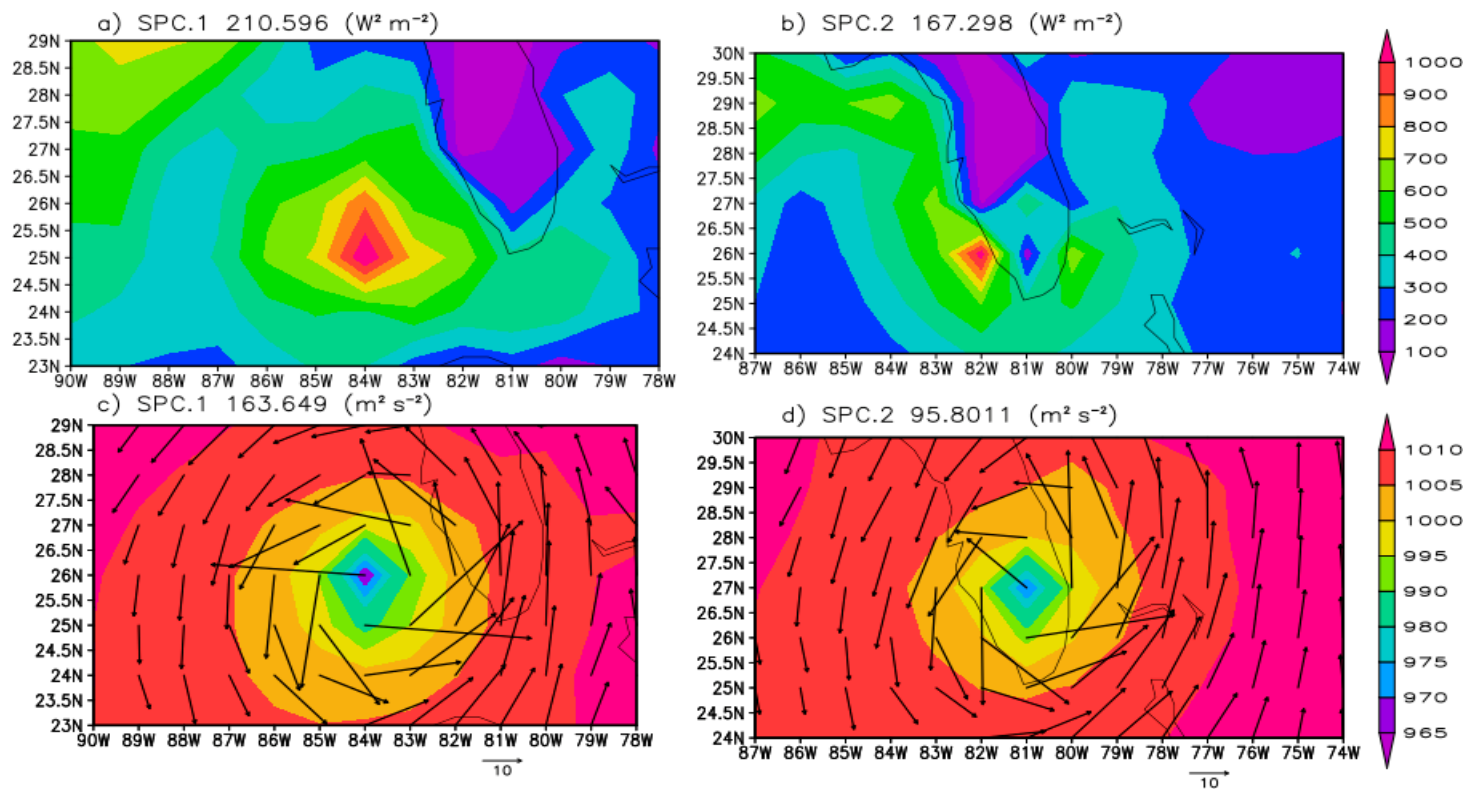
Figure 8.
Potential Vorticity (K m-2 kg-1 s-1) for (a) EXP CSAW SPC1 and (b) CSAW SPC2, calculated prior to the divergence of the hurricane tracks on September 28 00UTC. The solid black line is the best track, and the red line and the blue line are the tracks for EXP CSAW SPC1 and SPC2, respectively.
Figure 8.
Potential Vorticity (K m-2 kg-1 s-1) for (a) EXP CSAW SPC1 and (b) CSAW SPC2, calculated prior to the divergence of the hurricane tracks on September 28 00UTC. The solid black line is the best track, and the red line and the blue line are the tracks for EXP CSAW SPC1 and SPC2, respectively.
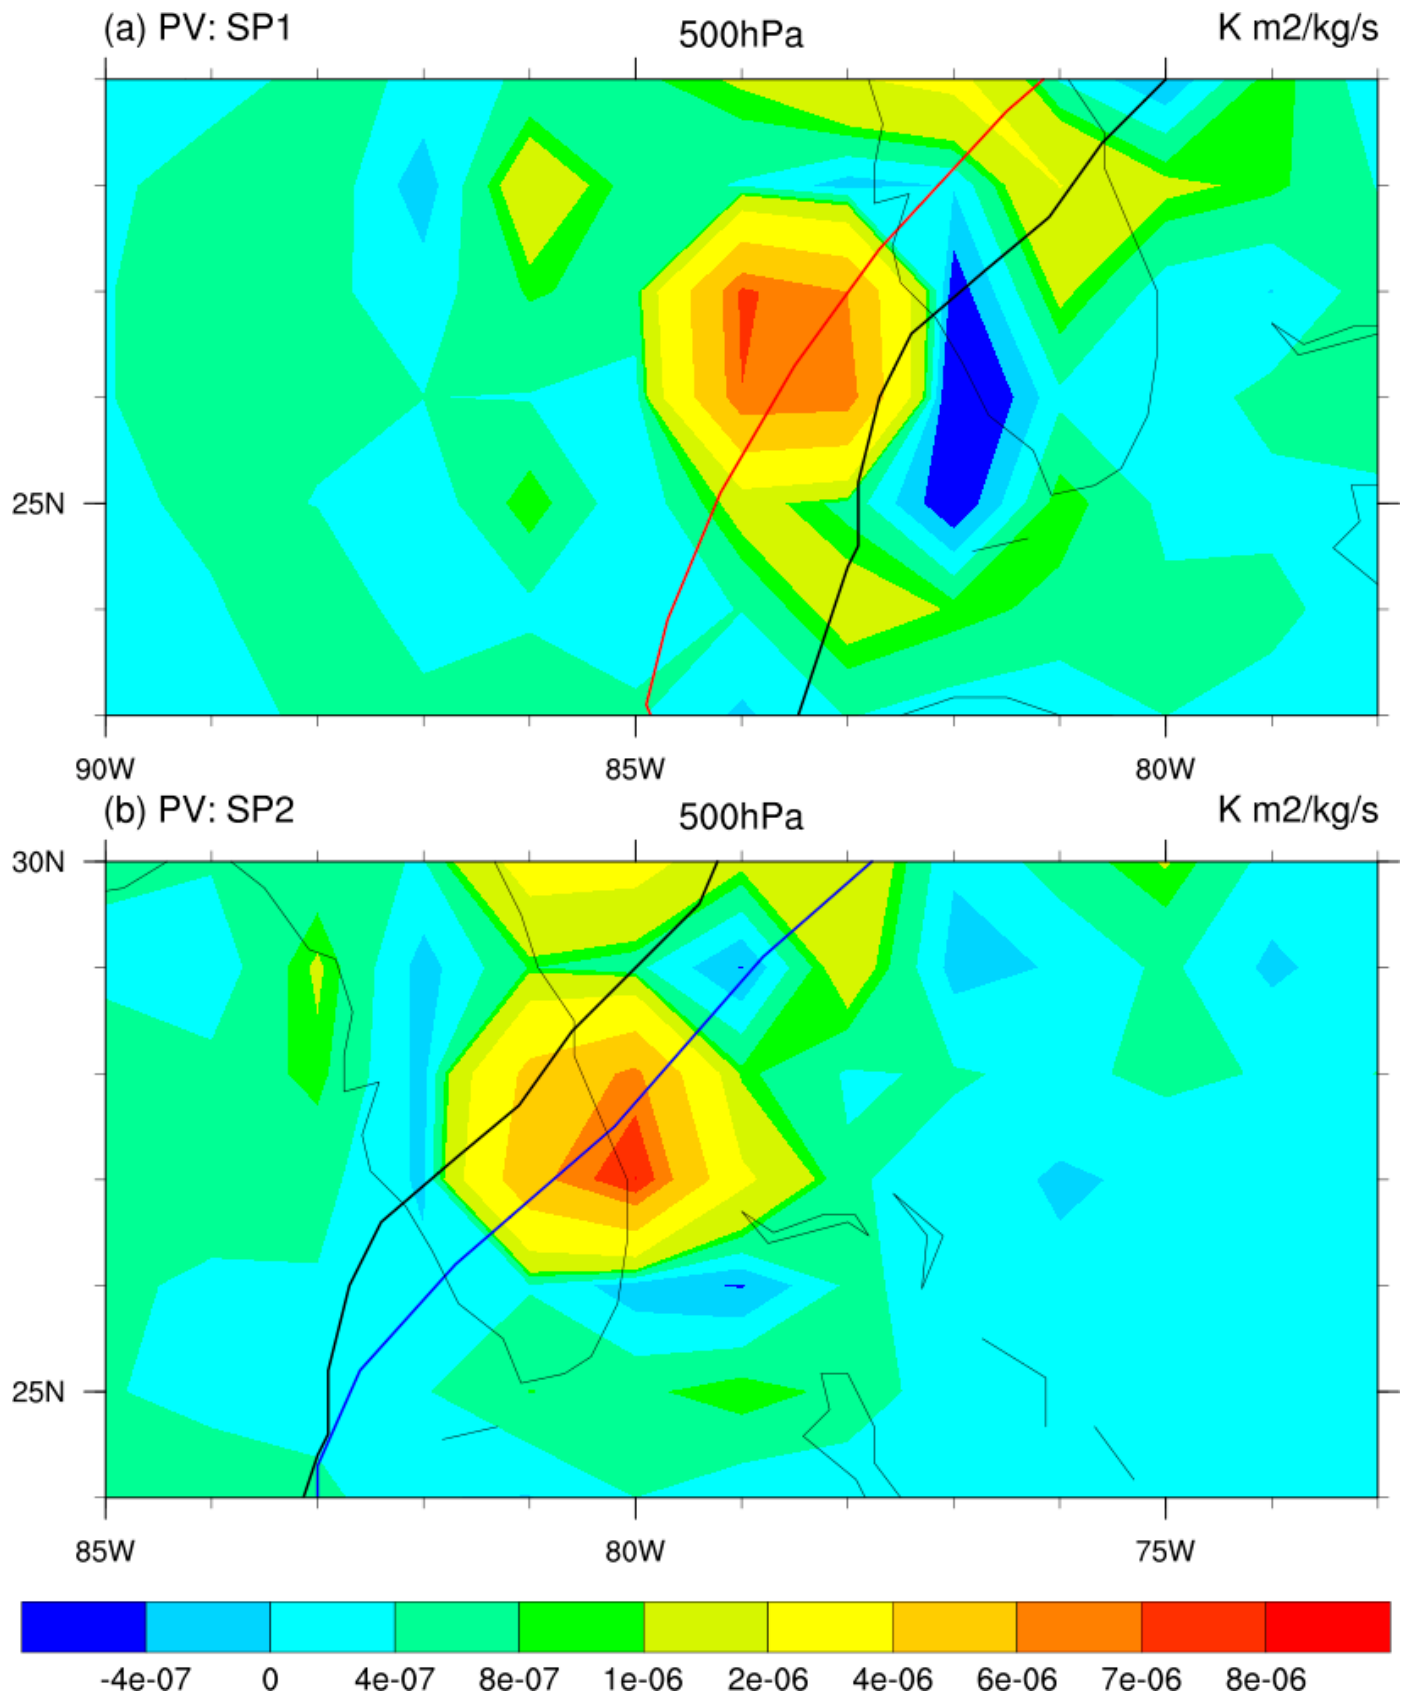
Figure 9.
Steering wind (m s-1) at 500 hPa for (a) EXP CSAW SP1 and (b) EXP CSAW (CTL) prior to track divergence on September 28 00UTC. Geopotential height at 500 hPa with unit gpm (shaded) is overlaid with steering wind vectors (arrows).
Figure 9.
Steering wind (m s-1) at 500 hPa for (a) EXP CSAW SP1 and (b) EXP CSAW (CTL) prior to track divergence on September 28 00UTC. Geopotential height at 500 hPa with unit gpm (shaded) is overlaid with steering wind vectors (arrows).
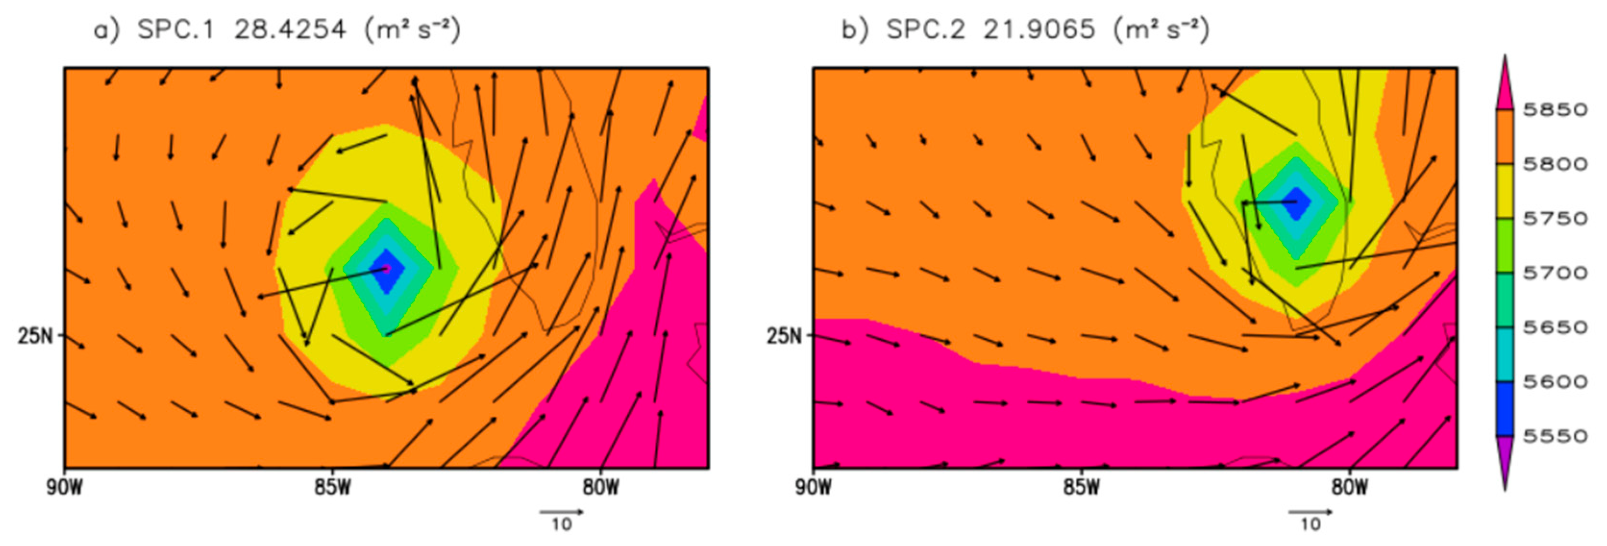

Table 1.
Comparison of SAS, RAS, and CS-AW in UFS.
| Updraft | Downdaft | Assumption | entrainment | detrainment | Scale aware | |
| SAS | One | Mass flux driven |
simplified | Every level | Every level | empirical |
| RAS | spectrum | PRECIP and EVAP driven |
Relaxed | Levels Below Cloud top |
Cloud top | empirical |
| CSAW | spectrum | PRECIP and EVAP driven |
Prognostic CKE |
Levels Below cloud top |
Cloud top | AW derived |
Disclaimer/Publisher’s Note: The statements, opinions and data contained in all publications are solely those of the individual author(s) and contributor(s) and not of MDPI and/or the editor(s). MDPI and/or the editor(s) disclaim responsibility for any injury to people or property resulting from any ideas, methods, instructions or products referred to in the content. |
© 2026 by the authors. Licensee MDPI, Basel, Switzerland. This article is an open access article distributed under the terms and conditions of the Creative Commons Attribution (CC BY) license (http://creativecommons.org/licenses/by/4.0/).
Copyright: This open access article is published under a Creative Commons CC BY 4.0 license, which permit the free download, distribution, and reuse, provided that the author and preprint are cited in any reuse.