

Submitted:
14 August 2026
Posted:
17 August 2026
You are already at the latest version
Abstract
This study aimed to analyze residual post-match fatigue using time-motion analysis across small-sided games (SSGs), fitness performance, and heart rate variability (HRV) in youth soccer players. Fifteen academy players (18.3 ± 0.6 years) performed four SSGs formats: 3 vs. 3 and 3 vs. 3 + 2 goalkeepers, played on small (25 × 18 m; 75 m2 per player) and large (36 × 25 m; 150 m2 per player) areas in a four-week experimental design. Two non-match weeks served as control weeks, and two weeks followed an official match. Time-motion during SSGs was monitored via GPS. Before each training session (24, 72, and 120 h post-match), HRV, countermovement jump (CMJ) height, and maximum isometric force (MIF) of the hamstring were measured. Time-motion was generally lower in post-match sessions than in control weeks, particularly at 24 h post-match; however, reliability was low. These reductions were more evident in SSGs on large areas, with GK. CMJ height and MIF were reduced post-match, whereas HRV showed only transient changes. Post-match fatigue was evident in fitness performance but was inconsistently reflected in SSGs outputs. CMJ height and hamstring MIF are sensitive markers of post-match fatigue in elite youth soccer players and should be prioritized when monitoring recovery.
Keywords:
physical assessment
; external load
; neuromuscular fatigue
; soccer training
; heart rate variability
1. Introduction
Post-match fatigue is systematically assessed across professional soccer teams using various methods to determine player readiness [1]. Monitoring external and internal loads is also strongly recommended to evaluate the stress placed on athletes [2]. The player’s stress response as a consequence of these physical demands, which is known as internal load [2], is quantified by measuring physiological (i.e., heart rate, blood lactate, or oxygen consumption) or psychological (i.e., rating of perceived exertion [RPE]) responses to exercise [3,4]. Fatigue is a complex, multifaceted phenomenon arising from multiple mechanisms [5]. Therefore, several tests have been reported to monitor residual fatigue [6,7,8]. Countermovement jump (CMJ) height is considered a good marker of fatigue [7,9] due to the close relationships reported between impairments in CMJ height and running speed with blood lactate and ammonia concentrations during typical running sprint sessions [9]. Furthermore, hamstring isometric peak force at long muscle lengths can be confidently used to assess posterior chain status after a competitive soccer match [6,8]. Fatigue can also induce changes in autonomic nervous system function [10,11], which can be assessed by analyzing heart rate variability (HRV) [12]. HRV has been used in high-level and young soccer players [13,14]. A decrease in HRV has been related to impairments in parasympathetic activity [11].
Nevertheless, the time required and the need for coaches to train technical, tactical, and physiological stimuli during the majority of soccer-based training [15] often lead to the rejection of physical tests in elite soccer teams. As a potential solution, several studies have analyzed whether standardized small-sided games (SSGs) can serve as field-based assessment of physical fitness [15,16,17,18,19]. In this regard, the global positioning system (GPS) technology is currently used to monitor the external load in soccer [3,4]. This method analyzes on-field player performance using multiple time-motion variables [20]. Although acceptable reliability has been reported for variables such as total distance (TD) and mean heart rate (HRmean), evidence regarding their validity remains inconsistent, with large variability in high-intensity actions limiting their usefulness as fitness indicators [15,16,17,18].
Beyond fitness assessment, SSGs have also been proposed as a means of monitoring training-induced fatigue. Rowell et al. [21] showed that a standardized SSGs (5 vs. 5 + 5; 45 x 36 m) was sensitive to weekly reductions in the ratio flight time-contact time during a CMJ, with decreases greater than 8% from baseline accompanied by lower accelerometry-load (PlayerLoadTM per minute) during the SSGs. However, interpretation of accelerometry-derived metrics is limited by unit placement, orientation noise, and posture-related effects [22,23]. Likewise, time-motion across all these SSGs formats shows high variability [24,25], especially as the number of players increases [26]. Moreover, various factors may influence the physical responses during SSGs [25,27,28]. Pitch size and the inclusion of floaters and goalkeepers (GK) are the main variables to consider when designing SSGs [27,29,30,31]. Specifically, SSGs conducted in larger areas result in greater workloads than those in smaller areas [32], which elicit more accelerations/decelerations but less distance covered at high speeds [27,32,33]. Moreover, the presence of a GK appears to reduce the player workload on small pitches [29,30] but to increase it on larger pitch areas [33].
Despite these controversies regarding the use of SSGs to monitor training-induced adaptations, to date, there is limited scientific evidence on their use as a physical assessment when their variability (game constraints) is reduced to test post-match fatigue. Therefore, the aim of the present study was to analyze residual post-match fatigue using time-motion performance across 3-a-side SSGs formats varying pitch size and GK presence, and fitness performance during a post-match training week in young soccer players. We hypothesized that time-motion performance for SSGs played on a larger pitch without a GK, and physical performance, would detect residual fatigue after the match, although reliability in SSGs parameters would be moderate.
2. Materials and Methods
2.1. Exploratory Design
A quasi-experimental design was used to examine changes in time-motion patterns for four 3-a-side SSGs and physiological and muscular fatigue over the typical training week after an official match in young soccer players. Because GK had different requirements during the matches and SSGs, they were excluded. This study was conducted over four consecutive in-season weeks. The external load was monitored throughout the four weeks to control variation in training load. The SSGs format was performed with and without GK (3 vs. 3 and 3 vs. 3 + 2 GK) and conducted on a small pitch (25 × 18 m) with a relative player area of 75 m2 (i.e., ssg and ssg+GK) and a long pitch (36 × 25 m) with a relative player area of 150 m2 (i.e., LSG and LSG+GK). A similar training-week schedule was used to analyze variations in time-motion and physical performance, selecting control weeks (CW): two training weeks without a previous match; and post-match weeks (PM): two post-training weeks following a one-match week. As a consequence of the match calendar, ssg and ssg+GK were conducted consecutively during the first two weeks of intervention, while LSG and LSG+GK were conducted during the last two weeks, both with one CW and PM. Two bouts were performed in the same pitch area: the first was played without (1st: ssg or LSG) and the second with GK (2nd: ssg+GK or LSG+GK). The total duration for SSGs was 3 minutes with a 6-minute rest period between bouts. SSGs formats were performed at the beginning of three different sessions with a 48-h rest between them during CW (CW-1, CW-2, and CW-3), and at 24 h (ssg/LSG-24H), 72 h (ssg/LSG-72H), and 120 h (ssg/LSG-120H) PM. Before each session, HRV, CMJ, and maximum isometric force (MIF) of the hamstrings were assessed (Figure 1). A 3-minute rest period was used between the different tests. The player order used during the tests was the same for all sessions. During the jump and strength tests, players were verbally encouraged to exert their maximal effort. The physical metric averages for both session types in CW (i.e., CW-1, CW-2, and CW-3) were used as the baseline for analyzing variation throughout the PM (i.e., ssg-week and LSG-week).
2.2. Subjects
Data were collected from 15 young male field soccer players (age: 18.3 ± 0.6 years; height: 178.2 ± 5.6 cm; body mass: 70.9 ± 6.4 kg) belonging to the academy of a Spanish La Liga Club. Players were categorized according to average match participation in both official matches: starters (above 60 minutes [67.1 ± 12.6 minutes]; n = 7) and non-starters (below 30 minutes [22.5 ± 14.8 minutes]; n = 8). Positions included were: defenders (starters: 4 vs. non-starters: 4), midfielders (starters: 2; non-starters: 2), and forwards (starters: 1; non-starters: 2). All players had been actively training for at least 3 years and participated in 5 training sessions (90 minutes each) plus one official game per week. The procedures were fully explained to the participants and the club staff. The players (or parents of minors) gave their written consent. This study was approved by the Institutional Review Committee of Pablo de Olavide University (REF: 25/7–82) and was performed in accordance with the Declaration of Helsinki.
2.3. Procedures
2.3.1. Small-Sided Games
The SSGs format consisted of 3-a-side games, with a total duration of 3 minutes and 6 minutes of rest between bouts. The first bout was played without a GK (i.e., 3 vs. 3), with the aim of free play focused on maintaining possession. In contrast, the second bout was played with GK (i.e., 3 vs. 3 + 2 GK) to defend a soccer goal (6 × 2 m) and score more goals than the opponent. The SSGs format was determined using pitch dimensions, divided into small (ssg: 25 x 18 m, 75 m2 per player) and large (LSG: 36 x 25 m, 150 m2 per player) pitch areas. The same teams faced each other in different SSGs formats and were composed of starter and non-starter players. The coach was required to provide verbal encouragement and immediately introduce a ball when the ball left the playing field. Before the SSGs, players completed a standardized warm-up consisting of 4 minutes of soccer-specific drills using a passing drill (area: 10 × 20 m).
2.3.2. Training Load
External load data were quantified by week type (CW or PM) to control the training load during the SSGs (ssg and LSG). The players were monitored using a GPS APEX (STATSports) with a sampling frequency of 10 Hz. Each player wore a tight vest with the GPS unit on the back of the upper body, between the scapulae, and it was activated 15 minutes before the start, as described by the manufacturer. Doppler-derived speed data were exported from the manufacturer’s software (STATSport Sonra 2.1.4). The variables selected to quantify external load were selected according to usual arbitrary thresholds [20,34]: TD, high-speed running (HSR; running speed > 19.8 km·h-1), sprinting distance (SPR; running speed > 25.2 km·h-1), number of accelerations (ACC; > 2 m·s-2), and decelerations (DEC; < -2 m·s-2).
2.3.3. Heart Rate Variability and Jumping Ability Measurements
To avoid circadian effects on HRV, all assessments were performed at the same time of day (between 8:00 and 8:30 AM), with room temperature maintained between 18 and 22 °C, with dim ambient light. During the test, the subjects lay supine for at least 10 minutes. The raw root mean square of successive differences (RMSSD) was used as a parasympathetic indicator [12]. RR intervals were recorded using a V800 Polar watch and a Polar H7 chest strap. Subsequently, raw data were exported and analyzed using Polar Flow software. For the analysis, only the last 8 minutes of the signal were used. The first two minutes were used to stabilize the heart rate [14]. After the HRV test, players performed the CMJ test. Jump height was calculated to the nearest 0.1 cm from flight time measured with an infrared timing system (OptojumpNext; Microgate, Bolzano, Italy). Before the assessment, players performed a standardized warm-up consisting of 5 minutes of jogging at a self-selected easy pace and five progressive submaximal jumps. During the test, the subjects completed five maximal CMJs, with a 20-s rest between jumps, with their hands on their hips (without arm swing). The highest and lowest values were discarded, and the remaining values were averaged for further analysis.
2.3.4. Isometric Hamstring Strength Test
The players completed a standardized warm-up that included three submaximal isometric repetitions in a glute bridge position at 30%, 40%, and 50% perceived effort, followed by two submaximal repetitions in the prone position with full extension of the knee and hip flexors on the platform. All strength tests were completed using a NordBord device (Vald Performance®) to determine the maximum hamstring isometric force. Players were kneeling on a padded board, with the ankles secured immediately superior to the lateral malleolus using individual ankle braces attached to custom-made uniaxial load cells (Delphi Force Measurement®, Gold Coast, Australia) with wireless data-acquisition capabilities (Mantracourt, Devon, UK). After the standardized warm-up, participants completed two maximal repetitions of the bilateral hamstring prone exercise, with a 30-s rest between them. The instructions to the players were to apply maximal force from the beginning and keep it for 5 s. Bilateral (MIF) and unilateral (left: LMIF; right: RMIF) maximal hamstring isometric forces were derived from the bilateral repetition provided by the NordBord system using VALDHub® (VALD Systems Software).
2.4. Statistical Analyses
Descriptive statistics are presented as the mean ± standard deviation. Absolute test-retest reliability was examined using the standard error of measurement (SEM), expressed in relative terms through the coefficient of variation (CV). The SEM was calculated as the square root of the mean total within-subject variance. Relative reliability was calculated using the intraclass correlation coefficient (ICC) with a 95% confidence interval (CI), applying a one-way random-effects model. The normality of the results was tested using the Shapiro-Wilk test. Linear mixed model (LMM) was employed to assess the effects of Pitch Size (ssg and LSG; fixed effects), Week (CW and PM; fixed effects), Session (at 24H, 72H and 120H; fixed effects), presence of GK (GK and no-GK; fixed effects), and Player Status (starters and non-starters; fixed effects) across GPS-derived variables. LMM was also conducted for analyzing the potential effects of Week (CW and PM; fixed effects), Session (at 24H, 72H and 120H; fixed effects), and Player Status (starters and non-starters; fixed effects) on HRV and fitness variables. When significant differences were found in the LMM model, an estimation of marginal means (contrasts) was performed using Bonferroni’s corrections for multiple comparisons. The level of statistical significance was set at p< 0.05. The statistical analysis was conducted using R studio (version 2025.05.0).
3. Results
The reliability of the time-motion and fitness performance variables is presented in Table 1. Fitness variables (i.e., CMJ height, LMIF, RMIF, and MIF) showed excellent reliability values: CVs < 8% and ICCs ≥ 0.90. Among the time-motion variables, only TD showed acceptable absolute reliability (CV ~ 8%), but none achieved acceptable ICC values.
3.1. Time-Motion Activity During the Small-Sided Games
Time-motion activity during the SSGs is presented in Table 2. The LMM analysis revealed significant main effects for Week (F = 61.89; p < 0.001), GK (F = 197.04; p < 0.001) and Pitch Size (F = 466.59; p < 0.001), and Session (F = 3.31; p = 0.038) on TD. Likewise, Pitch Size × Session (F = 6.04; p = 0.003), Player Status × Session (F = 3.63; p = 0.028) and Week × GK × Session (F = 3.26; p = 0.040) interactions were found for TD. Significant main effects were observed for GK (F = 33.38, p < 0.001; F = 22.6, p < 0.001) and Pitch Size (F = 70.85, p < 0.001; F = 22.6, p < 0.001) for HSR and SR, respectively, with a significant Week × Group (F = 5.85; p = 0.016) interaction for HSR. Acc were significantly influenced by both Week (F = 8.16; p = 0.005) and Pitch Size (F = 3.90; p = 0.049). Dec exhibited a significant main effect of Week (F = 17.08; p < 0.001) and significant Week × Session (F = 3.15; p = 0.044), Week × GK (F = 6.87; p = 0.009), Week × Pitch Size × Session (F = 4.63; p = 0.032) and Week × GK × Pitch Size (F = 3.07; p = 0.048) interactions. No other main effects or interaction terms reached statistical significance (p > 0.05).
Post-hoc pairwise comparisons showed that overall running volume was significantly lower during the PM than during CW for TD (β = -21.75 m; p < 0.001), Acc (β = -1.02 counts; p = 0.005), and Dec (β = -1.46 counts; p < 0.001). TD was significantly maximized in LSG compared to ssg at 24H-PM (β = 68.86 m; p < 0.001). Additionally, DEC was significantly reduced during the 24H-PM (β = -1.94 counts; p = 0.024) and 120H-PM (β = -2.21 counts; p = 0.005) compared to the CW-1.
3.2. Heart Rate Variability and Physical Performance
The LMM analysis for HRV (Figure 2) revealed no significant main effects for Week, or Session. However, significant interactions for Player Status × Session (F = 11.60, p < 0.001) and Week × Player Status × Session (F = 7.44, p < 0.001) were identified. Post-hoc analyses indicated that Starters exhibited an HRV fluctuation between the first and second session (β = 12.25 ms, p = 0.004), a trend not observed in Non-starters. In Starters, this decline was specifically pronounced when comparing CW-1 to 24H-PM (β = -18.07 ms, p = 0.011) and during the CW (CW-1 vs. CW-2: β = -25.21 ms, p < 0.001).
CMJ analysis revealed significant main fixed effects for Week (F = 36.94; p < 0.001) and Session (F = 7.94; p < 0.001). Furthermore, a significant interaction was observed for Week × Session (F = 4.30; p = 0.014). Subsequent post-hoc analyses indicated that CMJ height was significantly greater during CW than during PM (β = 0.90 cm; p < 0.001). In addition, lower CMJ height was observed at 24H-PM compared to CW-1 (β = -1.46 cm, p < 0.001).
Figure 3.
Changes in countermovement jump (CMJ) height (cm) through training week (CW: control week) and during post-match weeks using different small-sided games formats (ssg; 25 x 18 m pitch [75 m2] vs LSG; 36 x 25 m pitch [150 m2]) at 24, 72, and 120 h post-match. ANOVA: b Week; c Session, Ұ Week × Session (p ˂ 0.05). Post-hoc: *** Significant differences between CW and PM (p < 0.001). 𝟙 Significant differences compared to CW-1 (p ˂ 0.001).
Figure 3.
Changes in countermovement jump (CMJ) height (cm) through training week (CW: control week) and during post-match weeks using different small-sided games formats (ssg; 25 x 18 m pitch [75 m2] vs LSG; 36 x 25 m pitch [150 m2]) at 24, 72, and 120 h post-match. ANOVA: b Week; c Session, Ұ Week × Session (p ˂ 0.05). Post-hoc: *** Significant differences between CW and PM (p < 0.001). 𝟙 Significant differences compared to CW-1 (p ˂ 0.001).
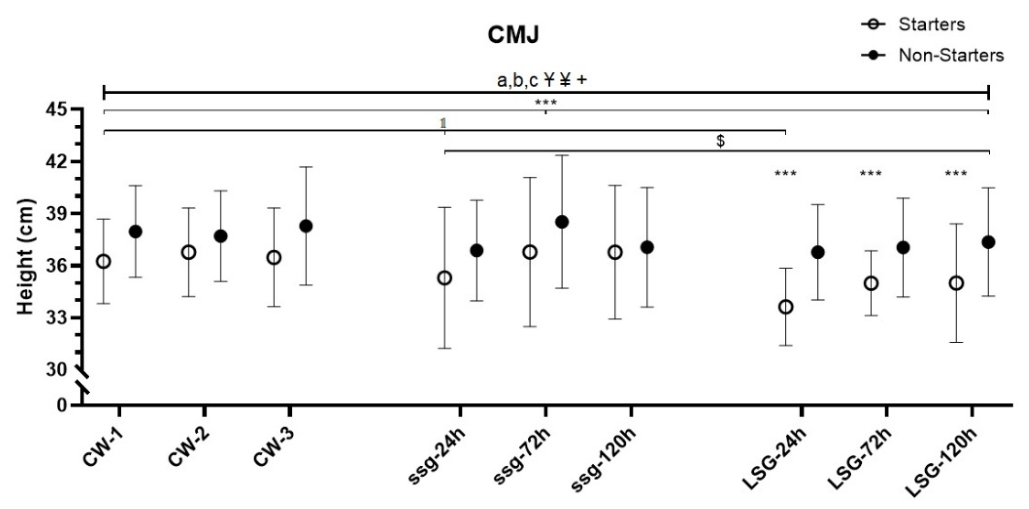
Figure 4.
Changes in maximum isometric force through training week (CW: control week) and during post-match weeks using different small-sided games formats (ssg; 25 x 18 m pitch, 75 m2 vs. LSG; 36 x 25 m pitch, 150 m2) at 24, 72, and 120 h post-match. LMIF: left-leg maximum isometric force; RMIF: right-leg maximum isometric force; and MIF: bilateral maximum isometric force. ANOVA: b Week; c Session; e Player Status. ¶ Week × Player Status; Ұ Week × Session, † Session × Player Status (p < 0.05). Post-hoc: * Week (CW vs PM); 𝟙 Significant differences compared to CW-1 (p ˂ 0.001); ¤ Significant differences compared to 24H-PM in Starters.
Figure 4.
Changes in maximum isometric force through training week (CW: control week) and during post-match weeks using different small-sided games formats (ssg; 25 x 18 m pitch, 75 m2 vs. LSG; 36 x 25 m pitch, 150 m2) at 24, 72, and 120 h post-match. LMIF: left-leg maximum isometric force; RMIF: right-leg maximum isometric force; and MIF: bilateral maximum isometric force. ANOVA: b Week; c Session; e Player Status. ¶ Week × Player Status; Ұ Week × Session, † Session × Player Status (p < 0.05). Post-hoc: * Week (CW vs PM); 𝟙 Significant differences compared to CW-1 (p ˂ 0.001); ¤ Significant differences compared to 24H-PM in Starters.
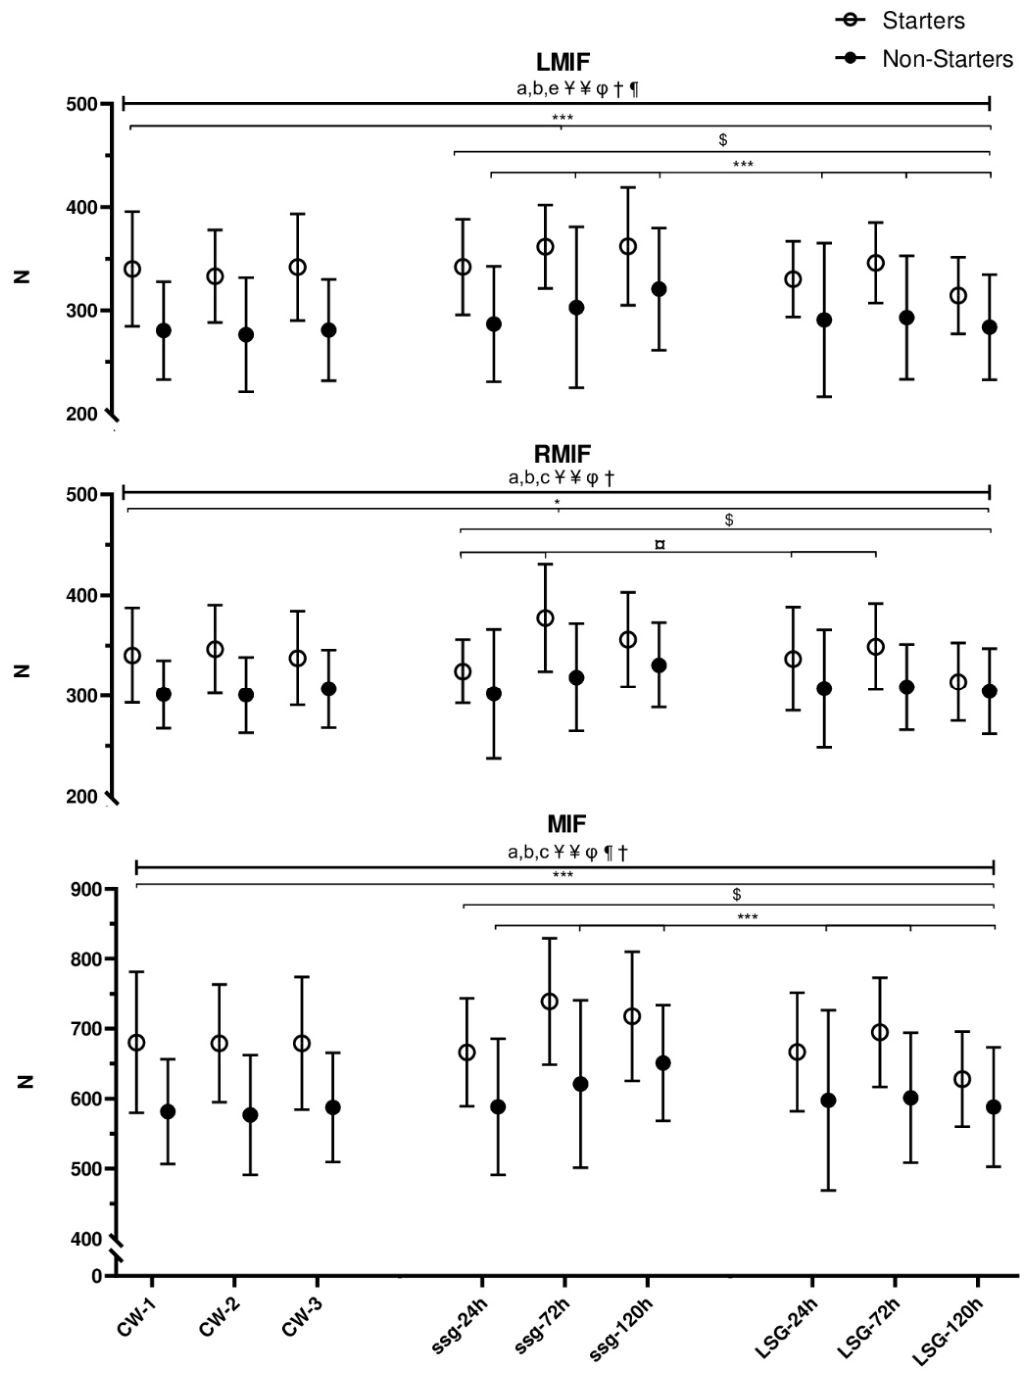
Regarding maximum hamstring isometric force metrics, the LMM analysis showed significant main fixed effects for Week (LMIF: F = 14.18, p < 0.001; RMIF: F = 4.23, p = 0.041; MIF: F = 11.33, p < 0.001), Session (RMIF: F = 7.20, p < 0.001; MIF: F = 3.69, p = 0.026), and Player Status (LMIF: F = 4.90, p = 0.045). Significant Week × Session (LMIF: F = 3.87, p = 0.022; RMIF: F = 4.29, p = 0.015; MIF: F = 5.25, p = 0.006), Week × Player Status (LMIF: F = 4.96, p = 0.027; MIF: F = 4.51, p = 0.034) and Session × Player Status (RMIF: F = 7.20, p < 0.001; MIF: F = 3.69, p = 0.026) interactions were observed.
Post-hoc analyses confirmed that force outputs were consistently superior in PM compared to CW (LMIF: β = 10.72 N, p < 0.001; RMIF: β = 5.22 N, p = 0.041; MIF: β = 15.95 N, p < 0.001). Significant inter-group variability and temporal decrements were detected, Non-Starters showed a higher force production during PM for LMIF (β = 17.06 N, p < 0.001) and MIF (β = 26.02 N, p < 0.001) compared to CW, while Starters exhibited a significant recovery in RMIF from first to second session (β = 19.36 N, p < 0.001) followed by a partial decrease by third session (β = -18.63 N, p < 0.001).
4. Discussion
To our knowledge, this is the first study to examine whether different SSGs formats are sensitive to post-match fatigue by analyzing changes in time-motion performance and physiological and athletic markers across a typical in-season training week in elite youth soccer players. The main finding was that although post-match fatigue was associated with reductions in several external-load variables during SSGs, particularly TD, ACC, and DEC, the practical value of these changes was substantially limited by the poor reliability and high variability of many SSGs-derived metrics. In contrast, neuromuscular assessment consistently detected post-match fatigue, as reflected by reductions in CMJ height and hamstring MIF, whereas HRV showed only a transient reduction in starters 24 h after match play. Collectively, these findings suggest that, despite some responsiveness to post-match fatigue, short 3-a-side SSGs have limited utility as standalone monitoring tools and should complement rather than replace direct neuromuscular assessments when evaluating recovery status in elite youth soccer players.
The use of SSGs for assessing physical performance has been debated because, unlike standardized physical tests, performance during SSGs emerges from the interaction of physical, technical, tactical, and contextual factors [15,16,17,18]. Therefore, the usefulness of SSGs for monitoring fatigue depends not only on their responsiveness to physiological changes but also on the reliability of the measured variables. In the present study, TD showed acceptable absolute reliability (CV: ~8%) but only moderate relative reliability (ICC: ~0.53) in 3-a-sided SSGs played with or without GK across different pitch sizes, consistent with the findings of Riboli et al. [18], who likewise concluded that SSG-derived TD was insufficiently reliable to monitor changes in aerobic fitness. Despite these limitations, a consistent reduction in TD covered during post-match weeks was observed across most SSGs formats, supporting the notion that match play induces residual fatigue that influences subsequent training performance. In addition to TD, other mechanical load indicators were also affected, as reflected by reduced ACC and DEC during PM weeks compared with CW. These findings align with previous research showing decrements in running performance during congested or post-match periods [34,35]. However, the magnitude and timing of these reductions varied considerably depending on pitch size, GK inclusion, and player status, suggesting that the sensitivity of SSG-derived metrics is highly dependent on task constraints. For example, decrements in HSR were evident only during LSG+GK, highlighting the multifactorial nature of performance responses during game-based drills. This variability likely reflects the inherent stochasticity of SSGs, in which technical-tactical behaviors, player interactions, and contextual constraints strongly influence physical outputs [25], limiting their use as a standalone tool for monitoring fatigue. This limitation was particularly evident for high-speed running and sprint distance. These variables exhibited poor relative reliability and very large coefficients of variation, likely reflecting the restricted opportunities to reach high running speeds during 3v3 SSGs played on relatively small pitches. Consequently, the observed floor effects reduce both the reproducibility and practical utility of these metrics for monitoring post-match fatigue in this specific training context. Although these variables were retained because they represent standard GPS-derived external-load metrics routinely quantified in soccer and allow comparisons with previous literature, their interpretation within this specific SSGs format should be made with caution.
In contrast to the SSG-derived metrics, CMJ height proved to be a sensitive and reliable indicator of post-match neuromuscular fatigue. A significant reduction in CMJ height was observed during post-match weeks compared with control weeks, with starters exhibiting greater impairments than non-starters. These findings are in line with previous studies reporting impairments in jump performance following competitive soccer matches [1,36], reinforcing the value of CMJ as a simple and practical marker of neuromuscular recovery. The largest reductions of CMJ height were observed at 24H-PM, suggesting the 24 h post-match timeframe as the peak acute neuromuscular fatigue. Although partial recovery occurred thereafter, starters continued to exhibit residual impairments throughout the post-match period, likely reflecting their greater match exposure and accumulated mechanical and metabolic load. In contrast, non-starters showed minimal changes in CMJ performance, reinforcing the importance of individualizing post-match monitoring and recovery strategies based on match involvement. The greater sensitivity of CMJ compared with SSG-derived variables is likely explained by its highly standardized nature. Unlike performance during SSGs, which is influenced by technical, tactical, and contextual factors, CMJ primarily reflects changes in neuromuscular function with minimal influence from external constraints. Consequently, day-to-day variability is substantially lower, allowing fatigue-related changes to be detected more consistently. Collectively, these findings support CMJ as one of the most practical and robust tools for monitoring post-match neuromuscular fatigue in elite youth soccer players.
Hamstring MIF force provided complementary information regarding post-match neuromuscular status. Although significant reductions in hamstring force were not consistently observed across all comparisons, starters generally exhibited an attenuated recovery pattern compared to non-starters, who showed slight improvements throughout the post-match training period. These findings are consistent with the greater match exposure and accumulated mechanical load experienced by starters and further support the importance of individualizing post-match recovery strategies according to playing time [1,37]. The observed differences in hamstring force may also help explain the concomitant reductions in ACC and DEC observed during SSGs. The hamstrings play a critical role in horizontal force production during high-intensity running, deceleration, and change-of-direction actions, and previous research has demonstrated that match-induced fatigue impairs hamstring force-generating capacity, thereby compromising the ability to decelerate and re-accelerate rapidly [38,39]. The persistence of hamstring force decrements up to 120-H-PM in the present study may therefore explain the prolonged suppression of mechanical load variables observed in certain SSGs formats. Collectively, these findings reinforce the value of hamstring strength assessments for interpreting changes in ACC and DEC during post-match training and highlight the importance of integrating neuromuscular testing with external load monitoring to better understand fatigue-related alterations in movement capacity.
HRV showed limited sensitivity to post-match fatigue in the present study. A significant reduction was observed only in starters at 24 h after match play, while no meaningful changes were detected across other sessions or in non-starters. It is possible that the high match exposure among starter players increased the detectability of autonomic disturbances in this group. This result aligns with some studies reporting post-match reductions in parasympathetic activity [40,41], but contrasts with others showing limited sensitivity of HRV to short-term fatigue in young or well-trained populations [11]. Muñoz et al. [14] reported that parasympathetic function decreased 24 h after a soccer match but was fully restored at 72 h. Interestingly, HRV recovered more rapidly than CMJ performance, suggesting that autonomic and neuromuscular recovery follow different time courses. While parasympathetic reactivation may occur within the first days after competition, residual impairments in force production and explosive performance can persist despite normalization of cardiac autonomic function. Therefore, while HRV may provide complementary information regarding acute post-match stress, it should not be used in isolation to infer neuromuscular recovery status. Instead, HRV assessments should be integrated with performance-based measures, particularly when monitoring recovery in elite youth soccer players.
The current study had several limitations that should be acknowledged. First, the relatively small sample size, combined with the complexity of the repeated-measures model and the number of dependent variables analyzed, may have increased the risk of both type I and type II errors. Therefore, higher-order interactions should be interpreted with caution and treated as exploratory. Second, the different SSGs formats were not randomized or counterbalanced across the study period due to the constraints imposed by the competitive match calendar. Consequently, the observed differences between SSGs formats cannot be attributed exclusively to pitch size or GK inclusion, as they may also have been influenced by temporal factors such as seasonal progression or accumulated fatigue. Nevertheless, weekly external training load was continuously monitored using GPS technology, allowing us to verify that the overall training load was largely comparable between weeks. Additionally, accelerometry-derived variables were not analyzed during SSGs, which could have provided more insight into changes in movement strategies. Future research should investigate whether combining SSGs performance with accelerometry metrics or personalized benchmarks enhances fatigue detection, and consider counterbalanced format sequencing with longer or repeated SSGs sessions to improve sensitivity.
In conclusion, post-match fatigue in elite youth soccer players was consistently detected by neuromuscular assessments, particularly CMJ height and hamstring MIF, which proved to be reliable indicators of residual fatigue, especially in starters. In contrast, HRV showed only transient alterations and did not consistently reflect neuromuscular recovery status. Although time-motion performance during 3-a-side SSGs was generally reduced during post-match weeks, the high variability and poor reproducibility of several time-motion variables, particularly high-speed running and sprint distance, limit their usefulness as indicators of post-match fatigue within short 3-a-side SSG formats. Consequently, SSGs may complement fatigue testing, but should not replace direct neuromuscular assessments when monitoring post-match recovery in elite youth soccer players.
Practical Applications
While SSGs remain a valuable training tool, their use as a diagnostic method for assessing post-match fatigue should be restricted to direct fitness assessments. The high variability of the time-motion parameters limits their use as standalone fatigue indicators. CMJ height and hamstring MIF are sensitive markers of post-match neuromuscular fatigue in elite youth soccer players and should be prioritized when monitoring recovery. Integrating performance-based tests with external load monitoring may provide a more robust approach for evaluating recovery and informing individualized training and return-to-play strategies in elite youth soccer players.
Author Contributions
Conceptualization, J.H, M.A.C., M.H. and F.P; methodology, M.A.C., M.H. and F.P; investigation, J.H. and J.V.; data curation, J.H. and M.L.; writing—original draft preparation, J.H.; writing—review and editing, M.A.C., M.H. and F.P. Supervision, F.P. All authors have read and agreed to the published version of the manuscript.
Funding
This research received no external funding.
Institutional Review Board Statement
This study was approved by the Research Ethics Committee of the Pablo de Olavide University (Ref: 25/7-82, 1 December 2025) in accordance with the Declaration of Helsinki.
Informed Consent Statement
Written informed consent was obtained from the participants (or parents of minors).
Data Availability Statement
The raw data supporting the conclusions of this article will be made available by the authors on request.
Acknowledgments
The authors thank all athletes who participated in this study.
Conflicts of Interest
The authors declare no conflicts of interest.
References
- Silva, J.R.; Rumpf, M.C.; Hertzog, M.; Castagna, C.; Farooq, A.; Girard, O.; Hader, K. Acute and Residual Soccer Match-Related Fatigue: A Systematic Review and Meta-analysis. Sports Med. 2018, 48, 539–583. [Google Scholar] [CrossRef] [PubMed]
- Impellizzeri, F.M.; Marcora, S.M.; Coutts, A.J. Internal and External Training Load: 15 Years On. Int. J. Sports Physiol. Perform. 2019, 14, 270–273. [Google Scholar] [CrossRef] [PubMed]
- Kalkhoven, J.T.; Watsford, M.L.; Coutts, A.J.; Edwards, W.B.; Impellizzeri, F.M. Training Load and Injury: Causal Pathways and Future Directions. Sports Med. 2021, 51, 1137–1150. [Google Scholar] [CrossRef] [PubMed]
- Bourdon, P.C.; Cardinale, M.; Murray, A.; Gastin, P.; Kellmann, M.; Varley, M.C.; Gabbett, T.J.; Coutts, A.J.; Burgess, D.J.; Gregson, W.; et al. Monitoring Athlete Training Loads: Consensus Statement. Int. J. Sports Physiol. Perform. 2017, 12, S2161–S2170. [Google Scholar] [CrossRef] [PubMed]
- Halson, S.L. Monitoring training load to understand fatigue in athletes. Sports Med. 2014, 44 Suppl 2, S139–147. [Google Scholar] [CrossRef] [PubMed]
- McCall, A.; Nedelec, M.; Carling, C.; Le Gall, F.; Berthoin, S.; Dupont, G. Reliability and sensitivity of a simple isometric posterior lower limb muscle test in professional football players. J. Sports Sci. 2015, 33, 1298–1304. [Google Scholar] [CrossRef] [PubMed]
- Claudino, J.G.; Cronin, J.; Mezencio, B.; McMaster, D.T.; McGuigan, M.; Tricoli, V.; Amadio, A.C.; Serrao, J.C. The countermovement jump to monitor neuromuscular status: A meta-analysis. J. Sci. Med. Sport 2017, 20, 397–402. [Google Scholar] [CrossRef] [PubMed]
- Matinlauri, A.; Alcaraz, P.E.; Freitas, T.T.; Mendiguchia, J.; Abedin-Maghanaki, A.; Castillo, A.; Martinez-Ruiz, E.; Carlos-Vivas, J.; Cohen, D.D. A comparison of the isometric force fatigue-recovery profile in two posterior chain lower limb tests following simulated soccer competition. PLoS ONE 2019, 14, e0206561. [Google Scholar] [CrossRef] [PubMed]
- Jimenez-Reyes, P.; Pareja-Blanco, F.; Cuadrado-Penafiel, V.; Ortega-Becerra, M.; Parraga, J.; Gonzalez-Badillo, J.J. Jump height loss as an indicator of fatigue during sprint training. J. Sports Sci. 2019, 37, 1029–1037. [Google Scholar] [CrossRef] [PubMed]
- Flatt, A.A.; Howells, D. Effects of varying training load on heart rate variability and running performance among an Olympic rugby sevens team. J. Sci. Med. Sport 2019, 22, 222–226. [Google Scholar] [CrossRef] [PubMed]
- Thorpe, R.T.; Strudwick, A.J.; Buchheit, M.; Atkinson, G.; Drust, B.; Gregson, W. Monitoring Fatigue During the In-Season Competitive Phase in Elite Soccer Players. Int. J. Sports Physiol. Perform. 2015, 10, 958–964. [Google Scholar] [CrossRef] [PubMed]
- Mirto, M.; Filipas, L.; Altini, M.; Codella, R.; Meloni, A. Heart Rate Variability in Professional and Semiprofessional Soccer: A Scoping Review. Scand. J. Med. Sci. Sports 2024, 34, e14673. [Google Scholar] [CrossRef] [PubMed]
- Sanchez-Sanchez, J.; Botella, J.; Felipe Hernandez, J.L.; Leon, M.; Paredes-Hernandez, V.; Colino, E.; Gallardo, L.; Garcia-Unanue, J. Heart Rate Variability and Physical Demands of In-Season Youth Elite Soccer Players. Int. J. Environ. Res. Public Health 2021, 18. [Google Scholar] [CrossRef] [PubMed]
- Munoz-Lopez, A.; Nakamura, F.; Naranjo Orellana, J. Soccer Matches but Not Training Sessions Disturb Cardiac-Autonomic Regulation During National Soccer Team Training Camps. Res. Q. Exerc. Sport 2021, 92, 43–51. [Google Scholar] [CrossRef] [PubMed]
- Owen, A.L.; Newton, M.; Shovlin, A.; Malone, S. The Use of Small-Sided Games as an Aerobic Fitness Assessment Supplement Within Elite Level Professional Soccer. J. Hum. Kinet. 2020, 71, 243–253. [Google Scholar] [CrossRef] [PubMed]
- Milanovic, Z.; Rada, A.; Erceg, M.; Trajkovic, N.; Stojanovic, E.; Lesnik, B.; Krustrup, P.; Randers, M.B. Reproducibility of Internal and External Training Load During Recreational Small-Sided Football Games. Res. Q. Exerc. Sport 2020, 91, 676–681. [Google Scholar] [CrossRef] [PubMed]
- Stevens, T.G.; De Ruiter, C.J.; Beek, P.J.; Savelsbergh, G.J. Validity and reliability of 6-a-side small-sided game locomotor performance in assessing physical fitness in football players. J. Sports Sci. 2016, 34, 527–534. [Google Scholar] [CrossRef] [PubMed]
- Riboli, A.; Dellal, A.; Esposito, F.; Coratella, G. Can small-sided games assess the training-induced aerobic adaptations in elite football players? J. Sports Med. Phys. Fit. 2022, 62, 1313–1322. [Google Scholar] [CrossRef] [PubMed]
- Younesi, S.; Rabbani, A.; Clemente, F.M.; Silva, R.; Sarmento, H.; Figueiredo, A.J. Relationships Between Aerobic Performance, Hemoglobin Levels, and Training Load During Small-Sided Games: A Study in Professional Soccer Players. Front. Physiol. 2021, 12, 649870. [Google Scholar] [CrossRef] [PubMed]
- Ravé, G.; Granacher, U.; Boullosa, D.; Hackney, A.C.; Zouhal, H. How to use global positioning systems (GPS) data to monitor training load in the “real world” of elite soccer. Front. Physiol. 2020, 11, 944. [Google Scholar] [CrossRef] [PubMed]
- Rowell, A.E.; Aughey, R.J.; Clubb, J.; Cormack, S.J. A Standardized Small Sided Game Can Be Used to Monitor Neuromuscular Fatigue in Professional A-League Football Players. Front. Physiol. 2018, 9, 1011. [Google Scholar] [CrossRef] [PubMed]
- Kelly, S.J.; Murphy, A.J.; Watsford, M.L.; Austin, D.; Rennie, M. Reliability and validity of sports accelerometers during static and dynamic testing. Int. J. Sports Physiol. Perform. 2015, 10, 106–111. [Google Scholar] [CrossRef] [PubMed]
- Shushan, T.; McLaren, S.J.; Buchheit, M.; Scott, T.J.; Barrett, S.; Lovell, R. Submaximal Fitness Tests in Team Sports: A Theoretical Framework for Evaluating Physiological State. Sports Med. 2022, 52, 2605–2626. [Google Scholar] [CrossRef] [PubMed]
- Asian-Clemente, J.; Rabano-Muñoz, A.; Muñoz, B.; Franco, J.; Suarez-Arrones, L. Can small-side games provide adequate high-speed training in professional soccer? Int. J. Sports Med. 2021, 42, 523–528. [Google Scholar] [CrossRef] [PubMed]
- Hill-Haas, S.V.; Dawson, B.; Impellizzeri, F.M.; Coutts, A.J. Physiology of small-sided games training in football: a systematic review. Sports Med. 2011, 41, 199–220. [Google Scholar] [CrossRef] [PubMed]
- Clemente, F.M. The Threats of Small-Sided Soccer Games: A Discussion About Their Differences With the Match External Load Demands and Their Variability Levels. Strength Cond. J. 2020, 42, 100–105. [Google Scholar] [CrossRef]
- Gantois, P.; Piqueras-Sanchiz, F.; Cid, M.J.F.A.; Pino-Ortega, J.; Castillo, D.; Nakamura, F.Y. The effects of different small-sided games configurations on heart rate, rating of perceived exertion, and running demands in professional soccer players. Eur. J. Sport Sci. 2023, 23, 1214–1222. [Google Scholar] [CrossRef] [PubMed]
- Halouani, J.; Chtourou, H.; Gabbett, T.; Chaouachi, A.; Chamari, K. Small-sided games in team sports training: a brief review. J. Strength Cond. Res. 2014, 28, 3594–3618. [Google Scholar] [CrossRef] [PubMed]
- Hulka, K.; Weisser, R.; Belka, J. Effect of the pitch size and presence of goalkeepers on the work load of players during small-sided soccer games. J. Hum. Kinet. 2016, 51, 175–181. [Google Scholar] [CrossRef] [PubMed]
- Koklu, Y.; Sert, O.; Alemdaroglu, U.; Arslan, Y. Comparison of the physiological responses and time-motion characteristics of young soccer players in small-sided games: the effect of goalkeeper. J. Strength Cond. Res. 2015, 29, 964–971. [Google Scholar] [CrossRef] [PubMed]
- Asian-Clemente, J.A.; Rabano-Munoz, A.; Nunez, F.J.; Suarez-Arrones, L. External and internal load during small-sided games in soccer: use or not floaters. J. Sports Med. Phys. Fit. 2022, 62, 301–307. [Google Scholar] [CrossRef] [PubMed]
- Riboli, A.; Esposito, F.; Coratella, G. Technical and locomotor demands in elite soccer: manipulating area per player during small-sided games to replicate official match demands. Biol. Sport 2023, 40, 639–647. [Google Scholar] [CrossRef] [PubMed]
- Clemente, F.M.; Praca, G.M.; Bredt, S.; van der Linden, C.M.I.; Serra-Olivares, J. External Load Variations Between Medium- and Large-Sided Soccer Games: Ball Possession Games Vs Regular Games with Small Goals. J. Hum. Kinet. 2019, 70, 191–198. [Google Scholar] [CrossRef] [PubMed]
- Nedelec, M.; McCall, A.; Carling, C.; Legall, F.; Berthoin, S.; Dupont, G. Recovery in soccer: part I - post-match fatigue and time course of recovery. Sports Med. 2012, 42, 997–1015. [Google Scholar] [CrossRef] [PubMed]
- Dupont, G.; Nedelec, M.; McCall, A.; McCormack, D.; Berthoin, S.; Wisloff, U. Effect of 2 soccer matches in a week on physical performance and injury rate. Am. J. Sports Med. 2010, 38, 1752–1758. [Google Scholar] [CrossRef] [PubMed]
- Ispirlidis, I.; Fatouros, I.G.; Jamurtas, A.Z.; Nikolaidis, M.G.; Michailidis, I.; Douroudos, I.; Margonis, K.; Chatzinikolaou, A.; Kalistratos, E.; Katrabasas, I.; et al. Time-course of changes in inflammatory and performance responses following a soccer game. Clinical journal of sport medicine: official journal of the Canadian Academy of Sport Medicine 2008, 18, 423–431. [Google Scholar] [CrossRef] [PubMed]
- Massamba, A.; Kouzkouz, N.; Geny, B.; Favret, F.; Hureau, T.J. Neuromuscular Fatigue in Hamstring and Quadriceps Muscles after Simulated Soccer Match Play and Typical Training Sessions. Med. Sci. Sports Exerc. 2025, 57, 984–995. [Google Scholar] [CrossRef] [PubMed]
- Timmins, R.G.; Opar, D.A.; Williams, M.D.; Schache, A.G.; Dear, N.M.; Shield, A.J. Reduced biceps femoris myoelectrical activity influences eccentric knee flexor weakness after repeat sprint running. Scand. J. Med. Sci. Sports 2014, 24, e299-305. [Google Scholar] [CrossRef] [PubMed]
- Small, K.; McNaughton, L.R.; Greig, M.; Lohkamp, M.; Lovell, R. Soccer fatigue, sprinting and hamstring injury risk. Int. J. Sports Med. 2009, 30, 573–578. [Google Scholar] [CrossRef] [PubMed]
- Nakamura, F.Y.; Flatt, A.A.; Pereira, L.A.; Ramirez-Campillo, R.; Loturco, I.; Esco, M.R. Ultra-short-term heart rate variability is sensitive to training effects in team sports players. J. Sports Sci. Med. 2015, 14, 602. [Google Scholar] [PubMed]
- Edmonds, R.C.; Sinclair, W.H.; Leicht, A.S. Effect of a training week on heart rate variability in elite youth rugby league players. Int. J. Sports Med. 2013, 34, 1087–1092. [Google Scholar] [CrossRef] [PubMed]
Figure 1.
Timeline schedule of study methodology. CW: control week; PM: post-match week; HRV: heart rate variability test; CMJ: countermovement jump test; MIF: maximum hamstring isometric force test; 3-a-sided: small (ssg) and large (LSG) format test. Training sessions with respect to the number of days before or after a match (MD minus or plus) or no training (DAY OFF).
Figure 1.
Timeline schedule of study methodology. CW: control week; PM: post-match week; HRV: heart rate variability test; CMJ: countermovement jump test; MIF: maximum hamstring isometric force test; 3-a-sided: small (ssg) and large (LSG) format test. Training sessions with respect to the number of days before or after a match (MD minus or plus) or no training (DAY OFF).
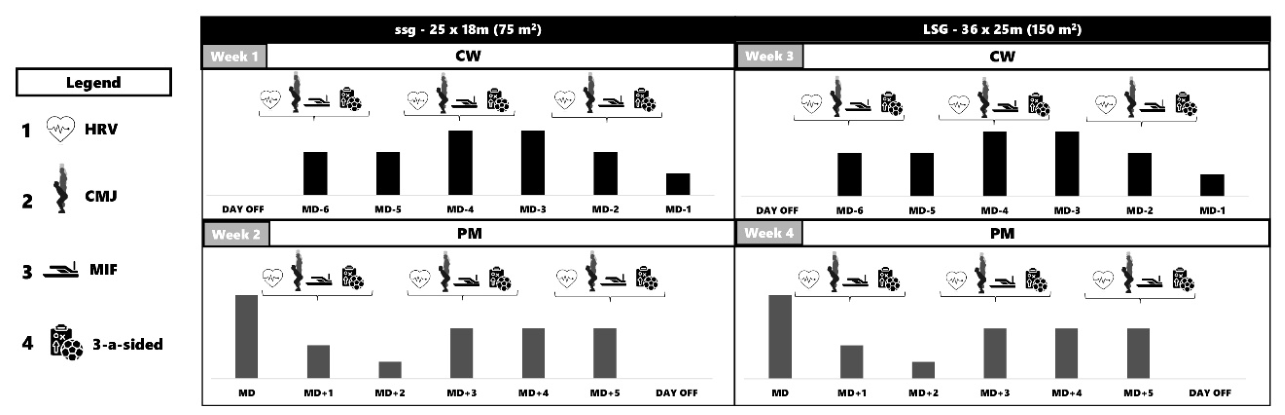
Figure 2.
Changes in root mean square of successive differences (RMSSD) through a training week (CW: control week) and during post-match weeks using different small-sided games formats (ssg; 25 x 18 m pitch, 75 m2 vs. LSG; 36 x 25 m pitch, 150 m2) at 24, 72, and 120 h post-match. ANOVA: # Significant “Session × Player Status” (p ˂ 0.001). & Significant “Week × Session × Player Status” (p = 0.001). Post-hoc: ① Significant differences compared to CW-1 in starters (p ˂ 0.05).
Figure 2.
Changes in root mean square of successive differences (RMSSD) through a training week (CW: control week) and during post-match weeks using different small-sided games formats (ssg; 25 x 18 m pitch, 75 m2 vs. LSG; 36 x 25 m pitch, 150 m2) at 24, 72, and 120 h post-match. ANOVA: # Significant “Session × Player Status” (p ˂ 0.001). & Significant “Week × Session × Player Status” (p = 0.001). Post-hoc: ① Significant differences compared to CW-1 in starters (p ˂ 0.05).
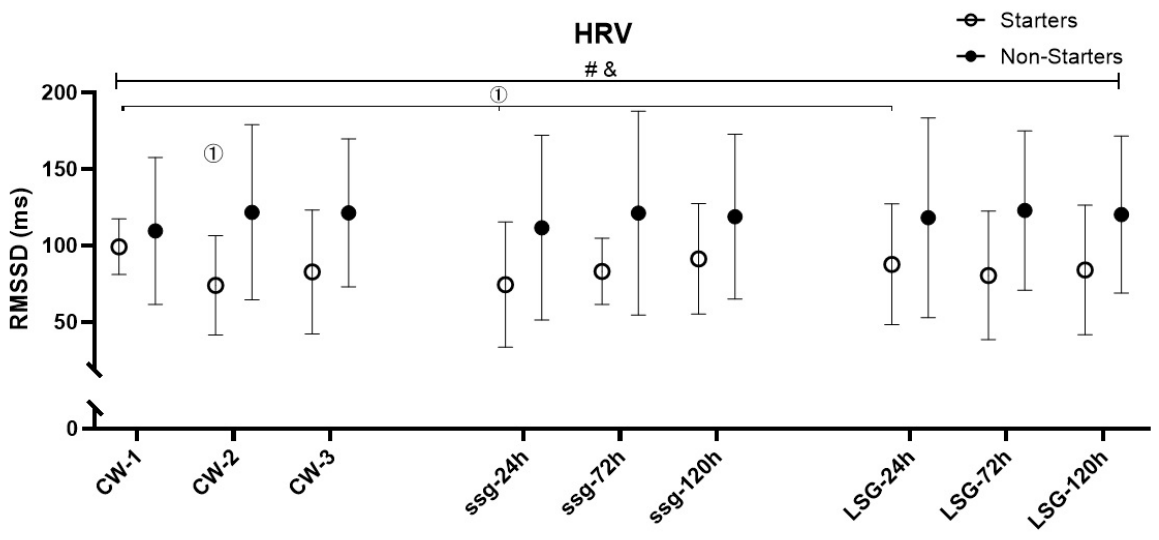

Table 1.
Test–retest reliability of external load in 3-a-side SSGs format and physical performance.
| Variable | Format | ICC | CI (95%) | CV |
|---|---|---|---|---|
| TD | ssg | 0.59 | 0.05 – 0.85 | 6.4% |
| ssg+GK | 0.38 | -0.46 – 0.77 | 7.3% | |
| LSG | 0.59 | 0.03 – 0.85 | 6.9% | |
| LSG+GK | 0.55 | -0.06 – 0.83 | 6.6% | |
| HSR | ssg | -0.19 | -1.34 – 0.63 | 215.0% |
| ssg+GK | 0.57 | -0.00 – 0.84 | 139.1% | |
| LSG | 0.55 | -0.45 – 0.83 | 125.3% | |
| LSG+GK | 0.20 | -0.88 – 0.70 | 86.4% | |
| SR | ssg | - | - | - |
| ssg+GK | -0.17 | -2.41 – 0.62 | 314.9% | |
| LSG | -0.58 | -2.76 – 0.48 | 239.0% | |
| LSG+GK | -0.64 | -2.83 – 0.40 | 183.3% | |
| ACC | ssg | 0.77 | 0.46 – 0.92 | 20.4% |
| ssg+GK | -0.28 | -1.98 – 0.53 | 25.0% | |
| LSG | 0.22 | -0.83 – 0.71 | 29.1% | |
| LSG+GK | 0.51 | -0.14 – 0.82 | 18.7% | |
| DEC | ssg | 0.59 | 0.04 – 0.85 | 20.6% |
| ssg+GK | 0.28 | -0.68 – 0.74 | 25.7% | |
| LSG | 0.49 | -0.02 – 0.81 | 20.0% | |
| LSG+GK | 0.62 | 0.11 – 0.86 | 21.4% | |
| CMJ | 0.99 | 0.97 – 0.99 | 1.3% | |
| LMIF | 0.95 | 0.84 – 0.98 | 7.1% | |
| RMIF | 0.90 | 0.72 – 0.97 | 7.8% | |
| MIF | 0.93 | 0.79 – 0.98 | 7.1% |
ICC: intraclass correlation coefficient; CI: confidence interval (95%); CV: coefficient of variation. TD: total distance; HSR: high-speed running; SR: sprint distance; ACC: accelerations; DEC: decelerations. ssg: 3-a-sided game without a goalkeeper (GK) in a relative player area of 75 m2; ssg+GK: 3-a-sided game with GK in a relative player area of 75 m2; LSG: 3-a-sided game without GK in a relative player area of 150 m2; LSG+GK: 3-a-sided game with GK in a relative player area of 150 m2; CMJ: countermovement jump height; LMIF: left-leg maximum isometric force; RMIF: right-leg maximum isometric force; and MIF: bilateral maximum isometric force.
Table 2.
Evolution of time-motion activity across the different small-sided games (SSGs) formats through different training weeks.
Table 2.
Evolution of time-motion activity across the different small-sided games (SSGs) formats through different training weeks.
| Variable | Format | Group | CW-1 | CW-2 | CW-3 | 24H-PM | 72H-PM | 120H-PM |
|---|---|---|---|---|---|---|---|---|
| TD (m)a, b, c,#,φ, Җ | ssg* | Starters | 366.5 ± 40.6 | 380.6 ± 16.2 | 378.4 ± 19.8 | 335.5 ± 15.7 | 350.9 ± 35.6 | 328.2 ± 9.3 |
| Non-Starters | 355.3 ± 16.0 | 360.7 ± 25.7 | 349.6 ± 36.6 | 331.2 ± 36.5 | 350.3 ± 27.4 | 296.8 ± 28.5 | ||
| ssg+GK* | Starters | 315.0 ± 25.5 | 341.8 ± 23.1 | 314.1 ± 25.4 | 310.9 ± 25.0 | 304.9 ± 28.0 | 311.5 ± 33.6 | |
| Non-Starters | 320.8 ± 22.2 | 332.5 ± 20.9 | 316.1 ± 31.9 | 301.7 ± 25.8 | 303.2 ± 21.5 | 300.9 ± 43.5 | ||
| LSG*$ | Starters | 428.1 ± 18.3 | 415.9 ± 44.9 | 441.3 ± 39.3 | 431.1 ± 33.9 | 401.0 ± 44.2 | 400.0 ± 27.1 | |
| Non-Starters | 425.9 ± 32.8 | 408.0 ± 32.7 | 408.6 ± 36.9 | 413.7 ± 32.6 | 393.2 ± 22.1 | 389.1 ± 20.0 | ||
| LSG+GK*$† | Starters | 387.1 ± 19.2 | 376.4 ± 23.7 | 397.6 ± 37.7 | 358.1 ± 26.9 | 369.9 ± 35.3 | 368.0 ± 34.4 | |
| Non-Starters | 385.9 ± 29.8 | 372.0 ± 23.6 | 357.1 ± 29.1 | 357.9 ± 18.9 | 360.1 ± 30.1 | 345.0 ± 24.7 | ||
| HSR (m)a, d, ¶ | ssg | Starters | 0.2 ± 0.3 | 2.3 ± 3.6 | 1.2 ± 2.5 | 0.0 ± 0.0 | 1.3 ± 3.5 | 0.0 ± 0.0 |
| Non-Starters | 0.2 ± 0.3 | 1.1 ± 1.8 | 0.5 ± 1.1 | 0.0 ± 0.0 | 0.5 ± 0.7 | 3.3 ± 6.6 | ||
| ssg+GK | Starters | 0.7 ± 1.3 | 1.6 ± 2.9 | 3.9 ± 6.4 | 2.3 ± 2.1 | 3.1 ± 3.7 | 0.3 ± 0.5 | |
| Non-Starters | 0.1 ± 0.2 | 2.8 ± 3.0 | 1.7 ± 2.6 | 2.8 ± 4.0 | 1.9 ± 3.9 | 2.5 ± 4.1 | ||
| LSG | Starters | 0.0 ± 0.1 | 2.1 ± 4.8 | 1.7 ± 4.2 | 0.0 ± 0.0 | 3.1 ± 7.0 | 1.4 ± 1.9 | |
| Non-Starters | 0.1 ± 0.2 | 4.1 ± 3.6 | 4.2 ± 7.3 | 1.1 ± 2.1 | 5.2 ± 6.4 | 9.2 ± 9.3 | ||
| LSG+GK | Starters | 11.1 ± 5.7 | 13.7 ± 11.8 | 14.1 ± 13.5 | 8.1 ± 9.1 | 4.1 ± 7.7 | 8.0 ± 8.4 | |
| Non-Starters | 13.9 ± 14.8 | 5.3 ± 4.2 | 8.0 ± 7.4 | 7.6 ± 9.5 | 6.7 ± 6.1 | 13.3 ± 10.5 | ||
| SR (m)a, d | ssg | Starters | 0.0 ± 0.0 | 0.4 ± 1.0 | 0.0 ± 0.0 | 0.0 ± 0.0 | 0.0 ± 0.0 | 0.0 ± 0.0 |
| Non-Starters | 0.0 ± 0.0 | 0.1 ± 0.2 | 0.0 ± 0.0 | 0.0 ± 0.0 | 0.0 ± 0.0 | 0.0 ± 0.0 | ||
| ssg+GK | Starters | 0.0 ± 0.0 | 0.0 ± 0.0 | 1.7 ± 2.9 | 0.1 ± 0.2 | 0.1 ± 0.3 | 0.0 ± 0.0 | |
| Non-Starters | 0.0 ± 0.0 | 0.1 ± 0.2 | 0.4 ± 1.0 | 0.2 ± 0.5 | 0.3 ± 1.0 | 0.2 ± 0.5 | ||
| LSG | Starters | 1.9 ± 2.6 | 0.1 ± 0.3 | 0.1 ± 0.3 | 1.0 ± 2.2 | 0.2 ± 0.5 | 0.0 ± 0.0 | |
| Non-Starters | 3.5 ± 3.6 | 0.0 ± 0.0 | 0.2 ± 0.5 | 5.3 ± 5.0 | 0.7 ± 1.7 | 0.3 ± 0.5 | ||
| LSG+GK | Starters | 1.7 ± 1.7 | 2.1 ± 3.4 | 4.7 ± 6.1 | 1.5 ± 2.3 | 2.1 ± 5.6 | 1.4 ± 3.1 | |
| Non-Starters | 2.2 ± 4.6 | 1.0 ± 2.2 | 1.3 ± 1.9 | 1.7 ± 3.0 | 1.0 ± 1.5 | 2.3 ± 3.7 | ||
| ACC (n)a, b | ssg* | Starters | 15.4 ± 4.2 | 13.6 ± 3.4 | 15.0 ± 4.2 | 12.9 ± 4.1 | 14.0 ± 2.2 | 12.2 ± 4.5 |
| Non-Starters | 15.0 ± 4.1 | 14.3 ± 5.3 | 16.3 ± 5.5 | 15.7 ± 4.1 | 14.9 ± 5.8 | 10.6 ± 6.0 | ||
| ssg+GK* | Starters | 14.3 ± 2.7 | 15.8 ± 3.0 | 15.6 ± 4.2 | 15.2 ± 1.9 | 14.4 ± 2.8 | 14.6 ± 2.5 | |
| Non-Starters | 14.3 ± 3.6 | 15.3 ± 4.3 | 15.0 ± 4.4 | 15.7 ± 2.6 | 15.3 ± 2.4 | 13.9 ± 3.3 | ||
| LSG* | Starters | 17.4 ± 5.9 | 14.0 ± 2.4 | 14.0 ± 2.2 | 12.7 ± 3.6 | 12.6 ± 5.0 | 11.6 ± 4.3 | |
| Non-Starters | 15.1 ± 4.1 | 14.5 ± 3.9 | 12.5 ± 6.2 | 12.4 ± 4.1 | 14.9 ± 2.7 | 13.9 ± 4.2 | ||
| LSG+GK* | Starters | 14.6 ± 4.0 | 14.7 ± 2.8 | 15.7 ± 2.3 | 13.1 ± 2.1 | 14.1 ± 1.8 | 13.1 ± 3.0 | |
| Non-Starters | 13.5 ± 3.4 | 14.0 ± 2.7 | 13.0 ± 3.2 | 12.9 ± 2.6 | 14.7 ± 2.9 | 13.3 ± 2.8 | ||
| DEC (n)b,ҰҮ | Ssg* | Starters | 17.3 ± 2.3 | 16.3 ± 4.1 | 18.5 ± 3.1 | 11.9 ± 2.3 | 14.0 ± 3.1 | 13.0 ± 2.6 |
| Non-Starters | 15.9 ± 3.4 | 17.0 ± 6.8 | 17.5 ± 4.8 | 14.0 ± 3.4 | 15.5 ± 4.3 | 12.8 ± 4.7 | ||
| ssg+GK* | Starters | 12.9 ± 2.4 | 15.1 ± 4.6 | 14.9 ± 3.7 | 15.1 ± 2.3 | 15.0 ± 2.9 | 14.2 ± 1.8 | |
| Non-Starters | 16.3 ± 2.9 | 12.5 ± 5.3 | 15.1 ± 3.8 | 13.5 ± 2.5 | 15.4 ± 3.2 | 12.4 ± 3.5 | ||
| LSG* | Starters | 17.4 ± 2.1 | 14.7 ± 2.8 | 15.4 ± 2.8 | 14.7 ± 2.6 | 12.7 ± 4.0 | 13.0 ± 3.1 | |
| Non-Starters | 15.9 ± 2.5 | 13.5 ± 3.4 | 13.1 ± 5.1 | 13.3 ± 5.7 | 15.4 ± 2.9 | 13.6 ± 5.1 | ||
| LSG+GK*γ | Starters | 13.7 ± 1.3 | 15.4 ± 2.6 | 16.1 ± 4.5 | 12.4 ± 1.4 | 14.7 ± 4.3 | 13.6 ± 2.8 | |
| Non-Starters | 14.0 ± 3.2 | 15.0 ± 4.8 | 13.1 ± 5.2 | 12.8 ± 2.0 | 15.1 ± 3.8 | 13.5 ± 3.5 |
CW-1: First test of control week (CW); CW-2: Second test of CW; CW-3: Third test of CW; 24H-PM: First test 24h post-match (PM); 72H-PM: Second test 72h PM; 120H-PM: Third test 120h PM. TD: total distance covered; HSR: high-speed running; SR: sprint distance; ACC: accelerations; DEC: decelerations. ssg: 3-a-sided game without GK in a relative player area of 75 m2; ssg+GK: 3-a-sided game with GK in a relative player area of 75 m2 with GK; LSG: 3-a-sided game without GK in a relative player area of 150 m2; LSG+GK: 3-a-sided game with GK in a relative player area of 150 m2. ANOVA: a Pitch Size; b Week; c Session; d GK. ¶ Week × Player Status; # Session × Player Status; φ Session × Pitch Size; Ұ Week × Session; Ү Week × GK; Җ Week × Session × Pitch Size (p < 0.05). Post-hoc: * Week (CW vs PM); $ Pitch Size (Small vs Large); † GK interaction; γ Complex interactions.
Disclaimer/Publisher’s Note: The statements, opinions and data contained in all publications are solely those of the individual author(s) and contributor(s) and not of MDPI and/or the editor(s). MDPI and/or the editor(s) disclaim responsibility for any injury to people or property resulting from any ideas, methods, instructions or products referred to in the content. |
© 2026 by the authors. Licensee MDPI, Basel, Switzerland. This article is an open access article distributed under the terms and conditions of the Creative Commons Attribution (CC BY) license.
Copyright: This open access article is published under a Creative Commons CC BY 4.0 license, which permit the free download, distribution, and reuse, provided that the author and preprint are cited in any reuse.