Preprint
Article

This version is not peer-reviewed.

Degradation Under Natural Solar Light of N-Nitrosodiethanolamine in Water by Ag/TiO2 and Ag/SiO2

Submitted:

14 August 2026

Posted:

17 August 2026

You are already at the latest version

Abstract

On 304 stainless steel substrates, two combined systems based on silver particle semiconductors, Ag/TiO2 and Ag/SiO2, were formed. Such systems were applied in the photocatalytic degradation, profiting from sunlight, of nitrosamines, which are highly toxic substances, specifically N-Nitrosodiethanolamine. The synthesis of TiO2 and SiO2 was carried out by the sol-gel method with co-precipitation of Ag metallic particles, adding a quaternary-ammonium-based ionic liquid as reducing agent. The photocatalysts were characterized by scanning electron microscopy (SEM), energy dispersive spectroscopy (EDS) and x-ray diffraction (XRD), confirming the integration of anatase-phase TiO2 and amorphous-phase SiO2 and the Ag cubic structure. The band gap width was determined by means of the Tauc graphical method, finding 1.7 eV and 1.8 eV for SiO2 and TiO2, severally. The photocatalytic evaluation occurred under direct sunlight irradiation, achieving degradation efficiencies above 98 % during the first 30 min; in addition, organic matter was quantified through the chemical oxygen demand (COD) technique.

Keywords: 
;  ;  

1. Introduction

N-nitrosamines (NAs) form diazonium-type structures, where nitrogen atoms are bound through a sigma bond (O-N-N-R, where R represents the organic part) when nitrites or nitrogen oxides react with secondary amines in acid medium (1–5). In this context, azo dyes (ADs) also contain at least a diazonium or azo group, where the nitrogen atoms are bound to each other with a double bond (-N=N-), frequently attached to aromatic rings with hydroxyl (-OH) and sulfite (-SO3) functional groups, representing 70% of synthetic dyes produced worldwide (6,7). NAs and ADs are highly carcinogenic and mutagenic compounds, where the diazonium ion can form covalent bonds between DNA molecules and cause damage through the metabolic activation of enzymes belonging to the cytochrome P450 family according to the International Agency for Research on Cancer (IARC) and World Health Organization (WHO) (8–12). NAs were detected as byproducts of a disinfection process for treating drinking water; the concern was increased when traces of drugs such as valsartan, nizatidine and metformin, surpassing the maximum allowable limits, were also found (13–19). Even at minimal dosage, the presence of NAs can provoke nausea, vomit, abdominal pain, diarrhea, and skin and eye rash; chronic exposure can affect vital organs such as heart, lungs, kidneys and liver and in pregnant women, the size and weight of the growing fetus are reduced with the concomitant risk of the occurrence of premature birth (20–22).
Diverse treatments of aqueous effluents in the presence of NAs and/or other diazonium-group derivatives have been developed by filtration and/or absorption, specifically with activated carbon, achieving up to 85% of efficiency; however, these methods are limited by the high polarities, solubilities and mobilities of this type of substances in water (23–27). Nanofiltration and reverse osmosis achieve up to 94% separating NAs with the disadvantage of excessive water and energy demand (28). The advanced oxidation processes (AOPs) have become a promising alternative for the degradation of pollutants by generating reactive oxygen species (ROS) (29). Photocatalysis stands out because of its easy operation, low cost, high efficiency and capacity for degrading organic pollutants into relatively not that toxic substances under either ultraviolet (UV) or visible light irradiation (30,31). The efficiency of photocatalysis lies in the properties of the semiconductor materials such as morphology, structure, composition, size and energy bands (32–34). Titanium oxide (TiO2) is a very stable and easy-to-synthesize compound, although with the limitation of being activated with just 5% of natural sunlight; the combination of advantages such as low toxicity and thermal stability, like those displayed by silicon dioxide (SiO2), allow the formation of semiconductor-metal heterojunctions that improve the photocatalytic properties of the materials and boost the response before UV-vis irradiation (35–43). By employing TiO2 in the degradation of NDMA, NDELA and NDEA, controlling pH and temperature during the photocatalytic treatment, significant efficiency rates were achieved (44–46).
On the other hand, silver (Ag) is characterized by its good conductivity, visible light absorption and electron capture efficiency, which are attributed to its surface plasmon resonance, notwithstanding, its application is limited by the high recombination of electron-hole pairs and their low stability, being necessary the implementation of an stabilizing agent participating in the formation of particles (47). Ionic liquids (ILs) are organic salts that are in liquid state at ambient temperature, and due to their unique physicochemical properties, these compounds have become very attractive for diverse scientific and industrial applications such as the synthesis of metallic nanoparticles, playing the role of stabilizing agents (48–51).
In the present work, the synthesis of TiO2 and SiO2 with Ag particles and IL as stabilizing agent was implemented to carry out the photocatalytic degradation of NDELA under sunlight irradiation. In order to detect NAs, visible ultraviolet spectroscopy (UV-vis) was employed, being a reliable quantitative technique for azo groups.

2. Materials and Methods

Tetraethyl orthosilicate (TEOS) and titanium butoxide (TBT), with purity ≤ 97%, were acquired from Sigma Aldrich®. Silver nitrate and ascorbic acid with reagent grade and 99% purity were purchased from Fermont® and nitric and hydrochloric acids were acquired from Meyer®. The solvents ethanol, isopropanol and acetone were purchased from Merk®. The IL trioctylmethyl ammonium dodecanedioate (TAD) was synthesized at the Organic Synthesis Laboratory at CIITEC-IPN (Mexico). 304 stainless steel substrates were previously submitted to a surface preparation process and washing with neutral detergent, acetone, ethanol and isopropanol. A scanning electron microscope (HITACHI TM3030), x-ray diffractometer (SIEMENS D500), reactor (HANNA Instruments HI839800) coupled with a multiparameter photometer (HANNA HI83099) and solar meter (SM206-SOLAR), all belonging to the Instituto Politécnico Nacional, and an x-ray photoelectron spectrometer (K-Alpha de Thermo Scientific) equipped with Al Kα monochromatic source (hν=1486.6 eV) and a UV-vis spectrophotometer (SmartSpec™Plus), property of the Mexican Petroleum Institute, were employed during the experiments.

2.1. Synthesis of Ag Particles Using TAD

Ag particles were synthesized by the coprecipitation method and to this end, a 0.1 M AgNO3 solution in double-distilled water was prepared by adding 3 g of TAD. The mixture was set in ultrasound bath for 20 min; afterward, a previously prepared 1 M solution of ascorbic acid (C6H8O6) was added dropwise. The solution was homogenized by means of a magnetic stirrer for 20 h at 25 °C to be left aging for 24 h. The separation of the dark brown precipitate was performed by solution centrifugation at 4000 rpm for 20 min; the solid was washed with water and ethanol and dried for 12 h at 60 °C in an oven. The obtained samples were calcined for 4 h at 500 °C.
XRD: 38.2° 2θ, 44.4° 2θ, 64.4° 2θ, 77.6° 2θ Ag (ICOD-00-003-0921).
SEM: Dispersion of clusters with particle size variations and spherical particles.
EDS: Ag 84.41%, O 8.43%, C 8.16%.

2.2. Synthesis of the Ag/SiO2 and Ag/TiO2 Systems

The Ag/SiO2 system was synthesized by preparing a 3.5-mL solution of TEOS with 2.5 mL of water and 3.5 mL of ethanol; for the hydrolysis reaction, hydrochloric acid was used as catalyst, employing 0.034 mol per each mol of TEOS. The solution was kept under constant stirring for 3 h at 40 °C. 0. 065 g of Ag were added, and the mixture was set in ultrasound bath for 6 cycles of 180 s. The deposition of thin films on the steel substrates was carried out by the immersion technique; the substrates were dried for 1 h at 80° C after each deposition and this process was carried out 3 times. Afterward, the substrates were dried at 120° C for 72 h, and the thermal treatment was performed in a muffle at 600° C for 4 h. As for the Ag/TiO2 system, an ethanol and TBT solution (20 mL) with a molar ratio of 8:1 was prepared and set under magnetic stirring until forming a milky suspension. A 0.3 M HNO3 solution was added dropwise (from 15 to 20 drops/min) until it turned clear yellow. Afterward, 0.08 g of Ag were added, keeping the solution under stirring for 2 h at 25° C. Thin films were deposited on the steel substrates, calcining at 700° C for 5 h.
XRD: Ag/TiO2: 25.32° 2θ, 36.98° 2θ, 48.07° 2θ, 53.91° 2θ, 62.16° 2θ, 70.34° 2θ, 75.12° 2θ TiO2 (ICDD-01-089-4921) and 38.2° 2θ, 44.4° 2θ, 64.4° 2θ, 77.6° 2θ Ag (ICOD-00-003-0921). Ag/SiO2: 22.53° 2θ SiO2 (ICDD-00-047-0715), 38.2° 2θ, 44.4° 2θ, 64.4° 2θ, 77.6° 2θ Ag (ICOD-00-003-0921) and 29.64° 2θ, 33. 39° 2θ, 33.79° 2θ Ag6Si2O7 (ICDD-00-048-0449).
SEM: Inhomogeneous deposition of the system with film cracking because of the thermal treatment at 700° C.
EDS: Ag/TiO2: Ti 58.21%, O 33%, Fe 6.83% Cr 1.62%, Si 0.26%, Ag 0.07%. Ag/SiO2: O 53.04%, Si 38.79%, Fe 4.82%, Cr 2.73%, Ag 0.62%.
UV-vis: Ag/TiO2: 1.8 eV, Ag/SiO2: 1.7 Ev.
XPS: Ag/TiO2: (Ag 3d5/2) at 368.06 eV and (O1s) at 529.57 eV. Ag/SiO2: (Ag 3d5/2) at 368.24 and 369.26 eV, Si 2p3/2) at 101.68 eV and 103.31 eV.

2.3. Photocatalytic Evaluation

The photocatalytic activity of SiO2 and TiO2 with Ag particles was evaluated in a batch reactor submitted to direct solar irradiation; 304 steel substrates were employed per 80 mL of NDELA at 10 ppm. The solution absorbance was measured through the characteristic peaks at 464 nm for MO and at 234 nm for NDELA and the degradation, efficiency was calculated by means of the equation:
n % = 1 C C O × 100
For the quantification of the organic matter present in the simples after the photocatalytic treatments, the chemical oxygen demand (COD) was implemented.
COD: Ag/SiO2 0.1 mg/L, Ag/TiO2 3 mg/L.

3. Results and Discussion

3.1. Ag Particles with TAD

Silver (Ag) is characterized by its efficiency absorbing electrons in photocatalytic processes and light response capacity. However, the recombination of the electron-hole pairs is still a limiting factor for its photocatalytic applications. An alternative for improving the properties of materials is the formation of a system consisting of various semiconductors in combination with metallic particles uniformly distributed on a substrate. The implementation of Ag particles provokes the adjustment of the band structures of semiconducting materials, which promote the introduction of defects that are also known as energy levels within the band gap that favor the absorption of visible light and prevent charge recombination (52, 53). One of the main challenges in the synthesis of Ag particles is the agglomeration that occurs during the stabilization process; in this context, ILs are an option for supporting such particles without having to use a strong reducing agent during the synthesis and it is here that the IL TAD has turned out to be promising (48). To achieve the photocatalyst efficiency, the Ag particles must have cubic geometry and for this purpose, the XRD analysis was employed to determine their structure and crystalline phases within an interval from 0 to 80 (2θ). The phase corresponding to the crystallographic card (ICOD-00-003-0921) for metallic Ag particles with cubic structure was confirmed, observing the reflection signals located at 2θ values corresponding to 38.2°, 44.4°, 64.4° and 77.6° (Figure 1).
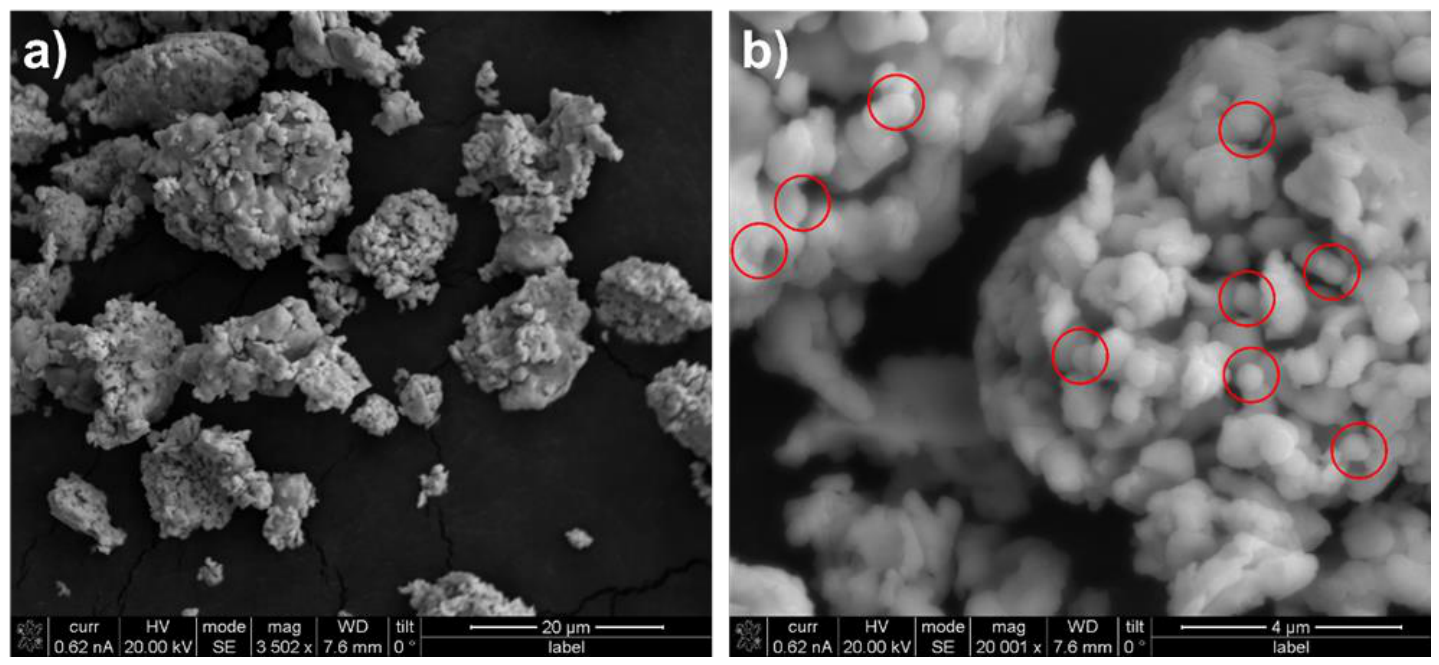
By means of SEM, the morphological and structural characterization of the Ag particles was carried out. Figure 2 displays micrographs at 3500x and 20 000x of the Ag particles. In Figure 2a, corresponding to 3500x, the dispersion of clusters with particle size variations is shown, which could have been due to the addition of TAD; at 20 000x, spherical particles were confirmed, which is the characteristic morphology of Ag nanoparticles (Figure 2b).
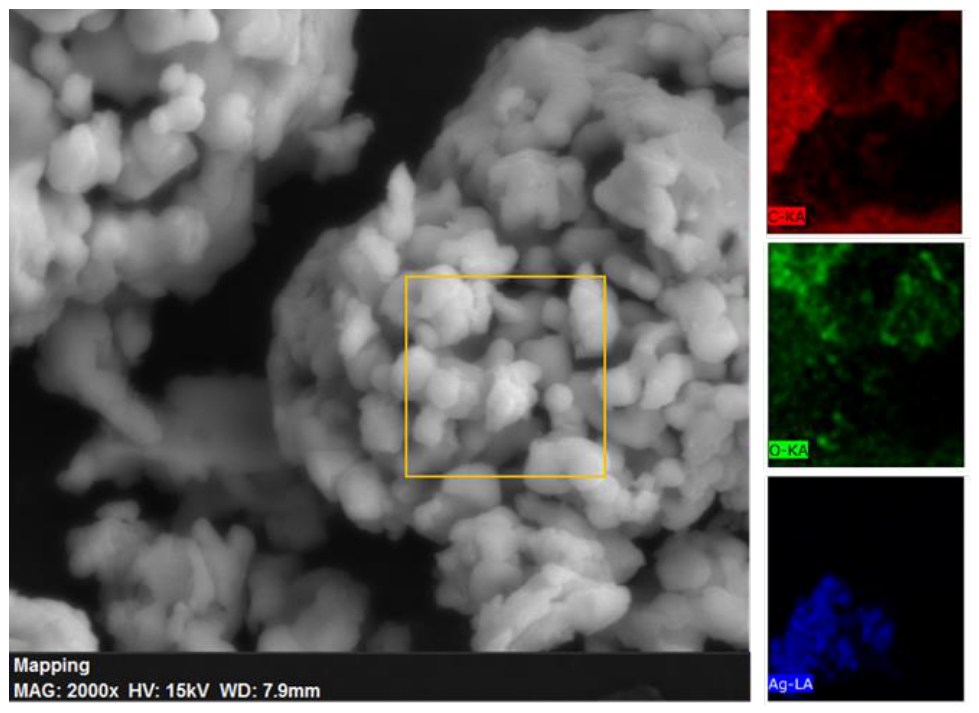
By means of EDS, the elemental composition of the synthesis of Ag particles was confirmed. Figure 3 displays the mapping of elements, where the presence of Ag stands out; oxygen and carbon were also confirmed. Table 1 shows the following element percentages: 84.41% Ag and 8.43% and 8.16% for O and C, severally. The presence of carbon can be attributed to residues from the organic part during the reduction process.

3.2. Ag/SiO2 and Ag/TiO2 Systems

Since metallic oxides are stable and easy to synthesize, the semiconductors TiO2 and SiO2 have been commonly employed in photocatalytic processes (35). TiO2 is one of the most studied photocatalysts because of its low cost, photocorrosion resistance and no toxicity, notwithstanding, its application is limited due to its light absorption capacity because this material can only be activated with UV light, which represents 5% of natural solar light; for this reason, it is tried to design photocatalysts with visible light response so that solar energy is profited (36–40). SiO2 is a semiconductor that stands out because of its low toxicity and thermal stability; it has been employed as catalytic support to disperse efficiently other metal oxides (41–43). The implementation of systems consisting of semiconductors and/or metals allows the formation of semiconductor-semiconductor or semiconductor-metal heterojunctions, which improve the photocatalytic properties of materials. Ag particles display photocatalyst features, however, they have to be separated after the photodegradation process, which can lead to additional pollution as well as to loss of semiconductor material. To avoid the loss of photocatalyst, it is better to deposit the material on steel substrates (54, 55). In the present research work, the semiconductors TiO2 and SiO2 were deposited on 304 stainless steel substrates by means of the immersion technique; the process was carried out thrice, achieving good adherence.
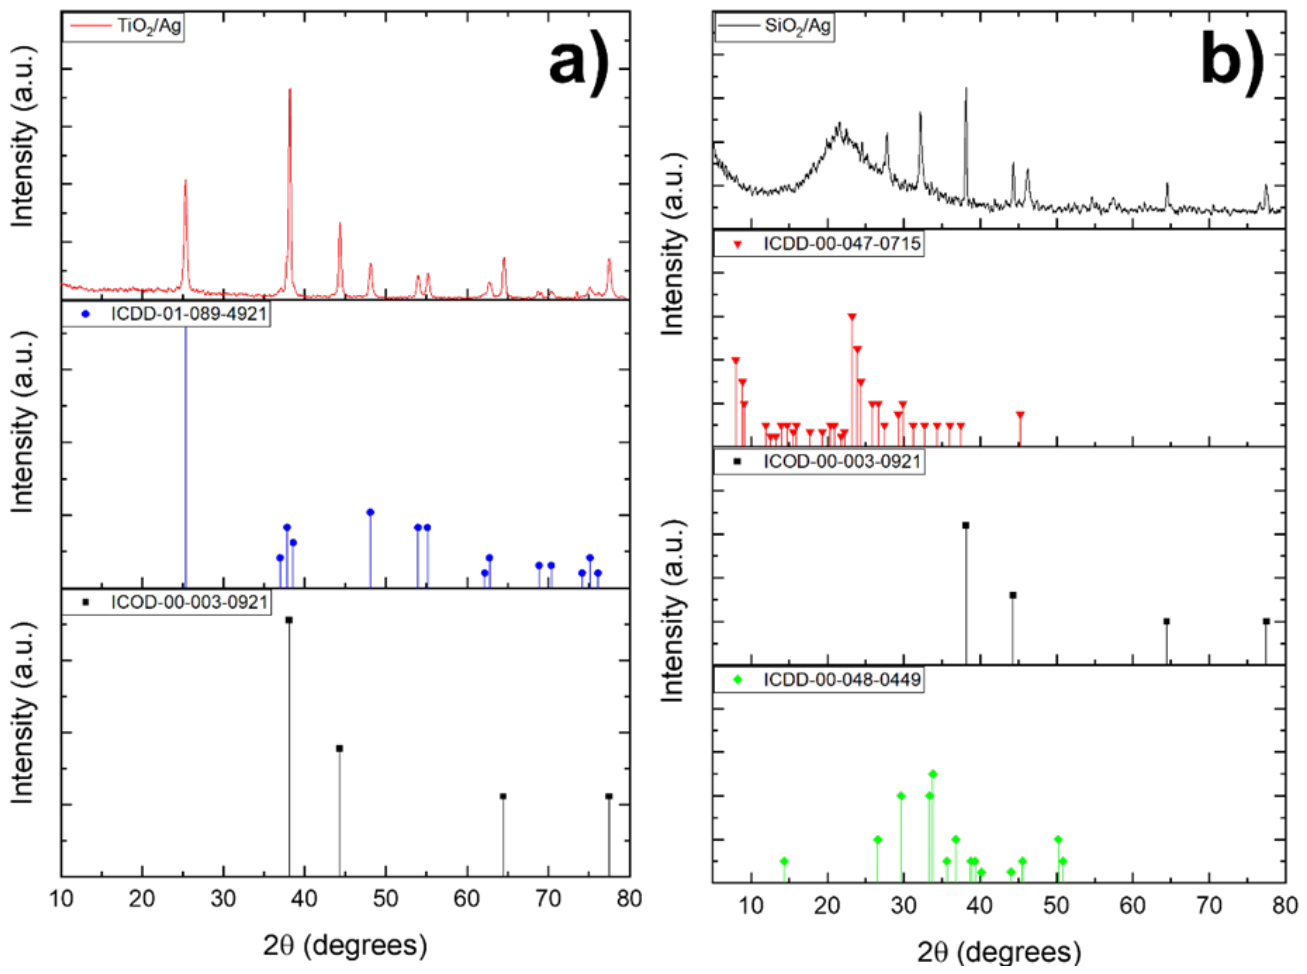
The XRD analysis was performed between the 2θ angles 10° and 80° to characterize the crystalline phases of the materials (Figure 4). Figure 4a displays the diffractogram of the Ag/TiO2 system, where the phase belongs to the crystallographic card (ICDD-01-089-4921) with reflections at 25.32°, 36.98°, 48.07°, 53.91°, 62.16°, 70.34° and 75.12° that correspond to TiO2 anatase phase with tetragonal structure. On the other hand, the reflections at 38.2°, 44.4°, 64.4° and 77.6°correspond to the crystallographic card (ICOD-00-003-0921) for metallic Ag with cubic structure. The presence of the TiO2 anatase phase is advantageous because it features improved photocatalytic properties with respect to the rutile phase. Likewise, the concentration of oxygen vacancies in TiO2 in its anatase phase promotes the charge separation in contrast with the rutile phase. Furthermore, its higher surface area favors the formation of active centers (56). In the spectrum of the Ag/SiO2 system (Figure 4b), the reflection at 22.53° stems from the amorphous structure of SiO2 particles; the highest reflections (38.2°, 44.4°, 64.4° and 77.6°) correspond to metallic Ag; also, the presence of new signals at 29.64°, 33. 39° and 33.79° were observed, corresponding to the crystallographic card (ICDD-00-048-0449) of Ag silicate (Ag6Si2O7). In 2018, Chen et al. synthesized Ag6Si2O7 particles supported on iron oxide (Fe3O4) to degrade methylene blue; by XRD, the monoclinic phase with 2θ characteristic reflections at approximately 34° was identified (57). Ag6Si2O7 presents a narrow band gap of 1.25 eV and its absorption capacity in the visible region sets it as a promising photocatalyst, however, its high charge recombination limits its application (58).
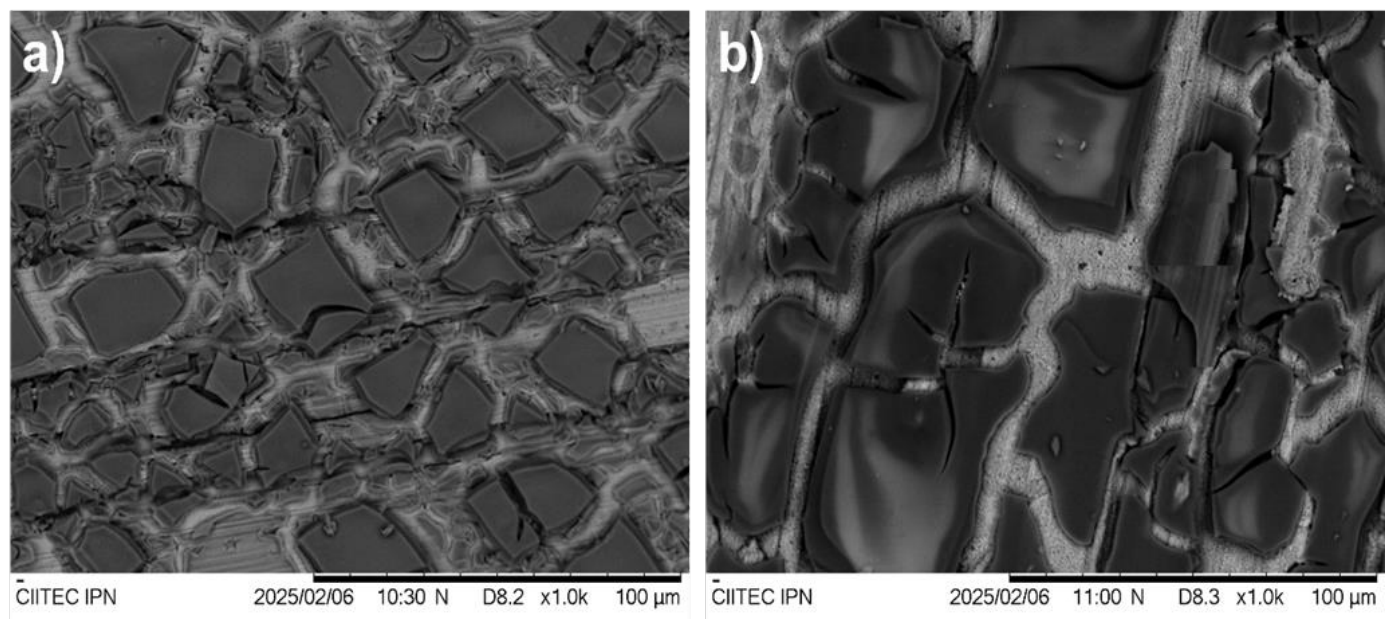
The systems were characterized by the SEM technique to know the morphology of the films and confirm the deposition of the Ag/TiO2 system (Figure 5). The findings presented at 1000x (Figure 5a) evidenced the inhomogeneous deposition of the system where the film cracking could have occurred due to tension generated by drying at 700° C. The evaporation of solvent generates the accumulation of capillary forces between the liquid-air contact zones; these forces can surpass the intermolecular bonds, provoking the fracturing of the continuous gel network and the formation of cracks during the drying process, leaving separated or isolated clusters (59). Figure 5b shows the micrograph of the Ag/SiO2 system, where clusters with irregular edges and voids in some zones can be observed, which were formed during the cooling stage and release of internal tension (60).
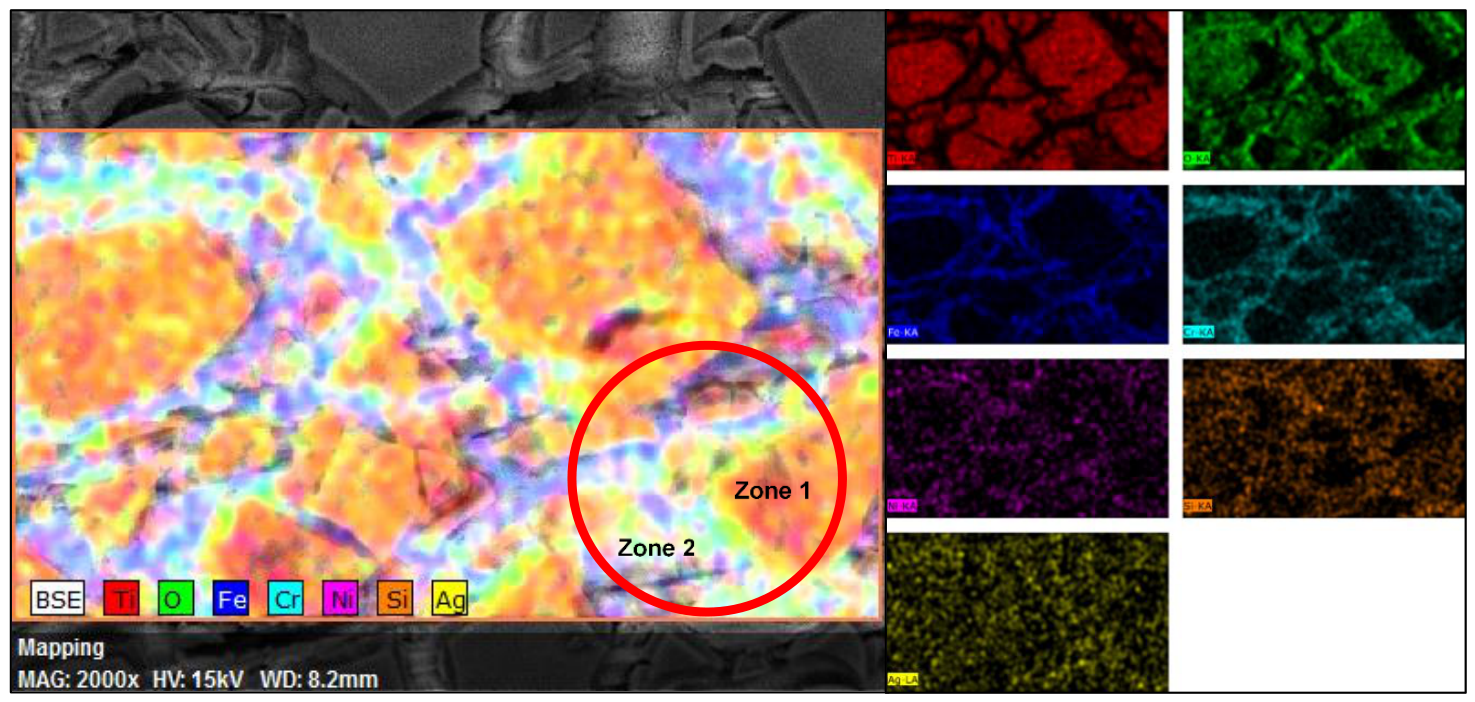
By EDS, the elemental composition of the systems deposited on the steel substrates was corroborated. The mapping of the Ag/TiO2 system (Figure 6) evidenced the presence of Ti and Ag at 58.21% and 0.07%, respectively, which confirmed its deposition in Zone 1. The amount of Ag is minimal because it is not possible to visualize clearly Ag particles with retro-dispersed electrons (61).
Table 2 shows the oxygen percentage of 33.00% that is attributed to the present oxides and Cr, Fe, Ni, and Si belong to the composition of the 304 stainless steel substrates. In Zone 2, Fe prevails with 36.81% and Ti is still observed at 24.50%, where its diminution could be attributed to the fact that the film in this zone is thinner.
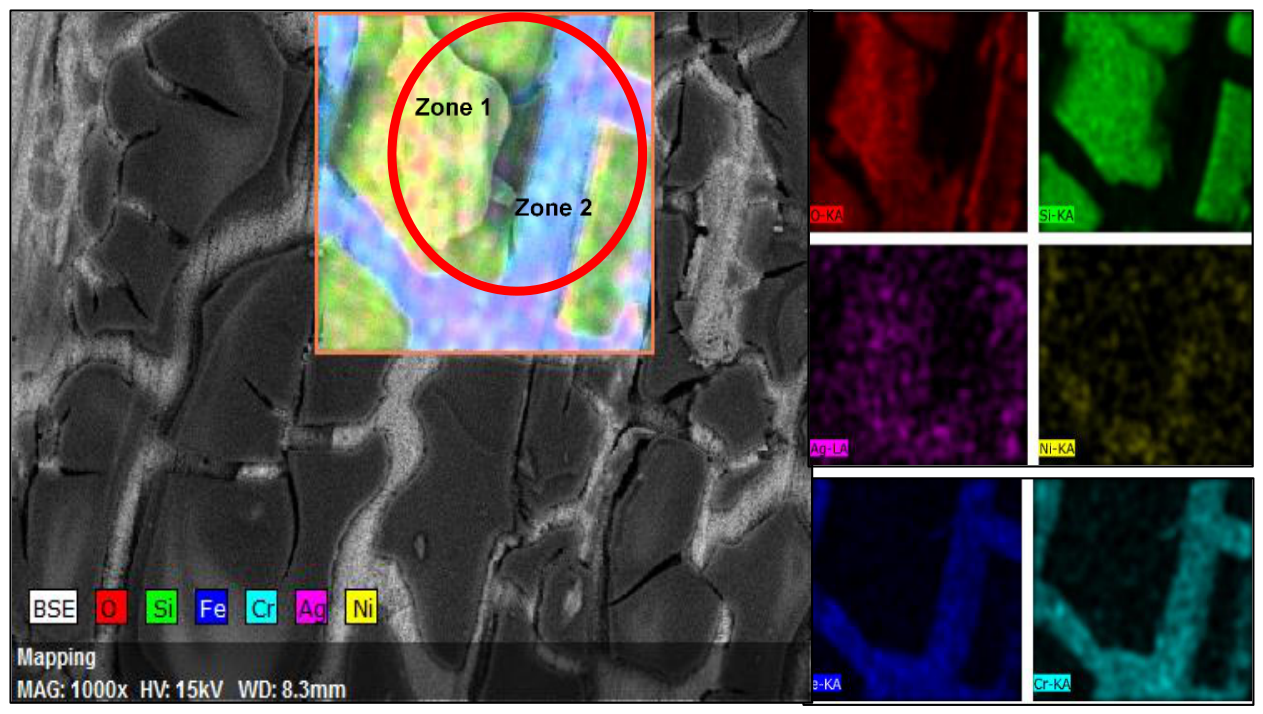
According to the mapping of the Ag/SiO2 system (Figure 7), in Zone 1, the highest proportions of Si and O are found, which can be attributed to the formation of oxides and whose percentages are displayed in Table 3 and correspond to 53.04% and 38.79%, severally. In Zone 2, the presence of Si diminished to 17.69% with a slight Ag increment. The Ag particles appear at lower proportion in Zone 1 due to the Si overlapping, which made the accurate detection of this element difficult in the analyzed area.
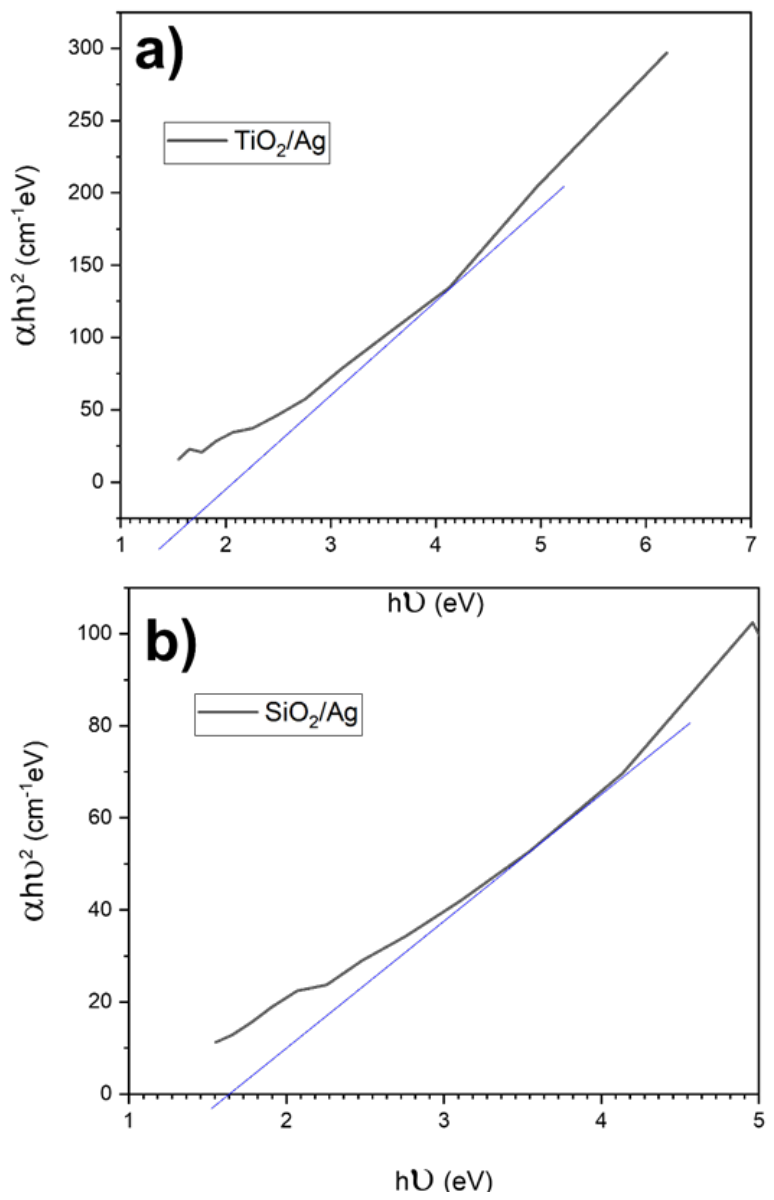
UV-vis spectroscopy was employed to evaluate the optical characteristics of the formed systems and calculate the band gap energy by means of the graphical Tauc method, which is based on the ratio between the material absorbance and energy of an incident photon in semiconducting materials. As observed in Figure 8, the TiO2 and SiO2 systems with Ag particles displayed a remarkable displacement to the visible region; notwithstanding, this fact does not imply a structural modification of the band gap characteristic of the material, but the formation of additional energy states because of the addition of Ag. The addition of metallic particles generates impurity levels in the conduction and valence bands, apparently reducing the band gap and increasing its absorption capacity in the visible region (62–64).
The apparent energy of the band gap width for the Ag/TiO2 system is equal to 1.8 eV (Figure 8a) and the wavelength required by the material to be excited and carry out the photocatalytic mechanism is 690 nm, which was calculated by using the ratio between the energy and wavelength of light. As for the Ag/SiO2 system, the band gap energy is 1.7 eV (Figure 8b) and the wavelength corresponds to 730 nm, which is in the limit of the visible spectrum. The additional absorption in the visible region was attributed to the plasmon absorption of Ag (65). Likewise, the apparent reduction of the band gap width means higher visible light absorption and enhanced photocatalytic efficiency (59).
By means of the XPS analysis, it was possible to establish the surface chemical composition and oxidation states present in the thin film deposited on the steel substrate. The spectra were acquired under ultrahigh vacuum conditions with base pressure in the order of 10-9 mbar. The calibration of the binding energy was done by taking the C 1s peak at 284.8 eV as reference. The processing of data included the subtraction of the Shirley-type background and fitting of peaks through mixed Gauss-Lorentz functions. From these analyses, the oxidation states of Ag, Ti and Si were determined by considering the binding energy positions and possible chemical contributions associated with each element.
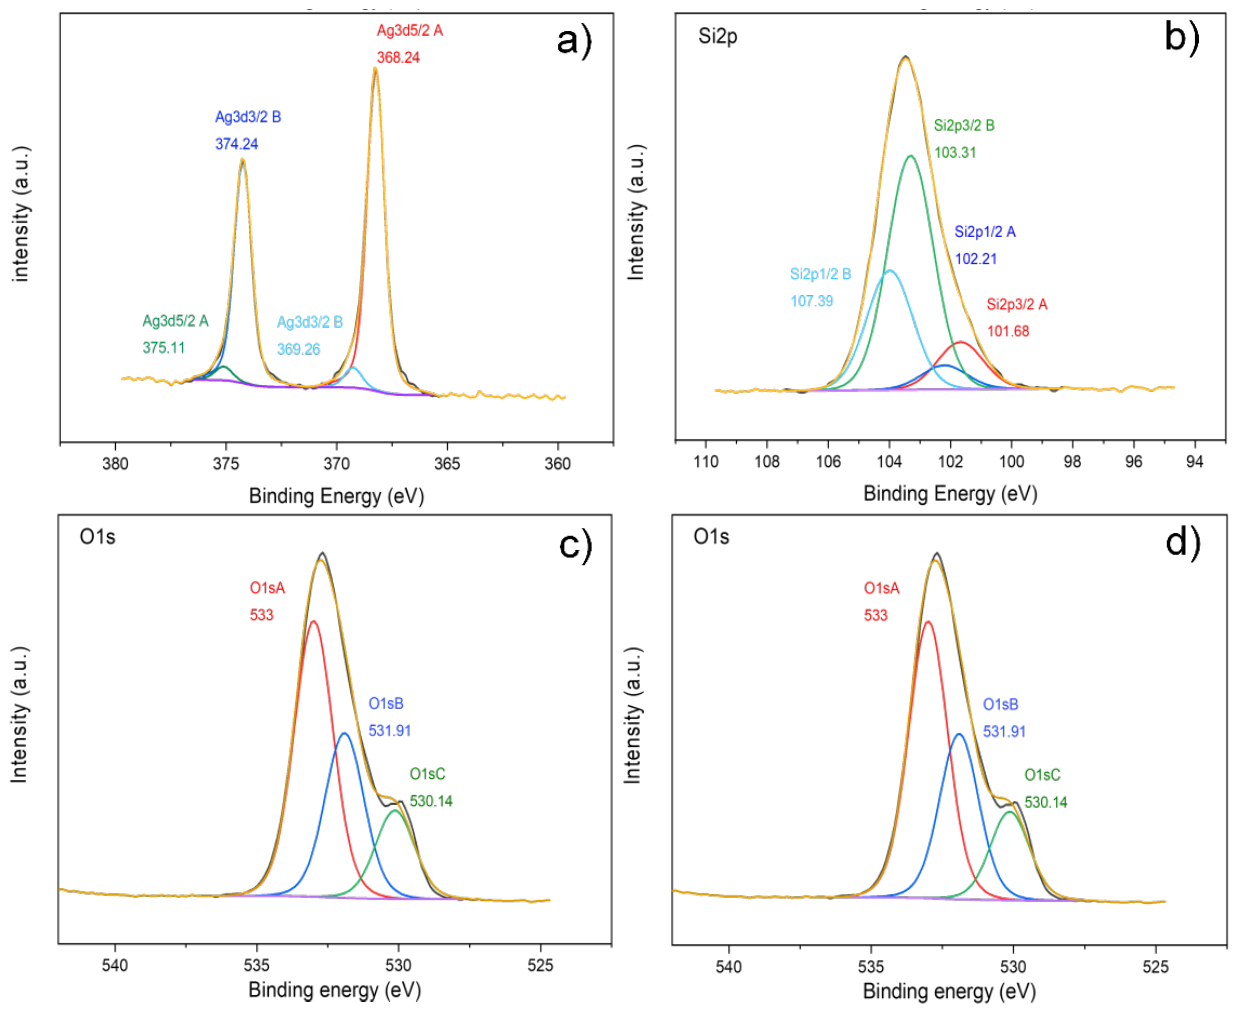
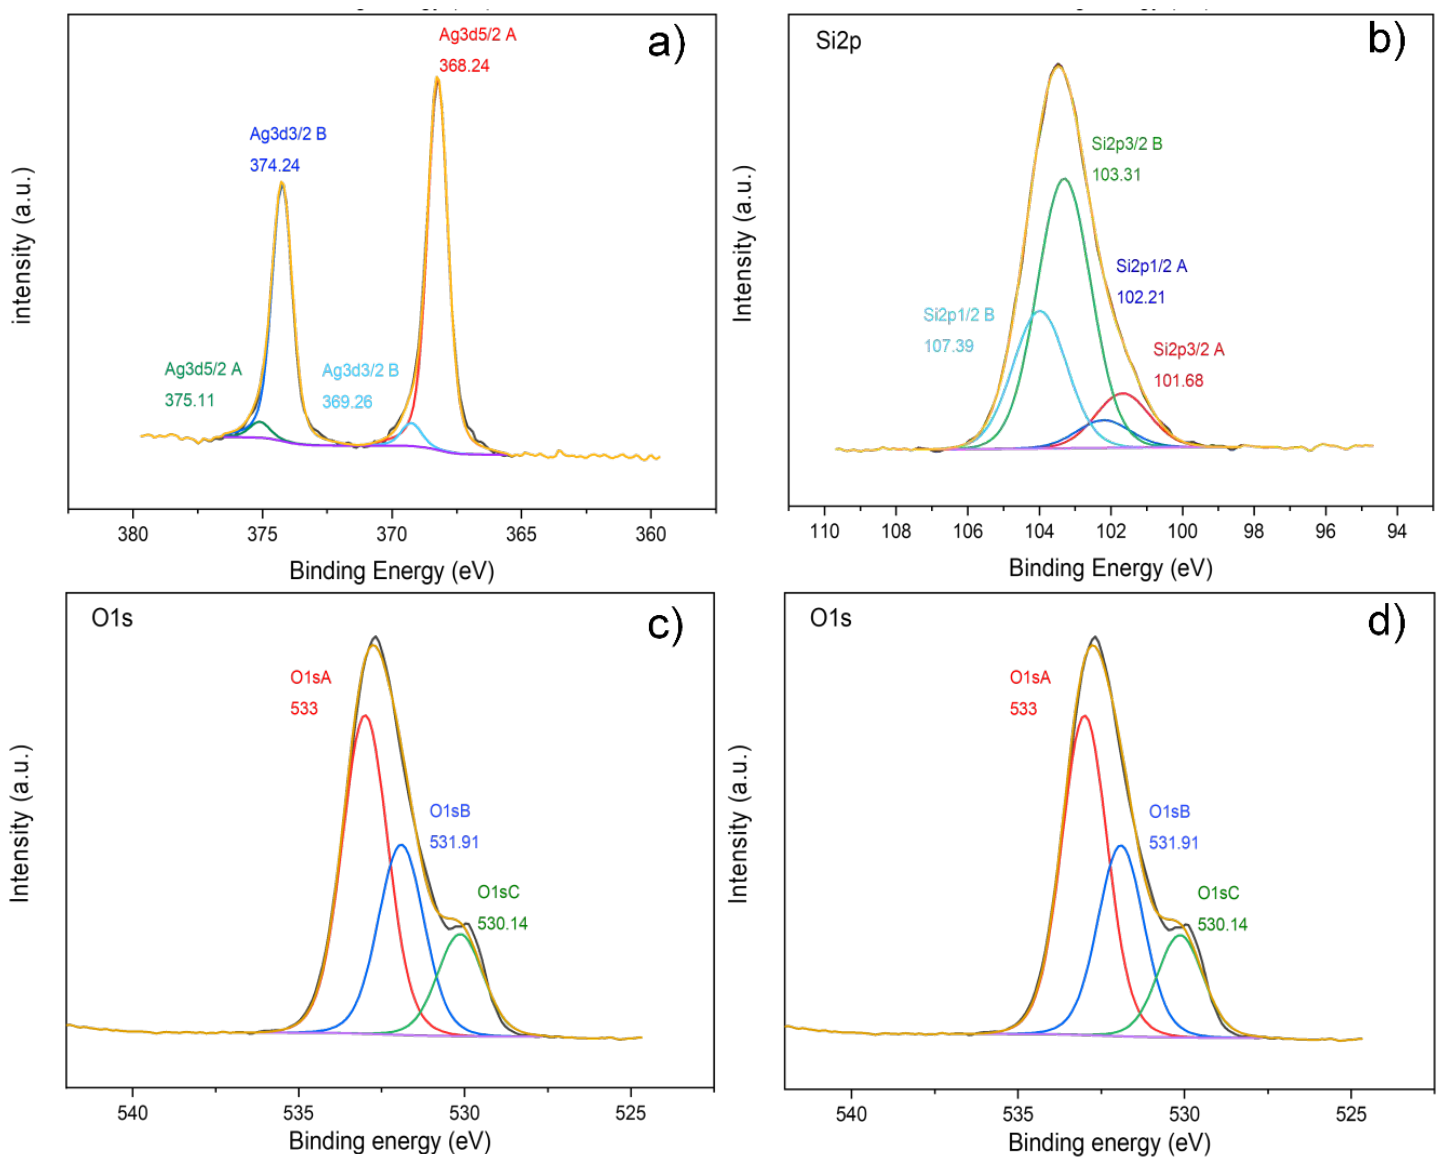
In the region corresponding to Ag (Ag 3d5/2) (Figure 9a), two main contributions were identified: the first one, located at a binding energy value of 368.24 eV, corresponded to silver in metallic state (Ag0) with atomic contribution of 0.75%; the second one, at 369.26 eV, was attributed to Ag oxidized (Ag+) species with presence below 0.05%. These results indicate that Ag is found, mainly, in metallic state with minimal surface oxidation. In the silicon region (Si 2p3/2), two chemical states were observed: the peak at 101.68 eV was assigned to silicon suboxides (SiO) at 4.49%, whereas the peak at 103.31 eV corresponded to SiO2, being the prevailing species at 22.28% and suggesting that significant silicon oxidation on the film surface occurred (Figure 9b). Figure 9c corresponds to the oxygen (O 1s) analysis, where the presence of multiple chemical surroundings is revealed: a main peak at 533.00 eV (32.20%) was attributed to carboxyl-type (O–C=O) groups, followed by a contribution at 531.91 eV (19.25%) ascribed to C–O bonds and a peak at 530.14 eV (10.30%) corresponding to oxygen in SiO2. The high proportion of oxygenated species suggests both the formation of silicon oxides and the possible adsorption of organic contaminants. In the carbon (C 1s) region, three contributions were detected: C–C (284.80 eV, 9.07%), C–O (286.64 eV, 1.19%) and O–C=O (288.72 eV, 0.43%), which are typically associated with adventitious contamination from the environment and that can be observed in Figure 9d. In general, the results indicate that the surface of the Ag–Si film consists mainly of silicon oxides and oxygenated species, whereas Ag remains predominantly metallic. The significant presence of SiO2 and oxygenated groups is especially relevant because it can exert an effect on further photooxidation mechanisms, modifying the interaction with radiation and generation of reactive species.
The XPS analysis of the Ag/TiO2 system (Figure 10a) evidenced that oxygen was mainly part of TiO2 (O1s A, 529.57 eV – 43.59%), indicating that the surface had an active photocatalyst to carry out photooxidation. The presence of Ti (Ti 2p3/2 A, 458.44 eV – 19.51%) confirmed the existence of TiO2 as main active component. Metallic Ag was detected at low amount (Ag3d5/2 A, 368.06 eV – 0.05%), suggesting that it can work as an electronic transfer center, although its contribution is limited due to its low concentration (Figure 10b). Adventitious carbon prevailed in the form of C–C (C1s A, 284.80 eV – 19.55%), whereas C–O (C1s B, 286.12 eV – 2.03%) and O–C=O (C1s C, 288.36 eV – 2.09% or 2.13%) represented small fractions or organic contaminants that could affect slightly the adsorption of molecules on the surface. In general, the Ag/TiO2 system presents a TiO2 dominated surface with significant photoactive potential, whereas the lower presence of Ag0 and carbon contaminants can modulate the photooxidation efficiency. The XPS analysis of the Ag/SiO2 system revealed the predominant metallic state of Ag (Ag 3d5/2 A, 368.24 eV – 0.75%) with a minimal contribution of oxidized species (Ag 3d5/2 B, 369.26 eV – 0.05%). Silicon was mainly present as suboxide (Si 2p3/2 A, 101.68 eV – 4.49%), whereas oxygen occurred mostly in O–C=O (O1s A, 533.00 eV – 32.20%) and C–O (O1s B, 531.91 eV – 19.25%) groups, indicating adventitious contamination that can affect the adsorption of molecules on the surface. Carbon was detected as C–C (C1s A, 284.80 eV – 9.07%), C–O (C1s B, 286.64 eV – 1.19%) and O–C=O (C1s C, 288.72 eV – 0.43%). The Ag/Si surface combines metallic Ag with a partially oxidized silicon film, which is relevant for electron transfer processes that take place during photooxidation.
The analyzed surfaces presented different characteristics: Ag/SiO2 combined Ag metallic sites with partially oxidized silicon, whereas in Ag/TiO2, TiO2 prevailed with lower amounts of metallic silver and adventitious carbon. The photooxidation potential for both systems was confirmed, where Ag/TiO2 was particularly relevant because of the presence of TiO2 as active photocatalyst, while the contaminants and low amount of Ag0 could modulate slightly the process efficiency.

3.3. Photocatalytic Evaluation

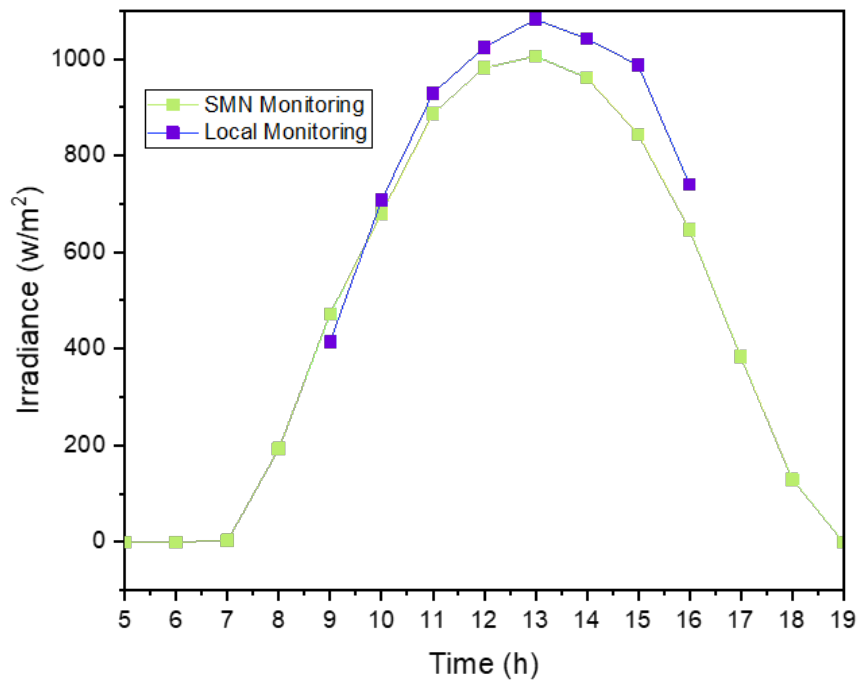
The evaluation of the photocatalytic degradation was carried out under natural sunlight irradiation; to this end, the local solar irradiation was monitored by implementing a SM206-SOLAR solar meter. The obtained data were compared with information supplied by the ‘Servicio Meteorológico Nacional (SMN)’ (National Weather Service). Furthermore, weather variables such as temperature, UV index, humidity, wind and pressure were considered to keep control of degradation parameters. The photocatalytic evaluation tests employing NDELA were performed when the sun was at its highest point, which was between 12:00 h and 14:00 h (Figure 11).
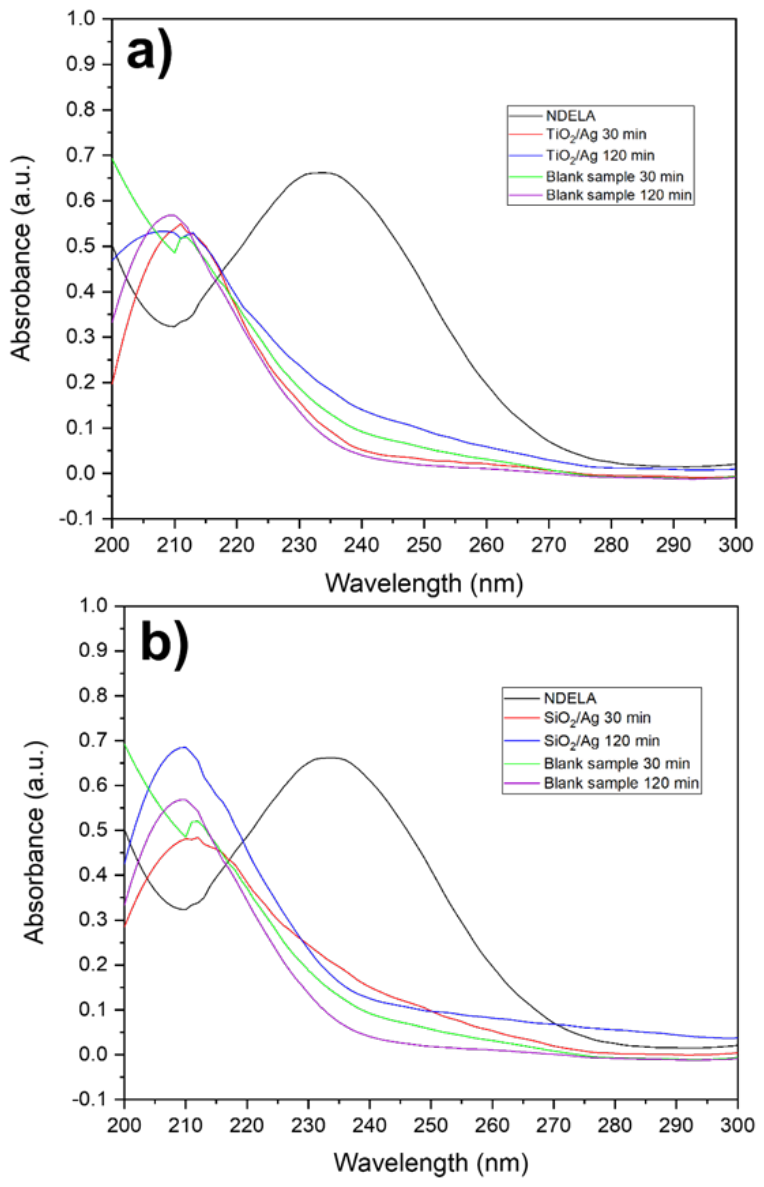
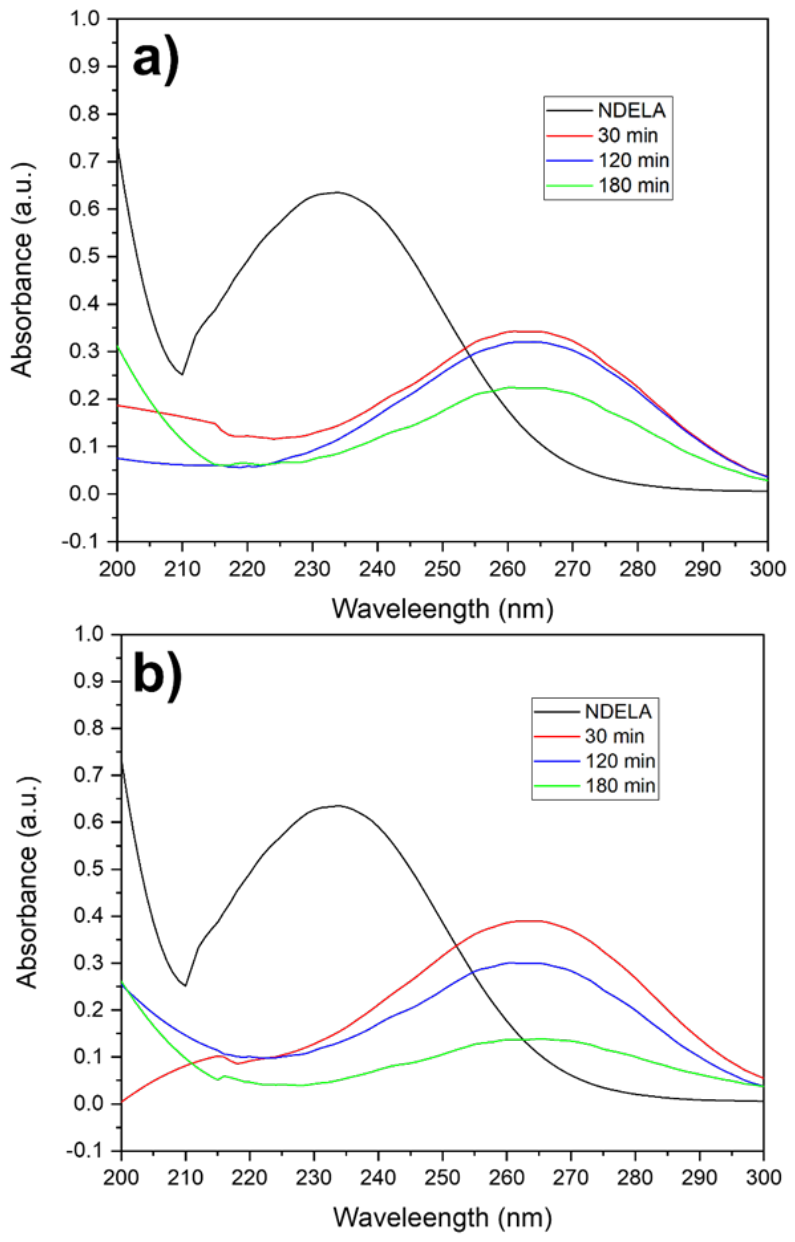
Figure 12a and Figure 12b display the UV-vis absorption spectra of a NDELA solution at 10 ppm, where a remarkable absorption peak in the UV region can be observed. The maximal intensity occurred at the wavelength value of 234 nm; absorption in this region is related to π →π* intermolecular charge transfer, which is responsible for the braking of the N-N bond in nitrosamine molecules (66). The absorption spectra (Figure 12a) revealed changes in the degradation process of NDELA; the solution was evaluated in the absence of photocatalyst at 30 and 120 min with the purpose of assessing the effect of solar irradiation on degradation and establishing a reference value for comparing the photocatalytic treatments employing the systems. With the Ag/TiO2 system, substantial changes did not occur during the first 30 min in comparison with the photolytic treatment. Changes in the spectral band achieved 85% of degradation efficiency at 120 min. It has been reported that even at low Ag concentrations, the photocatalytic efficiency is increased, where the distribution and size of the metallic particle could be less relevant factors than the amount of Ag particles (67).
In the present research work, the distribution of Ag in the particles played a major role, where by blocking the TiO2 active reaction area, the incident light was dispersed or absorbed by Ag. The Ag/SiO2 system (Figure 12b) underwent significant band change during the first 30 min of photocatalytic treatment, accomplishing 75% of efficiency; the same trend was kept at 120 min, although with absorbance increment. The band displacement for the photolysis test and reduction of the characteristic peak happened at the same time; however, such reduction was more clearly evidenced by the Ag/SiO2 system.
The decomposition of NDELA by solar irradiation photolysis occurred more slowly, then, the implementation of the systems with photocatalytic treatment enhanced the degradation of NDELA in comparison with direct photodegradation. There are previous research works about photolytic degradation by UV irradiation under specific pH and temperature conditions (66,68,69). Sørensen et al., in 2015, stated that the degradation of NDELA requires UV light and pH 7 at 50° C, however, these conditions are not similar to those found in the environment and laboratory (44). The absorption spectra of the samples during the photocatalytic treatment with the powder systems are displayed in Figure 13, where the results are similar to those obtained with films. Figure 13a corresponds to Ag/TiO2, where a different behavior pattern in the spectral bands can be observed along with significant absorbance increase at 210 nm after 120 min of treatment; the degradation percentage was 73%, which was attributed to the fact that the TiO2 particles agglomerated, thus affecting light absorption, which provoked surface area loss (70). As for the Ag/SiO2 system (Figure 13b), 80% of degradation efficiency was determined by UV-vis with significant changes occurring during the first 30 min. The displacement of the band at 200-220 nm for the tests with powders and films could be attributed to the formation of degradation products such as HNO3, NO2 and NH3, which are characterized by their absorption capacity within this interval and because of the lack of chromophores, absorption did not occur in the visible region.
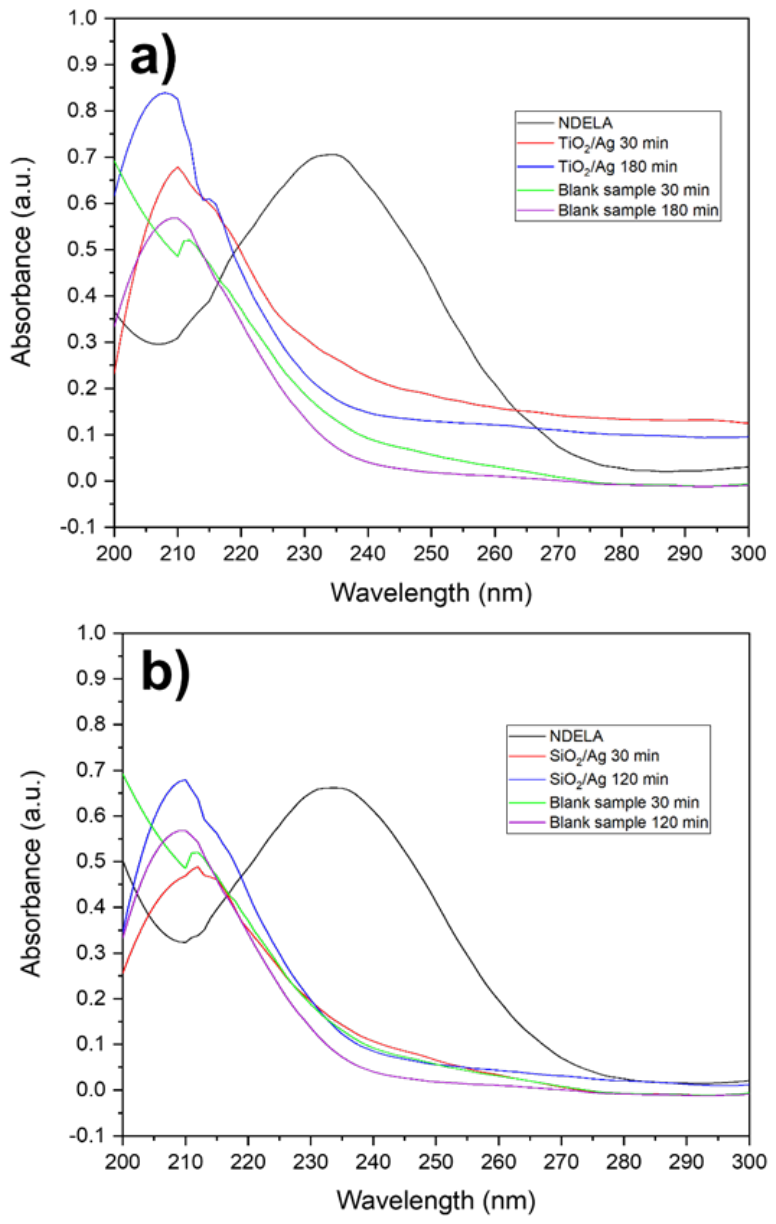
Stirring during the photocatalytic tests reduced absorbance at 234 nm during the first 30 min and a slight band displacement from 234 nm to 265 nm, which confirmed the absence of NDELA and the formation of amines (Figure 14). This change could be attributed to an increase in the reaction rate, and the homogeneous distribution promoted the interaction between the generated hydroxyl radicals and NDELA molecules to be more efficient, thus enhancing the contact rate, which prompted the breaking of chemical bonds and formation of intermediate compounds like ethanolamine. Guo et al., in 2015, and Liu, in 2022, achieved similar degradation efficiencies employing TiO2 in 240 min (45,46). Notwithstanding, the tested nitrosamines were NDMA and NDEA and pH was controlled during the photocatalytic treatment (45,46). In the case of this work, the degradation efficiency for the stirring systems was 99% for TiO2 (Figure 14a) and 98% for SiO2 (Figure 14b) in 180 min.
In practical applications with sunlight, the implementation of TiO2 is limited by its absorption capacity in the UV region; furthermore, the high recombination of the electron-hole pairs affects its photocatalytic efficiency. The efficiency of this system is related to the addition of Ag, which improved the performance of TiO2 by displaying enhanced optical absorption in the visible range, which was attributed to its surface plasmon resonance. Ag caught surface charge, thus activating reaction sites in the TiO2 network and reducing charge recombination (54).
COD was used to quantify the organic matter in the samples after the photocatalytic treatments. This technique is widely employed in the monitoring of residual and natural water by assessing indirectly the contamination level and efficiency of the treatment processes. The NDELA degradation tests showed significant variations in the COD values. Table 4 features such values for the two systems after 120 min of photocatalytic treatment. The initial solution corresponds to 19 mg/L and by the end of the photolysis test; the final concentration was 6%, which represented 58% of degradation efficiency. The Ag/SiO2 system achieved better results with 99% degradation efficiency during the first 30 min, where the concentration diminution to 0.1 mg/L for this time confirmed that degradation proceeded in 30 min. The value obtained for the Ag/TiO2 system was 84% with a final concentration of 3 mg/L in 120 min. The final concentrations could be ascribed to possible degradation products, where NO2 and HNO3 did not contribute significantly to high COD values.
The concentration of organic matter susceptible of chemical oxidation after treatment corresponded to 10 mg/L for the Ag/TiO2 and Ag/SiO2 film systems and according to the parameters and information established for water quality by Comisión Nacional del Agua (CONAGUA), the systems fall within the ‘excellent’ classification (≤ 10). Previously, it has been reported that the degradation of nitrosamines occurs naturally, however, materials capable of degrading these contaminant molecules faster are being looked for to prevent carcinogenic compounds from being released during their degradation; in this context, Ag/SiO2 achieved 99% degradation during the first 30 min of photocatalytic treatment.

4. Conclusions

In the research work here reported, two photocatalytic systems capable of profiting from the solar spectrum were developed from the TiO2 and SiO2 semiconductors with metallic Ag particles; the Ag/TiO2 and Ag/SiO2 systems were deposited on 304 stainless steel substrates, characterizing their structure and morphology. TiO2 particles were synthesized in the anatase phase with tetragonal structure and SiO2 particles with amorphous structure; systems with metallic Ag particles with cubic structure were designed. UV-vis spectroscopy revealed that the incorporation of Ag particles provokes the shortening of the band gap width to 1.7 eV for the Ag/SiO2 system and to 1.8 eV for the Ag/TiO2 system; such result was attributed to the formation of additional energy states because of the effect exerted by the addition of Ag. The XPS analysis helped establish the surface chemical composition and oxidation states present in the thin film deposited on the steel substrate. The analyzed surfaces displayed different characteristics: Ag/SiO2 combined metallic silver sites with partially oxidized silicon, whereas in Ag/TiO2, TiO2 prevailed with lower amounts of metallic silver and adventitious carbon. Both systems proved to have photo-oxidation potential and the photocatalytic treatments delivered similar results for both systems with NDELA degradation efficiencies of 99% and 84% for Ag/SiO2 and Ag/TiO2, severally.

Author Contributions

“Conceptualization, I.V. L. and N.V. L.; methodology, A.H.-R and M.J.N.-A.; software, A.H.-R.; validation, I.V. L. and N.V. L.; formal analysis, E.C.-M.; investigation, M.J.N.-A.; resources, O.O.-X..; data curation, A.H.-R.; writing—original draft preparation, M.J.N.-A.; writing—review and editing, I.V. L.; visualization, N.V. L.; supervision, O.O.-X..; project administration, I.V. L.; funding acquisition, I.V. L. All authors have read and agreed to the published version of the manuscript.

Funding

“This research received no external funding”.

Data Availability Statement

It is mandatory for the authors to include a “Data Availability Statement (DAS)” section in their manuscripts, except for the following article types: Book Review, Editorial, Obituary, Correction, Retraction, Expression of Concern. In this section, authors are required to provide details regarding where data supporting their reported results can be found, including links to publicly archived datasets analyzed or generated during the study. Where no new data were created or where data is unavailable due to privacy, legal, or ethical restrictions, a statement is still required. Suggested Data Availability Statements are available in section “MDPI Research Data Policies” at https://www.mdpi.com/ethics.

Conflicts of Interest

“The authors declare no conflicts of interest.”.

Acknowledgments

The authors have reviewed and edited the output and take full responsibility for the content of this publication.

References

  1. Wang W., Song Z., Jing Y., Wei X., Li H., Xie J., et al. Formation of advanced glycation end-products and N-nitrosamines in salami of different recipes and fermented at different stages. Food Chem. 05.2025; 474:143228. [CrossRef]
  2. Kruhlak N.L., Schmidt M., Froetschl R., Graber S., Haas B., Horne I., et al. Determining recommended acceptable intake limits for N-nitrosamine impurities in pharmaceuticals: Development and application of the Carcinogenic Potency Categorization Approach (CPCA). Regul Toxicol Pharmacol. 06.2024; 150:105640. [CrossRef]
  3. Vikram H.P.R., Kumar T.P., Kumar G., Beeraka N.M.., Deka R, Suhail S.M., et al. Nitrosamines crisis in pharmaceuticals − Insights on toxicological implications, root causes and risk assessment: A systematic review. J Pharm Anal. 05.2024; 14(5):100919. [CrossRef]
  4. Horne S., Vera M.D., Nagavelli L.R., Sayeed V.A., Heckman L., Johnson D., et al. Regulatory Experiences with Root Causes and Risk Factors for Nitrosamine Impurities in Pharmaceuticals. J Pharm Sci. 1 05.2023; 112(5):1166-82. [CrossRef]
  5. Daripelli S., Jadhav N.A., Sarkar A., Yadav V., Bhanti M., Jaywant M.. Highly sensitive and robust LC-MS/MS method for determination of up to 15 small molecule nitrosamine impurities in pharmaceutical drug substances. J Pharm Sci. 11.2024; S0022354924005100. [CrossRef]
  6. Kamenická B. Chemical degradation of azo dyes using different reducing agents: A review. J Water Process Eng. 05. 2024; 61:105350. [CrossRef]
  7. Dey P.Ch., Das R. Enhanced photocatalytic degradation of methyl orange dye on interaction with synthesized ligand free CdS nanocrystals under visible light illumination. Spectrochim Acta A Mol Biomol Spectrosc. 04.2020;231:118122. [CrossRef]
  8. Chen Y., Wang X., Liu B., Zhang Y., Zhao Y., Wang S. Directional regulation of reactive oxygen species in titanium dioxide boosting the photocatalytic degradation performance of azo dyes. J Colloid Interface Sci. 11.2024; 673:275-83. [CrossRef]
  9. Gao M., Liao X., Chen S., Li X.., Zhang Y, Chen C., et al. Unveiling distinct influencing mechanisms of Br- on NDMA formation during ozonation of actual water Matrixes: Identification of precursors and brominated substance. Chem Eng J. 06.2024; 490:151760. [CrossRef]
  10. Öncü T., Yüksel B., Binay E., Şen N. LC-MS/MS Investigation of nitrosamine impurities in certain Sartan group medicinal products available in Istanbul, Türkiye. Ann Pharm Fr. 01.01.2024; 82(1):72-83. [CrossRef]
  11. Golob N., Peterlin S., Grahek R., Roškar R. NDMA Formation Due to Active Ingredient Degradation and Nitrite Traces in Drug Product. J Pharm Sci. 05.2023; 112(5):1277-86. [CrossRef]
  12. Seo J.E., He X., Bryant M., Atrakchi A.H., McGovern T.J., Davis Bruno K.L., et al. Comparative DNA damage induced by eight nitrosamines in primary human and macaque hepatocytes. Chem Biol Interact. 08.2025; 416:111538. [CrossRef]
  13. Zhao J., Qi B., Zhang P., Jia Y., Guo X., Dong W., et al. Research progress on the generation of NDMA by typical PPCPs in disinfection treatment of water environment in China: A review. Sci Total Environ. 06.2024; 929:172498. [CrossRef]
  14. Thumbar H., Nariya P., Dhaduk B. Advanced LC-MS/MS method for selective quantification of nitrosamine impurities in Risperidone: Enhancing drug safety. Talanta Open 08.2025; 11:100416. [CrossRef]
  15. Powley M.W., Sobol Z., Johnson G.E., Clark R.W., Dalby S.M.., Ykoruk B.A., et al. N-nitrosamine impurity risk assessment in pharmaceuticals: Utilizing In vivo mutation relative potency comparison to establish an acceptable intake for NTTP. Regul Toxicol Pharmacol.09.2024; 152:105681. [CrossRef]
  16. Nomura R., Taniguchi T., Suzuoki K., Yokoi R., Akasaki K., Hirai K., et al. Exploration for Chemical Filter Cartridges that Can Reduce Nitrogen Oxides, a Common Factor in the Formation of Nitrosamines. Org Process Res Dev. 17 01.2025; 29(1):66-70. [CrossRef]
  17. Dos Santos CEM, Dorta D.J., De Oliveira D.P. Setting limits for N-nitrosamines in drugs: A defined approach based on read-across and structure-activity relationship for N-nitrosopiperazine impurities. Regul. Toxicol. Pharmacol. 12.2022; 136:105288. [CrossRef]
  18. Furuhama A., Sugiyama K., Honma M. Ames mutagenicity of 15 aryl, benzyl, and aliphatic ring N-nitrosamines. Regul Toxicol Pharmacol. 02.2025;156:105763. [CrossRef]
  19. Chakravarti S., Saiakhov R.D., Girireddy M. Cálculo del puntaje de confianza para las predicciones del enfoque de categorización de potencia carcinogénica (CPCA) para N -nitrosaminas. Comput Toxicol. 01.03.2024;29:100298. [CrossRef]
  20. Nudelman R., Kocks G., Mouton B., Ponting D.J., Schlingemann J., Simon S., et al. The Nitrosamine “Saga”: Lessons Learned from Five Years of Scrutiny. Org. Process. Re.s Dev. 20.10.2023;27(10):1719-35. [CrossRef]
  21. Londoño Pereira M., Gómez Ramírez B.D. Nitratos y nitritos, la doble cara de la moneda. Rev. Nutr. Clínica. Metab. 15.01. 2021;4(1):110-9. [CrossRef]
  22. Luo Q., Miao Y., Liu C., Bei E., Zhang J.F.., Zhang LH., et al. Maternal exposure to nitrosamines in drinking water during pregnancy and birth outcomes in a Chinese cohort. Chemosphere. 02.2023; 315:137776. [CrossRef]
  23. Yang T., Liu X., Zeng Z., Wang X., Zhang P., Feng B., et al. Efficient and recyclable degradation of organic dye pollutants by CeO2@ZIF-8 nanozyme-based non-photocatalytic system. Environ. Pollut. 01.2023; 316:120643. [CrossRef]
  24. Zou X., Zhao X., Zhang J., Lv W., Qiu L., Zhang Z. Photocatalytic degradation of ranitidine and reduction of nitrosamine dimethylamine formation potential over MXene–Ti3C2/MoS2 under visible light irradiation. J Hazard Mater. 07.2021;413:125424. [CrossRef]
  25. Gu X., Xu L., Huang X., Chen Y., Li Y., Shan Y., et al. N-nitrosamines in karst groundwaters in southwestern China: Risks and implications for drinking water safety. Emerg. Contam. 03.2025; 100497. [CrossRef]
  26. Gilca A.F., Teodosiu C., Fiore S., Musteret C.P. Emerging disinfection byproducts: A review on their occurrence and control in drinking water treatment processes. Chemosphere. 11.2020;259:127476. [CrossRef]
  27. Huang H., Chen Z., Su Y., Zeng H., Li H., Chen Y., et al. N-nitrosamines in electroplating and printing/dyeing industrial wastewater treatment plants: Removal efficiency, environmental emission, and the influence on drinking water. Water Res. 05. 2024; 255:121537. [CrossRef]
  28. Kang H.J., Ahn J., Park H., Choo K.H. Nitrosamine removal: Pilot-scale comparison of advanced oxidation, nanofiltration, and biological activated carbon processes. Chemosphere. agosto de 2021; 277:130249. [CrossRef]
  29. Liu Z., Meng Y., Wang Y., Zhang Z., Yin Z., Dai Y., et al. Complete removal of N-nitrosamines using in-situ constructed sequential microreactors: Synergies of catalysis-adsorption between N-nitrosamines and their degradation products. Appl Catal B Environ Energy. 11.2024;356:124219. [CrossRef]
  30. Li J., Jing Y., Zhang S., Rao C., Luo D., Xi F., et al. WO3@MOF heterostructure in-situ transformed and deposited on La-Bi2WO6-BiFeWOx composite with enhanced photocatalytic performance for degradation of harmful and toxic substances produced by tobacco. Chem Eng J. 11.2024; 499:156508. [CrossRef]
  31. Pan J., Yang X., Zhou J., Cheng W., Cheng K. Novel ZIF-8/ZnS hollow polyhedral heterostructures derived from ZIF-8 with enhanced photocatalytic activity for degradation of aflatoxin B1. Prog. Nat. Sci. Mater. Int. 10.2023; 33(5):575-80. [CrossRef]
  32. Liu T., Shi L., Wang Z., Liu D. Preparation of Ag2O/Bi12O17Cl2 p-n junction photocatalyst and its photocatalytic performance under visible and infrared light. Colloids Surf Physicochem Eng Asp.01.2022; 632:127811. [CrossRef]
  33. Yang X., Pan J., Hu J., Zhao S., Cheng K. MOF-derived La–ZnFe2O4@Fe3O4@carbon magnetic hybrid composite as a highly efficient and recyclable photocatalyst for mycotoxins degradation. Chem Eng J. 07.2023; 467:143381. [CrossRef]
  34. Wang L., Xu H. Two-dimensional conjugated polymer frameworks for solar fuel generation from water. Prog Polym Sci. 10.2023; 145:101734. [CrossRef]
  35. Yu H.L., Liu L.Q., Zhou Y.W., Xue X.L., Yuan X.H., Shen Y.G., et al. Photocatalysis performance enhancement of Ag2O/Al-doped ZnO heterojunction by introducing ZnO nanorod array. Ceram Int. 04.2023; 49(7):10513-24. [CrossRef]
  36. Mkhalid I.A., Fierro J.L.G., Mohamed R.M., Alshahri A.A. Visible light driven photooxidation of imazapyr herbicide over highly efficient mesoporous Ag/Ag2O–TiO2 p-n heterojunction photocatalysts. Ceram Int. 11.2020; 46(16):25822-32. [CrossRef]
  37. Shang Y., Cui Y., Shi R., Che Q., Zhang A., Yang P. Depositing Ag3PO4 on WO3 hollow microspheres at room temperature for rapid photocatalytic degradation of Rhodamine B. Prog Nat Sci Mater Int. 06.2022;32(3):282-8. [CrossRef]
  38. Pudukudy M., Shan S., Miao Y., Gu B., Jia Q. WO3 nanocrystals decorated Ag3PO4 tetrapods as an efficient visible-light responsive Z-scheme photocatalyst for the enhanced degradation of tetracycline in aqueous medium. Colloids Surf. Physicochem. Eng. Asp. 02.2020; 589:124457. [CrossRef]
  39. Wang Y., Bi N., Zhang H., Tian W., Zhang T., Wu P., et al. Visible-light-driven photocatalysis-assisted adsorption of azo dyes using Ag2O. Colloids Surf Physicochem Eng Asp. 01.2020; 585:124105. [CrossRef]
  40. Šuligoj A., Povirk N., Maver K., Mavrič A., Lavrenčič Štangar U., Surca A.K. Transparent vanadium doped titania-silica films: Structural characterization and self-cleaning properties. J. Environ. Chem. Eng. 10.2024; 12(5):113904. [CrossRef]
  41. Utomo R.S.B., Sentanuhady J., Muflikhun M.A. TiO2–SiO2 nanocomposite via a novel sol-gel method with the addition of an energy-monitoring device: Synthesized, characterization and anti-bacterial applications. Ceram. Int. 04.2024; S027288422401438X. [CrossRef]
  42. Guo M., Ding J., Ji G., Xie T., Pang H., Li X., et al. Highly dispersed Ag/SiO2 catalyst with weak metal-support interaction for diethyl oxalate hydrogenation to ethyl glycolate. Mol Catal. 03.2024; 556:113898. [CrossRef]
  43. Forghieri G., Ghedini E., Menegazzo F., Di Michele A., Signoretto M. An investigation on the photo-catalytic oxidation of air pollutants via SiO2-supported TiO2. Appl Catal Gen.08.2022; 644:118813. [CrossRef]
  44. Sørensen L., Zahlsen K., Hyldbakk A, Silva E.F.D., Booth A.M. Photodegradation in natural waters of nitrosamines and nitramines derived from CO2 capture plant operation. Int. J. Green. Gas. Control.01.2015; 32:106-14. [CrossRef]
  45. Guo X., Li Q., Zhang M., Long M., Kong L., Zhou Q., et al. Enhanced photocatalytic performance of N-nitrosodimethylamine on TiO2 nanotube based on the role of singlet oxygen. Chemosphere. 02.2015; 120:521-6. [CrossRef]
  46. Liu C., Zhang M., Gao H., Kong L., Fan S., Wang L., et al. Cyclic coupling of photocatalysis and adsorption for completely safe removal of N-nitrosamines in water. Water Res. 02.2022; 209:117904. [CrossRef]
  47. Rab Nawaz H.Z., Falak U., Naz T., Baig M.M., Mehmood Ahmad R.T., Rasheed A., et al. Synthesis of silver/silver oxide heterostructures via partial reduction of AgNO3 using a novel green reducing agent. Ceram. Int. 12.2022; 48(24):37194-202. [CrossRef]
  48. Avirdi E., Hooshmand S.E., Sepahvand H., Vishwanathan V., Bahadur I., Katata-Seru L.M., et al. Ionic liquids-assisted greener preparation of silver nanoparticles. Curr. Opin. Green Sustain Chem. 02.2022; 33:100581. [CrossRef]
  49. Masilela M., Ndlovu S. Extraction of Ag and Au from chloride electronic waste leach solutions using ionic liquids. J. Environ. Chem. Eng.02.2019;7(1):102810. [CrossRef]
  50. Husanu E., Chiappe C., Bernardini A., Cappello V., Gemmi M. Synthesis of colloidal Ag nanoparticles with citrate based ionic liquids as reducing and capping agents. Colloids Surf Physicochem. Eng. Asp. 02.2018; 538:506-12. [CrossRef]
  51. Castro-Amoedo R., Csendes Z., Brünig J., Sauer M.., Foelske-Schmitz A, Yigit N., et al. Carbon-based SILP catalysis for the selective hydrogenation of aldehydes using a well-defined Fe(II) PNP complex. Catal. Sci. Technol. 2018; 8(18):4812-20. [CrossRef]
  52. Zang C., Han X., Chen H., Zhang H., Lei Y., Liu H., et al. In situ growth of ZnO/Ag2O heterostructures on PVDF nanofibers as efficient visible-light-driven photocatalysts. Ceram. Int. 10.2022; 48(19):27379-87. [CrossRef]
  53. Fesharaki S.N., Fereydouni M., Sheibani S. Tailoring Ag-Co co-doped BaTiO3/graphene oxide nanocomposite as a solar-light-driven multifunctional photocatalyst for wastewater remediation and antibacterial applications. Results Eng .06.2026; 30:110504. [CrossRef]
  54. Komaraiah D., Radha E., Sivakumar J., Ramana Reddy M.V., Sayanna R. Photoluminescence and photocatalytic activity of spin coated Ag+ doped anatase TiO2 thin films. Opt. Mater. 10.2020; 108:110401. [CrossRef]
  55. Kuruva H., Khavala V.B., Mishra B.R., Murugan K., Thomas T., Murty B.S. Enhancing photocatalytic efficiency and durability: Ag-modified CNS–TiO2 thin films for sustainable industrial wastewater treatment. Opt Mater. abril de 2024;150:115180. [CrossRef]
  56. Bakina O, Chzhou V, Svarovskaya N, Buyakov A, Ivanova L, Rodkevich N, et al. Using of electrical explosion of two twisted wires to obtain TiO2(rutile)/TiO2(anatase)-Ag nanoparticles with high visible-light photochemical activity. J. Mol. Struct. 05.2025; 1329:141327. [CrossRef]
  57. Chen H., Chen N., Gao Y., Feng C. Photocatalytic degradation of methylene blue by magnetically recoverable Fe3O4/Ag6Si2O7 under simulated visible light. Powder Technol. 02.2018; 326:247-54. [CrossRef]
  58. Qin J., Chen N., Feng C., Fan C, Gao Y. Synthesis of a high-performance silver silicate (Ag6Si2O7)/silver bromide (AgBr) photocatalyst with enhanced visible light catalytic activity for refractory organic pollutants. Colloids Surf. Physicochem. Eng Asp. 09.2019; 577:213-23. [CrossRef]
  59. Al Amin S.M., Kowser M.A. Influence of Ag doping on structural, morphological, and optical characteristics of sol-gel spin-coated TiO2 thin films. Heliyon. 09.2024; 10(18):e37558. [CrossRef]
  60. Ma J., Ou W., Zhao L., Shi W., Zhu H., Liu J. Effect of SiO2 monocrystalline substrate orientation on the crystal structure and properties of VO2 film. J. Alloys Compd. 01.2025; 1010:177968. [CrossRef]
  61. Kerwald .J, Vebber M.C., Aguzzoli C., Da Silva Crespo J., Giovanela M. Influence of silver nanoparticle deposition on self-assembled thin films of weak polyelectrolytes/TiO2 for bezafibrate photodegradation through central composite experimental design. J. Environ. Chem. Eng. 02.2020; 8(1):103619. [CrossRef]
  62. Khan R., Rahman N., Prasannan A., Ganiyeva K., Chakrabortty S., Sangaraju S. Phase transition and bandgap modulation in TiO2 nanostructures for enhanced visible-light activity and environmental applications. Sci Rep. 26 06.025; 15(1):20309. [CrossRef]
  63. Yalçın Y., Kılıç M., Cinar Z. The Role of Non-Metal Doping in TiO2 Photocatalysis. J. Adv. Oxid. Technol.01.07.2010; 13:281-96. [CrossRef]
  64. Shah R., Khan D., Al-Anazi A., Ahmad W., Ullah I., Shah N.S., et al. Non-metal doped ZnO and TiO2 photocatalysts for visible light active degradation of pharmaceuticals and hydrogen production: A review. Appl Catal O Open.07.2025; 204:207043. [CrossRef]
  65. Zheng X., Zhang D., Gao Y., Wu Y., Liu Q., Zhu X. Synthesis and characterization of cubic Ag/TiO2 nanocomposites for the photocatalytic degradation of methyl orange in aqueous solutions. Inorg. Chem. Commun.12.2019;.110:107589. [CrossRef]
  66. Afzal A., Kang J., Choi B.M, Lim H.J. Degradation and fate of N -nitrosamines in water by UV photolysis. Int. J. Green. Gas Control. 09.2016; 52:44-51. [CrossRef]
  67. Sorvali M., Tinus T., Thamby J., Honkanen M., Ali-Löytty H., Charmforoushan A., et al. Silver nanoparticle coatings with adjustable extinction spectra produced with liquid flame spray, and their role in photocatalytic enhancement of TiO2. Mater. Des. 03.2024; 239:112800. [CrossRef]
  68. Aqeel A., Kim C.J., Lim H.J. Influence of pH on the UV photolysis of N -nitrosamines in water: Kinetics and products. Int. .J Green. Gas Control. 09.2017; 64:194-203. [CrossRef]
  69. Knuutila H., Svendsen H.F., Asif N. Destruction of nitrosoamines with UV-light. Energy Procedia. 2013; 37:743-50. [CrossRef]
  70. Khan H., Shah M.U.H. Modification strategies of TiO2 based photocatalysts for enhanced visible light activity and energy storage ability: A review. J Environ Chem Eng. 12.2023; 11(6):111532. [CrossRef]
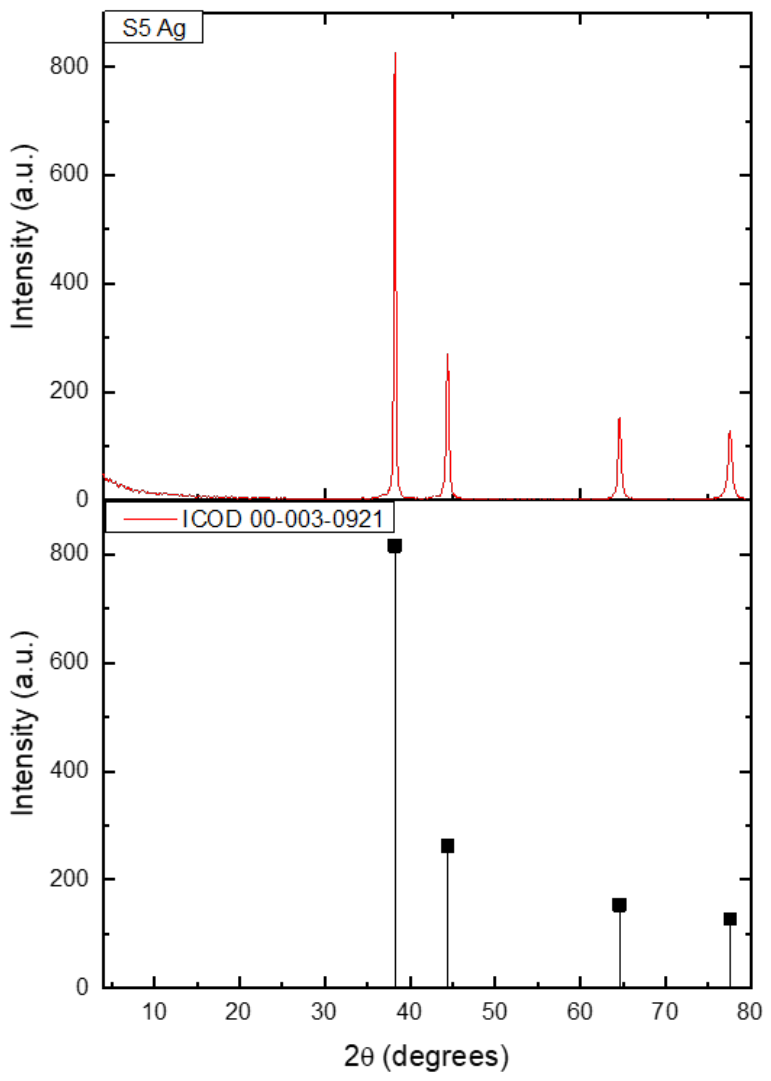
Figure 1. Diffraction pattern of the Ag particles synthesized by employing TAD as stabilizing agent.
Preprints 228438 g001
Figure 2. Micrographs of Ag particles synthesized by using TAD as stabilizing agent: a) 3 500x, b) 20 000x.
Preprints 228438 g002
Figure 3. EDS of the Ag particles synthesized by using DTA as stabilizing agent.
Preprints 228438 g003
Figure 4. Diffraction patterns of the systems a) Ag/TiO2 and b) Ag/SiO2.
Preprints 228438 g004
Figure 5. Micrographs of the systems deposited on 304 stainless steel substrates: a) Ag/TiO2 and b) Ag/SiO2.
Preprints 228438 g005
Figure 6. EDS analysis of the Ag/TiO2 system deposited on 304 stainless steel substrates.
Preprints 228438 g006
Figure 7. EDS analysis of the Ag/SiO2 system deposited on 304 stainless steel substrates.
Preprints 228438 g007
Figure 8. Tauc plot for the a) Ag/TiO2 and b) Ag/SiO2 systems.
Preprints 228438 g008
Figure 9. Spectra of the Ag/SiO2 photocatalyst: a) Ag 3d5/2, b) Si 2p3/2, c) O 1s, d) C 1s.
Preprints 228438 g009
Figure 10. Spectra of the Ag/SiO2 photocatalyst: a) Ag 3d5/2, b) Si 2p3/2, c) O 1s, d) C 1s.
Preprints 228438 g010
Figure 11. Local monitoring of solar irradiance compared with data of the ‘Sistema Meteorológico Nacional’.
Preprints 228438 g011
Figure 12. Photocatalytic treatment of NDELA by means of films of the a) Ag/TiO2 and b) Ag/SiO2 systems.
Preprints 228438 g012
Figure 13. Photocatalytic treatment of NDELA with powders of the a) Ag/TiO2 and b) Ag/SiO2 systems.
Preprints 228438 g013
Figure 14. Photocatalytic treatment with stirring of NDELA by means of the a) Ag/TiO2 and b) Ag/SiO2 systems.
Preprints 228438 g014
Table 1. Elemental composition of the synthesis of Ag particles using TAD as stabilizing agent.
Element Zone 1 (%)
Silver 84.41
Oxygen 8.43
Table 2. Elemental composition of the Ag/TiO2 system deposited on 304 stainless steel substrates.
Element Zone 1 (%) Element Zone 2 (%)
Titanium 58.21 Iron 36.81
Oxygen 33.00 Titanium 24.50
Iron 6.83 Oxygen 18.13
Chromium 1.62 Chromium 17.69
Silicon 0.26 Nickel 1.62
Silver 0.07 Silver 0.89
Nickel 0.00 Silicon 0.36
Table 3. Elemental composition of the Ag/SiO2 system deposited on 304 stainless steel substrates.
Element Zone 1 (%) Element Zone 2 (%)
Oxygen 53.04 Iron 36.81
Silicon 38.79 Oxygen 24.50
Iron 4.82 Chromium 18.13
Chromium 2.73 Silicon 17.69
Silver 0.62 Silver 1.62
Table 4. Concentration and COD degradation values using NDELA.
Concentration mg/L Degradation mg/L
Initial solution 19 0
Photolysis 6 58
Ag/SiO2 0.1 99
Ag/TiO2 3 84
Disclaimer/Publisher’s Note: The statements, opinions and data contained in all publications are solely those of the individual author(s) and contributor(s) and not of MDPI and/or the editor(s). MDPI and/or the editor(s) disclaim responsibility for any injury to people or property resulting from any ideas, methods, instructions or products referred to in the content.
Copyright: This open access article is published under a Creative Commons CC BY 4.0 license, which permit the free download, distribution, and reuse, provided that the author and preprint are cited in any reuse.