

Submitted:
13 August 2026
Posted:
17 August 2026
You are already at the latest version
Abstract
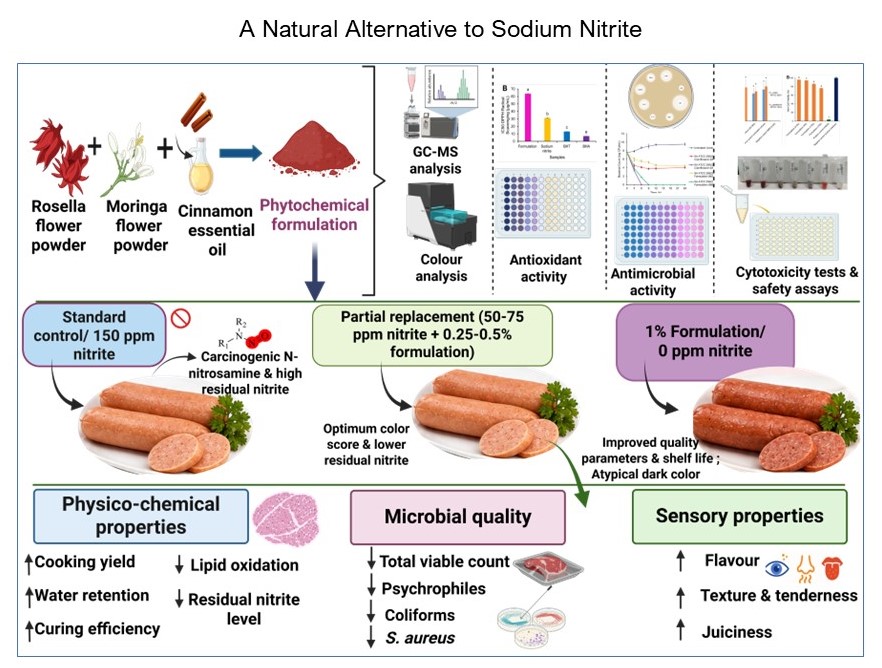
The use of nitrite and nitrate in processed meats is a public health concern because they can form potentially carcinogenic N-nitroso compounds. This study developed and characterized a natural phytochemical formulation comprising roselle flower and moringa flower powder, and cinnamon essential oil (5.5:4:0.5) as a potential nitrite alternative in emulsion-based chicken sausages. The formulation exhibited strong antioxidant activity, with high total phenolic content (147.44 mg GAE/g) and effective DPPH radical-scavenging capacity. Gas chromatography-mass spectrometry analysis identified diverse bioactive secondary metabolites. It also demonstrated broad-spectrum antimicrobial activity against major foodborne pathogens and remained stable across varying pH and temperature conditions. Safety evaluations, including red blood cell hemolysis, probiotic compatibility, and Vero cell cytotoxicity assays, confirmed its non-toxic nature. Chicken sausages containing different levels of the phytochemical formulation (0-1%) and sodium nitrite (0-150 ppm) were stored at 4 ± 1°C for 20 days and evaluated periodically. Compared with controls, sausages containing the formulation showed (p ≤ 0.05) significantly improved cooking yield, water retention, nutritional quality, and texture, while exhibiting lower lipid oxidation, residual nitrite levels, and microbial counts (total viable count, psychrophiles, coliforms, Staphylococcus aureus). Although complete nitrite replacement produced an undesirably dark color, partial replacement (1/2 to 2/3, i,e., 75-100 ppm nitrite) maintained product quality, safety, and shelf life, highlighting the formulation's potential for cleaner-label, healthier processed meat products.
Keywords:
nitrite alternative
; cinnamon essential oil
; moringa flower
; roselle flower
; chicken sausages
; food safety
; shelf life
; sensory
1. Introduction
Emulsion-based cooked chicken sausages are widely consumed and have become an important part of modern diets due to consumer preference for leaner meat, convenience, affordability, and desirable sensory attributes. However, their quality, safety, and acceptability depend heavily on chemical preservatives, especially sodium nitrite, which is valued for its multifunctional properties. This additive imparts the characteristic pink color by forming the cured pigment nitrosohemochrome, and inhibits lipid oxidation by preventing rancidity and “warmed-over flavor” in processed meat [1]. Further, it enhances flavor and suppresses the growth of pathogenic microorganisms, particularly Clostridium botulinum [2]. About 100-200 ppm of nitrite can sufficiently inhibit Clostridium spp., Bacillus spp., Listeria monocytogenes, Salmonella enterica serovar Typhimurium, Escherichia coli, Staphylococcus aureus, and others. In contrast, up to 300 ppm is required to inhibit the production of C. botulinum toxin in processed meat products [3].
Despite its beneficial functions, nitrite in processed meat has often been linked to adverse effects on human health, such as esophageal, nasopharyngeal, gastric, colorectal, brain, and bladder cancers [4]. In addition, it can cause methemoglobinemia or “blue baby syndrome” in infants [2]. Further, the interaction of nitrite and secondary amines is responsible for the formation of carcinogenic N-nitroso compounds (NOCs) (e.g. nitrosamines) during different stages of processing and storage of meat products [5,6]. The International Agency for Research on Cancer (IARC) under the World Health Organization (WHO) has classified processed meat as carcinogenic (Group 1) [7]. Excessive nitrite intake causes enlargement of the thyroid gland and may also interfere with progesterone synthesis, contributing to abortion [8]. In response, regulatory authorities have imposed strict limits on allowable nitrite levels in meat products. The maximum permissible limit (MPL) of nitrite in processed meat formulations is 150 ppm as per the European Union (EU) [9]. Further, consumer demand for “clean-label” foods free of synthetic additives has increased, as a recent survey suggests that consumers now seek “nitrite-free” labels on meat products, due to increased focus on health and wellness [10].
As efforts to replace or reduce synthetic nitrites with clean-label strategies are underway, natural ingredients emerge as the most promising nitrite alternatives, aligning with the “clean label” demands, as they are free of E-numbers [11,12]. Further, most plant-based ingredients exhibit nitrite-mimicking properties, have a long history of use and have gained GRAS (Generally Recognized As Safe) status from the Food and Drug Administration (FDA) [7].
Over the years, several plant-derived ingredients and essential oils (EOs), with excellent antioxidant, antimicrobial, and color-enhancing properties, have been explored as natural nitrite alternatives in processed meat products. For example, a mixture of fruit and vegetable powders containing Chinese cabbage, celery, and cranberries was demonstrated to improve the physico-chemical quality of fried beef meatballs [13]. Pitaya peel (PP) extract and lemon seed essential oil (LEO) could also partially replace nitrite without affecting the physico-chemical, microbial, and sensory properties in cured mutton [2]. Ozaki et al. [14] used radish and beetroot powders (0.5% and 1.0%, respectively) as substitutes for nitrite in fermented cooked sausages. Coriander EO (CEO) (0.075-0.150 µL/g) with different levels of sodium nitrite (0, 50 and 100 mg/kg) was demonstrated to be effective in cooked pork sausages [6]. Efforts have also focused on nitrite-rich vegetable powders such as celery or beetroot, combined with starter cultures to serve as chemical nitrite substitutes and generate nitrite in situ in cured meat products. But these alternatives could not fully eliminate nitrite-related concerns, as residual nitrite persists and continues to contribute to the formation of N-nitroso compounds [11]. Therefore, finding the optimal combination and quantity of plant extracts and EOs with synergistic effects is important, as a single plant ingredient can’t replicate the multifunctionality of synthetic nitrite, offering antimicrobial, antioxidant, and color-stabilizing properties in processed meat products.
A recent study demonstrated that a phytochemical blend comprising multiple plant components and an EO acted synergistically to retard physicochemical deterioration, suppress microbial growth, and preserve the microstructural and textural integrity of chicken sausages during chilled storage, indicating its potential as a natural preservation strategy for processed poultry products [15]. The current study conducted a comprehensive in vitro characterization of the phytochemical combination using minimum inhibitory concentration (MIC), minimum bactericidal concentration (MBC), DNA degradation analysis, time-kill and stability assays, and safety assessment, including hemolysis, probiotic compatibility, and Vero cell cytotoxicity assays. Further, the functional efficacy of the formulation was evaluated in a meat model system (chicken sausages) during refrigerated storage (4 ± 1℃) for 20 days, to assess its potential as a natural nitrite alternative in processed meat products.
2. Materials and Methods
2.1. Preparation of Phytochemical Formulation
Fresh plant parts used in this study were obtained from local markets (Kolkata, India) and identified by a botanist, an ex-professor at Samanta Chandra Sekhar (Autonomous) College, Puri, affiliated to Utkal University, Odisha, India. Cinnamon essential oil was purchased from RV Essential (New Delhi, India). The individual plant powders and their ethanolic extracts (70% v/v) were prepared as before [16].
Three different formulations were prepared by blending roselle flower powder (RFP), moringa flower powder (MFP), and cinnamon essential oil (CmEO) at different ratios: (4:4:2), (5.5:4:0.5), and (5:4:1) (% w/w). Preliminary studies on stability, color development, antioxidant capacity, and antimicrobial efficacy of these combinations demonstrated that the formulation ratio (5.5:4:0.5) was the most effective and was therefore used in subsequent experiments.
For in vitro characterization studies, 70% (v/v) ethanolic extract of the chosen blend/combination (5.5:4:0.5), designated as “formulation,” was used as described [15], whereas its powder form (% w/w) was used directly in chicken sausage for product development studies.
2.2. Characterization of Phytochemical Formulation
2.2.1. Total Extractable Components (TEC), pH, Color, and Residual Nitrite (RN) Content
The formulation was analyzed for total extractable components (TEC %), pH, instrumental color, and residual nitrite (RN) content. TEC % or extraction yield (%) was calculated [17] using the formula:
The pH was checked using a digital pH meter (pH tutor, Eutech Instruments, Singapore). The instrumental color coordinates [lightness (L*), redness (a*), yellowness (b*), hue angle (hab), and chroma (C*ab)] were measured using a ColorQuest XE colorimeter (HunterLab, Reston, VA, USA). The RN was determined by the method of AOAC [18] and calculated by the following formula:
Where, C = Concentration of NaNO2 (ppm) from the calibration curve that corresponds to the absorbance of the sample; M = Mass (g) of sample; V = Volume (mL) of sample filtrate.
2.2.2. Total Phenolics Content (TPC) and 2, 2-Diphenyl-1-picrylhydrazyl (DPPH) Assay
The TPC was estimated by the classical Folin-Ciocalteu (FC) method [19] and was expressed as mg/g of gallic acid equivalent (GAE). The DPPH radical-scavenging activity (RSA%) was assayed using the method of Brand-Williams et al. [20] using the following formula:
Where, AB = Absorbance of the blank and AS = Absorbance of the sample. The half-maximal inhibitory concentration (IC50) was determined by plotting RSA (%) against the sample concentrations.
2.2.3. Gas Chromatography-Mass Spectrometry (GC-MS) Analysis
Identification of compounds in the phytochemical formulation was done using a gas chromatograph-mass spectrometer (Shimadzu GCMSQP2010, Nakagyoku, Kyoto, Japan; runtime was ~70 min), and GC–MS solution software (Version 4.52, Shimadzu Sci, Nakagyoku, Kyoto, Japan) [21]. The identity of the phytochemical compound was determined by matching its mass spectra to standards from the NIST library (Version 20, Gaithersburg, MD, USA).
2.2.4. Agar Well Diffusion Assay, MIC, MBC and Tolerance Level
The formulation was evaluated for antimicrobial activity by an agar well diffusion assay against S. aureus ATCC 25923, L. monocytogenes ATCC 19111, L. monocytogenes ATCC 13932, S. Typhimurium ATCC 14028, E. coli ATCC 25922, C. perfringens MTCC 450 and C. sporogenes MTCC 2684 as per the method of Perez et al.[22] and the Clinical and Laboratory Standards Institute (CLSI) guidelines [23].
The MIC and MBC of the formulation were determined against some Gram-positive and Gram-negative bacteria. The MIC was determined by the resazurin dye reduction method. The MBC was determined by plating on Mueller-Hinton agar (MHA) plates by the drop plate method [24]. The mechanism of antibiosis (bactericidal or bacteriostatic) was ascertained by calculating the MBC/MIC ratio, or tolerance level [25].
2.2.5. Bacterial DNA Degradation, Dose and Time Dependent In-vitro Growth Kinetics and Stability Assays
The extent of damage caused by the formulation to genomic and plasmid DNA (pUC19) was assessed by agarose gel electrophoresis, as described previously [26]. The in vitro growth kinetics of the S. aureus (SA) ATCC 25922 isolate were evaluated by time-kill assay using the formulation (at 1X MIC and 1X MBC), with the log-phase bacterial culture (inoculum adjusted to 1 X 10⁷ CFU/mL) incubated in cation-adjusted Mueller-Hinton broth (CAMHB). A 50 µL of inoculum was transferred to the respective tubes containing 1X MIC and 1X MBC of the phytochemical formulation, and the tubes were incubated at 37 ℃. The isolate treated with ciprofloxacin (1X MIC and 1X MBC) served as the treatment control, while the target bacterial isolate in CAMHB served as the untreated control. Aliquots of 10 µL from each were collected at fixed time intervals (0, 3, 6, 9, 12, and 24 h), diluted 10-fold in sterile phosphate-buffered saline (PBS), and plated on MHA plates [24]. The inoculated agar plates were incubated at 37 ℃ for 24 h, and the colony counts were expressed as log10 CFU/mL. To assess the dose- and time-dependent in vitro growth kinetics, a line chart was prepared using the mean (n = 6) bacterial colony counts (log10 CFU/mL) and time (h) for each treatment.
Stability was assessed against S. Typhimurium ATCC 14028 and S. aureus ATCC 25923 by agar well diffusion assay. The 70% (v/v) ethanolic extract was pre-exposed for 30 min to varying temperatures (37 ℃, 70 ℃ and 100 ℃) and pH (2, 4, 6 and 8), followed by evaluation of inhibition zones. Additionally, the refrigerated (4 ± 1℃) storage stability of the extract was evaluated at 0, 15th and 30th days of aging [17].
2.2.6. In vitro Safety Assays (Hemolysis assay, Effect on Probiotics and Vero Cell Proliferation and Viability Assay)
The hemolysis assay was performed using sheep red blood cells (RBCs), as described by Ebbensgaard et al. [27]. Briefly, sheep blood (2 mL) was collected aseptically, washed several times with PBS, centrifuged at 1000 x g for 15 min, and resuspended in 10% (v/v) PBS containing 10 mM dithiothreitol (DTT). Aliquots (100 µL) of formulation at concentrations equivalent to 1X, 2X, 3X, 5X, and 10X MIC against S. aureus ATCC 25923 were mixed with 100 µL of the RBC suspension. Sterile PBS and 0.2% (v/v) Triton X-100 served as negative and positive controls, respectively. Hemoglobin release was quantified spectrophotometrically at 540 nm using the following formula:
The effect of the formulation on the growth of probiotic lactobacilli (Lactiplantibacillus plantarum MTCC 2621 and L. casei MTCC 1423), which are natural commensals in the gut, was analyzed as before [26]. Briefly, the lactobacilli bacteria (100 µL each, 107 CFU/mL) were inoculated into 100 µL of deMann-Rogosa-Sharpe (MRS) broth containing the formulation (1X MIC and 2X MIC for SA) in a 96-well microtiter plate. The untreated bacterial culture and MRS broth were included as positive and negative controls, respectively. After incubation at 37 ℃ for 48 h, the cultures were diluted in MRS broth, and 10 µL from each dilution was plated on MRS agar plates to enumerate colony-forming units to assess the formulation effect on the probiotics.
The effect of formulation, if any, on Vero cells (monkey kidney epithelial cell line; ATCC CCL-812) was measured by a 3-(4.5-dimethylthiazolyl-2)-2, 5-diphenyltetrazolium bromide (MTT) assay. Vero cells (5,000 cells/well) were seeded in a 96-well microtiter plate, cultured in Dulbecco’s Modified Eagle Medium (DMEM), supplemented with 10% heat-inactivated fetal bovine serum (FBS), 1% antibiotic (100 IU/mL penicillin), and antifungal (100 IU/mL streptomycin) solution. The plates were incubated at 37 ℃ for 24 h in a controlled atmosphere of 5% CO2 and 95% air. Thereafter, the cells were treated with different concentrations of the formulation (2.5, 5, 7.5, and 10%, w/v) for 48 h. The positive control consisted of H2O2 (500 µM), whereas culture medium alone served as the negative control. Subsequently, 15 µL of MTT (stock concentration = 4 mg/mL) was added to each well to give a final concentration of 500 µg/mL, and the mixture was incubated for 24 h. The unused DMEM and remaining MTT reagent were removed by aspiration after 24 h. The formazan crystals formed were dissolved with 80 µL of dimethyl sulfoxide per well. The optical density (OD) at 570 nm was measured using a microplate reader (SpectraMax® M5, Molecular Devices, San Jose, CA, USA). The percent cell viability, as compared to the untreated control, was calculated by the following formula:
- a.
- Preparation and Quality Evaluation of Chicken Sausages
Broiler chickens were slaughtered, dressed, and deboned according to standard procedures at our institutional meat processing facility. Meat was frozen at -18 ± 2 °C, later thawed at 4 ± 1 °C, and then minced through 8- and 4-mm plates. Batches were mixed (2–3 min) in a bowl chopper to form a fine emulsion (batter at 15 °C), stuffed (500 g per batch) into 24-mm artificial casings to yield 50 g sausages (~10 cm), and cooked in a water bath at 80 °C for 30 min (internal temperature 75 ± 1 °C). The sausages were cooled to room temperature, aerobically packaged in low-density polyethylene (LDPE) pouches, and stored at 4 ± 1 °C for 20 days. In total, five test chicken sausage groups, i.e., negative control (C1) containing no phytochemical or nitrite, positive control (C2) containing no phytochemical but 150 ppm nitrite, T1B (0.25% formulation + 75 ppm nitrite), T2B (0.5% formulation + 50 ppm nitrite), and T3B (1% formulation + no nitrite) were prepared. The five test groups of emulsion-based cooked chicken sausages were analyzed for expressible water content, proximate composition, and calorific value on the day of processing. Quality changes in the test chicken sausages were evaluated during refrigerated storage (4 ± 1℃) under aerobic packaging for 20 days at 5-day intervals (day 0, 5, 10, 15, and 20).
2.3.1. Expressible Water, Proximate Composition, and Calorific Value
The expressible water (%) of each sausage group was determined by the method of Jauregui et al. [28]. About 5 g of sample was placed between two layers of Whatman no. 1 filter paper (GE Healthcare, Waukesha, WI, USA). The sample was centrifuged at 1500 x g for 15 min (Remi, Mumbai, Maharashtra, India). The final weight was recorded, and the expressible water (%) of the sample was calculated as follows:
The proximate composition, such as moisture, crude protein (CP), crude fat (CF), and total ash (TA) of the sausage samples, was analyzed as per AOAC [18]. The carbohydrate contents (%) were estimated by difference.
The calorific values (kcal/100 g) of sausage samples were calculated using the Atwater values for CF (9.00 kcal/g), CP (4.02 kcal/g), and carbohydrate (4.00 kcal/g).
2.3.2. Thiobarbituric Acid Reacting Substances (TBARS) Values, Residual Nitrite (RN) Content, and Shear Force Value
The TBARS values of the sausage samples were determined as per the method of Witte et al. [29] with slight modification and expressed as mg malonaldehyde per kg (mg MDA/kg) of the sample. The RN content of sausage samples was determined by the slightly modified method of AOAC [18], as already described under section 2.2.1. The shear force values of sausage samples were measured instrumentally by a shear force apparatus (SHD-27, Superb Technologies, Haryana, India) at all specified storage intervals as per the slightly modified procedure of Berry and Stiffler [30] using the formula: Shear force value (kgf/cm2) = Kilogram-force required to shear the sausage (kgf)/Cross-sectional area of the sausage (cm2).
2.3.3. Total Pigment, Cured Pigment and Curing Efficiency
Nitroso/cured pigment (nitrosohemochrome) and total pigment in sausage samples were estimated following the method of Hornsey [31]. Cured pigment concentration (mg/kg) was calculated using the absorbance at 540 nm (A540) by the formula:
Total pigment concentration (mg/kg) was calculated using the absorbance at 640 nm (A640) by the formula:
The % conversion or curing efficiency (%) was calculated by the formula:
Curing efficiency (%) = [Cured pigment (mg/kg)/Total pigment (mg/kg)] × 100
2.3.4. Total Viable Count (TVC), Psychrophilic Count, Coliform Count, and S. aureus Count
The total viable count (TVC), psychrophilic count, coliform count, and S. aureus count of the sausage samples were estimated at specified storage intervals by the pour plate method as described by APHA [32]. Briefly, 10 g of sausage sample was transferred aseptically into a stomacher bag (Seward Medical, Newport Gwent, Wales, UK) containing 90 mL of 0.1% sterile buffered peptone water (BPW) and homogenized for 2 min. The samples were serially diluted in BPW, pour-plated with 1 mL of diluent, and incubated. Plate count agar (PCA) was used for TVC and psychrophilic count; violet red bile agar (VRBA) and Baird-Parker agar (BPA) for coliform and S. aureus counts, respectively, and incubated at 37 ± 1 °C under aerobic conditions for 48 h and 24 h. For psychrophilic counts, plates were incubated at 4 ± 1 ℃ in an inverted position for 7 days. Plates showing characteristic bacterial colonies were counted, and the average number of colonies was multiplied by the reciprocal of the dilution factor, then expressed as log10 CFU/g of sample.
2.3.5. Sensory Attributes
Sensory evaluation of the sausage samples was performed at specified storage intervals using 10 semi-trained panelists and an 8-point hedonic scale [25].
- Statistical Analysis
Data for each parameter were recorded in duplicate, and the current study was replicated three times (n=6 for each parameter, except for sensory evaluation, n = 30). Duncan’s multiple-range test, one-way, and two-way analyses of variance (ANOVA) were used to analyze the data using the Statistical Package for the Social Sciences (SPSS, IBM, USA, Version 20) software. The level of significance was set at 95% (p ≤0.05) for all parameters.
3. Results
3.1. Preparation of Formulation Blend
The preliminary screening results for stability, color development, antioxidant activity, and antimicrobial activity, expressed as zone of inhibition (ZOI, mm), were used to standardize and optimize the phytochemical blends. No significant differences (p > 0.5) were observed among the formulations consisting of RFP, MFP, and CmEO at different ratios (4:4:2; 5.5:4:0.5; 5:4:1) with respect to stability, color development, or antioxidant capacity. However, significant differences in ZOI values were detected (p ≤ 0.05; Supplementary Table 1), and all three combinations exhibited synergistic antimicrobial effects compared with their individual components. Of the three initial formulations, the blends with ratios and showed the highest antimicrobial activity, and the 5.5:4:0.5 blend (designated “formulation”) was selected for further studies. It is well established that no single nitrite substitute possesses all its properties and can completely replace it in processed meat products [11]. Therefore, researchers have also used blends of EOs, combinations of plant extracts with EOs, and combinations of spice extracts as nitrite replacers in emulsion-based chicken sausages [33] and fermented sausages [14,34].
3.2. Characterization of Phytochemical Formulation
3.2.1. Total Extractable Components (TEC), pH, Color and RN Content of Formulation
The TEC (%) of our chosen formulation was 26.79% (Table 1), indicating its improved solubility and extractability. The individual plant powders present in the formulation could have affected TEC or yield. In another study, researchers also calculated the yield (%) of tomato pomace (4.77%) by supercritical fluid extraction and peppermint EO (0.70%) by hydro-distillation, and used them as natural nitrite replacers in cooked pork sausage [6]. Variations in yields could be attributed to many factors, such as the extraction method employed, the type of solvent used, the plant derivative, the plant’s growth stage or maturity, environmental conditions, and seasonal growing conditions [35,36].
The mean pH of the formulation was 3.28 (Table 1), indicating its acidic nature and supporting its use in low-acid foods, such as meat products. As reported in earlier studies, extracts of individual plant powders, such as RFP (pH, 2-3) and MFP (pH 5.44) are acidic [36,37]. The low pH of the phytochemical combination may be due to the acidic nature of the individual constituents (RFP and MFP) used in this study.
The CIELAB instrumental color values of the formulation were L* (21.87), a* (19.88), b* (13.43), hab (6.20) and C*ab (25.01) (Table 1). In general, the L* value ranges from 0 (black) to 100 (white), whereas a* values, if positive, indicate redness and negative values indicate greenness. Likewise, negative b* values represent bluish color, whereas positive b* values correspond to yellowness. The b*, hab and C*ab values are positively correlated [38], where hab stands for hue angle/ tonality and C*ab indicates color vividness and a bright reddish nature. In parallel with our study, Ozaki et al. [14] also measured the color parameters of radish powder (L*=60.03, a*=17.24, b*=0.27) and beetroot powder (L*=30.17, a*=16.90, b*=2.94), which were used as natural nitrite replacers in dry fermented pork sausages.
No RN content was detected in our formulation, as evidenced by the absence of pinkish-violet color development following the addition of N-(1-naphthyl) ethylenediamine dihydrochloride (NEDA) reagent to the reaction mixtures, in contrast to the nitrite-positive control (Table 1). These findings corroborate those of Bahadoran et al. [39], who reported undetectable levels of nitrite and nitrate in common fruits and vegetables, including tomato, carrot, cucumber, and potato. The lack of residual nitrite in the phytochemical components of our formulation may be attributed to organic cultivation practices and the absence of nitrogenous fertilizers during plant growth [8].
- i.
- Antioxidant Activity Assays (TPC and DPPH Assay)
In this study, significant (p ≤ 0.05) differences in the mean TPC of our formulation (147.44 mg GAE/g) and synthetic standard antioxidants such as BHT (2.82 mg GAE/g) and BHA (3.25 mg GAE/g) were observed (Figure 1A). The TPC of the formulation can be attributed to the presence of polyphenols, phenolic acids, flavonoids, saponins, tannins, and alkaloids, among other components [40]. Similar to our study, Ozaki et al. [14,34] estimated the TPC of radish (301.11 mg GAE/100 g), beetroot (292.96 mg GAE/100 g) powders, and oregano EO (62 mg GAE/100 g), and used them as natural nitrite replacers in fermented sausages. In another study, Aquilani et al. [41] determined the TPC of grape seed extract (822.709 mg/g), chestnut extract (161.091 mg/g), and olive pomace hydroxytyrosol (32.62 g/L), and used them in combination as a natural sodium nitrite substitute in Cinta Senese dry-fermented pork sausage. The differences in total phenolic content of natural plant ingredients can be attributed to several factors, including plant part type, climate, geographic conditions, extraction method, and solvent type [42].
The DPPH assay measures the electron-donating activity of a substance by scavenging or reducing DPPH free radicals and is a measure of its antioxidant activity [43]. The data revealed a significant difference (p ≤ 0.05) in the mean IC50 values of ethanolic extracts of our formulation (63.81 µg/mL) as compared to BHT (13.12 µg/mL), BHA (6.99 µg/mL), and sodium nitrite (31.14 µg/mL) (Figure 1B). The DPPH radical-scavenging activity of the formulation could be attributed to its individual components, including plant phenolic hydroxyl groups (catechol, hydroquinone, etc.) that donate an electron to neutralize DPPH free radicals [44].
The study conducted by Šojić et al. [6] also estimated the DPPH scavenging activities of tomato pomace (30.82 µM TE/g) and peppermint EO (23.16 µM TE/g), which were used as natural nitrite replacers in cooked pork sausage. Similarly, Ozaki et al. [14,34] estimated the DPPH radical scavenging activities of the powders of radish (1537.65 mg TE/g), beetroot (7140 mg TE/g), and oregano EO (6210 mg TE/100 g), and used them as natural nitrite replacers in fermented pork and beef sausages. The differences in DPPH assay results might be due to various factors, as mentioned earlier for TPC.
- ii.
- Identification of Phytochemical Compounds Through GC-MS
The GC-MS/MS chromatogram revealed the presence of 30 major phytochemical compounds in the formulation (Supplementary Figure S1 and Supplementary Table S2). The compounds were mostly secondary plant metabolites, including polyphenols, ethers, esters, carboxylic acids, alcohols, aldehydes, ketones, and aromatic derivatives. Their occurrence likely reflects both the intrinsic phytochemical profiles of cinnamon essential oil, roselle, and moringa flower powders, as well as potential interactions among these components during formulation. Several compounds were detected at relatively higher proportions, suggesting their potential contribution to the functional properties of our formulation. For instance, 1-Octanol, 3,7-Dimethyl- (citronellol) was the most abundant constituent, followed by Cyclohexane, 1,2-Dimethyl-, cis- (cis-dimethyl cyclohexane), 6-Methyl-Cyclohex-2-En-1-Ol (carveol isomer), and Phosphonic acid, 7-octenyl-, dibutyl ester. Other notable compounds included 1,3,5-Tris(cyclohexyl)pent-1-ene, Cyclohexane, 1,1’-(2-propyl-1,3-propanediyl) bis-, and 2,5-Furandione, 3-dodecyl-. These phytochemical compounds might have contributed to the acidic pH, antioxidant, and antimicrobial activities used in the present study. Similar to our study, Šojić et al. [45] also performed chemical characterization of sage EO by GC-MS, identified several terpenoids and phenolic compounds, and used them as potential natural nitrite replacers in dry-fermented pork sausage. Šojić et al. [6] and Ozaki et al. [34] also identified phenolic compounds and terpenoids in peppermint EO (menthon, menthol, isomenthon, eucalyptol, etc.) and oregano EO (carvacrol, p-cymene, γ-terpinene, and thymol), which were used as natural nitrite replacers in cooked pork sausages and fermented cooked sausages, respectively.
- iii.
- Agar Well Diffusion Assay, MIC, MBC and Tolerance Level
The formulation exhibited strong antimicrobial activities against several foodborne pathogens, including S. aureus ATCC 25923 (18.5-30.5 mm), L. monocytogenes ATCC 19111 (18.41-30.58 mm), L. monocytogenes ATCC 13932 (24.67-30.58 mm), S. Typhimurium ATCC 14028 (18.33- 2.08 mm), E. coli ATCC 25922 (14.58-20.67 mm), C. sporogenes MTCC 2684 (30.92-32.91 mm) and C. perfringens MTCC 450 (22.83-24.33 mm) in agar well diffusion assay (Figure 2). There were significant differences (p ≤ 0.05) in the ZOI of the formulation at lower and higher concentrations against all target bacteria. Antimicrobial activities can be attributed to the inherent bioactive compounds and synergistic antibacterial effects of the individual components.
In this study, the penultimate concentration (10%) showed significantly greater antimicrobial activity than the lower (5%) and higher (20%) concentrations, suggesting its hermetic nature. A possible reason is that the lower concentration (5%) might be insufficient, whereas a higher concentration (20%) could lead to compound aggregation, reducing bioavailability and toxicity and resulting in lower antimicrobial activity than the penultimate concentration with optimal antimicrobial activity [46]. A similar trend was observed by Das et al. [25], who reported that bamboo essential oil (BEO) exhibited broad-spectrum antibacterial activity against S. aureus (2.48 cm), S. Typhimurium (2.8 cm), and E. coli (1.78 cm). Broad-spectrum antimicrobial activities of the individual plant components, such as roselle flower [47], moringa flower [48], and CmEO [49], or the synergistic effects of their combination (plant extracts and EOs) have also been reported by researchers [50].
The MIC was determined as the lowest concentration of the formulation that prevented the resazurin dye from changing from blue to pink [51]. After overnight incubation, MBC was recorded as the lowest extract concentration yielding no visible colonies on MHA plates [25]. The data summarized in Table 2 indicate that there were significant (p ≤ 0.05) differences in values for MIC, MBC, and tolerance level between Gram-positive (S. aureus ATCC 25923, L. monocytogenes ATCC 19111) and Gram-negative (S. Typhimurium ATCC 14028 and E. coli ATCC 25922) bacteria used in this study. The MIC and MBC of the formulation for both the Gram-positive bacteria were the same, i.e., 0.781 mg/mL, and the tolerance level was 1. However, it showed different values of MIC, MBC, and tolerance level for S. Typhimurium ATCC 14028 (MIC=MBC= 0.195 mg/mL and 1) and E. coli ATCC 25922 (0.39 mg/mL, 0.781 mg/mL, and 2). Furthermore, the positive control, ciprofloxacin, showed the same values of MIC, MBC, and tolerance level for each bacterium. However, there were significant differences (p ≤ 0.05) among the values for Gram-positive (0.125 mg/mL, 0.25 mg/mL, and 2) and Gram-negative bacteria (0.25 mg/mL, 0.5 mg/mL, and 2). The lower MIC, MBC, and tolerance levels of the formulation suggest its potent antimicrobial activity.
In a study, Sharma et al. [52] also determined the MBC of 9 EOs against 7 foodborne bacteria and evaluated their use as preservatives in vacuum-packaged chicken sausages under frozen storage conditions. The MIC, MBC, and tolerance levels of BEO [25] and Alkanna tinctoria roots [17] were also determined against several common foodborne bacteria before using them as natural preservatives in chicken meatballs. Generally, a low (≤ 4), high (≥ 4), and very high (≥ 16) MBC/MIC ratio or tolerance level indicates that the plant extract or antibiotic is bactericidal, bacteriostatic, and tolerant, respectively [25]. The low tolerance levels or MBC/MIC ratios (≤ 4) of our formulation and ciprofloxacin suggest that both have bactericidal activity, i.e., can kill the bacteria at concentrations closer to or equal to MIC.
3.2.5. Bacterial DNA Degradation
The DNA-degrading bioactivity of the phytochemical formulation was assessed via agarose gel electrophoresis (Figure 3). Treatment of plasmid DNA (pUC19) and S. aureus ATCC 25922 genomic DNA (gDNA) with the ethanolic extract of the formulation induced degradation, converting double-stranded circular plasmid DNA (lane 3) and genomic DNA (lane 7) into fragmented forms. In contrast, DNase treatment resulted in complete degradation of both plasmid (lane 4) and gDNA (lane 8), serving as a positive control (Figure 3).
Based on the results, it can be concluded that the formulation contained bioactive compounds that degraded extrachromosomal plasmid DNA (pUC19) and S. aureus (ATCC 25922) genomic DNA, thereby contributing to their antimicrobial activities. Moreover, degradation of plasmid DNA is an important finding from an antimicrobial resistance (AMR) perspective, as plasmids contribute to multi-drug resistance (MDR) by harboring and disseminating multiple resistance genes [53]. Similar results were also obtained by Das et al. [26] in their study on antioxidant and antimicrobial activities of Sesamum indicum honey.
3.2.6. Dose- and Time-Dependent In Vitro Growth Kinetics and Stability Assays
The results of the time-kill assay show dose- and time-dependent in vitro growth kinetics of S. aureus (ATCC 25922) (Figure 4). From the findings, it is apparent that the untreated control exhibited an increasing growth pattern (7.56-9.51 log10 CFU/mL) throughout the incubation period (i.e., up to 24 h). On the other hand, the antimicrobial effect of ciprofloxacin at the 1X MIC (treatment control) was highly significant (p ≤0.01) at 3 h post-incubation (hpi) (4.53 log10 CFU/mL), with more than 3-log reductions in bacterial counts relative to the control. The bacterial count exhibited almost static growth (3.81-4.02 log10 CFU/mL) with 1X MIC of ciprofloxacin until 24 hpi, whereas the untreated control exhibited increased growth, i.e., 9.5 log10 CFU/mL at the same time point. Similarly, the antimicrobial effect of ciprofloxacin (treatment control) at 1X MBC was highly significant (p ≤ 0.01) at 3 hpi (3.35 log10 CFU/ml), with a much lower bacterial count was observed than in all treatments. At 6 hpi, the treatment with 1X MBC of ciprofloxacin completely inhibited S. aureus ATCC 25923.
Significant (p ≤ 0.05) antimicrobial effects were observed at 1X MIC and 1X MBC with our formulation compared to the untreated control. However, at 1X MIC and 1X MBC, the antimicrobial effects were highly significant (p ≤ 0.05) from 3 hpi onward. Treatment with 1X MIC of the formulation resulted in bacterial counts ranging from 7.48 log10 CFU/mL to 4.48 log10 CFU/mL at 0 - 24 hpi. Moreover, complete elimination of S. aureus ATCC 25923 was observed at 9 hpi, with the formulation achieving 1X MBC. These kinetic studies demonstrate that our formulation is highly effective at the MBC concentration; however, a significant (p ≤ 0.05) reduction in log10 CFU/ml is also observed at their MIC concentrations.
In a study, Prasastha Ram et al. [54] also reported that the 1X MBC level of green-synthesized nanosilver entrapped with cinnamaldehyde eliminated MDR E. coli after 2 hpi. In a similar study, Olajuyigbe and Afolayan [55] reported that the ethanolic extracts of Erythrina caffra bark killed pathogenic bacteria, including Micrococcus luteus, Proteus vulgaris, and S. aureus, after 8 h of incubation at 2X MIC.
The antimicrobial activities of our formulation against S. Typhimurium ATCC 14028 and S. aureus ATCC 25923 were excellent at moderate to high temperatures (37 to 100 ℃), and under acidic conditions (pH 2 to 6), and remained stable up to 30 days under refrigerated storage conditions (Table 3). With increasing temperatures (37 ℃, 70 ℃, and 100 ℃), although significantly (p ≤ 0.05) decreasing trends were observed for ZOI in both bacteria, the formulation remained effective at all temperatures. Therefore, its use as a food preservative would be highly advantageous, as temperature plays a paramount role in food processing and preservation. The formulation showed high pH stability and strong antimicrobial activity at acidic pH (2, 4, and 6), but lost activity at basic pH (8). Possible reasons for loss of antibacterial activity at alkaline pH (8.0) include degradation of natural bioactive compounds and alterations in ionization states, leading to decreased solubility of the active compounds and reduced interaction with target bacterial cells [56]. In addition, higher pH conditions could accelerate the degradation of phenolic and other bioactive compounds, thereby reducing functional activity. The highest activity was recorded at pH 4, and no significant (p > 0.05) differences in ZOI were observed at pH 4 and pH 6 for both selected bacteria, indicating that the formulation retained substantial activity across a mildly acidic range. This suggests its suitability for use in acidic animal-origin foods such as meat, fish, and milk-based products, where maintaining a lower pH can support antimicrobial performance and improve product safety. Significant (p ≤ 0.05) differences in ZOI of the formulation were observed against S. Typhimurium ATCC 14028, and non-significant (p > 0.05) differences in ZOI for S. aureus ATCC 25923 between 0-day and 15-day storage at 4 ± 1℃. Although there were significant (p < 0.05) differences in the ZOI against the test bacteria on day 0 and day 30 of refrigerated storage (4 ± 1℃), appreciable antimicrobial activity was still observed on day 30. These results suggest that our formulation was stable under refrigerated storage and would be an attractive biopreservative and colorant in chilled foods.
In our previous study, it was also reported that the antimicrobial activity of ratanjot root extract was stable at varying temperatures (37-100 ℃), pH conditions (2-6), and storage at refrigerated (4 ± 1 ℃) conditions up to 30 days [17]. Similar stability assays to assess antimicrobial activity under varying conditions were conducted by Das et al. (2021) for a crude extract from Indian curd against B. cereus and S. Typhimurium, and by Prasastha Ram [54] for green-synthesized nanosilver with entrapped cinnamaldehyde against MDR enteroaggregative E. coli.
3.2.7. Hemolysis Assay
An in vitro hemolysis assay is a simple, cost-effective alternative to assess the safety of phytochemicals on mammalian cells before recommending their use in human food and/or medicine [58]. If the hemolysis induced by a plant extract exceeds 30%, it is considered hazardous to red blood cells (RBCs) [59]. The results (Figure 5) show significant differences (p ≤ 0.05) in the degree of hemolysis caused by our formulation compared to the positive control (Triton X-100), which showed complete (100%) hemolysis with sheep RBCs. However, no (0%) hemolysis was observed at lower concentrations (1X, 2X, and 3X MIC of SA), and negligible (<0.015% and <0.37%) at higher concentrations (4X and 5X MIC of SA), indicating it is safe for human consumption. The anti-hemolytic properties of plant extracts might be due to their phenolic contents exerting antioxidant activity on RBC membrane rupture [60]. Similar anti-hemolytic activities of phytochemicals or extracts from several plants, such as Portulacaria afra [59] and mangrove plants [60] have also been reported.
3.2.8. Effect on Probiotics
The probiotic safety evaluation of our formulation demonstrated negligible inhibitory effects on beneficial gut lactobacilli (Figure 6A). L. casei MTCC 1423 and L. plantarum MTCC 2621 maintained high mean viable counts when exposed to both 1X MIC and 2X MIC treatments, with values (9.27 ± 0.33 and 9.14 ± 0.21 log CFU/mL for L. casei; 9.40 ± 0.31 and 9.23 ± 0.19 log CFU/mL for L. plantarum), comparable to the positive control (9.31 ± 0.24 and 9.44 ± 0.21 log CFU/mL), respectively. Statistical analysis indicated no significant (p > 0.05) reduction in growth at 1X MIC, while only a marginal decrease was observed at 2X MIC, confirming that the formulation does not adversely affect probiotic viability.
The findings of this study clearly indicate selective inhibition of our formulation against the potentially harmful foodborne pathogenic bacteria, while sparing probiotic lactobacilli, a critical property for functional food applications, as it supports host gut health and microbial balance [61]. In fact, the phytochemical constituents of our formulation, including antioxidant dietary fibers, flavonoids, and phenolic compounds, may act as prebiotics and play a crucial role in promoting the growth and activity of probiotic gut lactobacilli [62], exerting a positive impact on host health. Such dual functionality, antimicrobial selectivity coupled with probiotic compatibility, makes it an ideal “clean-label” or natural alternative to chemical additives.
Similar non-inhibitory or growth-promoting effects have been reported for plant extracts such as Achillea millefolium L. (yarrow) herb extract [62], Cannabis sativa L. or hemp seed extracts [61], and Sesbania grandiflora or agasti flower extract [63]. These studies collectively confirmed that phytochemical-rich formulations can simultaneously suppress pathogenic bacteria while sustaining or even promoting probiotic populations such as L. plantarum, L. acidophilus, Lacticaseibacillus rhamnosus, Bifidobacterium bifidum, and probiotic yeasts.
3.2.8. Vero Cell Proliferation and Viability Assay
An MTT assay for cell proliferation and viability was conducted to assess the toxicity of a new phytochemical before incorporating it into food systems. The mean % Vero cell viability for our formulation (2.5% - 10%, w/v) ranged from 86.15 to 95.80% (Figure 6B). Further, only small amounts of cell death were observed in a dose-dependent manner after 24 h of incubation. On the other hand, the positive control (500 µM H2O2) and negative control yielded 3.48% and 100% cell viability, respectively, suggesting it is non-toxic to mammalian cells. Given this favorable safety profile at substantially higher test concentrations, the much lower level used in our chicken sausages (≤ 1% phytochemical formulation) is expected to pose no cytotoxic risk to consumers. Conducting an MTT assay, Das et al. [42] also found that clove EO nano-emulsion is safe for human use at 2.5- 100 µl/mL, even after 48 h of incubation. Several studies have also evaluated the cytotoxicity or safety aspects of different plants, such as Cassia surattensis [64] and Euphorbia helioscopia [65], using Vero cells in an MTT assay.
3.3. Quality Evaluation of Chicken Sausages
3.3.1. Expressible Water, Proximate Composition and Calorific Value
The expressible water is a measure of the water-holding capacity (WHC) of emulsion-based meat products. The lower the expressible water, the higher the product’s WHC [17]. The mean expressible water (%) of the control and our formulation-treated samples ranged from 22 to 25% (Table 4). Significantly (p ≤ 0.05) higher expressible water (%) was observed for C1 compared to C2 and other treated products, whereas T3B showed lower values than the other test groups, indicating its higher WHC. The reason might be greater water-binding by the phytochemical formulation in the treated sausages, compared to the control. These results agree with those of Das et al. [35] [25], who reported similar values for expressible water content in goat meat nuggets incorporated with moringa pods (19.25 - 21.85%) and in chicken meat balls with BEO (25.72 - 26.96%).
The % moisture, CP, CF, TA, and carbohydrate contents of the control and treated chicken sausages using our formulation were in the ranges of 66.02-67.24%, 15.30-16.07%, 12.14-13.04%, 2.09-2.32%, and 2.76-2.98%, respectively (Table 4). Conducting proximate composition analysis on emulsified pork sausages containing red beetroot powder as a natural nitrite substitute, Jin et al. [66] reported moisture (67.01-68.8%), CF (11.63-13.84%), crude ash (0.48-1.68%), and CP (17.13-17.58%). In another experiment, Šojić et al. [45] reported a slightly different proximate composition of moisture (31.5-35%), protein (22.9-28.9%), fat (31.1-37.4%), and ash (5-5.8%) for dry fermented sausages incorporated with sage EO as a nitrite replacer.
The mean calorific values of the control and treated chicken sausages using our formulation ranged from 182.72 to 193.09 kcal/100 g (Table 4). The treated sausages had lower calories than the control sausages due to substituting a portion of the meat with phytochemical combination powders, thereby making them healthier from a consumer health perspective. Similar to our study, Moirangthem et al. [67] also reported that the caloric values of duck meat sausages containing soy protein isolate and inulin were ranged from 165.94 to 180.00 kcal/100g. The differences in expressible water content, proximate composition, and calorific value among different meat products observed by various researchers could be attributed to differences in product formulations, ingredient amounts and types used, emulsion quality, cooking methods, etc. [68].
3.3.2. Thiobarbituric Acid Reactive Substances (TBARS) Values
The mean TBARS values (mg MDA/kg) for C1 and C2 ranged from 0.287 to 2.031 and 0.286 to 1.051, respectively, whereas the mean values for phytochemical formulation-treated chicken sausages were T1B (0.278-0.941), T2B (0.281-0.773), and T3B (0.280-0.761). With the advancement of storage days, there were significant increments (p ≤ 0.05) in mean TBARS values of the chicken sausages (Table 5). This might be due to lipid oxidation and the production of volatile metabolites in the presence of oxygen under aerobic packaging conditions [36]. However, the rate of increase in TBARS values of the sausages (T1B, T2B and T3B) was slower, which might be due to the high phenolic content and antioxidant activity of the phytochemical formulation [36]. Furthermore, the mean TBARS values of the treated sausages remained below the acceptable level (1-2 mg MDA/kg) throughout the storage period [25]. These findings are consistent with the results of Huang et al. [69], who reported an increasing trend of TBARS values in control (0.16-1.47, 0.71-2.05) and treated cured meat (0.35-1.46) with nitrite substitutes like Monascus color, beet red, nisin, and starter cultures of L. fermentum RC4 and L. plantarum B6 during 20 days of refrigerated storage. Jin et al. [70] also reported an increase in TBARS value (0.62-1.52 mg MDA/kg) of pork sausages, prepared with a combination of 0.04% paprika powder and 0.03% blueberry powder as a natural nitrite replacer during 4 weeks of refrigerated storage.
3.3.3. Residual Nitrite (RN) Content
The RN contents (mg/kg) of the control and our formulation-treated chicken sausages (Table 5) show that the ranges of mean RN contents (mg/kg) of C2, T1B, and T2B are 80.35-46.95, 47.14-26.46, and 31.10-16.03, respectively. The nitrite contents were within the maximum permissible limit of 80 mg/kg for comminuted, processed meat products, as set by the Codex Alimentarius Commission [71]. As no pink color development was evident in the reaction mixture containing C1 and T3B samples, it was considered that no nitrite was detected in those samples. This might be due to the lack of sodium nitrite in the formulation, the absence of nitrite contamination during product processing [14], and the absence of nitrite in the individual ingredients, such as the phytochemical combination and chicken meat due to improved feeding and management [8]. Significantly (p ≤ 0.05) lower RN contents were obtained for treated sausages (T1B, and T2B) as compared to a positive control (C2), which could be due to the reaction of highly reactive nitrite with different bioactive compounds (polyphenols, flavonoids, terpenes, etc.) present in the phytochemical combinations [5]. Further, the lower RN values in sausages than in the added nitrite might be due to losses during processing and to the reaction of chemical nitrite with meat proteins, lipids, myoglobin, and other constituents [72], as well as oxidation to nitrate, utilization by microbes and enzymes, etc. [5].
These results are in complete agreement with Šojić et al. [5], who reported no RN in the control pork sausages, 45-20 mg/kg RN in cooked pork sausages prepared with different concentrations of CEO and 50 mg/kg added nitrite, and 90-25 mg/kg RN in pork sausages with 100 mg/kg added nitrite during 60 days of storage at 4 ℃. These findings also bear similarity with those of Ozaki et al. (Ozaki et al. 2021a), who reported no RN content in control, sausages treated with 0.5% beetroot powder, significantly (p ≤ 0.05) lowered RN content with 1% beetroot (7.75-1.48 mg/kg) or radish (17.11-9.9 mg/kg) powder treated sausages, as compared to the positive control C1 (93.15-1.19 mg/kg), and also observed a decreasing trend in RN content of sausages with advancement of processing for 35 days.
3.3.4. Shear Force Value
The mean shear force values (kgf/cm2) for C1, C2, T1B, T2B and T3B were 1.88-1.44, 1.85-1.58, 1.84-1.59, 1.81-1.64, and 1.80-1.64, respectively, from day 0 to day 20 of storage (Table 5). Although a decreasing trend was observed throughout the storage period, significant differences (p ≤ 0.05) were observed between the control and treated sausages. The C1 sample had significantly higher (p ≤ 0.05) values during the initial storage days, indicating greater hardness. However, during the latter part of storage, significantly (p ≤ 0.05) lower shear force values were obtained, which might be due to the development of softness and poor texture resulting from microbial and enzymatic decomposition. In a study, Xin et al. [2] reported decreasing trends in shear force (N) values of cured mutton samples during refrigerated storage from day 0 to day 15, when PP extract and LEO were used as natural nitrite replacers. In partial agreement with our results, increased shear force values due to the addition of dried carrot pomace in chicken sausages (5.01-5.39 N) during a 15-day storage study have also been reported [73].
3.3.5. Total Pigment, Cured Pigment, and Curing Efficiency
The cured meat pigment, total pigment, and curing efficiency of the test chicken sausages are summarized in Table 5. The values for total pigment ranged from 65.84 to 95.26 mg/kg and from 50.25 to 84.03 mg/kg on day 0 and day 20 of storage, respectively. However, the sausages treated with our formulation had significantly higher (p ≤ 0.05) total pigment levels than the control, which could be attributed to the excellent colorimetric properties of the phytochemical combinations.
The cured pigment levels in the control and treated sausages using our formulation ranged from 16.41 to 7.63 mg/kg on day 0 and from 5.59 to 49.34 mg/kg on day 20 of storage. As expected, the lowest (p ≤ 0.05) cured pigment was observed in a negative control (C1) and the highest (p ≤ 0.05) for the positive control containing 150 ppm nitrite (C2). The probable reason for the small amounts of cured pigment observed in nitrite-free sausage samples (C1 and T3B) could be attributed to some amount of cured pigment formation by other salts like sodium chloride (common salt), sodium tripolyphosphate used in the formulation, and to some complex biochemical reactions during product processing and storage. In previously conducted studies, cured pigments were also detected in fermented sausages, even without the addition of nitrite [14,74]. The reason could be that the nitroso pigment (nitrosohemochrome), formed by the reaction of nitrous oxide (NO) and myoglobin in meat at pH 5-6.5, is the principal cured pigment and responsible for the characteristic reddish-pink color of cured meat products [75].
Curing efficiency measures the conversion of total pigments to cured or nitroso pigments, and a higher conversion rate implies greater redness [74]. The mean curing efficiency (%) of the test sausages ranged from 6.65% to 69.42% on day 0 and day 20 of storage, respectively. The chicken sausage group (C2) had significantly higher (p ≤ 0.05) curing efficiency, primarily due to the addition of sodium nitrite, which is known to drive curing efficiency. Generally, well-cured meat using chemical nitrite has a curing efficiency of ≥ 80% [76]. However, a slightly lower value (69.15 - 69.73%) than for well-cured meat was obtained for sausage containing 150 ppm nitrite (C2) throughout storage. On the other hand, significantly lower (p ≤ 0.05) curing efficiencies were recorded for T3B and C1, which might be due to the absence of chemical nitrite. In these nitrite-free formulations, the phytochemical formulation’s intrinsic color likely contributed to the observed red hue, thereby influencing the apparent cured color development in T3B and C1 sausages [14]. Overall, there was a decrease in cured and total pigments and in curing efficiency with increasing storage days, which could be attributed to lipid-protein oxidation, oxygen presence, and microbial activity leading to color fading [14].
These results partially agree with the findings of Ozaki et al. [14], who reported similar cured pigment (3.84-53.94 kg/mg and 6.53-33.21 kg/mg), total pigment (66.30-264.52 mg/kg and 84.83-265.71 mg/kg) and curing efficiency (11.01-26.45% and 9.35-27.67%) in fermented dry sausages using beetroot and radish powders as natural nitrite replacers with the advancement of processing and storage days. The study conducted by Serdaroğlu et al. [74] also reported nearly similar cured pigment (24.77-157.66 ppm), total pigment (109.35-197.17 ppm), and curing efficiency (22.65-83.52%) for control and treated fermented sausages, using arugula leaves extract and barberry extract as natural nitrite substitutes.
3.4. Microbiological Qualities of Sausages
3.4.1. Total Viable Count (TVC)
TVC measures the live mesophilic bacterial load under aerobic conditions and is an important indicator of a product’s overall microbiological quality [17]. In this study, significant differences (p ≤ 0.05) in TVC were observed between treated and control samples, and an increasing trend in microbial growth was observed with increasing storage days (Table 6). The mean TVC (log CFU/g) of the control (C1=1.58- 4.65, C2=1.41-4.13) and treated chicken sausages using our formulation (T1B=1.38 -3.81, T2B=1.30-3.69, T3B =1.28-3.52) from day 0 to day 20 of refrigerated storage are summarized in Table 6. On day 20, the microbial counts in the control cooked chicken sausages crossed the acceptable limits for TVC (3-4 log10 CFU/g), as per the FSSAI [77] standards. However, treated cooked chicken sausages remained microbiologically safe and acceptable for up to 20 days, which might be attributed to the strong antimicrobial activity of the phytochemical formulation, including polyphenols, flavonoids, and tannins. Similar to our findings, Ozaki et al. [14] reported reduced counts of mesophilic bacteria in fermented dry sausages treated with 0.5% radish powder, as natural nitrite replacers. Several researchers have also reported lower TVC in various meat products containing natural nitrite replacers during storage and processing [5,34,78], compared with the control.
3.4.2. Psychrophilic Bacterial Count
The mean psychrophilic counts (log CFU/g) of the control (C1=1.21-3.56, C2=1.29-2.41), sausages treated with phytochemical formulation (T1B=1.17-1.94, T2B=1.45, T3B=1.24) are summarized in Table 6. During the initial days (0 and 5), psychrophilic counts were below the limit of detection in all groups, probably due to the efficacy of heat treatment during processing. Thereafter, an increasing trend in psychrophile growth was observed from day 10 onwards in C1 and from day 15 onwards in T1B, which could be attributed to these organisms’ growth preference at refrigeration temperatures during storage. However, lower psychrophilic counts in the treated chicken sausages compared to the control might be due to the phytochemical formulation’s lower pH and antimicrobial activity, making the conditions unfavorable for psychrophile growth.
3.4.3. Coliform Count
No coliforms were detected in any of the sausage samples throughout the storage period, suggesting the absence of fecal contamination during processing and storage [79]. Similar to our findings, no coliforms were reported in chicken fingers coated with clove, cinnamon, and thyme EO nanoemulsions [49], or in chicken nuggets with pomegranate seed powder, grape seed extract, and tomato powder [79] throughout the storage period. In contrast to our findings, higher coliform counts (< 3 log CFU/g) were reported in control and treated fermented dry sausages with radish and beetroot as natural nitrite replacers [14].
3.4.4. Staphylococcus aureus Count
The S. aureus count of a food product is indicative of contamination from food handlers and inadequately cleaned food contact surfaces [80]. The mean S. aureus counts (log CFU/g) of the control sausages (C1=1.30-2.55, C2=1.19-2.0), and our formulation-treated sausages (T1B=1.04-1.78, T2B=1.51, T3B=1.34) are presented in Table 6. S. aureus was not detected during the initial days of storage. On day 15, control chicken sausages exceeded the maximum limit for S. aureus count (1-2 log10 CFU/g), as set by the Food Safety and Standards Authority of India (FSSAI) [77]. The treated sausages contained S. aureus within acceptable limits at the end of storage, attributable to the antimicrobial activity of our formulation. These results are consistent with the findings of Ibrahim et al. [80] who reported similar S. aureus counts for chicken nuggets (1.6 x 10³ CFU/g) and chicken shawarma (1.97 x 10³ CFU/g). In contrast to our results, Huang et al. [69] detected no S. aureus in no-added-nitrite cured meat using natural nitrite substitutes.
3.5. Sensory Attributes of Sausages
Sensory attributes play an important role in determining the consumer acceptance of a new food product [35,49]. In fact, the scores for color and appearance, flavor, texture and tenderness, and juiciness of products are indicative of either freshness or the extent of spoilage during storage due to microbial action, lipid and protein degradation, or loss of moisture, etc. [81]. The sensory quality attributes, such as color (7.3-4.9), flavor (7.4-4.8), texture and tenderness (7.5-5.4), juiciness (7.5-5.4), and overall acceptability (7.4-4.9) for the control and treated chicken sausages during storage are tabulated in Table 7.
Significant differences (p ≤ 0.05) in color and appearance scores of C1 and T3B sausages were noticed from day 5 onwards, and in the case of the others, from day 10 onwards. Among the treatments, T3B showed lower color and appearance scores, as the sausages developed an atypical or slightly darker color after cooking due to higher concentrations of our formulation. In contrast, T2B and T1B obtained significantly higher color and appearance scores (p ≤ 0.05), reflecting the colorimetric properties of the phytochemical combinations. Flavor scores revealed that the treated sausages (T1B, T2B, T3B) obtained significantly higher scores (p ≤ 0.05) than the controls (C1, C2). Among the treatments, T2B had significantly higher flavor scores (p ≤ 0.05). Significant differences (p ≤ 0.05) in flavor scores of the test sausages were observed from day 10.
Significant differences (p ≤ 0.05) in texture and tenderness scores of the control and treated sausages were observed from day 10 onwards. These scores correlate with shear force values (Table 5); sausage samples with higher shear force values had better texture and tenderness scores. The treated sausages (T1B, T2B, T3B) had significantly higher juiciness scores (p ≤ 0.05) than the controls (C1, C2). During storage, a significant (p ≤ 0.05) decrease in mean juiciness scores was observed from day 10 onwards for both treated and control (C1) samples.
The overall acceptability scores for C1 (7.1 - 4.9), C2 (7.4 - 5.9), T1B (7.3 - 6), T2B (7.4 - 6) and T3B (7.1 - 5.4) from day 0 and day 20 of refrigerated storage revealed significant (p ≤ 0.05) differences in acceptance of control and treated sausages. Significant differences (p ≤ 0.05) in overall acceptability scores of the test sausages were markedly observed from day 5 and, for some (T2B and T3B) sausages, from day 10 onwards. The overall acceptability scores for T3B were significantly (p ≤ 0.05) lower than those of C2 and other treatments, but higher than those of C1. This is mainly due to the product’s atypical, darker color, which resulted in lower color and appearance scores. C1 obtained significantly lower scores (p ≤0.05) than other test sausages during storage. T2B and T1B obtained significantly (p ≤ 0.05) better overall acceptability scores than other sausages on day 20 of storage. Incorporation of our formulation did not adversely affect the acceptability of the chicken sausages, except at higher concentration (T3B), where an atypical color was seen.
These findings are corroborated by the report of Serdaroğlu et al. [74], who found no difference in overall acceptability of heat-treated fermented sausages using arugula leaf extract and barberry extract as natural nitrite substitutes, either in combination or separately. While using radish powder (0.5 and 1.0%) and oregano essential oil (100 mg/kg) as nitrite substitutes in fermented cooked sausages, Ozaki et al. [34] also noticed equal or even higher sensory acceptance and consumer preference of treated sausages than the control.
4. Conclusions
The current study contributes significantly to the existing, but limited, scientific literature on natural nitrite replacers, both globally and in India. This study demonstrated that the novel phytochemical formulation comprising roselle flower powder, moringa flower powder, and cinnamon essential oil in a ratio of 5.5:4:0.5 possessed excellent antioxidant, broad-spectrum antimicrobial, and appealing colorimetric properties. This natural preservative retained its antimicrobial activity and displayed excellent thermostability at varying temperatures (37 ℃, 70 ℃, and 100 ℃), acidic pH (2, 4, and 6) conditions, and offered stability up to 30 days under refrigerated (4 ± 1℃) conditions. Further, the formulation was found to be safe in a hemolysis assay with sheep erythrocytes and an MTT assay using Vero cells and had no or negligible negative impact on gut lactobacilli. Incorporation of our formulation (0.25%, 0.5%, and 1%) in chicken sausages alone, or in combination with chemical nitrite, to replace nitrite completely or partially, resulted in improvement in quality and shelf life of treated sausages under aerobic packaging during refrigerated (4 ± 1 ℃) storage for 20 days. Although complete nitrite replacement with natural preservatives significantly (p ≤ 0.05) improved the physico-chemical and microbiological qualities of the treated sausages, sensory color was compromised by the development of an atypical, darker color. Therefore, partial replacement of sodium nitrite (1/2-2/3rd, i.e., –75=100 ppm) by the natural preservative (formulation) described here is recommended. This study further suggests that a combination of plant ingredients with synergistic effects could be explored as green alternatives to sodium nitrite and other chemical preservatives to produce healthier and safer processed meat products with improved quality and shelf life.
Supplementary Materials
The following supporting information can be downloaded at the website of this paper posted on Preprints.org. Figure S1: Identification of phytochemical compounds in formulation using Gas chromatography–mass spectrometry (GC-MS); Table S1: Antimicrobial activity in terms of zone of inhibition (mm) for standardization and development of phytochemical formulation; Table S2: Identification of phytochemical compounds in the formulation using Gas chromatography–mass spectrometry (GC-MS), related to Figure S1.
Author Contributions
Annada Das: Writing—original draft, Methodology, Investigation. Subhasish Biswas: Writing—review & editing, Supervision, Funding acquisition. Kaushik Satyaprakash: Visualization, Methodology, Investigation. Dipanwita Bhattacharya: Investigation, Methodology. Pramod K. Nanda: Writing—review & editing. Gopal Patra: Validation, Resources, Data curation. Arun K Das: Writing—review & editing, Supervision, Funding acquisition, Conceptualization. Arun K Bhunia: Writing—review & editing, Supervision.
Data Availability Statement
All data are presented in the manuscript as primary or Supplementary.
Conflicts of Interest
The authors declare no conflicts of interest in this work.
Acknowledgments
The authors gratefully acknowledge the Dean, Faculty of Veterinary Sciences, West Bengal University of Animal and Fishery Sciences, Kolkata, India, and HoRC, Eastern Regional Station, ICAR-IVRI, Kolkata, for providing the facilities and institutional support necessary to carry out this study. AKB acknowledges funding from the US Department of Agriculture—National Institute of Food and Agriculture (NIFA) Hatch Accession No.1016249.
References
- Parthasarathy, D.K.; Bryan, N.S. Sodium nitrite: The “cure” for nitric oxide insufficiency. Meat Sci. 2012, 92, 274–279. [Google Scholar] [CrossRef] [PubMed]
- Xin, K.-Q.; Ji, X.-Y.; Guo, Z.; Han, L.; Yu, Q.-L.; Hu, B. Pitaya peel extract and lemon seed essential oil as effective sodium nitrite replacement in cured mutton. LWT 2022, 160. [Google Scholar] [CrossRef]
- Lee, S.; Lee, H.; Kim, S.; Lee, J.; Ha, J.; Choi, Y.; Oh, H.; Choi, K.-H.; Yoon, Y. Microbiological safety of processed meat products formulated with low nitrite concentration — A review. Asian-Australas. J. Anim. Sci. 2018, 31, 1073–1077. [Google Scholar] [CrossRef] [PubMed]
- Guéraud, F.; Buisson, C.; Promeyrat, A.; Naud, N.; Fouché, E.; Bézirard, V.; Dupuy, J.; Plaisancié, P.; Héliès-Toussaint, C.; Trouilh, L.; et al. Effects of sodium nitrite reduction, removal or replacement on cured and cooked meat for microbiological growth, food safety, colon ecosystem, and colorectal carcinogenesis in Fischer 344 rats. npj Sci. Food 2023, 7, 1–17. [Google Scholar] [CrossRef] [PubMed]
- Šojić, B.; Pavlić, B.; Ikonić, P.; Tomović, V.; Ikonić, B.; Zeković, Z.; Kocić-Tanackov, S.; Jokanović, M.; Škaljac, S.; Ivić, M. Coriander essential oil as natural food additive improves quality and safety of cooked pork sausages with different nitrite levels. Meat Sci. 2019, 157, 107879. [Google Scholar] [CrossRef] [PubMed]
- Šojić, B.; Pavlić, B.; Tomović, V.; Kocić-Tanackov, S.; Đurović, S.; Zeković, Z.; Belović, M.; Torbica, A.; Jokanović, M.; Urumović, N.; et al. Tomato pomace extract and organic peppermint essential oil as effective sodium nitrite replacement in cooked pork sausages. Food Chem. 2020, 330, 127202. [Google Scholar] [CrossRef] [PubMed]
- Shakil, M.H.; Trisha, A.T.; Rahman, M.; Talukdar, S.; Kobun, R.; Huda, N.; Zzaman, W. Nitrites in Cured Meats, Health Risk Issues, Alternatives to Nitrites: A Review. Foods 2022, 11, 3355. [Google Scholar] [CrossRef] [PubMed]
- Ferysiuk, K.; Wójciak, K.M. Reduction of Nitrite in Meat Products through the Application of Various Plant-Based Ingredients. Antioxidants 2020, 9, 711. [Google Scholar] [CrossRef] [PubMed]
- EU European Commission Regulation (EC). OJ L 354 31.12.2008, p. 16; No 1333/2008 of the European Parliament and of the Council of 16 December 2008 on Food Additives.
- Melios, S.; Harbourne, N.; Bolton, D.; Crofton, E. Exploring beliefs, intentions, and expectations towards cured meat alternatives: A qualitative analysis based on the theory of planned behaviour and product tasting. Futur. Foods 2026, 13. [Google Scholar] [CrossRef]
- Kim, M.; Bae, S.M.; Yoo, Y.; Park, J.; Jeong, J.Y. Clean-Label Strategies for the Replacement of Nitrite, Ascorbate, and Phosphate in Meat Products: A Review. Foods 2025, 14, 2442. [Google Scholar] [CrossRef] [PubMed]
- Guéraud, F.; Buisson, C.; Promeyrat, A.; Naud, N.; Fouché, E.; Bézirard, V.; Dupuy, J.; Plaisancié, P.; Héliès-Toussaint, C.; Trouilh, L.; et al. Effects of sodium nitrite reduction, removal or replacement on cured and cooked meat for microbiological growth, food safety, colon ecosystem, and colorectal carcinogenesis in Fischer 344 rats. npj Sci. Food 2023, 7, 1–17. [Google Scholar] [CrossRef] [PubMed]
- Liang, X.; Wu, Y.; Wang, F.; Wang, Y. Effects of partial replacement of nitrite with different fruit and vegetable powder on physicochemical and sensory aspects of fried beef meatballs. Int. Food Res. J. 2023, 30, 964–977. [Google Scholar] [CrossRef]
- Ozaki, M.M.; Munekata, P.E.S.; Jacinto-Valderrama, R.A.; Efraim, P.; Pateiro, M.; Lorenzo, J.M.; Pollonio, M.A.R. Beetroot and radish powders as natural nitrite source for fermented dry sausages. Meat Sci. 2021, 171, 108275. [Google Scholar] [CrossRef] [PubMed]
- Das, A.; Biswas, S.; Satyaprakash, K.; Teja, E.R.R.; Bhattacharya, D.; Sarkhel, S.P.; Patra, G.; Nanda, P.K.; Bagh, J.; Das, A.K. Exploring the synergistic effects of plant powders and essential oil combination on the quality, and structural integrity of chicken sausages during storage. Discov. Food 2025, 5, 1–22. [Google Scholar] [CrossRef]
- Sharma, P.; Wichaphon, J.; Klangpetch, W. Antimicrobial and antioxidant activities of defatted Moringa oleifera seed meal extract obtained by ultrasound-assisted extraction and application as a natural antimicrobial coating for raw chicken sausages. Int. J. Food Microbiol. 2020, 332, 108770. [Google Scholar] [CrossRef] [PubMed]
- Das, A.; Biswas, S.; Satyaprakash, K.; Bhattacharya, D.; Nanda, P.K.; Patra, G.; Moirangthem, S.; Nath, S.; Dhar, P.; Verma, A.K.; et al. Ratanjot (Alkanna tinctoria L.) Root Extract, Rich in Antioxidants, Exhibits Strong Antimicrobial Activity against Foodborne Pathogens and Is a Potential Food Preservative. Foods 2024, 13, 2254. [Google Scholar] [CrossRef] [PubMed]
- AOAC Official Methods of Analysis. Nitrites in Cured Meat.Official Method 973.31. In Official Methods of Analysis, 20th Ed. ed; Association of Official Analytical Chemists: Arlington, Va, 2016. [Google Scholar]
- Singleton, V.L.; Orthofer, R.; Lamuela-Raventós, R.M. Analysis of total phenols and other oxidation substrates and antioxidants by means of folin-ciocalteu reagent. Methods Enzymol. 1999, 299, 152–178. [Google Scholar] [CrossRef]
- Brand-Williams, W.; Cuvelier, M.E.; Berset, C. Use of a free radical method to evaluate antioxidant activity. LWT Food Sci. Technol. 1995, 28, 25–30. [Google Scholar] [CrossRef]
- Al-Owaisi, M.; Al-Hadiwi, N.; Alam Khan, S. GC-MS analysis, determination of total phenolics, flavonoid content and free radical scavenging activities of various crude extracts of Moringa peregrina (Forssk.) Fiori leaves. Asian Pac. J. Trop. Biomed. 2014, 4, 964–970. [Google Scholar] [CrossRef]
- Cristina, P.; M., P.; Bazerque, P. Antibiotic Assay by Agarwell Diffusion Method. Acta Biol. Med. Exp. 1990, 113–115. [Google Scholar]
- CLSI Performance Standards for Antimicrobial Susceptibility Testing. In CLSI Supplement M100, 28th Ed. ed.
- Miles, A.A.; Misra, S.S.; Irwin, J.O. The estimation of the bactericidal power of the blood. Epidemiol. Infect. 1938, 38, 732–749. [Google Scholar] [CrossRef] [PubMed]
- Das, J.K.; Chatterjee, N.; Pal, S.; Nanda, P.K.; Das, A.; Das, L.; Dhar, P.; Das, A.K. Effect of Bamboo Essential Oil on the Oxidative Stability, Microbial Attributes and Sensory Quality of Chicken Meatballs. Foods 2023, 12, 218. [Google Scholar] [CrossRef] [PubMed]
- Das, A.; Datta, S.; Mukherjee, S.; Bose, S.; Ghosh, S.; Dhar, P. Evaluation of antioxidative, antibacterial and probiotic growth stimulatory activities of Sesamum indicum honey containing phenolic compounds and lignans. LWT 2015, 61, 244–250. [Google Scholar] [CrossRef]
- Ebbensgaard, A.; Mordhorst, H.; Overgaard, M.T.; Nielsen, C.G.; Aarestrup, F.M.; Hansen, E.B. Comparative Evaluation of the Antimicrobial Activity of Different Antimicrobial Peptides against a Range of Pathogenic Bacteria. PLoS ONE 2015, 10, e0144611. [Google Scholar] [CrossRef] [PubMed]
- Jauregui, C.A.; Regenstein, J.M.; Baker, R.C. A Simple Centrifugal Method for Measuring Expressible Moisture, A Water-Binding Property of Muscle Foods. J. Food Sci. 1981, 46, 1271–1271. [Google Scholar] [CrossRef]
- Witte, V.C.; Krause, G.F.; Bailey, M.E. A new extraction method for determining 2-thiobarbituric acid values of pork and beef during storage. J. Food Sci. 1970, 35, 582–585. [Google Scholar] [CrossRef]
- Berry, B.W.; Stiffler, D.M. Effects of Electrical Stimulation, Boning Temperature, Formulation and Rate of Freezing on Sensory, Cooking, Chemical and Physical Properties of Ground Beef Patties. J. Food Sci. 1981, 46, 1103–1106. [Google Scholar] [CrossRef]
- Hornsey, H.C. The colour of cooked cured pork.I.—Estimation of the Nitric oxide-Haem Pigments. J. Sci. Food Agric. 1956, 7, 534–540. [Google Scholar] [CrossRef]
- Compendium of Methods for the Microbiological Examination of Foods; American Public Health Association: Washington, DC, United States; ISBN, 2015.
- Sharma, H.; Mendiratta, S.K.; Agrawal, R.K.; Talukder, S.; Kumar, S. Studies on the potential application of various blends of essential oils as antioxidant and antimicrobial preservatives in emulsion based chicken sausages. Br. Food J. 2018, 120, 1398–1411. [Google Scholar] [CrossRef]
- Ozaki, M.M.; dos Santos, M.; Ribeiro, W.O.; Ferreira, N.C.d.A.; Picone, C.S.F.; Domínguez, R.; Lorenzo, J.M.; Pollonio, M.A.R. Radish powder and oregano essential oil as nitrite substitutes in fermented cooked sausages. Food Res. Int. 2021, 140, 109855. [Google Scholar] [CrossRef] [PubMed]
- Das, A.; Biswas, S.; Nanda, P.K.; Chatterjee, N.; Pal, S.; Dhar, P.; Verma, A.K.; Bhattacharya, D.; Koshy, R.; Das, A.K. Moringa pod derived antioxidant dietary fibre as a quality enhancer in goat meat nuggets. Sustain. Food Technol. 2024, 2, 232–242. [Google Scholar] [CrossRef]
- Madane, P.; Das, A.K.; Pateiro, M.; Nanda, P.K.; Bandyopadhyay, S.; Jagtap, P.; Barba, F.J.; Shewalkar, A.; Maity, B.; Lorenzo, J.M. Drumstick (Moringa oleifera) Flower as an Antioxidant Dietary Fibre in Chicken Meat Nuggets. Foods 2019, 8, 307. [Google Scholar] [CrossRef] [PubMed]
- Vanawati, N.; Oktari, A.; Febriani, T. Evaluation of Roselle (Hibiscus sabdariffa L.) Calyx Extract Stability for Intestinal Nematode Egg Staining; CONFERENCE NAME, LOCATION OF CONFERENCE, COUNTRYDATE OF CONFERENCE; p. 012004.
- Becerra, L.D.; Quintanilla-Carvajal, M.X.; Escobar, S.; Ruiz, R.Y. Correlation between color parameters and bioactive compound content during cocoa seed transformation under controlled process conditions. Food Biosci. 2023, 53. [Google Scholar] [CrossRef]
- Bahadoran, Z.; Mirmiran, P.; Jeddi, S.; Azizi, F.; Ghasemi, A.; Hadaegh, F. Nitrate and nitrite content of vegetables, fruits, grains, legumes, dairy products, meats and processed meats. J. Food Compos. Anal. 2016, 51, 93–105. [Google Scholar] [CrossRef]
- Das, A.K.; Nanda, P.K.; Madane, P.; Biswas, S.; Das, A.; Zhang, W.; Lorenzo, J.M. A comprehensive review on antioxidant dietary fibre enriched meat-based functional foods. Trends Food Sci. Technol. 2020, 99, 323–336. [Google Scholar] [CrossRef]
- Aquilani, C.; Sirtori, F.; Flores, M.; Bozzi, R.; Lebret, B.; Pugliese, C. Effect of natural antioxidants from grape seed and chestnut in combination with hydroxytyrosol, as sodium nitrite substitutes in Cinta Senese dry-fermented sausages. Meat Sci. 2018, 145, 389–398. [Google Scholar] [CrossRef] [PubMed]
- Das, J.K.; Chatterjee, N.; Nanda, P.K.; Das, A.; Nath, S.; Pal, S.; Dhar, P.; Bandyopadhyay, S.; Verma, A.K.; Sen, A.; et al. Encapsulation and Delivery of Clove Essential Oil Using Nanoemulsions: Impact on the Physicochemical, Microbial, and Sensory Properties of Chicken Meatballs. Food Biophys. 2024, 19, 701–716. [Google Scholar] [CrossRef]
- Lang, Y.; Gao, N.; Zang, Z.; Meng, X.; Lin, Y.; Yang, S.; Yang, Y.; Jin, Z.; Li, B. Classification and antioxidant assays of polyphenols: a review. J. Futur. Foods 2023, 4, 193–204. [Google Scholar] [CrossRef]
- Chaves, N.; Santiago, A.; Alías, J.C. Quantification of the Antioxidant Activity of Plant Extracts: Analysis of Sensitivity and Hierarchization Based on the Method Used. Antioxidants 2020, 9, 76. [Google Scholar] [CrossRef] [PubMed]
- Šojić, B.; Tomović, V.; Savanović, J.; Kocić-Tanackov, S.; Pavlić, B.; Jokanović, M.; Milidrag, A.; Martinović, A.; Vujadinović, D.; Vukić, M. Sage (Salvia officinalis L.) Essential Oil as a Potential Replacement for Sodium Nitrite in Dry Fermented Sausages. Processes 2021, 9, 424. [Google Scholar] [CrossRef]
- Patra, J.K.; Baek, K.-H. Antibacterial Activity and Synergistic Antibacterial Potential of Biosynthesized Silver Nanoparticles against Foodborne Pathogenic Bacteria along with its Anticandidal and Antioxidant Effects. Front. Microbiol. 2017, 08, 167. [Google Scholar] [CrossRef] [PubMed]
- Lade, S.N.; Burle, S.S.; Kosalge, S.B.; Bansode, M.N. Antimicrobial and Antioxidant Activity of Hibiscus Sabdariffa. Linn (Roselle). Int. J. Pharm. Res. Dan Technol. 2022, 12, 22–27. [Google Scholar] [CrossRef]
- Sehgal, S.; Yadav, R.; Kumar, M.; Saji, H. Phytochemical Composition and Antimicrobial Activity of the Flower Extracts of Hibiscus Rosa Sinensis, Moringa Oleifera and Catharanthus Roseus A Web of Science Journal Phytochemical Screening and Antimicrobial Potential of the Flower Extracts of Hibiscu. Indian J. Appl. Pure Bio 2021, 36, 443–453. [Google Scholar]
- Sagar, N.A.; Agrawal, R.K.; Singh, R.; Talukder, S.; Kumar, R.R.; Mendiratta, S.K. Quality and shelf life assessment of steam-cooked chicken fingers coated with essential oil nanoemulsions. Food Biosci. 2022, 49. [Google Scholar] [CrossRef]
- Purkait, S.; Bhattacharya, A.; Bag, A.; Chattopadhyay, R.R. Synergistic antibacterial, antifungal and antioxidant efficacy of cinnamon and clove essential oils in combination. Arch. Microbiol. 2020, 202, 1439–1448. [Google Scholar] [CrossRef] [PubMed]
- Elshikh, M.; Ahmed, S.; Funston, S.; Dunlop, P.; McGaw, M.; Marchant, R.; Banat, I.M. Resazurin-based 96-well plate microdilution method for the determination of minimum inhibitory concentration of biosurfactants. Biotechnol. Lett. 2016, 38, 1015–1019. [Google Scholar] [CrossRef] [PubMed]
- Sharma, H.; Mendiratta, S.K.; Agrawal, R.K.; Gurunathan, K.; Kumar, S.; Singh, T.P. Use of Various Essential Oils as Bio Preservatives and Their Effect on the Quality of Vacuum Packaged Fresh Chicken Sausages under Frozen Conditions; Elsevier Ltd: Amsterdam, The Netherlands, 2017; Volume 81, ISSN ISBN 9189305159. [Google Scholar]
- Shen, Z.; Tang, C.M.; Liu, G.-Y. Towards a better understanding of antimicrobial resistance dissemination: what can be learnt from studying model conjugative plasmids? Mil. Med. Res. 2022, 9, 1–11. [Google Scholar] [CrossRef] [PubMed]
- Ram, V.P.; Yasur, J.; Abishad, P.; Unni, V.; Gourkhede, D.P.; Nishanth, M.A.D.; Niveditha, P.; Vergis, J.; Malik, S.V.S.; Kullaiah, B.; et al. Antimicrobial Efficacy of Green Synthesized Nanosilver with Entrapped Cinnamaldehyde against Multi-Drug-Resistant Enteroaggregative Escherichia coli in Galleria mellonella. Pharmaceutics 2022, 14, 1924. [Google Scholar] [CrossRef] [PubMed]
- Olajuyigbe, O.O.; Afolayan, A.J. In VitroAntibacterial and Time-Kill Evaluation of theErythrina caffraThunb. Extract against Bacteria Associated with Diarrhoea. Sci. World J. 2012, 2012, 1–8. [Google Scholar] [CrossRef] [PubMed]
- Gonelimali, F.D.; Lin, J.; Miao, W.; Xuan, J.; Charles, F.; Chen, M.; Hatab, S.R. Antimicrobial Properties and Mechanism of Action of Some Plant Extracts Against Food Pathogens and Spoilage Microorganisms. Front. Microbiol. 2018, 9, 1639. [Google Scholar] [CrossRef] [PubMed]
- Das, A.; Chauhan, G.; Agrawal, R.K.; Das, A.K.; Tomar, S.; Uddin, S.; Satyaprakash, K.; Pateiro, M.; Lorenzo, J.M. Characterization of crude extract prepared from Indian curd and its potential as a biopreservative. Food Sci. Technol. Int. 2020, 27, 313–325. [Google Scholar] [CrossRef] [PubMed]
- Selin, C.; Stietz, M.S.; Blanchard, J.E.; Gehrke, S.S.; Bernard, S.; Hall, D.G.; Brown, E.D.; Cardona, S.T. A Pipeline for Screening Small Molecules with Growth Inhibitory Activity against Burkholderia cenocepacia. PLoS ONE 2015, 10, e0128587. [Google Scholar] [CrossRef] [PubMed]
- Tabassum, S.; Ahmad, S.; Khan, K.U.R.; Tabassum, F.; Khursheed, A.; Zaman, Q.U.; Bukhari, N.A.; Alfagham, A.; Hatamleh, A.A.; Chen, Y. Phytochemical Profiling, Antioxidant, Anti-Inflammatory, Thrombolytic, Hemolytic Activity In Vitro and In Silico Potential of Portulacaria afra. Molecules 2022, 27, 2377. [Google Scholar] [CrossRef] [PubMed]
- Karim, A.; Islam, A.; Islam, M.; Rahman, S.; Sultana, S.; Biswas, S.; Hosen, M.J.; Mazumder, K.; Rahman, M.; Hasan, N. Evaluation of antioxidant, anti-hemolytic, cytotoxic effects and anti-bacterial activity of selected mangrove plants (Bruguiera gymnorrhiza and Heritiera littoralis) in Bangladesh. Clin. Phytoscience 2020, 6, 1–12. [Google Scholar] [CrossRef]
- Frassinetti, S.; Gabriele, M.; Moccia, E.; Longo, V.; Di Gioia, D. Antimicrobial and antibiofilm activity of Cannabis sativa L. seeds extract against Staphylococcus aureus and growth effects on probiotic Lactobacillus spp. LWT 2020, 124. [Google Scholar] [CrossRef]
- Milutinović, M.; Dimitrijević-Branković, S.; Rajilić-Stojanović, M. Plant Extracts Rich in Polyphenols as Potent Modulators in the Growth of Probiotic and Pathogenic Intestinal Microorganisms. Front. Nutr. 2021, 8, 688843. [Google Scholar] [CrossRef] [PubMed]
- China, R.; Mukherjee, S.; Sen, S.; Bose, S.; Datta, S.; Koley, H.; Ghosh, S.; Dhar, P. Antimicrobial activity of Sesbania grandiflora flower polyphenol extracts on some pathogenic bacteria and growth stimulatory effect on the probiotic organism Lactobacillus acidophilus. Microbiol. Res. 2012, 167, 500–506. [Google Scholar] [CrossRef] [PubMed]
- Kumar, U.; Seeta, U.; Jothy, S.L.; Kavitha, N.; Chen, Y.; Kanwar, J.R.; Sasidharan, S. Genoprotection and Cytotoxicity of Cassia surattensis Seed Extract on Vero Cell Evaluated by Comet and Cytotoxicity Assays. Proc. Natl. Acad. Sci. India Sect. B Biol. Sci. 2016, 88, 313–320. [Google Scholar] [CrossRef]
- Saleem, U.; Ahmad, B.; Ahmad, M.; Hussain, K.; Bukhari, N.I.; Anjum, A.A. Determination of Cytotoxicity of Latex and Methanol Extract of Euphorbia Helioscopia Leaves on Vero Cell Line with MTT Assay. Pak. J. Zool. 2014, 46, 741–745. [Google Scholar]
- Jin, S.-K.; Choi, J.-S.; Moon, S.-S.; Jeong, J.-Y.; Kim, G.-D. The Assessment of Red Beet as a Natural Colorant, and Evaluation of Quality Properties of Emulsified Pork Sausage Containing Red Beet Powder during Cold Storage. Korean J. Food Sci. Anim. Resour. 2014, 34, 472–481. [Google Scholar] [CrossRef] [PubMed]
- Moirangthem, S.; Laskar, S.; Das, A.; Upadhyay, S.; Hazarika, M.; Hazarika, R.; Mahanta, J. Effects of Soy Protein Isolate and Inulin on Physico-chemical and Organoleptic Qualities of Low-fat Duck Meat Sausages. Asian J. Dairy Food Res. 2022. [Google Scholar] [CrossRef]
- Kasaiyan, S.; Caro, I.; Ramos, D.; Salvá, B.; Carhuallanqui, A.; Dehnavi, M.; Mateo, J. Effects of the use of raw or cooked chickpeas and the sausage cooking time on the quality of a lamb-meat, olive-oil emulsion-type sausage. Meat Sci. 2023, 202, 109217. [Google Scholar] [CrossRef] [PubMed]
- Huang, L.; Zeng, X.; Sun, Z.; Wu, A.; He, J.; Dang, Y.; Pan, D. Production of a safe cured meat with low residual nitrite using nitrite substitutes. Meat Sci. 2020, 162, 108027. [Google Scholar] [CrossRef] [PubMed]
- Jin, S.-K.; Choi, J.S.; Yang, H.-S.; Park, T.-S.; Yim, D.-G. Natural curing agents as nitrite alternatives and their effects on the physicochemical, microbiological properties and sensory evaluation of sausages during storage. Meat Sci. 2018, 146, 34–40. [Google Scholar] [CrossRef] [PubMed]
- Codex Aliment. Int. Food Stand. FAO; General Standard for Food Additives CODEX STAN 192-1995. 2019; pp. 1–480.
- Jantapirak, S.; Vangnai, K.; Tumpanuvatr, T.; Jittanit, W. Effects of heating method, temperature, initial nitrite level, and storage time on residual nitrite, pigments, and curing efficiency of chicken sausages. Int. J. Food Prop. 2023, 26, 2186–2200. [Google Scholar] [CrossRef]
- Yadav, S.; Pathera, A.K.; Islam, R.U.; Malik, A.K.; Sharma, D.P. Effect of wheat bran and dried carrot pomace addition on quality characteristics of chicken sausage. Asian-Australas. J. Anim. Sci. 2018, 31, 729–737. [Google Scholar] [CrossRef] [PubMed]
- Serdaroğlu, M.; Can, H.; Sarı, B.; Kavuşan, H.S.; Yılmaz, F.M. Effects of natural nitrite sources from arugula and barberry extract on quality characteristic of heat-treated fermented sausages. Meat Sci. 2022, 198, 109090. [Google Scholar] [CrossRef] [PubMed]
- Pegg, R.; Honikel, K.O. Principles of Curing. In Handbook of Fermented Meat and Poultry, 2nd ed.; Toldrá, F., Hui, Y.H., Astiararan, I., Sebranek, J.G., Talon, R., Eds.; Wiley Blackwell: West Sussex, UK, 2015; pp. 19–30. [Google Scholar] [CrossRef]
- AMSA Meat Color Measurement Guidelines; American Meat Science Association: Champaign, IL, USA, 2012.
- FSSAI Microbiological Requirements, Version 1 (01.09.2023), Appendix B: Microbiological Requirements. New Delhi, 2023.
- Tomović, V.; Šojić, B.; Savanović, J.; Kocić-Tanackov, S.; Pavlić, B.; Jokanović, M.; Đorđević, V.; Parunović, N.; Martinović, A.; Vujadinović, D. New Formulation towards Healthier Meat Products: Juniperus communis L. Essential Oil as Alternative for Sodium Nitrite in Dry Fermented Sausages. Foods 2020, 9, 1066. [Google Scholar] [CrossRef] [PubMed]
- Kaur, S.; Kumar, S.; Bhat, Z.F.; Kumar, A. Effect of pomegranate seed powder, grape seed extract and tomato powder on the quality characteristics of chicken nuggets. Nutr. Food Sci. 2015, 45, 583–594. [Google Scholar] [CrossRef]
- Ibrahim, H.; Hassan, M.; Amin, R.; Shawky, N.; Elkoly, R. The Bacteriological Quality 0f Some Chicken Meat Products. Benha Veter-Med. J. 2018, 35, 50–57. [Google Scholar] [CrossRef]
- Taormina, P.J. Purposes and Principles of Shelf Life Determination. In Food Safety and Quality-Based Shelf Life of Perishable Foods; Springer International Publishing: Cham, 2021; pp. 1–26. [Google Scholar]
Figure 1.
Total phenolic content (A) and DPPH radical-scavenging activity (B) of phytochemical formulation as compared to standard chemical antioxidants. BHT: Butylated hydroxytoluene; BHA: Butylated hydroxyanisole.
Figure 1.
Total phenolic content (A) and DPPH radical-scavenging activity (B) of phytochemical formulation as compared to standard chemical antioxidants. BHT: Butylated hydroxytoluene; BHA: Butylated hydroxyanisole.
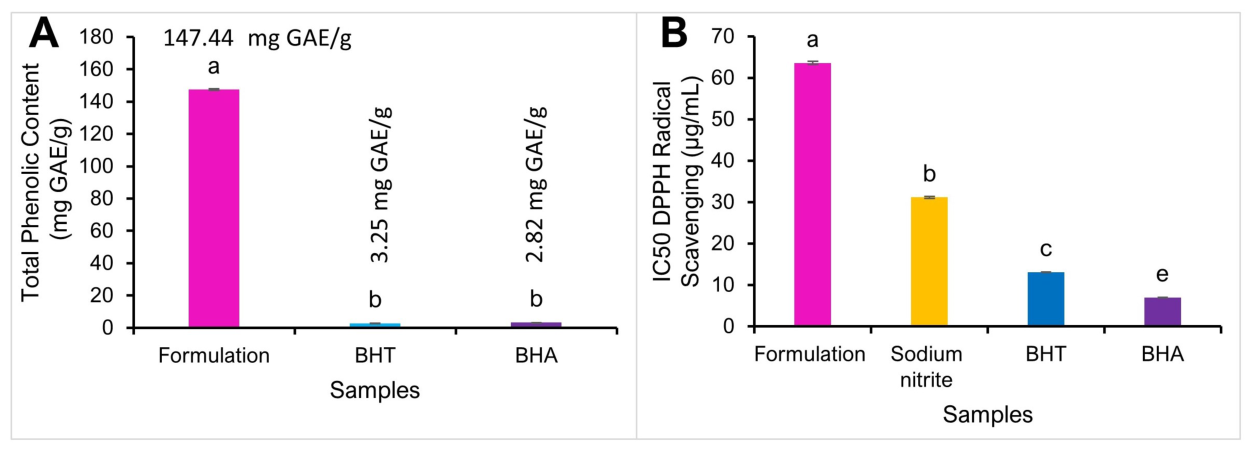
Figure 2.
Antimicrobial activity (zone of inhibition) of phytochemical formulation against foodborne pathogens.
Figure 2.
Antimicrobial activity (zone of inhibition) of phytochemical formulation against foodborne pathogens.
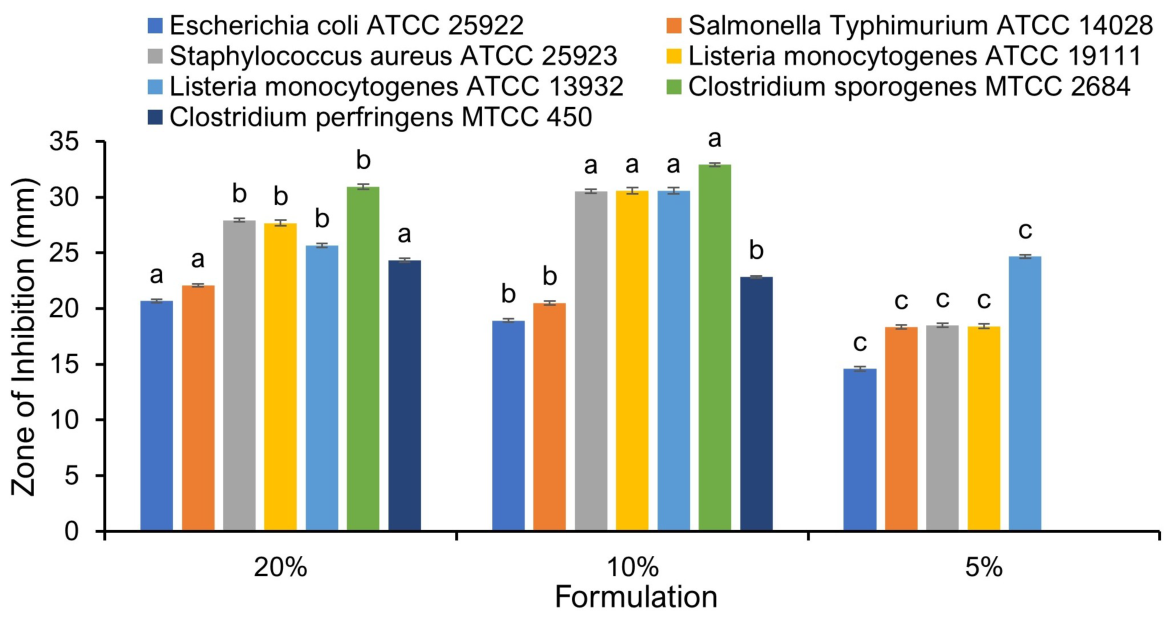
Figure 3.
Gel image showing the extent of bacterial genomic DNA (gDNA) and plasmid DNA (pUC19) damage by the phytochemical formulation.
Figure 3.
Gel image showing the extent of bacterial genomic DNA (gDNA) and plasmid DNA (pUC19) damage by the phytochemical formulation.
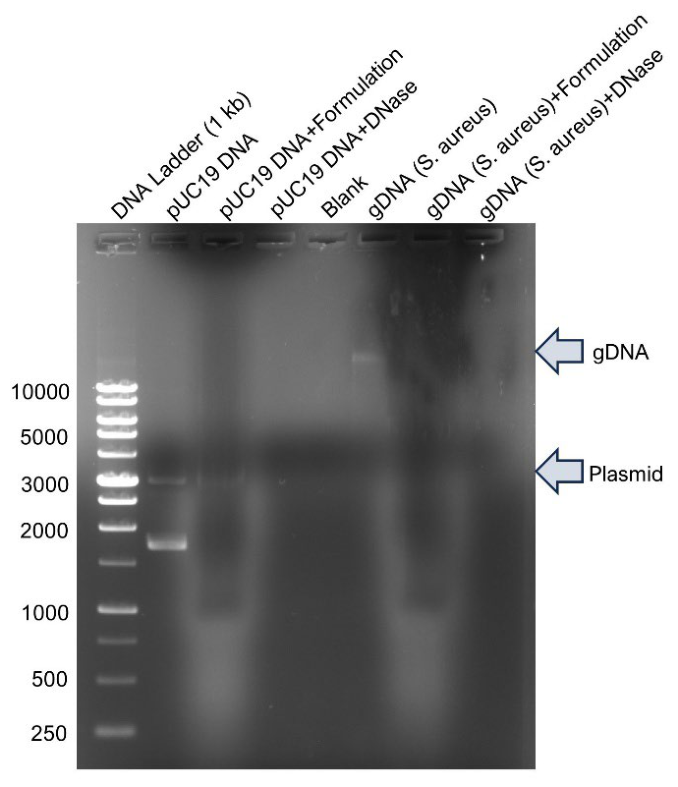
Figure 4.
Time-kill assay showing dose- and time-dependent growth kinetics of Staphylococcus aureus (SA, ATCC 25922) using the phytochemical formulation. .
Figure 4.
Time-kill assay showing dose- and time-dependent growth kinetics of Staphylococcus aureus (SA, ATCC 25922) using the phytochemical formulation. .
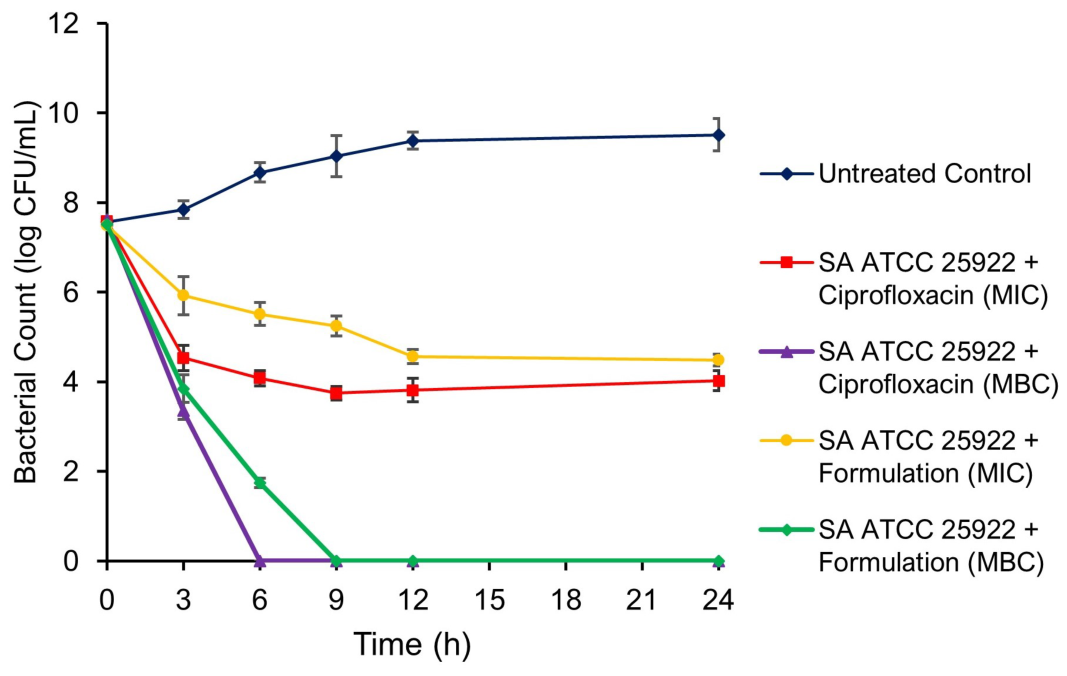
Figure 5.
Hemolysis assay of phytochemical formulation using 5% sheep red blood cells. Top panel, quantitative plot; bottom panel, corresponding photographs.
Figure 5.
Hemolysis assay of phytochemical formulation using 5% sheep red blood cells. Top panel, quantitative plot; bottom panel, corresponding photographs.
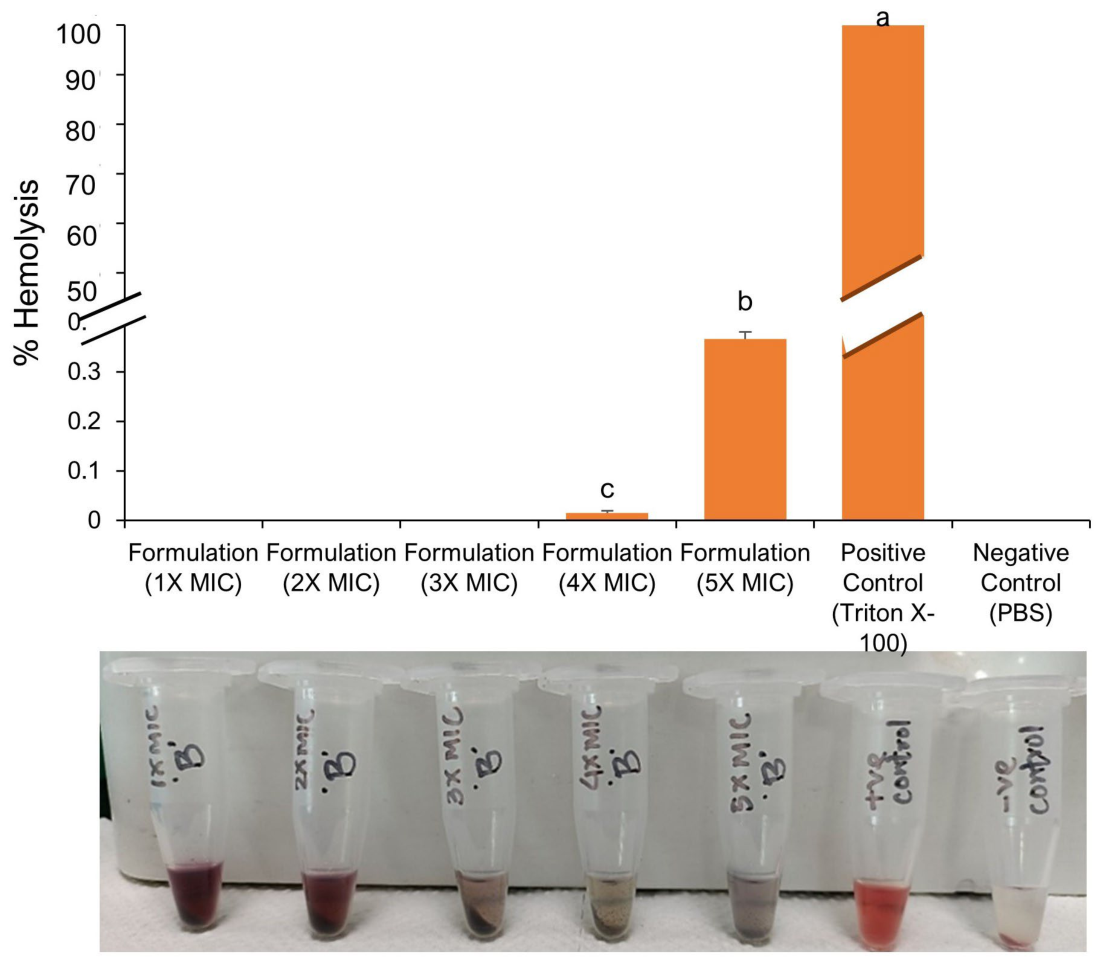
Figure 6.
Effect of phytochemical formulation on the growth of probiotic lactobacilli (A) and Vero cell viability (B) at different concentrations of formulation in the 3-(4.5-dimethylthiazolyl-2)-2, 5-diphenyltetrazolium bromide (MTT) assay.
Figure 6.
Effect of phytochemical formulation on the growth of probiotic lactobacilli (A) and Vero cell viability (B) at different concentrations of formulation in the 3-(4.5-dimethylthiazolyl-2)-2, 5-diphenyltetrazolium bromide (MTT) assay.
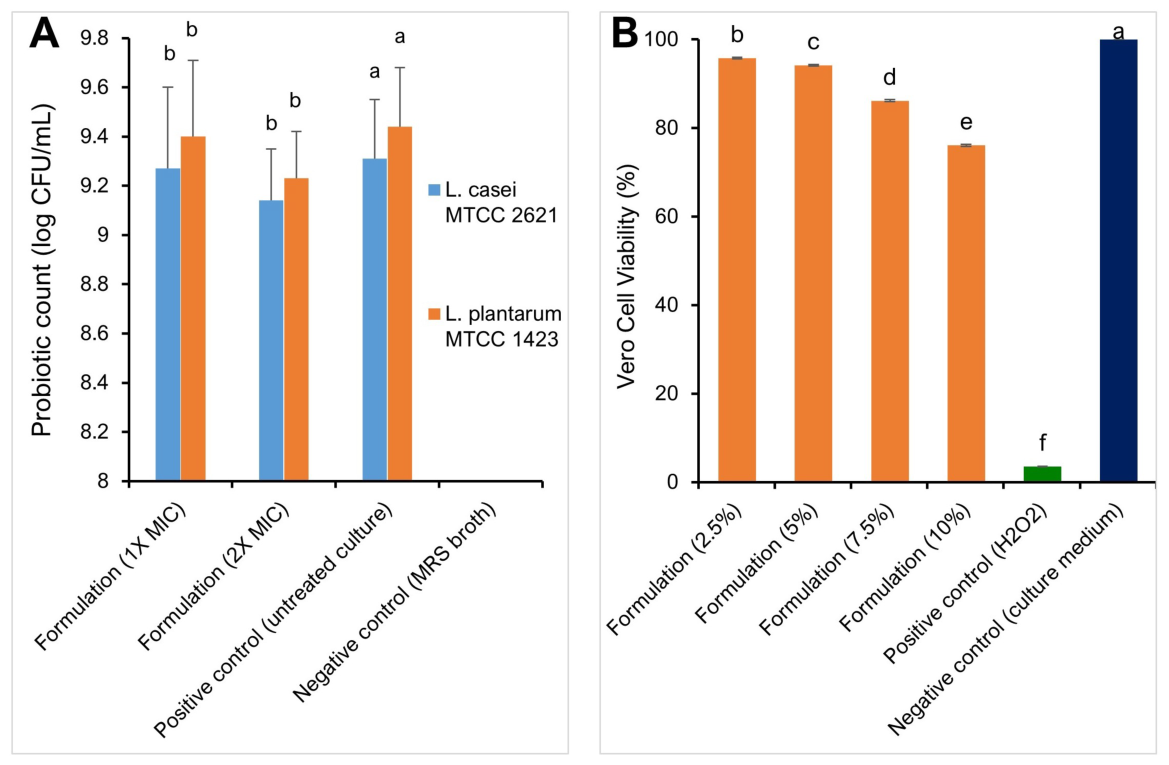

Table 1.
Total extractable components, pH, instrumental color, and residual nitrite content of phytochemical formulation.
Table 1.
Total extractable components, pH, instrumental color, and residual nitrite content of phytochemical formulation.
| Parameter | Phytochemical Formulation |
|---|---|
| TEC (%) | 26.79 ± 0.23 |
| pH | 3.28 ± 0.03 |
| Instrumental Color | |
| Lightness (L*) | 21.87 ± 0.39 |
| Redness (a*) | 19.88 ± 0.41 |
| Yellowness (b*) | 13.43 ± 0.31 |
| Hue angle (hab) | 6.20 ± 0.35 |
| Chroma (C*ab) | 25.01 ± 0.56 |
| RN content | Not Detected |
Values are average ± SEM. TEC: Total extractable components, RN: Residual nitrite.
Table 2.
Determination of MIC, MBC, and tolerance level of phytochemical formulation.
| Bacteria | Phytochemical formulation (RFP + MFP + CmEO) | Ciprofloxacin | ||||
|---|---|---|---|---|---|---|
| MIC (mg/mL) | MBC (mg/mL) | Tolerance level | MIC (mg/mL) | MBC (mg/mL) | Tolerance level | |
| EC 25922 | 0.390 ± 0.00b | 0.781 ± 0.00a | 2.00 ± 0.00 | 0.125 ± 0.00b | 0.250 ± 0.00b | 2.00 ± 0.00 |
| ST 14028 | 0.195 ± 0.00c | 0.195 ± 0.00b | 1.00 ± 0.00 | 0.125 ± 0.00b | 0.250 ± 0.00b | 2.00 ± 0.00 |
| SA 25923 | 0.781±0.00a | 0.781 ± 0.00a | 1.00 ± 0.00 | 0.250 ± 0.00a | 0.500 ± 0.00a | 2.00 ± 0.00 |
| LM 19111 | 0.781±0.00a | 0.781 ± 0.00a | 1.00 ± 0.00 | 0.250 ± 0.00a | 0.500 ± 0.00a | 2.00 ± 0.00 |
*Mean (n=6) ± SE bearing different superscript(s) in a column differ significantly (p ≤ 0.05). RFP: roselle flower powder, MFP: moringa flower powder; CmEO: cinnamon essential oil, EC: Escherichia coli; ST: Salmonella Typhimurium; SA: Staphylococcus aureus; LM: Listeria monocytogenes; MIC: minimum inhibitory concentration; MBC: minimum bactericidal concentration.
Table 3.
Stability assays showing antimicrobial activity of phytochemical formulation in terms of ZOI at varying temperatures, pH, and storage days.
Table 3.
Stability assays showing antimicrobial activity of phytochemical formulation in terms of ZOI at varying temperatures, pH, and storage days.
| Parameter | ZOI (mm) | |
|---|---|---|
| Salmonella Typhimurium ATCC 14028 | Staphylococcus aureus ATCC 25923 | |
| Temperature | ||
| 37℃ | 22.00 ± 0.26a | 28.67 ± 0.17a |
| 70℃ | 20.00 ± 0.22b | 27.00 ± 0.26b |
| 100℃ | 17.75 ± 0.17c | 23.83 ± 0.25c |
| pH | ||
| 2 | 19.50 ± 0.18c | 22.67 ± 0.25c |
| 4 | 20.83 ± 0.21b | 27.67 ± 0.21b |
| 6 | 21.75 ± 0.25a | 28.42 ± 0.15a |
| 8 | 0.00 ± 0.00d | 0.00 ± 0.00d |
| Storage days (4 ± 1℃) | ||
| 0 | 22.00 ± 0.26a | 28.67 ± 0.17a |
| 15 | 21.25 ± 0.17a | 28.33 ± 0.25a |
| 30 | 20.00 ± 0.26b | 27.25 ± 0.34b |
*Mean (n = 6) ± SE; bearing different superscripts in a column differ significantly (p ≤ 0.05). ZOI: Zone of inhibition.
Table 4.
Expressible water (%), proximate composition, and calorific value of control and chicken sausages treated with phytochemical formulation.
Table 4.
Expressible water (%), proximate composition, and calorific value of control and chicken sausages treated with phytochemical formulation.
| Treatments | Expressible Water (%) | Proximate Composition (%) | Calorific Value (kcal/100 g) | ||||
|---|---|---|---|---|---|---|---|
| Moisture (%) | Crude protein (%) | Crude fat (%) | Total ash (%) | Carbohydrate (%) | |||
| C1 (Negative control) | 25.00 ± 0.29a | 66.02 ± 0.12d | 16.07 ± 0.33a | 13.04 ± 0.19a | 2.09 ± 0.03c | 2.76 ± 0.03c | 193.09 ± 0.16a |
| C2 (Positive control) | 23.73 ± 0.13b | 66.02 ± 0.35d | 16.06 ± 0.16a | 13.03 ± 0.25a | 2.11 ± 0.09c | 2.76 ± 0.05c | 192.91 ± 0.14a |
| T1B | 23.86 ± 0.20b | 66.32 ± 0.36c | 16.03 ± 0.14a | 12.70 ± 0.18b | 2.13 ± 0.09c | 2.81 ± 0.05bc | 190.04 ± 0.20b |
| T2B | 22.78 ± 0.17c | 66.73 ± 0.52b | 15.76 ± 0.26b | 12.34 ± 0.19c | 2.23 ± 0.11b | 2.93 ± 0.05ab | 186.19 ± 0.15c |
| T3B | 22.00 ± 0.13c | 67.24 ± 0.31a | 15.30 ± 0.32b | 12.14 ± 0.20d | 2.32 ± 0.10a | 2.98 ± 0.05a | 182.72 ± 0.11d |
*Mean (n = 6) ± SE bearing different superscript(s) in a column differ significantly (p ≤ 0.05). C1: no sodium nitrite or phytochemical formulation (negative control); C2: 150 ppm sodium nitrite + no phytochemical formulation (positive control), T1B (Treatment 1 Blend): 75 ppm sodium nitrite + 0.25% phytochemical formulation; T2B (Treatment 2 Blend): 50 ppm sodium nitrite + 0.5% phytochemical formulation; T3B (Treatment 3 Blend): no sodium nitrite + 1% phytochemical formulation.
Table 5.
Physico-chemical quality changes in control and chicken sausages treated with phytochemical formulation during storage.
Table 5.
Physico-chemical quality changes in control and chicken sausages treated with phytochemical formulation during storage.
| Treatment | Day 0 | Day 5 | Day 10 | Day 15 | Day 20 | ||||
|---|---|---|---|---|---|---|---|---|---|
| TBARS value (mg MDA/kg) | |||||||||
| C1 | 0.287 ± 0.008D | 0.321 ± 0.006D | 0.510 ± 0.017aC | 1.019 ± 0.039aB | 2.031 ± 0.039aA | ||||
| C2 | 0.286 ± 0.009D | 0.313 ± 0.009D | 0.402 ± 0.023bC | 0.593 ± 0.009bB | 1.051 ± 0.025bA | ||||
| T1B | 0.278 ± 0.008D | 0.300 ± 0.005D | 0.391 ± 0.022bC | 0.498 ± 0.004cB | 0.941 ± 0.014cA | ||||
| T2B | 0.281 ± 0.009D | 0.303 ± 0.009D | 0.351 ± 0.016bC | 0.495 ± 0.012cB | 0.773 ± 0.018dA | ||||
| T3B | 0.280 ± 0.008D | 0.301 ± 0.009D | 0.343 ± 0.012bC | 0.484 ± 0.010cB | 0.761 ± 0.019dA | ||||
| RN content (mg/kg) | |||||||||
| C1 | N.D. | N.D. | N.D. | N.D. | N.D. | ||||
| C2 | 80.35 ± 0.19aA | 70.67 ± 0.35aB | 62.61 ± 0.13aC | 55.44 ± 0.56aC | 46.95 ± 0.18aD | ||||
| T1B | 47.14 ± 0.42bA | 42.18 ± 0.31bB | 34.12 ± 0.40bC | 29.68 ± 0.51bD | 26.46 ± 0.19bD | ||||
| T2B | 31.10 ± 0.36cA | 27.64 ± 0.24cA | 22.19 ± 0.34cB | 20.75 ± 0.50cB | 16.03 ± 0.52cC | ||||
| T3B | N.D. | N.D. | N.D. | N.D. | N.D. | ||||
| Shear force (kgf/cm2) | |||||||||
| C1 | 1.88 ± 0.008aA | 1.85 ± 0.008aA | 1.76 ± 0.010bB | 1.66 ± 0.007bC | 1.44 ± 0.008cD | ||||
| C2 | 1.85 ± 0.009bA | 1.84 ± 0.005aA | 1.80 ± 0.010aB | 1.66 ± 0.016bC | 1.58 ± 0.019bD | ||||
| T1B | 1.84 ± 0.008bA | 1.82 ± 0.006bAB | 1.79 ± 0.016abB | 1.68 ± 0.012bC | 1.59 ± 0.013bD | ||||
| T2B | 1.81 ± 0.007cA | 1.80 ± 0.005bcA | 1.76 ± 0.009bB | 1.72 ± 0.005aC | 1.64 ± 0.013aD | ||||
| T3B | 1.80 ± 0.010cA | 1.79 ± 0.005cA | 1.78 ± 0.007abA | 1.73 ± 0.010aB | 1.64 ± 0.013aC | ||||
| Cured pigments (mg/kg) | |||||||||
| C1 | 16.41 ± 0.04eA | 15.93 ± 0.04dB | 13.69 ± 0.12dC | 10.53 ± 0.13dD | 5.83 ± 0.02dE | ||||
| C2 | 57.63 ± 0.03aA | 57.76 ± 0.16aA | 56.40 ± 0.19aB | 53.88 ± 0.18aC | 49.34 ± 0.18aD | ||||
| T1B | 50.30 ± 0.02bB | 51.49 ± 0.03bA | 50.15 ± 0.03bC | 47.24 ± 0.03bD | 42.35 ± 0.04bE | ||||
| T2B | 40.78 ± 0.09cA | 41.24 ± 0.12cA | 40.08 ± 0.12cB | 37.29 ± 0.14cC | 31.22 ± 0.11cD | ||||
| T3B | 16.62 ± 0.04dA | 15.69 ± 0.05dB | 13.81 ± 0.05dC | 10.79 ± 0.03dD | 5.59 ± 0.01dE | ||||
| Total pigments (mg/kg) | |||||||||
| C1 | 65.84 ± 0.04eA | 63.54 ± 0.10eB | 60.77 ± 0.10eC | 56.49 ± 0.16eD | 50.25 ± 0.25eE | ||||
| C2 | 83.02 ± 0.17dA | 83.39 ± 0.15dA | 80.87 ± 0.11dB | 77.69 ± 0.08dC | 71.36 ± 0.04dD | ||||
| T1B | 85.31 ± 0.14cA | 85.01 ± 0.03cA | 83.93 ± 0.06cB | 81.00 ± 0.08cC | 75.69 ± 0.21cD | ||||
| T2B | 90.09 ± 0.18bB | 91.40 ± 0.15bA | 90.32 ± 0.15bB | 87.43 ± 0.29bC | 80.82 ± 0.14bD | ||||
| T3B | 95.26 ± 0.24aA | 94.19 ± 0.19aB | 92.30 ± 0.18aC | 89.13 ± 0.20aD | 84.03 ± 0.09aE | ||||
| Curing efficiency (%) | |||||||||
| C1 | 24.93 ± 0.06dA | 25.07 ± 0.03dA | 22.52 ± 0.16dB | 18.64 ± 0.19dC | 11.61 ± 0.05dD | ||||
| C2 | 69.42 ± 0.16a | 69.27 ± 0.29a | 69.73 ± 0.22a | 69.35 ± 0.19a | 69.15 ± 0.26a | ||||
| T1B | 58.96 ± 0.10bC | 60.57 ± 0.04bA | 59.76 ± 0.03bB | 58.33 ± 0.05bD | 55.95 ± 0.12bE | ||||
| T2B | 45.27 ± 0.04cA | 45.12 ± 0.06cA | 44.38 ± 0.06cB | 42.65 ± 0.06cC | 38.62 ± 0.07cD | ||||
| T3B | 17.45 ± 0.04eA | 16.66 ± 0.05eB | 14.96 ± 0.04eC | 12.11 ± 0.02eD | 6.65 ± 0.01eE | ||||
*Mean (n = 6) ± SE bearing different lower-case superscript(s) (a, b, c, d, ……) in a column and upper-case superscripts (A, B, C, D, E) in a row differ significantly (p ≤0.05). N.D.- Not Detected. C1: no sodium nitrite or phytochemical formulation (negative control); C2: 150 ppm sodium nitrite + no phytochemical formulation (positive control), T1B (Treatment 1 Blend): 75 ppm sodium nitrite + 0.25% phytochemical formulation, T2B (Treatment 2 Blend): 50 ppm sodium nitrite + 0.5% phytochemical formulation; T3B (Treatment 3 Blend): no sodium nitrite + 1% phytochemical formulation.
Table 6.
Microbiological quality changes in control and chicken sausages treated with phytochemical formulation during storage.
Table 6.
Microbiological quality changes in control and chicken sausages treated with phytochemical formulation during storage.
| Total Viable Counts (log CFU/g) | |||||
|---|---|---|---|---|---|
| Treatment | Day 0 | Day 5 | Day 10 | Day 15 | Day 20 |
| C1 | 1.58 ± 0.10aE | 1.98 ± 0.22aD | 2.77 ± 0.27aC | 3.55 ± 0.31aB | 4.65 ± 0.32aA |
| C2 | 1.41 ± 0.19bE | 1.79 ± 0.20bD | 2.45 ± 0.23bC | 3.22 ± 0.24bB | 4.13 ± 0.25bA |
| T1B | 1.38 ± 0.09bE | 1.71 ± 0.12cD | 2.23 ± 0.21cC | 3.08 ± 0.19cB | 3.81 ± 0.27cA |
| T2B | 1.30 ± 0.13cE | 1.50 ± 0.15dD | 2.19 ± 0.20cC | 2.88 ± 0.21dB | 3.69 ± 0.16dA |
| T3B | 1.28 ± 0.09cE | 1.47 ± 0.08dD | 2.04 ± 0.15dC | 2.69 ± 0.10eB | 3.52 ± 0.23eA |
| Psychrophile Counts (log CFU/g) | |||||
| C1 | ND | ND | 1.21 ± 0.03aC | 2.38 ± 0.08aB | 3.56 ± 0.07aA |
| C2 | ND | ND | ND | 1.29 ± 0.19bB | 2.41 ± 0.14bA |
| T1B | ND | ND | ND | 1.17 ± 0.21bB | 1.94 ± 0.23cA |
| T2B | ND | ND | ND | ND | 1.45 ± 0.21dA |
| T3B | ND | ND | ND | ND | 1.24 ± 0.17eA |
| Staphylococcus aureus Counts (log CFU/g) | |||||
| C1 | ND | ND | 1.30 ± 0.14aC | 2.19 ± 0.23bB | 2.55 ± 0.24aA |
| C2 | ND | ND | ND | 1.19 ± 0.16bB | 2.00 ± 0.28bA |
| T1B | ND | ND | ND | 1.04 ± 0.05cB | 1.78 ± 0.11cA |
| T2B | ND | ND | ND | ND | 1.51 ± 0.10dA |
| T3B | ND | ND | ND | ND | 1.34 ± 0.12eA |
*Mean (n = 6) ± SE marked with different superscript(s) (a, b, c, d, e) in a column and (A, B, C, D, E) in a row differ significantly (p ≤ 0.05). N.D.- Not Detected. C1: no sodium nitrite or phytochemical formulation (negative control); C2: 150 ppm nitrite + no phytochemical formulation (positive control), T1B (Treatment 1 Blend): 75 ppm sodium nitrite + 0.25% phytochemical formulation, T2B (Treatment 2 Blend): 50 ppm sodium nitrite + 0.5% phytochemical formulation; T3B (Treatment 3 Blend): no sodium nitrite + 1% phytochemical formulation.
Table 7.
Sensory quality changes in control and chicken sausages treated with phytochemical formulation during storage.
Table 7.
Sensory quality changes in control and chicken sausages treated with phytochemical formulation during storage.
| Color and Appearance | |||||
|---|---|---|---|---|---|
| Treatment | Day 0 | Day 5 | Day 10 | Day 15 | Day 20 |
| C1 | 7.0 ± 0.22bA | 6.9 ± 0.20bB | 6.1 ± 0.12bC | 5.6 ± 0.10dD | 4.9 ± 0.28dE |
| C2 | 7.3 ± 0.16aA | 7.3 ± 0.27aA | 7.1 ± 0.21aB | 6.7 ± 0.34bC | 5.9 ± 0.20bD |
| T1B | 7.3 ± 0.14aA | 7.3 ± 0.21aA | 7.0 ± 0.12aB | 6.8 ± 0.23aC | 6.3 ± 0.23aD |
| T2B | 7.3 ± 0.17aA | 7.4 ± 0.25aA | 7.1 ± 0.15aB | 6.8 ± 0.16aC | 6.3 ± 0.16aD |
| T3B | 6.7 ± 0.30cA | 6.6 ± 0.23cB | 6.2 ± 0.16bC | 5.8 ± 0.19cD | 5.2 ± 0.23cE |
| Flavor | |||||
| C1 | 7.1 ± 0.14cA | 7.1 ± 0.10cA | 6.6 ± 0.10cB | 5.8 ± 0.17cC | 4.8 ± 0.27cD |
| C2 | 7.3 ± 0.13abA | 7.3 ± 0.13aA | 6.9 ± 0.12aB | 6.4 ± 0.20aC | 5.7 ± 0.27aD |
| T1B | 7.3 ± 0.18abA | 7.3 ± 0.12aA | 6.9 ± 0.19aB | 6.3 ± 0.12bC | 5.7 ± 0.20aD |
| T2B | 7.4 ± 0.20aA | 7.3 ± 0.27aA | 6.9 ± 0.27aB | 6.4 ± 0.21aC | 5.8 ± 0.21aD |
| T3B | 7.3 ± 0.17bA | 7.2 ± 0.20bA | 6.8 ± 0.20bB | 6.3 ± 0.21bC | 5.6 ± 0.23bD |
| Texture and Tenderness | |||||
| C1 | 7.3 ± 0.09cA | 7.2 ± 0.09cB | 6.8 ± 0.14cC | 6.3 ± 0.21dD | 5.4 ± 0.29cE |
| C2 | 7.5 ± 0.09aA | 7.4 ± 0.10bB | 7.0 ± 0.10bC | 6.4 ± 0.10cD | 5.8 ± 0.16bE |
| T1B | 7.5 ± 0.10aA | 7.4 ± 0.12aA | 7.1 ± 0.18aB | 6.6 ± 0.12aC | 6.0 ± 0.12aD |
| T2B | 7.5 ± 0.15aA | 7.5 ± 0.22aA | 7.1 ± 0.21aB | 6.7 ± 0.23aC | 6.0 ± 0.22aD |
| T3B | 7.4 ± 0.12bA | 7.4 ± 0.19bA | 7.0 ± 0.26bB | 6.5 ± 0.22bC | 5.8 ± 0.24bD |
| Juiciness | |||||
| C1 | 7.3 ± 0.14bA | 7.2 ± 0.14cB | 6.8 ± 0.21cC | 6.3 ± 0.28cD | 5.4 ± 0.34cE |
| C2 | 7.3 ± 0.18bA | 7.3 ± 0.18bA | 7.1 ± 0.22bB | 6.7 ± 0.22bC | 6.0 ± 0.20bE |
| T1B | 7.5 ± 0.09aA | 7.4 ± 0.14bB | 7.1 ± 0.14bC | 6.7 ± 0.17bD | 6.1 ± 0.17bE |
| T2B | 7.5 ± 0.14aA | 7.5 ± 0.14aA | 7.1 ± 0.13bB | 6.7 ± 0.20bC | 6.1 ± 0.27bD |
| T3B | 7.5 ± 0.11aA | 7.5 ± 0.16aA | 7.2 ± 0.16aB | 6.8 ± 0.16aC | 6.2 ± 0.14aD |
| Overall acceptability | |||||
| C1 | 7.1 ± 0.15cA | 7.0 ± 0.21cA | 6.7 ± 0.31cB | 5.9 ± 0.42dC | 4.9 ± 0.42dD |
| C2 | 7.4 ± 0.15aA | 7.2 ± 0.21bB | 7.0 ± 0.25bC | 6.6 ± 0.32aD | 5.9 ± 0.27bE |
| T1B | 7.3 ± 0.19bA | 7.3 ± 0.24bA | 7.0 ± 0.24bB | 6.5 ± 0.18bC | 6.0 ± 0.14aD |
| T2B | 7.4 ± 0.12aA | 7.4 ± 0.15aA | 7.1 ± 0.20aB | 6.6 ± 0.16aC | 6.0 ± 0.23aD |
| T3B | 7.1 ± 0.15cA | 7.0 ± 0.15cB | 6.7 ± 0.16cC | 6.1 ± 0.16cD | 5.4 ± 0.13cE |
*Mean (n = 6) ± SE; bearing different lower-case superscripts (a, b, c, d, e……) in a column and upper-case superscripts (A, B, C, D, E) in a row differ significantly (p ≤ 0.05). C1: no sodium nitrite or phytochemical formulation; C2: 150 ppm sodium nitrite + no phytochemical formulation; T1B (Treatment 1 Blend): 75 ppm sodium nitrite + 0.25% phytochemical formulation; T2B (Treatment 2 Blend): 50 ppm sodium nitrite + 0.5% phytochemical formulation; T3B (Treatment 3 Blend): no sodium nitrite + 1% phytochemical formulation.
Disclaimer/Publisher’s Note: The statements, opinions and data contained in all publications are solely those of the individual author(s) and contributor(s) and not of MDPI and/or the editor(s). MDPI and/or the editor(s) disclaim responsibility for any injury to people or property resulting from any ideas, methods, instructions or products referred to in the content. |
© 2026 by the authors. Licensee MDPI, Basel, Switzerland. This article is an open access article distributed under the terms and conditions of the Creative Commons Attribution (CC BY) license (http://creativecommons.org/licenses/by/4.0/).
Copyright: This open access article is published under a Creative Commons CC BY 4.0 license, which permit the free download, distribution, and reuse, provided that the author and preprint are cited in any reuse.