

Submitted:
14 August 2026
Posted:
14 August 2026
You are already at the latest version
Abstract
Cover crops (CCs) are widely used to improve soil function, support water regulation, and moderate vine vigor. This study evaluated alternative vineyard floor management strategies designed to improve ecosystem services while minimizing excessive competition with grapevines under semiarid Mediterranean conditions. A long-term, three-season field experiment was conducted in Bekoa, Israel, using 4 treatments: standard-management control, selective herbicide promoting annual winter grasses, interrow tall fescue (Festuca arundinacea-TF), and full-TF ground cover. Unlike conventional perennial CCs, the selective herbicide treatment promoted naturally occurring winter grasses that completed their life cycle before the dry summer period, thereby limiting prolonged competition with grapevines. Vine water status, vegetative-growth, yield components, and wine-quality parameters were monitored. Grass-based treatments progressively reduced vegetative growth and induced moderate vine water stress, as reflected by lower leaf area index and more negative stem water-potential. Yield declined over the three growing seasons due to reductions in cluster number, with the strongest effects observed in perennial turfgrass. In contrast, the selective herbicide treatment consistently produced intermediate physiological and agronomic responses. In the third season, wines from the perennial turfgrass treatments exhibited greater color intensity, particularly under full-cover TF, while hue was not significantly affected. Overall, CC-based vineyard floor management affected vine performance and wine quality, but the response depended on cover-type and duration of use. The selective promotion of naturally occurring winter grasses through targeted herbicide application represents a practical vineyard floor management strategy that retains many of the benefits associated with vineyard floor vegetation while minimizing excessive summer water competition under Mediterranean conditions.
Keywords:
cover crops
; turf grass
; Festuca arundinacea
; selective herbicide
; vine water status
; grapevine performance
; wine quality
1. Introduction
Vineyard floor management plays a central role in sustainable viticulture, directly affecting soil physical properties, water dynamics, vine vigor, and ultimately, fruit and wine quality [1]. Under Mediterranean conditions, rainfall is concentrated in winter, while summers are hot and dry. As a result, ground-cover strategies must balance their potential benefits to soil health and ecosystem functioning against the risk of excessive competition for water and nutrients [2]. Many Mediterranean vineyards rely on regulated deficit irrigation and canopy management to achieve a desired balance between yield and quality. Therefore, any practice that affects soil water availability or vine vigor can lead to measurable changes in fruit composition and wine attributes. [3,4,5,6].
Cover crops (CCs) are defined as non-harvested plant species grown primarily to improve soil and agroecosystem performance. CCs have become an integral part of modern vineyard management and are typically placed between vine rows. Under controlled conditions, CCs are sometimes planted within the rows. Reported benefits include reduced surface runoff and erosion, improved soil structure and organic matter content, reduced weed competition, and enhanced beneficial microbial activity [7]. These benefits are particularly important in sloping or erosion-prone landscapes, where soil loss removes the upper horizon, which is richest in organic matter and nutrients. This soil loss can thus threaten the long-term productivity of a vineyard [8,9]. CCs may also contribute to improved soil quality by increasing organic matter in the soil. As a result, aggregation, infiltration, and overall soil functioning are enhanced [10]. Vineyard systems that maintain CCs often show greater soil organic matter than systems managed with intensive soil disturbance or herbicide-based bare-soil. This pattern has been observed in both seeded CCs and resident vegetation allowed to grow between vine rows [11,12]. Similar responses have also been reported under Mediterranean conditions, including Israeli vineyards. Therefore, maintaining resident winter ground cover can increase the soil organic matter and reduce soil loss compared with spraying or tillage [13].
Additionally, CCs may also help moderate vine vegetative growth, particularly where water availability is high or vine vigor is excessive. This reduction in canopy density can indirectly improve grape composition and air circulation, thereby contributing to lower disease pressure [14,15]. However, during spring and summer, CCs may compete with vines for water and nutrients, especially in Mediterranean climates, potentially leading to yield reductions. The magnitude and direction of these effects depend on the CC species, vine root stock, soil characteristics, and irrigation regime [16,17]. Previous studies have mainly examined permanent CCs or annually sown species removed before summer, while less attention has been given to natural winter vegetation managed to reduce competition with grapevines during the dry season [17]. Under semiarid Mediterranean conditions, limited water availability and the risk of excessive summer competition restrict the adoption of conventional CCs systems [2,18]. These constraints highlight the need for alternative vineyard floor management strategies that retain the benefits of ground cover while minimizing negative impacts on vine performance.
Therefore, the objective of this research was to evaluate vineyard performance under ground-cover strategies adapted to Mediterranean conditions, combining resident winter ground cover, selective herbicide management promoting annual grasses, and seeded perennial turfgrass (Festuca arundinacea). We hypothesized that selective promotion of naturally occurring winter grasses would provide an intermediate vineyard floor management strategy, retaining many of the agronomic benefits associated with vineyard floor vegetation while reducing excessive summer water competition compared with perennial turfgrass systems.
2. Results
2.1. Leaf Area Index (LAI)
Leaf area index (LAI) was used to characterize seasonal changes in grapevine vegetative growth under the different vineyard floor management treatments. The seasonal dynamics of the LAI were monitored during the 2022–2024 growing seasons under different weed management treatments (Figure 1).
In all seasons, LAI increased from budburst toward fruit set, followed by temporal fluctuations associated with canopy management practices. In 2022, the LAI increased sharply until fruit set, reaching maximum values of 1.34 m² m⁻² in the control treatment (A) and 1.08 m² m⁻² in the complete cover tall fescue treatment (D). A subsequent decline was observed in Stage 1 following shoot positioning and hedging, after which the LAI increased again but at Stage 2, slightly decreased following leaf removal. The LAI values in the sprayed control remained higher than those in the grass-based treatments throughout the season, with a significant difference between the control (A) and treatments C and D as detected in July 2022.
Overall, LAI was lower in 2023 than in 2022 across all the treatments. Within the 2023 season, it increased gradually from the early measurements and reached its highest values at Stage 2. Differences between the control and the grass-based treatments appeared on several sampling dates, especially after canopy management operations. The complete cover tall fescue treatment (D) generally produced the lowest LAI during the season.
The seasonal pattern in 2024 was similar, with LAI rising moderately during Stage 1 and more clearly during Stage 3. Across most measurements, the control maintained higher LAI than the selective herbicide and tall fescue treatments. Significant differences among treatments appeared at several time points, particularly during Stage 3. Nevertheless, LAI remained below the values observed in 2022 across all treatments. Overall, the differences in LAI between the control and the perennial turfgrass treatments became progressively greater over the three experimental seasons, indicating a cumulative effect of long-term vineyard floor management on vine vegetative growth.
2.2. Stem Water Potential
Across the three growing seasons (2022-2024), seasonal stem water potential (Ψstem) followed a similar temporal pattern, becoming progressively more negative as the season advances (Figure 2). In all seasons, the control treatment generally resulted in less negative Ψstem values, as compared to the grass cover treatments, although statistically significant differences were observed only on specific measurement dates.
At the beginning of the 2022 growing season, the Ψstem was more negative than expected for this stage of the season, likely due to a delay in the application of the first irrigation. During Stage 1, the values increased (became less negative) and began to stabilize, reaching approximately -0.6 MPa by the end of Stage 1, followed by a moderate decline during Stage 2 (Figure 2). Approximately two weeks before harvest, the Ψstem decreased in all treatments, reaching -1.1 MPa. Following harvest, values increased to approximately -1.0 MPa.
Throughout the season, the Ψstem values measured in the control treatment were the least negative. Statistically significant differences were observed on the three measurement dates. On day of year (DOY)159, the Ψstem in the control treatment was significantly greater than that measured in treatment C. In the subsequent measurement on June 2022, the Ψstem in the control was significantly greater than that in treatments B and C, whereas treatment D resulted in significantly lower values compared with the other treatments. In the measurements conducted close to veraison, the Ψstem in the control treatment was significantly greater than that in the grass-covered treatments (C and D).
The 2023 growing season began with Ψstem values ranging between –0.66 and –0.81 MPa. Despite a transient increase in early June, the season was characterized by a moderate decline toward values close to –1.0 MPa (Figure 2).
Throughout the season, the highest Ψstem values were recorded in the control treatment (A), which differed significantly from those in the grass-covered treatments (C and D) during the first three measurement dates of the season and in the measurement conducted in July 2023. In this measurement, the selective herbicide treatment (B) also differed from the between-row turfgrass treatment (C). In the first measurement, Selective herbicide differed significantly from treatment (D). Notably, although the control treatment never differed statistically from Selective herbicide, a clear trend could be identified. Until mid-Stage 2, Selective herbicide resulted in lower Ψstem values than the control did, whereas by the end of Stage 2, the values in selective herbicide were higher than or similar to those in the control. The growing season of 2024 was also characterized by a moderate decline in Ψstem throughout the season, except for a temporary increase in mid-June (Figure 2). In the first four measurements of the season, the control treatment differed significantly from the grass-covered treatments. In the first and third measurements, Selective herbicide treatment also differed significantly from the grass-covered treatments.
Like in the 2023 season, compared with the control treatment, the grass-stimulation treatment initially resulted in lower Ψstem, but later, the Ψstem converged and, in the final measurement, even exceeded it. Across both 2023 and 2024, the selective herbicide treatment tended to show an intermediate seasonal pattern. Ψstem was initially more negative than in the control and gradually approached the values measured in the control toward the end of the growing season.
2.3. Yield and Its Components
At the 2022 harvest, the highest yield was recorded in the control treatment, although the differences among treatments were not statistically significant (Table 1). No differences were observed in the number of clusters per vine or in cluster weight. However, compared with those in the turfgrass-covered treatments, berry weight in the control treatment was significantly higher. No differences were detected in the sugar content among treatments, whereas the pH and tartaric acid concentration were greater in treatment D than in the control, indicating that the yield quality was greater.
During the 2023 season, a reduction in yield was observed across all parameters compared with that in 2022, a trend observed all around the country. This decline was also reflected in reduced leaf area and assimilation rates, as mentioned above (Table 2). The differences in total yield from turfgrass-covered treatments were significantly lower, with the control treatment differing from the other treatments. The number of clusters per vine was greater in the control treatment, although the differences were not statistically significant. The average cluster weight was highest in control treatment and lowest in the turfgrass-covered treatment. With respect to most quality parameters, no statistically significant differences were observed among the treatments.
During the 2024 season, a marked reduction in yield was observed across all treatments (Table 3). This season was characterized by exceptionally low winter rainfall (434 mm) and reduced winter chilling (70 Cumulating Chilling units), conditions that affected grapevine productivity throughout the region. However, the reduction was more pronounced in the perennial turfgrass treatments, which differed significantly from the control. The number of clusters per vine in the control treatment was nearly double that in the turfgrass-covered treatments and differed significantly from that in the other treatments. The cluster weight in the control was significantly greater than that in treatment D, and the number of berries per cluster was also greatest in the control, differing significantly from that in treatment C. No statistically significant differences were observed in the total sugar content; however, compared with those in 2022, the grapes in the control treatment were significantly less acidic.
2.4. Correlations Among Yield Components
Correlation analysis was performed to identify the yield component primarily responsible for the yield differences among treatments across the three growing seasons. In the 2022 season, a strong positive correlation was found between the number of clusters per vine and yield (r = 0.945; Table 4).
In addition, positive correlations were observed between cluster weight and yield (r = 0.76), number of clusters per vine (r = 0.53), and number of berries per cluster (r = 0.70). Correlations involving the number of berries per cluster were statistically significant and indicated positive relationships with yield (r = 0.84), number of clusters per vine (r = 0.70), and cluster weight (r = 0.84), as well as a negative relationship with berries (r = -0.48). During the 2023 season, the number of clusters strongly correlated with yield (r = 0.96). Positive correlations were also observed between cluster weight (r = 0.69) and berry weight (r = 0.67; Table 5). Similarly, yield was positively correlated with cluster weight (r = 0.84) and berry weight (r = 0.63). A moderate positive correlation was found between cluster weight and berry weight (r = 0.53). In contrast, the number of berries per cluster was negatively correlated with berry weight (r = –0.69).
During the 2024 season, a strong positive correlation was also observed between yield and the number of clusters (r = 0.98) as well as cluster weight (r = 0.86; Table 6).
In addition, positive correlations were detected between the number of berries per cluster and yield (r = 0.79), number of clusters (r = 0.77), and cluster weight (r = 0.85). A positive correlation was observed between the number of clusters and cluster weight (r = 0.78), as well as between the number of berries per cluster and berry weight (r = 0.54). Across all three growing seasons, yield was consistently and most strongly associated with the number of clusters per vine (r = 0.95–0.98), whereas the relationships with cluster weight and berry weight were considerably weaker. These results indicate that differences in yield among treatments were driven primarily by changes in cluster number rather than by changes in berry size or cluster weight.
The cumulative effect of the different vineyard floor management strategies became more evident when the relative decline in yield was compared across the three growing seasons (Table 7).
The control treatment exhibited the smallest cumulative reduction in yield, whereas both perennial tall fescue treatments showed the greatest reductions. The selective herbicide treatment displayed an intermediate response throughout the experimental period.
2.5. Relationship Between Seasonal ΨStem and Yield Components
Seasonal mean Ψstem was significantly associated with both yield per vine and the number of clusters per vine across all treatments and growing seasons (Figure 3).
2.6. Wine Color
The significant differences in wine color parameters were observed among treatments during the first two experimental seasons, these results likely reflected short-term adaptation processes rather than stable long-term responses. Therefore, wine color parameters are presented only for the third experimental season (2024), when vine performance was considered more physiologically balanced and representative of the long-term influence of the treatments.
Wine color parameters measured during the 2024 season are presented in Table 8. Significant differences among treatments were observed for absorbance at 420, 520, and 620 nm, as well as for total color intensity, whereas hue was not significantly affected by treatment. The highest absorbance values at all measured wavelengths were recorded in the full-cover tall fescue treatment (D), which also exhibited the greatest color intensity, significantly greater than that of the control treatment. Intermediate values were observed in the selective herbicide treatment (B) and the tall fescue between-row treatment (C).
Overall, color intensity increased with increasing ground cover intensity.
3. Discussion
The present study demonstrates that the long-term response of grapevines to vineyard floor vegetation depends not only on the presence of ground vegetation but also on the duration of competition between the grapevine and the vegetation. While perennial turfgrass remained active throughout the growing season and imposed continuous competition for water, the naturally occurring annual grass promoted by selective herbicide management completed their life cycle before the onset of the dry Mediterranean summer, leaving a protective straw mulch while substantially reducing competition during the period of greatest vine water demand. Consequently, the selective herbicide treatment consistently produced intermediate physiological, agronomic, and wine quality responses (Figure 1 and Figure 2; Table 4, Table 5, Table 6, Table 7 and Table 8), suggesting that vegetation phenology is a key determinant of vineyard performance under Mediterranean conditions. The more negative Ψstem observed under the turfgrass-covered treatments (Figure 2) indicates that competition for soil water was the principal mechanism driving vine responses. Reduced vine water status was accompanied by lower leaf area index (Figure 1), indicating that prolonged water competition progressively restricted vegetative growth. These findings agree with previous studies reporting that vineyard floor vegetation reduces vine water availability under Mediterranean conditions, and with studies demonstrating that seasonal Ψstem integrates the combined effects of meteorological conditions and vineyard water availability and provides a robust indicator of vine productivity [19,20].
The cumulative consequences of these physiological responses became evident in vine productivity. Yield declined in all treatments during the three-year experiment, with the smallest reduction occurring in the control and the greatest reduction in the perennial turfgrass treatments (Table 7). The exceptionally dry winter and reduced chilling accumulation during the 2024 season contributed to lower productivity across all treatments, reflecting a regional climatic effect. However, the substantially greater reduction observed under perennial turfgrass indicates that prolonged competition for water amplified the impact of these unfavorable environmental conditions. Correlation analysis (Table 4, Table 5 and Table 6) consistently identified cluster number as the yield component most strongly associated with total yield, while seasonal Ψstem was closely related to both yield and cluster number (Figure 3). These findings are consistent with Ohana-Levi et al. [21], who demonstrated that seasonal yield responses are primarily mediated through changes in cluster number, and with previous studies showing that vine water deficits reduce bud fruitfulness and inflorescence initiation, thereby affecting cluster number in the following season [22,23].
Improved wine color intensity in the turfgrass-covered treatments (Table 8) illustrates the well-established trade-off between grape yield and fruit quality under moderate water limitation. Lower vine vigor and a more open canopy enhance light penetration into the fruiting zone and promote the accumulation of anthocyanins and other phenolic compounds [19,22,24]. However, the improvement in wine color observed under perennial turfgrass was accompanied by substantial yield penalties, particularly after three consecutive seasons of competition. In contrast, the selective herbicide treatment generally maintained intermediate responses (Table 4, Table 5, Table 6, Table 7 and Table 8), suggesting that restricting vegetation competition to winter and spring can preserve part of the quality benefits associated with vineyard floor vegetation while minimizing long-term reductions in productivity.
Although the present study was conducted over three consecutive seasons, it was performed in a single commercial vineyard under one cultivar, one irrigation regime, and one set of Mediterranean environmental conditions. Therefore, the magnitude of the observed responses may vary under different cultivars, soils, climates, or management systems, although the underlying physiological mechanisms are expected to remain broadly applicable.
From a practical perspective, these findings indicate that vineyard floor vegetation management should be integrated with irrigation management rather than considered independently. The results of the present study (Figure 1, Figure 2 and Figure 3; Table 4, Table 5, Table 6, Table 7 and Table 8) suggest that irrigation scheduling should account not only for climatic demand but also for the additional water consumption imposed by vineyard floor vegetation. Integrating meteorological conditions, canopy development, and vine water status into holistic irrigation decision-support systems may compensate for the seasonal water use associated with vineyard floor vegetation while preserving its ecological and agronomic benefits. Future research should quantify the seasonal water consumption of different vineyard floor vegetation types and determine the irrigation adjustments required to offset this competition while maintaining both vineyard sustainability and grapevine productivity under increasingly water-limited Mediterranean conditions. Ultimately, irrigation recommendations should consider the water requirements of the entire vineyard ecosystem, including both the grapevine and vineyard floor vegetation, rather than those of the grapevine alone [19,24].
Conclusively, in this study, over three consecutive growing seasons (i.e., in 2022, 2023, and 2024), the effects of vineyard floor management alteration on grapevine performance were analyzed, primarily through competition for water under Mediterranean conditions. The results showed that the tall fescue maintained during the growing season progressively reduced leaf area index and Ψstem and resulted in the largest cumulative yield losses, particularly when used as a complete ground cover. Across seasons, yield was most closely associated with cluster number, and both variables (yield and cluster number) declined as seasonal Ψstem became more negative. Although the full-cover tall fescue treatment resulted in higher wine color intensity in the final season, this improvement was observed with substantial loss of productivity. Therefore, wine color intensity did not provide a balanced outcome under the conditions of this study. Selective herbicide management produced a more moderate response that favored resident annual winter grasses that senesced before the dry summer. Vine water status, canopy development, yield, and wine color generally remained between those of the sprayed control and the perennial grass treatments. These findings show that the seasonal activity of vineyard floor management is as important as its presence. In semiarid Mediterranean vineyards, controlling active ground cover to the wetter part of the year may offer a more practical cooperation than maintaining perennial turf throughout summer. This conclusion should be tested across cultivars, soils, and irrigation regimes, and future studies should directly quantify vegetation water use and soil-related benefits before making broader management recommendations.
4. Materials and Methods
4.1. Experimental Design and Treatments
The field trial was located in a commercial Vitis vinifera cv. Shiraz vineyard near Bekoa in Israel’s central coastal plain (31.82°N, 34.93°E; elevation 156 m a.s.l.). Vines were grafted on 140 Richter rootstock, planted in 2011 at a spacing of 1.5 m × 3 m, and trained as bilateral cordons on a vertical shoot positioning (VSP) trellis. Drip irrigation is delivered via a subsurface line positioned midway between vine rows, 20–30 cm below ground level, with emitters spaced every 75 cm (1.6 L h⁻¹). For all treatments, standard cultural practices were uniformly applied, including irrigation, fertilization, and pest and disease management.
4.1.1. Experimental Design
A randomized complete block design was used, with four treatments and five replicates arranged in blocks of three adjacent vine rows. Each treatment plot contained 12 vines per row. Ten central vines were permanently labeled for repeated measurements across seasons, and three vines per replicate were selected for detailed physiological and vegetative measurements. Buffer rows between blocks were maintained under standard vineyard management to minimize edge effects (Figure 4).
4.1.2. Treatments
- A.
- Control (standard herbicide management): Preemergence application of diuron (Diurex, Adama-Agan, Israel, 2.4 kg ai ha-1) + oxyfluorfen (Galigan, Adama-Agan, Israel, 0.72 kg ai ha-1) was carried out in autumn (≈50 cm on each side of the vine row). Spontaneous weed vegetation remained untouched between rows, until controlled using postemergence herbicides, namely Glufosinate-ammonium (Basta, BASF, Germany, 0.6 kg ai ha-1) + oxyfluorfen 0.12 kg ai ha-1 during early spring. This was done in order to allow comparisons between bare soil and vegetation treatments.
- A.
- B. Selective herbicide (encouraged grasses): The broadleaf herbicide carfentrazone-ethyl (Spot-light, FMC, USA, 0.6 kg ai ha-1) was applied between rows to selectively control the broad-leaved weeds and allow naturally occurring annual winter grasses to dominate the vegetation, primarily Avena sterilis, Lolium rigidum, and Bromus madritensis while maintaining in-row weed control similar to that of the control treatment. These annual species naturally completed their life cycle before the onset of the dry summer period, leaving a layer of dry straw mulch on the soil surface during summer.
- A.
- C. Tall fescue between rows: Seeding of Festuca arundinacea (Avenger, USA) between vine rows was conducted at 2.5 kg ha⁻¹. Seeding was performed manually in late November using a handheld spreader, followed by light incorporation with forks to enhance seed‒soil contact. A second seeding in December improved ground coverage. In-row herbicide management was identical to that of the control.
- A.
- D. Tall fescue full cover: Seeding of F. arundinacea both between and within vine rows was carried out as described above, without any herbicide use. Vegetation management relied exclusively on mowing.
Each rectangle delineates the boundaries of a replicate. Treatments were marked by color: Black - Control (A), green -Encouraged grass (B), yellow -tall fescue between rows (C), blue -tall fescue full cover (D) (Figure 5).
4.2. Vine Vegetative and Physiological Measurements
4.2.1. Leaf Area Index (LAI)
From May to September, the LAI was measured biweekly on 60 vines (three per replicate) with a SunScan canopy analyzer (Delta-T Devices, UK). The LAI was calculated as the ratio of the leaf surface area to the ground area (m² m⁻²), adjusted for row spacing and unshaded gaps [25].
4.2.2. Stem Water Potential (ΨStem)
Ψstem was measured biweekly (May-September) on three vines per replicate using a pressure chamber (PMS 600, USA; MRC 3000, Israel). Mature, sun-exposed leaves were enclosed in plastic bags covered with aluminum for at least 2 hours prior to measurement to allow equilibration of the leaf and Ψstem.
4.3. Yield and Fruit Composition
At harvest, the total yield and number of clusters were recorded separately for each experimental vine. Measurements were obtained from 240 vines per season (12 measurement vines × 5 replicates × 4 treatments), resulting in a total of 720 vine observations over the three consecutive growing seasons. Mean cluster weight was calculated by dividing the total yield per vine by the corresponding number of clusters. In addition, 24 clusters were randomly sampled from each replicate (two clusters per vine). A random subsample of 100 berries was collected from these clusters and weighed to determine the mean berry weight. The mean number of berries per cluster was then estimated by dividing the mean cluster weight by the mean berry weight. The remaining berries were crushed, and the must was analyzed for total soluble solids (°Brix) and pH using a refractometer (Atago Pocket PAL) and a pH meter (CyberScan 500, Thermo Scientific, USA).
4.4. Micro-Vinification and Wine Analysis
To assess potential impacts on wine quality, micro-vinifications were carried out using the micro-vinification system developed at the Eastern Regional R&D Center, Ariel University [26]. From each replicate, 1.6 kg of grapes were fermented in 2 L glass fermenters at 24 °C with Saccharomyces cerevisiae (0.25 g kg⁻¹). After nine days, the wines were pressed, racked, and bottled (375 mL). Wine color parameters were determined spectrophotometrically (UV‒VIS GENESYS 10, Thermo Scientific, USA) at 420, 520, and 620 nm to calculate color density (A₄₂₀ + A₅₂₀ + A₆₂₀) and hue (A₄₂₀/A₅₂₀).
4.5. Data Analysis
Statistical analyses and standard error calculations were performed on the means derived from all five replicates. Analysis of grapevine parameters, yield and its components was conducted using one-way ANOVA (with α = 0.05 and p < 0.05), followed by Tukey’s post hoc test to determine the differences between the means of the various evaluated parameters. Linear regression analysis was additionally performed to examine the relationships between seasonal mean Ψstem and yield components.
4.6. Declaration of Generative AI Use
During the preparation of this manuscript, the authors used ChatGPT (OpenAI) for language editing, improving clarity, and assisting with the presentation of text and figures. All statistical analyses were performed and verified by the authors using JMP. The authors reviewed and approved the final manuscript and take full responsibility for its content.
Author Contributions
Conceptualization, Y.N., M.S., YG and B.R.; methodology, Y.N, BC.R.L. and B.R.; software, I.W.; validation, Y.N., B.R., R.Y., M.S. and I.W.; formal analysis, I.W, J.S and R.Y.; investigation, I.W. M.S. and Y.G.; resources, B.R. and Y.N.; Data curation, I.W., BC.R.L.; writing-original draft preparation, I.W and R.Y.; writing-review and editing, R.Y., B.R., YG Y.N. and J.S.; visualization, R.Y.; supervision, Y.N, BC.R.L., B.R. and T.R.; project administration, B.R.; and funding acquisition, B.R and Y.N.. All the authors have read and agreed to the published version of the manuscript.
Funding
This research was supported by the Ministry of Agriculture, Israel (Grant No. 12-01-0074), the Israel Wine Grapes Board, the Nekudat Hen Fund, and the Ministry of Innovation, Science and Technology of Israel through its support of the Eastern Regional R&D Center.
Data Availability Statement
The original contributions presented in the study are included in the article; further inquiries can be directed to the corresponding authors.
Acknowledgments
The authors sincerely thank the staff of the Vine Laboratory, the Experimental Winery, and the Eastern Regional R&D Center at Ariel University for their valuable technical and scientific support. We are especially grateful to Roni Mikhalovsky, Dov Rosen, Noa Haiman, Naveh Hajaj, Idan Roth, Idan Bahat, Amit Bahlul, Meir Buskila, Prof. Shivi Drori, Dr. Ilana Stein, Yair Hayat (Barkan Winery), Baruch Naim, the vineyard manager, and the members of the Netzer family (Itamar, Shilo, Achia, and Uri) for their assistance and valuable contributions to this research.
Conflicts of Interest
The authors declare no conflicts of interest.
Abbreviations
The following abbreviations are used in this manuscript:
| CC | Cover Crop |
| ai | Active ingredient |
| TF | Tall Fescue (Festuca arundinacea) |
| LAI | Leaf Area Index |
| LD | Linear dichroism |
| UAV | Unmanned Aerial Vehicle |
| VSP | Vertical Shoot Positioning |
| DOY | Day of Year |
| Ψstem | Stem Water Potential |
| PAR | Photosynthetically Active Radiation |
| LVPD | Leaf Vapor Pressure Deficit |
References
- Mirás-Avalos, J. M.; Araujo, E. S. Optimization of vineyard water management: Challenges, strategies, and perspectives. Water 2021, 13(6), 746. [Google Scholar] [CrossRef]
- Scavo, A.; Calderone, F.; Maio, A.; Scordia, D.; Gresta, F. Ecosystem services and management options of grass-based cover crops in Mediterranean climates: a review: Agronomy for Sustainable Development. 2026, 46(4), 50. [Google Scholar] [CrossRef]
- Keller, M. The Science of Grapevines: Anatomy and Physiology, 3rd ed.; Academic Press: London, UK, 2020. [Google Scholar]
- Munitz, S.; Netzer, Y.; Schwartz, A. Sustained and regulated deficit irrigation of field-grown Merlot grapevines. Aust. J. Grape Wine Res. 2017, 23(1), 87–94. [Google Scholar] [CrossRef]
- Munitz, S.; Schwartz, A.; Netzer, Y. Water consumption, crop coefficient and leaf area relations of a Vitis vinifera cv. Cabernet Sauvignon vineyard. Agric. Water Manag. 2019, 219, 86–94. [Google Scholar] [CrossRef]
- Cohen, I.; Netzer, Y.; Sthein, I.; Gilichinsky, M.; Tel-Or, E. Plant growth regulators improve drought tolerance, reduce growth and evapotranspiration in deficit irrigated zoysia japonica under field conditions. Plant Growth Regul. 2019, 88(1), 9–17. [Google Scholar] [CrossRef]
- Quintarelli, V.; Radicetti, E.; Allevato, E.; Stazi, S. R.; Haider, G.; Abideen, Z.; Mancinelli, R. Covercrops for sustainable cropping systems: a review. Agriculture 2022, 12(12), 2076. [Google Scholar] [CrossRef]
- Napoli, M.; Dalla Marta, A.; Zanchi, C. A.; Orlandini, S. Assessment of soil and nutrient losses by runoff under different soil management practices in an Italian hilly vineyard. Soil Tillage Res. 2017, 168, 71–80. [Google Scholar] [CrossRef]
- Visconti, F.; Lopez, R.; Olego, M. A. The health of vineyard soils: Towards a sustainable viticulture. Horticulturae 2024, 10(2), 154. [Google Scholar] [CrossRef]
- Bartosiewicz, B.; Wawer, R.; Poręba, L.; Siebielec, G. The impact of cover crops on soil quality. Curr. Agron. 2025, 54(2), 118–128. [Google Scholar] [CrossRef]
- Abad, J.; Hermoso de Mendoza, I.; Marín, D.; Orcaray, L.; Santesteban, L.G. Cover crops in viticulture. A systematic review (1): Implications on soil characteristics and biodiversity in vineyards. OENO One 2021, 55, 295–312. [Google Scholar] [CrossRef]
- Liebhard, G.; Guzman, G.; Gomez, J. A.; Winter, S.; Zaller, J. G.; Bauer, T.; Strauss, P. Vineyard cover crop management strategies and their effect on soil properties across Europe. Eur. J. Soil Sci. 2024, 75(5), e13573. [Google Scholar] [CrossRef]
- Sod, H. Effects of wild plant cover and grape pomace compost application on soil structure, fertility, runoff and erosion in a wine vineyard. M.Sc. Thesis, The Hebrew University of Jerusalem, Rehovot, Israel, 2023. [Google Scholar]
- Guerra, B.; Steenwerth, K. Influence of floor management technique on grapevine growth, disease pressure, and juice and wine composition: A review. Am. J. Enol. Vitic. 2012, 63(2), 149–164. [Google Scholar] [CrossRef]
- Fernando, M.; Scott, N.; Shrestha, A.; Gao, S.; Hale, L. A native plant species cover crop positively impacted vineyard water dynamics, soil health, and vine vigor. Agric. Ecosyst. Environ. 2024, 367, 108972. [Google Scholar] [CrossRef]
- Hatch, T. A.; Hickey, C. C.; Wolf, T. K. Cover crop, rootstock, and root restriction regulate vegetative growth of Cabernet Sauvignon in a humid environment. Am. J. Enol. Vitic. 2011, 62(3), 298–311. [Google Scholar] [CrossRef]
- Kesser, M. M.; Joubert, W.; Cavagnaro, T. R.; De Bei, R.; Collins, C. Long-term under-vine coverage by spontaneous vegetation changed plant community and soil dynamics without impacting yield at two South Australian vineyards. Agric. Ecosyst. Environ. 2023, 356, 108629. [Google Scholar] [CrossRef]
- Ziche, Z. I.; Mezzapesa, G. N.; Dragonetti, G.; Piscitelli, L. Unveiling the opportunities of unexplored use of cover crop in mediterranean agriculture through systematic review and meta-analysis. Sustainability 2024, 16(17), 7362. [Google Scholar] [CrossRef]
- Suter, B.; Triolo, R.; Pernet, D.; Dai, Z.; Van Leeuwen, C. Modeling stem water potential by separating the effects of soil water availability and climatic conditions on water status in grapevine (Vitis vinifera L.). Front. Plant Sci. 2019, 10, 1485. [Google Scholar] [CrossRef] [PubMed]
- Bahat, I.; Netzer, Y.; Grünzweig, J. M.; Naor, A.; Alchanatis, V.; Ben-Gal, A.; Cohen, Y. How do spatial scale and seasonal factors affect thermal-based water status estimation and precision irrigation decisions in vineyards? Precis. Agric. 2024, 25(3), 1477–1501. [Google Scholar] [CrossRef]
- Ohana-Levi, N.; Cohen, Y.; Munitz, S.; Michaelovsky, R.; Mintz, D. F.; Hagag, N.; Netzer, Y. The response of yield, number of clusters, and cluster weight to meteorological factors and irrigation practices in grapevines: A multi-experiment study. Sci. Hortic. 2024, 326, 112761. [Google Scholar] [CrossRef]
- Gambarani, A.; Bordoni, M.; Giganti, M.; Vivaldi, V.; Gatti, M.; Poni, S.; Meisina, C. Multi-Year Assessment of Soil Moisture Dynamics Under Nature-Based Vineyard Floor Management in the Oltrepò Pavese (Northern Italy). Agriculture 2026, 16(3), 316. [Google Scholar] [CrossRef]
- Williams, L.E.; Matthews, M.A. Grapevine. In Irrigation of agricultural crops – 502 Agronomy;Monograph No. 30; ASA-CSSA-SSSA, Ed.; 1990; pp. 1019–1055 Madison, 503 Wisconsin, USA. [Google Scholar]
- Wheeler, S. J.; Pickering, G. J. The effects of soil management techniques on grape and wine quality. In Fruits: Growth, Nutrition and Quality; Dris, R., Ed.; 2006; pp. 195–208. [Google Scholar]
- Patrignani, A.; Ochsner, T.E. Canopeo: A powerful new tool for measuring fractional green canopy cover. Agron. J. 2015, 107(6), 2312–2320. [Google Scholar] [CrossRef]
- Rabinovitz, S.; Green, B.; Lang, Y.; Stanevsky, M.; Netzer, Y.; Drori, E.; Lubin, B.C.R. Development and validation of an automated micro-vinification system for high-throughput wine quality research. Food Bioprocess Technol. 2025, 18(12), 10542–10555. [Google Scholar] [CrossRef]
Figure 1.
Seasonal dynamics of the LAI under different weed management treatments during year 2022 (upper), 2023 (middle), and 2024 (lower) growing seasons. Treatments included a sprayed control (A), a selective herbicide (B), tall fescue between rows (C), and tall fescue sown as a complete ground cover (D). The X-axis indicates the day of the year, and the fruit development stages (Stages 1–3) are shown above each graph. The arrows denote canopy management operations. Values are presented as means ± SE (n = 5). Statistical significance was determined by one-way ANOVA (p < 0.05). Asterisks indicate significant differences among treatments: *denotes significant difference between the control and grass cover treatments, **denotes significant difference between the control and the other treatments, depending on season and sampling date.
Figure 1.
Seasonal dynamics of the LAI under different weed management treatments during year 2022 (upper), 2023 (middle), and 2024 (lower) growing seasons. Treatments included a sprayed control (A), a selective herbicide (B), tall fescue between rows (C), and tall fescue sown as a complete ground cover (D). The X-axis indicates the day of the year, and the fruit development stages (Stages 1–3) are shown above each graph. The arrows denote canopy management operations. Values are presented as means ± SE (n = 5). Statistical significance was determined by one-way ANOVA (p < 0.05). Asterisks indicate significant differences among treatments: *denotes significant difference between the control and grass cover treatments, **denotes significant difference between the control and the other treatments, depending on season and sampling date.
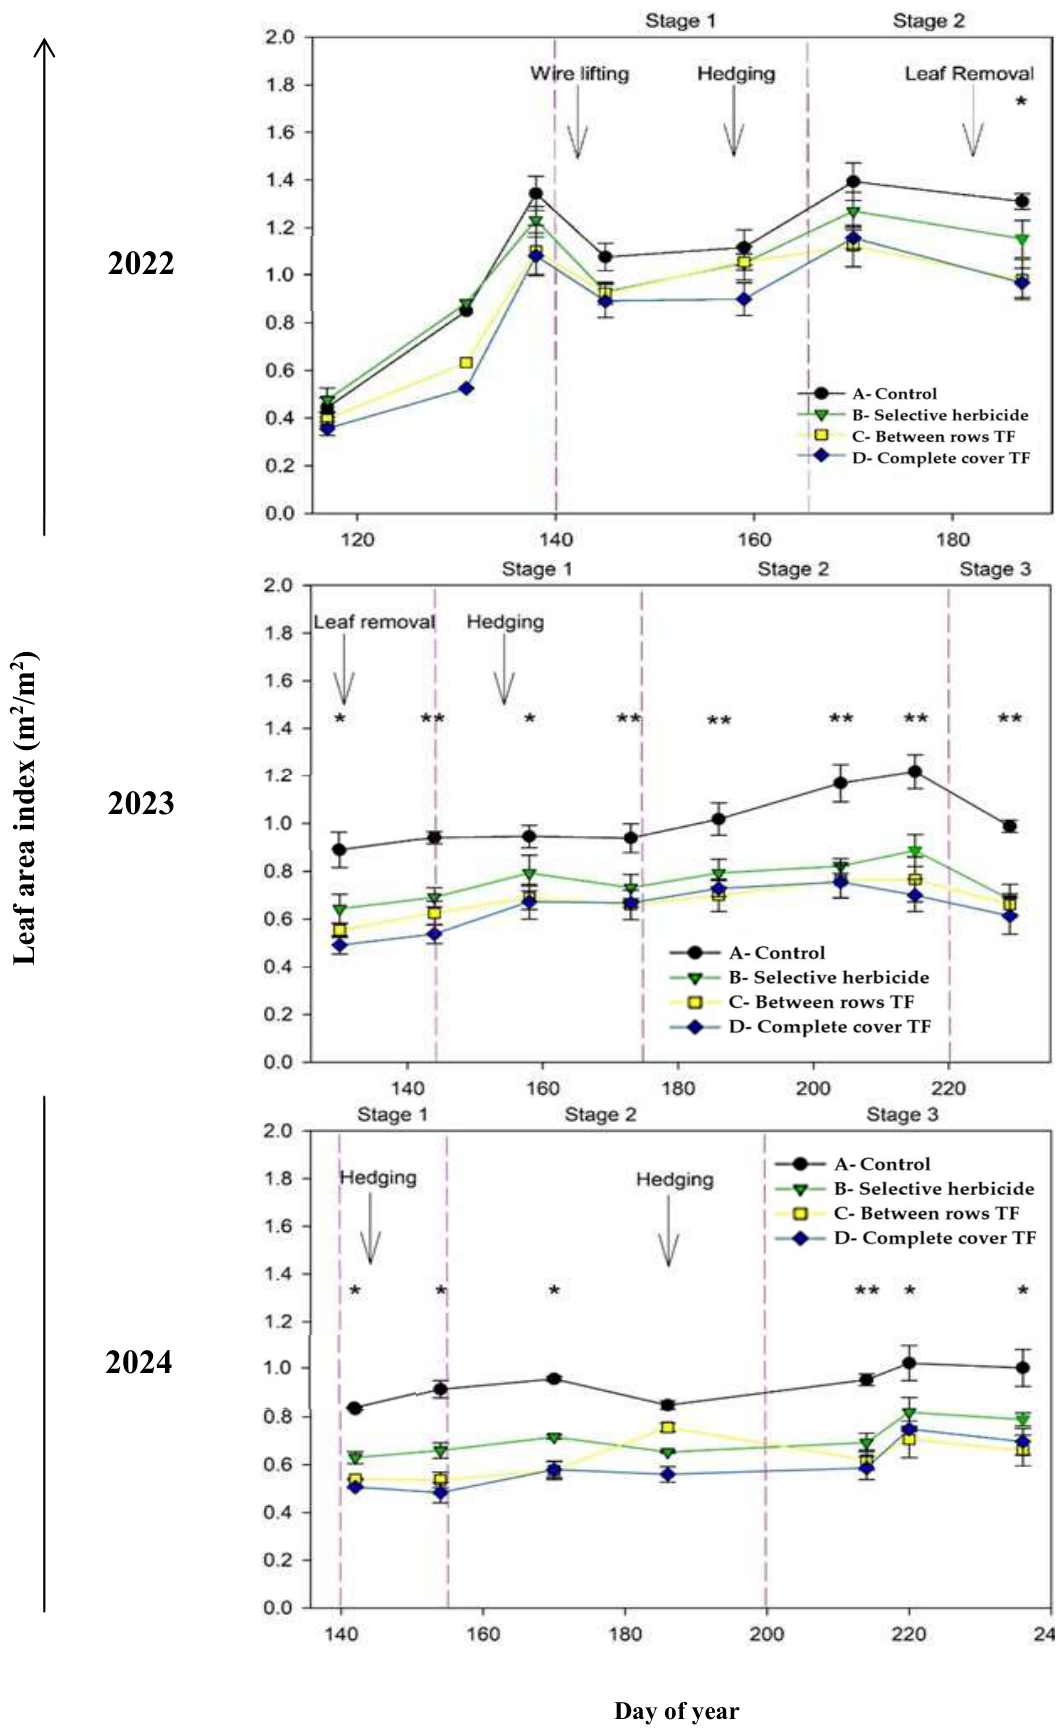
Figure 2.
Seasonal dynamics of stem water potential (Ψstem) under different treatments during the 2022 (upper), 2023 (middle), and 2024 (lower) growing seasons. Treatments included a sprayed control (A), a selective herbicide (B), tall fescue between rows (C), and tall fescue sown as a complete ground cover (D). The X-axis indicates the day of the year, and the fruit development stages (Stages 1–3) are shown above each graph. Each data point represents the mean of 15 vines, and the vertical error bars indicate the standard error of the mean. Statistical significance was determined by ANOVA (p < 0.05). Asterisks indicate significant differences among treatments: * indicates significant differences between the control and grass cover treatments, ** indicates significant differences between the control and interrow grass cover treatments, and *** indicates significant differences among the grass cover treatments and/or between the control and Selective herbicide treatments, depending on the season and sampling date.
Figure 2.
Seasonal dynamics of stem water potential (Ψstem) under different treatments during the 2022 (upper), 2023 (middle), and 2024 (lower) growing seasons. Treatments included a sprayed control (A), a selective herbicide (B), tall fescue between rows (C), and tall fescue sown as a complete ground cover (D). The X-axis indicates the day of the year, and the fruit development stages (Stages 1–3) are shown above each graph. Each data point represents the mean of 15 vines, and the vertical error bars indicate the standard error of the mean. Statistical significance was determined by ANOVA (p < 0.05). Asterisks indicate significant differences among treatments: * indicates significant differences between the control and grass cover treatments, ** indicates significant differences between the control and interrow grass cover treatments, and *** indicates significant differences among the grass cover treatments and/or between the control and Selective herbicide treatments, depending on the season and sampling date.
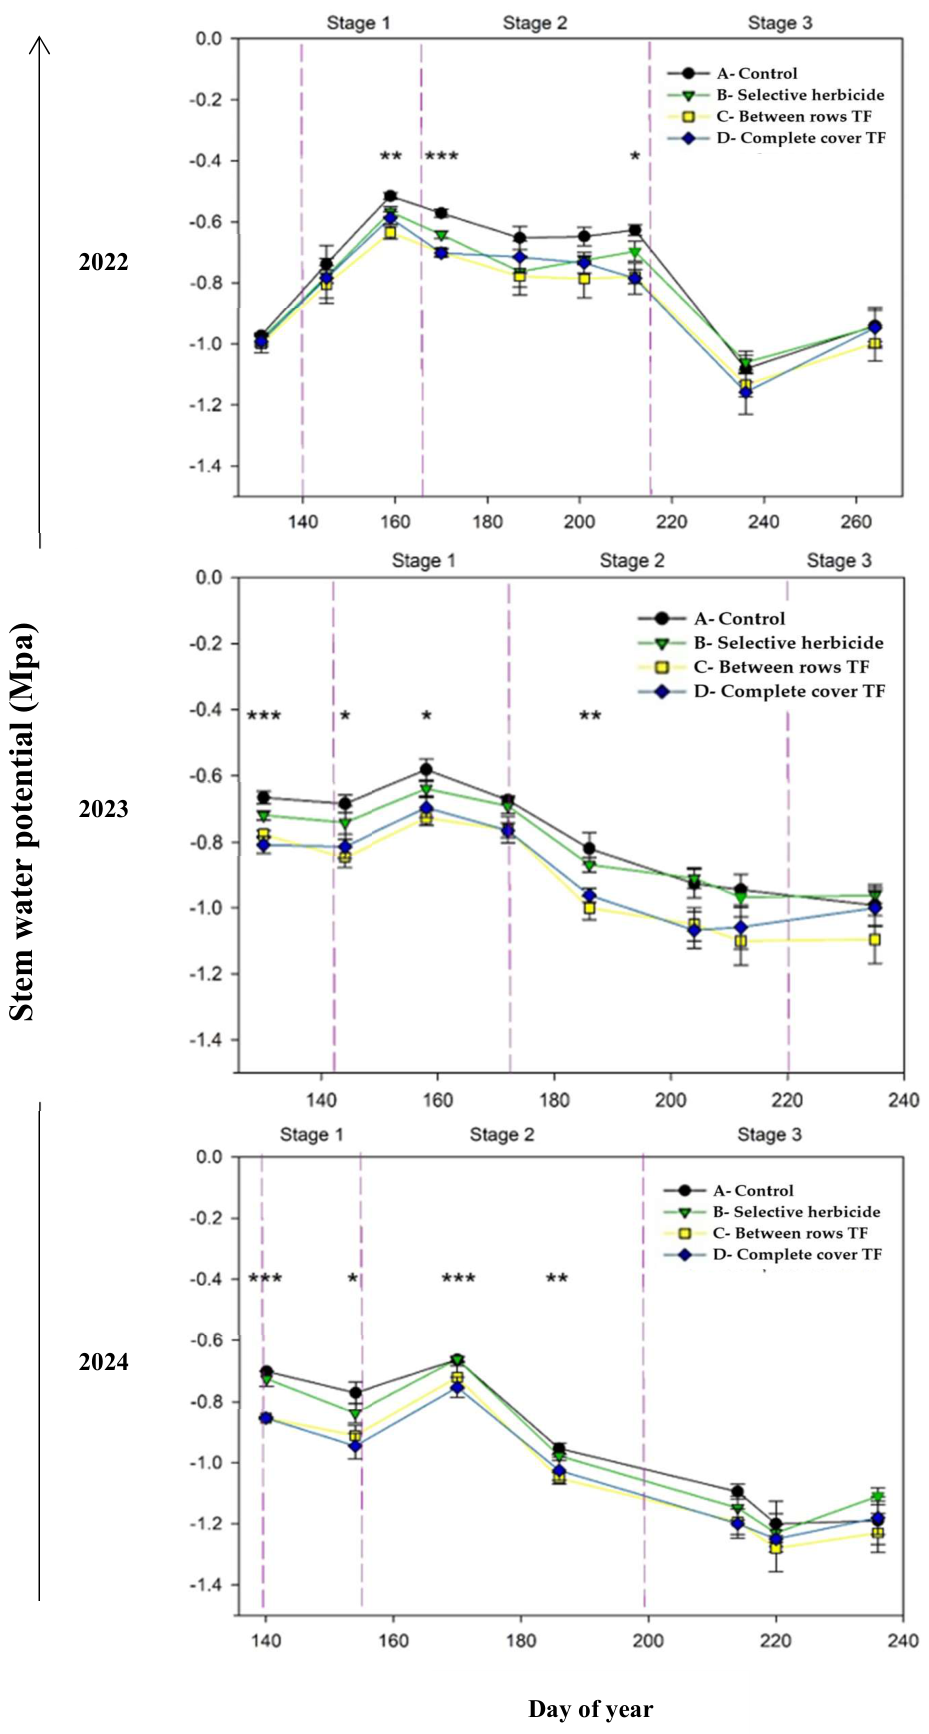
Figure 3.
Relationships between seasonal mean stem water potential (Ψstem) and (a) yield per vine and (b) number of clusters per vine across all treatments and growing seasons (2022-2024). Each point represents one treatment replicate. Solid lines indicate linear regression fits.
Figure 4.
(a) Map of Israel (b) Location of the experimental plot in Bekoa, and (c) Aerial drone image of the experimental vineyard plot in Bekoa. Black rectangles indicate sprayed control plots, green rectangles indicate selective herbicide treatment, yellow rectangles indicate tall fescue between rows, and blue rectangles indicate full ground cover with tall fescue.
Figure 4.
(a) Map of Israel (b) Location of the experimental plot in Bekoa, and (c) Aerial drone image of the experimental vineyard plot in Bekoa. Black rectangles indicate sprayed control plots, green rectangles indicate selective herbicide treatment, yellow rectangles indicate tall fescue between rows, and blue rectangles indicate full ground cover with tall fescue.
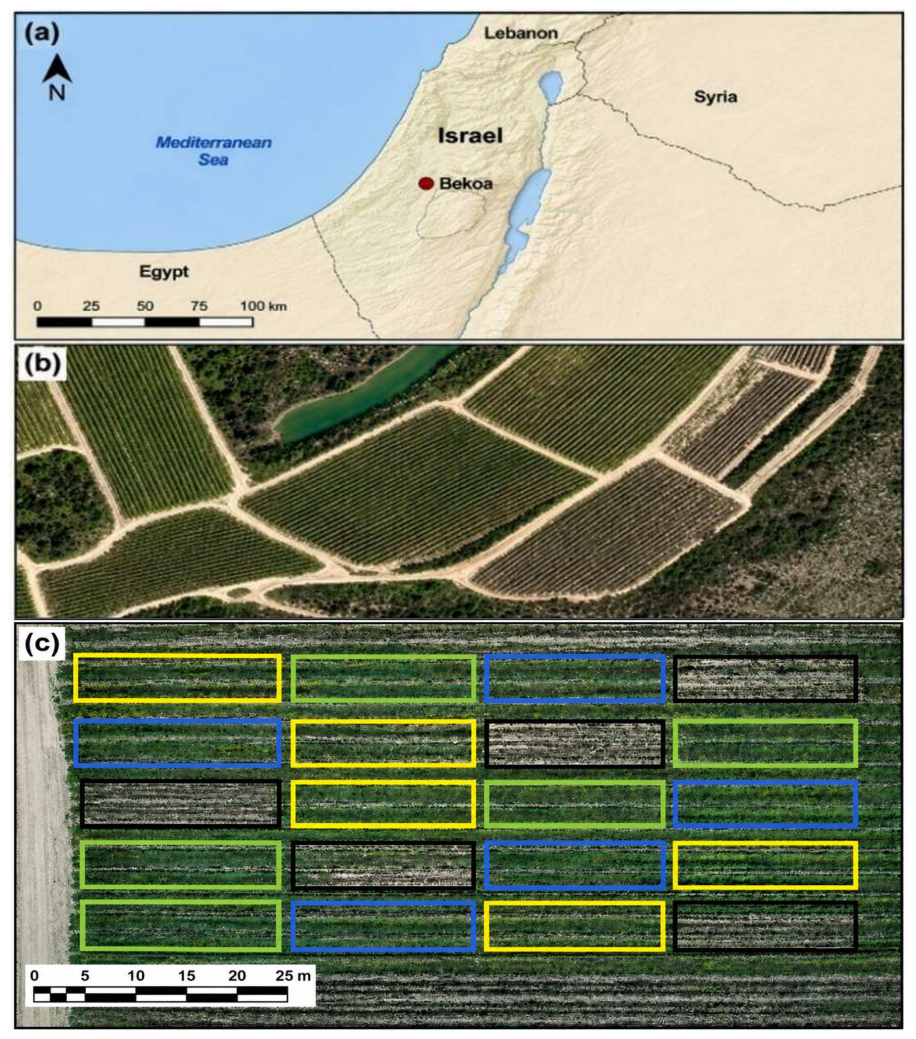
Figure 5.
The different experimental treatments: Each rectangle delineates the boundaries of a replicate. The treatments are marked by color: (a) black: sprayed control, (b) green: selective herbicide (encouraged grasses), (c) yellow: tall fescue (Festuca arundinacea) between rows, and (d) blue: tall fescue sown as full ground cover.
Figure 5.
The different experimental treatments: Each rectangle delineates the boundaries of a replicate. The treatments are marked by color: (a) black: sprayed control, (b) green: selective herbicide (encouraged grasses), (c) yellow: tall fescue (Festuca arundinacea) between rows, and (d) blue: tall fescue sown as full ground cover.
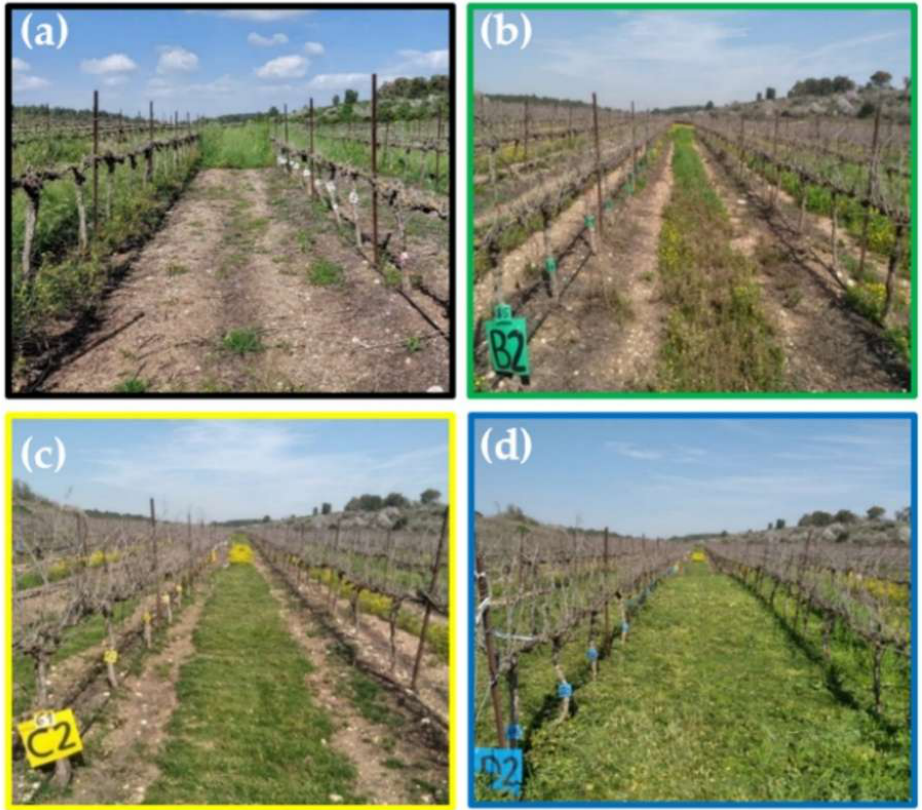

Table 1.
Harvest data and must quality, September 2022*.
| Treatment | pH |
Total soluble solids (°Bx) |
Number of berries/ Cluster |
Berry weight (g) | Cluster weight (g) |
Number of clusters/ Vine |
Yield (kg/vine) |
| A- Control | 3.55a | 20.28 | 71 | 1.42a | 101.3 | 97 | 9.43 |
| B- Selective herbicide | 3.46ab | 19.24 | 64 | 1.42ab | 89.8 | 97 | 8.72 |
| C-Tall fescue between rows | 3.45ab | 19.86 | 65 | 1.33b | 86.3 | 89 | 7.84 |
| D- Tall fescue full cover | 3.41b | 20.20 | 71 | 1.33b | 94.3 | 91 | 8.63 |
| pValue | 0.0015 | NS | NS | 0.0103 | NS | NS | NS |
* The data presented in the table represent measurements obtained from 60 vines per treatment, 240 vines in total (5 replicates per treatment, 12 vines per replicate). Different letters indicate statistically significant differences (p ≤ 0.05).
Table 2.
Harvest data and must quality, September 2023*.
| Treatment | pH |
Total soluble solids (°Bx) |
Number of berries/ Cluster |
Berry weight (g) | Cluster weight (g) |
Number of clusters/ Vine |
Yield (kg/vine) |
| A- Control | 3.36 | 17.73 | 66 | 1.35 | 88.0a | 102 | 8.86a |
| B- Selective herbicide | 3.33 | 17.78 | 66 | 1.24 | 80.2ab | 91 | 7.35ab |
| C- Tall fescue between rows | 3.33 | 17.80 | 66 | 1.14 | 75.0b | 76 | 5.57c |
| D- Tall fescue full cover | 3.34 | 18.40 | 65 | 1.17 | 76.1b | 79 | 5.80bc |
| pValue | NS | NS | NS | NS | 0.0242 | NS | 0.0006 |
* The data presented in the table represent measurements obtained from 60 vines per treatment, 192 vines in total (4 replicates per treatment, 12 vines per replicate). Different letters indicate statistically significant differences (p ≤ 0.05).
Table 3.
Harvest data and must quality, August 2024*.
| Treatment | pH |
Total soluble solids (°Bx) |
Number of berries/ Cluster |
Berry weight (g) | Cluster weight (g) |
Number of clusters/ Vine |
Yield (kg/vine) |
| A- Control | 3.59b | 23.76 | 65.9 | 1.20 | 78.7a | 53a | 4.25a |
| B- Selective herbicide | 3.63ab | 24.26 | 58.1 | 1.36 | 78.4a | 37ab | 2.99ab |
| C- Tall fescue between rows | 3.66ab | 24.24 | 51.5 | 1.24 | 63.4b | 28b | 1.79b |
| D- Tall fescue full cover | 3.70a | 24.64 | 55.2 | 1.25 | 68.8ab | 32b | 2.28b |
| pValue | 0.0283 | N. S | N. S | N. S | 0.0064 | 0.0002 | 0.0088 |
* The data presented in the table represent measurements obtained from 60 vines per treatment, 240 vines in total (5 replicates per treatment, 12 vines per replicate). Different letters indicate statistically significant differences (p ≤ 0.05).
Table 4.
Correlation matrix describing the relationships among yield components, 2022 season*.
|
Number of berries/clusters |
Berry weight | Cluster weight | Number of clusters/vine | Yield | Component |
| Yield | |||||
| r = 0.95 p < 0.0001 |
Number of clusters/vine |
||||
| r = 0.53 p = 0.0286 |
r = 0.77 p = 0.0003 |
Cluster weight | |||
| r = 0.07 NS |
r = –0.44 NS |
r = –0.31 NS |
Berry weight | ||
| r = –0.48 p = 0.05 |
r = 0.84 p < 0.0001 |
r = 0.70 p = 0.0017 |
r = 0.84 p < 0.0001 |
Number of berries/clusters |
* Each cell presents the Pearson correlation coefficient (r) and the p value. 4 September 2022.
Table 5.
Correlation matrix describing the relationships among yield components, 2023 season*.
|
Number of berries/clusters |
Berry weight | Cluster weight | Number of clusters/ vine | Yield | Component |
| Yield | |||||
| r = 0.96 p < 0.0001 |
Number of clusters/vine |
||||
| r = 0.69 p = 0.0066 |
r = 0.84 p = 0.0002 |
Cluster weight | |||
| r = 0.53 p = 0.05 |
r = 0.67 p = 0.0084 |
r = 0.63 p = 0.0149 |
Berry weight | ||
| r = –0.69 p = 0.0068 |
r = 0.25 NS |
r = –0.16 NS |
r = 0.004 NS |
Number of berries/ clusters |
* Each cell presents the Pearson correlation coefficient (r) and the p value.
Table 6.
Correlation matrix describing the relationships among yield components, 2024 season*.
|
Number of berries/clusters |
Berry weight | Cluster weight | Number of clusters/vine | Yield | Component |
| Yield | |||||
| r = 0.98 p < 0.0001 |
Number of clusters/vine |
||||
| r = 0.78 p = 0.0002 |
r = 0.86 p < 0.0001 |
Cluster weight | |||
| r = –0.05 NS |
r = –0.21 NS |
r = –0.12 NS |
Berry weight | ||
| r = –0.54 p = 0.0208 |
r = 0.85 p < 0.0001 |
r = 0.77 p = 0.0002 |
r = 0.79 p < 0.0001 |
Number of berries/ clusters |
* Each cell presents the Pearson correlation coefficient (r) and the p Value.
Table 7.
Relative yield decline (%) across the three growing seasons.
| Treatment |
Yield (kg vine⁻¹) 2022 |
Yield (kg vine⁻¹) 2023 |
Yield (kg vine⁻¹) 2024 |
Decline 2022→2023 (%) |
Decline 2023→2024 (%) |
Overall decline 2022→2024 (%) |
| A – Control | 9.43 | 8.86 | 4.25 | −6.0 | −52.0 | −54.9 |
|
B – Selective Herbicide |
8.72 | 7.35 | 2.77 | −15.7 | −62.3 | −68.2 |
|
C – Tall fescue between rows |
7.84 | 5.57 | 2.17 | −29.0 | −61.0 | −72.3 |
|
D – Tall fescue full cover |
8.63 | 5.80 | 1.84 | −32.8 | −68.3 | −78.7 |
Table 8.
Mean values of wine color parameters for wines produced from Shiraz harvest grapes, September 2024*.
Table 8.
Mean values of wine color parameters for wines produced from Shiraz harvest grapes, September 2024*.
| Treatment |
A420 (yellow) |
A520 (red) |
A620 (blue) |
Color Intensity (A420 + A520 + A620) |
Hue (A420/A520) |
| A- Control | 10.32b | 11.32 | 2.73b | 24.4b | 0.91 |
| B- Selective herbicide | 11.89ab | 12.30 | 3.15ab | 27.3ab | 1.01 |
| C- Tall fescue between rows | 13.67ab | 15.39 | 3.72ab | 32.8ab | 0.89 |
| D- Tall fescue full cover | 15.27a | 16.52 | 4.44a | 36.3a | 0.95 |
| p-Value | 0.01 | 0.044 | 0.009 | 0.011 | NS |
* Different letters indicate statistically significant differences (p ≤ 0.05).
Disclaimer/Publisher’s Note: The statements, opinions and data contained in all publications are solely those of the individual author(s) and contributor(s) and not of MDPI and/or the editor(s). MDPI and/or the editor(s) disclaim responsibility for any injury to people or property resulting from any ideas, methods, instructions or products referred to in the content. |
© 2026 by the authors. Licensee MDPI, Basel, Switzerland. This article is an open access article distributed under the terms and conditions of the Creative Commons Attribution (CC BY) license.
Copyright: This open access article is published under a Creative Commons CC BY 4.0 license, which permit the free download, distribution, and reuse, provided that the author and preprint are cited in any reuse.