

Submitted:
31 July 2026
Posted:
14 August 2026
You are already at the latest version
Abstract
This research investigates the determinants of perceived outdoor thermal comfort (POTC) in a coastal area of Athens, Greece, with emphasis on seasonal transitions between cooler and warmer periods, utilizing a comprehensive survey dataset completed in late 2023. To capture the dynamic nature of human-environment interactions across varying thermal conditions, the dataset was segmented into a combined spring–autumn transitional period, winter, and summer. This seasonal stratification was validated by integrating survey data with meteorological conditions to calculate the Predicted Mean Vote (PMV) for available temporal cases. Canonical Correlation Analysis (CCA) was executed for the spring-autumn and winter periods to map the complex interrelationships between a set of demographic, experiential, environmental, and spatial predictors with four subjective dependent variables. These variables acted as surrogates for POTC, capturing the combined influence of meteorological parameters alongside perceptual and adaptive factors. The spring-autumn CCA model revealed that POTC is defined by a balance, where comfort-enhancing psychological and behavioral adaptations — relaxation space, proactive clothing adjustments, and an urban identity — successfully counteract the physiological and environmental indicators of localized heat stress. The winter CCA model demonstrated that POTC is driven by deliberate cognitive evaluations rather than generalized physical sensations, with satisfaction maximized during sunny, calm daytime conditions particularly among male respondents, and primary environmental stress determined by the convective cooling effects of wind rather than humidity. Due to sample size limitations specific to the summer cohort, analysis was restricted to descriptive methods and it was found that a strong urban identity, evening exposure, physical activity, and optimal airflow functioned as the primary positive indicators of outdoor thermal comfort, whereas peak afternoon exposure, stagnant air conditions, and an explicit demand for shading and cooling infrastructure served as the primary markers of thermal discomfort. Findings demonstrate that POTC is shaped by a dynamic interplay of adaptive, cognitive, and microclimatic factors, with the comparison of these findings with the calculated PMV values confirming that the four subjective dependent variables serve as robust, reliable surrogates for POTC. Behavioral regulators — such as urban identity, psychological relaxation, and clothing adjustments — actively mitigate physiological strain across transitional and summer periods, while a highly resilient, educated, urban-oriented demographic consistently prioritizes structural spatial benefits over seasonal microclimatic, acoustic, or convective stressors. This research suggests that climate-responsive urban design must combine targeted physical modifications — such as wind shelters in cooler months and cool pavements or strategic shading in summer — with a human-centric framework that accounts for diverse, subjective urban thermal experiences.
Keywords:
outdoor thermal comfort
; Mediterranean climate
; seasonal adaptation
; subjective thermal sensation
; canonical correlation analysis
1. Introduction
Outdoor thermal comfort (OTC) has emerged as a critical research domain at the intersection of urban climatology, human biometeorology, and urban design, driven by the increasing frequency of extreme heat events and the intensification of the urban heat island (UHI) effect [1,2,3]. In Mediterranean urban environments, the combined influence of high solar radiation, recurrent heatwaves, and dense urban morphology generates complex thermal conditions that directly affect human well-being, outdoor activity patterns, and energy consumption [4,5,6]. Within this context, understanding how individuals perceive and respond to outdoor thermal environments is essential for the development of climate-responsive and human-centered urban design strategies [6,7,8,9].
The thermal experience in outdoor environments is governed by the interaction of physical, physiological, and psychological processes [10,11,12]. Classical approaches describe this interaction through key environmental variables — air temperature, mean radiant temperature (MRT), humidity, and wind speed — which collectively determine the human energy balance [13,14]. However, thermal perception cannot be fully explained by these physical descriptors alone: it also reflects subjective responses shaped by individual characteristics, behavioral adaptation, and cognitive expectations [7,15]. Identical environmental conditions may result in markedly different perceived comfort levels, underscoring the need for integrative frameworks that bridge objective measurements with subjective evaluation [6,7].
Despite substantial advances in OTC research, several critical limitations remain. Most existing studies implicitly assume that the relative importance of thermal comfort drivers remains stable over time, frequently relying on seasonally aggregated analyses or fixed-index approaches. Such formulations systematically overlook the possibility that the hierarchy of environmental, physiological, and perceptual factors may shift dynamically under varying thermal stress conditions. In addition, widely used objective indices, including physiological equivalent temperature (PET) [16], Universal Thermal Climate Index (UTCI) [17], Standard Effective Temperature (SET) [18], and Predicted Mean Vote (PMV) [19], primarily capture the physiological heat balance. While these formulations can model objective conditions when precise meteorological parameters are available, they fundamentally fail to capture the subjective, experiential dimensions of a pedestrian’s perceived outdoor thermal comfort (POTC). Subjective attributes, such as individual sweating sensation, radiative perception, adaptive behavioral responses, and psychological adaptation, become increasingly dominant under high thermal stress and cannot be represented by fixed physiological equations alone. Furthermore, empirical studies that integrate these multidimensional, perceived comfort data within robust statistical modeling frameworks remain limited, particularly in Mediterranean urban environments characterized by strong seasonal variability.
This research addresses some of these gaps by investigating the determinants of POTC in a Mediterranean urban setting, with particular emphasis on seasonal transitions between cooler and warmer periods. The primary objective is to identify and quantify the environmental, physiological, and psychological predictors of thermal perception, and to examine whether their relative importance shifts between winter-spring and summer-autumn conditions. To this end, targeted descriptive and multivariate statistical techniques are employed to analyze the responses of a POTC survey conducted in Athens, Greece, focusing on transitional seasons, guided by theoretical expectations, and tailored to the parameters of the dataset.
The main contribution of this work lies in the introduction of a season-dependent framework of thermal perception, demonstrating that subjective OTC is not governed by a fixed set of objective factors but by a dynamic hierarchy that evolves with individual attributes, temporal characteristics, and thermal stress intensity. By explicitly integrating subjective sensations with environmental descriptors, the study advances current OTC frameworks and highlights future research pathways that extend fruitfully beyond an exclusive reliance on traditional thermal indices.
The remainder of this paper is structured as follows. Section 2 provides a critical review of the literature on the environmental, physiological, and psychological determinants of OTC, establishing the theoretical foundation of the study. Section 3 presents the methodological framework, including the data collection process, variable specification, and statistical procedures employed. Section 4 details the seasonal stratification and its validation, followed by season-specific statistical analyses and their results, guided by both theoretical considerations and data availability constraints. Finally, Section 5 summarizes the principal findings and discusses their implications for advancing the understanding of POTC and informing climate-responsive urban design.
2. Literature Review
OTC has become an important research topic at the intersection of several scientific disciplines, including urban climatology, human biometeorology, and urban design. Thermal conditions experienced in outdoor environments arise from the interaction between atmospheric processes, characteristics of the built environment, and the physiological and psychological responses of individuals exposed to these conditions [2,3,20,21]. Because of this multidimensional nature, the evaluation of OTC requires approaches that integrate physical measurements of the urban microclimate with assessments of how people perceive and respond to thermal conditions in real urban settings [4,22,23].
Research on OTC therefore typically combines objective environmental observations with subjective evaluations of human perception. Microclimatic variables such as air temperature, radiation, humidity, and wind conditions describe the physical characteristics of the environment, whereas perception-based assessments capture how individuals interpret and tolerate these thermal stimuli. Integrating these perspectives allows researchers to better understand the relationship between environmental conditions and human thermal experience in urban outdoor spaces.
The literature review presented in this section examines the main factors that shape OTC. Initially, the broader context of urban thermal environments is introduced, with particular emphasis on the UHI effect and its implications for thermal conditions in cities. The discussion then focuses on the environmental variables that influence pedestrian-level thermal exposure. Subsequently, physiological and individual factors affecting human thermoregulation are considered, followed by an examination of psychological and behavioral adaptation mechanisms that modify thermal perception. Finally, the role of subjective assessment methods in evaluating OTC is discussed, highlighting their importance for understanding human responses to urban thermal environments.
2.1. Outdoor Thermal Comfort in Urban Environments
OTC has attracted growing attention in urban environmental research as contemporary cities increasingly face thermal stress driven by the combined effects of climate change and rapid urban development [2,4]. Increasing global temperatures, together with the intensification of the UHI phenomenon, have contributed to a significant rise in heat exposure for urban populations across many metropolitan areas worldwide [1,20,24,25,26]. The UHI effect is primarily associated with the thermal characteristics of urban surfaces. Materials such as asphalt, concrete, and building façades absorb large amounts of solar radiation during daytime hours and gradually release the stored heat after sunset, resulting in higher air temperatures within the urban canopy layer compared with surrounding rural environments [27]. Moreover, the progressive loss of vegetated areas, the extensive use of construction materials with high thermal storage capacity, and additional heat generated by human activities further enhance heat accumulation within densely built urban areas [24,28,29].
These processes have important consequences for urban environmental quality and human well-being. Elevated urban temperatures can limit the usability of outdoor public spaces, modify patterns of outdoor activities, and increase the susceptibility of urban populations to heat-related health impacts [11,28,30]. The problem is particularly pronounced in Mediterranean cities, where intense solar radiation, recurrent summer heatwaves, and restricted urban ventilation often create challenging thermal conditions for pedestrians and outdoor users. Under such circumstances, excessive heat exposure may discourage the use of open public spaces, reduce levels of outdoor physical activity, and increase dependence on air-conditioned indoor environments, which in turn contributes to greater energy consumption and higher greenhouse gas emissions [12,28,31].
For these reasons, improving thermal conditions in outdoor urban environments has become a major priority in sustainable urban planning and climate adaptation strategies. Urban design interventions aimed at mitigating heat exposure — such as increasing urban vegetation, providing shading structures, and optimizing urban morphology — can significantly enhance outdoor thermal conditions and improve the livability of urban spaces [9,32,33]. Consequently, a comprehensive understanding of the processes influencing OTC is essential for the development of climate-responsive urban design strategies that reduce thermal stress and promote healthier and more comfortable urban environments.
2.2. Environmental Determinants of Thermal Perception
Thermal conditions perceived by pedestrians in outdoor urban environments are controlled by the combined influence of atmospheric variables and radiative exchanges occurring between the human body and the surrounding urban surfaces [7,16,34]. Within the framework of human biometeorology, thermal perception is typically described through four primary environmental variables: air temperature, MRT, relative humidity, and wind speed [7,10,16]. Together, these parameters determine the thermal balance of the human body by governing the main heat transfer processes — radiation, convection, evaporation, and conduction — that regulate energy exchange between the body and the environment [35].
Air temperature is commonly regarded as one of the most recognizable indicators of thermal conditions because it represents the sensible heat content of the ambient air. In urban areas, air temperature is strongly affected by land surface characteristics, material thermal properties, and anthropogenic heat sources generated by human activities [2,24,27]. Higher temperatures in cities are frequently linked to the UHI effect, whereby buildings, roads, and other impervious surfaces absorb solar radiation during the day and gradually release the accumulated heat after sunset. This mechanism results in persistently elevated temperatures within urban areas relative to nearby rural surroundings and can substantially increase thermal stress experienced by pedestrians [36].
Among the environmental variables influencing OTC, MRT plays a particularly significant role. MRT describes the net radiative environment surrounding the human body by accounting for both short-wave and long-wave radiation exchanges with nearby surfaces and the sky [37,38]. It incorporates the effects of direct solar radiation, diffuse radiation from the atmosphere, and long-wave radiation emitted by heated urban materials such as façades, pavements, and ground surfaces. Because radiative heat transfer often dominates the human energy balance in outdoor settings, MRT is widely recognized as one of the most influential parameters governing OTC conditions [39,40,41]. In open urban areas exposed to direct sunlight, especially in Mediterranean climates during the summer, MRT values can become extremely high due to the combined influence of intense solar radiation and heat emitted from surrounding surfaces. These conditions highlight the importance of shading interventions and appropriate urban design strategies for reducing thermal stress in pedestrian environments [31].
Relative humidity also affects the perception of thermal conditions by influencing the efficiency of evaporative heat loss from the human body. When humidity levels are high, the evaporation of sweat from the skin surface becomes less effective, limiting the body’s ability to dissipate heat and thereby increasing the likelihood of thermal discomfort. Conversely, lower humidity levels may enhance evaporative cooling processes, although prolonged exposure to hot and dry conditions may lead to dehydration [7,16].
Air movement represents another important environmental factor influencing outdoor thermal perception. Wind enhances convective heat exchange between the human body and the surrounding air and also facilitates evaporative cooling from the skin surface [36,42,43]. Under warm conditions, increased airflow can reduce perceived thermal stress by accelerating heat removal from the body. In contrast, strong winds during cooler conditions may increase heat loss and produce discomfort. Within urban areas, airflow patterns are strongly shaped by urban morphology. Features such as street canyon geometry, building height, density, and orientation can either promote ventilation through channeling effects or restrict airflow due to aerodynamic obstruction, thereby influencing pedestrian-level thermal conditions [42].
2.3. Physiological and Personal Factors
Beyond environmental conditions, OTC is also shaped by physiological characteristics and individual attributes that influence how the human body responds to thermal stimuli [7]. The human thermoregulatory system maintains core body temperature within a relatively stable range through a series of physiological mechanisms, including sweating, vasodilation, vasoconstriction, and metabolic heat production. When environmental heat loads exceed the body’s capacity to dissipate heat through these regulatory processes, individuals may experience thermal discomfort or, under more severe conditions, heat stress [6,10].
Individual thermal perception is further influenced by several personal parameters that affect the body’s energy balance. Among these, metabolic rate, clothing insulation, activity level, and acclimatization status play particularly important roles. Higher levels of physical activity increase metabolic heat production within the body, which elevates internal heat loads and can intensify thermal stress under warm environmental conditions [7,30]. Clothing characteristics also strongly affect thermal exchange processes between the body and the surrounding environment. Properties such as insulation level, material permeability, and fabric composition can either facilitate or restrict heat dissipation, thereby influencing perceived thermal comfort [7,10,16].
Demographic characteristics may also modify individual responses to thermal environments. Age-related physiological changes can reduce thermoregulatory efficiency, as older individuals often exhibit diminished sweating capacity and slower cardiovascular adjustments during heat exposure. These limitations may increase susceptibility to heat-related stress. Differences in thermal perception associated with gender have also been reported, with several studies suggesting that women may exhibit higher sensitivity to thermal conditions than men [7,11,30,44].
Adaptation to local climatic conditions through heat acclimatization represents another factor affecting human thermal tolerance. Repeated exposure to warm environments can enhance the efficiency of thermoregulatory responses by improving sweating mechanisms, stabilizing cardiovascular performance, and reducing physiological strain during heat exposure [7,10,16]. Consequently, individuals who are acclimatized to warmer climates are generally capable of tolerating higher ambient temperatures while maintaining thermal balance [10,23].
2.4. Psychological and Behavioral Adaptation
In addition to physiological mechanisms, OTC is also shaped by psychological perception and behavioral responses to environmental conditions. Unlike indoor spaces, where thermal conditions are generally controlled through mechanical systems, outdoor environments allow individuals greater flexibility to modify their exposure to climatic factors. Consequently, behavioral adjustments and psychological expectations play an important role in determining how thermal conditions are perceived and tolerated in outdoor settings [11,22,23].
Psychological adaptation involves the influence of cognitive and contextual elements — such as expectations, previous thermal experiences, perceived control over the environment, and cultural background — on an individual’s evaluation of thermal conditions. These factors can alter the way environmental stimuli are interpreted, meaning that identical physical conditions may be perceived differently by different individuals. For example, people who anticipate warm weather or who consider certain thermal conditions to be typical for a specific climate often demonstrate a greater tolerance for heat compared with those encountering unfamiliar or unexpected environmental conditions [11,30,45].
Behavioral adaptation refers to the actions individuals take to regulate their thermal exposure in response to changing environmental conditions. In urban outdoor environments, such behaviors may include seeking shaded areas, adjusting levels of physical activity, modifying clothing, relocating within a space, or changing the timing and duration of outdoor activities. Through these adaptive strategies, individuals can partially offset unfavorable climatic conditions and maintain acceptable levels of thermal comfort [46,47,48,49].
Perceived environmental control is another factor that significantly influences outdoor thermal perception. When individuals feel able to regulate their exposure to thermal conditions — such as by moving between sunlight and shaded areas or adjusting their behavior — they often report higher levels of comfort and tolerance [11]. Therefore, the overall thermal experience of pedestrians in urban environments results from the interaction between environmental conditions, physiological responses, and the adaptive behaviors individuals employ to manage their thermal exposure.
2.5. Subjective Assessment of Outdoor Thermal Comfort
A substantial body of literature highlights the importance of incorporating subjective evaluation methods when investigating OTC [4,22,23,50,51]. While widely used thermal comfort indices — including PET [16], UTCI [17], SET [18], and PMV [19] — offer quantitative indicators of thermal stress, these metrics primarily describe the physiological heat balance of the human body [15]. Consequently, such approaches may not fully reflect important psychological and perceptual factors that mediate the subjective responses of individuals to outdoor thermal environments.
To overcome this limitation, some studies rely on field-based research designs that integrate in situ microclimatic monitoring with questionnaire-based surveys of human thermal perception [22,23,43]. Such combined methodologies enable researchers to explore the relationship between measured environmental variables and the subjective evaluations reported by individuals exposed to those conditions. By coupling environmental observations with perception-based data, these studies provide a more comprehensive understanding of how people interpret and respond to thermal environments in real urban contexts.
Survey instruments used in OTC studies commonly include standardized rating scales that assess thermal sensation, perceived comfort, temperature preference, and overall satisfaction with the surrounding environment [52,53,54,55]. These subjective indicators are valuable for identifying how different groups perceive thermal conditions and for determining acceptable thermal ranges across varying climatic and cultural settings. The use of perception-based assessments is particularly relevant in outdoor environments, where behavioral adaptation, individual expectations, and contextual factors can strongly influence comfort perception.
Accordingly, the examination of subjective perception data is essential for advancing the understanding of outdoor thermal experience in urban environments. By capturing the intricate interplay of psychological, cognitive, and behavioral adaptation mechanisms, subjective assessments provide insights that extend beyond those obtainable through physical metrics alone. While microclimatic variables remain indispensable for characterizing environmental conditions, the statistical analysis of multidimensional survey responses enables a more comprehensive exploration of the processes shaping human thermal perception. Rather than constituting a source of analytical uncertainty, the inherent subjectivity of such data reflects the very phenomenon under investigation and can be rigorously interpreted through appropriate statistical frameworks. As a result, this approach provides a robust empirical foundation for informing climate-responsive urban design and planning interventions that enhance the comfort, livability, and usability of outdoor public spaces.
3. Methodology
Using quantitative and categorical data derived from an extensive empirical survey, this research explores the determinants of POTC among pedestrians in the Mediterranean coastal environment of Athens, Greece. Particular emphasis is placed on identifying how the contribution of demographic, behavioral, perceptual, environmental, temporal, and spatial factors evolve across cool, warm, and transitional seasons. The overall methodological framework comprised questionnaire development and validation, data collection, and subsequent statistical analysis aimed at identifying the factors influencing POTC under varying seasonal conditions.
3.1. Survey Instrument
This study was based on primary data collected through a structured questionnaire specifically designed to capture the multidimensional aspects of POTC. The questionnaire was developed based on the literature reviewed in Section 2, which identified the principal demographic, environmental, behavioral, and perceptual factors associated with OTC perception. The questionnaire was accompanied by a cover letter outlining the study’s purpose and significance, assuring participants of data confidentiality, and confirming that the collected information would be used exclusively for research purposes.
The questionnaire was organized into a series of thematic modules designed to capture the multidimensional determinants of outdoor thermal perception and environmental experience. These modules encompassed spatial, seasonal, and temporal characteristics of the study setting; demographic and socioeconomic attributes of respondents; individual behavioral patterns and activity-related information; subjective evaluations of thermal and environmental conditions; and perceptions regarding urban morphology, green infrastructure, and potential site-specific adaptation interventions. To ensure a comprehensive representation of both measurable and experiential dimensions, the survey incorporated a combination of closed- and open-ended questions, resulting in a total of 91 primary variables, including 28 quantitative and 63 qualitative indicators. Closed-ended questions consisted primarily of dichotomous response options and Likert-type scales, facilitating standardized statistical analysis, whereas open-ended questions enabled respondents to provide unrestricted qualitative insights regarding their environmental perceptions and preferences.
The evaluation of the questionnaire was carried out in two phases. In the first phase, a pre-test study was conducted with an initial sample of 15 participants to identify ambiguities, eliminate non-functional questions, and rephrase complex items to refine instrument validity and increase internal consistency. This preliminary stage ensured that all technical terminology was accessible and that the questions were optimized for a general audience before wider deployment. In the second phase, the revised questionnaire was finalized, and reliability testing was repeated across all multi-item composite scales to confirm acceptable internal consistency.
The questionnaire was carefully structured to support subsequent transformation of responses into nominal, ordinal, and binary analytical variables, thereby enhancing its suitability for advanced statistical modeling. Likert-type response scales captured the multidimensional nature of participant perceptions while maintaining adequate response granularity. Prior to full-scale deployment, the instrument was subjected to rigorous pilot evaluation to refine item wording, maximize interpretability, and ensure that all technical concepts were readily comprehensible to respondents with diverse educational and demographic backgrounds.
3.2. Data Collection
Following the optimization and validation stages, the questionnaire was distributed using a non-probability sampling framework combining convenience and snowball sampling techniques. Data collection was conducted through multiple dissemination channels, including targeted email campaigns, academic and professional social networks, and structured face-to-face interviews. To ensure that responses reflected direct experiential knowledge of the study environment, participation was restricted to pedestrians who regularly visited the study area. The field survey campaign was completed in late 2023.
A total of 350 questionnaires were distributed, of which 281 were returned fully completed, corresponding to a response rate of 80.3%. Informed consent was obtained from all adult participants prior to survey completion. For participants under 18 years of age (n = 4), parental or accompanying adult consent was obtained prior to participation. The final sample encompassed a diverse demographic profile, including both male and female participants ranging in age from 13 to 87 years, thereby capturing a broad spectrum of user experiences, perceptions, and behavioral characteristics associated with the study area.
3.3. Data Analysis
The analytical framework consisted of a sequential workflow integrating data preprocessing, quality assessment, variable selection, and multivariate statistical modelling. Initially, the dataset was systematically screened to identify and exclude variables affected by excessive missing values, inadequate data quality, or limited theoretical relevance to OTC, based on the conceptual framework of the study. Subsequently, the PMV index was calculated for the subset of observations containing complete temporal and environmental information, enabling the assessment of objective thermal conditions. Four questionnaire-derived indicators were selected as dependent variables to represent distinct dimensions of POTC. The alignment between subjective thermal assessments and PMV-based estimations was subsequently examined across different seasonal conditions. To enhance statistical power and ensure sufficient sample sizes for multivariate analyses, the four meteorological seasons were aggregated into three analytically meaningful microclimatic periods: a transitional spring–autumn period, winter, and summer. Independent variables were grouped into conceptually coherent domains representing demographic, behavioral, perceptual, and environmental characteristics. Their initial associations with POTC indicators were explored through bivariate analyses.
Descriptive statistics were subsequently generated for each seasonal group, followed by Canonical Correlation Analysis (CCA) for the spring–autumn and winter periods, where sample size requirements were satisfied. The resulting canonical functions were interpreted within the theoretical perspectives of adaptive thermal comfort and environmental psychology, enabling the identification of complex relationships between environmental conditions, individual characteristics, and perceived thermal experience.
This multi-step data analysis workflow is outlined in Figure 1.
Graphing and statistical analysis were conducted using JASP [56], an open-source platform providing a graphical interface for executing R-based statistical procedures, and Stata (for CCA). To maintain the mathematical integrity of the comparative models, listwise deletion was applied.
4. Results
4.1. Data Description
The spatial distribution of survey responses revealed a marked imbalance across the study locations. Of the 281 valid questionnaires collected, 195 responses (69.4% of the total sample) were obtained from the Floisvos area. Consequently, the present analysis focused exclusively on this location to ensure an adequate sample size and to minimize potential confounding effects associated with substantial differences in urban morphology and microclimatic conditions among study sites.
Floisvos is a coastal urban district located along the Saronic Gulf within the Athens metropolitan area. The site is characterized by an open waterfront configuration, extensive pedestrian infrastructure, and strong interactions between the built environment and the coastal atmosphere. Its microclimatic setting is influenced by high levels of solar exposure, sea-breeze circulation patterns, and substantial pedestrian activity, making it a particularly relevant case study for the investigation of outdoor thermal perception and environmental comfort.
Restricting the analysis to a single, well-defined urban environment facilitated a more focused examination of the relationships between environmental conditions, individual characteristics, and perceived thermal comfort, while reducing variability arising from site-specific morphological differences. The survey variables, their corresponding labels, and descriptive statistics for the Floisvos subsample are presented in Table 1.
The final sample consisted of 195 pedestrians in Floisvos, comprising 31.3% men and 68.7% women. The participants’ age ranged from 15 to 87 years, with a mean age of approximately 42 years. Height ranged from 150 to 190 cm, with an average of 169 cm, while weight ranged from 40 to 95 kg, with an average of 72 kg.
Regarding seasonal distribution, 52 participants (26.7%) visited the study area in winter, 45 (23.1%) in spring, 18 (9.2%) in summer, and 70 (35.9%) in autumn. The lower number of summer observations reflects the inherent difficulty of conducting outdoor pedestrian surveys under the extreme thermal conditions prevailing in Athens during the summer period. In particular, daytime outdoor activity, including walking and jogging, is substantially reduced during periods of high temperature, with many residents shifting their physical activities to indoor environments such as gyms or other climate-controlled spaces. Consequently, the available pedestrian population in outdoor public spaces during summer is considerably smaller than during milder seasons. Although the summer sample size is therefore limited, these observations remain valuable as they represent thermal comfort responses under the most challenging climatic conditions encountered in the study area.
In terms of temporal distribution, 21 participants (11.3%) visited the study area between 6:01 and 12:00, 100 participants (53.8%) between 12:01 and 18:00, and 65 participants (34.9%) between 18:01 and 24:00. This pronounced concentration in the afternoon and evening reflects the typical diurnal patterns of recreational public space utilization, as standard morning occupational and educational commitments naturally restrict outdoor leisure activities during the earlier hours of the day.
Data Refinement
To improve model robustness and interpretability, the Floisvos variable set was further refined through the removal of variables characterized by sparse observations, pronounced distributional skewness, or limited theoretical justification within the study framework. Initially, several variables were excluded due to a high proportion of missing values (referencing the total 195 cases). This filtering process was necessary to prevent a substantial reduction in the final model’s sample size due to listwise deletion. The excluded variables and their respective counts of nonmissing cases (in parentheses) were as follows:
- Demographic and personal: KIDS (N=92).
- Temporal and clothing: CLOTH_MATERIAL (N=115), and ACCESSORY (N=147).
- Exertion and physical response: ACT_INTEN (N=86), CLOTH_SWEATY (N=80), and WIPE_SWEAT (N=72).
- Acoustic and environmental stressors: LOUD_NOIS_SOUR (N=39) and LOUD_NOISE (N=53)
- Psychological and sensory factors: CELL_FEEL_GOOD (N =88), GARB_UNPL (N=55), and GARB_SMELL (N=103).
- Spatial thermal variance: THERM_COMF_PAV (N=110).
Subsequently, the following categorical variables were excluded from further analysis due to extreme class imbalances, near zero-variance, or highly skewed distributions, which can lead to computational instability and unreliable coefficients in multivariate modeling:
- Demographic homogeneity: NATIONALITY (2 non-Greek respondents), and LOCAL (10 local residents).
- Behavioral homogeneity: VISIT_PURP (183 of 194 respondents reported leisure as their primary motivation).
- Psychological and sensory states: MINS (a heavy positive skew concentrated 62.7% of the sample into the single “over 60 mins” category), ANXIOUS (11 affirmative responses), and DISCOMF_DRY_ITCH (2 affirmative responses).
A final subset of variables was excluded based on theoretical considerations. While these factors provided a broader descriptive context of the participants, they lacked a clear theoretical mechanism directly linking them to OTC perceptions. Consequently, these variables were omitted to maintain a parsimonious, theoretically grounded, and conceptually focused multivariate model:
- Socioeconomic indicators: MARITAL, EDUCATION, PROF, and INCOME.
- Situational and behavioral factors: DEVICE, CELL_FEEL_GOOD, and REASON.
- Health and lifestyle baselines: Q10_EXERC, Q12_ALLER, and Q15_MEDIC.
- Environmental and aesthetic factors: NOISE and GARB.
The remaining variables, having successfully met the criteria for statistical robustness and theoretical relevance, are analyzed in detail in the subsequent sections of this manuscript.
4.2. Dependent Variables
In this section, the PMV is calculated for the subset of cases with complete meteorological information. Subsequently, four metrics of POTC are established as the dependent variables for the study. Finally, their seasonal variation is examined alongside the calculated PMV values to validate their consistency and reliability as subjective indicators.
4.2.1. Calculation of Predicted Mean Vote
The calculation of the Predicted Mean Vote (PMV) index was limited to 41 observations (out of 195 total cases) for which complete temporal information regarding the date and time of the visit was available. Biometeorological simulations were performed using the RayMan model [57]. Because visit times were recorded in six-hour intervals (06:01–12:00, 12:01–18:00, and 18:01–24:00), the midpoint of each interval was adopted as the representative observation time to ensure compatibility with the hourly meteorological data required for PMV estimation. Descriptive statistics for PMV across seasons are presented in Table 2.
Despite the relatively small sample size, the results reveal distinct seasonal patterns in outdoor thermal conditions. PMV values spanned the full theoretical range of the index (−3 to +3), indicating substantial variability in the thermal environments experienced by participants. However, the annual distribution was strongly influenced by the predominance of winter observations, which accounted for more than half of the available PMV cases (23 of 41 observations).
As expected, winter exhibited the lowest mean PMV value (−2.087), indicating a pronounced tendency toward cold thermal sensations. The relatively low standard deviation (0.785) further suggests a high degree of consistency in participants’ thermal experiences during this period. In contrast, spring and autumn displayed mean PMV values closer to the thermal neutrality range (0.533 and 1.029, respectively). Moreover, the comparable standard deviations observed in these transitional seasons (1.52 and 1.426) indicate similar levels of variability in thermal perception, supporting their consideration as a unified transitional microclimatic category for subsequent analyses.
Summer presented a markedly different thermal profile, recording the highest mean PMV value (1.52), indicative of persistent warm-to-hot thermal sensations. Nevertheless, the limited number of available summer observations constrains the reliability of more advanced inferential analyses. Consequently, summer was treated as a distinct seasonal category and examined primarily through descriptive statistical approaches.
Although these findings provide valuable preliminary insights into seasonal thermal variability, they are derived exclusively from the subset of observations containing complete temporal information required for PMV estimation. Therefore, conclusions regarding seasonal aggregation and stratification remain provisional and are revisited in a subsequent section, where the seasonal composition of the complete Floisvos dataset (N=195) is evaluated in greater detail.
4.2.2. Identification of Dependent Variables
The following four variables were established as the primary dependent variables for this study, as they quantify how individuals perceive and respond to subjective thermal conditions in real urban settings using ordinal Likert scales:
- FEEL_COMF was measured on a 7-point Likert-type scale, with values ranging from 1 (not at all comfortable) to 7 (very comfortable).
- THERM_COMF originally represented perceived thermal sensation on a bipolar scale ranging from −3 (cold) to +3 (hot), with 0 indicating thermal neutrality. Because the objective of this analysis was to assess the attainment of a comfortable thermal state rather than the direction of thermal sensation itself, the original scale was transformed into a unipolar comfort-attainment metric (THERM_DEV). Specifically, the scale was folded around the neutral point (0) and reverse-scored, so that values closer to thermal neutrality received higher scores. Thus, THERM_DEV ranges from 0, representing maximum thermal deviation and discomfort (extreme cold or extreme heat), to 3, representing the ideal thermal state (thermal neutrality/maximum comfort). Without this transformation, the original bipolar scale would imply a linear relationship in which increasingly positive values are statistically interpreted as higher levels of the measured construct, despite the fact that both thermal extremes represent undesirable conditions.
- TEMP_PREF was evaluated on a 7-point Likert-type scale ranging from 1 (extremely unpleasant) to 7 (extremely pleasant), capturing how respondents evaluated the immediate thermal environment in terms of hedonic pleasure.
- THERM_ENV_SATISF was measured on a standard 7-point scale ranging from 1 (very displeased) to 7 (very pleased). However, because no respondents selected the lowest category, the empirical distribution for this variable effectively spanned from 2 (displeased) to 7.
The descriptive statistics of the subjective thermal perception variables are presented in Table 3 and reveal generally positive evaluations of the outdoor thermal environment among the participants.
The variable FEEL_COMF, representing overall comfort, exhibited the highest mean value (5.78 on a seven-point scale), with a relatively low standard deviation (1.29) and a median response of 6, indicating a strong tendency toward comfortable thermal conditions. The limited spread of responses, as reflected by the interquartile range (Q1=6, Q3=7), suggests a high level of agreement among participants regarding their perceived comfort. Similarly, THERM_ENV_SATISF, which captures satisfaction with the thermal environment, presented a high mean score (5.23) and a median value of 6, suggesting that most respondents perceived the outdoor thermal conditions as satisfactory. Although the variable exhibited moderate variability (SD=1.04), the concentration of responses within the upper range of the scale indicates an overall favorable evaluation of the thermal setting. THERM_DEV showed a substantially lower mean value (1.66), with responses concentrated around the lower end of the scale (Median=2). This pattern suggests that most participants experienced limited deviation from their preferred thermal conditions. However, the wider proportional presence of lower scores indicates that a subset of respondents perceived noticeable thermal discrepancies. Finally, TEMP_PREF, representing temperature preference, displayed an intermediate mean value (4.41) and moderate variability (SD=1.13). The distribution suggests that while participants generally tended toward neutral or slightly warmer preferences, individual differences in thermal expectations and adaptation responses were evident.
The descriptive statistics of the subjective thermal perception variables, presented in Table 1, reveal generally positive evaluations of the outdoor thermal environment among the participants. The high median values observed for perceived thermal comfort and thermal environment satisfaction indicate an overall favorable perception of the studied outdoor setting. At the same time, the variability identified in temperature preference and perceived thermal deviation highlights the existence of individual differences in thermal expectations and adaptive responses. These findings suggest that subjective thermal perception cannot be adequately represented through a single aggregated comfort indicator, as different perceptual dimensions may capture distinct aspects of the human–environment interaction. Accordingly, the four selected subjective indicators were retained as separate outcome variables, collectively providing a multidimensional representation of pedestrian thermal perception and evaluation.
This analytical structure offers a suitable basis for multivariate approaches such as Canonical Correlation Analysis (CCA), which enables the simultaneous examination of relationships between sets of variables while preserving the contribution of each individual indicator. Unlike dimensionality-reduction approaches such as Principal Component Analysis (PCA), which transform the original variables into latent components and may reduce the direct interpretability of specific perceptual dimensions, the present framework maintains the original structure of subjective responses. This allows the identification of variable-specific relationships that may otherwise remain concealed within aggregated measures.
The consideration of multiple dependent perceptual outcomes, rather than a single composite thermal comfort score, enables a more detailed characterization of heterogeneity in outdoor thermal experience. From a measurement perspective, the inclusion of distinct evaluative dimensions supports a more comprehensive assessment of subjective responses and reduces the risk of oversimplifying a complex perceptual construct. More broadly, this framework aligns with the inherently multidimensional nature of POTC, which emerges through the interaction of sensory, cognitive, affective, and adaptive processes. By explicitly preserving these dimensions, the analysis provides a more structured and interpretable representation of pedestrian thermal experience within the urban environment.
4.2.3. Validation of Dependent Variables
To assess the extent to which the four dependent variables reflect expected variations in thermal perception and their alignment with PMV, their distributions were examined across the contrasting seasonal conditions observed in Athens, Greece. Lower values of the dependent variables indicated greater thermal discomfort.
Descriptive statistics for the four dependent variables across the seasonal groups are presented in Table 4. To facilitate comparison with these subjective measures, a derived biometeorological indicator (PMV_Dev) was constructed from the original PMV index, expressing proximity to thermal neutrality on a standardized 0 to 3 scale, where a value of 3 corresponding to thermal neutrality and a value of 0 representing the greatest deviation toward either cold or hot thermal conditions. This rescaling enables a more direct comparison between PMV-derived thermal conditions and the subjective dimensions of POTC.
The seasonal descriptive statistics presented in Table 4 provide an overview of the relationship between the objectively estimated thermal conditions and the subjective dimensions of perceived outdoor thermal comfort. Overall, the results indicate a clear seasonal variability in thermal perception, with participants adapting their evaluations according to the prevailing environmental conditions. The PMV_Dev values reveal a gradual increase in thermal load from winter to summer. Winter exhibited the lowest mean PMV_Dev value (0.913), indicating relatively neutral conditions, whereas summer presented the highest mean value (1.480), reflecting an increase in thermal comfort. Although the variability of PMV_Dev was moderate across seasons, the observed range indicates that participants experienced a broad spectrum of thermal environments, highlighting the complexity of outdoor thermal perception.
Subjective evaluations remained consistently favorable across all periods. FEEL_COMF maintained high mean values throughout the year, ranging from 5.588 in summer to 6.044 in spring on a seven-point scale. Similarly, THERM_ENV_SATISF remained relatively high across seasons, with mean values above 4.9 in all cases. This suggests that participants generally perceived the outdoor environment as acceptable or comfortable, even under increased thermal loads.
THERM_DEV exhibited relatively low mean values across all seasons (1.347 to 1.875), suggesting a moderate perception of thermal comfort. However, the higher variability observed during winter (SD=1.11) compared with the transitional seasons indicates greater heterogeneity in individual thermal responses under cooler conditions. Temperature preference (TEMP_PREF) showed moderate seasonal variation, with slightly lower values during summer and winter, suggesting differences in preferred thermal conditions depending on recent environmental exposure and adaptive processes.
The comparison between PMV and subjective indicators highlights an important characteristic of outdoor thermal perception: objective thermal conditions do not necessarily translate linearly into perceived discomfort. The consistently positive comfort evaluations, despite seasonal fluctuations in PMV, indicate the potential contribution of adaptive mechanisms, including behavioral adjustments, expectations, and individual acclimatization. These findings support the interpretation of POTC as a multidimensional construct influenced not only by meteorological parameters but also by perceptual and adaptive factors.
Overall, the descriptive patterns justify the inclusion of multiple subjective outcome variables in subsequent multivariate analyses, as each indicator captures a distinct component of pedestrian thermal experience.
4.2.4. Rationale for Seasonal Classification
Overall, the four subjective dependent variables exhibit seasonal shifts consistent with the established PMV framework. When considered alongside reported behavioral adaptation patterns, such as heat avoidance responses, the sensitivity of these indicators to contrasting climatic conditions suggests that they are able to capture the nuanced and seasonally dependent nature of POTC within a Mediterranean context.
Nevertheless, both the empirical distribution of the dependent variables and the available sample sizes per season required a targeted aggregation of seasonal data. The adoption of a broader seasonal classification, rather than a more granular monthly categorization, was supported by the previously discussed descriptive patterns and by the practical reliability of seasonal-level responses. Participants are generally expected to recall their thermal experiences more consistently when associated with broader climatic periods rather than specific dates, thereby reducing potential recall-related uncertainty and improving data reliability.
The development of independent models for all four individual seasons was considered statistically inappropriate due to insufficient observations within certain seasonal groups, which could negatively affect model stability and parameter estimation. Therefore, to preserve statistical power while maintaining consistency with the climatic characteristics of Athens, Greece, the dataset was partitioned into three analytical periods: winter, summer, and a combined transitional period including spring and autumn. This classification separates the dominant cooling and heating periods while grouping transitional seasons based on their comparable statistical variability and similar patterns in perceived thermal comfort.
4.3. Independent Variables
The independent variables were grouped into the following conceptual categories based on their definitions and functional similarities, with each category comprising a combination of binary (dummy), nominal, ordinal, Likert-scale, and continuous variables.
- Individual attributes include variables that characterize the internal heat production and the barrier to heat losses. They comprise MALE, AGE, WEIGHT, HEIGHT, BMI, CLOΤH_TYPE, CLOTH_COLOR, HORMONAL, and CITY_PERSON.
- Temporal variables comprise SEASON, HOUR.
- Activity-related variables describe how the body physically regulates temperature through stance, sweating, vasodilation, and other mechanisms. They comprise position (standing, walking and running), and activity (resting, sitting, standing while talking and standing while working); ACT_INTEN; CLOTH_SWEATY; WIPE_SWEAT; DRINK; EAT; and SWEATY.
- Ambient variables are the physical drivers of heat exchange between the body and the environment. They comprise SUNNY, HUMID, STICKY, WIND, AIR_CHANGE, and SUN_INT.
- Illumination-related variables comprise NAT_LIGHT, ARTIF_ILLUM, INT_NAT_ILL_PAV, INT_ARTIF_ILL, and INT_ARTIF_ILL_PAV.
- Infrastructure variables comprise TALL_BUILD, RELAX, INTERV, PAV_COLOR, WIDE_SIDEWALK, BRIEF_STOPS, and SMART_STOPS.
- Finally, greening and cooling variables comprise SHADE_NATUR, SHADE_ARTIF, VEG_SUFF, SHADE_SUFF, MORE_TREE_SHADE, MORE_ARTIF_SHADE, GREEN_COOL, and WATER_COOL.
To ensure model parsimony, stability, and interpretability, independent variables were selected through a two-stage variable screening framework. First, a data-driven screening procedure was applied by evaluating the bivariate associations between each candidate predictor and the dependent variables using appropriate statistical tests. Although bivariate screening does not account for potential confounding effects among predictors, this preliminary step served as an effective dimensionality-reduction strategy, allowing the identification of variables with meaningful preliminary associations while maintaining an adequate predictor-to-sample size ratio. Subsequently, all candidate variables underwent a theoretical assessment based on established concepts from the outdoor thermal comfort literature. Final inclusion decisions were therefore guided not only by empirical evidence but also by a priori theoretical relevance, ensuring that retained predictors represented meaningful mechanisms underlying thermal perception. By combining empirical screening with theoretical justification, the proposed selection strategy reduced the risk of model overfitting and enhanced both the statistical robustness and interpretability of the final multivariate models.
4.3.1. Individual Attributes
Individual attributes encompass demographic, anthropometric, physiological, and psychological characteristics that dictate human biometeorological responses and thermoregulatory adjustments to ambient thermal stimuli. The statistical associations (for categorical variables) or correlations (for quantitative variables) between individual attributes and dependent variables, stratified by seasonal period, are presented in Table 5.
This preliminary screening stage was conducted to identify variables demonstrating meaningful empirical associations with POTC, while the final selection for multivariate modelling was additionally guided by theoretical relevance. Overall, the observed relationships indicate that individual characteristics influence thermal perception in a highly context-dependent manner, with their effects varying across seasonal conditions. This seasonal dependency highlights the adaptive and multidimensional nature of outdoor thermal perception within Mediterranean urban environments.
Gender demonstrated several significant seasonal associations. Male gender was positively associated with TEMP_PREF and THERM_ENV_SATISF during winter conditions, while a negative association with FEEL_COMF was observed during the spring–autumn period. These findings are consistent with previous studies suggesting that males generally exhibit a broader thermal comfort range and lower sensitivity to thermal stress compared with females, who more frequently report thermal dissatisfaction and stronger preferences for cooler conditions [7,58]. However, the absence of consistent effects across all seasons suggests that gender-related differences are moderated by environmental context and adaptive responses.
Age showed limited but relevant associations, with a positive relationship with thermal preference during the transitional spring–autumn period. Age-related changes in thermoregulation, including reduced metabolic activity, slower cardiovascular adjustment, and altered sweat response, may influence thermal perception and adaptation capacity [59]. Similarly, weight demonstrated a positive marginal association with thermal preference during winter, which may be attributed to differences in metabolic heat production and body surface-area-to-mass ratio affecting heat exchange mechanisms [60].
Anthropometric characteristics, particularly height and BMI, exhibited several season-specific patterns. Height showed marginal positive associations with perceived comfort, thermal preference, and thermal satisfaction during winter, while negative associations appeared during transitional and summer conditions. These findings are consistent with previous evidence suggesting that body morphology affects thermal sensation through variations in heat dissipation efficiency, with taller individuals potentially benefiting from greater convective and evaporative heat loss capacity [10]. BMI-related variables further supported the relevance of body composition, as higher BMI categories were generally associated with warmer perceptions and altered thermal preferences. This relationship may be explained by the insulating effect of subcutaneous fat and increased metabolic heat production, whereas lower body mass is commonly associated with increased susceptibility to cold discomfort [60].
Clothing-related adaptation also emerged as an important behavioral mechanism. Since clothing directly modifies the human energy balance through insulation, permeability, and coverage, it represents one of the primary adaptive responses available to pedestrians. Accordingly, a composite ordinal clothing index (CLOTH_TYPE) was developed to characterize insulation levels across five categories, ranging from light summer clothing to heavy winter attire. CLOTH_TYPE showed a significant positive association with thermal deviation perception during the spring–autumn period and marginal associations with thermal environment satisfaction and temperature preference under transitional and summer conditions. These results highlight the role of behavioral adaptation in explaining variations in subjective thermal evaluation. Conversely, CLOTH_COLOR was not significantly associated with any dependent variable, despite previous evidence suggesting that darker fabrics may increase heat absorption under strong solar radiation conditions [16,61].
Physiological and personal conditions also contributed to variations in perceived thermal comfort. HORMONAL showed significant associations with thermal deviation perception and thermal satisfaction, particularly during the transitional and winter periods. Such effects may be related to alterations in thermoregulatory thresholds, peripheral blood flow, and individual thermal sensitivity, although these relationships are often heterogeneous and influenced by multiple interacting factors [62].
Finally, psychological and contextual adaptation was represented through CITY_PERSON, a variable reflecting individuals’ affinity toward urban environments. This factor was positively associated with temperature preference during spring–autumn and summer conditions and with perceived comfort during the transitional period. Beyond physiological acclimatization, psychological adaptation contributes to thermal evaluation by incorporating previous exposure, environmental expectations, and perceived compatibility with the urban setting. Individuals who are accustomed to warm climatic conditions or who associate urban environments positively may demonstrate greater tolerance toward elevated thermal conditions, a mechanism that may contribute to a location-specific adaptive response within Athens [11,30].
Overall, the bivariate analysis demonstrates that POTC is influenced by a combination of demographic, anthropometric, behavioral, physiological, and psychological factors rather than by isolated predictors. The seasonal variability of these associations supports the use of a multivariate framework capable of simultaneously considering multiple interacting dimensions of thermal perception. Variables exhibiting both statistical relevance and theoretical plausibility were therefore retained for subsequent multivariate modelling, ensuring an interpretable and robust analytical structure while minimizing the risk of overfitting.
4.3.2. Temporal Characteristics
Temporal characteristics fundamentally dictate the dynamics of urban climatology, which fluctuates distinctly across both macro-seasonal periods and micro-diurnal cycles. To capture these underlying variations within the empirical dataset, explicit temporal parameters — specifically the season, and the approximate hour of each respondent’s visit — were recorded.
SEASON values, previously shown in Table 1, were distributed across all four seasons, with most responses recorded in the autumn and the fewest in the summer, likely reflecting an avoidance of walking or exercising outdoors during the hot weather conditions typically prevalent in Greece in the summer. Regarding the influence of season on OTC, seasonal adaptation studies demonstrate that participants’ thermal expectations and perceptions shift significantly throughout the year. Individuals typically exhibit higher heat tolerance and a preference for warmer temperatures during the summer months, due to psychological and physiological acclimatization [10,16].
4.3.3. Activity Characteristics
Activity characteristics directly influence human biometeorological responses by altering metabolic heat production and, consequently, the body’s thermal balance. To account for these effects, activity-related variables describing body position, physical activity, perspiration, and ingestive behaviors were examined across seasonal periods.
Overall, activity-related variables exhibited relatively limited associations with the four dimensions of POTC, suggesting that thermal perception was influenced more strongly by personal, psychological, and environmental factors than by momentary activity characteristics. Nevertheless, several meaningful seasonal relationships emerged. During the spring–autumn period, standing was negatively associated with FEEL_COMF (p=0.032) and positively associated with TEMP_PREF (p=0.026), whereas walking exhibited the opposite pattern, showing a marginal positive association with FEEL_COMF (p=0.058) and a negative association with TEMP_PREF (p=0.016). These findings are consistent with biometeorological theory, according to which metabolic heat production is a primary determinant of thermal sensation, with moderate locomotion partially offsetting thermal stress compared with more stationary postures [10,57,63].
Among activity-specific behaviors, sitting was marginally associated with TEMP_PREF during the spring–autumn period (p=0.084). In the summer, standing and talking was strongly associated with lower perceived comfort (p=0.002), while standing and working showed a weaker but significant negative association with the same variable (p=0.018). These results suggest that even low-intensity activities may reduce thermal comfort under elevated environmental heat loads, supporting previous findings that posture and activity level are key physiological determinants of outdoor thermal sensation [10,57,63,64].
Perceived perspiration emerged as one of the most influential behavioral indicators. To maximize data availability, a composite variable (SWEAT) was constructed from three survey items related to sweat perception and management. During the spring–autumn period, SWEAT was negatively associated with FEEL_COMF (p=0.064), THERM_DEV (p=0.004), and THERM_ENV_SATISF (p=0.008). These relationships highlight the importance of skin wettedness and evaporative heat-loss processes in shaping subjective thermal evaluations. In Mediterranean climates, perceived sweating constitutes a direct indicator of thermoregulatory strain and has repeatedly been linked to reduced thermal satisfaction, particularly under conditions that limit evaporative cooling [7,16].
Food and fluid consumption exhibited only weak associations with thermal perception. DRINK was positively associated with THERM_DEV (p=0.071) and TEMP_PREF (p=0.050) during winter, whereas EAT showed a marginal negative association with THERM_ENV_SATISF during the spring–autumn period (p=0.094). These effects may reflect behavioral responses to prevailing environmental conditions and the short-term thermogenic consequences of digestion [65,66,67,68,69].
Overall, the findings indicate that activity-related variables exert seasonally dependent influences on outdoor thermal perception. Although most behavioral indicators demonstrated weak or inconsistent effects, variables directly associated with metabolic heat production and thermoregulatory responses — particularly standing, walking, and perceived sweating — displayed meaningful relationships with thermal comfort outcomes. These results are consistent with the adaptive thermal comfort framework, which conceptualizes thermal perception as the product of dynamic interactions among environmental conditions, physiological processes, and behavioral adaptation mechanisms.
4.3.4. Ambient Conditions
This section examines ambient environmental conditions as subjective expressions of urban climatology, capturing how pedestrians perceive and evaluate the immediate microclimatic characteristics of their surroundings. Within this framework, ambient conditions were operationalized through perceptions of solar exposure, humidity, wind, air movement, and natural and artificial illumination. The corresponding statistical associations with the four dimensions of POTC are presented in Table 6.
Among the examined variables, SUNNY emerged as one of the most influential environmental descriptors. During winter, SUNNY was positively associated with THERM_DEV, marginally associated with TEMP_PREF, and strongly associated with THERM_ENV_SATISF. A further positive association with thermal satisfaction was observed during the spring–autumn period. These findings reflect the dominant role of solar radiation in outdoor thermal perception. Exposure to direct sunlight substantially increases MRT, often constituting the principal environmental driver of outdoor thermal sensation and comfort [10,57]. The positive associations observed during cooler seasons further suggest that solar exposure may compensate for lower air temperatures, thereby enhancing perceived thermal quality.
Perceived humidity demonstrated weaker and less consistent relationships with thermal perception. HUMIDITY was negatively associated with THERM_DEV during winter at a marginal significance level and negatively associated with TEMP_PREF, whereas a marginal positive association with TEMP_PREF emerged during summer. Although humidity directly affects the evaporative potential of the environment and the efficiency of sweat evaporation, its influence on outdoor thermal comfort is generally secondary to radiation and wind effects [10,57]. In contrast, STICKY, representing a subjective indicator of elevated atmospheric moisture and restricted evaporative cooling, exhibited a more coherent pattern. STICKY was negatively associated with TEMP_PREF during winter, negatively associated with THERM_DEV and THERM_ENV_SATISF during the spring–autumn period, and marginally negatively associated with thermal satisfaction during summer. These findings highlight the importance of perceived skin wettedness and vapor-pressure-related discomfort as determinants of subjective thermal evaluations [10,57].
Wind-related variables revealed clear seasonal differences. WIND was negatively associated with THERM_DEV during winter, indicating that increased airflow substantially altered thermal sensation under colder conditions. Wind constitutes a primary mechanism of convective and evaporative heat exchange, enhancing cooling under warm conditions while potentially intensifying thermal discomfort during winter through increased heat loss [10,57]. The importance of airflow was further reinforced by the preferred air-change variables. Q45_AIR_CHANGE_MORE exhibited significantly lower THERM_DEV scores during both spring–autumn and summer. Conversely, AIR_CHANGE_NO consistently displayed higher THERM_DEV and THERM_ENV_SATISF scores across seasons, with particularly strong associations observed during winter. Collectively, these findings support previous research identifying perceived ventilation as one of the most important behavioral adaptation mechanisms regulating outdoor thermal comfort [10,57].
Lighting-related variables also demonstrated notable associations with thermal perception. NAT_LIGHT was positively associated with TEMP_PREF and THERM_ENV_SATISF during winter and remained positively associated with thermal satisfaction during the spring–autumn period. Similarly, SUN_INT exhibited strong positive correlations with thermal satisfaction during both winter and spring–autumn conditions. As a perceptual proxy for radiative exposure and MRT, sunlight intensity captures the dominant contribution of short-wave radiation to the human energy balance and has repeatedly been identified as one of the strongest determinants of outdoor thermal sensation [10,57]. INT_NAT_ILL_PAV, which may additionally reflect surface heating and albedo-related effects, displayed multiple significant associations with THERM_DEV, TEMP_PREF, and THERM_ENV_SATISF across winter and transitional seasons, further emphasizing the importance of radiative environmental processes in shaping thermal evaluations. In contrast, artificial illumination variables exhibited limited explanatory power. While ARTIF_ILLUM showed negative associations with thermal satisfaction during winter and spring–autumn conditions, INT_ARTIF_ILL and INT_ARTIF_ILL_PAV were not significantly associated with any POTC dimension. These findings suggest that artificial lighting primarily functions as a visual or contextual indicator of nighttime conditions rather than a direct determinant of thermal perception, given its negligible contribution to the human heat balance relative to solar radiation [10,57].
Overall, the results indicate that subjective evaluations of sunshine, airflow, humidity-related discomfort, and natural illumination are more strongly associated with outdoor thermal perception than purely objective environmental descriptors. The observed seasonal variability further supports adaptive thermal comfort theory, according to which thermal evaluations emerge through the interaction of environmental stimuli, physiological responses, behavioral adaptation, and cognitive expectations. These findings reinforce the multidimensional nature of pedestrian outdoor thermal comfort and justify the subsequent use of multivariate techniques to investigate these interrelated perceptual processes in a more integrated framework.
4.3.5. Infrastructure Characteristics
Infrastructure characteristics represent an important dimension of subjective urban climatology, capturing how pedestrians perceive the spatial configuration, functional quality, and environmental adequacy of their immediate surroundings. Although the analysis is restricted to the Floisvos dataset, these perceived infrastructure attributes provide additional contextual information that differentiates micro-environmental conditions within the study area. The statistical associations between infrastructure-related variables and the four POTC dimensions were examined across seasonal periods and are summarized in Table 7.
TALL_BUILD was used as a subjective indicator of urban geometry, reflecting the influence of building height and street-canyon configuration on solar exposure, shading patterns, and local airflow. The perceived presence of tall buildings was negatively associated with THERM_DEV during the winter, suggesting that greater structural enclosure may influence thermal perception by modifying radiant and aerodynamic conditions. Tall buildings can act as important environmental modifiers by reducing direct solar exposure while simultaneously altering ventilation patterns through canyon effects and localized turbulence [42]. RELAX showed a consistent positive relationship with thermal comfort, being significantly associated with FEEL_COMF during spring–autumn and marginally associated during winter. This relationship highlights the importance of perceived access to thermally supportive spaces, such as shaded areas, vegetation, or recreational infrastructure, which can enhance psychological adaptation and reduce perceived environmental stress. Such findings align with adaptive thermal comfort theory, where environmental perception extends beyond purely physical parameters to include behavioral and psychological factors.
Among all infrastructure variables, INTERV demonstrated the most consistent associations with POTC outcomes. It was negatively associated with FEEL_COMF in the summer and the winter and negatively associated with THERM_ENV_SATISF during the spring-autumn period. These results indicate that perceived demand for additional interventions may act as a direct indicator of environmental dissatisfaction, reflecting insufficient shading, vegetation, ventilation, or other microclimatic adaptation measures. Although subjective, this variable captures a users’ evaluation of whether the existing urban infrastructure adequately supports thermal comfort.
Variables related to pavement characteristics and pedestrian infrastructure showed more limited seasonal effects. PAV_COLOR was positive but marginally associated with THERM_DEV during the summer, suggesting that pavement appearance and perceived material characteristics may influence thermal evaluation indirectly through associations with surface heating and visual exposure. Pavement color can modify surface energy balance through changes in albedo, although increased reflectance may also introduce visual discomfort due to glare effects [9,70]. Similarly, WIDE_SIDEWALK was negatively associated with FEEL_COMF during the summer. This result may reflect the complex interaction between pedestrian space, exposure, and thermal conditions: wider sidewalks may improve mobility and reduce crowding but may also increase exposure to direct solar radiation when shading is insufficient.
Rest-related infrastructure variables showed weaker but conceptually relevant associations. BRIEF_STOPS was not significantly associated with any dependent variable, suggesting that the perceived need for short resting opportunities may reflect broader mobility or fatigue considerations rather than direct thermal perception. Conversely, SMART_STOPS was negatively associated with FEEL_COMF during the summer, indicating that users may associate the need for technologically enhanced shaded resting areas with insufficient thermal protection during hot periods. These findings emphasize that perceived infrastructure demand does not necessarily represent objective deficiency but rather reflects users’ expectations regarding environmental quality and thermal adaptation capacity.
Overall, the results indicate that infrastructure-related perceptions influence POTC primarily through psychological adaptation, environmental satisfaction, and perceived availability of adaptive resources rather than through direct physical mechanisms alone. The observed relationships support the adaptive thermal comfort framework, which considers outdoor thermal experience as the outcome of dynamic interactions between microclimatic exposure, urban form, behavioral adaptation, and psychological perception [11,71].
4.3.6. Greening and Cooling
The greening and cooling characteristics represent the perceived capacity of the urban environment to mitigate thermal stress through vegetation, shading, and evaporative cooling mechanisms. These subjective indicators capture not only physical microclimatic modifications but also the psychological perception of environmental control and thermal adaptation. The statistical associations of greening and cooling characteristics with the dependent variables, stratified by seasonal period, are presented in Table 8.
VEG_SUFF was negatively correlated with TEMP_PREF during the spring–autumn period, potentially reflecting a reverse adaptation response whereby participants experiencing higher thermal stress expressed stronger expectations for greener environments. Although vegetation is a fundamental cooling component through shading and evapotranspiration, its perceived effect may depend strongly on the immediate thermal context.
SHADE_NATUR was positively associated with THERM_ENV_SATISF during the spring–autumn period, whereas SHADE_ARTIF showed no significant associations. Natural shade reduces MRT through solar obstruction and evapotranspiration, while artificial shading mainly provides direct protection from short-wave radiation without additional cooling benefits. SHADE_SUFF emerged as one of the most relevant greening-related predictors. It was associated with THERM_DEV and THERM_ENV_SATISF during the winter (highly significant for the latter) and negatively associated with FEEL_COMF and TEMP_PREF during the spring-autumn period (highly significant for the latter). These results suggest that perceived shade availability functions as a key adaptive mechanism, reflecting both actual exposure to solar radiation and the perceived ability to regulate thermal conditions [72,73]. MORE_TREE_SHADE was not significant, while MORE_ARTIF_SHADE was negatively associated with FEEL_COMF during the summer, indicating demand for immediate protection in highly exposed pedestrian areas.
GREEN_COOL was negative but marginally associated with FEEL_COMF during the summer. This finding highlights the role of vegetation in reducing urban heat accumulation by enhancing evapotranspirative cooling and mitigating the effects of dense built environments. Similarly, WATER_COOL was positively associated with TEMP_PREF during spring-autumn and negatively associated with FEEL_COMF during the summer, suggesting that water-based cooling features contribute both through evaporative processes and perceived psychological cooling effects.
Overall, the findings indicate that perceived shade availability, particularly shade sufficiency, represents the strongest greening-related determinant of outdoor thermal perception, whereas broader indicators of vegetation quantity and cooling infrastructure showed weaker and more context-dependent associations.
4.4. Data Analysis
Having identified the theoretically and empirically relevant predictors, subsequent analyses employed multivariate approaches to examine their joint relationships with the multidimensional construct of POTC.
Because POTC was operationalized through four conceptually distinct yet potentially interrelated dimensions, separate regression models were considered insufficient to fully capture the covariance structure among the outcome variables. Therefore, CCA was applied to simultaneously examine the relationship between two multivariate domains: environmental/behavioral predictors and thermal perception responses. CCA derives pairs of canonical variates, defined as linear combinations of variables within each domain, that maximize the association between the two sets [74]. Although CCA is mathematically symmetric and does not formally distinguish between dependent and independent variables, the present study interprets environmental and behavioral characteristics as the predictor set and thermal comfort indicators as the response set to facilitate interpretation.
CCA was selected because it preserves the multidimensional structure of POTC and identifies shared variance patterns between predictors and thermal responses. Unlike PCA, which reduces dimensionality within a single variable domain, CCA directly evaluates cross-domain relationships without requiring the aggregation of thermal comfort dimensions into a single composite index.
4.4.1. Transitional Seasons: Spring and Autumn
During the transitional spring–autumn period, several predictors demonstrated significant associations with the multidimensional dimensions of POTC. CITY_PERSON was positively and highly significantly associated with TEMP_PREF and positively associated with FEEL_COMF, suggesting that psychological adaptation and climatic expectations may contribute to greater thermal tolerance in urban environments. CLOΤH_TYPE was positively associated with THERM_DEV and marginally with THERM_ENV_SATISF, indicating the importance of adaptive clothing choices in regulating perceived thermal conditions. HORM was positively and highly significantly associated with THERM_DEV, highlighting the influence of individual physiological characteristics.
Environmental factors were also important determinants. NAT_LIGHT and SUN_INT were positively and highly significantly associated with THERM_ENV_SATISF, while SUNNY showed a positive association with the same variable, emphasizing the dominant role of short-wave radiation and perceived solar exposure in outdoor thermal evaluation. AIR_CHANGE_NO was positively associated with THERM_DEV, whereas the need for increased or reduced air movement demonstrated significant associations with thermal perception. Additional associations were observed for AGE, BMI-related indicators, physical position/activity variables, and water-cooling perception, reflecting the contribution of physiological, behavioral, and contextual adaptation mechanisms.
Conversely, several variables were negatively associated with thermal perception outcomes. SWEAT was negatively and highly significantly associated with THERM_DEV and THERM_ENV_SATISF, and marginally with FEEL_COMF, confirming the importance of evaporative heat-loss limitations and perceived skin wetness. Similarly, STICKY showed significant negative associations with thermal responses, while ARTIF_ILLUM and INTERV indicated lower perceived thermal satisfaction under specific conditions. STANDING demonstrated opposite associations, being positively related to TEMP_PREF but negatively related to FEEL_COMF, suggesting that activity-related metabolic effects may influence different dimensions of thermal perception differently.
Based on these bivariate screening results and theoretical considerations from outdoor thermal comfort literature, variables were subsequently selected for CCA. Because CCA requires an adequate observations-to-variable ratio, the spring-autumn dataset (N=97) allowed the inclusion of a maximum of 19 variables across both canonical sets under the conservative 5 to 10 observations-per-variable criteria [75,76,77]. Considering that the dependent set consisted of four POTC dimensions, the number of predictors was restricted accordingly.
The final predictor set included CITY_PERSON, CLO_INDEX, HORM, NAT_LIGHT, SUN_INT, RELAX, MALE, AIR_CHANGE_MORE, IR_CHANGE_LESS, STICKY, and SWEAT. Correlation analysis indicated no relevant multicollinearity issues, with Pearson correlation coefficients ranging from 0 to 0.34 among dependent variables and from −0.20 to 0.55 among predictors, supporting the suitability of the selected variables for CCA.
Estimating the CCA model yielded the following first pair of canonical variates, dependent (Y) and independent (X), where all the canonical weights are standardized:
Y1 = 0.361(FEEL_COMF) + 0.57(THERM_DEV)+ 0.228 (TEMP_PREF) + 0.475 (THERM_ENV_SATISF)
X1 = 0.212(CITY_PERSON) + 0.43(CLOTH_TYPE) − 0.049(HORM)+ 0.0512 (Q51_NAT_LIGHT) + 0.11(SUN_INT) + 0.44(RELAX)+ 0.0269(MALE) − 0.206(Q45_AIR_CHANGE_MORE) − 0.296(AIR_CHANGE_LESS)− 0.266(STICKY) − 0.39(SWEAT)
The first canonical function represents a multivariate thermal adaptation pattern linking subjective outdoor thermal comfort responses with behavioral, psychological, and environmental characteristics. The dependent canonical variate (Y1) was mainly defined by THERM_DEV (weight=0.57) and THERM_ENV_SATISF (weight=0.475), followed by FEEL_COMF (weight=0.361). This indicates that the dominant dimension captured by the first canonical axis is related to the overall evaluation of whether outdoor conditions are thermally appropriate and satisfactory, rather than a single isolated comfort perception.
Within the predictor canonical variate (X1), the strongest positive contributions were observed for CLOTH_TYPE (weight=0.43) and RELAX (weight=0.440). This suggests that behavioral adaptation and the perceived quality of the urban environment jointly contribute to the formation of thermal evaluations. Individuals who adjusted their clothing levels and perceived greater availability of relaxing urban spaces tended to align with more favorable thermal perception patterns. The moderate positive contribution of CITY_PERSON (0.212) indicates that psychological adaptation and familiarity with the urban environment may partly shape thermal perception. This finding supports adaptive thermal comfort theory, where previous exposure, expectations, and perceived environmental control influence thermal evaluation beyond purely physical climatic variables.
Conversely, variables associated with physiological heat stress showed strong negative contributions. SWEAT (weight=−0.390) and STICKY (weight= −0.266) contributed negatively to the canonical predictor, indicating that evaporative limitations and skin wetness represent important constraints on outdoor thermal satisfaction. Similarly, AIR_CHANGE_MORE and AIR_CHANGE_LESS contributed negatively, suggesting that perceived mismatch between existing airflow conditions and individual expectations forms an important component of thermal dissatisfaction.
Overall, the first canonical function reveals a dominant adaptive thermal comfort dimension, where thermal perception emerges from the interaction between physiological strain (sweating and humidity perception), behavioral adjustment (clothing), and psychological evaluation of the urban environment.
4.4.2. Winter Season
During the winter period, several environmental and personal variables showed significant associations with perceived outdoor thermal comfort dimensions. Radiation-related variables were among the strongest predictors, with INT_NAT_ILL_PAV, SUNNY, NAT_LIGHT, and SUN_INT showing positive associations mainly with thermal satisfaction and temperature preference, reflecting the dominant role of short-wave radiation and MRT in winter outdoor comfort. Similarly, AIR_CHANGE_NO was positively associated with thermal deviation and environmental satisfaction, suggesting that perceived adequacy of airflow contributed to improved thermal evaluation.
Conversely, variables reflecting atmospheric discomfort were negatively associated with thermal perception. STICKY and HUMIDITY showed negative associations with temperature preference and thermal deviation, highlighting the role of evaporative constraints even under cooler conditions. INTERV, TALL_BUILD, and ARTIF_ILLUM were also negatively related to specific comfort dimensions, indicating the influence of perceived environmental quality beyond purely meteorological factors.
Given the limited winter sample size (N=52), the subsequent CCA model was interpreted cautiously. Based on theoretical relevance and statistical screening, INT_NAT_ILL_PAV, NAT_LIGHT, AIR_CHANGE_NO, WIND, Q41_STICKY, and MALE were selected as predictors. Intercorrelations among the independent variables remained within acceptable levels, suggesting that multicollinearity did not compromise the canonical solution.
Estimating the CCA model yielded the following first pair of canonical variates, where all the canonical weights are standardized:
Y1 = 0.076(FEEL_COMF) + 0.404(THERM_DEV) + 0.314(TEMP_PREF)+ 0.577(THERM_ENV_SATISF)
X1 = 0.218(INT_NAT_ILL_PAV) + 0.452(NAT_LIGHT) + 0.351(AIR_CHANGE_NO)+ 0.427(MALE) − 0.261(WIND) + 0.0185(STICKY)
This was the only statistically significant canonical function (p= 0.032).
The winter CCA identified a single statistically significant canonical function (p=0.032), indicating the presence of one dominant multivariate pathway linking environmental characteristics with perceived outdoor thermal comfort. The dependent canonical variate was mainly defined by THERM_ENV_SATISF, followed by THERMAL_DEV and TEMP_PREF, suggesting that wintertime POTC was primarily shaped by the overall evaluation of environmental acceptability rather than by comfort sensation alone.
The independent canonical variate was dominated by NAT_LIGHT, AIR_CHANGE_NO, and gender-related differences, with additional contributions from INT_NAT_ILL_PAV. These findings highlight the dominant role of solar access and perceived environmental openness in winter outdoor comfort. Conversely, wind perception contributed negatively to the canonical structure, reflecting its potential to enhance convective heat loss and increase cold stress during winter conditions. The negligible loading of STICKY suggests that humidity-related discomfort, despite showing individual associations, did not contribute substantially to the overall multivariate winter comfort pattern.
4.4.3. Summer Season
The limited number of observations in the summer (N=18, representing 9.7% of the total in Floisvos) precludes multivariate modeling, therefore, only descriptive trends are discussed. Overall, summer thermal perception appeared to be strongly influenced by temporal exposure, activity-related metabolic conditions, and perceived environmental adaptation opportunities. Evening exposure and selected activity states were positively associated with thermal evaluations, while conditions indicating insufficient airflow, direct heat stress, and demand for additional cooling infrastructure were associated with reduced thermal satisfaction. The negative associations of perceived needs for additional shade, water-based cooling, wider sidewalks, and smart resting facilities suggest that these variables primarily captured users’ perception of existing thermal limitations rather than direct effects of the interventions themselves.
4.5. Discussion
OTC is traditionally interpreted through the framework of human heat balance, whereby environmental variables such as air temperature, solar radiation, humidity, and wind determine the magnitude of thermal stress experienced by the human body. While this perspective forms the basis of contemporary thermal comfort assessment, it does not fully explain why individuals exposed to identical microclimatic conditions frequently report substantially different levels of comfort. The results of the present research suggest that subjective thermal evaluations emerge not only from physical exposure but also from the interaction of adaptive behavior, environmental appraisal, personal expectations, and psychological interpretation. Consequently, POTC appears to represent a multidimensional human-environment interaction process in which thermal stimuli are continuously filtered through individual experiences, preferences, and adaptive opportunities [11,78].
The spring-autumn transitional seasons provide the clearest demonstration of the adaptive nature of POTC. During these periods, perceived thermal comfort was associated less with prevailing environmental conditions than with the individual’s capacity to accommodate environmental variability. The strong contribution of clothing adjustment confirms a central principle of adaptive comfort theory, namely that thermal satisfaction is actively negotiated through behavioral adaptation rather than passively determined by climatic exposure. Given the pronounced fluctuations in temperature, solar radiation, humidity, and wind that characterize transitional seasons, behavioral flexibility becomes a critical mechanism for maintaining thermal acceptability. The simultaneous importance of adaptive variables and environmental preferences suggests that comfort during these periods is governed not solely by environmental forcing but by the effectiveness of the adaptive opportunities available to the individual. Conversely, indicators of physiological strain, including sweating, skin stickiness, and dissatisfaction with airflow conditions, were associated with reduced thermal satisfaction, suggesting that discomfort emerges when environmental demands exceed the individual’s adaptive capacity. Interestingly, demographic and physiological characteristics exhibited comparatively weak contributions during the transitional seasons, implying that behavioral and psychological adaptation may outweigh individual physiological differences under moderate climatic conditions.
Beyond behavioral adaptation, the significance of recreational and relaxation space highlights the importance of environmental appraisal processes. Participants who perceived the study area as supportive of leisure, recreation, and psychological restoration reported greater thermal satisfaction despite the presence of environmental stressors. This finding suggests that thermal perception is partially mediated by the broader experiential qualities of place. Environmental psychology research has long demonstrated [11] that individuals evaluate environments not only according to their physical characteristics but also according to their ability to support desired activities, provide restoration, and satisfy psychological needs. Consequently, environments perceived as attractive, meaningful, or restorative may promote greater thermal tolerance by altering the subjective interpretation of thermal stimuli. Such findings suggest that emotional responses to place may partially moderate thermal perception, causing identical environmental conditions to be experienced differently depending on the psychological qualities attributed to the surrounding environment. Under this perspective, thermal comfort is not simply a response to climatic conditions but also a reflection of how individuals experience and emotionally evaluate the places in which those conditions occur.
The role of urban identity further strengthens this interpretation. Across both transitional and summer conditions, individuals identifying themselves as city persons consistently exhibited higher levels of perceived comfort. Although the mechanisms underlying this relationship cannot be directly established from the present dataset, the findings suggest a form of expectation-based adaptation in which environmental preferences shape thermal evaluations. Individuals with a strong affinity for urban environments may possess greater acceptance of characteristic urban conditions, including elevated temperatures, increased solar exposure, crowding, and anthropogenic modifications of the local microclimate. The recurring importance of urban identity across seasons further suggests that thermal evaluations may be embedded within broader lifestyle preferences and patterns of urban engagement. Individuals who actively use and identify with urban spaces may exhibit greater tolerance toward environmental stressors because the functional, social, and experiential benefits associated with urban environments partially offset localized sources of discomfort.
This finding highlights that thermal comfort is not determined exclusively by environmental exposure but also by the degree of congruence between environmental conditions and individual environmental preferences. Importantly, this relationship cannot be readily explained through conventional heat-balance principles, as personal identification with an urban lifestyle does not directly alter the physiological processes governing heat exchange. Instead, it suggests that thermal comfort is partly mediated by subjective environmental appraisal and individual-environment relationships. In this sense, thermal perception appears to be influenced not only by what individuals physically experience but also by how they interpret and assign meaning to those experiences.
The airflow findings provide additional insight into this adaptive-perceptual framework. The simultaneous negative influence of both the desire for increased airflow and the desire for reduced airflow suggests that discomfort was associated not with wind conditions themselves but with a perceived mismatch between actual and preferred environmental conditions. This distinction reflects one of the fundamental principles of thermal comfort research: the difference between thermal sensation and thermal preference. Individuals expressing a desire for environmental modification were effectively signaling a departure from thermal neutrality, whereas comfort was associated with conditions that remained within an acceptable adaptive range. Consequently, airflow appears to function not only as a regulator of convective heat exchange but also as an indicator of perceived environmental control and environmental fit.
The winter results reveal a somewhat different, yet equally informative, adaptive mechanism. During colder conditions, sunshine and direct solar exposure emerged as the strongest positive determinants of comfort, whereas wind represented the dominant negative influence. An additional observation concerns the role of body mass. Higher BMI was positively associated with achieving an ideal thermal state during the winter, yet negatively associated with overall thermal comfort and environmental satisfaction, particularly within the obese category. This apparent contradiction suggests that thermophysiological advantages associated with greater body insulation do not necessarily translate into improved subjective comfort, reinforcing the distinction between objective thermal state and perceived thermal experience. These relationships are consistent with the fundamental role of radiative heat gains and convective heat losses in shaping the winter human energy balance. However, the findings suggest that winter comfort extends beyond thermophysiological regulation alone.
Thermal satisfaction was more strongly associated with favorable environmental attributes than with generalized thermal sensation, indicating that winter adaptation frequently involves the active pursuit of beneficial thermal stimuli rather than merely the avoidance of discomfort. This observation is consistent with the concept of alliesthesia [79], which proposes that the hedonic value of a thermal stimulus depends on an individual’s physiological state, causing environmental conditions such as solar exposure to be perceived as particularly pleasant when they contribute to restoring thermal balance. Sunshine therefore appears to function simultaneously as a source of radiative warming and as a positive environmental cue associated with outdoor activity, visual pleasantness, and seasonal well-being. Collectively, these findings suggest that winter thermal perception is shaped not only by physical heat exchange processes but also by environmental appraisal, whereby favorable environmental conditions are perceived as desirable and rewarding components of the outdoor experience.
The summer results provide perhaps the strongest evidence for the importance of adaptive capacity in shaping POTC. Despite the substantially higher thermal loads associated with Mediterranean summer conditions, the dominant positive determinants of comfort were not direct thermal variables but rather urban identity, evening exposure, physical activity, and favorable airflow conditions. Conversely, dissatisfaction was primarily expressed through demands for additional shading, cooling water features, resting facilities, and other heat-mitigation interventions. This pattern suggests that participants evaluated not only prevailing thermal conditions but also the ability of the surrounding environment to provide adaptation opportunities and thermal relief. Consequently, thermal discomfort may be interpreted as a perceived mismatch between environmental demands and available adaptive resources. The recurrent demand for adaptive infrastructure further indicates that users actively recognize and value urban features that enhance resilience to thermal stress and support thermal comfort under challenging summer conditions. This observation also suggests that perceived comfort during summer is influenced not only by the reduction of thermal stress itself but also by the perception that the environment provides sufficient opportunities for coping, adaptation, and recovery from heat exposure
Collectively, these findings challenge the implicit assumption that POTC can be fully represented through objective thermal indices alone. Indices such as PMV [19], PET [16], SET [18], and UTCI [17] remain indispensable for quantifying thermal stress and environmental exposure; however, they capture only one dimension of the overall thermal experience. The present results suggest that perceived comfort emerges from the interaction of environmental conditions, behavioral adaptation, cognitive expectations, environmental preferences, emotional responses, and place-based experiences. The observed influence of environmental preferences, adaptive opportunities, and urban identity indicates that thermal satisfaction depends not only on the magnitude of thermal exposure but also on the extent to which environmental conditions align with individual expectations and desired patterns of environmental use. A broader implication is that people do not experience thermal conditions in isolation; rather, they experience places. Thermal sensations are embedded within a multidimensional context involving recreation, environmental identity, social interaction, environmental meaning, and emotional engagement. Consequently, urban environments perceived as attractive, restorative, and supportive of desired activities may promote greater thermal tolerance than would be predicted from microclimatic conditions alone.
From an urban planning perspective, these findings suggest that successful climate-responsive design should extend beyond the exclusive objective of reducing thermal stress. Traditional interventions such as shading systems, vegetation, reflective materials, water-based cooling elements, and wind management remain essential because they directly modify the physical processes governing human heat exchange. However, their effectiveness may be enhanced when combined with design strategies that strengthen adaptive opportunities, environmental identity, psychological restoration, social interaction, and positive place experiences. Future OTC frameworks should therefore integrate physical, behavioral, and psychological dimensions of adaptation within a unified human-centered perspective. Such an approach may provide a more comprehensive understanding of thermal perception and support the creation of urban environments that are not only thermally efficient, psychologically supportive, and capable of enhancing human well-being under increasingly challenging climatic conditions
5. Conclusions
Methodologically, this study combined meteorological observations, questionnaire-based assessments, PMV validation for selected cases, and CCA to investigate the determinants of POTC within a Mediterranean urban environment. The integration of objective environmental measurements with subjective thermal evaluations enabled the exploration of multivariate relationships between environmental, behavioral, physiological, and psychological variables. The PMV estimates, based on 41 complete temporal observations, supported the seasonal classification adopted in the study, confirming distinct thermal regimes characterized by cold stress during winter, highly variable conditions during the transitional spring–autumn periods, and pronounced heat stress during summer.
The CCA model for the spring-autumn transitional seasons revealed that POTC is a multidimensional construct strongly influenced by adaptive capacity and environmental appraisal. Thermal satisfaction and the attainment of an ideal thermal state were positively associated with behavioral adaptation through clothing adjustment, psychological relaxation, recreational opportunities, and urban identity. Conversely, physiological strain indicators, including sweating, skin stickiness, and dissatisfaction with airflow conditions, were associated with reduced comfort. These findings suggest that thermal comfort during transitional seasons depends less on prevailing environmental conditions alone and more on the individual’s ability to adapt effectively to environmental variability.
The winter CCA model indicated that POTC is primarily associated with environmental satisfaction and the attainment of an ideal thermal state rather than generalized physical comfort alone. Sunshine and direct solar exposure emerged as the strongest positive correlates of comfort, whereas wind represented the dominant negative influence due to its enhancement of convective heat losses. Higher BMI was associated with the attainment of an ideal thermal state but was simultaneously linked to lower overall thermal satisfaction, highlighting the distinction between objective thermal conditions and subjective thermal perception. Collectively, these findings suggest that winter comfort is shaped by both thermophysiological processes and environmental appraisal, with favorable environmental conditions functioning as both sources of thermal benefit and positive environmental experiences.
Due to sample size limitations, the summer assessment relied primarily on descriptive analysis. Nevertheless, the results consistently indicated that urban identity, evening exposure, physical activity, and favorable airflow conditions represent the principal positive indicators of POTC. In contrast, heat stress during peak afternoon periods, stagnant airflow conditions, and a pronounced demand for urban interventions such as artificial shading, cooling infrastructure, resting facilities, and improved pedestrian amenities emerged as clear indicators of thermal dissatisfaction. These findings emphasize the importance of adaptive opportunities and environmental responsiveness in shaping summer thermal experiences.
Across all seasons, urban identity emerged as one of the most consistent determinants of POTC. Individuals exhibiting a stronger affinity for urban environments generally demonstrated greater tolerance toward environmental stressors and higher levels of environmental satisfaction. This finding suggests that thermal perception is influenced not only by climatic exposure but also by environmental preferences, lifestyle characteristics, and individual-environment relationships.
Overall, the findings indicate that POTC cannot be fully explained through objective thermal conditions alone. In essence, individuals do not merely respond to thermal environments; they interpret, evaluate, and experience them through the lens of their expectations, preferences, and interactions with place. Consequently, thermal perception emerges from a dynamic interplay among environmental exposure, adaptive behavior, environmental appraisal, and psychological interpretation. The application of CCA proved particularly valuable in revealing these multidimensional relationships, highlighting latent patterns and associations that may not be identifiable through conventional univariate approaches.
From an urban planning perspective, the results suggest that climate-responsive urban design in Mediterranean cities should extend beyond the exclusive objective of modifying microclimatic conditions. While interventions such as shading systems, vegetation, cooling infrastructure, and wind management remain essential for mitigating thermal stress, their effectiveness may be enhanced when combined with strategies that strengthen adaptive opportunities, environmental satisfaction, recreational potential, and positive place experiences. The findings indicate that improving OTC requires not only cooler environments but also environments that people perceive as supportive, attractive, and responsive to their needs. Consequently, successful OTC design should integrate physical, behavioral, and psychological dimensions within a unified human-centered framework.
Despite the insights provided by the present analysis, certain limitations should be acknowledged. First, the study was conducted within a single Mediterranean urban setting, which may limit the external validity of the findings to other climatic, cultural, and urban contexts. Second, the relatively limited sample size, particularly during the summer period, restricted the application of more complex multivariate statistical techniques and necessitated a more descriptive interpretation of seasonal trends.
Future research should extend this approach to different urban typologies, climatic regions, and demographic groups. In addition, the application of unsupervised learning approaches and advanced clustering techniques could further assist in identifying distinct thermal perception profiles. Such efforts may contribute to the development of more comprehensive and robust human-centered thermal comfort frameworks and support the design of resilient, climate-responsive urban environments.
Abbreviations
| BMI | Body Mass Index |
| CCA | Canonical Correlation Analysis |
| M | Mean value |
| Max | Maximum value |
| Min | Minimum value |
| MRT | Mean Radiant Temperature |
| OTC | Outdoor Thermal Comfort |
| PET | Physiological Equivalent Temperature |
| PMV | Predicted Mean Vote |
| POTC | Perceived Outdoor Thermal Comfort |
| SD | Standard Deviation |
| SET | Standard Effective Temperature |
| UHI | Urban Heat Island |
| UTCΙ | Universal Thermal Climate Index |
References
- Guo, Y.; Ren, Z.; Dong, Y.; Hu, N.; Wang, C.; Zhang, P.; Jia, G.; He, X. Strengthening of surface urban heat island effect driven primarily by urban size under rapid urbanization: national evidence from China. GIsci Remote Sens. 2022, 59, 2127–43. [Google Scholar] [CrossRef]
- Oke, T.R. Boundary Layer Climates; Routledge, 1987. [Google Scholar] [CrossRef]
- Mihalakakou, G.; Paravantis, J.A.; Romeos, A.; Malefaki, S.; Georgiou, P.N.; Giannadakis, A. Machine Learning for Outdoor Thermal Comfort Assessment and Optimization: Methods, Applications and Perspectives. Sustainability 2026, Vol 18 18, 2600. [Google Scholar] [CrossRef]
- Liu, T.; Wang, Y.; Zhang, L.; Xu, N.; Tang, F. Outdoor Thermal Comfort Research and Its Implications for Landscape Architecture: A Systematic Review. Sustainability 2025, 17, 2330. [Google Scholar] [CrossRef]
- Requena-Ruiz, I.; Siret, D.; Stavropulos-Laffaille, X.; Leduc, T. Designing thermally sensitive public spaces: an analysis through urban design media. J. Urban Des. 2023, 28, 44–65. [Google Scholar] [CrossRef]
- Cohen, P.; Potchter, O.; Matzarakis, A. Human thermal perception of Coastal Mediterranean outdoor urban environments. Appl. Geogr. 2013, 37, 1–10. [Google Scholar] [CrossRef]
- Fanger, P.O. Thermal Comfort Analysis and Applications in Environmental Engineering; McGraw-Hill Book Company: New York, NY, USA, 1972. [Google Scholar]
- Mihalakakou, G.; Souliotis, M.; Papadaki, M.; Menounou, P.; Dimopoulos, P.; Kolokotsa, D.; Paravantis, J.A.; Tsangrassoulis, A.; Panaras, G.; Giannakopoulos, E.; Papaefthimiou, S. Green roofs as a nature-based solution for improving urban sustainability: Progress and perspectives. Renew. Sustain. Energy Rev. 2023, 180, 113306. [Google Scholar] [CrossRef]
- Kappou, S.; Souliotis, M.; Papaefthimiou, S.; Panaras, G.; Paravantis, J.A.; Michalena, E.; Hills, J.M.; Vouros, A.P.; Dimenou, K.; Mihalakakou, G. Cool Pavements: State of the Art and New Technologies. Sustainability 2022, Vol 14 14, 5159. [Google Scholar] [CrossRef]
- Matzarakis, A.; Rutz, F.; Mayer, H. Modelling radiation fluxes in simple and complex environments: Basics of the RayMan model. Int. J. Biometeorol. 2010, 54, 131–9. [Google Scholar] [CrossRef] [PubMed]
- Nikolopoulou, M.; Steemers, K. Thermal comfort and psychological adaptation as a guide for designing urban spaces. Energy Build. 2003, 35, 95–101. [Google Scholar] [CrossRef]
- Gaitani, N.; Mihalakakou, G.; Santamouris, M. On the use of bioclimatic architecture principles in order to improve thermal comfort conditions in outdoor spaces. Build. Env. 2007, 42, 317–24. [Google Scholar] [CrossRef]
- Alexandri, E.; Jones, P. Temperature decreases in an urban canyon due to green walls and green roofs in diverse climates. Build. Env. 2008, 43, 480–93. [Google Scholar] [CrossRef]
- Andreou, E. Thermal comfort in outdoor spaces and urban canyon microclimate. Renew. Energy 2013, 55, 182–8. [Google Scholar] [CrossRef]
- Meng, F.; Qin, M.; Gao, Z.; Wang, H.; Xu, X.; Xu, F. A review of RayMan in thermal comfort simulation: Development, applications and prospects. Build. Env. 2025, 270, 112547. [Google Scholar] [CrossRef]
- Höppe, P. The physiological equivalent temperature - A universal index for the biometeorological assessment of the thermal environment. Int. J. Biometeorol. 1999, 43, 71–5. [Google Scholar] [CrossRef] [PubMed]
- Jendritzky, G.; de Dear, R.; Havenith, G. UTCI-Why another thermal index? Int. J. Biometeorol. 2012, 56, 421–8. [Google Scholar] [CrossRef] [PubMed]
- Gagge, A.; Fobelets, A.; Berglund, L. A standard predictive index of human response to the thermal environment. ASHRAE Trans. 1986, 92, 709–31. [Google Scholar]
- Ole Fanger, P.; Toftum, J. Extension of the PMV model to non-air-conditioned buildings in warm climates. Energy Build. 2002, 34, 533–6. [Google Scholar] [CrossRef]
- Kong, D.; Gu, X.; Li, J.; Ren, G.; Liu, J. Contributions of Global Warming and Urbanization to the Intensification of Human-Perceived Heatwaves Over China. J. Geophys. Res. Atmos. 2020, 125, e2019JD032175. [Google Scholar] [CrossRef]
- Founda, D. Urban Thermal Risk. Atmosphere 2021, Vol 12(Page 466 12), 466. [Google Scholar] [CrossRef]
- Johansson, E.; Thorsson, S.; Emmanuel, R.; Krüger, E. Instruments and methods in outdoor thermal comfort studies – The need for standardization. Urban Clim. 2014, 10, 346–66. [Google Scholar] [CrossRef]
- Nikolopoulou, M.; Lykoudis, S. Thermal comfort in outdoor urban spaces: Analysis across different European countries. Build. Env. 2006, 41, 1455–70. [Google Scholar] [CrossRef]
- Gago, E.J.; Jordan, J.; Pacheco-Torres, R.; Ordóñez, J. The city and urban heat islands: A review of strategies to mitigate adverse effects. Renew. Sustain. Energy Rev. 2013, 25, 749–58. [Google Scholar] [CrossRef]
- Bagiorgas, H.S.; Mihalakakou, G. On the influence of the urban heat island on the cooling load of a school. J. Atmos. Sol. Terr. Phys. 2016, 138, 179–86. [Google Scholar] [CrossRef]
- Vardoulakis Karamanis, D.; Fotiadi, A.; Mihalakakou, G. E. The urban heat island effect in a small Mediterranean city of high summer temperatures and cooling energy demands 2013. [CrossRef]
- Oke, T.R.; Mills, G.; Christen, A.; Voogt, J.A. Urban Climates; Cambridge University Press: Cambridge, UK, 2017. [Google Scholar] [CrossRef]
- Santamouris, M. Cooling the cities – A review of reflective and green roof mitigation technologies to fight heat island and improve comfort in urban environments 2015. [CrossRef]
- Khaire Madrigal, L. O.; Lanzarote, B. S. J.D. Outdoor thermal comfort in built environment: A review of studies in India 2024. [CrossRef]
- Klemm, W.; Heusinkveld, B.G.; Lenzholzer, S.; Jacobs, M.H.; Van Hove, B. Psychological and physical impact of urban green spaces on outdoor thermal comfort during summertime in The Netherlands. Build. Env. 2015, 83, 120–8. [Google Scholar] [CrossRef]
- Andreou, E. The effect of urban layout, street geometry and orientation on shading conditions in urban canyons in the Mediterranean. Renew. Energy 2014, 63, 587–96. [Google Scholar] [CrossRef]
- Bowler, D.E.; Buyung-Ali, L.; Knight, T.M.; Pullin, A.S. Urban greening to cool towns and cities: A systematic review of the empirical evidence. Landsc. Urban Plan 2010, 97, 147–55. [Google Scholar] [CrossRef]
- Norton, B.A.; Coutts, A.M.; Livesley, S.J.; Harris, R.J.; Hunter, A.M.; Williams, N.S. Planning for cooler cities: A framework to prioritise green infrastructure to mitigate high temperatures in urban landscapes 2015. [CrossRef]
- Huang, X.; Yao, R.; Halios, C.H.; Kumar, P.; Li, B. Integrating green infrastructure, design scenarios, and social-ecological-technological systems for thermal resilience and adaptation: Mechanisms and approaches. Renew. Sustain. Energy Rev. 2025, 212, 115422. [Google Scholar] [CrossRef]
- Erell, E.; Pearlmutter, D.; Williamson, T. Urban microclimate : designing the spaces between buildings; Routledge: London, UK, 2015. [Google Scholar]
- Arnfield, A.J. Two decades of urban climate research: A review of turbulence, exchange of energy and water and the urban heat island. Int. J. Climatol. 2003, 23, 1–6. [Google Scholar] [CrossRef]
- Thorsson, S.; Rocklöv, J.; Konarska, J.; Lindberg, F.; Holmer, B.; Dousset, B.; Rayner, D. Mean radiant temperature – A predictor of heat related mortality. Urban Clim. 2014, 10, 332–45. [Google Scholar] [CrossRef]
- Lindberg, F.; Holmer, B.; Thorsson, S. SOLWEIG 1.0 - Modelling spatial variations of 3D radiant fluxes and mean radiant temperature in complex urban settings. Int. J. Biometeorol. 2008, 52, 697–713. [Google Scholar] [CrossRef]
- Nasrollahi, N.; Namazi, Y.; Taleghani, M. The effect of urban shading and canyon geometry on outdoor thermal comfort in hot climates: A case study of Ahvaz, Iran. Sustain Cities Soc. 2021, 65, 102638. [Google Scholar] [CrossRef]
- Narimani, N.; Karimi, A.; Brown, R.D. Effects of street orientation and tree species thermal comfort within urban canyons in a hot, dry climate. Ecol. Inf. 2022, 69, 101671. [Google Scholar] [CrossRef]
- Karimimoshaver, M.; Khalvandi, R.; Khalvandi, M. The effect of urban morphology on heat accumulation in urban street canyons and mitigation approach. Sustain Cities Soc. 2021, 73, 103127. [Google Scholar] [CrossRef]
- Ali-Toudert, F.; Mayer, H. Numerical study on the effects of aspect ratio and orientation of an urban street canyon on outdoor thermal comfort in hot and dry climate. Build. Env. 2006, 41, 94–108. [Google Scholar] [CrossRef]
- Johansson, E.; Emmanuel, R. The influence of urban design on outdoor thermal comfort in the hot, humid city of Colombo, Sri Lanka. Int. J. Biometeorol. 2006, 51, 119–33. [Google Scholar] [CrossRef] [PubMed]
- Karjalainen, S. Thermal comfort and gender: a literature review. Indoor Air 2012, 22, 96–109. [Google Scholar] [CrossRef] [PubMed]
- Elnabawi, M.H.; Hamza, N. A Behavioural Analysis of Outdoor Thermal Comfort: A Comparative Analysis between Formal and Informal Shading Practices in Urban Sites. Sustainability 2020, Vol 12 12, 9032. [Google Scholar] [CrossRef]
- Cui, D.; Zhang, Y.; Li, X.; Yuan, L.; Mak, C.M.; Kwok, K. Effects of different vertical façade greenery systems on pedestrian thermal comfort in deep street canyons. Urban Urban Green 2022, 72, 127582. [Google Scholar] [CrossRef]
- Li, Z.; Zhang, H.; Juan, Y.-H.; Lee, Y.-T.; Wen, C.-Y.; Yang, A.-S. Effects of urban tree planting on thermal comfort and air quality in the street canyon in a subtropical climate. Sustain Cities Soc. 2023, 91. [Google Scholar] [CrossRef]
- Mohammad, P.; Aghlmand, S.; Fadaei, A.; Gachkar, S.; Gachkar, D.; Karimi, A. Evaluating the role of the albedo of material and vegetation scenarios along the urban street canyon for improving pedestrian thermal comfort outdoors. Urban Clim. 2021, 40, 100993. [Google Scholar] [CrossRef]
- Segura, R.; Krayenhoff, E.S.; Martilli, A.; Badia, A.; Estruch, C.; Ventura, S.; Villalba, G. How do street trees affect urban temperatures and radiation exchange? Observations and numerical evaluation in a highly compact city. Urban Clim. 2022, 46. [Google Scholar] [CrossRef]
- Chen, Y.; Liu, F.; Lin, X.; Liu, J.; Chen, Z.; Shi, K.; Li, J.; Dong, J.; Jim, C.Y.; Martin, T.A.; Chen, Y.; Liu, F.; Lin, X.; Liu, J.; Chen, Z.; Shi, K.; Li, J.; Dong, J. Combined Effects of the Thermal-Acoustic Environment on Subjective Evaluations in Urban Park Based on Sensory-Walking. Forests 2023, Vol 14 14, 1161. [Google Scholar] [CrossRef]
- Cheung, P.K.; Jim, C.Y. Subjective outdoor thermal comfort and urban green space usage in humid-subtropical Hong Kong. Energy Build. 2018, 173, 150–62. [Google Scholar] [CrossRef]
- Lai, D.; Chen, C. Comparison of the linear regression, multinomial logit, and ordered probability models for predicting the distribution of thermal sensation. Energy Build. 2019, 188–189, 269–77. [Google Scholar] [CrossRef]
- Li, Y.; Nian, X.; Gu, C.; Deng, P.; He, S.; Hong, B. Assessing children’s outdoor thermal comfort with facial expression recognition: An efficient approach using machine learning. Build. Env. 2024, 258, 111556. [Google Scholar] [CrossRef]
- Xi, T.; Wang, M.; Cao, E.; Li, J.; Wang, Y.; Sa’ad, S.U. Preliminary Research on Outdoor Thermal Comfort Evaluation in Severe Cold Regions by Machine Learning. Buildings 2024, Vol 14(Page 284 14), 284. [Google Scholar] [CrossRef]
- Eslamirad, N.; Malekpour Kolbadinejad, S.; Mahdavinejad, M.; Mehranrad, M. Thermal comfort prediction by applying supervised machine learning in green sidewalks of Tehran. Smart Sustain. Built Environ. 2020, 5, 511–28. [Google Scholar] [CrossRef]
- JASP Team. JASP - Computer software. 2026. [Google Scholar] [CrossRef]
- Matzarakis, A.; Rutz, F.; Mayer, H. Modelling radiation fluxes in simple and complex environments - Application of the RayMan model. Int. J. Biometeorol. 2007, 51, 323–34. [Google Scholar] [CrossRef] [PubMed]
- Van Hoof, J. Forty years of Fanger’s model of thermal comfort: comfort for all? Indoor Air 2008, 18, 182–201. [Google Scholar] [CrossRef] [PubMed]
- McKenna, Z.J.; Foster, J.; Atkins, W.C.; Belval, L.N.; Watso, J.C.; Jarrard, C.P.; Orth, B.D.; Crandall, C.G. Age alters the thermoregulatory responses to extreme heat exposure with accompanying activities of daily living. J. Appl. Physiol. 2023, 135, 445–55. [Google Scholar] [CrossRef] [PubMed]
- Chudecka, M.; Lubkowska, A.; Kempińska-Podhorodecka, A. Body surface temperature distribution in relation to body composition in obese women. J. Therm. Biol. 2014, 43, 1–6. [Google Scholar] [CrossRef] [PubMed]
- Taleghani, M.; Kleerekoper, L.; Tenpierik, M.; Van Den Dobbelsteen, A. Outdoor thermal comfort within five different urban forms in the Netherlands. Build. Env. 2015, 83, 65–78. [Google Scholar] [CrossRef]
- Baker, F.C.; Siboza, F.; Fuller, A. Temperature regulation in women: Effects of the menstrual cycle. Temperature 2020, 7, 226–62. [Google Scholar] [CrossRef] [PubMed]
- Foster, J.; Hodder, S.G.; Lloyd, A.B.; Havenith, G. Individual Responses to Heat Stress: Implications for Hyperthermia and Physical Work Capacity. Front Physiol. 2020, 11, 541483. [Google Scholar] [CrossRef] [PubMed]
- Périard, J.D.; Eijsvogels, T.M.H.; Daanen, H.A.M. Exercise under heat stress: Thermoregulation, hydration, performance implications, and mitigation strategies. Physiol. Rev. 2021, 101, 1873–979. [Google Scholar] [CrossRef] [PubMed]
- Pałka, T.; Rydzik, Ł.; Koteja, P.M.; Piotrowska, A.; Bagińska, M.; Ambroży, T.; Angelova-Igova, B.; Javdaneh, N.; Wiecha, S.; Filip-Stachnik, A.; Tota, Ł. Effect of Various Hydration Strategies on Work Intensity and Selected Physiological Indices in Young Male Athletes during Prolonged Physical Exercise at High Ambient Temperatures. J. Clin. Med. 2024, Vol 13 13, 982. [Google Scholar] [CrossRef] [PubMed]
- Roca, J.; Sanromà-Ortiz, M.; Cemeli, T.; Tort-Nasarre, G.; Santamaría, A.L.; Espart, A.; Cantos-Puig, C.; Campoy, C. Health Interventions for the Prevention of Dehydration in Agricultural Workers Exposed to Heat Stress: A Systematic Review. Healthcare 2025, 13, 1232. [Google Scholar] [CrossRef] [PubMed]
- Nikolopoulou, M.; Nikolopoulou, M. Outdoor thermal comfort. Front. Biosci.-Sch. 2011, 3((4) 3), 1552–68. [Google Scholar] [CrossRef] [PubMed]
- Havenith, G. Individualized model of human thermoregulation for the simulation of heat stress response. J. Appl. Physiol. 2001, 90, 1943–54. [Google Scholar] [CrossRef] [PubMed]
- ASHRAE. Standard 55 – Thermal Environmental Conditions for Human Occupancy. American Society of Heating, Refrigerating and Air-Conditioning Engineers. 2020. Available online: https://www.ashrae.org/technical-resources/bookstore/standard-55-thermal-environmental-conditions-for-human-occupancy (accessed on 16 September 2025).
- Akbari, H.; Pomerantz, M.; Taha, H. Cool surfaces and shade trees to reduce energy use and improve air quality in urban areas. Sol. Energy 2001, 70, 295–310. [Google Scholar] [CrossRef]
- De Dear, R.; Brager, G.S. The adaptive model of thermal comfort and energy conservation in the built environment. Int. J. Biometeorol. 2001, 45, 100–8. [Google Scholar] [CrossRef]
- Aminipouri, M.; Knudby, A.J.; Krayenhoff, E.S.; Zickfeld, K.; Middel, A. Modelling the impact of increased street tree cover on mean radiant temperature across Vancouver’s local climate zones. Urban Urban Green 2019, 39, 9–17. [Google Scholar] [CrossRef]
- Thom, J.K.; Coutts, A.M.; Broadbent, A.M.; Tapper, N.J. The influence of increasing tree cover on mean radiant temperature across a mixed development suburb in Adelaide, Australia. Urban Urban Green 2016, 20, 233–42. [Google Scholar] [CrossRef]
- Hair, J.F.; Black, W.C.; Babin, B.J.; Anderson, R.E. Multivariate data analysis, 8th ed.). 8th ed.; Cengage Learning, 2019. [Google Scholar]
- Stevens, J.P. Applied Multivariate Statistics for the Social Sciences, 5th ed.; Routledge, 2012. [Google Scholar] [CrossRef]
- Tabachnick, B.G.; FLS. Using Multivariate Statistics, 7th ed.). 7th ed.; Pearson, 2019. [Google Scholar]
- Barcikowski, R.S.; Stevens, J.P. A Monte Carlo Study of the Stability of Canonical Correlations, Canonical Weights and Canonical Variate-Variable Correlations. Multivar. Behav. Res. 1975, 10, 353–64. [Google Scholar] [CrossRef] [PubMed]
- Lin, T.P. Thermal perception, adaptation and attendance in a public square in hot and humid regions. Build. Env. 2009, 44, 2017–26. [Google Scholar] [CrossRef]
- Cabanac, M. Physiological Role of Pleasure. Science 1979) 1971, 173, 1103–7. [Google Scholar] [CrossRef] [PubMed]
Figure 1.
Multi-step data analysis workflow.
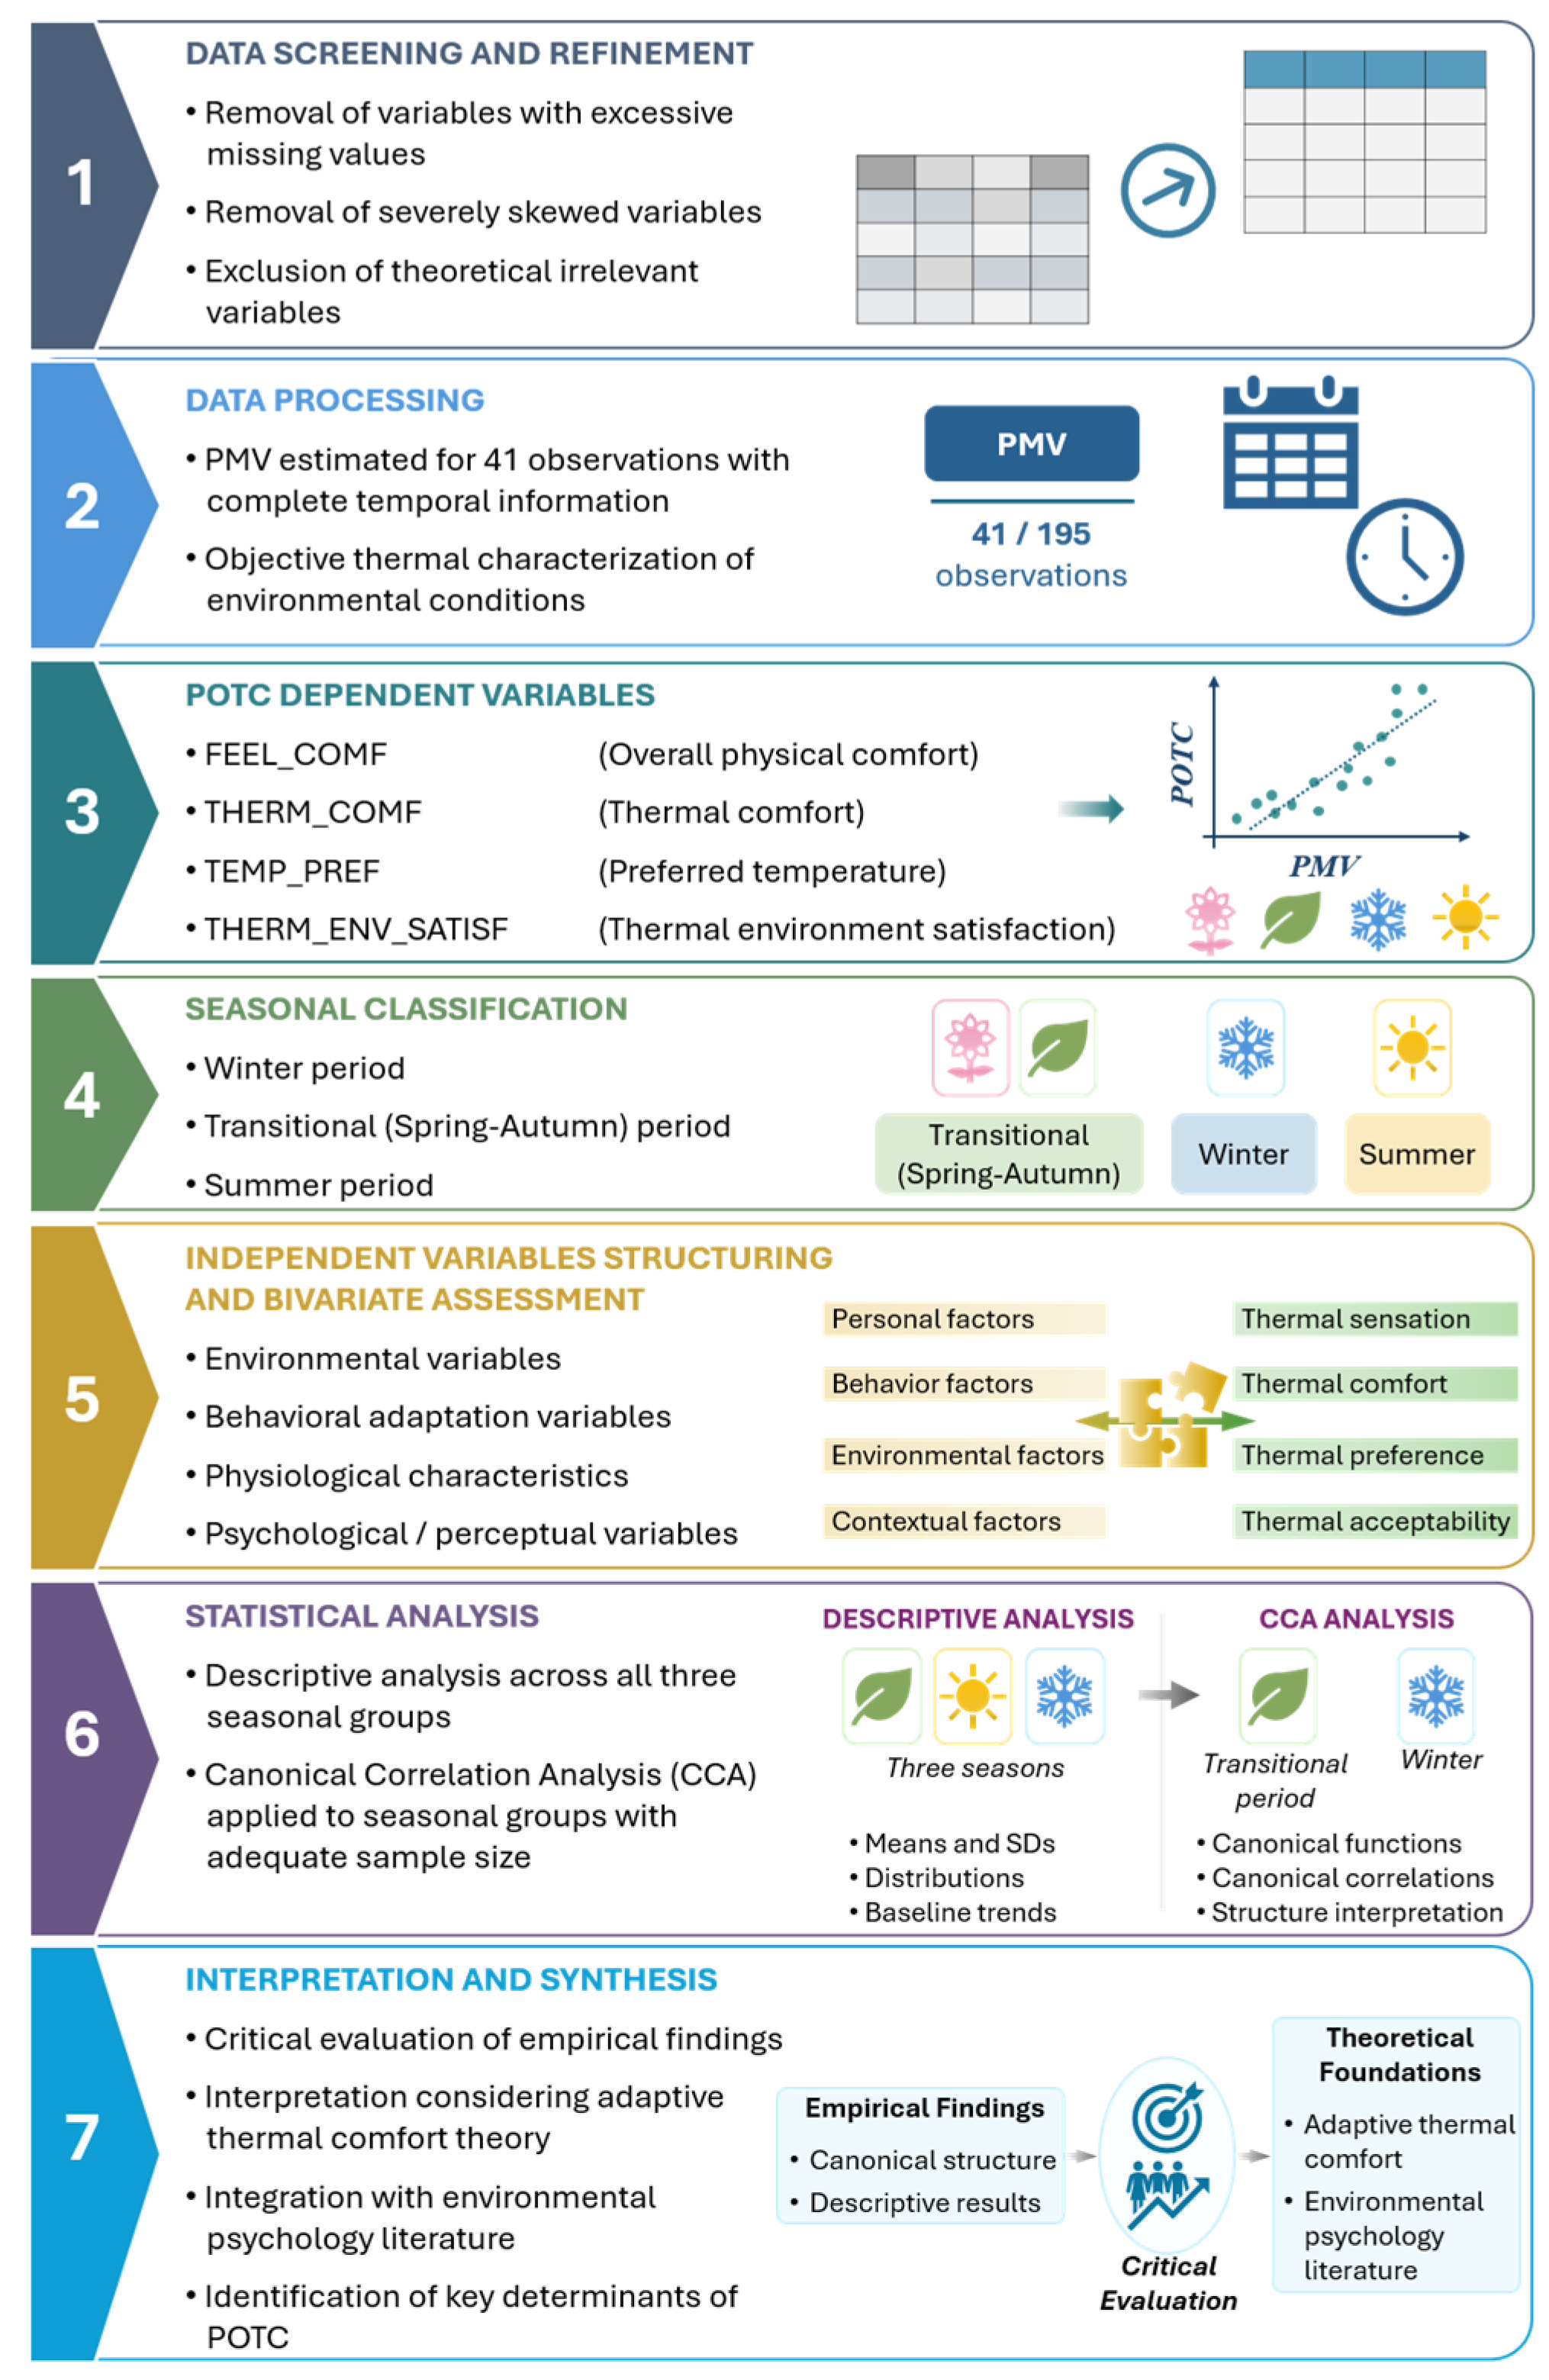

Table 1.
Definitions and descriptive statistics of the survey variables (N: non-missing cases; M: mean; SD: standard deviation).
Table 1.
Definitions and descriptive statistics of the survey variables (N: non-missing cases; M: mean; SD: standard deviation).
| Name | Definition (units) | N | Descriptive measures |
| MALE | Gender dummy | 195 | Male: 61 (31.3%); female: 134 (68.7%) |
| AGE | Age (years) | 195 | M=41.92, SD=12.241, min=15, max=87, |
| WEIGHT | Weight (kg) | 195 | M=71.78, SD=12.894, min=40, max=95 |
| HEIGHT | Height (cm) | 195 | M=168.98, SD=9.567, min=150, max=190, |
| BMI | Body Mass Index (BMI, dimensionless) | 195 | M=25.078, SD=3.847, min=15.1, max=42.2 |
| MARITAL | Marital status (categorical) | 192 | Married 99 (51.6%); single: 80 (41.7%); divorced 12 (6.3%); widowed 1 (0.5%) |
| KIDS | Number of children (dimensionless) | 92 | One child: 39 (42.4%); two children: 48 (52.2%)’ three or more children: 5 (5.4%) |
| EDUCATION | Educational level (categorical) | 195 | Primary: 2 (1%); lower secondary: 4 (2.1%); upper secondary: 49 (25.1%); college/vocational: 23 (11.8%); university/Bachelor’s: 45 (23.1%); graduate/Master’s: 52 (26.7%); PhD: 9 (4.6%); postdoc: 4 (2.1%); other: 7 (3.6%) |
| PROF | Profession (categorical) | 186 | Private sector employee: 70 (37.6%); public sector employee: 38 (20.4%); self-employed: 37 (19.9%); unemployed: 11 (5.9%); student: 10 (5.4%); retired: 9 (4.8%); homemaker: 6 (3.2%); military 5 (2.7%) |
| INCOME | Annual income (euros) | 195 | M=12,423.08, SD=9,850.388, min=0, max=45,000 |
| LOCAL | Local resident (dummy) | 195 | Local: 10 (5.1%); visitor: 185 (94.9%) |
| NATIONALITY | Greek citizenship (dummy) | 195 | Greek citizen: 193 (99%); non Greek resident: 2 (1%) |
| SEASON | Season of visit (categorical) | 185 | Winter: 52 (28.1%); spring: 45 (24.3%); summer: 18 (9.7%); autumn: 70 (37.8%) |
| HOUR | Hour of visit (hours:minutes) | 186 | 6:01 to 12:00: 21 (11.3%); 12:01 to 18:00: 100 (53.8%); 18:01 to 24:00: 65 (34.9%) |
| DURATION | Duration of stay (minutes) | 193 | 0 to 15 mins: 5 (2.6%); 16 to 30 mins: 17 (8.8%); 31 to 45 mins: 18 (9.3%); 46 to 60 mins: 32 (16.6%); over 60 mins: 121 (62.7%) |
| CLOΤHtype | Clothing type (categorical) | 175 | Winter: 55 (31.4%); spring: 55 (31.4%); light summer: 44 (25.1); sports summer: 20 (11.4%); male suit: 1 (0.6%) |
| CLOTH_MATERIAL | Clothing material (categorical) | 115 | Cotton: 60 (52.2%); linen: 14 (12.2%); polyester: 12 (10.4%); thin wool: 12 (10.4%); thick wool: 10 (8.7%); acrylic: 4 (3.5%); polypropylene: 2 (1.7%); cashmere: 1 (0.9%); |
| CLOTH_COLOR | Mostly dark clothing (dummy) | 162 | Mostly dark clothing: 90 (55.6%); not mostly dark clothing: 72 (44.4%) |
| ACCESSORY | Clothing accessory (categorical) | 147 | Glasses: 104 (70.7%); scarf: 23 (15.6%); glasses and hat: 10 (6.8%); headwrap: 6 (4.1%); hat: 4 (2.7%) |
| POSITION | Body position (categorical) | 182 | Walking on sidewalk: 126 (69.2%); walking on road: 31 (17%); standing on sidewalk: 15 (8.2%); standing on road: 6 (3.3%); running on sidewalk: 3 (1.6%); running on road: 1 (0.5%) |
| ACTIVITY | Activity | 186 | Standing and performing light work: 101 (54.3%); standing and talking: 44 (23.7%); sitting and talking: 32 (17.2%); sitting immobile: 4 (2.2%); standing and performing hard work: 4 (2.2%); resting: 1 (0.5%); |
| ACT_INTEN | Activity intensity | 86 | Very mild: 66 (76.7%); mild: 17 (19.8%); intense: 2 (2.3%); very intense: 1 (1.2%) |
| CLOTH_SWEATY | Exertional clothing sweat (dummy) | 80 | Sweaty: 13 (16.3%); not sweaty: 67 (83.8%) |
| WIPE_SWEAT | Wiped sweat after sports (dummy) | 72 | Wiped sweat: 15 (20.8%); did not wipe sweat: 57 (79.2%) |
| EXERCISE | Exercise 2–3 times per week (dummy) | 194 | Exercised 2–3 times per week: 109 (56.2%); did not exercise 2–3 times per week: 85 (43.8%) |
| EAT | Eating while in the area | 195 | Eating: 69 (35.4%); not eating: 126 (64.6%) |
| DRINK | Drinking while in the area | 195 | Drinking: 104 (53.3%); not drinking: 91 (46.7%) |
| ALLERIES | Have allergies (dummy) | 186 | Have allergies: 43 (23.1%); does not have allergies: 143 (76.9%) |
| HORMONAL | Have hormonal problem (dummy) | 187 | Have hormonal problem: 26 (13.9%); does not have hormonal problem: 161 (86.1%) |
| MEDICATION | Taking medication (dummy) | 178 | Taking medication: 22 (12.4%); not taking medication: 156 (87.6%) |
| VISIT | Purpose of visit | 194 | Leisure: 183 (94.3%); physical activity: 6 (3.1%); work: 5 (2.6%) |
| ANXIOUS | Anxious or stressed (dummy) | 171 | Anxious or stressed: 11 (6.4%); not anxious or stressed: 160 (93.6%) |
| NOISE | Unpleasant noise (dummy) | 177 | Unpleasant noise: 24 (13.6%); no unpleasant noise: 153 (86.4%) |
| CITY_PERSON | Preference for urban environment (Likert) | 195 | M=4.23, SD=1.665, min=1, max=7 |
| DEVICE | Use of cell phone, tablet or laptop (dummy) | 183 | Used device: 141 (77%); did not use device: 42 (23%) |
| CELL_FEEL_GOOD | Cell phone usage felt good (dummy) | 88 | Cell phone usage felt good: 58 (65.9%); cell phone usage did not feel good: 30 (34.1%( |
| GARB | Litter at location (dummy) | 154 | Litter present at location: 21 (13.6%); no litter present at location: 133 (86.4%) |
| GARB_UNPL | Quantity of litter perceived as unpleasant (dummy) | 55 | Quantity of litter unpleasant: 4 (7.3%); quantity of litter not unpleasant: 51 (92.7%) |
| GARB_SMELL | Unpleasant litter smell (dummy) | 103 | Unpleasant litter smell: 3 (2.9%); no unpleasant litter smell: 100 (97.1%) |
| REAS_LAB | Reason for selecting location (categorical) | 178 | Beautiful landscape: 99 (55.6%); convenient: 24 (13.5%); just passing: 24 (13.5%); quiet: 16 (9%); clean air: 7 (3.9%); safe: 5 (2.8%); thermally comfortable: 3 (1.5%) |
| SUNNY | Sunny (dummy) | 183 | Sunny: 128 (69.9%); not sunny: 55 (30.1%) |
| FEEL_COMF | Felt comfortable (Likert) | 191 | M=5.86, SD=1.069, min=1 (not at all comfortable), max=7 (very comfortable) |
| THERM_COMF | Perceived thermal sensation (bipolar Likert) | 179 | M=−0.07, SD=1.603, min=−3 (cold), max=3 (hot) |
| THERM_COMF_PAV | More thermal comfort near pavement (dummy) | 110 | Higher thermal comfort near pavement: 43 (39.1); not higher thermal comfort near pavement: 67 (60.9%) |
| TEMP_PREF | Temperature comfort rating (Likert) | 195 | M=4.38, SD=1.166, min=1 (extremely unpleasant), max=7 (extremely pleasant) |
| THERM_ENV_SATISF | Thermal environment satisfaction (Likert) | 179 | M=5.2, SD=1.03, min=2 (very displeased), max=7 (very pleased) |
| HUMIDΙΤΥ | Perceived air humidity (bipolar Likert) | 160 | M=0.33, SD=0.976, min=−3 (extremely dry), max=3 (extremely humid) |
| DISCOM_DRY_ITCH | Felt thermal discomfort, dryness, and itching (dummy) | 171 | Felt discomfort: 2 (1.2%); did not feel discomfort: 169 (98.8%) |
| STICKY | Perceived air as sticky (dummy) | 156 | Air felt sticky: 21 (13.5%); air did not feel sticky: 135 (86.5%) |
| SWEATY | Perception of being sweaty (dummy) | 169 | Sweaty: 26 (15.4%); not sweaty: 143 (84.6%) |
| WIND | Perceived wind presence in the area (dummy) | 154 | Wind present: 52 (33.8%); wind not present: 102 (66.2%) |
| AIR_CHANGE | Preferred change in air flow (bipolar Likert) | 195 | No change: 132 (67.7%); more air: 36 (18.5%); Less air: 27 (13.8%) |
| TALL_BUILD | Presence of tall buildings in the area (dummy) | 164 | Tall buildings: 21 (12.8%); no tall buildings: 143 (87.2%) |
| RELAX | Perceived sufficiency of recreational and relaxation space in the area | 195 | M=1.77, SD=0.547, min=0 (not enough), max=2 (enough) |
| VEG_SUFF | Subjective assessment of vegetation sufficiency | 195 | M=−0.159, SD=1.316, min=−3 (extremely insufficient), max=3 (extremely sufficient) |
| SHADE_NATUR | Natural shading present in the area (dummy) | 170 | Natural shading present: 92 (54.1%); natural shading not present: 78 (45.9%) |
| SHADE_ARTIF | Artificial shading present in the area (dummy) | 170 | Artificial shading present: 109 (64.1%); artificial shading not present: 61 (35.9%) |
| SHADE_SUFF | Perceived sufficiency of shading | 170 | M=−0.03, SD=1.428, min=−3 (very insufficient), max=3 (very sufficient) |
| NAT_LIGHT | Presence of sunlight (dummy) | 183 | Sunlight: 143 (78.1); no sunlight: 40 (21.9%) |
| ARTIF_ILLUM | Presence of artificial illumination | 183 | Artificial illumination: 78 (42.6%); no artificial illumination: 105 (57.4%) |
| SUN_INT | Sunlight intensity | 195 | M=4.46, SD=1.73, min=1, max=7 |
| INT_NAT_ILL_PAV | Intensity of natural light near pavement | 167 | M=4.51, SD=1.563, min=1, max=7 |
| INT_ARTIF_ILL | Intensity of artificial illumination | 195 | M=3.59, SD=1.654, min=1, max=7 |
| INT_ARTIF_ILL_PAV | Intensity of artificial illumination near pavement | 167 | M=3.61, SD=1.657, min=1, max=7 |
| INTERVΕΝΤΙOΝ | Perceived need for additional interventions | 195 | Additional interventions needed: 114 (58.5%); no additional interventions needed: 81 (41.5%) |
| MORE_TREE_SHADE | Perceived need for additional tree shading | 174 | M=5.38, SD=1.6, min=1 (not at all important), max=7 (very important) |
| MORE_ARTIF_SHADE | Perceived need for more artificial shading near pedestrian areas | 172 | M=4.6, SD=1.753, min=1 (not at all important), max=7 (very important) |
| PAV_COLOR | Perceived need for pavement color change for visual comfort | 171 | M=3.93, SD=1.83, min=1 (not at all important), max=7 (very important) |
| GREEN_COOL | Perceived need for more green spaces for cooling | 173 | M=5.7, SD=1.526, min=1 (not at all important), max=7 (very important) |
| WATER_COOL | Perceived need for fountains or water walls to improve cooling | 173 | M=4.95, SD=1.958, min=1 (not at all important), max=7 (very important) |
| WIDE_SIDEWALK | Perceived need for sidewalk widening for comfort | 174 | M=4.34, SD=2.001, min=1 (not at all important), max=7 (very important) |
| BRIEF_STOPS | Perceived need for more benches and brief resting stops | 174 | M=4.98, SD=1.713, min=1 (not at all important), max=7 (very important) |
| SMART_STOPS | Perceived need for smart shaded rest stops with device charging | 173 | M=4.93, SD=1.86, min=1 (not at all important), max=7 (very important) |
Table 2.
Descriptive statistics of Predicted Mean Vote (PMV) across different seasons (N: number of cases; SD: standard deviation; Min: minimum; Max: maximum).
Table 2.
Descriptive statistics of Predicted Mean Vote (PMV) across different seasons (N: number of cases; SD: standard deviation; Min: minimum; Max: maximum).
| Season | N | Mean | SD | Min | Max |
| Winter | 23 | −2.087 | 0.785 | −3 | −0.5 |
| Spring | 6 | 0.533 | 1.520 | −0.9 | 2.6 |
| Summer | 5 | 1.520 | 1.333 | 0.2 | 3 |
| Autumn | 7 | 1.029 | 1.426 | −0.5 | 3 |
| All year | 41 | −0.732 | 1.893 | −3 | 3 |
Table 3.
Descriptive statistics of subjective thermal perception variables (SD: standard deviation; Min: minimum; Q1: first quartile; Q3: third quartile; Max: maximum).
Table 3.
Descriptive statistics of subjective thermal perception variables (SD: standard deviation; Min: minimum; Q1: first quartile; Q3: third quartile; Max: maximum).
| Variable | Mean | SD | Min | Q1 | Median | Q3 | Max |
| FEEL_COMF | 5.78 | 1.29 | 0 | 6 | 6 | 7 | 7 |
| THERM_DEV | 1.66 | 0.90 | 0 | 1 | 2 | 2 | 3 |
| TEMP_PREF | 4.41 | 1.13 | 1 | 4 | 4 | 5 | 7 |
| THERM_ENV_SATISF | 5.23 | 1.04 | 2 | 4 | 6 | 6 | 7 |
Table 4.
Descriptive statistics of PMV_Dev and the dependent variables per season (N: number of cases; M: mean; SD: standard deviation; Min: minimum; Max: maximum).
Table 4.
Descriptive statistics of PMV_Dev and the dependent variables per season (N: number of cases; M: mean; SD: standard deviation; Min: minimum; Max: maximum).
| Season | Statistic | PMV_Dev | FEEL_COMF | THERM_DEV | TEMP_PREF | THERM_ENV_SATISF |
| Winter | N Mean StDev Min Max |
23 0.913 0.785 0.0 2.5 |
51 5.706 1.346 1.0 7.0 |
49 1.347 1.110 0.0 3.0 |
52 4.308 1.351 1.0 7.0 |
48 4.917 1.2 2.0 7.0 |
| Spring | N Mean StDev Min Max |
6 1.867 1.054 0.4 3.0 |
45 6.044 0.999 2.0 7 |
40 1.875 0.757 1.0 3.0 |
45 4.622 1.051 2.0 7.0 |
40 5.525 0.933 4.0 7.0 |
| Summer | N Mean StDev Min Max |
5 1.480 1.333 0.0 2.8 |
17 5.588 1.004 4.0 7.0 |
17 1.647 0.862 0.0 3.0 |
18 4.111 1.183 1.0 6.0 |
17 5 0.791 4.0 6.0 |
| Autumn | N Mean StDev Min Max |
7 1.771 1.227 0.0 2.8 |
69 5.957 0.865 3.0 7.0 |
66 1.773 0.760 1.0 3.0 |
70 4.429 0.972 2.0 7.0 |
66 5.333 0.966 3.0 7.0 |
| All year | N Mean StDev Min Max |
41 1.268 1.028 0.0 3.0 |
191 5.859 1.069 1.0 7.0 |
179 1.682 0.908 0.0 3.0 |
195 4.379 1.166 1.0 7.0 |
179 5.201 1.03 2.0 7.0 |
Table 5.
Summary of statistical associations (t-tests or Pearson’s correlation coefficient) between individual attributes and dependent variables, stratified by seasonal period (n.d.=not enough data; *=Welch test for unequal variances).
Table 5.
Summary of statistical associations (t-tests or Pearson’s correlation coefficient) between individual attributes and dependent variables, stratified by seasonal period (n.d.=not enough data; *=Welch test for unequal variances).
| FEEL_COMF | THERM_DEV | TEMP_PREF | THERM_ENV_SATISF | |||||||||
| Wint | Spr–Aut | Sum | Wint | Spr–Aut | Sum | Wint | Spr–Aut | Sum | Wint | Spr–Aut | Sum | |
| MALE | t=1.242 p=0.22 |
t=−3.372 p=0.001 |
t=−0.761 p=0.459 |
t=1.351 p=0.183 |
t=0.708 p=0.48 |
n.d. | t=1.838 p=0.072 |
t=0.971 p=0.334 |
t=−1.662 0.116 |
t=2.855 p=0.006 |
t=−0.773 p=0.441 |
t=0.0 p=1.0 |
| AGE | r=0.113 p=0.43 |
r=−0.002 p=0.984 |
r=−0.261 p=0.312 |
r=0.064 p=0.661 |
r=−0.027 p=0.784 |
r=−0.199 p=0.445 |
r=0.219 p=0.118 |
r=0.216 p=0.021 |
r=−0.23 p=0.359 |
r=0.079 p=0.592 |
r=0.144 t=0.141 |
r=−0.027 p=0.917 |
| WEIGHT | r=−0.007 p=0.963 |
r=−0.114 p=0.227 |
r=−0.15 p=0.565 |
r=0.228 p=0.115 |
r=−0.04 p=0.682 |
r=−0.112 p=0.669 |
r=0.246 p=0.079 |
r=0.103 p=0.276 |
r=−0.173 p=0.494 |
r=0.118 p=0.423 |
r=−0.051 p=0.605 |
r=0.066 p=0.801 |
| HEIGHT | r=0.274 p=0.052 |
r=−0.205 p=0.028 |
r=−0.07 p=0.789 |
r=0.059 p=0.685 |
r=−0.079 p=0.42 |
r=−0.464 p=0.061 |
r=0.23 p=0.1 |
r=−0.04 p=0.672 |
r=−0.104 p=0.681 |
r=0.254 p=0.081 |
r=−0.028 p=0.772 |
r=−0.047 p=0.857 |
| BMI | r=−0.275 p=0.051 |
r=0.031 p=0.741 |
r=−0.113 p=0.665 |
r=0.245 p=0.09 |
r=0.037 p=0.709 |
r=0.221 p=394 |
r=104 p=0.463 |
r=0.166 p=0.077 |
r=−0.123 p=0.627 |
r=−0.083 p=0.576 |
r=−0.033 p=0.736 |
r=0.122 p=0.64 |
| CLOTHtype | n.d. | r=0.037 p=0.708 |
r=−0.181 p=0.503 |
n.d. | r=0.311 p=0.002 |
r=−0.084 p=0.756 |
n.d. | r=0.023 p=0.813 |
r=0.449 p=0.07 |
n.d. | r=0.19 p=0.058 |
r=−0.048 p=0.859 |
| CLOΤHcolor | t=−1.301 p=0.2 |
t=−0.016 p=0.987 |
t=0.713 p=0.491 |
t=1.358 p=0.181 |
t=−1.423 p=0.158 |
t=0.277 p=0.787 |
t=0.758 p=0.453 |
t=0.113 p=0.911 |
t=0.353 p=0.731 |
t=0.907 p=0.37 |
t=−0.223 p=0.824 |
t=0.498 p=0.628 |
| HORMONAL | t=−0.801 p=0.428 |
t=1.555 p=0.123 |
t=−1.888 p=0.079 |
t=−0.509 p=0.613 |
t=−3.684* p=0.001 |
t=0.772 p=0.452 |
t=−1.238 p=0.222 |
t=−1.242 p=0.217 |
t=0.886 p=0.389 |
t=−2.113 p=0.041 |
t=0.248 p=0.804 |
t=−0.795 p=0.439 |
| CITY_ PERSON |
r=−0.043 p=0.766 |
r=0.207 p=0.027 |
r=−0.096 p=0.713 |
r=−0.015 p=0.918 |
r=0.003 p=0.979 |
r=0.294 p=0.253 |
r=0.008 p=0.953 |
r=0.339 p<0.001 |
r=0.756 p<0.001 |
r=−0.185 p=0.209 |
r=0.103 p=0.292 |
r=−0.056 p=0.831 |
Table 6.
Summary of statistical associations (t-tests or Pearson’s correlation coefficient) between ambient conditions and dependent variables, stratified by seasonal period (n.d.=not enough data; *=Welch’s t-test for unequal variances).
Table 6.
Summary of statistical associations (t-tests or Pearson’s correlation coefficient) between ambient conditions and dependent variables, stratified by seasonal period (n.d.=not enough data; *=Welch’s t-test for unequal variances).
| FEEL_COMF | THERM_DEV | TEMP_PREF | THERM_ENV_SATISF | |||||||||
| Wint | Spr–Aut | Sum | Wint | Spr–Aut | Sum | Wint | Spr–Aut | Sum | Wint | Spr–Aut | Sum | |
| SUNNY | t=1.339 p=0.187 |
t=−0.266 p=0.791 |
t=−0.621 p=0.544 |
t=2.59 p=0.013 |
t=0.289 p=0.773 |
t=0.528 p=0.606 |
t=1.989 p=0.052 |
t=−0.888 p=0.376 |
t=−0.308 p=0.762 |
t=3.621 p<0.001 |
t=2.36 p=0.02 |
t=−1.577 p=0.137 |
| HUMIDITY | r=0.149 p=0.319 |
r=0.012 p=0.912 |
r=−0.011 p=0.968 |
r=−0.255 p=0.088 |
r=−0.016 p=0.884 |
r=0.14 p=0.62 |
t=−0.291 p=0.047 |
r=−0.144 p=0.172 |
r=0.48 p=0.07 |
r=−0.234 p=0.122 |
r=−0.105 p=0.332 |
r=−0.085 p=0.762 |
| STICKY | t=−0.867 p=0.391 |
t=−0.887 p=0.378 |
t=−0.916 p=0.378 |
t=−1.03 p=0.309 |
t=−2.013 p=0.047 |
t=−0.54 p=0.599 |
t=−2.924 p=0.005 |
t=−1.511 p=0.134 |
t=−0.082 p=0.936 |
t=−1.547 p=0.13 |
t=−2.731 p=0.008 |
t=−2.074 p=0.06 |
| WIND | t=0.043 p=0.966 |
t=1.254 p=0.213 |
t=−0.354 p=0.729 |
t=−2.401 p=0.021 |
t=1.07 p=0.288 |
t=0.704 p=0.494 |
t=−1.493 p=0.142 |
t=0.525 p=0.601 |
t=0.288 p=0.778 |
t=−2.07 p=0.045 |
t=0.003 p=0.998 |
t=0 p=1 |
| AIR_CHANGE_MORE | t=−0.051 p=0.959 |
t=−0.221 p=0.826 |
t=−0.231 p=0.821 |
t=−0.448 p=0.656 |
t=−2.782 p=0.006 |
t=−4.439 p<0.001 |
t=−1.295 0.201 |
t=−1.002 p=0.318 |
t=−1.349 p=0.196 |
t=−0.477* p=0.716 |
t=−0.717 p=0.475 |
t=0.63 p=0.538 |
| AIR_CHANGE_NO | t=0.438 p=0.663 |
t=0.91* p=0.358 |
t=1.099 p=0.289 |
t=2.15 p=0.037 |
t=2.205 p=0.03 |
t=2.767 p=0.014 |
t=1.148 p=0.256 |
t=0.971 p=0.334 |
t=0.145 p=0.165 |
t=2.693 p=0.01 |
t=2.52 p=0.013 |
t=0 p=1 |
| AIR_CHANGE_LESS | t=−0.435 p=0.665 |
t=−1.355 p=0.178 |
n.d. | t=−2.016 p=0.05 |
t=0.32 p=0.75 |
n.d. | t=−0.53 p=0.598 |
t=−0.172 p=0.863 |
n.d. | t=−2.232 p=0.031 |
t=−2.904 p=0.005 |
n.d. |
| NAT_LIGHT | t=1.087 p=0.283 |
t=−0.375 p=0.708 |
t=−1.03 p=0.322 |
t=1.675 p=0.101 |
t=−0.272 p=0.786 |
t=1.089 p=0.296 |
t=2.929 t=0.005 |
t=0.498 p=0.62 |
t=−0.808 p=0.433 |
t=3.802 p<0.001 |
t=2.62 p=0.01 |
t=−1.634 p=0.126 |
| ARTIF_ILLUM | t=−0.475 p=0.637 |
t=−0.072 p=0.943 |
t=0.096 p=0.925 |
t=−1.377 p=0.175 |
t=1.047 p=0.298 |
t=0.572 p=0.577 |
t=−1.472 p=0.148 |
t=−0.527 p=0.599 |
t=−0.222 p=0.828 |
t=−2.574 p=0.014 |
t=−1.909 p=0.059 |
t=1.448 p=0.171 |
| SUN_INT | r=0.145 p=0.309 |
r=0.093 p=0.327 |
r=−0.15 p=0.566 |
r=0.174 p=0.232 |
r=−0.148 p=0.129 |
r=−0.044 p=0.868 |
r=0.081 p=0.566 |
r=0.087 p=0.355 |
r=0.112 p=0.657 |
r=0.386 p=0.007 |
r=0.295 p=0.002 |
r=−0.385 p=0.127 |
| INT_NAT_ILL_PAV | r=0.148 p=0.35 |
r=0.111 p=0.27 |
r=0.474 p=0.087 |
r=0.413 0.007 |
r=−0.227 p=0.03 |
r=−0.133 p=0.649 |
r=0.384 p=0.011 |
r=0.083 p=0.409 |
r=0.112 p=0.702 |
r=0.49 p=0.001 |
r=0.255 p=0.014 |
r=0.103 p=0.725 |
| INT_ARTIF_ILL | r=−0.053 p=0.712 |
r=−0.014 p=0.88 |
r=0.296 p=0.249 |
r=−0.127 p=0.383 |
r=0.035 p=0.719 |
r=0.295 p=0.25 |
r=−0.091 p=0.521 |
r=0.066 p=0.482 |
r=0.223 p=0.375 |
r=−0.183 p=0.213 |
r=0.123 p=0.211 |
r=0.355 p=0.162 |
| INT_ARTIF_ILL_PAV | r=−0.109 p=0.47 |
r=−0.039 p=0.702 |
r=−0.306 p=0.31 |
r=−0.156 p=0.311 |
r=0.079 p=0.464 |
r=0.443 p=0.13 |
r=0.028 p=0.851 |
r=0.123 p=0.228 |
r=0.101 p=0.742 |
r=−0.039 p=0.806 |
r=164 p=0.123 |
r=−0.068 p=0.824 |
Table 7.
Summary of statistical associations (t-tests or Pearson’s correlation coefficient) between infrastructure characteristics and dependent variables, stratified by seasonal period (n.d.=not enough data; *=Welch’s t-test for unequal variances).
Table 7.
Summary of statistical associations (t-tests or Pearson’s correlation coefficient) between infrastructure characteristics and dependent variables, stratified by seasonal period (n.d.=not enough data; *=Welch’s t-test for unequal variances).
| FEEL_COMF | THERM_DEV | TEMP_PREF | THERM_ENV_SATISF | |||||||||
| Wint | Spr–Aut | Sum | Wint | Spr–Aut | Sum | Wint | Spr–Aut | Sum | Wint | Spr–Aut | Sum | |
| TALL_BUILD | t=−1.316 p=0.196 |
t=0.33 p=0.742 |
t=−0.182 p=0.858 |
t=−2.175 p=0.035 |
t=−0.236 p=0.814 |
t=−0.425 p=0.677 |
t=−0.186 p=0.853 |
n.d. | t=0.676 p=0.51 |
t=−0.373 p=0.711 |
t=−0.075 p=0.94 |
t=0.619 p=0.546 |
| RELAX | r=0.25 p=0.077 |
r=0.263 p=0.005 |
r=0.1 p=0.703 |
r=0.082 p=0.575 |
r=0.125 p=0.2 |
r=0.029 0.912 |
r=0.162 p=0.252 |
r=0.02 p=0.832 |
r=−0.028 p=0.912 |
r=0.095 p=0.52 |
r=0.074 p=0.454 |
r=−0.269 p=0.297 |
| INTERV | t=−1.685 p=0.098 |
t=−1.138 p=0.257 |
t=−2.653 p=0.018 |
t=−1.94 p=0.058 |
t=−1.072 p=0.286 |
t=−0.646 p=0.528 |
t=−1.541 p=0.13 |
t=−1.807 p=0.073 |
t=−0.904 p=0.38 |
t=−2.258 p=0.029 |
t=−1.825 p=0.071 |
t=−0.63 p=0.538 |
| PAV_COLOR | r=0.113 p=0.475 |
r=−0.059 p=0.555 |
r=−0.336 p=0.241 |
r=0.085 p=0.604 |
r=0.098 p=0.346 |
r=0.521 p=0.056 |
r=−0.022 p=0.89 |
r=0.056 p=0.574 |
r=0.17 p=0.562 |
r=0.124 p=0.454 |
r=−0.093 p=0.367 |
r=0.292 p=0.311 |
| WIDE_ SIDEWALK |
r=0.025 p=0.87 |
r=−0.105 p=0.291 |
r=−0.548 p=0.034 |
r=−0.067 p=0.67 |
r=0.019 p=0.856 |
r=0.398 p=0.141 |
r=−0.003 p=0.893 |
r=0.063 p=0.527 |
r=−0.346 p=0.207 |
r=0.035 p=0.828 |
r=−0.051 p=0.619 |
r=0 p=1 |
| Q63_BRIEF_ STOPS |
r=−0.203 p=0.187 |
r=0.007 p=0.946 |
r=−0.211 p=0.451 |
r=0.094 p=0.547 |
r=−0.078 p=0.455 |
r=−0.245 p=0.378 |
r=−0.164 p=0.281 |
r=0.106 p=0.284 |
r=−0.111 p=0.693 |
r=−0.012 p=0.939 |
r=−0.07 p=0.497 |
r=0.196 p=0.484 |
| Q64_SMART_ STOPS |
r=0.092 p=0.551 |
r=0.041 p=0.679 |
r=−0.525 p=0.045 |
r=−0.157 p=0.316 |
r=−0.029 p=0.782 |
r=0.047 p=0.868 |
r=−0.063 p=0.679 |
r=0.147 p=0.136 |
r=0.134 p=0.635 |
r=−0.043 p=0.787 |
r=−0.082 p=0.429 |
r=−0.25 p=0.369 |
Table 8.
Summary of statistical associations (t-tests or Pearson’s correlation coefficient) between greening and cooling characteristics and dependent variables, stratified by seasonal period (n.d.=not enough data; *=Welch’s t-test for unequal variances).
Table 8.
Summary of statistical associations (t-tests or Pearson’s correlation coefficient) between greening and cooling characteristics and dependent variables, stratified by seasonal period (n.d.=not enough data; *=Welch’s t-test for unequal variances).
| FEEL_COMF | THERM_DEV | TEMP_PREF | THERM_ENV_SATISF | |||||||||
| Wint | Spr–Aut | Sum | Wint | Spr–Aut | Sum | Wint | Spr–Aut | Sum | Wint | Spr–Aut | Sum | |
| Q48_VEG_ SUFF |
r=0.064 p=0.654 |
r=0.021 p=0.824 |
r=0.054 p=0.836 |
r=−0.181 p=0.213 |
r=0.133 p=0.173 |
r=0.405 p=0.107 |
r=0.001 p=0.996 |
r=−0.2 p=0.032 |
r=0.009 p=0.972 |
r=0.008 p=0.958 |
r=−0.025 p=0.799 |
r=−0.13 p=0.618 |
| Q49_SHADE_ NATUR |
t=0.969 p=0.338 |
t=0.77 p=0.443 |
t=−1.684 p=0.113 |
t=0.033 p=0.974 |
t=1.019 p=0.311 |
t=1.248 p=0.231 |
t=0.574 p=0.569 |
t=−0.6 p=0.55 |
t=0.365 p=0.72 |
t=0.89 p=0.379 |
t=2.089 p=0.039 |
t=0 p=1 |
| Q49_SHADE_ ARTIF |
t=0.258 p=0.797 |
t=0.296 p=0.768 |
t=−1.467 p=0.163 |
t=0.007 p=0.994 |
t=0.586 p=0.559 |
t=−0.042 p=0.967 |
t=0.419 p=0.677 |
t=1.211 p=0.229 |
t=−0.328 p=0.747 |
t=0.08 p=0.936 |
t=1.413 p=0.161 |
t=−1.702 p=0.109 |
| Q50_SHADE_ SUFF |
r=−0.137 p=0.377 |
r=−0.218 p=0.03 |
r=0.103 p=0.714 |
r=−0.378 p=0.013 |
r=−0.045 p=0.669 |
r=−0.385 p=0.156 |
r=−0.21 p=0.166 |
r=−0.346 p<0.001 |
r=−0.269 p=0.314 |
r=−0.421 p=0.006 |
r=−0.146 p=0.162 |
r=−0.154 p=0.584 |
| Q57_MORE_ TREE_ SHADE_ |
r=0.052 p=0.739 |
r=0.124 p=0.214 |
r=−0.313 p=0.255 |
r=−0.06 p=0.704 |
r=−0.057 p=0.581 |
r=−0.043 p=0.879 |
r=−0.228 p=0.132 |
r=−0.026 p=0.794 |
r=0.32 p=0.245 |
r=−0.127 p=0.43 |
r=−0.064 p=0.545 |
r=0 p=1 |
| Q58_MORE_ ARTIF_ SHADE |
r=−0.068 p=0.664 |
r=−0.009 p=0.931 |
r=−0.544 p=0.036 |
r=−0.143 p=0.374 |
r=−0.111 p=0.285 |
r=0.316 p=0.25 |
r=−0.133 p=0.389 |
r=0.092 p=0.358 |
r=−0.071 p=0.801 |
r=−0.01 p=0.95 |
r=−0.15 p=0.145 |
r=−0.213 p=0.446 |
| Q60_GREEN_ COOL |
r=−0.045 p=0.771 |
r=0.11 p=0.269 |
r=−0.485 p=0.067 |
r=−0.237 p=0.126 |
r=−0.041 p=0.693 |
r=−0.102 p=0.716 |
r=−0.233 p=0.123 |
r=0.087 p=0.38 |
r=−0.098 p=0.727 |
r=−0.052 p=0.743 |
r=0.087 p=0.404 |
r=−0.164 p=0.56 |
| Q61_WATER_ COOL |
r=−0.04 p=0.798 |
r=0.125 p=0.211 |
r=−0.549 p=0.034 |
r=−0.163 p=0.296 |
r=−0.045 p=0.668 |
r=−0.13 p=0.643 |
r=−0.087 p=0.569 |
r=0.209 p=0.034 |
r=−0.267 p=0.336 |
r=0.051 p=0.749 |
r=−0.009 p=0.929 |
r=−0.125 p=0.658 |
Disclaimer/Publisher’s Note: The statements, opinions and data contained in all publications are solely those of the individual author(s) and contributor(s) and not of MDPI and/or the editor(s). MDPI and/or the editor(s) disclaim responsibility for any injury to people or property resulting from any ideas, methods, instructions or products referred to in the content. |
© 2026 by the authors. Licensee MDPI, Basel, Switzerland. This article is an open access article distributed under the terms and conditions of the Creative Commons Attribution (CC BY) license (http://creativecommons.org/licenses/by/4.0/).
Copyright: This open access article is published under a Creative Commons CC BY 4.0 license, which permit the free download, distribution, and reuse, provided that the author and preprint are cited in any reuse.