

Submitted:
12 August 2026
Posted:
14 August 2026
You are already at the latest version
Abstract
Glaucoma drainage device (GDD) surgery is frequently limited by postoperative fibro-blast proliferation, leading to device failure and the need for revision procedures. In this work, we developed a spray-assisted layer-by-layer (LbL) drug delivery system for GDD surfaces that enables localized release of antiproliferative agents, aiming to standardize patient care. Multilayer thin films composed of poly(β-amino ester) (PBAE) and a 5-fluorouracil (5-FU) and β-cyclodextrin (β-CD) complex (5-FU:β-CD) were fabricated, without (type A films) and with (type B films) graphene oxide (GO) barrier layers. Film growth was monitored by ultraviolet–visible spectroscopy (UV-Vis) and vacuum ultraviolet spectroscopy (VUV), confirming consistent, sequential deposition; type A films exhibited greater reproducibility than GO-containing type B films. Drug release studies revealed a rapid burst release within the first 5 min, fol-lowed by a plateau, regardless of GO incorporation. Cell cycle analysis confirmed that β-CD complexation preserved the biological activity of 5-FU, which induced an S-phase arrest in a dose-dependent manner. Although further optimization of film archi-tecture and composition is required to achieve sustained release, this study demon-strates the feasibility of spray-assisted LbL coatings as a localized drug delivery strate-gy for GDD surfaces. Overall, these findings establish a promising platform for the fu-ture development of more effective and standardized coatings for glaucoma surgical devices.
Keywords:
glaucoma
; drug delivery system
; layer-by-layer
; 5-fluorouracil
; β-cyclodextrin
; graphene oxide
1. Introduction
Affecting an estimated 76 million people worldwide in 2020, glaucoma is one of the leading causes of blindness [1]. It is a severe neurodegenerative disease characterized by the loss of retinal ganglion cells and progressive optic nerve atrophy [2,3,4,5]. Although glaucoma is normally associated with intraocular pressure (IOP), the underlying mechanisms remain incompletely understood, and the disease can also occur in the absence of increased IOP [2,6].
The IOP rises in response to failure of the aqueous humor drainage pathways. Aqueous humor is constantly being produced inside the eye and being drained through the Schlemm’s canal and/or the trabecular meshwork [6]. For primary glaucoma, we can classify the disease into two main groups: primary open-angle glaucoma (POAG) or primary angle-closure glaucoma (PACG) [7]. In POAG the angle between the iris and the trabecular meshwork is open so it is the trabecular meshwork which is mainly affected, and Schlemm’s canal may be functional. In PACG the iris is enlarged, causing a closure of the drainage angle (which can be total or partial) and impeding the correct drainage through the Schlemm’s canal and trabecular meshwork [7,8,9]. In this case, even though in the beginning the trabecular meshwork and the Schlemm’s canal may be functional, this blockage caused by the iris will ultimately lead to permanent damage [8]. Furthermore, glaucoma can also be congenital, normally caused by an abnormal development of the anterior chamber during embryogenesis or secondary to other pathologies or syndromes, such as in the cases of juvenile glaucoma (often genetic), neovascular glaucoma, uveitic glaucoma, steroid-induced glaucoma, lens-induced glaucoma, or trauma-induced glaucoma [10,11,12,13,14,15,16,17].
The first line of treatment for glaucoma patients is normally the use of eye drops aimed at reducing the production of aqueous humor to reduce the IOP [18]. However, this type of treatment does not always work either because the drops are not effective, or due to poor patient compliance [19,20,21,22]. When this happens, the next step is usually surgery [9]. There is a wide range of glaucoma surgical procedures, including laser procedures, such as laser trabeculoplasty or cyclophotocoagulation; filtering surgeries such as trabeculectomy; glaucoma drainage devices (GDDs) such as Ahmed or Paul valves; minimally invasive glaucoma surgery (MIGS), such as iStent, among others [23,24,25,26,27,28,29,30]. In this study, we focus on GDD surgery, a common approach for refractory glaucoma. Despite being widely used and considered an effective approach for glaucoma management, this procedure, like any surgical technique, has inherent risks and limitations [26]. Surgical failure often occurs due to excessive fibroblast proliferation during the wound-healing process, which can lead to obstruction of the device and subsequent loss of function [31,32,33]. As a result, a substantial proportion of patients require a return to the operating room for revision surgery [34]. Nowadays surgeons intraoperatively apply mitomycin-C (MMC) soaked sponges, which are applied under the conjunctiva, at the implantation site for a period of time determined by the surgeon (normally ranging from 1.5 to 2 min) at concentrations ranging from 0.2 to 0.4 mg/mL [35,36]. Before this, it was also common to use 5-fluorouracil (5-FU) post-surgery by subconjunctival injection daily for a week or more to maintain the fibroblast suppression [35,36,37]. However, the epithelial toxicity of 5-FU, together with the discomfort associated with repeated injections, has led to a decline in its clinical use [38,39]. Notwithstanding, both MMC and 5-FU are antimitotic drugs with proven effects on cell cycle arrest and preventing excessive fibroblast proliferation [40,41]. These drugs act in different ways: MMC is an alkylating agent that crosslinks DNA replication and transcription leading to the cell cycle arrest and apoptosis in a cell phase independent manner; 5-FU is an antimetabolite/pyrimidine analog being metabolized inside the cells into fluorodeoxyuridine monophosphate, which inhibits thymidylate synthase, an enzyme needed for DNA synthesis. Therefore 5-FU is S-phase specific, only affecting cells that are actively dividing [42,43].
There is no universal standard for MMC use, and its application varies depending on the surgeon performing the surgery. The concentration, exposure time, and even the way sponges are placed all depend on the surgeon’s training, patient profile, and institutional habits, making it an operator-dependent and heterogeneous technique [44,45].
We propose to address this challenge by designing a nanometer-scale drug delivery system (DDS) that can be applied to the valve plate, enabling controlled and sustained drug release. As proof of concept, a multilayer DDS was developed using a spray-assisted layer-by-layer (LbL) assembly technique, in which successive layers are adsorbed onto preceding ones through electrostatic interactions, hydrogen bonding, or π–π stacking/hydrophobic interactions [46,47]. The thin films that constitute the DDS are composed of alternate layers of poly β-amino ester (PBAE) (Figure 1), a hydrophobic polymer with a backbone which is hydrolyzed under physiological conditions allowing for the drug to be released, 5-FU:β-cyclodextrin complex (5-FU:β-CD) (Film type A) and depending on the film they can have additional graphene oxide (GO) barrier or capping layers, either positively or negatively charged (GO+/GO− respectively) (Film type B) [47,48,49].
Due to its highly hydrophilic nature, its small size, and highly polar nature 5-FU is not easily incorporated into the films. This happens because the PBAE is a hydrophobic polymer and the films, after drying, have a hydrophobic nature making it harder for 5-FU to be retained in the film since the abundance of hydrophobic interactions can repel small highly polar molecules. Taking this into consideration, 5-FU was previously complexed with β-cyclodextrin (β-CD) forming the complex 5-FU:β-CD [49,50,51,52]. β-cyclodextrin is a cyclic oligosaccharide composed of seven glucose units linked by α-1,4 glycosidic bonds, and its conical shape creates an outer hydrophilic surface with an inner hydrophobic cavity, which makes it ideal for drug complexation, improving solubility, stability, and bioavailability. β-CD was preferred over α or γ cyclodextrins because the cavity size, which is about 6.0–6.5 Å makes it ideal to complex with 5-FU, which has a size of about 5–6 Å, and it has been widely reported in literature to form stable complexes with several drugs [51,53].
Graphene is a two-dimensional compound composed of a monolayer of aromatic carbon atoms (sp²-hybridized), covalently bound in a hexagonal lattice structure, forming sheets only one atom thick. Its oxidized form, GO, retains this sheet-like architecture while introducing abundant oxygen-containing functional groups (hydroxyl, epoxy, carboxyl). When used as a capping or barrier layer in multilayer films, GO provides a dense, planar barrier that slows molecular diffusion by creating a tortuous pathway. This barrier effect enhances film stability and regulates drug release [47].
In this work, considering our proposed DDS development strategy, the growth of the proposed type A and type B films was characterized by ultraviolet-visible (UV-Vis) and vacuum ultraviolet (VUV) spectroscopies; 5-FU release/desorption was evaluated by high-performance liquid chromatography (HPLC), UV-Vis, and VUV spectroscopies; and the biological effect of the released drug was assessed through cell cycle analysis to investigate its impact on cell cycle progression and arrest
2. Results
2.1. Film Growth
Films were prepared according to the protocol described in the materials and methods section of this paper. The UV-Vis absorbance spectra of LbL with A and B structures are presented in Figure 2A and 2B, respectively. For better visualization, only absorbance data in the 200–300 nm range are shown, as no relevant absorption occurs beyond this interval. Furthermore, at the beginning of the preparation of each film, a spectrum from the substrate was acquired, then subtracted from the following measurements for baseline correction.
From Figure 2A,B, one can see the films grow sequentially with the number of bilayers. For the films containing GO, the adsorption profile slightly changes because graphene also absorbs around 230 nm.
Additionally, film growth was also tracked by vacuum ultraviolet spectroscopy (VUV). The VUV results (data not shown) corroborate the UV-Vis findings and additionally indicate that doubling the number of drug-loaded layers between each set of graphene does not exponentially increase the total load of the film, possibly due to film saturation.
To infer the linearity of the absorbance with the number of bilayers, the absorbance at 266 nm was chosen as a reference for linear representation since it is the characteristic wavelength absorption for 5-FU. Moreover, β-CD does not absorb in this wavelength range, so it is not expected to change the absorption profile.
Figure 3A,B show the growth of (PBAE/5-FU:β-CD)₁₅ (type A) and ((PBAE/5-FU:β-CD)₆/GO⁺/GO⁻)₄ (type B) LbL films, respectively, as a function of the number of bilayers. For each film type, the complete fabrication process was repeated independently, with four independent type A films and three independent type B films prepared and analyzed. At each bilayer number, the absorbance values obtained from the independent films were averaged, and the error bars represent the corresponding standard deviation. For films containing GO, the growth profiles showed lower linearity and the slopes of each set of PBAE/5-FU:β-CD bilayers were considerably lower, indicating less regular film growth and an overall smaller increase in drug loading (Figure 3C). In later layers, the variance increases, which is expected for this type of film deposition, as the use of a manual spray atomizer and manual drying can introduce inconsistencies in layer thickness, the amount of material deposited, and overall film roughness. Aside from that, it is possible that interlayer diffusion affects the films or that each layer does not fully cover the previous one leading to variations in the measurements that accumulate with each deposition. Because graphene layers contribute strongly to absorbance, raw growth curves show sharp step-like increases in absorbance at each GO⁺/GO⁻ insertion. To isolate the incremental growth of 5-FU, we applied an offset correction: at each graphene insertion, the cumulative offset (difference between the GO⁻ absorbance and the last preceding 5-FU value) was calculated, and this offset was subtracted from all subsequent absorbance values. The corrected curve (Figure 3D) therefore reflects the continuous accumulation of 5-FU independently of graphene and as indicated by the R² value, exhibits a linear increase.
Taking the data of an individual type B film as an example (see Table 1), when looking at the increments of absorbance (A) in each block of 6 bilayers of PBAE/5-FU:β-CD, calculated by the equation (1)
where ΔA corresponds to the difference of absorbance between a set of layers, n represents the last bilayer number of each set, it is possible to see that the growth is similar in each block, with a mean value of 0.01338 and SD of 0.003857, i.e., 0.013±0.004.
ΔA = Aₙ – An-5,
For comparison between films, the mean area under the curve (AUC) for each film type was calculated. The relative standard deviation (RSD) or coefficient of variation (CV), given by
was also determined for each type of film and listed in Table 2.
RSD (%) = 100*SD/Mean
For type A films, in which the mean and SD values were 0.1722 and 0.01650, respectively (i.e., 0.172±0.0165), the RSD value is 9.6%, indicating low relative variability and therefore good reproducibility of the films under the tested conditions [54,55]. For type B films, in which mean and SD values were 4.3773 and 1.117, respectively (i.e., 4.377±1.117), the RSD for these films is 25.5%. This indicates that films containing graphene exhibit greater variability than those without it [47]. However, when we consider the AUC of the curves corrected for the GO offset, accounting only for the drug increments, the mean and the SD values were 0.8281 and 0.137819, respectively, lowering the RSD value to 16.6% suggesting improved relative consistency after removing the graphene-related background contribution. This corrected value indicates moderate variability and is comparable to RSD values reported for spray-based coating processes [56,57,58].
2.2. Film Desorption/ Drug Release
Drug release studies were carried out as described in the materials and methods section of this paper, and both films, without GO (type A film) and with GO (type B film), were evaluated across time. However, irregular peak shapes and baseline/signal instability, likely associated with instrumental or methodological limitations, prevented the reliable quantification of a few time points. These difficulties were more pronounced in films containing GO, probably due to residual GO in solution affecting the measurements, as GO absorbs in the 200–300 nm range. Therefore, Figure 4 shows only the data up to the last time point with consecutive reliable readings. Figure 4A shows the data for type A films and Figure 4B shows the data for type B films. Even though GO was expected to reliably delay the release of the drug, in both cases a burst release was observed within the first 5 min, followed by a plateau. Although the type B films had a slight release after the initial 5 min, the concentration was very low. Interestingly the film with better results was the one deposited on the PDMS (Sylgard™ 184, Dow) silicone indicating that the molecules might have a greater affinity with this substrate. The rapid release profile suggests that the drug is weakly retained within the multilayer structure, presumably due to incomplete layer deposition. The lack of significant delay in release for GO containing films might also be related to this and indicates that the barrier effect of graphene oxide is insufficient under the current film architecture.
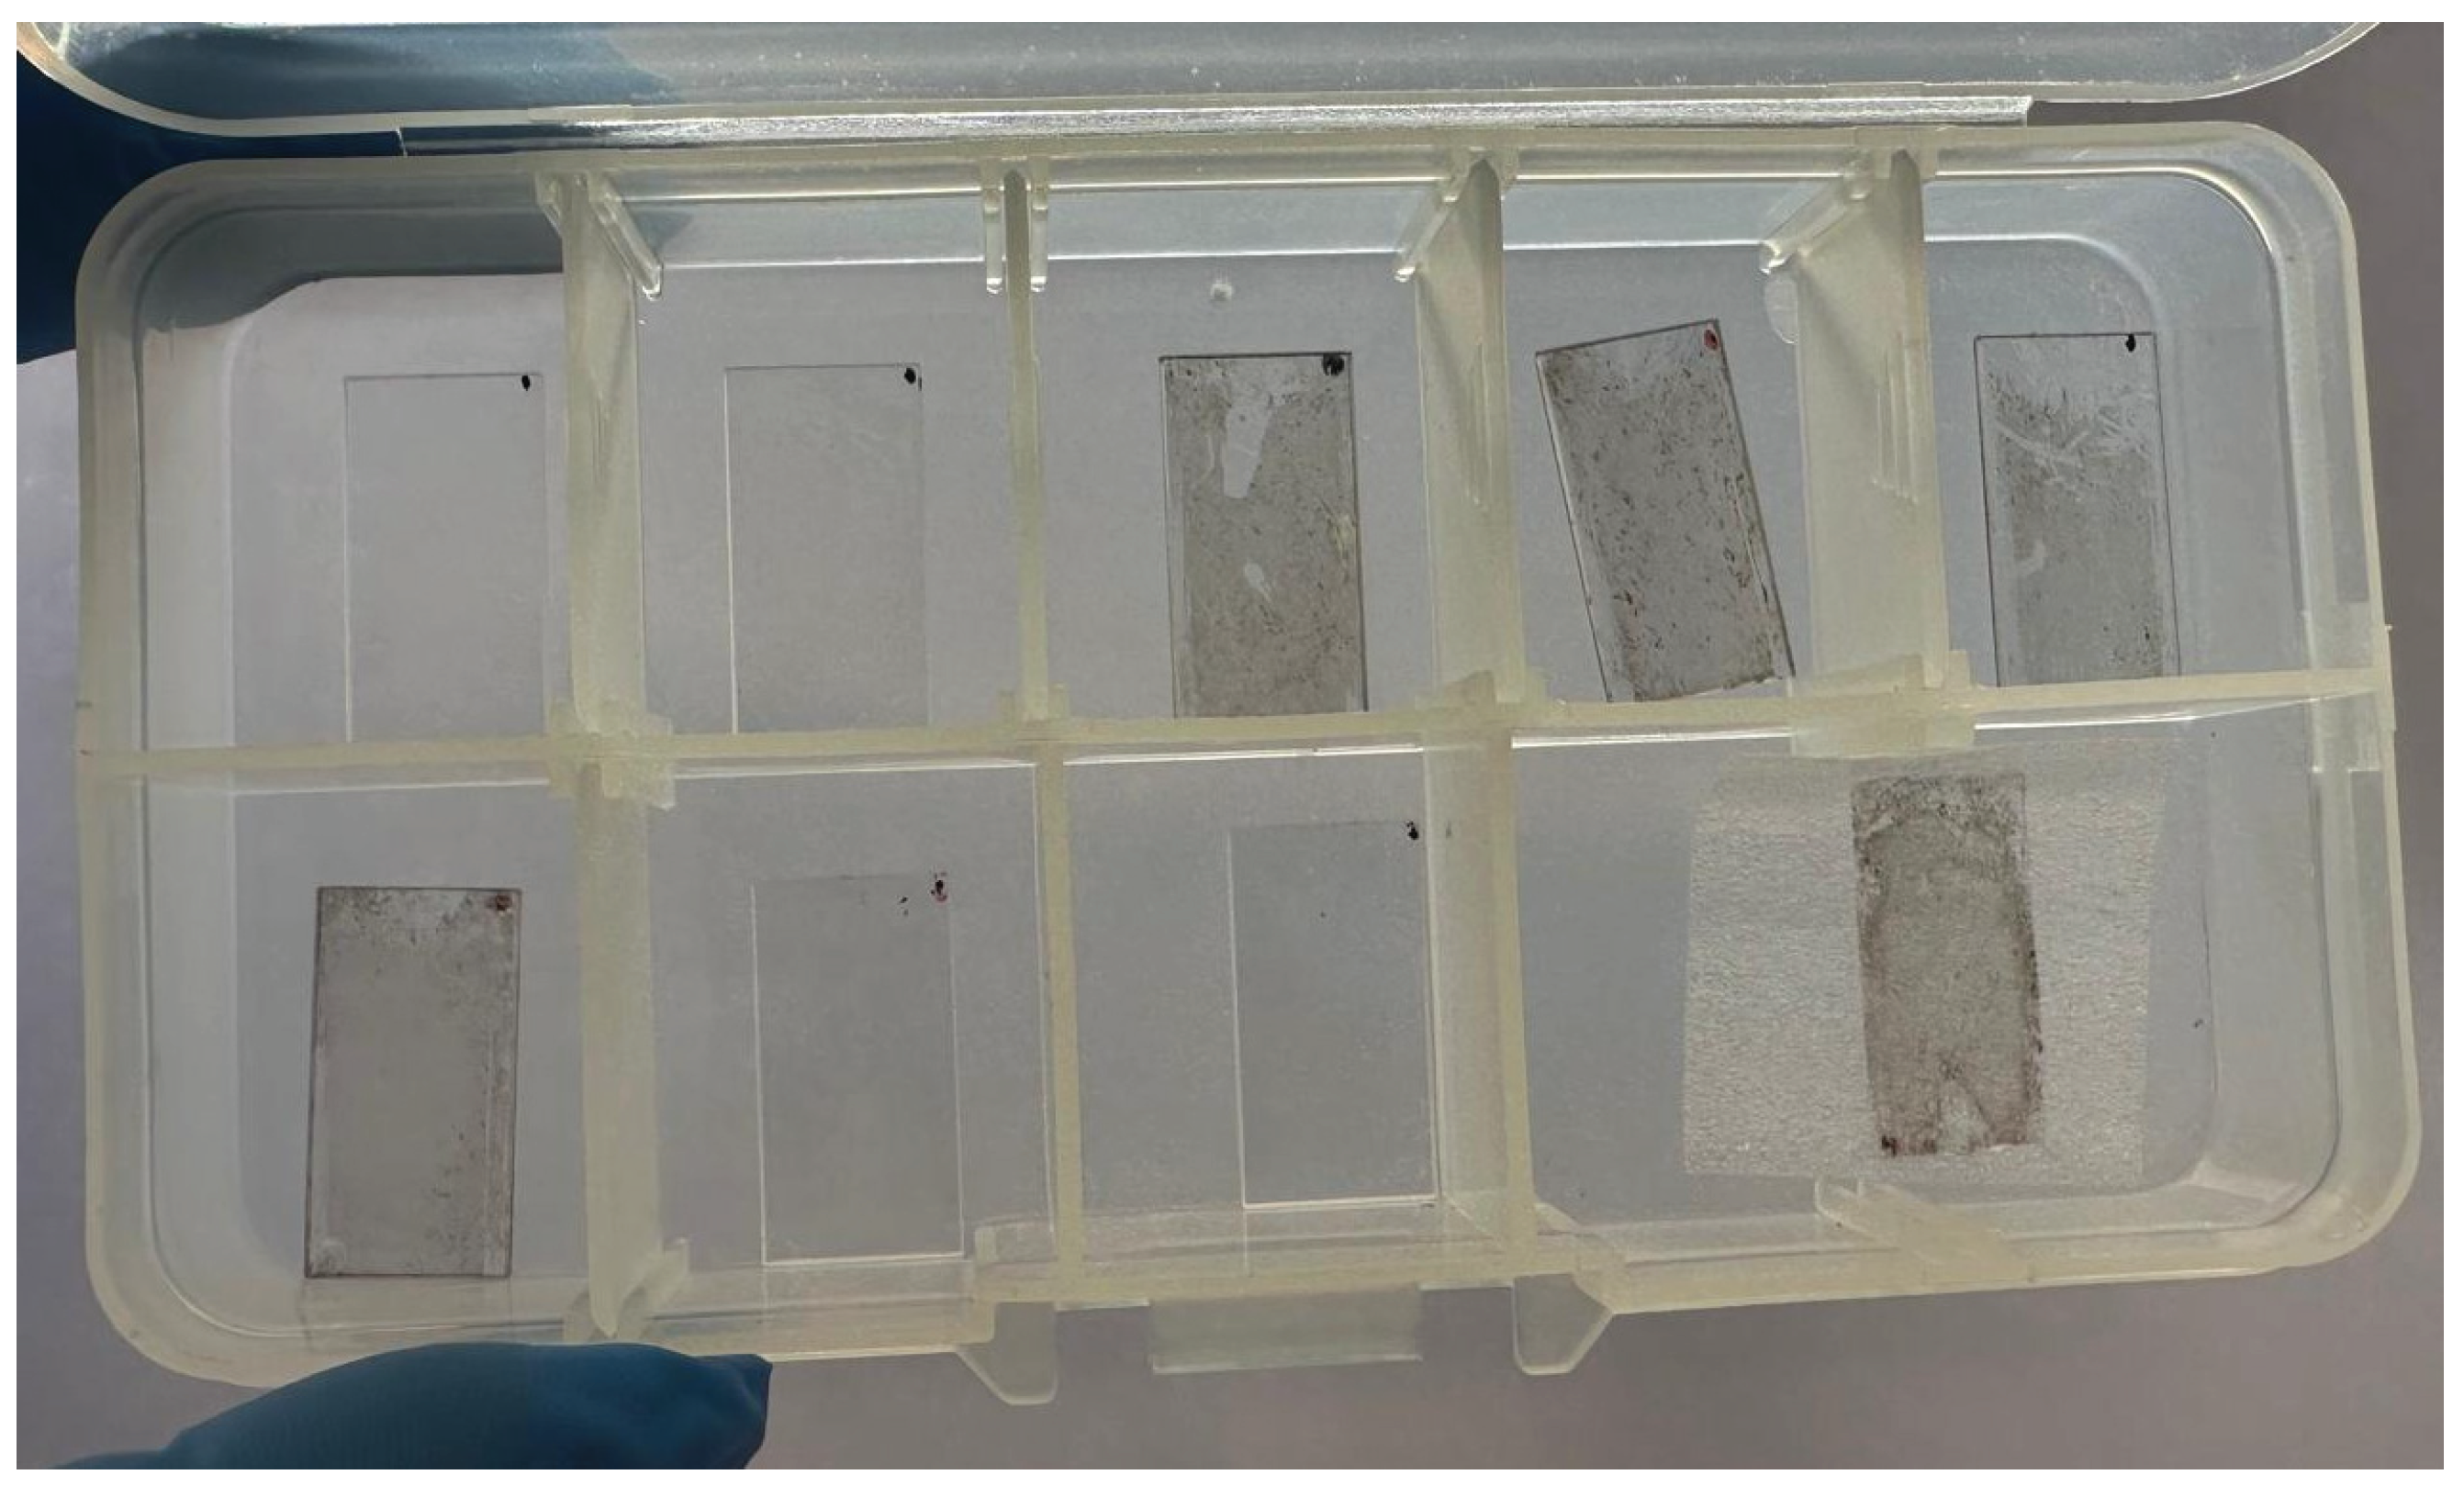
Visual inspection of the films after the drug release study, Figure A1 in Appendix A, demonstrated that GO was not completely desorbed from the substrate. Taking this into account, the final UV-Vis spectra after desorption were recorded for each of the type A and Type B films deposited on the quartz substrates. Figure 5 shows the UV-Vis spectra of a representative type A film, (PBAE/5-FU:β-CD)15 and a representative type B film, ((PBAE/5-FU:β-CD)6/GO+/GO−)4, both before and after desorption, as well as the difference spectra for each film representing the material removed during the desorption process (desorption difference spectra). These were calculated by subtracting the post-desorption spectrum from the pre-desorption spectrum in each film.
Peak analysis by Gaussian deconvolution was performed on the UV-Vis spectra before desorption and on the desorption difference spectra in each film. This allowed us to identify each peak in the spectrum as presented in Figure 6. Figure 6A,B show the UV-Vis spectra of a (PBAE/5-FU:β-CD)15 film before desorption and respective desorption difference spectra, while Figure 6C,D show the spectra of a ((PBAE/5-FU:β-CD)6/(GO+/GO−)4 film before desorption and respective desorption difference spectra. The green, blue, and magenta curves in these figures represent the fitted Gaussian peaks of the spectrum and red curves are the sum of the peak curves. The peak of interest is centered in the 260 to 270 nm wavelength range, which is associated with 5-FU absorbance and corresponds to the blue curves in the graphs. For reference, Samy et al. measured the UV spectrum of 5-FU in 0.5% acetic acid and found a peak at 265.2 nm, while Machado et al. found a peak near 268 nm when measuring the spectra of 5-FU with varying concentrations of β-CD at pH 7.1 [52,59]. Machado et al. also demonstrated that the 5-FU peak position is pH-dependent [52]. Consequently, the absorbance peak of 5-FU is expected to be influenced by the electrical charges of the other molecules present in the films, and its position may change during the desorption process. Indeed Figure 6 shows a shift in the position of the 5-FU peak in the spectra associated with the desorbed material. Table 3 summarizes the deconvolution results of 5-FU peak fitted in the spectra of Figure 6. The values of absorbance at maximum absorbance were not displayed in the table because they varied slightly between samples.
From the analysis of peaks associated to 5-FU and deconvoluted from UV-Vis spectra of all measured samples, before and after the desorption, it was possible to determine the percentage of 5-FU desorbed material considering the height of 5-FU peak. The average of the peak heights of 5-FU before desorption () and of desorbed material () for each type of film is listed in Table 4. The percentage of 5-FU desorbed material (was calculated using the relation:
The calculated percentage of 5-FU desorbed material values for both film types, listed in Table 4, reveals that in type A films the 5-FU is desorbed in 71% while only about 30% is desorbed in type B films. This demonstrates that the GO layers are contributing to maintain the 5-FU molecules retained in the films.
Similarly to the evaluation of the UV-Vis adsorption spectra, desorption was also analyzed through VUV spectroscopy as described in the materials and methods section of this paper. Results are represented in Figure 7A,B which show representative spectra acquired before and after 1 min of desorption in PBS for a type A film, (PBAE/5-FU:β-CD)₁₀, and a type B film, ((PBAE/5-FU:β-CD)₆/GO⁺/GO⁻)₄, respectively. By analyzing these spectra, it is possible to observe that in films without GO (type A) the VUV signal markedly decreased, suggesting extensive desorption, whereas in films with GO (type B) the VUV signal was still substantial indicating a greater retention of material on the film and suggesting that a considerable part of the drug-loaded multilayer structure remains after short-term desorption. This result is fully consistent with what was observed by UV-Vis spectroscopy and supports the interpretation that even though the desorption occurs in both films GO slows the desorption process.
Additional VUV measurements were performed to compare type B films prepared with either 6 or 12 PBAE/5-FU:β-CD bilayers between each GO⁺/GO⁻ block (Figure 8). Although the film with 12 drug-loaded bilayers showed a slightly higher absorbance signal, this increase was not proportional to the doubling of the number of PBAE/5-FU:β-CD bilayers. This suggests that increasing the number of drug-loaded layers between GO insertions does not lead to a proportional increase in the VUV absorbance signal, possibly due to film saturation or limited incorporation efficiency.
2.3. Cell Cycle Arrest
To confirm whether β-CD complexation preserved the biological activity of 5-FU, cell cycle distribution was assessed by flow cytometry after 24 h of exposure. This analysis was performed given that 5-FU is expected to interfere with DNA synthesis and induce S-phase arrest in actively proliferating cells [43].
Three conditions, each at two dose levels, were tested: 5-FU (0.3 mg and 0.075 mg), 5-FU:β-CD complexes (containing 0.3 mg and 0.075 mg of 5-FU) and β-CD (amounts equivalent to those used to complex 0.3 mg and 0.075 mg of 5-FU, corresponding to approximately 2.65 mg and 0.66 mg of β-CD, respectively). Since the complex was prepared at a 1:1 molar ratio and β-CD has a molecular weight approximately 8.82-fold higher than 5-FU, the corresponding β-CD mass was proportionally higher. Therefore, the β-CD controls were prepared using the amount of β-CD equivalent to that present in the corresponding 5-FU:β-CD complexes. The 0.3 mg dose was diluted in 1 mL while the 0.075 mg dose was diluted in 250 µL of PBS. Cells were processed for cell cycle analysis by flow cytometry 24 h after adding the corresponding volume of each condition to each well [43,51,60,61].
As shown in Figure 9, treatment with 5-FU increased the percentage of cells in S phase, consistent with the expected mechanism of action of 5-FU as an inhibitor of DNA synthesis [60,61]. This effect was more pronounced at the higher dose and was also observed when 5-FU was complexed with β-CD, indicating that complexation did not impair the biological activity of the drug [51]. In contrast, β-CD alone did not substantially alter cell cycle distribution compared with the untreated and PBS controls, supporting its suitability as a carrier in this system.
3. Discussion
The present work aimed to develop a spray-assisted LbL DDS for localized application in GDD surgery, targeting the suppression of fibroblast proliferation. The results demonstrate that the proposed fabrication method enables the formation of multilayer films with consistent and sequential growth, as confirmed by UV-Vis spectroscopy. Type A films exhibited lower variability and more reproducible growth profiles than type B films, potentially due to the additional complexity introduced by the insertion of GO layers and the manual spray deposition process.
In addition to UV-Vis analysis, VUV spectroscopy provided further insight into the internal structure and loading behavior of the films. While both techniques confirmed sequential film growth, VUV data revealed that increasing the number of drug-loaded layers between graphene insertions does not result in a proportional increase in overall drug content. This suggests the existence of a saturation effect within the multilayer architecture, presumably associated with limited available binding sites or inefficient layer adsorption.
Despite the successful incorporation of GO as a potential diffusion barrier, drug release studies revealed a rapid burst release within the first few minutes, followed by a plateau, for both film types. This behavior suggests that a fraction of the incorporated 5-FU is weakly retained within the multilayer structure, which can be explained by its low molecular weight, high polarity, and hydrophilic nature, limiting its interaction with the relatively hydrophobic PBAE matrix. Although β-cyclodextrin complexation was employed to enhance drug incorporation, this strategy alone appears insufficient to significantly modulate release kinetics under the tested conditions.
From a practical standpoint, the films demonstrated good shelf stability, maintaining their structural integrity and performance after storage for up to one month prior to the drug release studies, which supports their potential for practical handling and preoperative preparation in clinical settings.
HPLC measurements suggested that the incorporation of GO did not result in a substantial delay in drug release, contrary to what would be expected from its role as a diffusion barrier. However, UV-Vis and VUV analyses demonstrated that GO-containing films retained a significant fraction of 5-FU after desorption, suggesting partial drug retention within the multilayer structure. This suggests that GO incorporation alone is not sufficient to modulate release kinetics under these deposition conditions. Possible explanations include incomplete surface coverage, structural heterogeneity of the films, or partial entrapment of the drug in the film structure. Additionally, visual inspection of the substrates indicated that GO layers remain present even after prolonged desorption.
From a biological perspective, cell cycle analysis confirmed that 5-FU retained its activity after complexation with β-CD, inducing S-phase arrest in a concentration-dependent manner. This is consistent with the known mechanism of action of 5-FU and supports the suitability of the complexed drug for incorporation into DDS platforms. The absence of effects from β-CD alone further confirms its biocompatibility in this context.
Overall, while the proposed system demonstrates feasibility for film fabrication and drug incorporation, and may contribute to more standardized treatment approaches, the lack of sustained release highlights the need for further optimization. Future work should focus on improving drug retention within the films, potentially through increased film density, alternative barrier strategies, or the use of additional crosslinking mechanisms. Furthermore, optimizing the deposition technique to reduce variability and enhance layer uniformity may contribute to more predictable and controlled release profiles. These improvements are essential for the translation of this approach into clinically relevant coatings for glaucoma surgical devices.
4. Materials and Methods
4.1. Reagents
PBAE was synthesized using the method described by Lynn et al. [49]. Briefly, 1,4-butanediol diacrylate (0.750 g, 0.714 mL, 3.78 mmol; 99% purity, Alfa Aesar, CAS 1070-70-8) and 4,4′-trimethylenedipiperidine (3.78 mmol; 97% purity, Sigma-Aldrich, CAS 16898-52-5) were separately dissolved in distilled tetrahydrofuran (THF) (5 mL each). The diamine solution was added dropwise to the diacrylate solution, the mixture was stirred with a Teflon-coated stir bar, sealed under a Teflon-lined cap, and heated at 50 °C for 48 h. After cooling, the reaction mixture was precipitated into vigorously stirred diethyl ether. The resulting polymer was collected by vacuum filtration (Büchner funnel) and dried under vacuum overnight. The final PBAE structure (Table 5) was confirmed by ^1H and ^13C nuclear magnetic resonance (NMR) spectroscopy.
The 5-FU (F6627) and β-CD(C2485) were acquired from Sigma-Aldrich/Merck (see Table 5 for chemical structure).
GO− (GOCD21057) was acquired from Graphenea. GO+ was synthesized from GO− according to the following: 50 mL of GO− were mixed with 0.625 g of N-ethyl-N’-(3-dimethylaminopropyl) carbodiimide methiodide (EDC) (D5334, TCI) and 5 mL of Ethylenediamine (E26266, Sigma-Aldrich). The solution was left stirring for 24 h at room temperature (RT). After this the solution was purified using a cellulose membrane (D9527, Sigma-Aldrich) previously washed and submerged into distilled water for 24 h. For the purification the cellulose membrane containing the solution was submerged in distilled water changed every 24 h until the pH of the water reached 6. The pH of the GO+ was then adjusted to 5.0 with glacial acetic acid (1.00063.2511, Merck/Sigma-Aldrich) [62]. See Table 5 for GO+ and GO− chemical structures.
4.2. Complexation 5-FU:β-CD
A sodium acetate (27652.260, VWR Chemicals) solution at pH 5.5 adjusted with acetic acid was prepared by dissolving 0.433 g of sodium acetate in distilled water for a final concentration of approximately 0.106 M.
5-FU and β-CD were complexed by dissolving them in the aforementioned sodium acetate buffer and stirring at a 1:1 molar ratio for 24 h at room temperature. Since the polymer β-CD is used for this calculation, the molecular weight of the β-CD monomer was considered. To prepare 10 mL of solution, 0.06 g of β-CD and 0.0068 g of 5-FU were used, yielding a final concentration of 5.2 mM for each.
This protocol was previously used and optimized by us using brimonidine [48].
4.3. Layer by Layer Film Deposition
For film deposition three types of substrates were used. Crystal Quartz substrates (24 mm × 12.5 mm × 1 mm, Crystran), calcium fluoride substrates (CaF2, 20 mm diameter, Crystan) and polydimethylsiloxane (PDMS, Sylgard™ 184, Dow) substrates kindly provided by Monica Machado from the Organic Electronics group (Telecommunications Institute). Quartz substrates were chosen to allow film growth tracking with UV-Vis, CaF2 substrates were chosen to allow tracking using Fourier-transform infrared spectroscopy (FTIR) and PDMS substrates were chosen for their similarity with the glaucoma drainage device valve.
Quartz substrates were thoroughly cleaned before film deposition with piranha solution (1:1, H2O2:H2SO4). In addition to cleaning, the piranha solution also imparts a negative charge to the substrate, promoting the adhesion of the first, positively charged PBAE layer. After being washed with piranha solution the substrates were thoroughly rinsed with water and dried with a nitrogen (N2) (AlphagazTM 1) flow [47,67,68,69].
Furthermore, before deposition all substrates were functionalized by oxygen plasma treatment for 3 min (Plasma Cleaner, PDC-002-CE, Harrick Plasma) which oxidizes and functionalizes the surface, generating negatively charged oxygen-containing groups [70].
PBAE was freshly prepared every 3.5 h due to its high degradation rate when in aqueous solution, by dissolving 0.0237 g of PBAE in sodium acetate solution for a final approximate monomer-equivalent concentration of 8 mM [49].
For the spray deposition perfume atomizers (Equivalenza) and 3D printed supports were used to guarantee that the distance (6 cm) and placement of the substrate were the same every time.
Two types of films were produced: films without GO with the composition (PBAE/5-FU:β-CD)15 (Film type A) and films with GO with the composition ((PBAE/5-FU:β-CD)6/GO+/GO−)4 (Film type B). Schemes of these films are displayed in Figure 1 on the introduction of this paper. For the deposition 5 spray pushes for PBAE and GO and 6 spray pushes for 5-FU:β-CD were used. In between each layer deposition the substrate was dried with a N2 flow and a UV-Vis spectrum between 200 and 500 nm was acquired (JASCO V-730) in each 5-FU:β-CD and GO layer. No measurements were taken for the PBAE layers, as this polymer does not exhibit absorbance within this spectral range. In addition, other formulations were explored, including halving the 5-FU:β-CD concentration, introducing sodium acetate washes between each layer, varying the number of spray applications per layer, and using spin coating instead of the spray-assisted technique (data not shown). None of these approaches proved effective; ultimately, the previously described technique was selected.
For VUV measurements a third type of film was produced with the composition (PBAE/5-FU:β-CD)10 (Film type C). In this case instead of sequential measurements as the film was being deposited, several films were produced with the desired number of layers and only one measurement (on the final layer) was made per film. The plots were then generated according to this. Measurements were performed at the AU-UV beamline of the ASTRID2 synchrotron radiation facility (Aarhus University, Denmark). UV/VUV transmission spectra were acquired in the 110–330 nm range using a monochromator equipped with a grating system. The transmitted intensity was detected using a photomultiplier tube (PMT) under vacuum conditions. Reference measurements were performed using clean CaF₂ windows. Data acquisition was performed using software specifically developed for the beam line (UV scan and ConSys).
4.4. Dissolution Study / Drug Release
For the drug release study, films were produced according to the aforementioned methodology and transferred to airtight vials, with the films facing up, submerged in 2 mL of PBS at pH 7.2 (70013032, Thermo Fisher). The vials were then incubated at 37 °C under constant orbital agitation (100 rpm). In each pre-determined timepoint 1 mL of the dissolution media was collected for subsequent HPLC analysis and 1 mL of fresh PBS was added. After the final timepoint a new UV-Vis reading was performed except for the film deposited on the PDMS substrate.
4.5. HPLC Measurements
Sample analysis was carried out on an HPLC Waters Alliance system with a photodiode array (PDA) detector. A wavelength scan was performed between 190 and 300 nm, and each run lasted 7 min. The column used was a Symmetry C18 250 × 4.6 mm from Waters, and peak analysis was performed using the Empower 2 software. The 5-FU peak has its λmax around 266 nm, and its retention time is approximately 3.5 min for the following running conditions: running buffer was PBS (0.1752 g of sodium dihydrogen phosphate (NaH2PO4) and 3.6 g of disodium hydrogen phosphate (Na2HPO4) per liter, pH ≈ 5.2, adjusted with hydrochloric acid (HCl)) with 7% acetonitrile (ACN), premixed before injection; and 7% of ACN was added to each sample before the run according to the formula
ACN% = X/ (sample volume +X)
Samples were filtered prior to analysis using polyethersulfone (PES) syringe filters with a 0.22 µm pore size.
4.6. Cell Cycle Arrest - Cell Culture
Human retinal pigment epithelial cells (D407) were used to study whether β-CD affected the effect of 5-FU on cell cycle. Cells were cultured in HyClone™ Dulbecco’s Modified Eagle Medium (DMEM) with high glucose (Cytiva, SH30285.01) at 37 °C, 5% carbon dioxide (CO2). Cells were seeded at a density of 150000 cells/well in 6 well plates and after growing for 24 h the experiment began. Two types of controls were used: cells without any treatment and cells with PBS (1 mL and 250 µL). Three conditions, each at two dose levels, were tested: 5-FU (0.3 mg and 0.075 mg), 5-FU:β-CD complexes (containing 0.3 mg and 0.075 mg of 5-FU) and β-CD (amounts equivalent to those used to complex 0.3 mg and 0.075 mg of 5-FU, corresponding to approximately 2.65 mg and 0.66 mg of β-CD, respectively). Since the complex was prepared at a 1:1 molar ratio and β-CD has a molecular weight approximately 8.82-fold higher than 5-FU, the corresponding β-CD mass was proportionally higher. Therefore, the β-CD controls were prepared using the amount of β-CD equivalent to that present in the corresponding 5-FU:β-CD complexes. The 0.3 mg dose was diluted in 1 mL while the 0.075 mg dose was diluted in 250 µL of PBS. Cells were processed for cell cycle analysis through flow cytometry 24 h after adding the corresponding volume of each condition to each well.
4.7. Cell Cycle Arrest - Flow Cytometry
For flow cytometry cell cycle analysis, the cells were washed once with PBS, trypsinized and centrifuged at 440 g for 1 min followed by two more PBS washes. After that, cells were vigorously resuspended in 500 µL of PBS at 4 °C and fixed with 4.5 mL ethanol 70% at -20 °C added dropwise while vortexing for at least 2 h. Next cells were centrifuged at 400 g for 5 min and washed three times with PBS and resuspended in 100 µL of PBS with 100 µg/mL of ribonuclease A (RNase A) (1072590, Qiagen) and 50 µg/mL of propidium iodide (PI) (P3566, Invitrogen.). Cells were run through the FACS Canto II flow cytometer (BD Biosciences, FacsDiva v.8.0.3) 30 min after the resuspension.
4.8. Analysis Software
Data resulting from film growth experiments were analyzed using GraphPad Prism 9 and OriginPro 8.5. Data resulting from drug release studies were analyzed using GraphPad Prism 9 and OriginPro 8.5. Data resulting from cell cycle studies were analyzed using FlowJo 10.10.1 and Excel (Office 365) and the model chosen for cell cycle analysis was Watson Pragmatic applied to DNA content.
5. Conclusions
In this work, we successfully developed an LbL DDS using the spray-assisted technique. The films exhibited consistent growth and drug incorporation (confirmed by UV-Vis and VUV spectroscopy), with type A films showing higher reproducibility compared to type B films. Despite the incorporation of GO as a diffusion barrier both systems displayed a rapid burst release profile suggesting limited control over sustained drug delivery under the tested conditions. Furthermore, VUV analysis revealed saturation behavior in drug loading, indicating structural limitations in the multilayer architecture. Notably, β-CD complexation did not compromise the biological activity of 5-FU, which effectively induced S-phase cell cycle arrest in a concentration-dependent manner. These findings demonstrate the feasibility of the proposed system while highlighting the need for further optimization to achieve controlled and prolonged drug release suitable for clinical applications.
Author Contributions
Conceptualization, A.M.L.O., M.R., Q.F. and G.A.S.; methodology, A.M.L.O., M.R., S.Y. and R.O.W.; software, A.M.L.O., M.R.; formal analysis, A.M.L.O. and M.R.; investigation, A.M.L.O., M.P.N., M.G. and D.B.B.; data curation, A.M.L.O., M.R., N.C.J. and S.V.H.; writing - original draft preparation, A.M.L.O.; writing - review and editing, M.R., S.Y., R.O.W., Q.F., L.A.P. and G.A.S.; visualization, A.M.L.O. and M.R.; supervision, M.R., Q.F., L.A.P. and G.A.S.; project administration, Q.F. and G.A.S.; funding acquisition, Q.F. and G.A.S.
Funding
This research was funded by Fundação para a Ciência e Tecnologia (FCT) through the projects - iNOVA4Health, Translational Medicine program – UIDB/Multi/04462/2020; UIDB/50008/2020, SmartGlauco - PTDC/CTM-REF/2679/2020 and the PhD scholarship 2022.13010.BD to AML. Access to the AU-UV beamline at the ASTRID2 synchrotron radiation was co-funded by the project NEPHEWS under Grant Agreement No. 101131414 from the EU Framework Programme for Research and Innovation Horizon Europe (project untitled “VUV Spectroscopic Analysis of Poly(β-amino ester) Thin Films for Drug Delivery Applications” and reference number ISA-26-111).
Institutional Review Board Statement
Not applicable.
Informed Consent Statement
Not applicable.
Acknowledgments
The authors would like to acknowledge the Flow Cytometry and Cell Culture Facilities at Nova Medical School Research for their technical support and assistance with experimental procedures. The authors also acknowledge ISA, Aarhus University, for access to the AU-UV beamline at the ASTRID2 synchrotron radiation facility.
Conflicts of Interest
The authors declare no conflicts of interest.
Abbreviations
The following abbreviations are used in this manuscript:
| ACN | Acetonitrile |
| AUC | Area Under the Curve |
| β-CD | β-Cyclodextrin |
| CAS | Chemical Abstracts Service |
| CaF₂ | Calcium Fluoride |
| CI | Confidence Interval |
| CO₂ | Carbon Dioxide |
| CV | Coefficient of Variation |
| DM | Desorbed Material |
| DDS | Drug Delivery System |
| DMEM | Dulbecco’s Modified Eagle Medium |
| DNA | Deoxyribonucleic Acid |
| EDC | N-ethyl-N’-(3-dimethylaminopropyl) carbodiimide methiodide |
| FACS | Fluorescence-Activated Cell Sorting |
| FTIR | Fourier-Transform Infrared Spectroscopy |
| GO | Graphene Oxide |
| GO⁺ | Positively Charged Graphene Oxide |
| GO⁻ | Negatively Charged Graphene Oxide |
| GDD | Glaucoma Drainage Device |
| HCl | Hydrochloric Acid |
| H₂O₂ | Hydrogen Peroxide |
| HPLC | High-Performance Liquid Chromatography |
| H₂SO₄ | Sulfuric Acid |
| IOP | Intraocular Pressure |
| LbL | Layer-by-Layer |
| MIGS | Minimally Invasive Glaucoma Surgery |
| MMC | Mitomycin C |
| N₂ | Nitrogen |
| NaH₂PO₄ | Sodium Dihydrogen Phosphate |
| Na₂HPO₄ | Disodium Hydrogen Phosphate |
| NMR | Nuclear Magnetic Resonance |
| PACG | Primary Angle-Closure Glaucoma |
| PES | Polyethersulfone |
| PMT | Photomultiplier Tube |
| PBS | Phosphate Buffered Saline |
| PBAE | Poly(β-amino ester) |
| PDA | Photodiode Array |
| PDMS | Polydimethylsiloxane |
| PI | Propidium Iodide |
| PP | Peak Position |
| POAG | Primary Open-Angle Glaucoma |
| RSD | Relative Standard Deviation |
| RNase | Ribonuclease |
| RT | Room Temperature |
| SD | Standard Deviation |
| THF | Tetrahydrofuran |
| UV-Vis | Ultraviolet-Visible Spectroscopy |
| VUV | Vacuum Ultraviolet Spectroscopy |
| 5-FU | 5-Fluorouracil |
Appendix A
Appendix A.1
Visual inspection of the films after the drug release study, Figure A1 clearly shows that GO is not being completely desorbed from the substrate during the release assay.
Figure A1.
. Photo showing type A film - (PBAE/5-FU:β-CD)15 and type B film - ((PBAE/5-FU:β-CD)6/GO+/GO−)4 films after desorption. Films number 1, 2, 7 and 8, counting from the top to the bottom and left to right, are type A films while the remainder are type B films. All but the last one are in quartz substrates with the last one being PDMS.
Figure A1.
. Photo showing type A film - (PBAE/5-FU:β-CD)15 and type B film - ((PBAE/5-FU:β-CD)6/GO+/GO−)4 films after desorption. Films number 1, 2, 7 and 8, counting from the top to the bottom and left to right, are type A films while the remainder are type B films. All but the last one are in quartz substrates with the last one being PDMS.
References
- Allison, K.; Patel, D.; Alabi, O. Epidemiology of Glaucoma: The Past, Present, and Predictions for the Future. Cureus 2020, 12(11), e11686. [Google Scholar] [CrossRef] [PubMed]
- Weinreb, R.N.; Aung, T.; Medeiros, F.A. The Pathophysiology and Treatment of Glaucoma: A Review. JAMA 2014, 311(18), 1901–1911. [Google Scholar] [CrossRef] [PubMed]
- Morrison, J.C.; et al. Understanding mechanisms of pressure-induced optic nerve damage. Prog. Retin. Eye Res. 2005, 24(2), 217–240. [Google Scholar] [CrossRef] [PubMed]
- Laowanapiban, P.; Sathianvichitr, K.; Chirapapaisan, N. Structural and functional differentiation between compressive and glaucomatous optic neuropathy. Sci. Rep. 2022, 12(1), 6795. [Google Scholar] [CrossRef] [PubMed]
- Jonas, J.B.; et al. Glaucoma. The Lancet 2017, 390(10108), 2183–2193. [Google Scholar]
- Jayaram, H.; et al. Glaucoma: now and beyond. The Lancet 2023, 402(10414), 1788–1801. [Google Scholar] [CrossRef] [PubMed]
- Coleman, A.L. Glaucoma. The Lancet 1999, 354(9192), 1803–1810. [Google Scholar] [CrossRef] [PubMed]
- Sun, J.A.; et al. Comparison of Structural and Functional Features in Primary Angle Closure and Open Angle Glaucomas. J. Glaucoma 2024, 33(4). [Google Scholar] [CrossRef] [PubMed]
- Schuster, A.K.; et al. The Diagnosis and Treatment of Glaucoma. Dtsch. Arztebl. Int. 2020, 117(13), 225–234. [Google Scholar] [CrossRef] [PubMed]
- Cibis, G.W. Congenital glaucoma. J. Am. Optom. Assoc. 1987, 58(9), 728–33. [Google Scholar] [PubMed]
- Senthil, S.; et al. Neovascular glaucoma - A review. Indian J. Ophthalmol. 2021, 69(3), 525–534. [Google Scholar] [CrossRef] [PubMed]
- Kok, H.; Barton, K. Uveitic glaucoma. Ophthalmol. Clin. 2002, 15(3), 375–387. [Google Scholar] [CrossRef] [PubMed]
- Roberti, G.; et al. Steroid-induced glaucoma: Epidemiology, pathophysiology, and clinical management. Surv. Ophthalmol. 2020, 65(4), 458–472. [Google Scholar] [CrossRef] [PubMed]
- Ellant, J.P.; Obstbaum, S.A. Lens-induced glaucoma. Doc. Ophthalmol. 1992, 81(3), 317–338. [Google Scholar] [CrossRef] [PubMed]
- De Leon-Ortega, J.E.; Girkin, C.A. Ocular trauma-related glaucoma. Ophthalmol. Clin. 2002, 15(2), 215–223. [Google Scholar] [CrossRef] [PubMed]
- WuDunn, D. Genetic basis of glaucoma. Curr. Opin. Ophthalmol. 2002, 13(2). [Google Scholar] [CrossRef] [PubMed]
- Maxwell, G.; Souzeau, E. Childhood glaucoma: Implications for genetic counselling. Clin. Genet. 2024, 106(5), 545–563. [Google Scholar] [CrossRef] [PubMed]
- Xu, L.; Wang, X.; Wu, M. Topical medication instillation techniques for glaucoma. Cochrane Database Syst. Rev. 2017, 2. [Google Scholar] [PubMed]
- Schwartz, G.F. Compliance and persistency in glaucoma follow-up treatment. Curr. Opin. Ophthalmol. 2005, 16(2). [Google Scholar] [CrossRef] [PubMed]
- Ramesh, P.V.; Parthasarathi, S.; John, R.K. An exploratory study of compliance to anti-glaucoma medications among literate primary glaucoma patients at an urban tertiary eye care center in South India. Indian J. Ophthalmol. 2021, 69(6). [Google Scholar] [CrossRef] [PubMed]
- Alhusban, A.A.; et al. Level of Adherence to Glaucoma Medication and Its Associated Factors Among Adult Jordanian Patients. Cureus 2024, 16(6), e63475. [Google Scholar] [CrossRef] [PubMed]
- Yip, J.L.Y.; Foster, P.J. Ethnic differences in primary angle-closure glaucoma. Curr. Opin. Ophthalmol. 2006, 17(2), 175–180. [Google Scholar] [CrossRef] [PubMed]
- Gazzard, G.; et al. Laser in Glaucoma and Ocular Hypertension (LiGHT) Trial: Six-Year Results of Primary Selective Laser Trabeculoplasty versus Eye Drops for the Treatment of Glaucoma and Ocular Hypertension. Ophthalmology 2023, 130(2), 139–151. [Google Scholar] [PubMed]
- Vidal-Villegas, B. J.A. Miralles de Imperial-Ollero, and M.P. Villegas-Pérez, Cyclodestruction and cyclophotocoagulation: Where are we? Arch. De La Soc. Española De Oftalmol. (English Edition) 2024, 99(11), 493–503. [Google Scholar]
- Koike, K.J.; Chang, P.T. Trabeculectomy: A Brief History and Review of Current Trends. Int. Ophthalmol. Clin. 2018, 58(3), 117–133. [Google Scholar] [CrossRef] [PubMed]
- Riva, I.; et al. Ahmed glaucoma valve implant: surgical technique and complications; Clinical Ophthalmology: Auckland, N.Z., 2017; Volume 11, pp. 357–367. [Google Scholar]
- Mendoza-Moreira, A.L.; et al. Efficacy and safety outcomes of the Paul glaucoma implant compared to the Ahmed glaucoma valve. Sci. Rep. 2025, 15(1), 16646. [Google Scholar] [CrossRef] [PubMed]
- Balas, M.; Mathew, D.J. Minimally Invasive Glaucoma Surgery: A Review of the Literature. Vision 2023, 54, 7. [Google Scholar] [CrossRef] [PubMed]
- Carlà, M.M.; et al. The Paul Glaucoma Implant: a systematic review of safety, efficacy, and emerging applications. Graefe’s Arch. Clin. Exp. Ophthalmol. 2025, 263(9), 2447–2459. [Google Scholar] [CrossRef] [PubMed]
- Le, K. H. Saheb, iStent trabecular micro-bypass stent for open-angle glaucoma. Clin. Ophthalmol. 2014, 8, 1937–45. [Google Scholar] [CrossRef] [PubMed]
- Sacchi, M.; et al. Fighting Bleb Fibrosis After Glaucoma Surgery: Updated Focus on Key Players and Novel Targets for Therapy. Int. J. Mol. Sci. 2025, 26, 2327. [Google Scholar] [CrossRef] [PubMed]
- Zhang, W.D.; et al. Mechanisms of fibrosis formation following glaucoma filtration surgery. Int. J. Ophthalmol. 2025, 18(8), 1579–1586. [Google Scholar] [CrossRef] [PubMed]
- Millá, E.; et al. Differential Gene and Protein Expression of Conjunctival Bleb Hyperfibrosis in Early Failure of Glaucoma Surgery. Int. J. Mol. Sci. 2023, 24(15), 11949. [Google Scholar] [CrossRef] [PubMed]
- Jünemann, A.G.M.; Rejdak, R.; Hohberger, B. Revision nach Filtrationschirurgie. Der Ophthalmol. 2016, 113(11), 897–905. [Google Scholar] [CrossRef] [PubMed]
- Collignon-Brach, J. Mitomycin C in glaucoma surgery. Bull. Soc. Belge. Ophtalmol. 1993, 247(1), 79–86. [Google Scholar] [PubMed]
- Kavitha, S.; et al. Wound modulation in glaucoma surgery: The role of anti-scarring agents. Indian J. Ophthalmol. 2024, 72(3), 320–327. [Google Scholar] [CrossRef] [PubMed]
- Rockwood, E.J.; et al. Glaucoma filtering surgery with 5-fluorouracil. Ophthalmology 1987, 94(9), 1071–8. [Google Scholar] [CrossRef] [PubMed]
- Alsaleh, A.; Alfarhan, A. Corneal Endothelial Toxicity Secondary to Topical 5-fluorouracil. Middle East Afr. J. Ophthalmol. 2023, 30(1). [Google Scholar] [CrossRef] [PubMed]
- Shapiro, M.S.; et al. 5-Fluorouracil toxicity to the ocular surface epithelium. Invest Ophthalmol. Vis. Sci. 1985, 26(4), 580–3. [Google Scholar] [PubMed]
- Katz, G.J.; et al. Mitomycin C versus 5-fluorouracil in high-risk glaucoma filtering surgery. Extended follow-up. Ophthalmology 1995, 102(9), 1263–9. [Google Scholar] [CrossRef] [PubMed]
- Kang, S.G.; et al. Mechanism of growth inhibitory effect of Mitomycin-C on cultured human retinal pigment epithelial cells: Apoptosis and cell cycle arrest. Curr. Eye Res. 2001, 22(3), 174–181. [Google Scholar] [CrossRef] [PubMed]
- Sinitsky, M.Y.; et al. Mitomycin C induced genotoxic stress in endothelial cells is associated with differential expression of proinflammatory cytokines. Mutat. Res. Genet Toxicol. Env. Mutagen 2020. 858-860, 503252. [Google Scholar] [CrossRef] [PubMed]
- Zhang, N.; et al. 5-Fluorouracil: Mechanisms of Resistance and Reversal Strategies. Molecules 2008, 13, 1551–1569. [Google Scholar] [CrossRef] [PubMed]
- Nassiri, N.; et al. Use of Mitomycin C in Ophthalmic Surgery. J. Curr. Ophthalmol. 2024, 36(3). [Google Scholar] [CrossRef] [PubMed]
- Wolters, J.E.J.; et al. History, presence, and future of mitomycin C in glaucoma filtration surgery. Curr. Opin. Ophthalmol. 2021, 32(2), 148–159. [Google Scholar] [CrossRef] [PubMed]
- Assunção, I.C.C.; et al. Graphene Oxide Layer-by-Layer Films for Sensors and Devices. Nanomaterials 2021, 11, 1556. [Google Scholar] [CrossRef] [PubMed]
- Oliveira, A.M.L.; et al. Graphene Oxide Thin Films with Drug Delivery Function. Nanomaterials 2022, 12, 1149. [Google Scholar] [CrossRef] [PubMed]
- Machado, M.; et al. Self-Assembled Multilayer Films for Time-Controlled Ocular Drug Delivery. ACS Appl. Bio Mater. 2019, 2(10), 4173–4180. [Google Scholar] [CrossRef] [PubMed]
- Lynn, D.M.; Langer, R. Degradable Poly(β-amino esters): Synthesis, Characterization, and Self-Assembly with Plasmid DNA. J. Am. Chem. Soc. 2000, 122(44), 10761–10768. [Google Scholar] [CrossRef]
- Melnikova, D.L.; et al. On Complex Formation between 5-Fluorouracil and β-Cyclodextrin in Solution and in the Solid State: IR Markers and Detection of Short-Lived Complexes by Diffusion NMR. Molecules 2020, 25, 5706. [Google Scholar] [CrossRef] [PubMed]
- Di Donato, C.; et al. Alpha- and Beta-Cyclodextrin Inclusion Complexes with 5-Fluorouracil: Characterization and Cytotoxic Activity Evaluation. Molecules 2016, 21, 1644. [Google Scholar] [CrossRef] [PubMed]
- Machado, M.; et al. Enhancement of the solubility of 5-fluorouracil through encapsulation within β-cyclodextrin to control fibroblast growth in glaucoma surgery. RSC Adv. 2025, 15(40), 33522–33530. [Google Scholar] [CrossRef] [PubMed]
- Jin, L.; et al. Preparation of 5-Fluorouracil/β-Cyclodextrin Complex Intercalated in Layered Double Hydroxide and the Controlled Drug Release Properties. Ind. Eng. Chem. Res. 2010, 49(22), 11176–11181. [Google Scholar] [CrossRef]
- Al-Shaari, H.; et al. A systematic review of repeatability and reproducibility studies of diffusion tensor imaging of cervical spinal cord. Br. J. Radiol. 2023, 96(1151), 20221019. [Google Scholar] [CrossRef] [PubMed]
- Viriyakitpattana, N.; et al. Layer-by-Layer Biopolymer Assembly for the In Situ Fabrication of AuNP Plasmonic Paper-A SERS Substrate for Food Adulteration Detection. ACS Omega 2024, 9(9), 10099–10109. [Google Scholar] [CrossRef] [PubMed]
- Turner, E.A.; et al. Coating and Pharmacokinetic Evaluation of Air Spray Coated Drug Coated Balloons. Cardiovasc Eng. Technol. 2018, 9(2), 240–250. [Google Scholar] [CrossRef] [PubMed]
- Kittle, J.; Levin, J.; Levin, N. Water Content of Polyelectrolyte Multilayer Films Measured by Quartz Crystal Microbalance and Deuterium Oxide Exchange. Sensors 2021, 21(3), 771. [Google Scholar] [CrossRef] [PubMed]
- Serebrennikova, K.V.; et al. SERS Sensors with Bio-Derived Substrates Under the Way to Agricultural Monitoring of Pesticide Residues. Biosensors 2024, 14(12), 573. [Google Scholar] [CrossRef] [PubMed]
- Samy, M.; et al. In vitro release and cytotoxicity activity of 5-fluorouracil entrapped polycaprolactone nanoparticles. Polym. Bull. 2022, 79(8), 6645–6671. [Google Scholar] [CrossRef]
- De Angelis, P.M.; et al. Cellular response to 5-fluorouracil (5-FU) in 5-FU-resistant colon cancer cell lines during treatment and recovery. Mol. Cancer 2006, 5, 20. [Google Scholar] [CrossRef] [PubMed]
- Backus, H.H.; et al. Differences in the induction of DNA damage, cell cycle arrest, and cell death by 5-fluorouracil and antifolates. Oncol. Res. 2000, 12(5), 231–9. [Google Scholar] [CrossRef] [PubMed]
- Hwang, H.; et al. Highly Tunable Charge Transport in Layer-by-Layer Assembled Graphene Transistors. ACS Nano 2012, 6(3), 2432–2440. [Google Scholar] [CrossRef] [PubMed]
- National Center for Biotechnology; I. PubChem Compound Summary for CID 3385, 5-Fluorouracil. 2004. [Google Scholar]
- Pirvu, A.S.; et al. Cyclodextrins as Active Therapeutic Agents: Beyond Their Role as Excipients. Pharmaceuticals 2025, 18, 1592. [Google Scholar] [CrossRef] [PubMed]
- Morais, H.I.C. Nanostructured films of graphene for controlled ocular drug delivery; Instituto Politécnico de Lisboa: Lisboa, Portugal, 2017. [Google Scholar]
- Tadyszak, K.; Wychowaniec, J.K.; Litowczenko, J. Biomedical Applications of Graphene-Based Structures. Nanomaterials 2018, 8(11), 944. [Google Scholar] [CrossRef] [PubMed]
- Bhowmick, D.K.; et al. Functionalization of Amorphous SiO2 and 6H-SiC(0001) Surfaces with Benzo[ghi]perylene-1,2-dicarboxylic Anhydride via an APTES Linker. Small 2012, 8(4), 592–601. [Google Scholar] [CrossRef] [PubMed]
- de Vos, W.M.; et al. Adsorption and Surfactant-Mediated Desorption of Poly(vinylpyrrolidone) on Plasma- and Piranha-Cleaned Silica Surfaces. Langmuir 2014, 30(28), 8425–8431. [Google Scholar] [CrossRef] [PubMed]
- Snopok, B.; et al. Gold surface cleaning by etching polishing: Optimization of polycrystalline film topography and surface functionality for biosensing. Surf. Interfaces 2021, 22, 100818. [Google Scholar] [CrossRef]
- Nafian, F.; et al. A lab-on-a-chip model of glaucoma. Brain Behav. 2020, 10(10), e01799. [Google Scholar] [CrossRef] [PubMed]
Figure 1.
Schematic composition of type A and B LbL films. Created with BioRender.com.
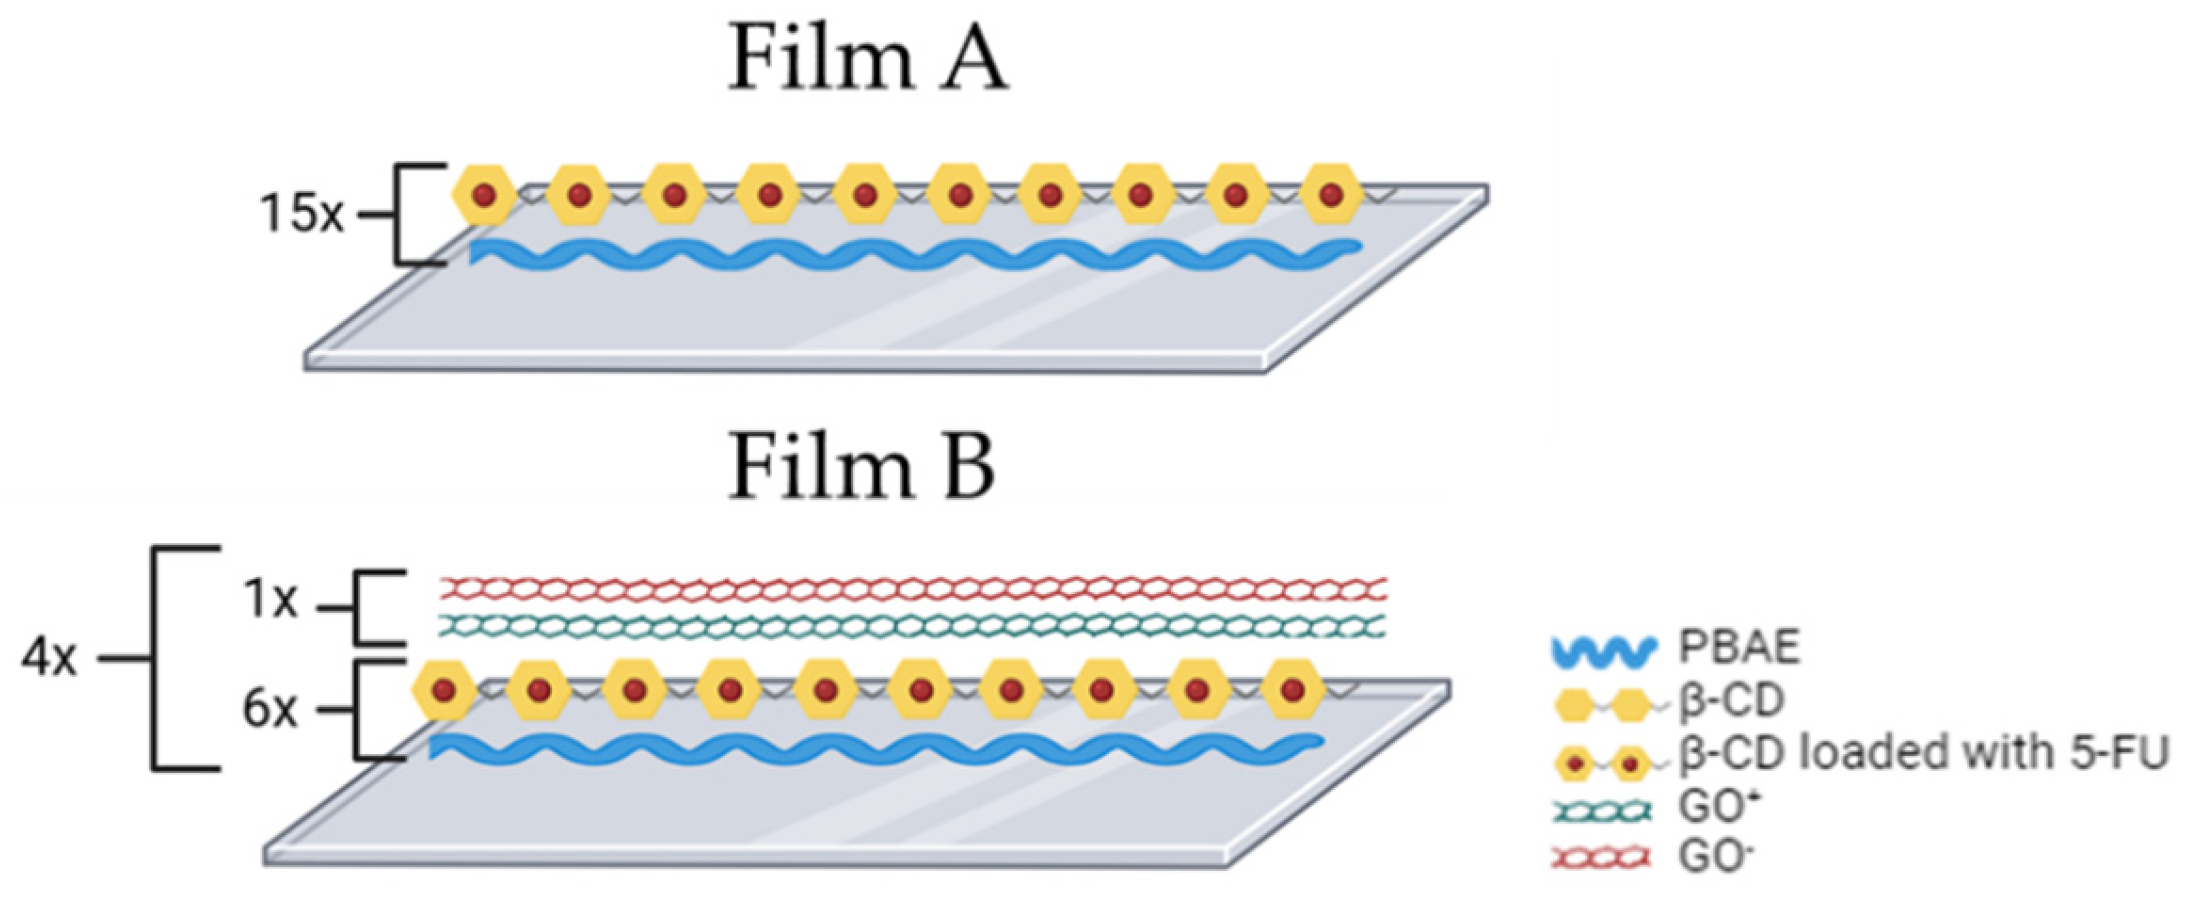
Figure 2.
UV-Vis spectra between 200 and 300 nm representing the growth of (A) - (PBAE/5-FU:β-CD)15 (type A film) and (B) - ((PBAE/5-FU:β-CD)6/GO+/GO−)4 (type B film) LbL films.
Figure 2.
UV-Vis spectra between 200 and 300 nm representing the growth of (A) - (PBAE/5-FU:β-CD)15 (type A film) and (B) - ((PBAE/5-FU:β-CD)6/GO+/GO−)4 (type B film) LbL films.
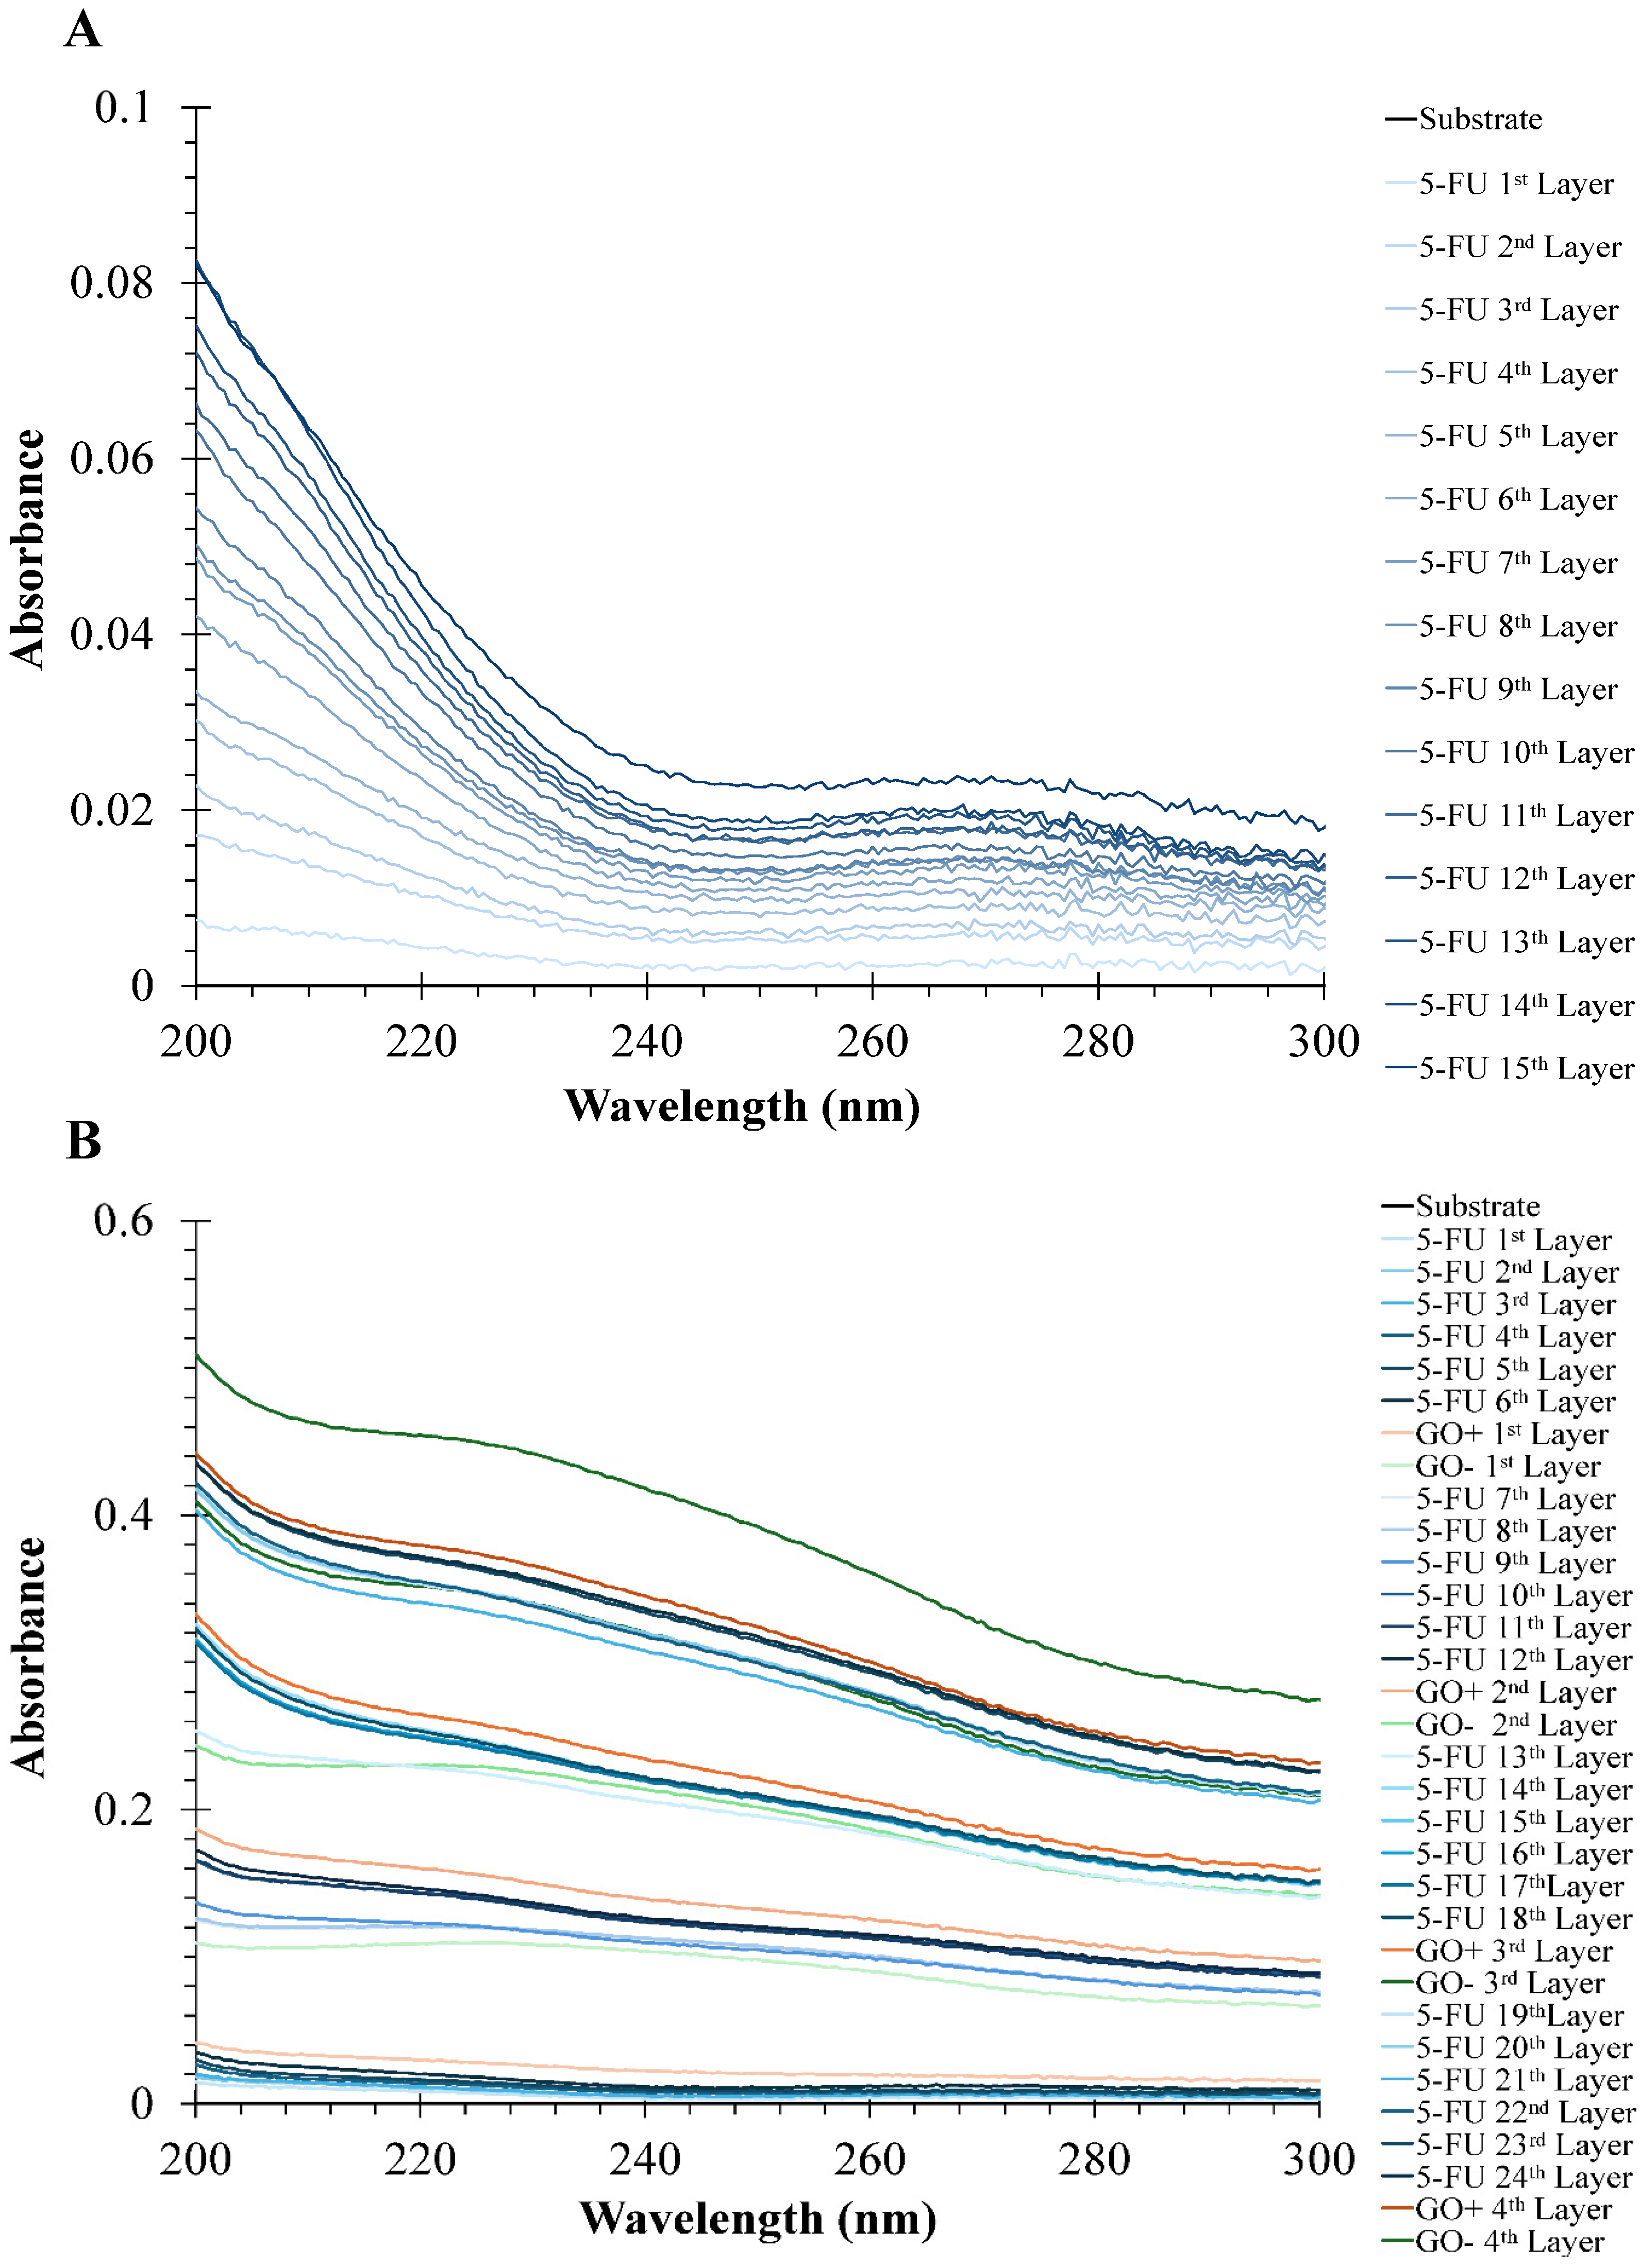
Figure 3.
Film growth absorbance at λ 266 nm. (A) - (PBAE/5-FU:β-CD)15 (type A film); (B) - ((PBAE/5-FU:β-CD)6/GO+/GO−)4 ( type B film); (C) – Slope comparison per set for type B films represented in Figure 3 (B); (D) - Offset-corrected growth curve for Type B films represented in Figure 3 (B), isolating 5-FU accumulation from GO absorbance. Data are represented as mean ± standard deviation (SD) (n = 4 for Type A; n = 3 for Type B; see text for details). Dotted lines represent the 95% confidence interval (CI) for the regression line.
Figure 3.
Film growth absorbance at λ 266 nm. (A) - (PBAE/5-FU:β-CD)15 (type A film); (B) - ((PBAE/5-FU:β-CD)6/GO+/GO−)4 ( type B film); (C) – Slope comparison per set for type B films represented in Figure 3 (B); (D) - Offset-corrected growth curve for Type B films represented in Figure 3 (B), isolating 5-FU accumulation from GO absorbance. Data are represented as mean ± standard deviation (SD) (n = 4 for Type A; n = 3 for Type B; see text for details). Dotted lines represent the 95% confidence interval (CI) for the regression line.
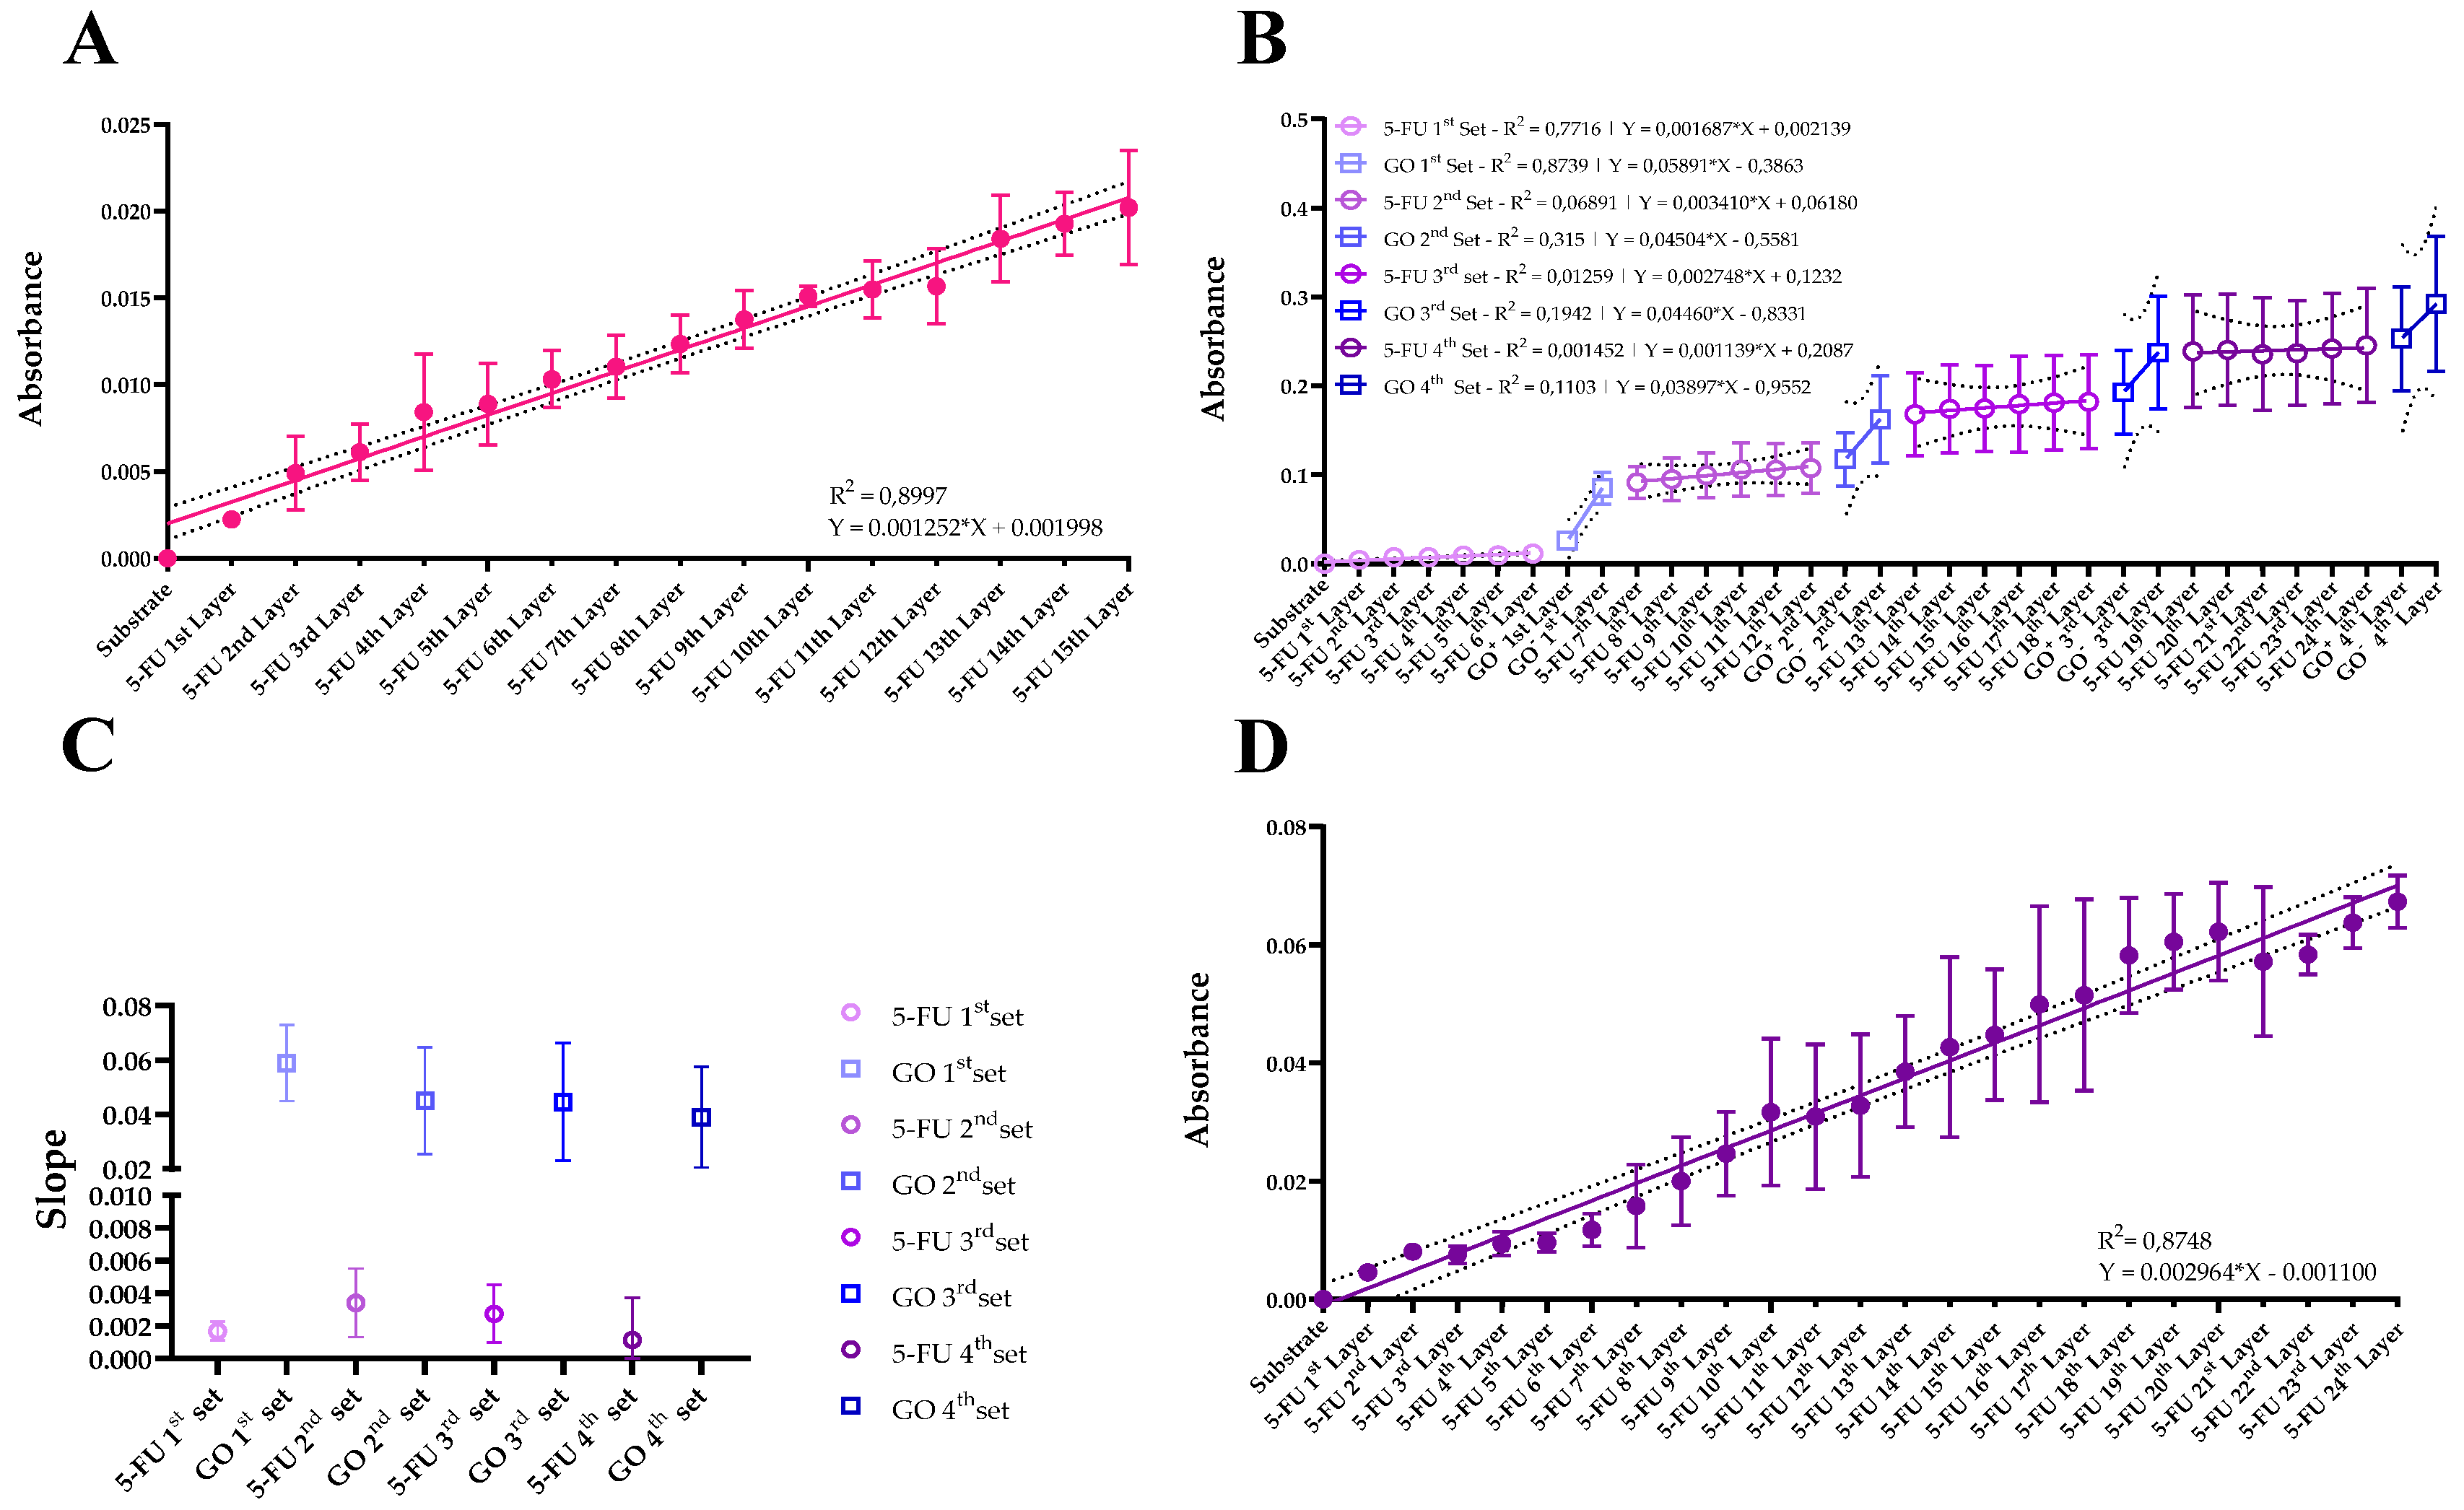
Figure 4.
Drug release studies. (A) Type A films; (B) Type B films. The drug release was assessed by HPLC for three type A films and four type B films. In panel B, the purple data series corresponds to a film deposited on a PDMS substrate, while the remaining series in both panels correspond to films deposited on quartz substrates. A burst release is observed within the first 5 min, followed by a plateau region thereafter.
Figure 4.
Drug release studies. (A) Type A films; (B) Type B films. The drug release was assessed by HPLC for three type A films and four type B films. In panel B, the purple data series corresponds to a film deposited on a PDMS substrate, while the remaining series in both panels correspond to films deposited on quartz substrates. A burst release is observed within the first 5 min, followed by a plateau region thereafter.
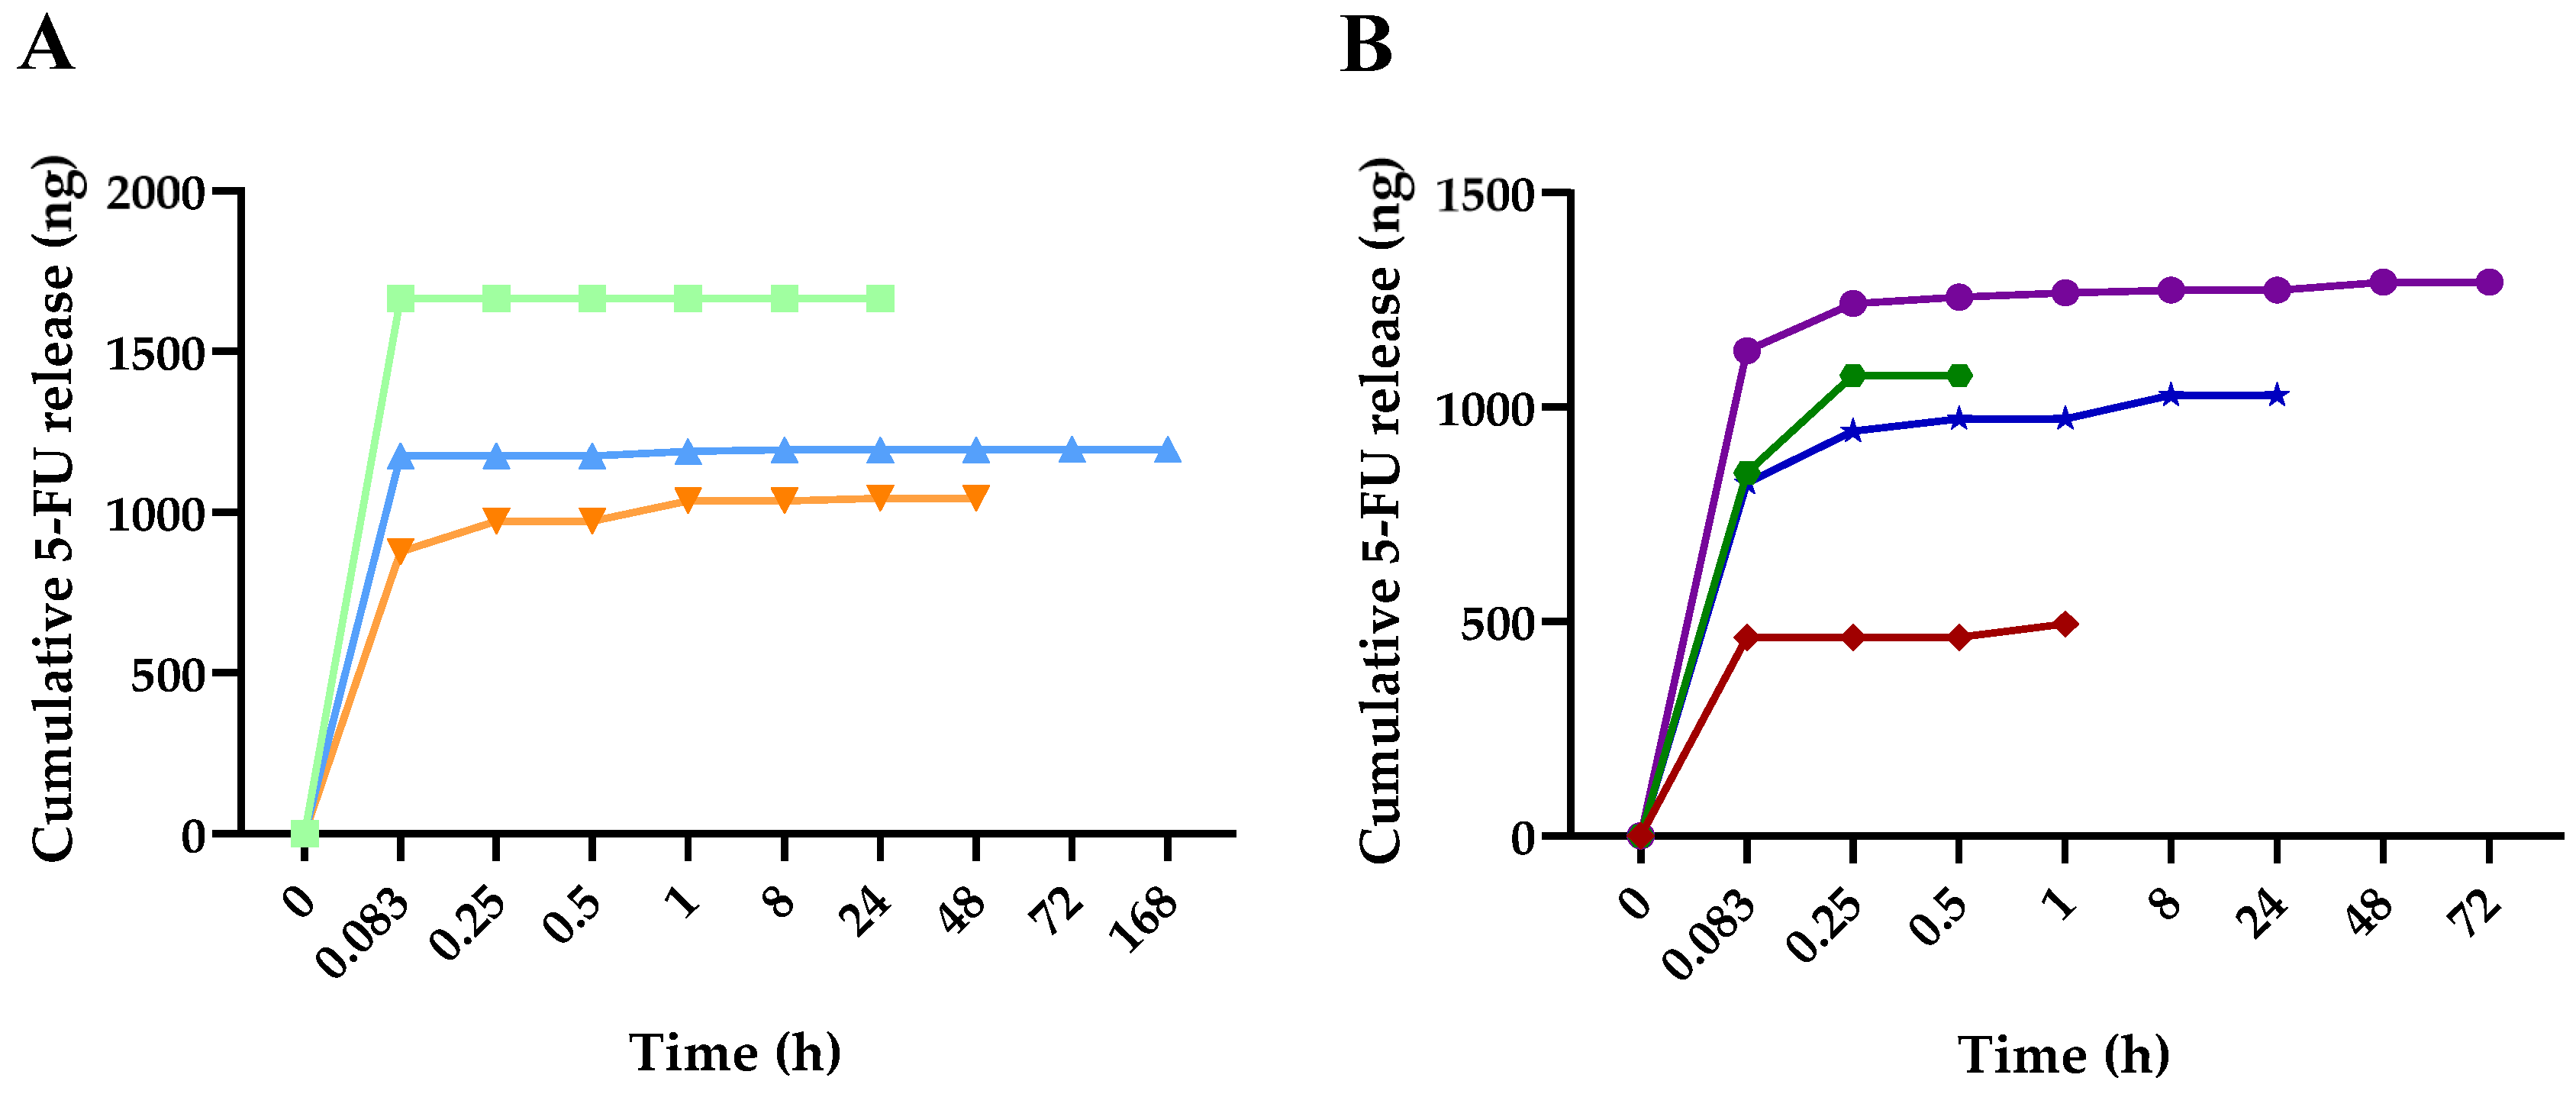
Figure 5.
UV-Vis spectra of a representative type A film - (PBAE/5-FU:β-CD)15 and type B film - ((PBAE/5-FU:β-CD)6/GO+/GO−)4 before and after desorption, as well as the graphical representation of the desorption difference spectra.
Figure 5.
UV-Vis spectra of a representative type A film - (PBAE/5-FU:β-CD)15 and type B film - ((PBAE/5-FU:β-CD)6/GO+/GO−)4 before and after desorption, as well as the graphical representation of the desorption difference spectra.
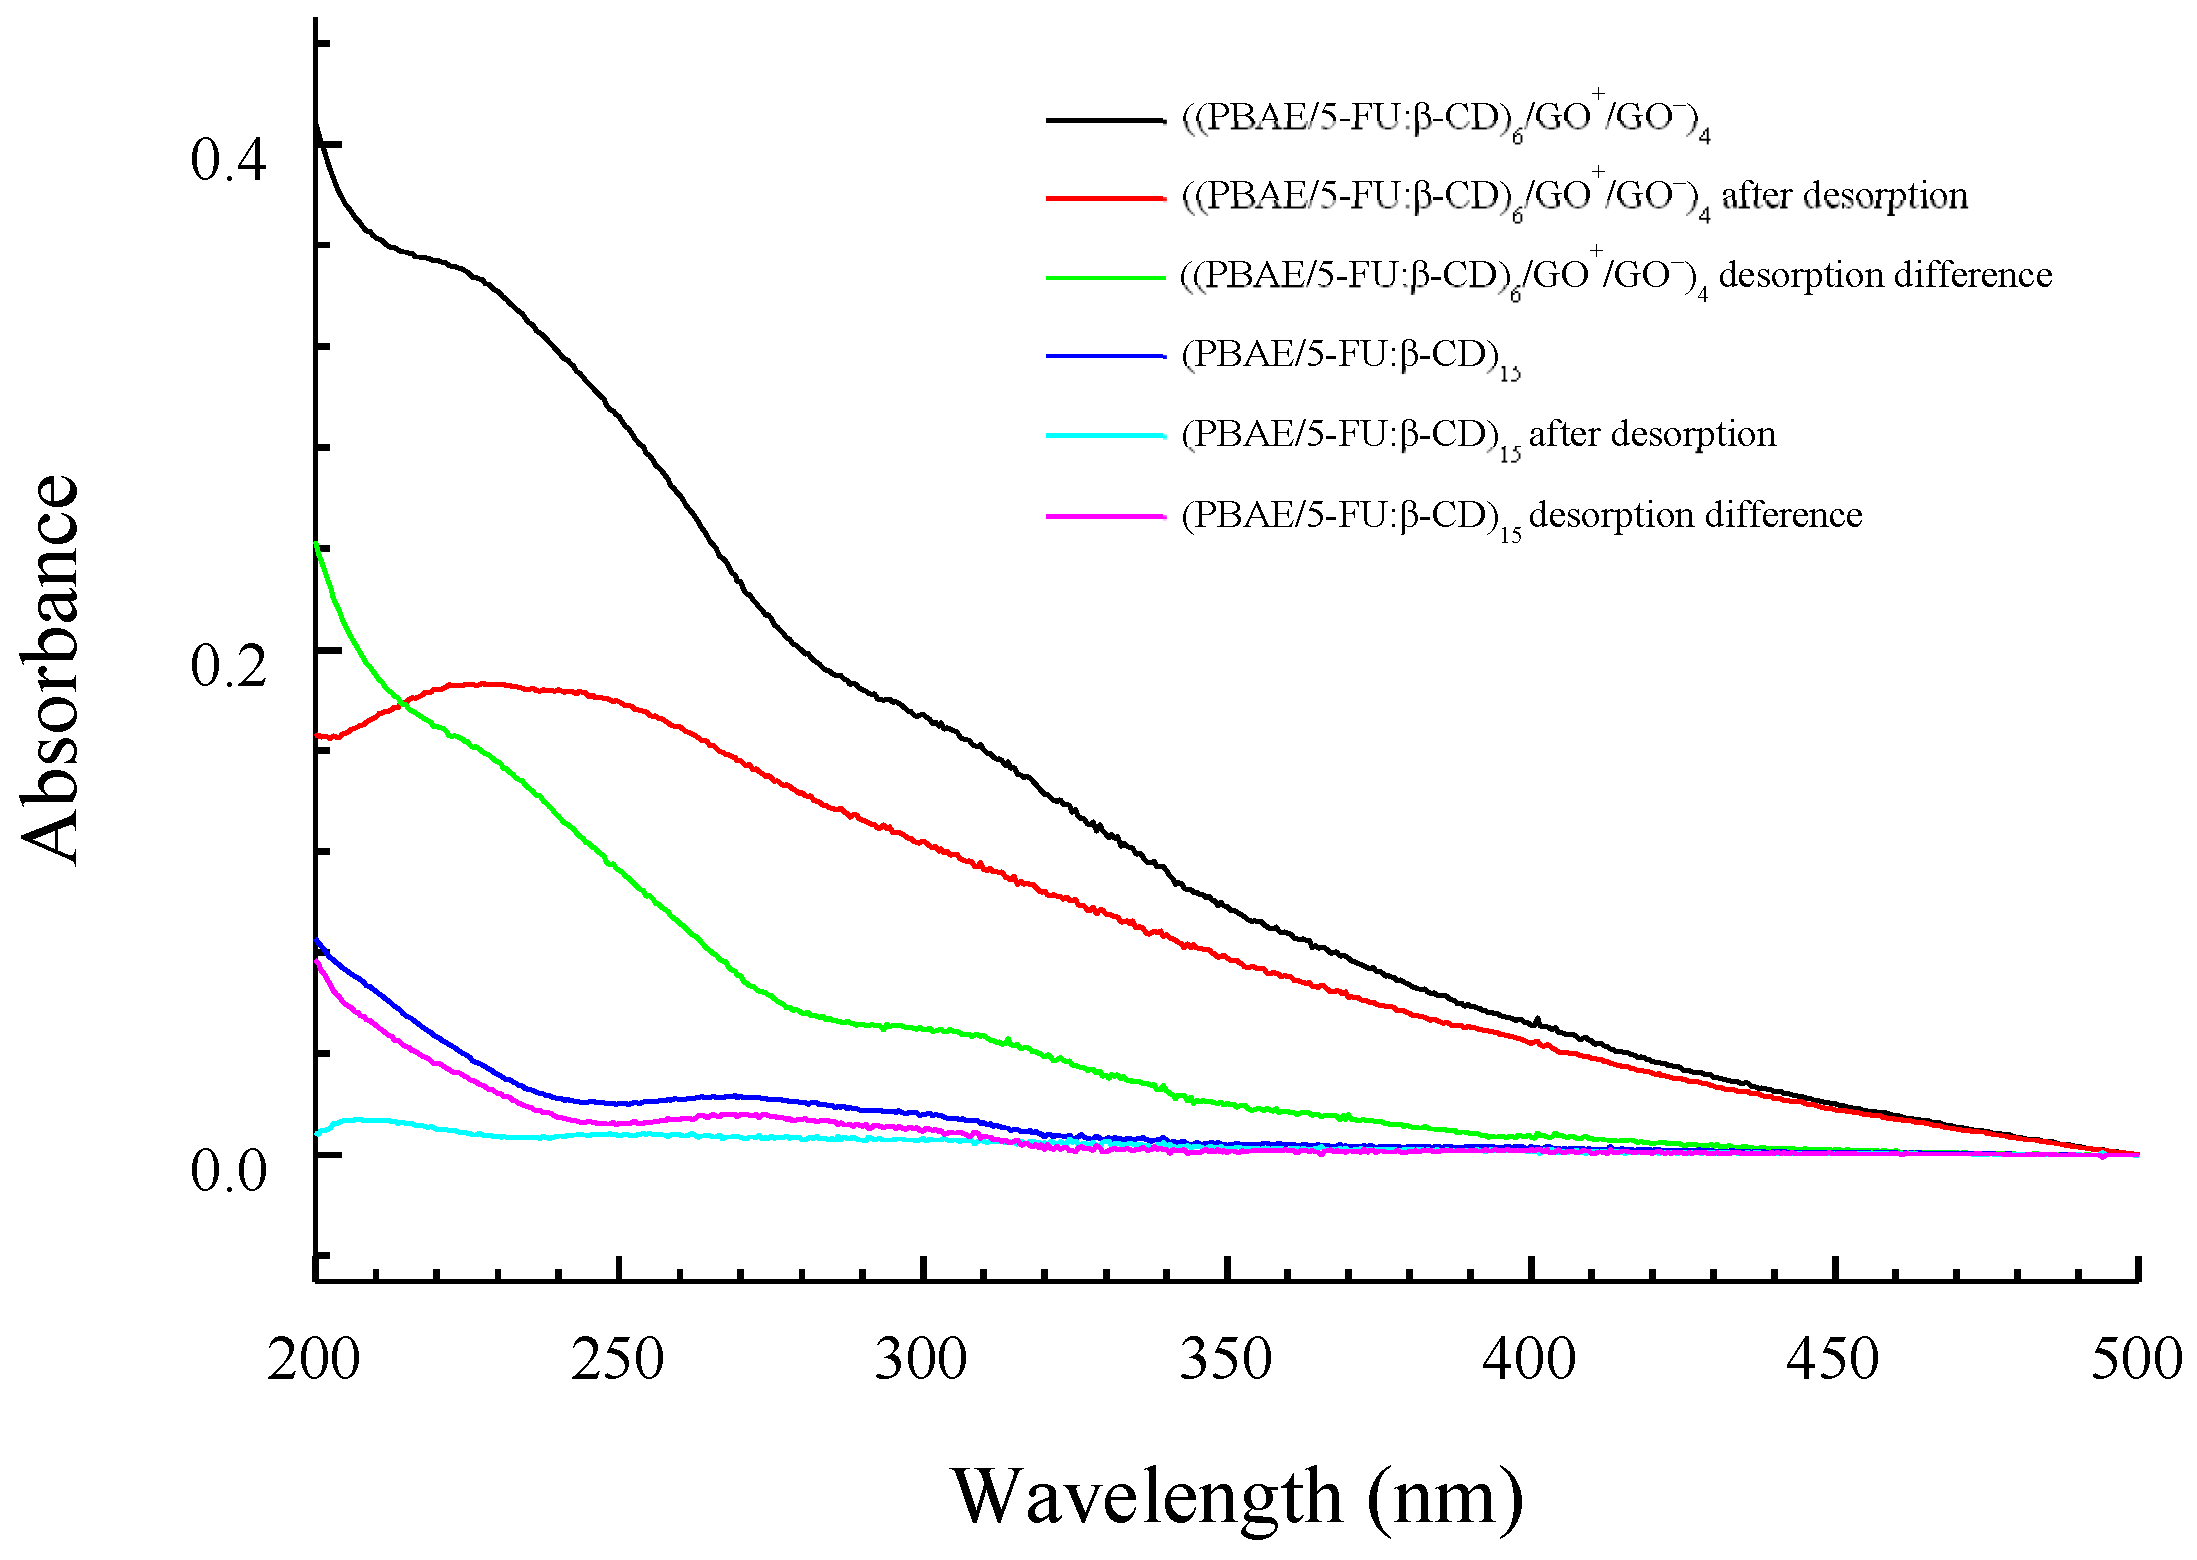
Figure 6.
UV-Vis spectra of a representative type A film (PBAE/5-FU:β-CD)15 before desorption (A) and its desorption difference spectrum (B); and of a type B film ((PBAE/5-FU:β-CD)6/GO+/GO−)4 before desorption (C) and its desorption difference spectrum (D). The green, blue, and magenta curves are the fitted Gaussian peaks.
Figure 6.
UV-Vis spectra of a representative type A film (PBAE/5-FU:β-CD)15 before desorption (A) and its desorption difference spectrum (B); and of a type B film ((PBAE/5-FU:β-CD)6/GO+/GO−)4 before desorption (C) and its desorption difference spectrum (D). The green, blue, and magenta curves are the fitted Gaussian peaks.
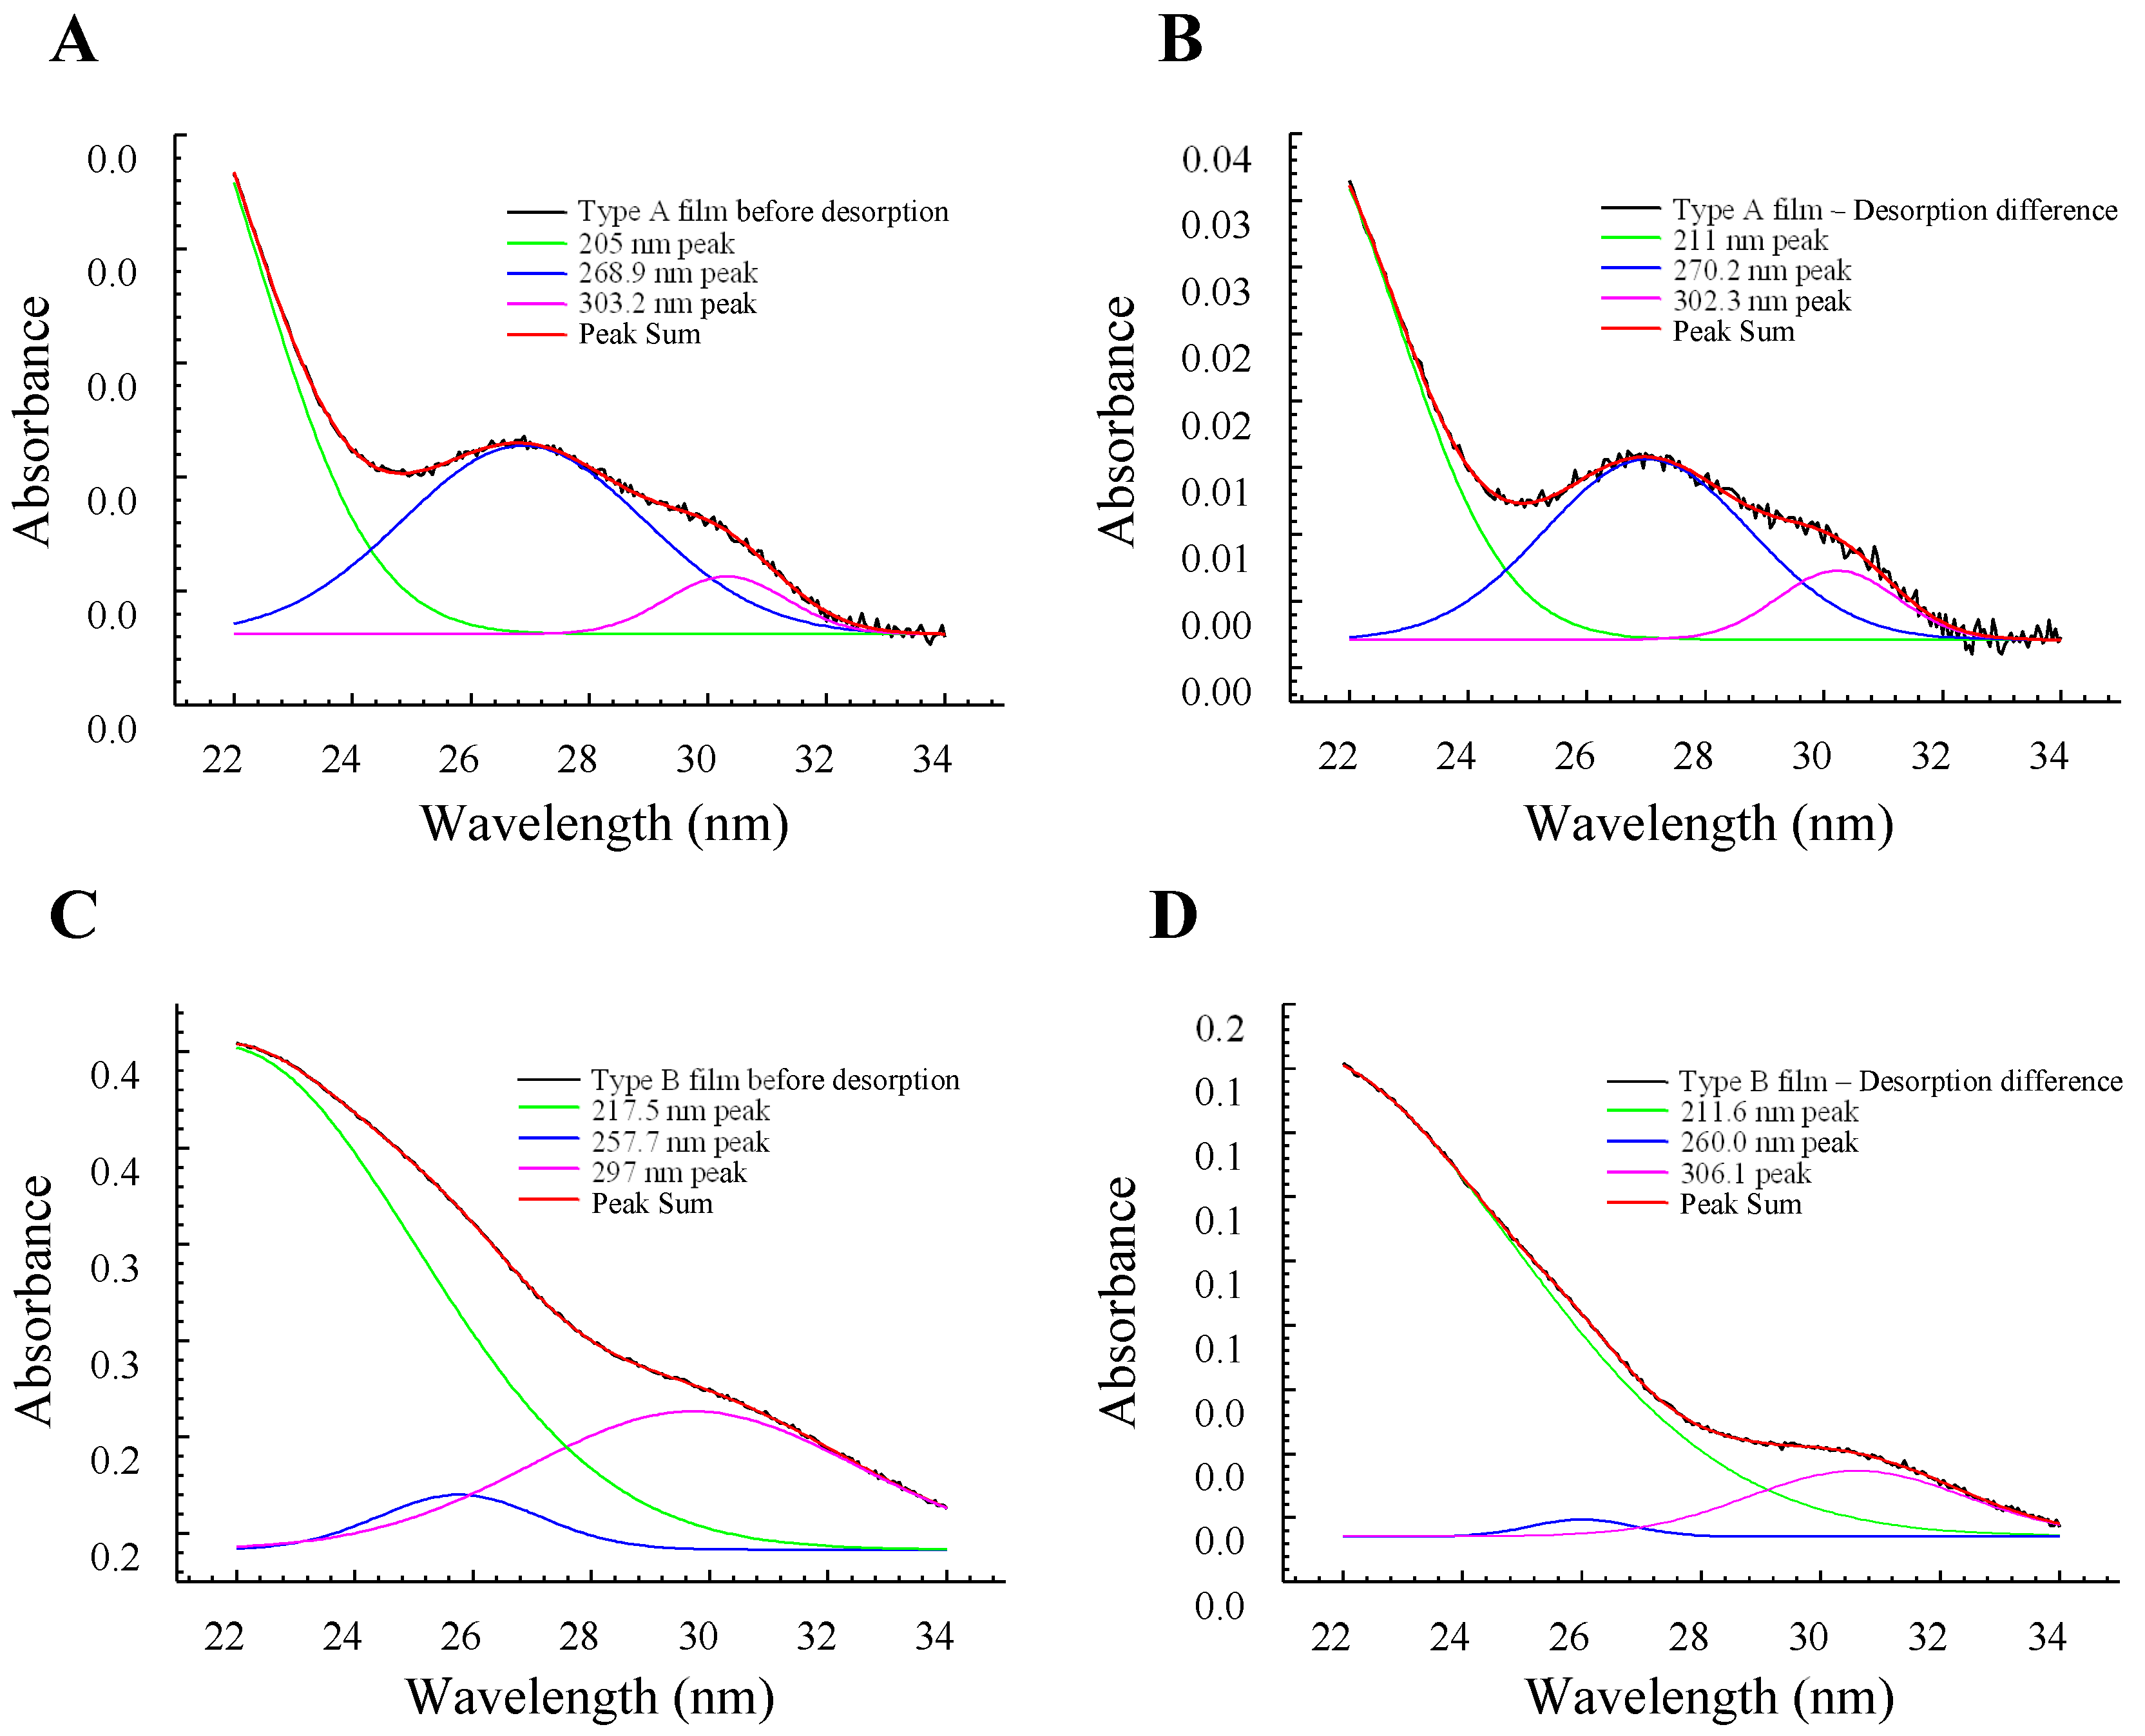
Figure 7.
VUV spectra between 120 and 330 nm representing the desorption for 1 min of (A) (PBAE/5-FU:β-CD)10 and (B) ((PBAE/5-FU:β-CD)6/GO+/GO−)4 (type B film).
Figure 7.
VUV spectra between 120 and 330 nm representing the desorption for 1 min of (A) (PBAE/5-FU:β-CD)10 and (B) ((PBAE/5-FU:β-CD)6/GO+/GO−)4 (type B film).
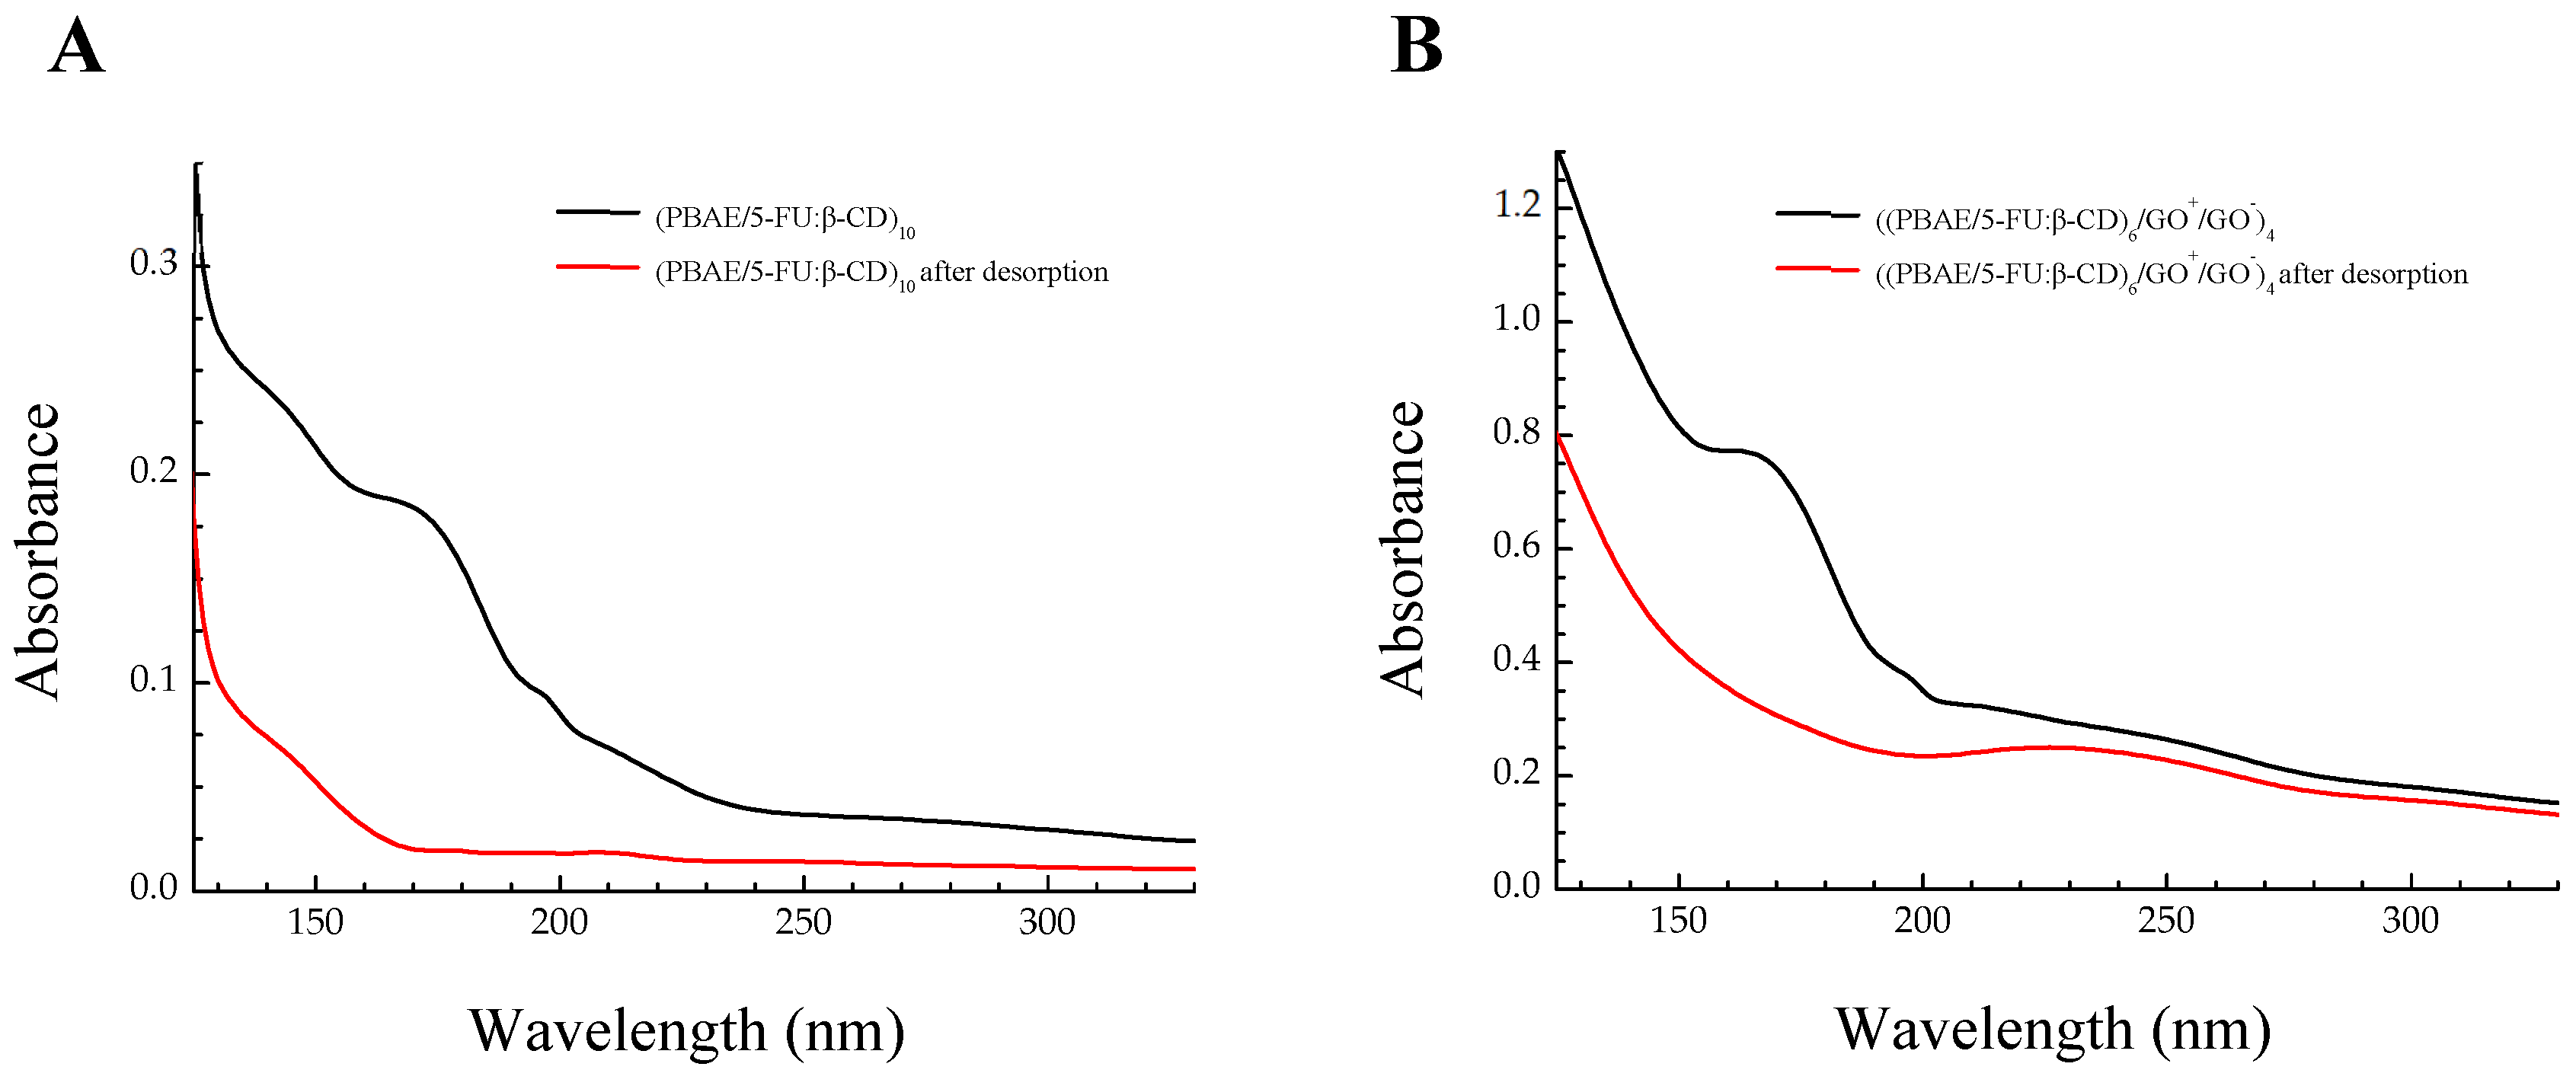
Figure 8.
VUV spectra between 130 and 330 nm comparing type B films prepared with either 6 or 12 PBAE/5-FU:β-CD bilayers between each GO⁺/GO⁻ block: ((PBAE/5-FU:β-CD)₆/GO⁺/GO⁻)₄ and ((PBAE/5-FU:β-CD)₁₂/GO⁺/GO⁻)₄, respectively.
Figure 8.
VUV spectra between 130 and 330 nm comparing type B films prepared with either 6 or 12 PBAE/5-FU:β-CD bilayers between each GO⁺/GO⁻ block: ((PBAE/5-FU:β-CD)₆/GO⁺/GO⁻)₄ and ((PBAE/5-FU:β-CD)₁₂/GO⁺/GO⁻)₄, respectively.
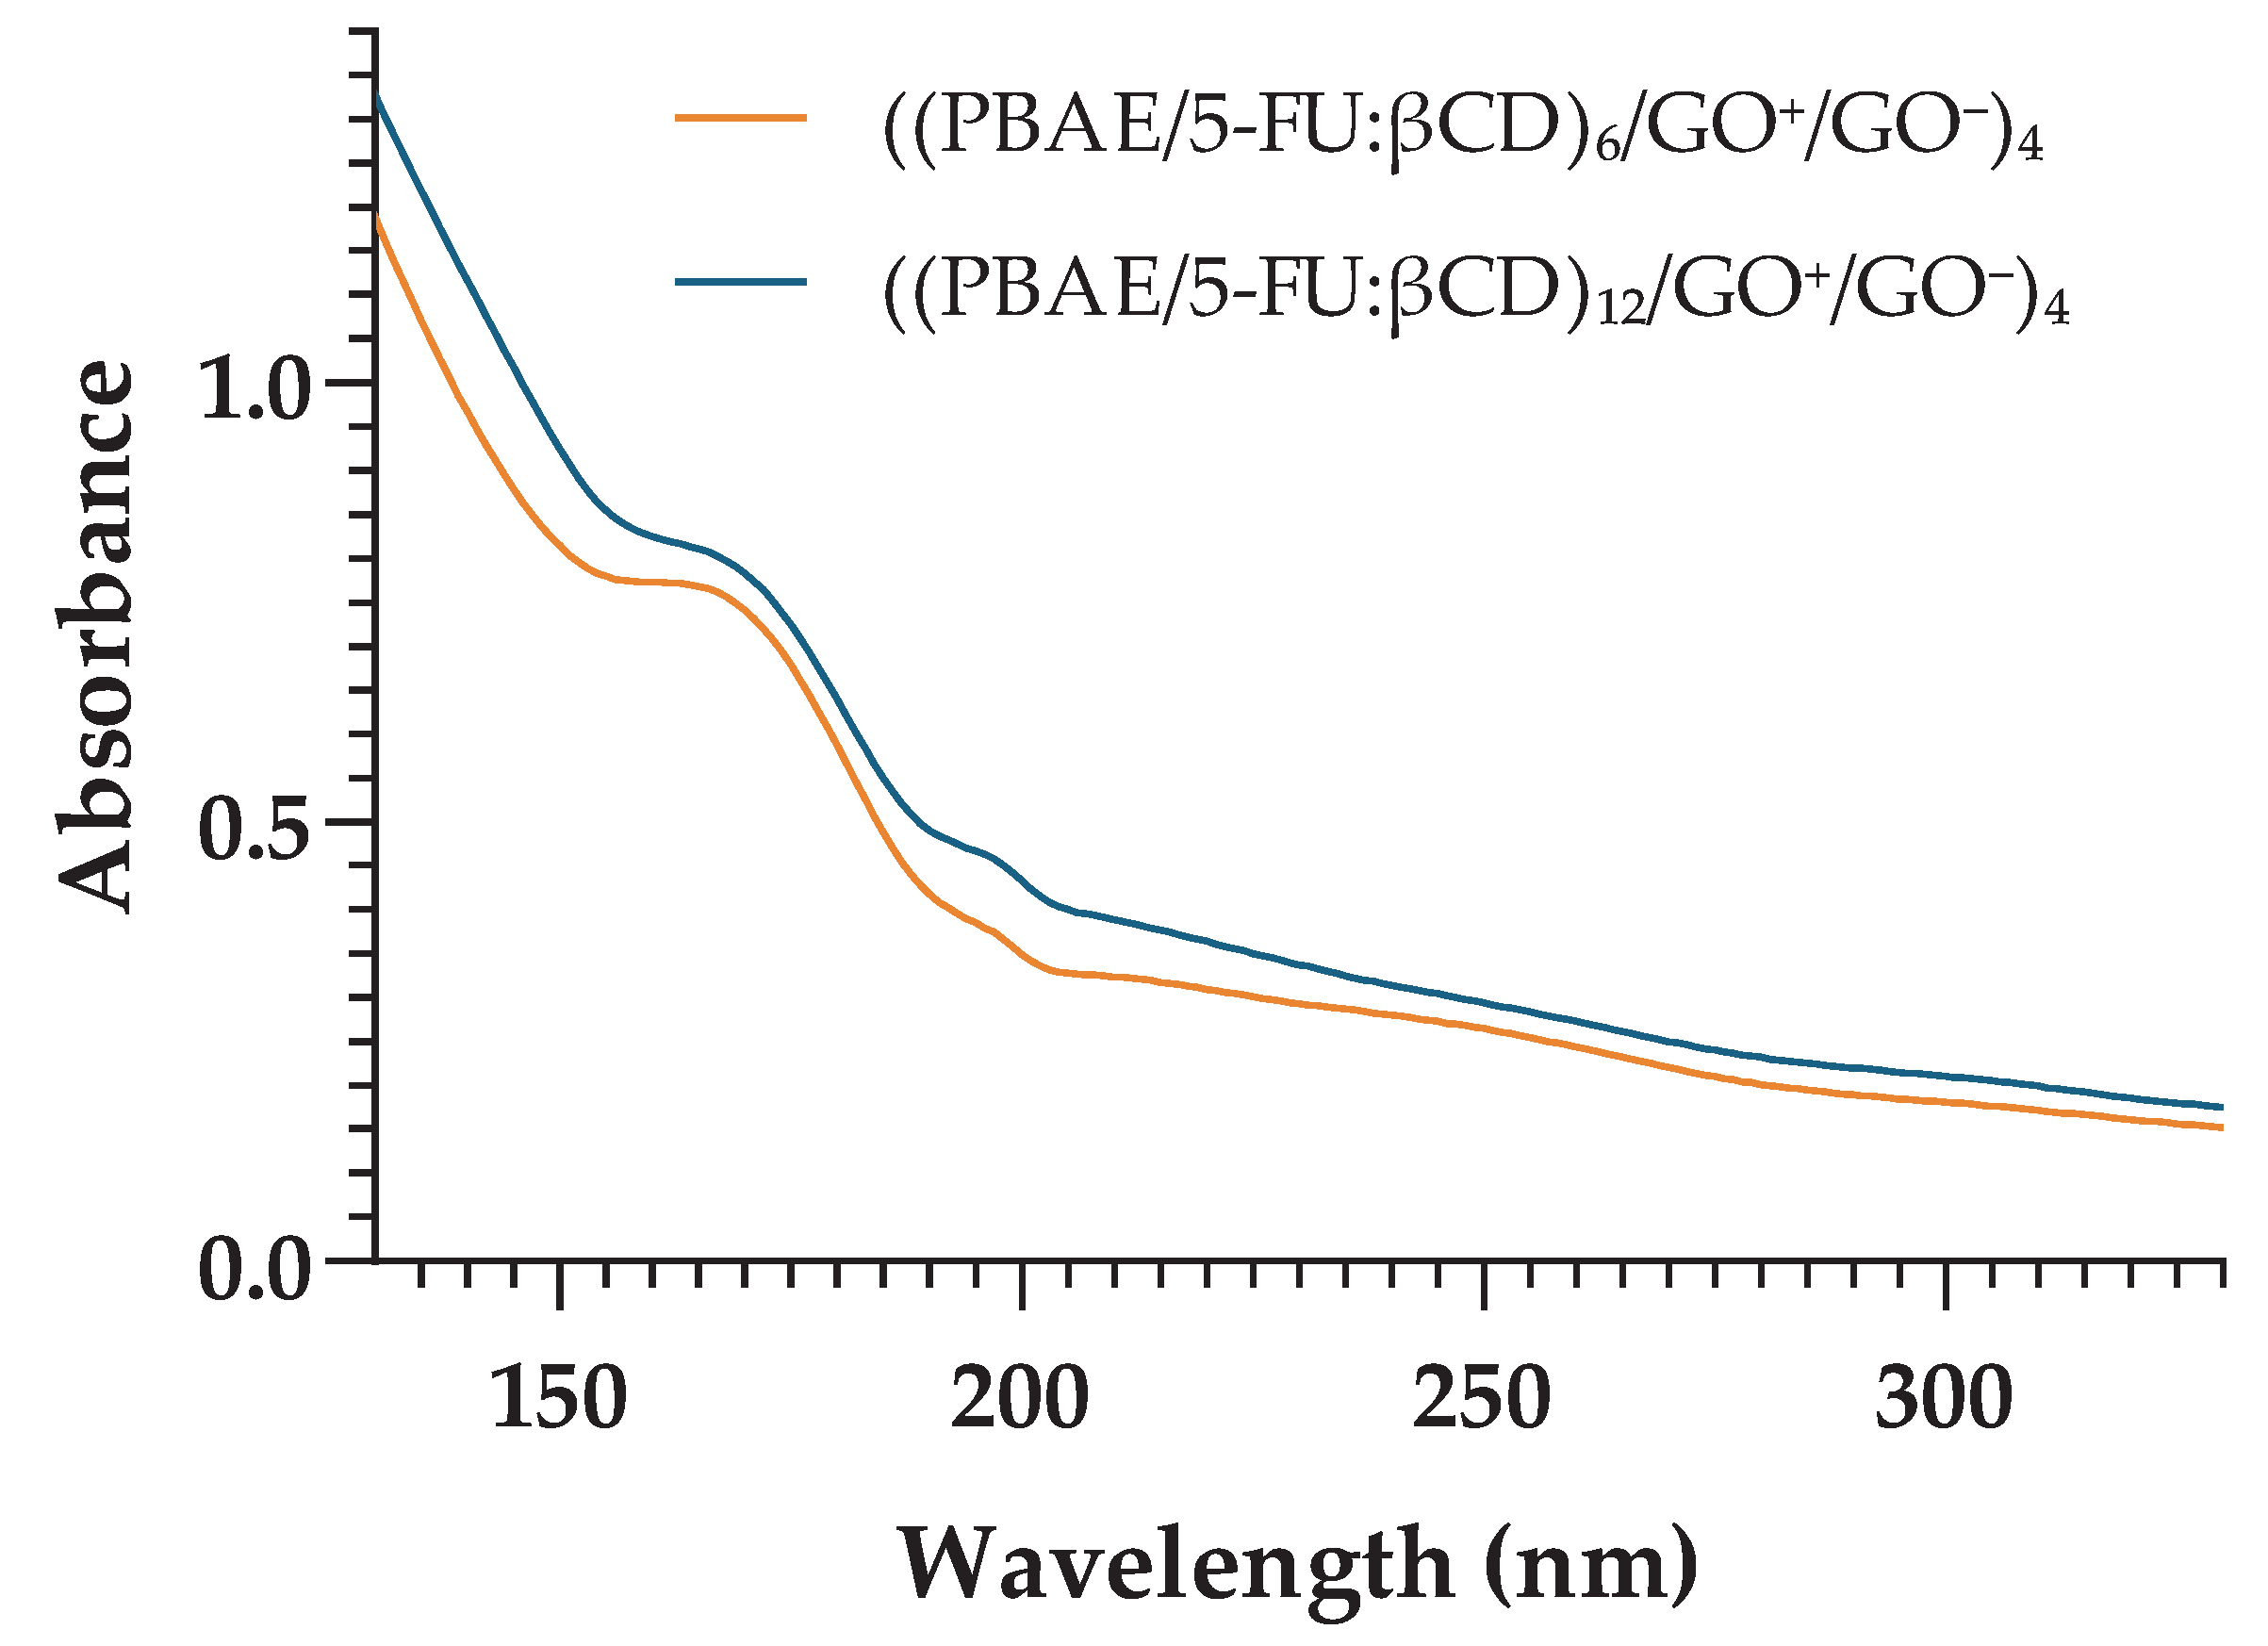
Figure 9.
. Effect of 5-FU on the cell cycle distribution. Flow cytometry was used to analyze the effect of two different dose levels of 5-FU alone or complexed with β-CD (5-FU:β-CD). 5-FU induced cell cycle arrest in the S phase, with a stronger effect at the higher dose, while β-CD controls did not appear to affect cell cycle distribution. The control (CT) corresponds to untreated cells, and PBS was used as the dissolution medium for all conditions. For clarity, β-CD/PBS controls and 5-FU/5-FU:β-CD conditions are presented separately. β-CD controls were prepared using the amount of β-CD equivalent to that present in the corresponding 5-FU:β-CD complexes. Data are expressed as the percentage of cells in each cell cycle phase. A total of 30,000 cells were analyzed per experiment, with n = 3 independent experiments. Statistical significance was assessed by ordinary one-way ANOVA followed by Tukey’s multiple comparisons test. Adjusted p values indicate statistical significance: p < 0.0001 (****); p < 0.0002 (***); p < 0.0021 (**); p < 0.0332 (*).
Figure 9.
. Effect of 5-FU on the cell cycle distribution. Flow cytometry was used to analyze the effect of two different dose levels of 5-FU alone or complexed with β-CD (5-FU:β-CD). 5-FU induced cell cycle arrest in the S phase, with a stronger effect at the higher dose, while β-CD controls did not appear to affect cell cycle distribution. The control (CT) corresponds to untreated cells, and PBS was used as the dissolution medium for all conditions. For clarity, β-CD/PBS controls and 5-FU/5-FU:β-CD conditions are presented separately. β-CD controls were prepared using the amount of β-CD equivalent to that present in the corresponding 5-FU:β-CD complexes. Data are expressed as the percentage of cells in each cell cycle phase. A total of 30,000 cells were analyzed per experiment, with n = 3 independent experiments. Statistical significance was assessed by ordinary one-way ANOVA followed by Tukey’s multiple comparisons test. Adjusted p values indicate statistical significance: p < 0.0001 (****); p < 0.0002 (***); p < 0.0021 (**); p < 0.0332 (*).
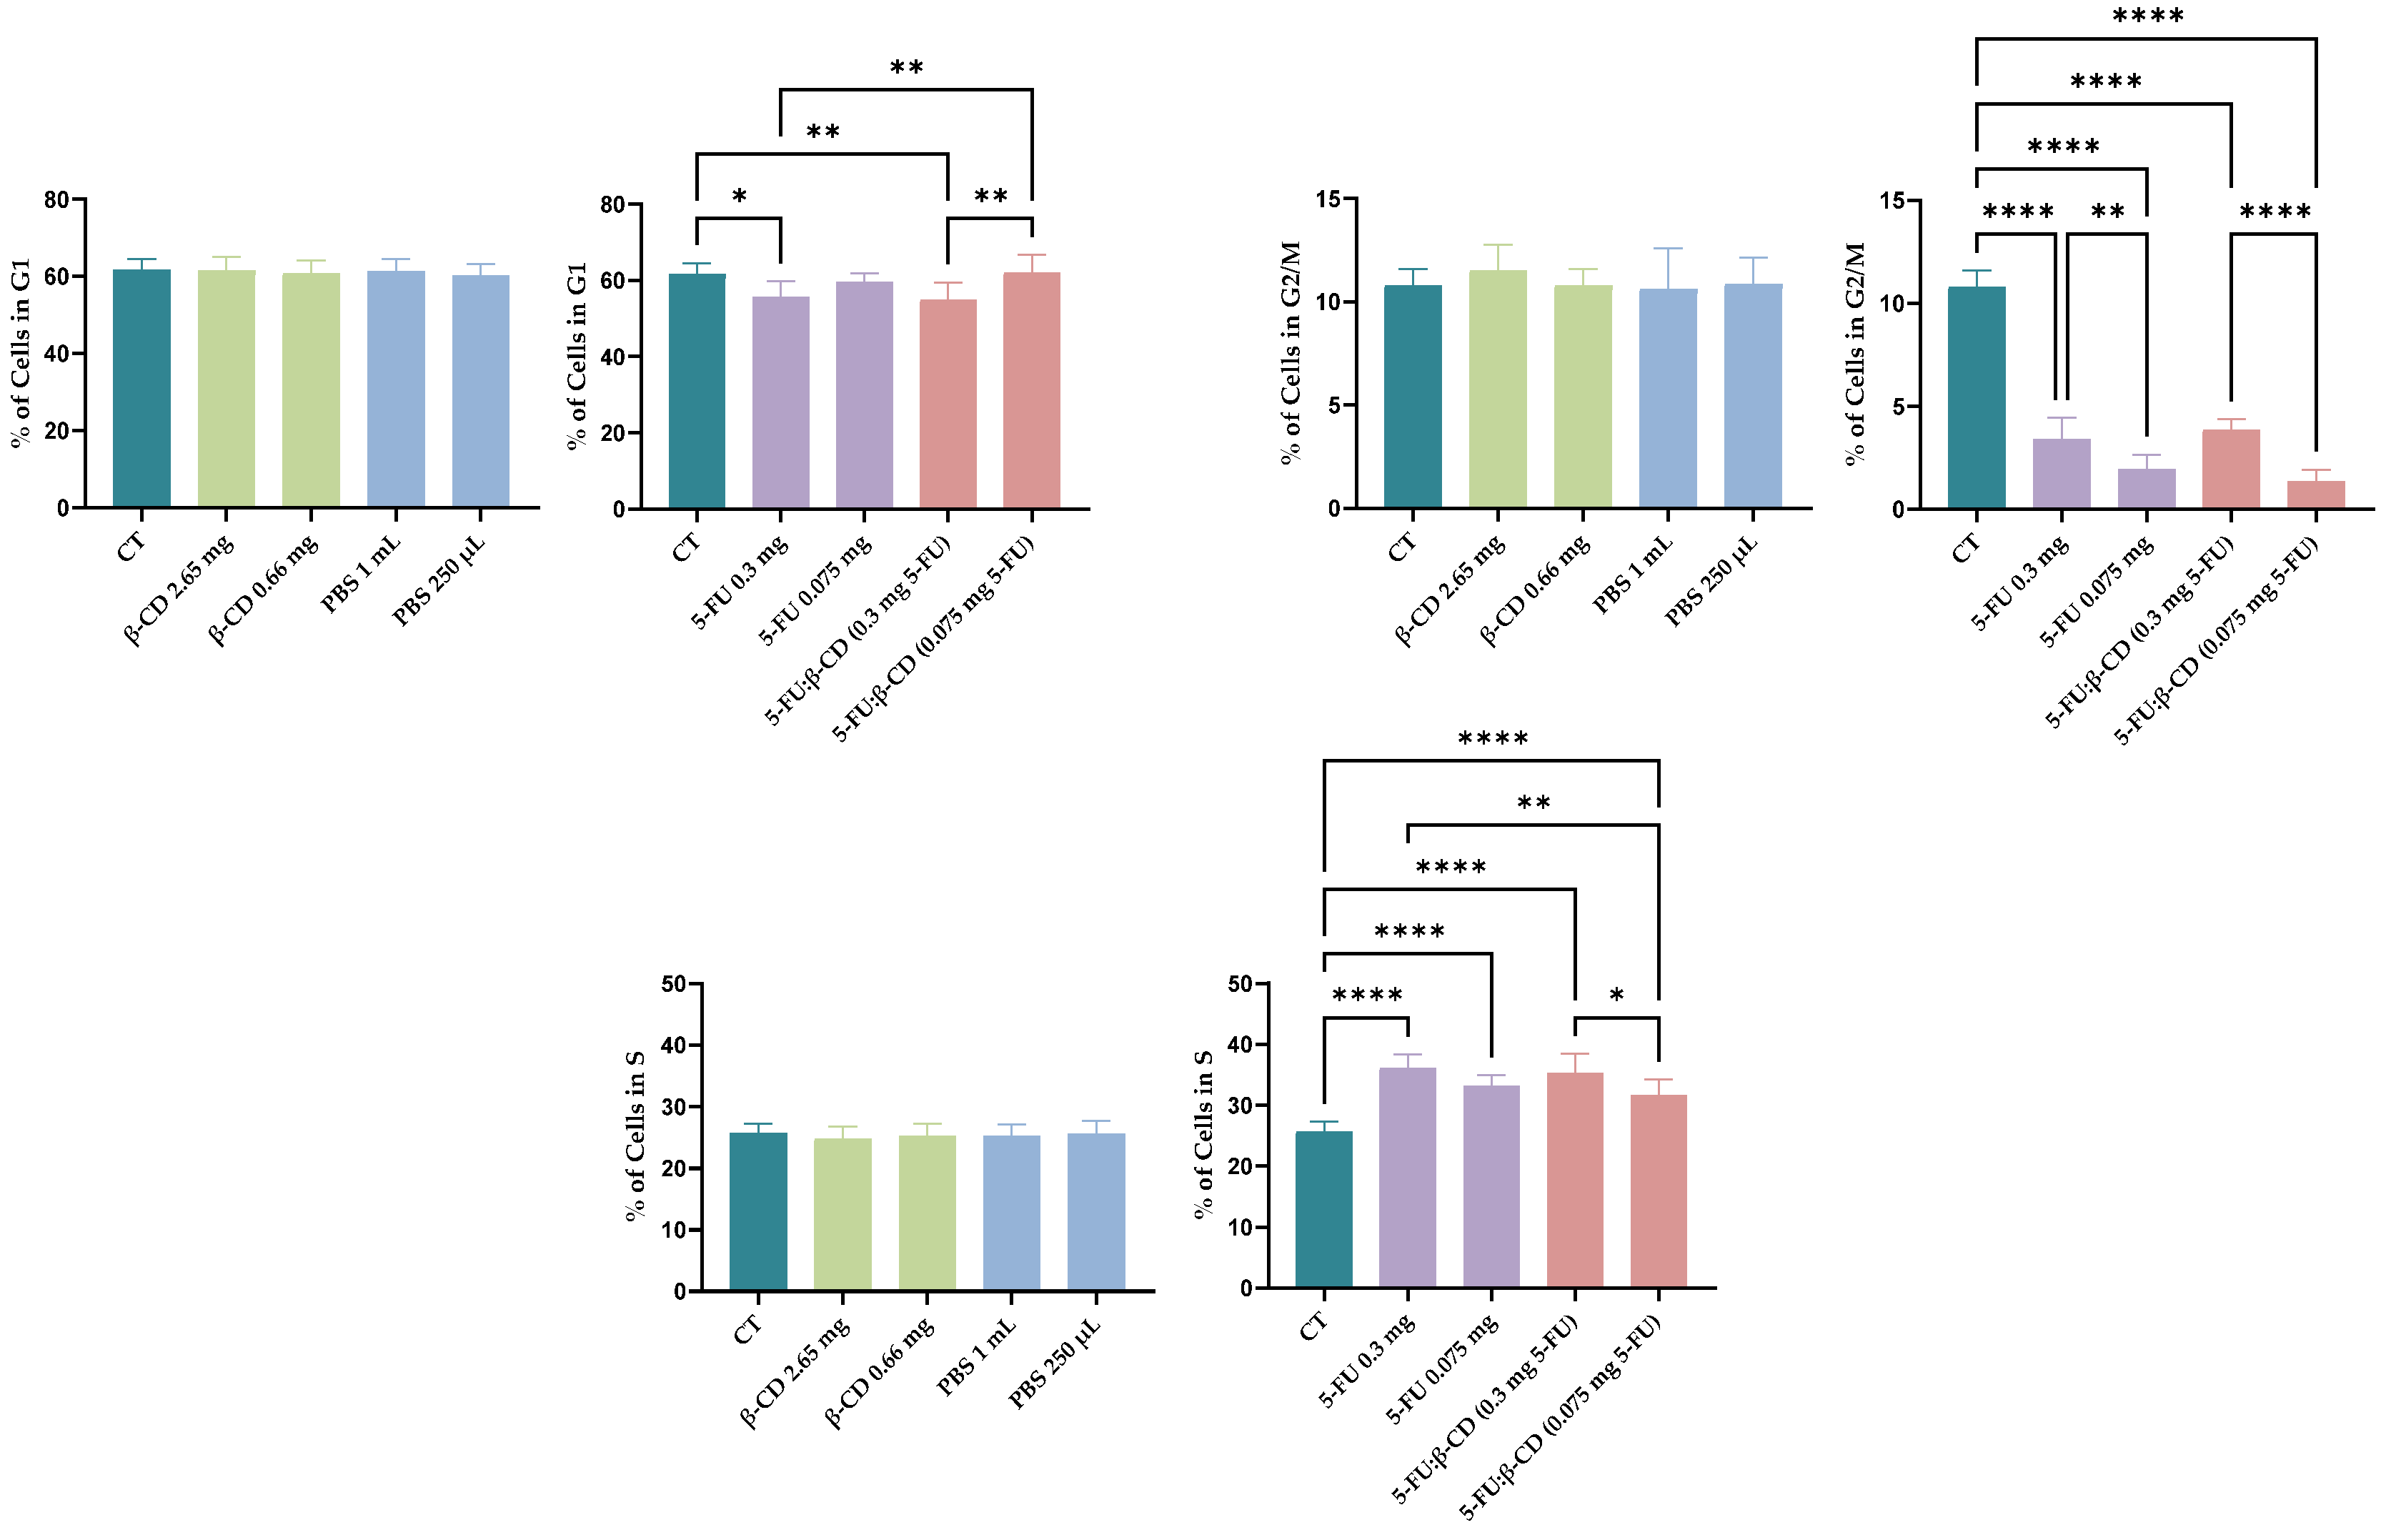

Table 1.
Block increments for an individual type B film.
| ΔA (6–1) = A₆ – A₁ | 0.0084403 |
| ΔA (12–7) = A₁₂ – A₇ | 0.015844 |
| ΔA (18–13) = A₁₈ – A₁₃ | 0.01226 |
| ΔA (24–19) = A₂₄ – A₁₉ | 0.016971 |
Table 2.
Area under the curve (AUC) and relative standard deviation (RSD) for type A and B films.
| Type of Films | AUC | RSD (%) |
|---|---|---|
| A | 0.173±0.017 | 9.6 |
| B | 4.4±1.1 | 25.5 |
| B without graphene offset | 0.83±0.14 | 16.6 |
Table 3.
Fitting characteristics of 5-FU peak for type A and B films. PP= Peak Position.
| Type of Films | PP before desorption (nm) |
Peak Width before desorption |
R2 | PP Desorbed Material (nm) | Peak Width Desorbed Material |
R2 |
|---|---|---|---|---|---|---|
| A | 268.9±0.3 | 41±2 | 0.99888 | 270.2±0.4 | 35±2 | 0.99631 |
| B | 257.7±0.7 | 17±2 | 0.99988 | 260.0±0.3 | 17±2 | 0.99988 |
Table 4.
Desorption analysis of 5-FU for type A and B films, where is the mean value of the peak height of 5-FU before desorption, is the mean value of the 5-FU peak height of desorbed material and %DM is the percentage of 5-FU desorbed material.
Table 4.
Desorption analysis of 5-FU for type A and B films, where is the mean value of the peak height of 5-FU before desorption, is the mean value of the 5-FU peak height of desorbed material and %DM is the percentage of 5-FU desorbed material.
| Type of Films | (%) | ||
| A | 0.0134±0.0040 | 0.0097±0.0040 | 71±15 |
| B | 0.0353±0.0097 | 0.0088±0.0015 | 28.9±4.7 |
Table 5.
. Chemical structures of the materials used in the preparation of the thin films. The 5-FU structure was obtained/adapted from PubChem; the PBAE structure was drawn by the authors using RDKit in Google Colab based on the cited reference; β-CD and GO− structures were reproduced from the cited references under the Creative Commons Attribution License (CC BY 4.0); and the GO+ structure was adapted from a master’s thesis with permission.
Table 5.
. Chemical structures of the materials used in the preparation of the thin films. The 5-FU structure was obtained/adapted from PubChem; the PBAE structure was drawn by the authors using RDKit in Google Colab based on the cited reference; β-CD and GO− structures were reproduced from the cited references under the Creative Commons Attribution License (CC BY 4.0); and the GO+ structure was adapted from a master’s thesis with permission.
| Molecule | Chemical Structure | Acronym |
|---|---|---|
| 5-fluorouracil [63] | 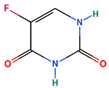 |
5-FU |
| Poly β-amino ester [49] | 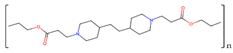 |
PBAE |
| β-cyclodextrin [64] | 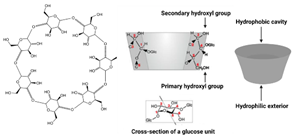 |
β-CD |
| Positively Charged Graphene Oxide [65] | 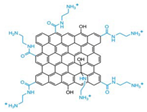 |
GO+ |
| Negatively Charged Graphene Oxide [66] | 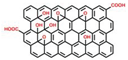 |
GO− |
Disclaimer/Publisher’s Note: The statements, opinions and data contained in all publications are solely those of the individual author(s) and contributor(s) and not of MDPI and/or the editor(s). MDPI and/or the editor(s) disclaim responsibility for any injury to people or property resulting from any ideas, methods, instructions or products referred to in the content. |
© 2026 by the authors. Licensee MDPI, Basel, Switzerland. This article is an open access article distributed under the terms and conditions of the Creative Commons Attribution (CC BY) license (http://creativecommons.org/licenses/by/4.0/).
Copyright: This open access article is published under a Creative Commons CC BY 4.0 license, which permit the free download, distribution, and reuse, provided that the author and preprint are cited in any reuse.