

Submitted:
13 August 2026
Posted:
14 August 2026
You are already at the latest version
Abstract
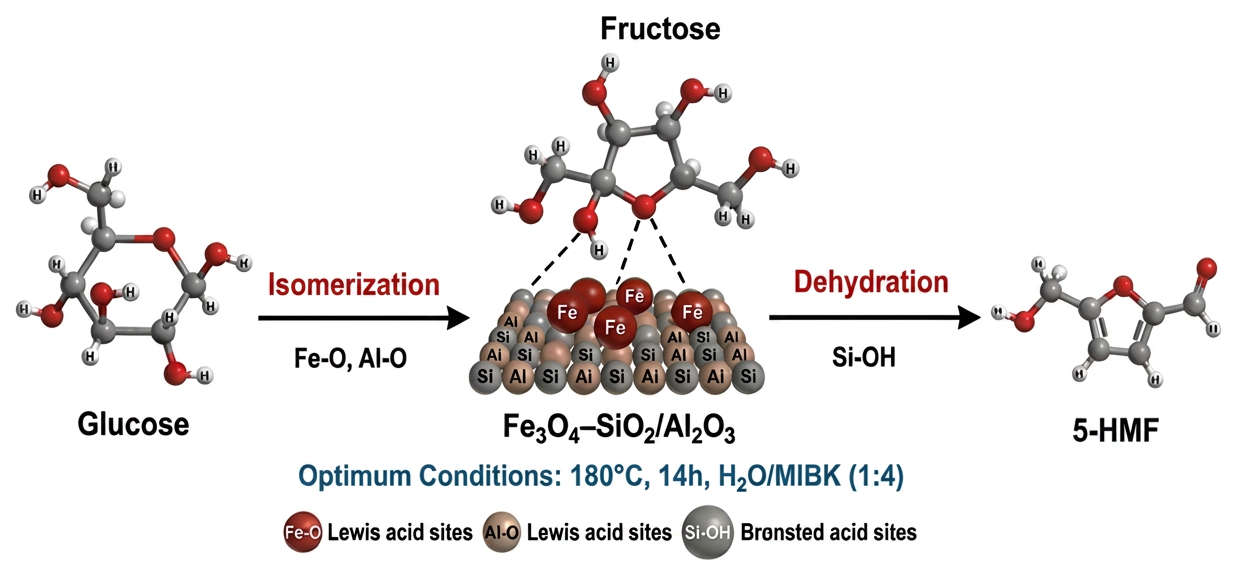
Converting glucose into 5-hydroxymethylfurfural (HMF) via catalytic methods is essential for creating renewable chemicals and biofuels. Nonetheless, the process faces challenges due to by-products. This research introduces a cost-effective iron monometallic catalyst supported on silica-alumina (Fe3O4-SiO2/Al2O3), prepared by a straightforward co-precipitation technique. Its structure and active sites were extensively characterized using FTIR, TGA, XRD, SEM-EDX, XPS, and N₂ adsorption–desorption (BET). Glucose dehydration was performed in a biphasic water/methyl isobutyl ketone (H₂O: MIBK, 1:4, v/v) system, which facilitated in situ HMF extraction and reduced humin formation. Parameters such as temperature (170-190°C), reaction time (10-14 hours), and catalyst loading (25-75 wt.%) were optimized through response surface methodology using a Box-Behnken Design (RSM–BBD). The synergistic effect among Si, Al, and Fe increased the number of Lewis and Brønsted acid sites, thereby enhancing glucose isomerization to fructose and boosting HMF selectivity. Under optimal conditions (180°C, 14 hours, 50 wt.% catalyst), a maximum HMF yield of 63.91% with 99.22% glucose conversion was obtained, along with a notable reduction in by-products. This yield is among the highest reported for monometallic catalysts under similar conditions. The catalyst was reused up to four times and could be regenerated, showing fair stability. Overall, this work offers a scalable, eco-friendly method for efficient glucose conversion, underscoring the potential of bifunctional monometallic catalysts combined with biphasic systems for sustainable HMF production.
Keywords:
glucose
; Fe3O4-SiO2/Al2O3 catalyst
; dehydration
; HMF
; Box-Behnken Design
1. Introduction
5-Hydroxymethylfurfural (HMF) has emerged as an important biomass-derived platform molecule in the transition from a fossil fuel-based chemical economy to one that relies on renewable carbon resources, driven by the depletion of fossil fuels and environmental concerns [1,2]. HMF can be produced from carbohydrates derived from lignocellulosic biomass and subsequently upgraded into a wide range of high-value chemicals, making it a key intermediate in biorefinery systems designed for both materials and energy applications [3]. HMF contains a furan ring with both aldehyde and hydroxymethyl groups, making it highly reactive and enabling it to undergo various transformations, such as esterification, oxidation, reduction, hydrogenation, and halogenation [4,5,6]. These reactions produce derivatives including 2,5-diformylfuran, 2,5-furandicarboxylic acid (FDCA), 2,5-dimethylfuran, 5-ethoxymethylfurfural, levulinic acid, and other furan compounds intermediates [7]. These compounds find applications in biofuels, plasticizers, pharmaceuticals, polyesters, and chemicals, making HMF a crucial link between renewable biomass chemistry and the petrochemical industry [6,8,9]. As a result, the U.S. Department of Energy (DOE) has listed HMF among the top 10 value-added chemicals derived from biomass, emphasizing its importance for future bio-based value chains [10,11].
HMF can be produced from C6 carbohydrates, including glucose and fructose, which are derived from lignocellulosic biomass. The typical process for converting biomass into HMF involves three main steps: hydrolyzing cellulose into glucose, isomerizing glucose into fructose, and subsequently dehydrating fructose to form HMF [6]. Among these sugars, dehydration of fructose is relatively simple and generally yields higher HMF selectivity and yield. However, fructose is relatively expensive and occurs in limited amounts in nature, which limits its industrial importance. Conversely, glucose accounts for 40-60% of lignocellulosic biomass, making it a primary component of cellulose and economically appealing. Therefore, creating effective methods for converting glucose into HMF has become a crucial goal in biomass valorization research [12]. Despite its availability, glucose conversion remains significantly more challenging than fructose dehydration due to low selectivity, a multistep reaction process, and the formation of several undesired byproducts [8].
To address these challenges, various catalytic systems and solvents have been investigated. Solvent selection plays a critical role in both selectivity and activity during HMF production, influencing reaction rates, sugar solubility, product stability, and the formation of undesired by-products [1,2,13]. Water is widely regarded as a green and sustainable solvent due to its safety, abundance, and ability to dissolve carbohydrates [9]. However, purely aqueous systems often yield low HMF selectivity due to rapid rehydration, and formation of formic acid, levulinic acid, and humin [12]. Ionic liquids (ILs) have become attractive alternative solvents because they can dissolve cellulose, offer high thermal stability, and have low volatility. Additionally, several IL systems have shown enhanced HMF production [14]. Organic solvents, including tetrahydrofuran (THF) and dimethyl sulfoxide (DMSO), can effectively suppress by-products and enhance product selectivity [15]. However, concerns about cost, environmental impact, toxicity, and separation complexity restrict their large-scale implementation [16]. As a result, biphasic solvent systems composed of water and an immiscible organic phase have been extensively employed. In these systems, HMF produced in the aqueous phase is rapidly extracted into the organic phase, minimizing its degradation in water [17]. The presence of inorganic salts further improves HMF extraction by a salting-out effect, resulting in better product selectivity [4,6]. Several organic phases such as ethyl acetate [1], n-butanol [9], THF [6], DMSO [16], acetone [18] and methyl isobutyl ketone (MIBK) have been used in previous studies. MIBK is considered one of the best solvents due to its lower miscibility with water, chemical stability, and effectiveness in phase separation [4,19].
The choice of catalyst support is equally critical for achieving high 5-HMF yields and facilitating catalyst recovery. Initial studies on sugar dehydration primarily relied on homogeneous mineral acids, including H2SO4, HCl, and H3PO4 [20]. While these acids provide strong catalytic activity, they suffer from several drawbacks such as reactor corrosion, difficulties in catalyst recovery, energy-intensive separation and environmental hazards [6]. Subsequently, metal halide catalysts such as SnCl4, CrCl3, and AlCl3 were introduced due to their enhanced catalytic efficiency and strong Lewis acidity [21]. However, these catalysts may generate corrosive acidic species, suffer from hydrolysis in aqueous media, and pose sustainability challenges, which have driven the development of more environmentally benign heterogeneous acid catalysts [22]. To address these challenges, many diverse solid acid catalysts have been developed, including heteropolyacids, supported metal catalysts, zeolites, metal phosphates, metal oxides, sulfonated resins, functionalized silica-based materials, and carbonaceous acids [23]. Many of these catalysts are designed to incorporate both Lewis and Brønsted acid sites within a bifunctional framework, which facilitates the isomerization of glucose and the dehydration of fructose. These heterogeneous catalysts offer notable benefits in ease of separation, recyclability, and process stability. Their catalytic performance mainly depends on the strength, density, and accessibility of acid sites, which influence interactions with sugar molecules and mass transfer [9,24].
Among heterogeneous catalysts, silica- and aluminosilicate-based materials (such as silicon dioxide, montmorillonite, and zeolites) have received significant attention. These materials possess high surface area, excellent thermal stability, tunable pore structures, and versatile surface chemistry, enabling easy functionalization [25]. Recent research has focused on modifying silica and aluminosilicate materials to incorporate Lewis-acidic metal centers such as Nb, Zr, Sn, Cr, and Fe, along with Brønsted-acid groups, such as sulfonic groups, on the surface [3,26]. This approach enables the creation of bifunctional catalysts capable of performing isomerization and dehydration simultaneously in a single reactor. Moreover, silica-based catalysts perform well in biphasic systems, where solvent synergy and optimized acidity enhance HMF selectivity and reduce side reactions [27]. In a recent study, Zhang et al. successfully synthesized the Sn-OH/SBA-15 catalyst under acidic conditions and achieved a 70.6% HMF yield with a 96.9% glucose conversion 180℃ [28]. Similarly, Mercedes Moreno-Recio et al. reported a 55.8% HMF yield using H-Beta zeolite in a biphasic system (water: NaCl/MIBK) at 195℃ [29]. In another approach, Bharath Velaga et al. employed an H-MOR zeolite catalyst with a high silica-to-alumina ratio, achieving 87% HMF selectivity and 76% glucose conversion [30]. Furthermore, Elsayed et al. obtained 70% HMF yield in a water/MIBK biphasic system by using a magnetic nanoparticle catalyst (Fe3O4@SiO2-SO3H) prepared by using sulfonic acid [17].
Traditional methods for evaluating parameters usually focus on one factor at a time by keeping all others constant. However, this approach has limitations, as it fails to account for the effects and interactions among variables. Response Surface Methodology (RSM) and Design of Experiments (DoE) offer a framework that optimizes complex systems [31]. RSM measures the relationship between variables and responses to improve process efficiency while reducing the number of experiments. At the same time, DoE ensures that the smaller experimental set is statistically sound and provides reliable, reproducible results [32].
This study, for the first time, reports the synthesis of a novel and cost-effective iron-modified silica–alumina catalyst, in which iron introduces Lewis acid sites to complement the inherent Brønsted acidity of silica–alumina, enabling efficient glucose dehydration to HMF in a biphasic water/MIBK system. The catalyst was characterized using FTIR, TGA, XRD, SEM–EDX, XPS, and N2 adsorption-desorption isotherm (BET). Reaction parameters such as temperature, time, and catalyst loading were optimized through an RSM-BBD study. Reusability and regeneration of the catalyst were also evaluated.
2. Materials and Methods
2.1. Materials
Silica alumina catalyst (Grade-135), D-(+)-glucose (≥99.5%), D-(-)-fructose (≥99%), 5-hydroxymethylfurfural (5-HMF) (≥99%), and methanol (99.8%) were purchased from Sigma-Aldrich. Iron (III) nitrate nonahydrate (>98%) and methyl isobutyl ketone (MIBK) (HPLC grade, 99+%) were obtained from Alfa Aesar. Nickel (II) nitrate hexahydrate (99%) and glacial acetic acid were purchased from ACROS Organics. All chemicals were used without further purification.
2.2. Synthesis of Fe3O4-SiO2/Al2O3 Catalyst
The Fe3O4-SiO2/Al2O3 catalyst was prepared by co-precipitation, as outlined in previous studies, with some modifications [33]. First, 0.6 g of silica alumina was added to a 100 mL beaker, and the beaker was filled to 50 mL with deionized water. The solution was sonicated for 30 min at 50℃ to form an emulsion. A 10 wt.% iron solution, based on the weight of silica-alumina (1:10, m/m), was prepared in a separate beaker by dissolving 0.4347 g Fe(NO3)3·9H2O in 10 mL of water. The salt mixture was added dropwise to the silica-alumina solution under continuous stirring. The solution was sonicated for 1 h at 80 ℃, then placed in an oven at 80℃ overnight. The dried mixture was transferred to a crucible and placed in a muffle furnace for calcination at 550 °C for 5 h. A monometallic catalyst was formed and stored in a closed vial for further use. The monometallic NiO-SiO2/Al2O3 and the bimetallic NiO-Fe3O4-SiO2/Al2O3 were also prepared using the same method described above, and their catalytic abilities were compared with the Fe3O4-SiO2/Al2O3 catalyst. Results shown in Table S1 indicate that Fe3O4-SiO2/Al2O3 performed better, so we used this catalyst in our study. Additionally, we compared different iron loading ratios (5, 10, and 20wt%) on a silica-alumina catalyst, and the results are presented in Table S2.
2.3. Catalyst Characterization
The functional groups of the catalyst were characterized by Fourier Transform Infrared (FTIR) spectroscopy using a PerkinElmer Spectrum Two instrument. Spectra were recorded in transmission mode using KBr pellets over the wavenumber range of 450–4000 cm−1, with a spectral resolution of 4 cm−1 and accumulation of 10 scans. The thermogravimetric analysis (TGA) was performed using an SDT Q600. The sample was heated from 25 °C to 800 °C at 5 °C/min under a nitrogen flow rate of 50 mL/min. X-ray diffraction (XRD) patterns were recorded on a RINT Ultima III diffractometer (Rigaku Corp., Japan) with Cu Kα1 radiation (λ = 1.54 Å). The instrument was operated at 40kV and 44 mA to examine the crystal structure of the synthesized catalyst. The samples were ground finely and placed in recessed glass holders to ensure a flat surface. X-ray photoelectron spectroscopy (XPS) measurements were carried out using a Kratos Axis Ultra to analyze the surface chemical composition and oxidation states of the elements (Kratos Analytical, Inc., Manchester, UK). The specific surface area, pore size distribution, and pore volume of the catalyst were obtained from N2 adsorption-desorption isotherms measured at −196 °C using a Quantachrome Autosorb iQ instrument (Quantachrome, USA). The surface area was calculated using the Brunauer–Emmett–Teller (BET) method, while the pore size distribution and pore volume were obtained using the Barrett–Joyner–Halenda (BJH) model. Prior to analysis, the samples were degassed under vacuum at 105 °C for 10 h to remove physically adsorbed species.
2.4. Dehydration of Glucose into 5-HMF
A total of 50 mg of glucose was dissolved in 10 mL of deionized water in a 100 mL stainless steel hydrothermal autoclave reactor (Huanyu). Subsequently, 40 mL of MIBK and the catalyst were added, with catalyst loadings of 25, 50, and 75wt% relative to the initial mass of glucose. The sealed autoclave was then placed in a furnace and heated to 170, 180, and 190 °C for reaction times of 10, 12, and 14 h. Upon completion, the reactor was cooled to room temperature, and the aqueous and organic phases were separated using a separating funnel. The catalyst was recovered by centrifugation at 4150 rpm. Both phases were subsequently filtered through 0.22 µm syringe filters prior to HPLC analysis, as illustrated in Scheme 1. The experimental conditions for the 17 runs conducted prior to applying the response surface methodology based on the Box–Behnken design (RSM-BBD) are summarized in Table 1. The selected temperature range was established from preliminary experiments using a silica–alumina catalyst (Table S3), while the water-to-MIBK volume ratio (1:4, v/v) was adopted based on previous studies [17,34].
2.5. HPLC Analysis
The residual glucose concentration in the reaction mixture was determined using high-performance liquid chromatography (HPLC) on an Agilent 1200 system equipped with a refractive index (RI) detector and a UV detector (λ = 278 nm). Separation was achieved using a Bio-Rad HPX-87P column maintained at 80℃, with deionized water as the mobile phase at a flow rate of 0.6 mL/min for 65 min. The concentration of HMF in both aqueous and organic phases was determined using an Agilent 1100 system equipped with an Agilent Eclipse XDB-C18 column maintained at 25℃ and a UV detector set at λ = 282 nm. Methanol-to-water (1:5, v/v) with 5wt% acetic acid were used as the mobile phase at a flow rate of 1 mL/min for 30 min. Quantification of glucose and HMF was performed by external calibration using standard solutions, with concentrations determined from the corresponding chromatographic peak areas. Representative chromatograms obtained from the Agilent 1100 and Agilent 1200 systems are shown in Figure S1 (a-c).
2.6. Determination of Glucose Conversion and HMF Yield
Conversion of glucose is calculated using Equation (1):
Yield of HMF is calculated using Equation (2):
Here, “in”, “aq”, and “org” are initial, aqueous and organic phase, respectively. [glucose] and [HMF] are the concentrations of glucose and HMF in solution. [V] is the volume of solution, and “180” and “126” are the molecular masses of glucose and HMF, respectively.
2.7. Experimental Design and Statistical Analysis
Response Surface Methodology (RSM) was applied to optimize the dehydration process. A Box–Behnken design (BBD) was adopted to systematically evaluate the effects of three independent variables: reaction temperature (T), reaction time (t), and catalyst loading (C) on the HMF yield. Each factor was examined at three coded levels (−1, 0, +1), corresponding to low, intermediate, and high values, respectively, as summarized in Table 2. The BBD approach is based on a second-order polynomial model incorporating linear, interaction, and quadratic terms, enabling efficient exploration and optimization within the experimental space. A total of 15 experimental runs were conducted, including three replicates at the center points to evaluate the pure error, as presented in Table 3. Statistical analysis and model fitting were performed using Design-Expert 13 software and optimization was achieved through analysis of variance (ANOVA) to assess the statistical significance and adequacy of the model using the coefficient of determination (R2), adjusted R2, and lack-of-fit tests. The statistical significance of individual factors and their interaction was assessed using F-values and corresponding p-values. The experimental data were fitted to a full quadratic model to establish the relationship between the response (HMF yield) and the independent variables.
2.8. Experimental Design and Statistical Analysis
After each reaction, the catalyst was easily recovered by centrifugation, thoroughly washed with 100 mL of deionized water to remove residual reactants and products, and then reused under the optimized reaction conditions. The catalytic performance was evaluated over four consecutive cycles to assess stability and reusability. Catalyst regeneration was carried out by calcination at 550℃ for 5h in a muffle furnace, followed by reuse in subsequent reaction cycles to evaluate the recovery of catalytic activity.
3. Results and Discussion
3.1. Characterization of the Catalyst
FTIR spectra of fresh and used Fe3O4-SiO2/Al2O3 monometallic catalyst are shown in Figure 1a. Both spectra exhibit a broad band around 3439 cm-1, which corresponds to the stretching vibrations of surface hydroxyl (‒OH) groups. A small peak at 1634 cm-1 represents the bending vibration of adsorbed water, consistent with the hygroscopic nature of silica-containing materials. A sharp peak at 1091 cm-1 is assigned to the asymmetric stretching vibration of the Si-O-Al, confirming the formation of silica-alumina framework of the catalyst. Additionally, the peak at 800 cm-1 indicates the symmetric stretching vibration of the Si-O-Si bond, characteristic of silica linkage [17,35]. Both the fresh and used catalysts exhibit the same spectra, with differences in peak intensity confirming that the catalyst’s structural backbone remains intact after the reaction. Minor variations in band intensity suggest deposition of reaction byproducts (e.g., humin) on the catalyst surface.
Figure 1b shows the Thermogravimetric analysis (TGA) analysis of the Fe3O4-SiO2/Al2O3 monometallic catalyst, illustrating its weight loss. It reveals an initial weight loss between 100 and 150℃, attributed to the removal of physically adsorbed water [36]. Beyond this region, the catalyst exhibits less than 4% weight loss up to 800℃, demonstrating the catalyst’s excellent thermal stability for high-temperature reactions.
Figure 1c shows the X-ray diffraction (XRD) patterns of fresh and used Fe3O4-SiO2/Al2O3 catalysts. The broad diffraction peak observed in both spectra, centered at about 2θ = 25° and extending to near 40°, indicates the predominantly amorphous nature silica-alumina structure [37]. The weak diffraction peaks observed at 2θ of 35.6° and 62.5° are indexed to the (311) and (440) lattice planes of Fe3O4, confirming the presence of magnetite nanoparticles [17]. The relatively low intensity of these peaks suggests high dispersion of Fe3O4 particles on the silica-alumina support. In the used catalyst, the overall diffraction pattern remains largely unchanged, indicating that the structural integrity is preserved during the reaction.
As shown in Figure 2a and Figure 2b, the adsorption isotherms for both fresh and used catalysts displayed typical type IV isotherms with H3-type hysteresis loops, characteristic of mesoporous materials with slit-like pores formed by aggregated particles [36]. The fresh catalyst (Figure 2a) shows a gradual increase in nitrogen uptake at low relative pressure (P/P0 < 0.3), corresponding to monolayer–multilayer adsorption, followed by a pronounced capillary condensation step at intermediate relative pressures (P/P0 ≈ 0.4–0.9), confirming the presence of well-developed mesoporosity. In contrast, the used catalyst (Figure 2b) exhibits a significantly reduced adsorption capacity across the entire relative pressure range, indicating a substantial decrease in accessible surface area and pore volume. The hysteresis loop remains present but is less pronounced, suggesting partial pore blockage and reduced pore accessibility. This reduction in textural properties is attributed to the deposition of carbonaceous byproducts (humin) during the dehydration reaction, which obstructs pore channels and limits nitrogen diffusion. Additionally, the slight shift toward larger average pore diameter observed after use suggests preferential blockage of smaller mesopores, leaving wider pores relatively accessible [38]. The fresh catalyst achieved a high surface area of 426.935 m2/g, an average pore size of 6.1400 nm, and a pore volume of 0.608 cc/g. After reaction, the surface area decreases significantly to 175.139 m2/g, accompanied by a reduction in pore volume (0.476 cm3 g−1) and an increase in average pore diameter (10.45 nm). The pore size distribution curves further confirm that both catalysts possess mesopores in the 2–50 nm range, consistent with BJH analysis. The preservation of mesoporosity after the reaction indicates that, despite partial deactivation, the catalyst’s overall pore structure remains intact.
SEM examines the morphology, particle distribution, and surface structure of a material, while EDX is employed to identify and quantify elements. Figure (3a-f) shows the SEM-EDX of the fresh Fe3O4-SiO2/Al2O3 monometallic catalyst. Figure 3a displays the morphology of a fresh catalyst surface, which appears rough, relatively clean, and porous surface, composed of quasi-spherical particles, indicative of high surface area and abundant active sites. EDX analysis (Figure 3b) confirms the presence of Si, Al, O, and Fe, verifying the successful incorporation of iron oxides into the silica-alumina matrix. Elemental mapping (Figures c-f) confirms that Si, Al, and O are evenly spread across the surface. Notably, the Fe mapping reveals a fairly uniform distribution, suggesting that iron oxide is well dispersed on the support without forming significant agglomerates. Figure 3g displays the surface morphology of the used catalyst, where particles appear partial agglomeration and some pores are blockage, probably due to deposition of reaction byproducts. A slight structural collapse is also observed, which may contribute to the reduced surface area. The corresponding EDX spectrum (Figure 3h) still confirms the presence of all constituent elements, Slight variations in elemental composition are observed, particularly a relative decrease in Fe content, which may indicate minor leaching or surface coverage of active sites. Nevertheless, elemental mapping (Figure 3i-l) indicates that Fe remains relatively well dispersed after use.
XPS was employed to investigate the surface composition and oxidation states of a catalyst (Figure 4). The survey spectrum (Figure 4a) confirms the presence of Fe, O, Si, and Al, with characteristic binding energies at 710.86 eV, 532.29 eV, 104.11 eV, and 74.76 eV for Fe 2p, O 1s, Si 2p, and Al 2p, respectively, indicating successful incorporation of iron oxide into the silica–alumina matrix without detectable impurities. The high-resolution Fe 2p spectrum (Figure 4b) exhibits characteristic features of mixed-valence iron oxide. The deconvoluted peaks at 711.1 eV (Fe 2p3/2) and 724.4 eV (Fe 2p1/2), along with the satellite peak at 719.7 eV, confirm the coexistence of Fe2+ and Fe3+ species, which is a hallmark of Fe3O4 [39]. The presence of these mixed oxidation states is critical, as it enhances redox flexibility and may contribute to catalytic activity. The Si 2p spectrum shows a dominant peak at 103.56 eV, which can be attributed to Si4+ in SiO2, confirming that silicon is predominantly present in an oxidized silica framework, as depicted in Figure 4c. Similarly, the Al 2p region in Figure 4d displays a peak at 73.98 eV, characteristic of Al3+ in the aluminosilicate structure, indicating the preservation of the support framework [40]. The O1s spectrum (Figure 4e) can be deconvoluted into three distinct components: (i) lattice oxygen associated with metal oxides (Fe–O) at 530.0 eV, (ii) bridging oxygen in Si–O–Si and Si–O–Al linkages at 532.5 eV, and (iii) surface hydroxyl groups (Si–OH/Al–OH) at 533.9 eV. The presence of these hydroxyl groups suggests the availability of Brønsted acid sites, while metal–oxygen bonds may contribute to Lewis acidity. Overall, the XPS results confirm that the catalyst surface comprises well-dispersed Fe3O4 species embedded within a stable silica–alumina framework, with both acidic and redox-active sites. This combination is expected to facilitate glucose dehydration by promoting protonation, stabilizing intermediates, and suppressing side reactions.
3.2. Statistical Analysis and Model Adequacy
Table 3 summarizes the experimental and model-predicted HMF yields for the 15 runs of the Box-Behnken design, together with the corresponding residuals. Across all factor combinations, the predicted values are in close agreement with the actual experimental values, with residuals generally within ±2, indicating that the quadratic model describes the response very well across the entire design space. A high HMF yield of 60.13% was obtained at 180℃, 14h, and 50 wt% catalyst loading (run 10), with a small residual of 1.42, demonstrating the reliability of the model under optimal conditions. In contrast, significantly lower yields were observed under milder conditions, such as low temperature and catalyst loading (run 9) or short reaction time at low temperature (run 13), highlighting the sensitivity of the system to operating parameters. The absence of any systematic trend in the residuals with respect to run order or factor levels suggests no obvious outliers or unexplained curvature beyond the fitted model, supporting the statistical adequacy of the RSM model for predicting HMF yield under the conditions studied. The graphs of predicted vs. actual yield and the normal plot of residuals are shown in Figure S2.
3.3. ANOVA Table for the Quadratic Model
The ANOVA results in Table 4 indicate that the overall quadratic model is highly significant, with a model p-value of 0.001 and an F-value of 27.68, confirming that the model effectively captures the variability in HMF yield. Within linear terms, Temperature (A) is highly significant with p-value 0.0002 and very high F-value 92.06. This indicates that temperature strongly governs the dehydration kinetics and HMF selectivity. Whereas reaction time (B) shows a weaker but noticeable effect (p-value = 0.0584), while catalyst loading (C) is also significant with p-value 0.0138, demonstrating that the availability of active acid sites contributes meaningfully to HMF formation. Regarding the interaction effects, the AB term is statistically significant (p-value 0.0342), indicating that the effect of temperature on HMF yield depends on reaction time and vice versa. In contrast, AC and BC are not significant, suggesting limited synergistic effects between catalyst loading and the other variables. The quadratic terms A2, B2, and C2 are all highly significant (p-value ≤ 0.0112), supporting the strong curvature observed in the response surface and justifying the use of a second-order polynomial model to capture the presence of an optimum region. The model exhibits a high coefficient of determination (R2 = 0.9803), indicating that 98.03% of the variance in HMF yield is explained by the selected variables. The adjusted R2 (0.9449) indicates that the model explains most of the experimental variance with only limited overfitting, while predicted R2 (0.7657) remains reasonably close to adjusted R2, suggesting good predictive ability for new experimental points. Furthermore, the lack-of-fit test is not significant (p-value = 0.4112), confirming that the quadratic model is adequate and no higher-order cubic terms are needed to describe the data within the experimental domain. In Table 5, the sequential model sum of squares and p-values further support this conclusion. The quadratic model is highly significant (p-value 0.0006) and markedly improves fit compared with the linear and 2FI models, whereas the cubic model is aliased and not statistically justified. The effect of all factors on HMF yield is depicted in Figure S3.
Equations 3 and 4, in terms of coded and actual factors, respectively, are used to predict the response for the given levels of each factor.
3.4. Regression Coefficient and Factor Effects
Table 6 shows that temperature has a strong positive regression coefficient, indicating that increasing temperature from low to mid-levels strongly promotes HMF formation, consistent with the endothermic nature of the dehydration step. In contrast, the negative quadratic coefficient (A2) indicates that excessive temperature eventually reduces HMF yield, consistent with the observed decline at the extreme high-temperature region of the response surface due to HMF decomposition and humin formation. Reaction time shows a moderate positive linear coefficient, suggesting that longer residence time initially enhances HMF formation, whereas its negative quadratic term (B2) again indicates an optimum beyond which prolonged heating causes side reactions and product loss. Catalyst loading shows a negative linear coefficient under the coded conditions, implying that increasing the catalyst amount beyond a certain level may favor side reactions (e.g., formation of levulinic acid, formic acid, and humin) rather than selectively promoting HMF generation. This trend is reinforced by the significant negative quadratic term C2. The negative coefficient of the AB interaction term indicates that the beneficial effect of increasing temperature is more pronounced at shorter reaction times, while at longer times, the same temperature rise becomes less favorable or even detrimental to HMF yield. The relatively narrow 95% confidence intervals of the significant coefficients indicate good precision in estimating the model parameters. Finally, all variance inflation factors (VIFs) are close to 1, confirming the absence of multicollinearity among the coded variables and supporting the statistical robustness of the fitted response surface model. Diagnostic plots, including Box-Cox transformation, perturbation, and cube plots, are shown in Figure S4 and Figure S5, respectively, further validating the statistical reliability and predictive capability of the developed model.
3.5. 3D Surface and Contour Plots
The three-dimensional (3D) response surfaces and corresponding contour plots (Figure 5) demonstrate in the combined effects of temperature (A), reaction time (B), and catalyst loading (C) on HMF yield within the Box-Behnken design domain. At a fixed catalyst loading of 50wt% (Figure 5a), the temperature-time surface displays a distinct dome-shaped profile. As temperature and reaction time increase from their lower levels, HMF yield steadily rises until reaching a clear optimum in the mid-to-high range of both variables. Beyond this optimum point, further increases lead to a decline in predicted yield, indicating HMF degradation and side reactions occurring under excessively harsh conditions. Yang Liu et al. reported that glucose conversion steadily increased over time when using a catalyst of nano-Al2O3 and HCl, ultimately achieving full glucose conversion. The HMF yield initially rose, peaking at 69.1% at 180 °C after 30 min, then decreased as the reaction continued up to 90 min [34]. Xiangbo et al. also observed a significant dependence on temperature and time; at lower temperatures (140-150 °C), the HMF yield gradually increased with reaction time, whereas at 170 °C, the yield peaked within 1h and then decreased with longer reaction times [41]. Arumugam Ramesh and colleagues investigated H-SO42-/Ti-Al2O3 catalyst with a 200 mg loading, achieving a 65% HMF selectivity. Their results demonstrated that HMF selectivity increased with increasing reaction time from 1 to 4h, but declined after 4h due to increased oligomer and humin formation. Temperature screening from 130 °C to 190 °C identified 170 °C as the optimal temperature for HMF selectivity, whereas further increasing the temperature to 190 °C led to lower HMF yield and more side reactions [42]. In another study, Wenze Guo et al. reported comparable temperature-dependent behavior, noting that P-3Ti/SBA-15 catalyst achieved a maximum HMF yield of 71% at 160℃ in 150 min, which declined to 55.4% at 180℃ due to the degradation of glucose and HMF into humin and formic acid [43]. The corresponding contour plot (Figure 5b) shows closed, elliptical contours confirming a strong quadratic relationship and a significant interaction between temperature and time, as equal-yield lines bend toward an optimum ridge rather than remaining parallel.
Figure 5c shows the interaction between temperature and catalyst loading at a constant reaction time of 12h. A similar trend is observed, with moderate increases in temperature and catalyst loading enhancing HMF yield up to an optimum, followed by a decline at higher catalyst loadings and temperatures. This trend suggests that excessive acidity promotes undesired side reactions, leading to the formation of levulinic acid, formic acid, and humin, as shown in Figure S6. Thawanrat Kobkeatthawin and colleagues enhanced commercial HZSM-5 through nitric acid treatment to boost Brønsted acidity, then incorporated iron modification to add Lewis acidity sites. The optimized Fe-modified zeolite achieved a 67.5% HMF yield at 170℃. When varying Fe loading from 0.1 to 0.5 wt% on dealuminated HZSM-5, they observed that 0.25 wt% Fe loading produced a 61.1% HMF yield with 86.3% glucose conversion. Higher Fe loadings decreased both HMF yield and glucose conversion due to excessive Fe2O3 coverage, thereby reducing the number of accessible acid sites. HMF yield increased with rising temperature up to 170℃, reaching 50.3%, while at a temperature of 190℃, humin formation became dominant, leading to 60% humin yield [39]. Yang Liu et al. emphasized that an appropriate balance between Lewis acidic Al2O3 and Brønsted acidic HCl was essential. Using Al2O3 alone yielded only 20.8% HMF with 79.4% glucose conversion, whereas adding 0.06% HCl significantly increased the yield to 69.1%. Further increasing of HCl concentration to 0.4% reduced the HMF yield, indicating that excessive Brønsted acidity promotes side reactions and HMF degradation [34]. The contours in this plot (Figure 5d) again form closed ovals, indicating curvature and a nonlinear dependence on both factors, with a relatively narrow high-yield region along the catalyst-loading axis, suggesting that HMF formation is particularly sensitive to overdosing than to moderate shifts in temperature.
Figure 5e illustrates the interaction between reaction time and catalyst loading at a fixed temperature of 180℃. Compared to the temperature-dependent surfaces, HMF yield is less sensitive to variations in reaction time near the center point, while changes in catalyst loading produce more pronounced effects on HMF yield. Nevertheless, at prolonged reaction times and high catalyst loadings, a clear decrease in yield is observed, again indicating the dominance of HMF secondary degradation pathways. The contour plot (Figure 5f) shows broad, concentric regions with the highest yields occurring at intermediate reaction times and catalyst levels, further confirming that optimal performance requires a careful balance between sufficient residence time and controlled catalyst dosage to maximize dehydration while minimizing subsequent decomposition and polymerization pathways. Jingjing Wang et al. reported that increasing the catalyst-to-glucose ratio in a 20wt% SnO2/MCM system enhanced HMF yield from 55.3% (1:8) to an optimum at 1:2, beyond which further increases led to a decline due to the promotion of secondary reactions [44]. Similarly, Xiangbo et al. demonstrated that Sn loading in SAPO-34 catalysts strongly influences product distribution: a 5 wt% Sn loading yielded 51.7% HMF, while increasing the loading to 10 wt% and 15 wt% reduced the yield to 41.7% and 34.8%, respectively, accompanied by increased levulinic acid formation. These findings highlight the critical role of acid-site balance, where Lewis acidity facilitates glucose isomerization to fructose, and Brønsted acidity promotes subsequent dehydration to HMF [41]. Excessive acidity, however, accelerates side reactions such as rehydration and polymerization, leading to byproduct formation. Overall, the trends observed in the present study are in strong agreement with previous reports, confirming that optimal HMF production requires a careful balance between reaction conditions and catalyst properties.
Collectively, the three sets of contour and 3D surface plots reveal a well-defined optimum region within the experimental domain where the maximum HMF yield of 60.13% is achieved at approximately 180-185℃, 11-12h, and 50wt% catalyst loading. These results indicate that moderately high temperature combined with intermediate reaction times and controlled catalyst loading favor HMF formation while limiting its subsequent degradation. The graphical analysis is fully consistent with the statistical model and ANOVA results, providing a clear visualization of the optimization window for maximizing HMF yield.
3.6. Mechanism of Glucose Dehydration to HMF
A plausible reaction mechanism for the conversion of glucose to HMF over the Fe3O4-SiO2/Al2O3 catalyst is illustrated in Figure 6. This process is well known to involve two key steps: (i) isomerization of glucose to fructose, and (ii) dehydration of fructose to HMF. The isomerization step is generally considered rate-limiting and is catalyzed by Lewis acid sites, whereas the dehydration step is promoted by Brønsted acidity. In the present catalytic system, silica-alumina support supplies Brønsted acid sites, while Fe3O4 offers Lewis acid sites. The Brønsted acidity of silica-alumina arises from Si-OH-Al bridging hydroxyl groups, also known as protonated silanol-aluminum sites [45]. These groups are highly polarized because the electron density is drawn toward the Al3+ center, weakening the O-H bond and promoting proton release. The reaction is initiated by protonation of cyclic glucose, followed by ring opening to form the corresponding linear intermediate under Brønsted acid catalysis. Subsequently, Lewis acidic Fe centers coordinate with the oxygen atoms of the open-chain glucose, enabling a 1,2-hydride shift that converts glucose to fructose. In biphasic aqueous–organic systems, this pathway predominantly proceeds via an acyclic mechanism, which stabilizes intermediates and promotes efficient extraction of HMF into the organic phase, thereby suppressing undesired side reactions [10]. In the final step, fructose undergoes sequential protonation and elimination of three water molecules over Brønsted acid sites to form HMF. The cooperative interaction between Lewis and Brønsted acid sites is therefore essential, as it facilitates both isomerization and dehydration steps while enhancing selectivity toward HMF. This synergistic effect is consistent with the observed catalytic performance and aligns with literature reports on bifunctional acid catalysts.
3.7. Catalyst Reusability
The reusability of the Fe3O4-SiO2/Al2O3 catalyst was evaluated over four consecutive reaction cycles under the optimized conditions (180 °C, 14 h, and 50 wt% catalyst loading). As shown in Figure 7, the catalyst’s reactivity slightly decreased, with glucose conversion decreasing from 100% to 93.5% and HMF yield from 63.9% to 49.5% after four cycles. This deactivation is primarily attributed to the deposition of carbonaceous byproducts (humin and oligomers) on the catalyst surface and within its pore structure, leading to partial blockage of active sites and reduced accessibility. These findings are consistent with the BET and SEM analyses, which revealed a decrease in surface area and evidence of pore obstruction after use [46,47]. Cycle 5 shows regenerated catalyst results that indicate conversion increased to 95.93% and HMF yield increased to 51.29%. After each cycle, the catalyst was recovered by centrifugation, thoroughly washed with deionized water, and dried prior to reuse. Although a moderate loss of activity is observed, the catalyst retains a significant portion of its performance, demonstrating reasonable stability under the reaction conditions used.
4. Conclusions
A novel Fe3O4-SiO2/Al2O3 monometallic catalyst was successfully synthesized via a simple, cost-effective co-precipitation method for the efficient conversion of glucose into HMF. The catalyst exhibits bifunctional acidity, combining Lewis acid sites (Fe3O4, Al2O3) with Brønsted acid sites originating from the silica–alumina framework. The optimized balance between these acid functionalities, achieved through iron incorporation, plays a crucial role in enhancing catalytic performance. A plausible reaction mechanism was proposed, involving Lewis acid-catalyzed isomerization of glucose to fructose, followed by Brønsted acid-driven dehydration to HMF. The use of a biphasic water/methyl isobutyl ketone (MIBK) system (1:4, v/v) facilitated in situ extraction of HMF into the organic phase, thereby suppressing side reactions and improving selectivity. Reaction parameters, including temperature, time, and catalyst loading, were systematically optimized using RSM-BBD study. The maximum HMF yield of 63.91% with 99.22% glucose conversion was achieved under optimal conditions (180℃, 14h, 50wt% catalyst loading). Complete glucose conversion was obtained at 190℃ under all tested conditions, although with reduced selectivity due to side reactions. Statistical analysis confirmed that temperature is the most influential factor governing HMF yield, followed by catalyst loading and time. The developed quadratic model showed excellent agreement with experimental data (R2 = 0.9803). Comprehensive characterization techniques of the catalyst confirmed the successful formation of a thermally stable, mesoporous catalyst with a high specific surface area (426.9 m2 g−1) and well-dispersed Fe3O4 species. Reusability studies demonstrated that the catalyst retains reasonable activity over multiple cycles, with only a moderate decrease in HMF yield attributed to pore blockage and active site coverage by humin and other carbonaceous byproducts. Overall, this study presents an economically viable and environmentally benign approach for converting abundant glucose into HMF using a robust bifunctional catalyst system. The insights gained into the role of acid-site balance and reaction optimization provide valuable guidance for the rational design of advanced catalysts for biomass valorization.
Supplementary Materials
The following supporting information can be downloaded at the website of this paper posted on Preprints.org: Table S1: Glucose conversion and HMF yield over three different catalysts, Table S2: Glucose conversion and HMF yield over different Iron (Fe) loading on silica alumina support (SiO2/Al2O3), Table S3: Glucose conversion and HMF yield at different temperature ranges using silica alumina catalyst (SiO2/Al2O3), Figure S1: HPLC chromatograms of (a) organic phase (Agilent 1100), (b) aqueous phase (Agilent 1200), and (c) aqueous phase (Agilent 1100), Figure S2: Graphs of predicted vs actual HMF yield and normal plot of residuals, Figure S3: Effect of all variables on HMF yield, Figure S4: Graphs of Box-Cox plot for power transforms and perturbation, Figure S5: Cube plot of HMF yield, Figure S6: Degradation side-reactions within HMF dehydration reaction.
Author Contributions
M.H.M.: methodology, investigation, data curation, writing—original draft preparation. I.E.: Methodology, writing—review and editing. E.M.E.: writing—review and editing. E.H.: Methodology, writing—review and editing, supervision, project administration, funding acquisition. All authors have read and agreed to the published version of the manuscript.
Funding
This work is supported by the U.S. Department of Agriculture - National Institute of Food and Agriculture (USDA-NIFA), project award no. 2024- 67021- 42038. “Any opinions, findings, conclusions, or recommendations expressed in this publication are those of the author(s) and should not be construed to represent any official USDA or U.S. Government determination or policy”.
Data Availability Statement
All data obtained during this work are included in this manuscript and supplementary information.
Acknowledgments
This manuscript is publication #SB1190 of the Sustainable Bioproducts, Mississippi State University. This publication is also a contribution of the Forest and Wildlife Research Center, Mississippi State.
Conflicts of Interest
The authors declare no conflicts of interest.
Abbreviations
The following abbreviations are used in this manuscript
| 3D | Three-dimensional |
| 5-HMF | 5-hydroxymethylfurfural |
| ANOVA | Analysis of Variance |
| BBD | Box-Behnken Design |
| BET | Brunauer–Emmett–Teller |
| BJH | Barrett–Joyner–Halenda |
| DOE | Department of Energy |
| DoE | Design of Experiments |
| EDX | Energy-dispersive X-ray Spectroscopy |
| FDCA | 2,5-furandicarboxylic acid |
| FTIR | Fourier Transform Infrared Spectroscopy |
| MIBK | Methyl isobutyl ketone |
| RSM | Response Surface Methodology |
| SEM | Scanning Electron Microscopy |
| TGA | Thermogravimetric Analysis |
| THF | Tetrahydro furan |
| XPS | X-ray Photoelectron Spectroscopy |
| XRD | X-ray diffraction |
References
- Askar, Z.; Akhmetzhanova, Z.; Rakhatkyzy, M.; Shah, D.; Nuraje, N. Mechanistic insights into glucose-to-5-HMF conversion in DES media. J. Mol. Liq. 2025, 430, 127774. [Google Scholar] [CrossRef]
- Modak, A.; Mankar, A.R.; Sonde, R.; Pant, K.K. One-pot conversion of glucose to 5-hydroxymethylfurfural under aqueous conditions using acid/base bifunctional mesoporous silica catalyst. Renew. Energy 2023, 212, 97–110. [Google Scholar] [CrossRef]
- Reddy, K.H.P.; Lee, J.; Park, Y.-K. Hydroxymethylfurfural production from cellulosic sugars over supported metal and metal oxide catalysts. Ind. Crops Prod. 2024, 222, 119754. [Google Scholar] [CrossRef]
- Wang, S.; Zhang, M.; Guo, D.; Feng, J.; Pan, H. Construction of Lewis-Brønsted bifunctional carbonaceous acidic catalyst for efficient transformation of glucose into 5-HMF. Fuel 2024, 363, 130991. [Google Scholar] [CrossRef]
- Wang, S.; Eberhardt, T.L.; Guo, D.; Feng, J.; Pan, H. Efficient conversion of glucose into 5-HMF catalyzed by lignin-derived mesoporous carbon solid acid in a biphasic system. Renew. Energy 2022, 190, 1–10. [Google Scholar] [CrossRef]
- Wang, W.; Wei, C.; Wang, H.; He, Z.-H.; Li, L.; Ma, Y.; Guo, N.; Liu, Z.-T. Boosting transformation of glucose and fructose to 5-hydroxymethylfurfural by a strategy of dual catalyst in biphasic solvent system with salt. Ind. Crops Prod. 2024, 216, 118702. [Google Scholar] [CrossRef]
- Gaafar, M.M.; Hamza, M.; Manzoor, M.H.; Elsayed, I.; Hassan, E.b. Sustainable Methods for Conversion of Cellulosic Biomass to Bio-Based Plastics: A Green Chemistry Approach. Sustain. Chem. 2026, 7, 20. [Google Scholar] [CrossRef]
- Keum, Y.; Jeong, H.; Kim, T.Y.; Han, J.W.; Kim, Y.J.; Baek, J. Chloride-free indium (III)-catalyzed glucose-to-HMF conversion: Overcoming kinetic barriers via water-mediated direct dehydration. Appl. Catal. B Environ. Energy 2025, 378, 125561. [Google Scholar] [CrossRef]
- Eblagon, K.M.; Malaika, A.; Ptaszyńska, K.; Pereira, M.F.R.; Kozłowski, M.; Figueiredo, J.L. Niobium oxide-phosphorylated carbon xerogel composites as solid acid catalysts for cascade conversion of glucose to 5-hydroxymethylfurfural (HMF) in pure water. Catal. Today 2023, 418, 114070. [Google Scholar] [CrossRef]
- Kim, Y.; Mittal, A.; Robichaud, D.J.; Pilath, H.M.; Etz, B.D.; St. John, P.C.; Johnson, D.K.; Kim, S. Prediction of hydroxymethylfurfural yield in glucose conversion through investigation of Lewis acid and organic solvent effects. ACS Catal. 2020, 10, 14707–14721. [Google Scholar] [CrossRef]
- Tomer, R.; Biswas, P. Reaction kinetics study and the estimation of thermodynamic parameters for the conversion of glucose to 5-hydroxymethylfurfural (5-HMF) in a dimethyl sulfoxide (DMSO) medium in the presence of a mesoporous TiO2 catalyst. J. Taiwan Inst. Chem. Eng. 2022, 136, 104427. [Google Scholar] [CrossRef]
- Liu, Z.-Q.; Guo, J.-L.; Liang, R.-H.; Wang, F.-X.; Li, Z.-K.; Liu, Y.; Ying, A. Two birds with one stone: A magneto-optical dual-stimuli-responsive intelligent Pickering emulsion for efficient conversion of glucose to 5-hydroxymethylfurfural. Chem. Eng. J. 2024, 479, 147757. [Google Scholar] [CrossRef]
- You, L.; Liu, T.; Liu, D.; Zhao, X. Efficient conversion of glucose to 5-hydroxymethylfurfural by synergetic catalysis of enzymes and chemical catalysts towards potential large-scale continuous operation. Chem. Eng. J. 2023, 459, 141552. [Google Scholar] [CrossRef]
- Naseem, A.; Rasul, I.; Raza, Z.A.; Muneer, F.; ur Rehman, A.; Nadeem, H. Bacterial production of polyhydroxyalkanoates (PHAs) using various waste carbon sources. PeerJ 2024, 12, e17936. [Google Scholar] [CrossRef] [PubMed]
- Blunt, W.; Shah, P.; Vasquez, V.; Ye, M.; Doyle, C.; Liu, Y.; Saeidlou, S.; Monteil-Rivera, F. Biosynthesis and properties of polyhydroxyalkanoates synthesized from mixed C5 and C6 sugars obtained from hardwood hydrolysis. New Biotechnol. 2023, 77, 40–49. [Google Scholar] [CrossRef] [PubMed]
- Chang, K.-L.; Muega, S.C.; Ofrasio, B.I.G.; Chen, W.-H.; Barte, E.G.; Abarca, R.R.M.; de Luna, M.D.G. Synthesis of 5-hydroxymethylfurfural from glucose, fructose, cellulose and agricultural wastes over sulfur-doped peanut shell catalysts in ionic liquid. Chemosphere 2022, 291, 132829. [Google Scholar] [CrossRef] [PubMed]
- Elsayed, I.; Mashaly, M.; Eltaweel, F.; Jackson, M.A.; Hassan, E.B. Dehydration of glucose to 5-hydroxymethylfurfural by a core-shell Fe3O4@ SiO2-SO3H magnetic nanoparticle catalyst. Fuel 2018, 221, 407–416. [Google Scholar] [CrossRef]
- Sanpitakseree, C.; Motagamwala, A.H.; Dumesic, J.A.; Neurock, M. Solvent and chloride ion effects on the acid-catalyzed conversion of glucose to 5-hydroxymethylfurfural. ACS Sustain. Chem. Eng. 2022, 10, 8275–8288. [Google Scholar] [CrossRef]
- Gao, D.-M.; Huang, K.; Zheng, J.; Fujino, H.; Zhang, W.; Liu, H. Hierarchically porous tantalum oxide as a high-performance catalyst for efficient conversion of glucose to HMF. New J. Chem. 2025, 49, 19018–19028. [Google Scholar] [CrossRef]
- Jayalath, S.U.; Alwis, A.P.d. PHA, the greenest plastic so far: advancing microbial synthesis, recovery, and sustainable applications for circularity. ACS Omega 2025, 10, 32564–32586. [Google Scholar] [CrossRef] [PubMed]
- Van Thuoc, D.; Chung, N.T.; Hatti-Kaul, R. Polyhydroxyalkanoate production from rice straw hydrolysate obtained by alkaline pretreatment and enzymatic hydrolysis using Bacillus strains isolated from decomposing straw. Bioresour. Bioprocess. 2021, 8, 98. [Google Scholar] [CrossRef] [PubMed]
- Yao, Y.; Chen, S.; Zhang, M. Sustainable Approaches to Selective Conversion of Cellulose Into 5-Hydroxymethylfurfural Promoted by Heterogeneous Acid Catalysts: A Review. Front. Chem. 2022, Volume 10 - 2022. [Google Scholar] [CrossRef] [PubMed]
- Sawant, S.S.; Salunke, B.K.; Kim, B.S. Degradation of corn stover by fungal cellulase cocktail for production of polyhydroxyalkanoates by moderate halophile Paracoccus sp. LL1. Bioresour. Technol. 2015, 194, 247–255. [Google Scholar] [CrossRef] [PubMed]
- Niakan, M.; Masteri-Farahani, M.; Seidi, F. Efficient glucose-to-HMF conversion in deep eutectic solvents over sulfonated dendrimer modified activated carbon. Renew. Energy 2022, 200, 1134–1140. [Google Scholar] [CrossRef]
- Zhang, T.; Wei, H.; Jin, Y.; Xiao, H. Dehydration of glucose to 5-hydroxymethylfurfural over sn-containing dendritic mesoporous silica. Chem. Eng. J. 2023, 454, 140415. [Google Scholar] [CrossRef]
- Davis, R.; Kataria, R.; Cerrone, F.; Woods, T.; Kenny, S.; O’donovan, A.; Guzik, M.; Shaikh, H.; Duane, G.; Gupta, V.K. Conversion of grass biomass into fermentable sugars and its utilization for medium chain length polyhydroxyalkanoate (mcl-PHA) production by Pseudomonas strains. Bioresour. Technol. 2013, 150, 202–209. [Google Scholar] [CrossRef] [PubMed]
- Baruah, J.; Medhi, U.; Nath, B.K.; Deka, R.C.; Kalita, E. Enhancements in the production of 5-HMF from glucose: A review on recent advances in heterogeneous catalysts and solvent effects. Next Energy 2025, 9, 100420. [Google Scholar] [CrossRef]
- Yu, M.; Zhang, X.-F.; Bai, Y.; Shu, L.; Yao, J. Sn-modified SBA-15 with tailored acid properties for efficient 5-hydroxymethylfurfural production from glucose. Biomass Bioenergy 2024, 184, 107202. [Google Scholar] [CrossRef]
- Moreno-Recio, M.; Jiménez-Morales, I.; Arias, P.L.; Santamaría-González, J.; Maireles-Torres, P. The Key Role of Textural Properties of Aluminosilicates in the Acid-Catalysed Dehydration of Glucose into 5-Hydroxymethylfurfural. ChemistrySelect 2017, 2, 2444–2451. [Google Scholar] [CrossRef]
- Velaga, B.; Peela, N.R. Seed-assisted and OSDA-free synthesis of H-mordenite zeolites for efficient production of 5-hydroxymethylfurfural from glucose. Microporous Mesoporous Mater. 2019, 279, 211–219. [Google Scholar] [CrossRef]
- Chen, C.; Luo, Z.; Tu, H.; Lin, X.; Pang, Y.; Huang, J.; Zhang, J.; Wang, X.; Cai, Q.; Wei, Z. Response surface methodology and Box-Behnken design optimization of Sulfaquinoxaline removal efficiency and degradation mechanisms by Bacillus sp. strain DLY-11. J. Hazard. Mater. 2025, 486, 136986. [Google Scholar] [CrossRef] [PubMed]
- Manzoor, M.H.; Elsayed, I.; Hassan, E.B. Optimization of Hemicellulosic Carbohydrate Extraction from Corncobs via Hydrothermal Treatment: A Response Surface Methodology Approach. Sustain. Chem. 2025, 6, 27. [Google Scholar] [CrossRef]
- Guvenc, C.; Alan, E.; Degirmencioglu, P.; Ozcan, M.C.; Karaman, B.P.; Oktar, N. Catalytic upgrading of bio-oil model mixtures in the presence of microporous HZSM-5 and γ-Al2O3 based Ni, Ta and Zr catalysts. Fuel 2023, 350, 128870. [Google Scholar] [CrossRef]
- Liu, Y.; Zhang, S.; Zhang, T.; Jin, Y.; Xiao, H.; Zhang, C. Efficient production of 5-hydroxymethylfurfural from glucose over the combination of nano-metal oxides and HCl in biphasic methyl isobutyl ketone/H2O–NaCl. Sustain. Chem. Pharm. 2025, 47, 102188. [Google Scholar] [CrossRef]
- Damayanti, N. Preparation of superhydrophobic PET fabric from Al2O3–SiO2 hybrid: geometrical approach to create high contact angle surface from low contact angle materials. J. Sol.-Gel Sci. Technol. 2010, 56, 47–52. [Google Scholar] [CrossRef]
- Gemeay, A.H.; Keshta, B.E.; El-Sharkawy, R.G.; Zaki, A.B. Chemical insight into the adsorption of reactive wool dyes onto amine-functionalized magnetite/silica core-shell from industrial wastewaters. Environ. Sci. Pollut. Res. 2020, 27, 32341–32358. [Google Scholar] [CrossRef] [PubMed]
- Taghvaei, H.; Rahimpour, M.R.; Bruggeman, P. Catalytic hydrodeoxygenation of anisole over nickel supported on plasma treated alumina–silica mixed oxides. RSC Adv. 2017, 7, 30990–30998. [Google Scholar] [CrossRef]
- Yu, X.; Williams, C.T. Recent advances in the applications of mesoporous silica in heterogeneous catalysis. Catal. Sci. Technol. 2022, 12, 5765–5794. [Google Scholar] [CrossRef]
- Kobkeatthawin, T.; Thiensuwan, N.; Chotirattanachote, A.; Chaowamalee, S.; Ngamcharussrivichai, C. Selectivity control in catalytic glucose dehydration using iron-and tungsten-modified ZSM-5 catalysts. Mater. Today Sustain. 2024, 28, 101005. [Google Scholar] [CrossRef]
- Xie, X.; Tong, C. One-Pot Synthesis of Cu2+-Doped 4A Zeolite from Kaolin: Structural Characterization and Functional Potential Analysis. Results Eng. 2025, 108673. [Google Scholar] [CrossRef]
- Song, X.; Yue, J.; Zhu, Y.; Wen, C.; Chen, L.; Liu, Q.; Ma, L.; Wang, C. Efficient conversion of glucose to 5-hydroxymethylfurfural over a Sn-modified SAPO-34 zeolite catalyst. Ind. Eng. Chem. Res. 2021, 60, 5838–5851. [Google Scholar] [CrossRef]
- Ramesh, A.; Rajesh, D.; Shanthi, K.; Bhargav, P.B.; Nguyen-Le, M.-T. Catalytic conversion of glucose to 5-hydroxymethylfurfural productions over sulphated Ti-Al2O3 catalysts. Biomass Bioenergy 2021, 154, 106261. [Google Scholar] [CrossRef]
- Guo, W.; Hensen, E.J.; Qi, W.; Heeres, H.J.; Yue, J. Titanium phosphate grafted on mesoporous SBA-15 silica as a solid acid catalyst for the synthesis of 5-hydroxymethylfurfural from glucose. ACS Sustain. Chem. Eng. 2022, 10, 10157–10168. [Google Scholar] [CrossRef]
- Wang, J.; Zhang, W.; Ning, L.; Wang, K.; Wang, Y.; Li, H.; Yu, H. Catalytic Conversion of Glucose to 5-Hydroxymethylfurfural by Nanoporous Carbon Microspheres Loaded with Tin Dioxide Nanoparticles. ACS Appl. Nano Mater. 2025, 8, 3905–3914. [Google Scholar] [CrossRef]
- Salvia, W.S.; Zhao, T.Y.; Chatterjee, P.; Huang, W.; Perras, F.A. Are the Brønsted acid sites in amorphous silica–alumina bridging? Chem. Commun. 2023, 59, 13962–13965. [Google Scholar] [CrossRef] [PubMed]
- Candu, N.; El Fergani, M.; Verziu, M.; Cojocaru, B.; Jurca, B.; Apostol, N.; Teodorescu, C.; Parvulescu, V.I.; Coman, S.M. Efficient glucose dehydration to HMF onto Nb-BEA catalysts. Catal. Today 2019, 325, 109–116. [Google Scholar] [CrossRef]
- Jakob, A.; Likozar, B.; Grilc, M. Effect of Lignin, Humins, and Biomass-Derived Acids on Kinetics of Catalytic Hydroxymethylfurfural Production during Saccharide Dehydration Reactions. ChemSusChem 2025, 18, e202501282. [Google Scholar] [CrossRef] [PubMed]
Scheme 1.
Schematic diagram of glucose dehydration to HMF.
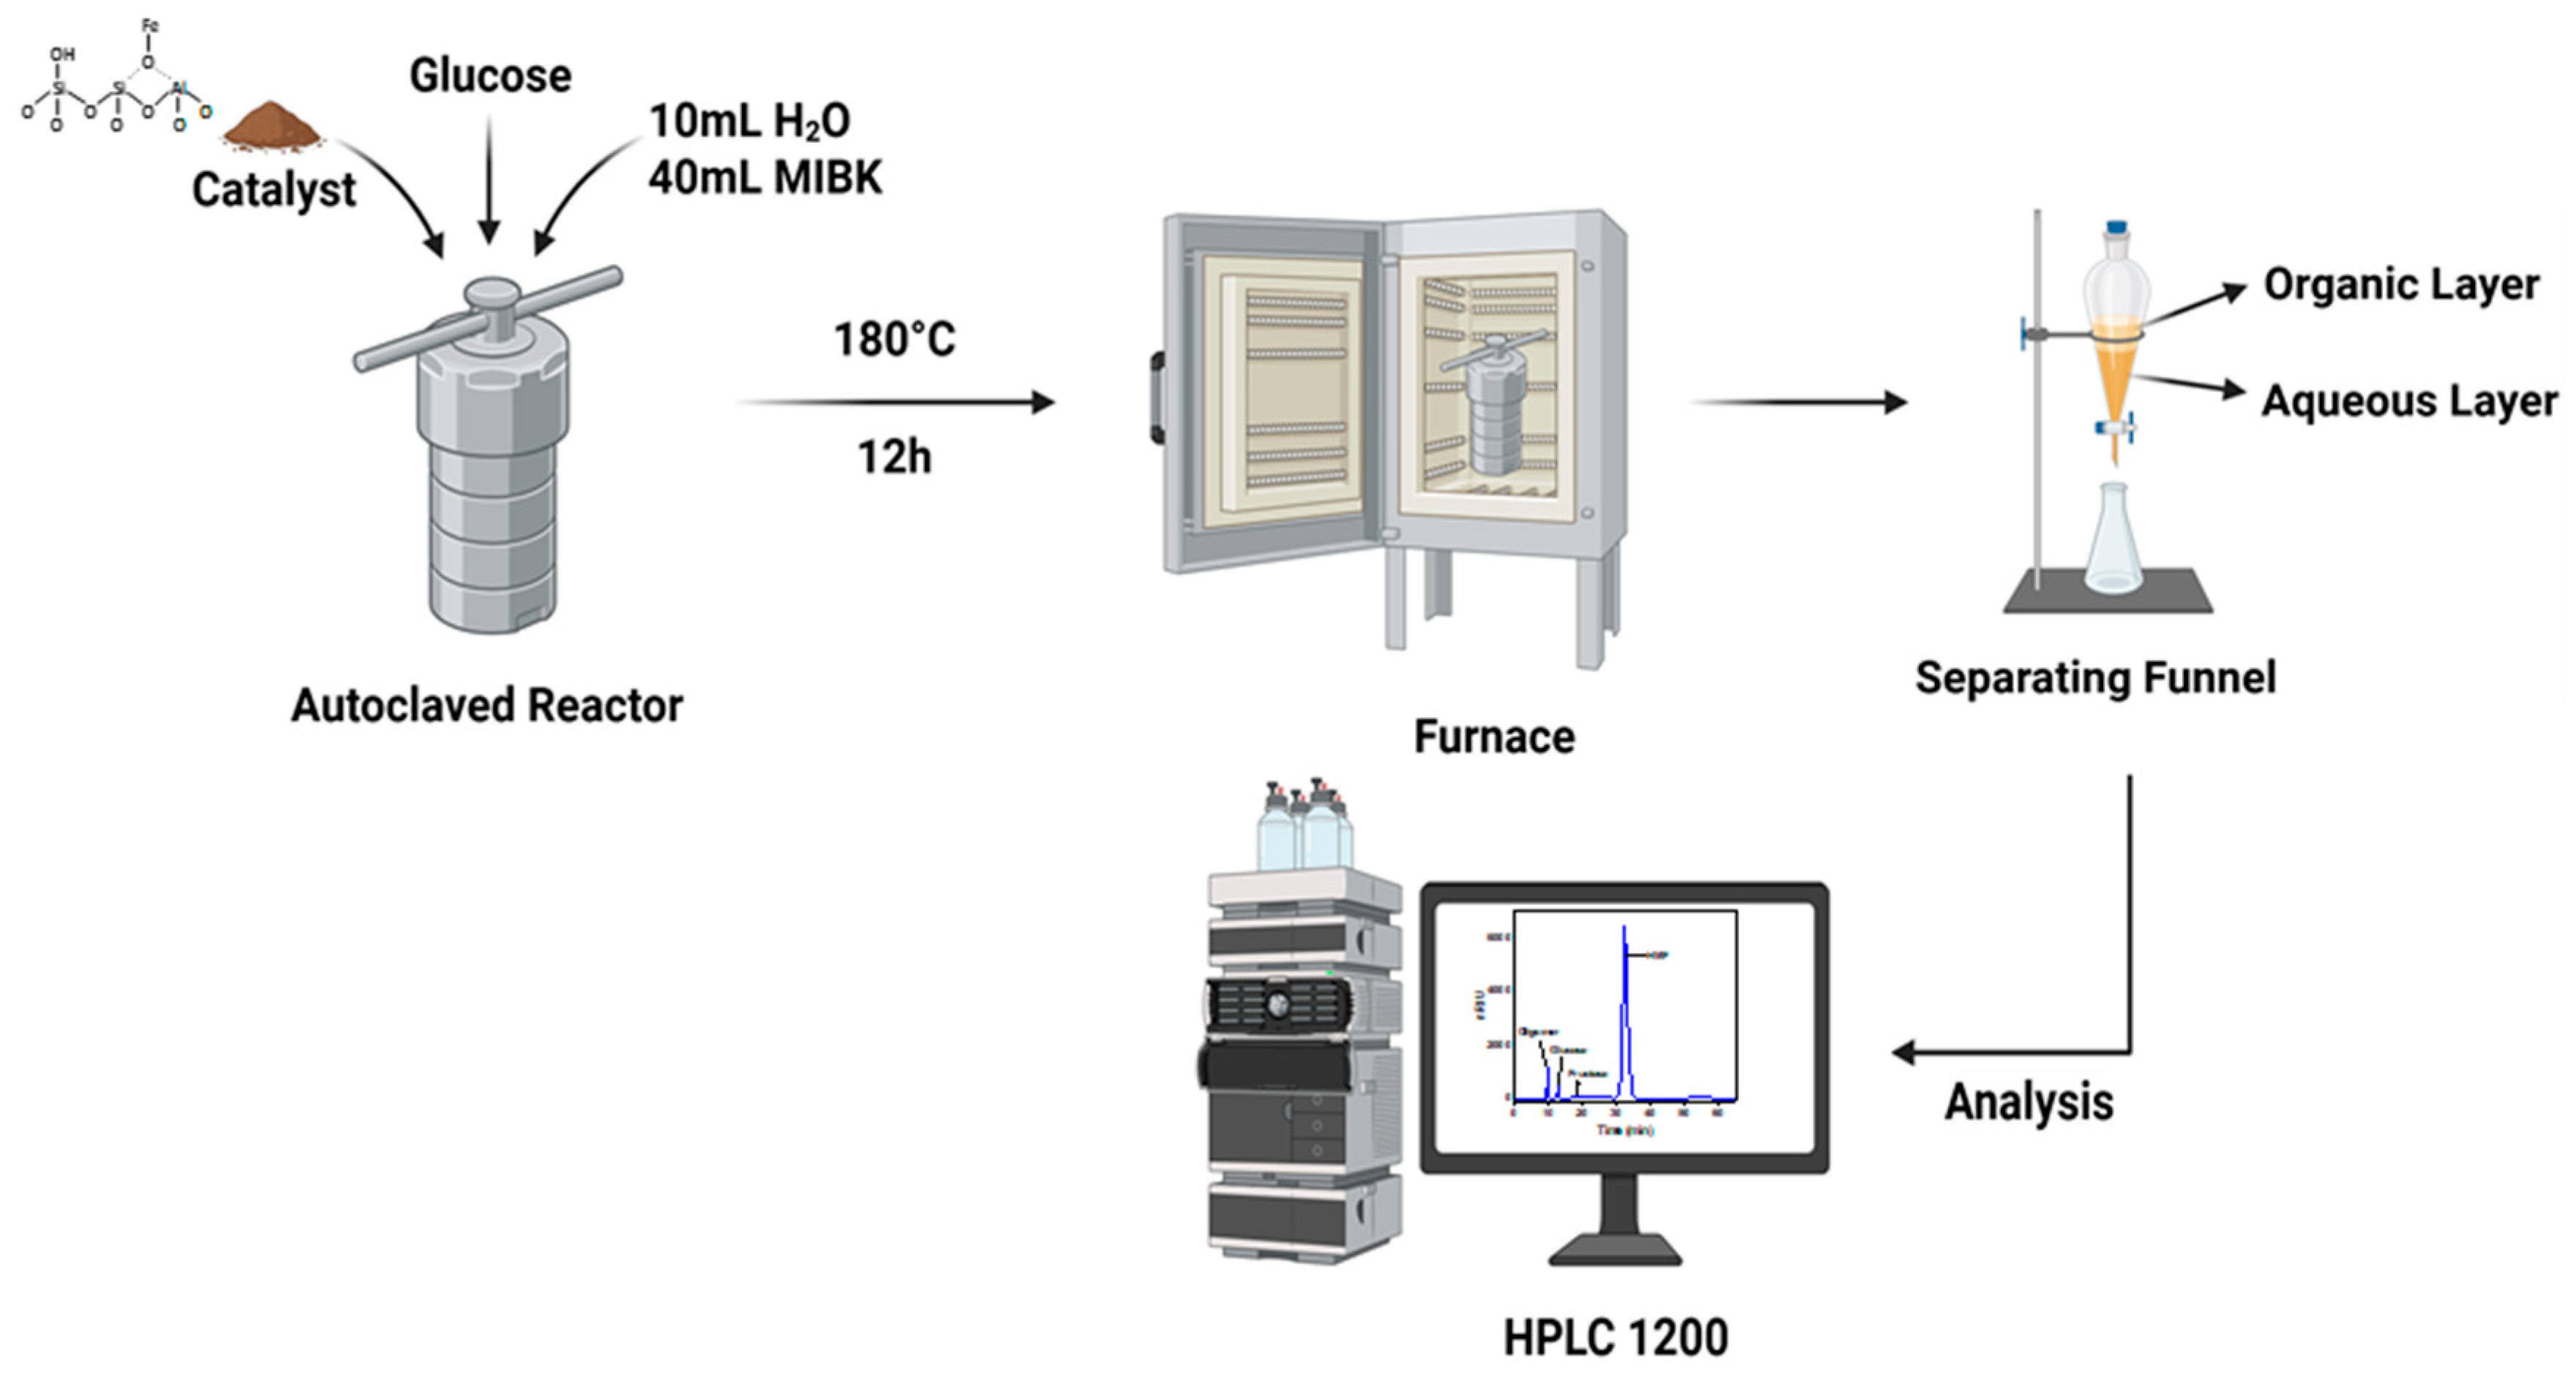
Figure 1.
Characterization of the Fe3O4-SiO2/Al2O3 catalyst, a) FTIR spectrum, b) TGA thermograph, and c) XRD pattern.
Figure 1.
Characterization of the Fe3O4-SiO2/Al2O3 catalyst, a) FTIR spectrum, b) TGA thermograph, and c) XRD pattern.
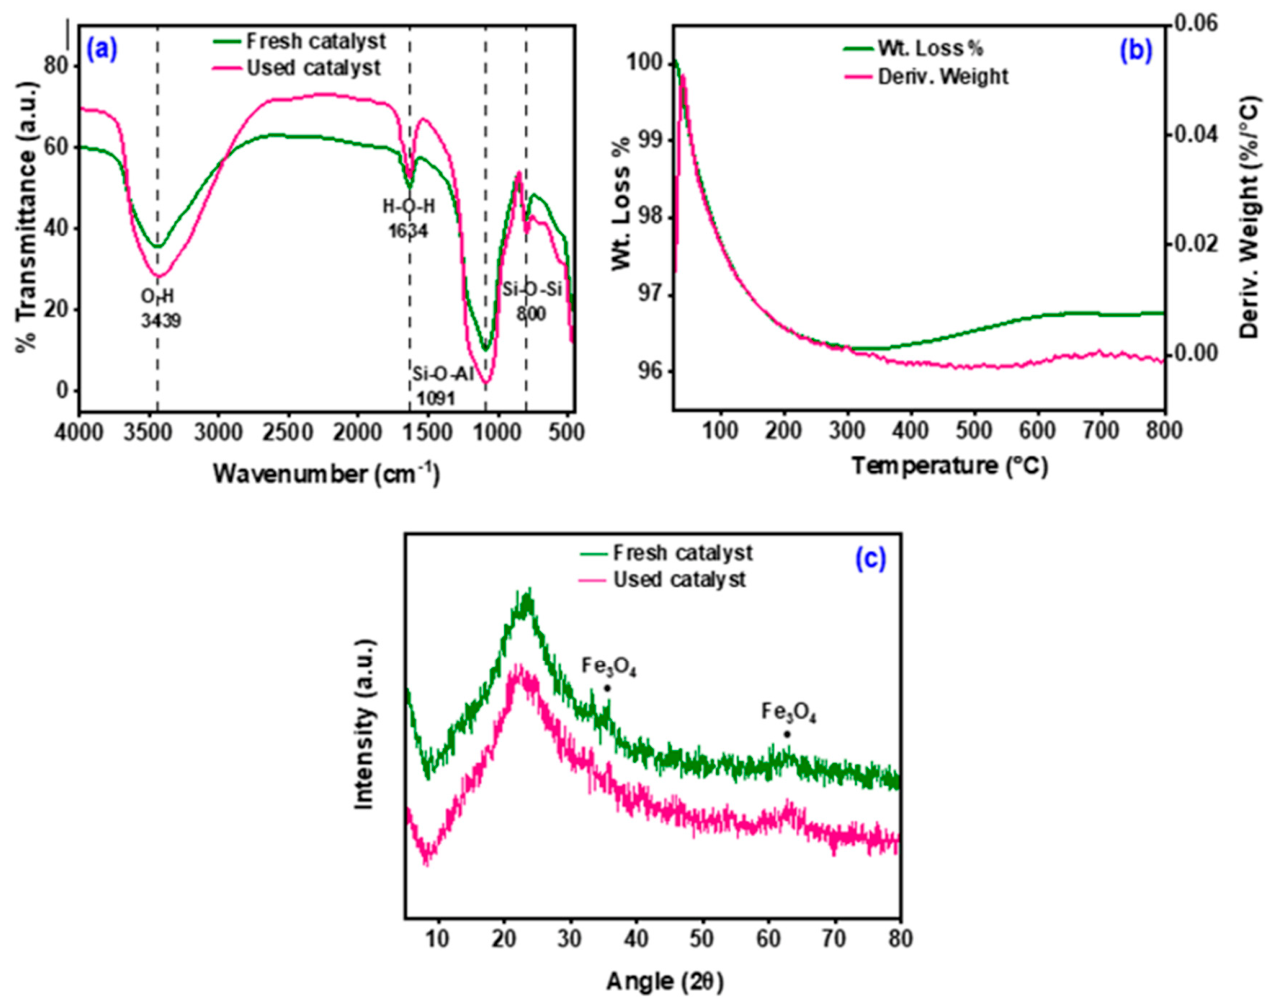
Figure 2.
Nitrogen adsorption-desorption isotherms at -196 ℃ and pore size distribution of a) Fresh Fe3O4-SiO2/Al2O3 catalyst, b) Used Fe3O4-SiO2/Al2O3 catalyst.
Figure 2.
Nitrogen adsorption-desorption isotherms at -196 ℃ and pore size distribution of a) Fresh Fe3O4-SiO2/Al2O3 catalyst, b) Used Fe3O4-SiO2/Al2O3 catalyst.
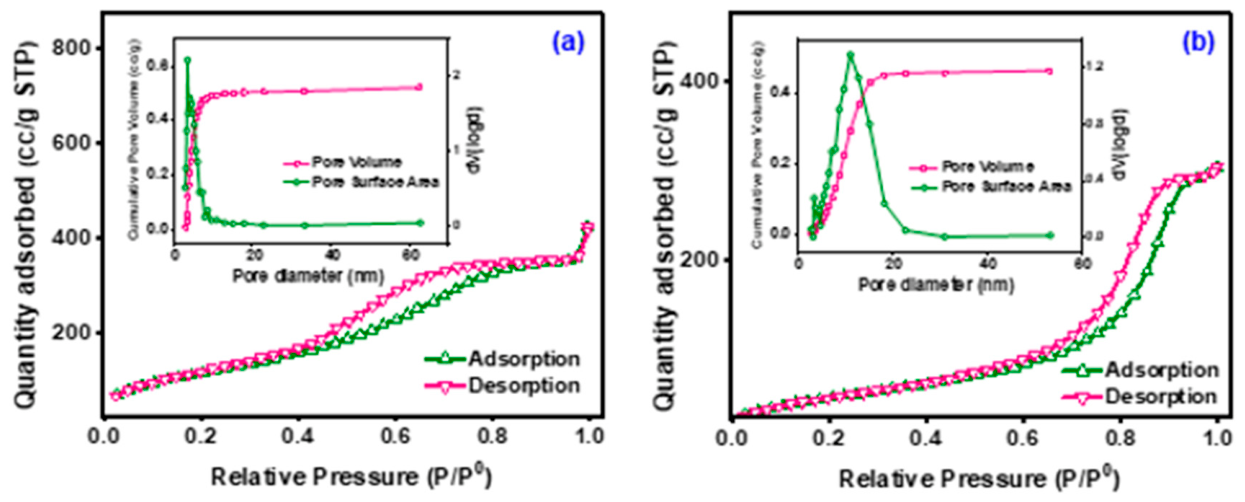
Figure 3.
SEM-EDX of fresh Fe3O4-SiO2/Al2O3 catalyst (a-f), and SEM-EDX of used Fe3O4-iO2/Al2O3 catalyst (g-l).
Figure 3.
SEM-EDX of fresh Fe3O4-SiO2/Al2O3 catalyst (a-f), and SEM-EDX of used Fe3O4-iO2/Al2O3 catalyst (g-l).
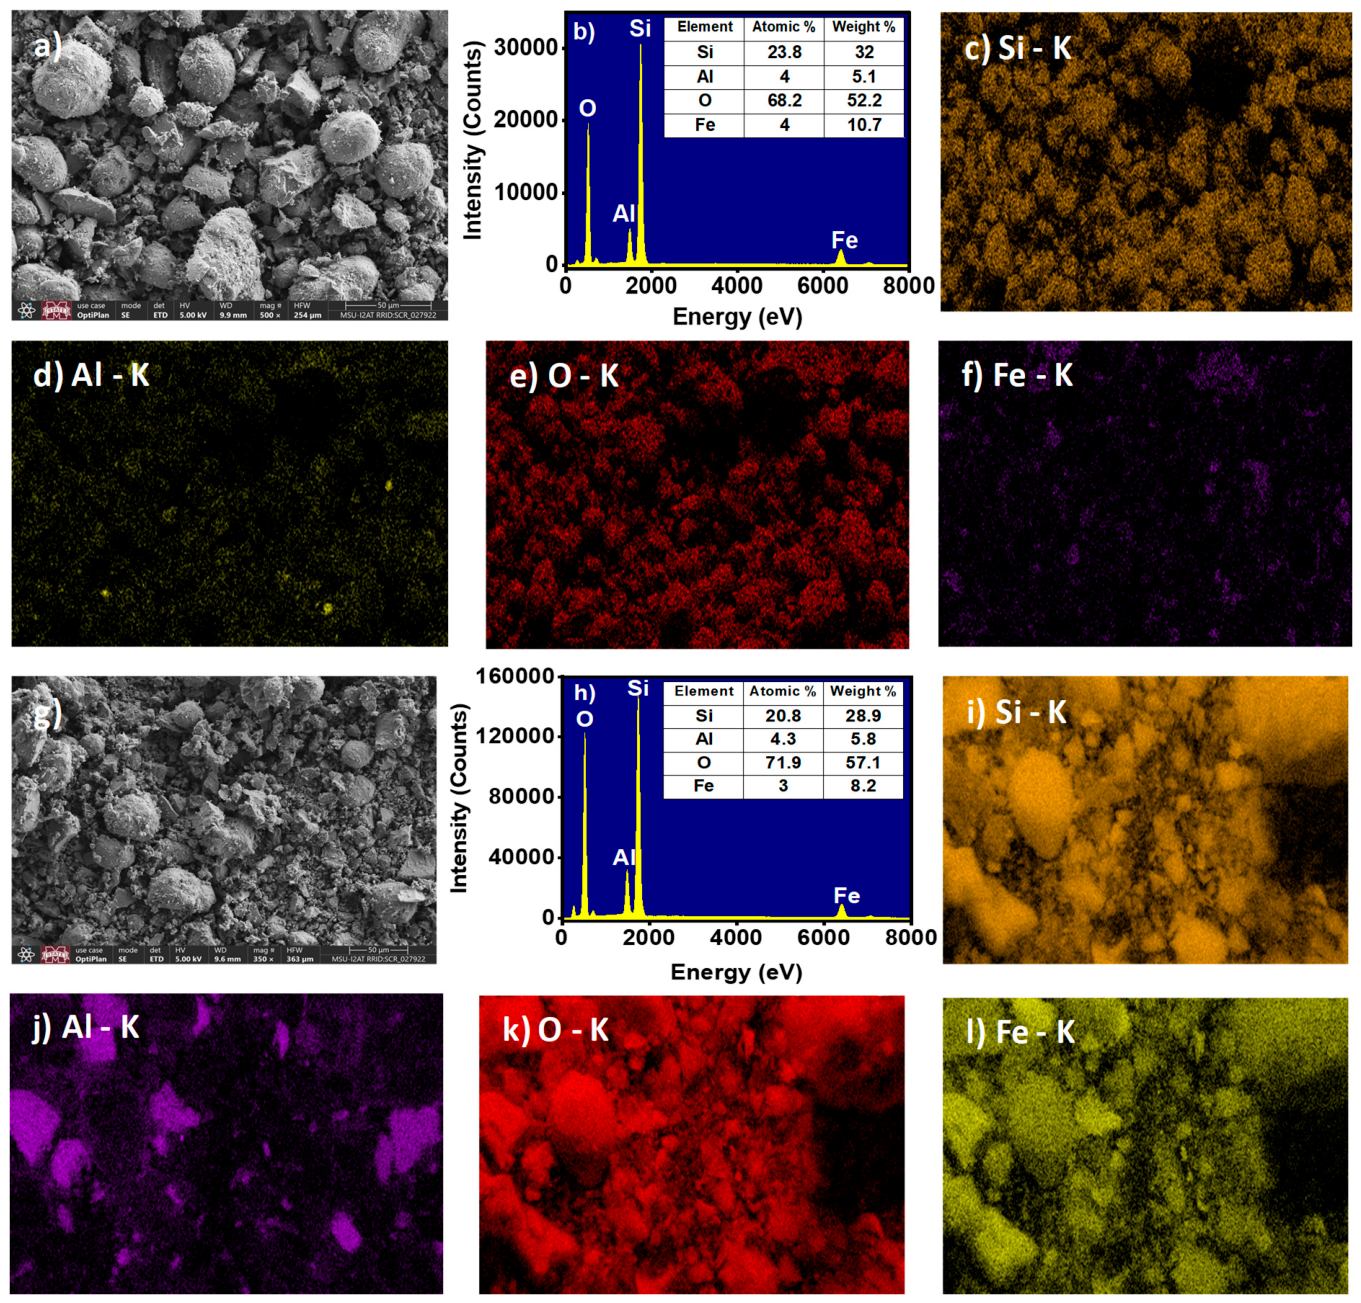
Figure 4.
X-ray photoelectron spectra of (a) convoluted Fe3O4-SiO2/Al2O3, deconvoluted peaks of (b) Fe2p, (c) Si2p, (d) Al2p, and (e) O1s in Fe3O4-SiO2/Al2O3 catalyst.
Figure 4.
X-ray photoelectron spectra of (a) convoluted Fe3O4-SiO2/Al2O3, deconvoluted peaks of (b) Fe2p, (c) Si2p, (d) Al2p, and (e) O1s in Fe3O4-SiO2/Al2O3 catalyst.
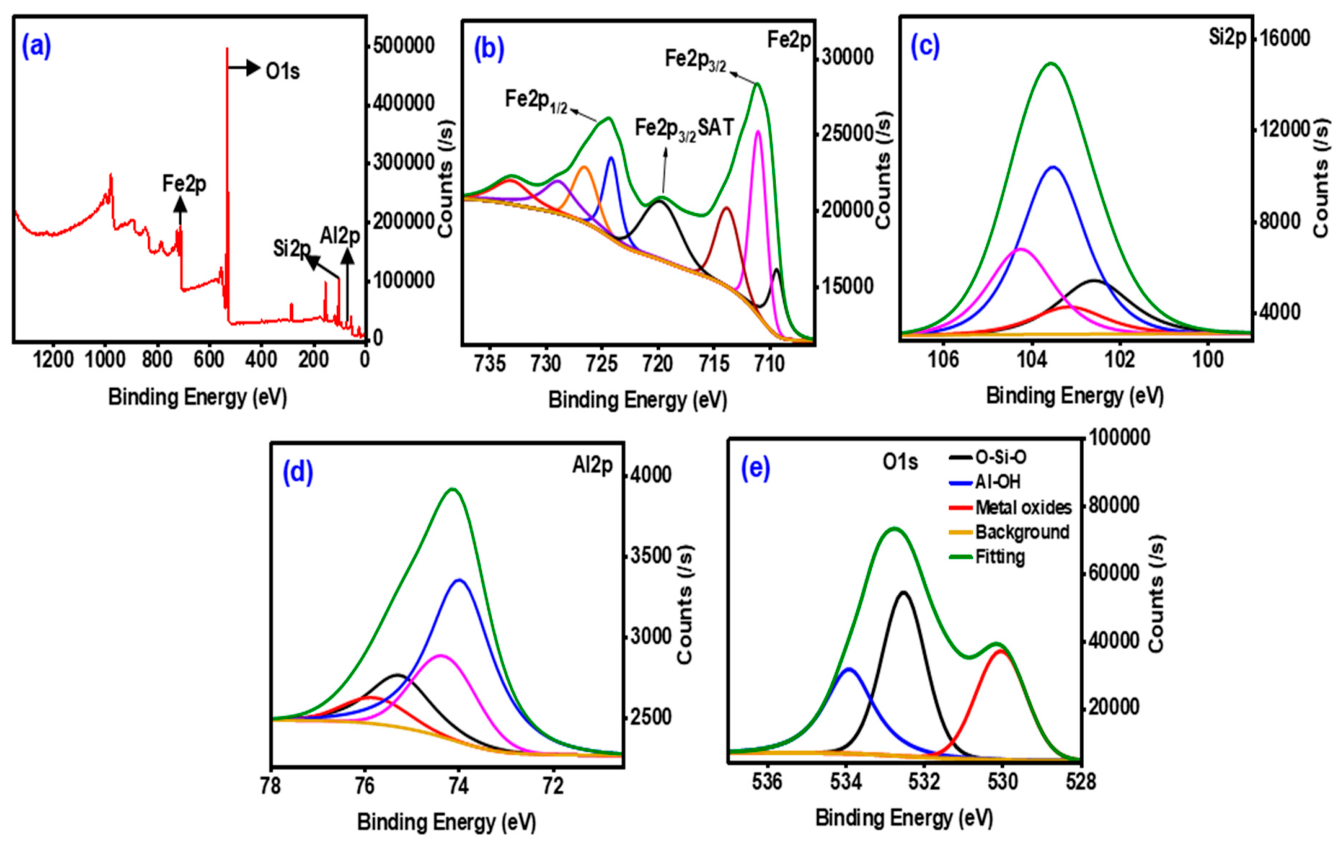
Figure 5.
a) 3D surface plot and b) 2D Contour plot showing the effect of temperature and time on HMF yield at a constant catalyst loading; c) 3D surface plot and d) 2D Contour plot illustrating the effect of temperature and catalyst loading on HMF yield at a constant time; e) 3D surface plot and f) 2D Contour plot displaying the effect of catalyst and time on HMF yield at constant temperature.
Figure 5.
a) 3D surface plot and b) 2D Contour plot showing the effect of temperature and time on HMF yield at a constant catalyst loading; c) 3D surface plot and d) 2D Contour plot illustrating the effect of temperature and catalyst loading on HMF yield at a constant time; e) 3D surface plot and f) 2D Contour plot displaying the effect of catalyst and time on HMF yield at constant temperature.
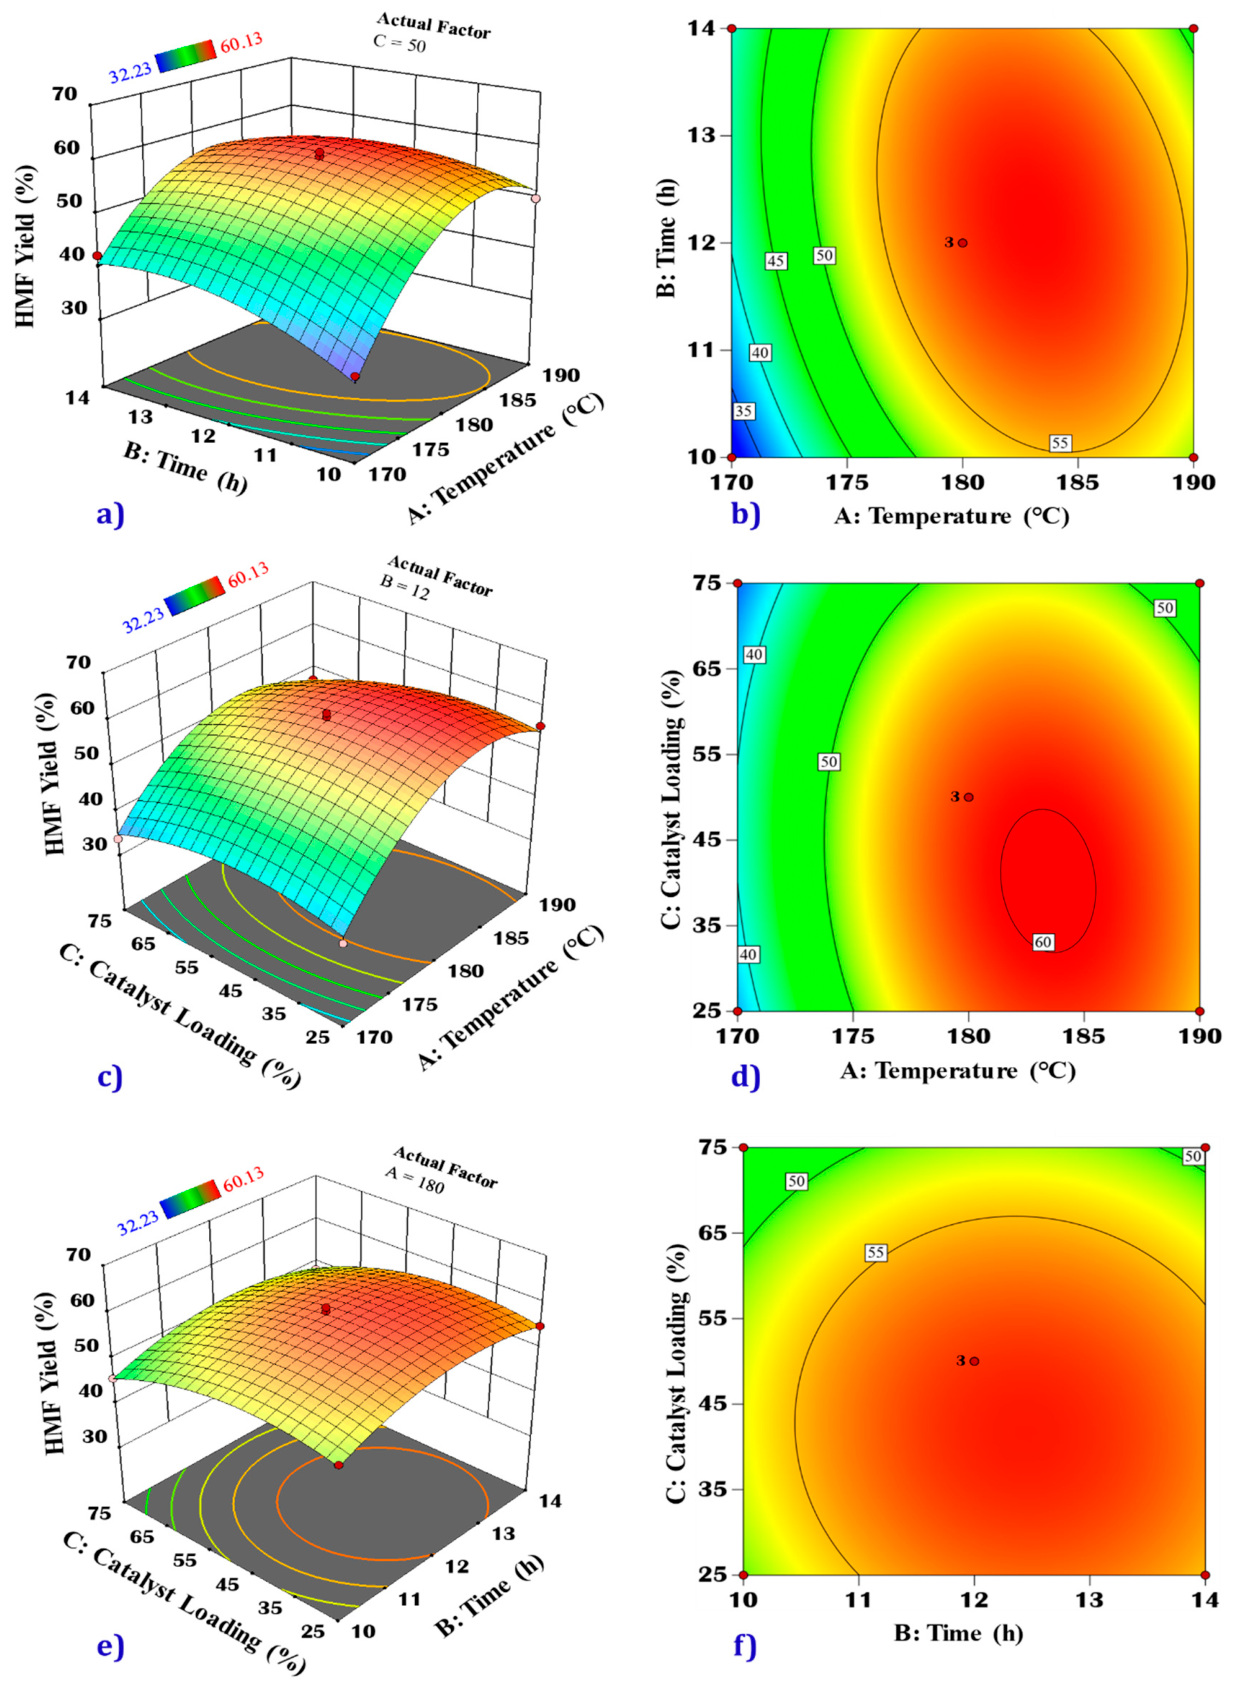
Figure 6.
The proposed reaction mechanism of dehydration of glucose into HMF over Fe3O4-SiO2/Al2O3 catalyst.
Figure 6.
The proposed reaction mechanism of dehydration of glucose into HMF over Fe3O4-SiO2/Al2O3 catalyst.
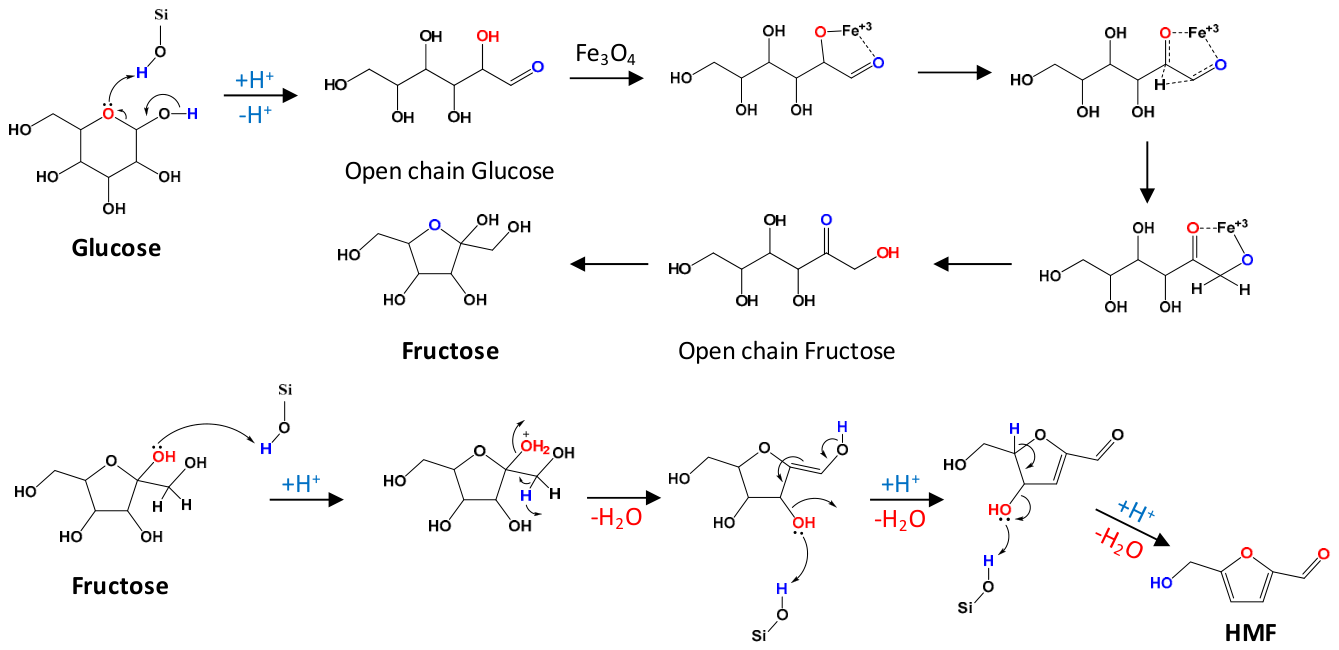
Figure 7.
Reusability performance of Fe3O4-SiO2/Al2O3 catalyst for glucose dehydration under optimized conditions (Catalyst loading: 50wt%, temperature: 180 °C, reaction time: 14 h).
Figure 7.
Reusability performance of Fe3O4-SiO2/Al2O3 catalyst for glucose dehydration under optimized conditions (Catalyst loading: 50wt%, temperature: 180 °C, reaction time: 14 h).
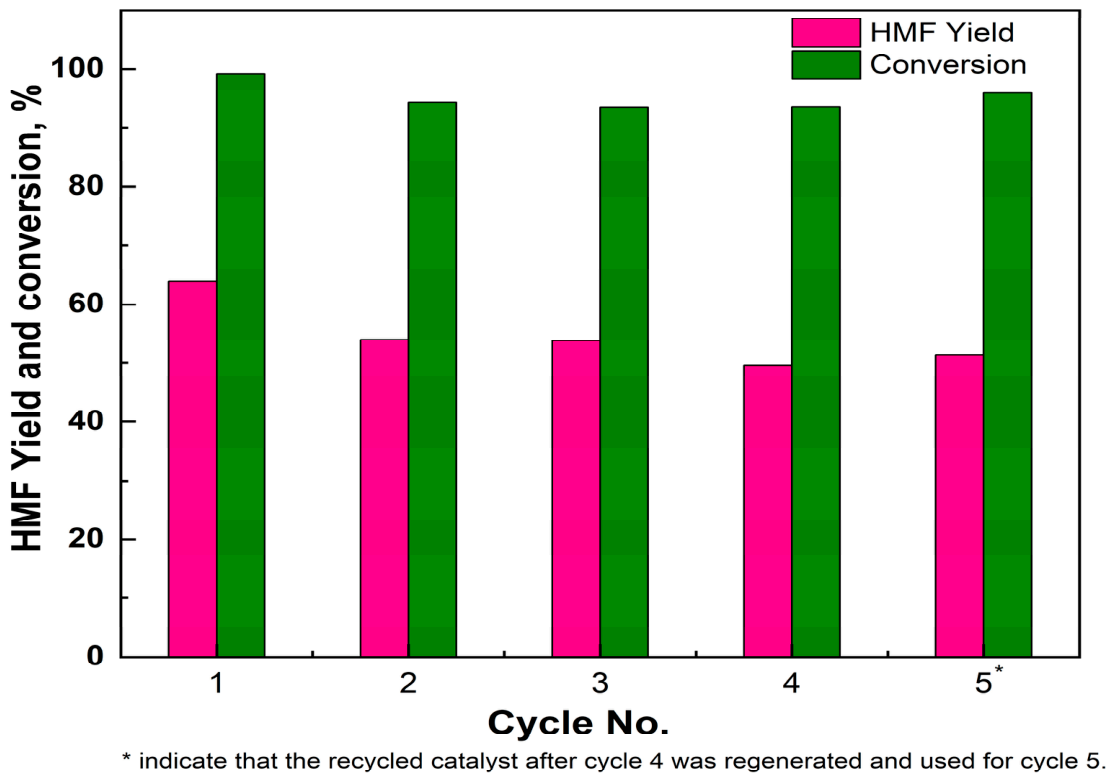

Table 1.
Experimental conditions for glucose dehydration.
| Exp. No. | Glucose, mg | Temp, ℃ | Time, h | Catalyst, wt% |
| 1 | 50.10 | 180 | 10 | 25 |
| 2 | 50.20 | 180 | 12 | 50 |
| 3 | 50.77 | 190 | 10 | 50 |
| 4 | 50.18 | 190 | 14 | 50 |
| 5 | 50.42 | 170 | 14 | 50 |
| 6 | 50.17 | 190 | 12 | 75 |
| 7 | 50.59 | 190 | 12 | 25 |
| 8 | 50.37 | 180 | 10 | 75 |
| 9 | 50.05 | 170 | 12 | 25 |
| 10 | 50.10 | 180 | 12 | 50 |
| 11 | 50.41 | 180 | 14 | 25 |
| 12 | 50.33 | 180 | 12 | 50 |
| 13 | 50.41 | 170 | 12 | 75 |
| 14 | 50.17 | 170 | 10 | 50 |
| 15 | 50.27 | 180 | 14 | 75 |
| 16 | 50.43 | 170 | 12 | 50 |
| 17 | 51.20 | 180 | 14 | 50 |
Table 2.
Experimental design levels with three factors.
| Factors | Unit | Symbol coded | Levels in BBD | ||
| Low (-1) | Medium (0) | High (+1) | |||
| Temperature | ºC | A | 170 | 180 | 190 |
| Time | h | B | 10 | 12 | 14 |
| Catalyst | % | C | 25 | 50 | 75 |
Table 3.
Experimental and model-predicted yield of HMF.
| Run Order | A | B | C | Experimental Value | Predicted Value | Residual |
| 1 | 180 | 10 | 25 | 50.94 | 50.60 | 0.35 |
| 2 | 180 | 12 | 50 | 56.67 | 58.71 | -2.04 |
| 3 | 190 | 10 | 50 | 49.81 | 51.34 | -1.53 |
| 4 | 190 | 14 | 50 | 47.68 | 48.90 | -1.22 |
| 5 | 170 | 14 | 50 | 42.24 | 40.72 | 1.52 |
| 6 | 190 | 12 | 75 | 47.33 | 45.77 | 1.56 |
| 7 | 190 | 12 | 25 | 55.87 | 54.69 | 1.18 |
| 8 | 180 | 10 | 75 | 45.80 | 45.84 | -0.04 |
| 9 | 170 | 12 | 25 | 35.48 | 37.04 | -1.56 |
| 10 | 180 | 12 | 50 | 60.13 | 58.71 | 1.42 |
| 11 | 180 | 14 | 25 | 55.02 | 54.99 | 0.04 |
| 12 | 180 | 12 | 50 | 59.33 | 58.71 | 0.62 |
| 13 | 170 | 12 | 75 | 33.74 | 34.92 | -1.18 |
| 14 | 170 | 10 | 50 | 32.23 | 31.02 | 1.21 |
| 15 | 180 | 14 | 75 | 48.36 | 48.71 | -0.35 |
Table 4.
Analysis of variance (ANOVA) for a quadratic model.
| Source | Sum of Squares | DF | Mean Square | F-value | p-value | Remarks |
| Model | 1099.22 | 9 | 122.14 | 27.68 | 0.0010 | Significant |
| A-Temperature | 406.12 | 1 | 406.12 | 92.06 | 0.0002 | Significant |
| B-Time | 26.35 | 1 | 26.35 | 5.97 | 0.0584 | Not significant |
| C-Catalyst Loading | 60.94 | 1 | 60.94 | 13.81 | 0.0138 | Significant |
| AB | 36.84 | 1 | 36.84 | 8.35 | 0.0342 | Significant |
| AC | 11.56 | 1 | 11.56 | 2.62 | 0.1664 | Not significant |
| BC | 0.5776 | 1 | 0.5776 | 0.1309 | 0.7323 | Not significant |
| A2 | 473.35 | 1 | 473.35 | 107.29 | 0.0001 | Significant |
| B2 | 71.40 | 1 | 71.40 | 16.18 | 0.0101 | Significant |
| C2 | 67.72 | 1 | 67.72 | 15.35 | 0.0112 | Significant |
| Residual | 22.06 | 5 | 4.41 | |||
| Lack of Fit | 15.50 | 3 | 5.17 | 1.57 | 0.4112 | Not Significant |
| Pure Error | 6.56 | 2 | 3.28 | |||
| Cor Total | 1121.27 | 14 | ||||
| R2 = 0.9803 | Adj R2 = 0.9449 Predicted R2 = 0.7657 | |||||
Table 5.
Fit summary of the sequential model.
| Source | Sequential p-value | Lack of Fit p-value | Adjusted R2 | Predicted R2 | |
| Linear | 0.0841 | 0.0462 | 0.2873 | 0.1092 | |
| 2FI | 0.8760 | 0.0336 | 0.0965 | -0.4529 | |
| Quadratic | 0.0006 | 0.4112 | 0.9449 | 0.7657 | Suggested |
| Cubic | 0.4112 | 0.9590 | Aliased |
Table 6.
Regression coefficients of the predicted full quadratic polynomial model for HMF yield.
| Factor | Coefficient Estimate | DF | Standard Error | 95% CI Low | 95% CI High | VIF |
| Intercept | 58.71 | 1 | 1.21 | 55.59 | 61.83 | |
| A-Temperature | 7.12 | 1 | 0.7426 | 5.22 | 9.03 | 1.0000 |
| B-Time | 1.81 | 1 | 0.7426 | -0.0939 | 3.72 | 1.0000 |
| C-Catalyst Loading | -2.76 | 1 | 0.7426 | -4.67 | -0.8511 | 1.0000 |
| AB | -3.03 | 1 | 1.05 | -5.73 | -0.3354 | 1.0000 |
| AC | -1.70 | 1 | 1.05 | -4.40 | 0.9996 | 1.0000 |
| BC | -0.3800 | 1 | 1.05 | -3.08 | 2.32 | 1.0000 |
| A2 | -11.32 | 1 | 1.09 | -14.13 | -8.51 | 1.01 |
| B2 | -4.40 | 1 | 1.09 | -7.21 | -1.59 | 1.01 |
| C2 | -4.28 | 1 | 1.09 | -7.09 | -1.47 | 1.01 |
Disclaimer/Publisher’s Note: The statements, opinions and data contained in all publications are solely those of the individual author(s) and contributor(s) and not of MDPI and/or the editor(s). MDPI and/or the editor(s) disclaim responsibility for any injury to people or property resulting from any ideas, methods, instructions or products referred to in the content. |
© 2026 by the authors. Licensee MDPI, Basel, Switzerland. This article is an open access article distributed under the terms and conditions of the Creative Commons Attribution (CC BY) license (http://creativecommons.org/licenses/by/4.0/).
Copyright: This open access article is published under a Creative Commons CC BY 4.0 license, which permit the free download, distribution, and reuse, provided that the author and preprint are cited in any reuse.