

Submitted:
02 August 2026
Posted:
14 August 2026
You are already at the latest version
Abstract
This study examines entrepreneurs’ awareness and preventive activities regarding the environment and employees as key elements of the Quality 5.0 concept. Quantitative research was conducted among manufacturing companies in Greater Poland that had not implemented or certified a quality management system. Data were collected using CATI interviews based on an original questionnaire assessing the importance and implementation of 24 preventive management factors, with detailed analysis of 10 factors. A quota-random sample of 380 enterprises, stratified by company size, was used. The findings indicate that maintaining good relationships with the environment, ensuring occupational safety and ergonomics, careful supplier selection and continuous evaluation, and improving employees’ qualifications and skills are perceived as the most important preventive management factors. Environmental relations and workplace safety also achieved the highest implementation levels, suggesting their strongest contribution to a preventive management approach. In contrast, participatory management received relatively low importance and implementation ratings, highlighting the need for further investigation. The results emphasize the role of preventive management practices in supporting the Quality 5.0 concept and provide practical guidance for organizations seeking to strengthen sustainable, employee-oriented, and proactive management approaches.
Keywords:
Quality 5.0
; preventive approach to management
; preventive management factors
1. Introduction
Three decades of society maturing to understand the concept of sustainable industrial development have led to the awareness that it is possible to meet the needs of contemporary society without losing future generations. At the same time, the economy is undergoing an industrial evolution using the Internet of Things, progressive automation, robotics, and artificial intelligence not only in production processes.
In building a balance between economic growth, environmental protection, and the well-being of society, knowledge about quality plays an extremely important role, which, with the use of modern digital solutions, can effectively support development activities with respect for the environment and social responsibility. In this case, the proactive approach is of particular importance, which emphasizes the sense of predicting and preventing technical, environmental, and social problems and is becoming more and more accessible and effective thanks to advanced data analysis techniques and artificial intelligence.
In accordance with the above, a research problem emerges, which is proactive action in the context of the challenges of the Quality 5.0 concept. The aim of the work is to discuss the results of the study of entrepreneurs from Wielkopolska in relation to their awareness and preventive activities in relation to the environment and employees.
Quality 4.0 is a consequence of the developing Industry 4.0 and represents digitalized quality management, with an emphasis on mass production. It uses modern technologies such as the Internet of Things (IoT), artificial intelligence (AI), and big data. This includes the use of automatic sensors, advanced data analysis, and improved communication to monitor production processes in real time, identify defects, and improve efficiency. The goal of Quality 4.0 is therefore to achieve a higher level of product quality, customer satisfaction, and operational efficiency through the use of advanced technologies. Intelligent systems can automatically and independently collect data and, consequently, obtain information on production cycles, quality requirements, and waste production [1]. They also allow for modeling, simulating, and forecasting the quality of processes and products, which supports informed decision-making in this area [2,3,4,5]. At the same time, it increases the empowerment of activities for a holistic approach to quality and also expands the possibilities of predicting requirements, phenomena, and multiple consequences by functioning in an adaptive and intelligent environment ready to solve challenges and problems [6].
This interpretation is consistent with recent studies that describe Quality 5.0 as a shift from reactive inspection to proactive, data-supported quality control focused on anticipating nonconformities before they occur [7,8]. In this sense, the transition from Quality 4.0 to Quality 5.0 should be understood not only as technological modernization, but also as a roadmap for integrating human-centricity, sustainability, resilience, and proactive decision-making into quality management systems [8,9].
It can be confidently stated that industry is still in the process of implementing Quality 4.0 solutions, and this stage of evolution has not yet been completed. Nevertheless, it is already responding at a dynamic pace to emerging challenges. A stronger focus on people and their needs, supported by information technologies and automation, together with the need to incorporate the principles of sustainable development and to strengthen organizational resilience, has become the cornerstone of the Industry 5.0 paradigm and, consequently, of the Quality 5.0 concept [10,11].
Preventive quality management in manufacturing companies has been an approach promoted by quality advocates for years, but it is still insufficiently defined in the literature. Preventive actions are undoubtedly the most rational form of organizational improvement because due to their proactive, rather than reactive, nature, they are the most cost-effective and economically justified [12]. Few scientific studies usually refer to selected aspects in this area. One of them is a response to the still low interest and a proposal of a simple way to take effective preventive actions using brainstorming, the 5W method, the Pareto principle, and root cause analysis [13], or an attempt to use Design for six sigma (DFSS) [14]. New possibilities for preventing non-conformities are also indicated thanks to the digital processing of process data, as well as the possibility of simulating production processes on a virtual product model [15,16]. A noticeable direction of the preventive approach is the pharmaceutical industry, where CAPA (Corrective and Preventive Action) procedures are in force, introduced by the Federal Drug Administration (FDA) in the USA in 1999 [17,18], as well as the food industry characterized by HACCP (Hazard analysis and critical control points) requirements [19,20]. This means that entrepreneurs do not undertake proactive thinking voluntarily, but only in situations when it is required by industry standards. This is surprising enough because management knowledge has a large set of methods and tools supporting decision-making. Unfortunately, the level of their use is still low, even though entrepreneurs increasingly recognize the need for risk analysis and a predictive management style [21,22,23].
Despite the growing interest in Quality 5.0, little empirical evidence exists regarding entrepreneurs’ awareness and implementation of preventive management practices related to employees and the environment. Therefore, this study aims to identify the most important preventive management factors in manufacturing enterprises and assess their degree of implementation within the Quality 5.0 concept.
2. Literature Review
Optimization of production processes extends the scope of impact, as advanced data analysis can help improve production processes, not only by shortening production times and eliminating unnecessary losses but also by optimizing the consumption of raw materials and energy, which corresponds to more ecological processes. Additionally, personalized production with elements of human action emphasizes uniqueness and individuality, which is today considered the highest form of quality. This approach forces continuous supplementation of employees' knowledge and improvement of their competencies to be able to meet constantly changing requirements and ensure product innovation and creativity [11,24]. The role of quality managers is also increasing, as they are starting to pay attention to social satisfaction while taking into account the main values of current stakeholders. It is necessary to introduce new management models that can be adapted to the rapidly changing environment because building social satisfaction should begin with identifying the main values in the fields of occupational health and safety, business ethics, and environmental protection [25,26].
The human-oriented dimension of Quality 5.0 is also emphasized in studies linking quality management with Society 5.0, where the quality management process is treated as a mechanism for balancing technological advancement with social value creation [27]. From this perspective, sustainable quality improvement requires organizations to combine digital transformation with employee involvement, stakeholder orientation, and long-term responsibility for environmental and social outcomes [27,28]. This presents the management against a task of complex support to the company in terms of management based on the requirements of law, standards and social issues [29].
The necessary transformation is emphasized by the results of the research of the Balouei and Jamkhaneh team, which proves that in the digital era, technical skills and the ability to solve problems are the most important for strengthening the staff potential. Additionally, the following should also be taken into account:
- orientation on innovation,
- quick response to changes,
- use of IoT, big data, artificial intelligence, smart factory,
- learning orientation,
- improving efficiency,
- training and education,
- strategic flexibility.
Appropriately unstructured data and their analytical technologies were set as priorities because Quality 5.0 can successfully use advanced digital technologies for real-time monitoring and data collection from production processes [30]. This allows for more accurate quality control and effective response to current changes.
In Industry 5.0, proactive quality control is increasingly connected with explainable artificial intelligence, because human operators and managers need to understand the logic behind algorithmic recommendations in order to trust and use them responsibly [31]. Therefore, predictive and explainable solutions may strengthen proactive quality management by supporting earlier identification of process deviations, more transparent decision-making, and better cooperation between people and intelligent systems [31,32].
Fundin indicates five areas that will concern quality in the current decade. These are system perspectives, stability of change, models of intelligent self-organization, integration of sustainable development, and a higher purpose as support for quality management. Among the challenges, on the other hand, there is the provision of systematics and methodologies to investigate and understand the root causes and diversity, as well as knowledge on developing organizational capabilities for learning, change, and adaptation [33].
The need for such an extension is further supported by analyses of leadership and proactivity in Industry 5.0, which indicate that organizational readiness for new industrial challenges depends not only on technology, but also on proactive leadership, employee engagement, and the ability to anticipate change [34]. These aspects make proactive quality management a managerial competence as well as a technological capability.
The development of digitalization technologies and automation of production processes has opened up new opportunities for activities in the area of quality management in recent decades. It can be safely specified that the concept of Quality 5.0 means a transition from the traditional reactive model of quality control (identifying and removing defects after production is completed) to a proactive approach. This includes continuous monitoring, predictive analytics, and real-time corrections to prevent nonconformities before they occur [7,35].
This direction also reflects the earlier distinction between reactive and proactive quality strategies, where proactive quality management is associated with preventing problems at the design and process-planning stages rather than correcting defects after their occurrence [36]. In the current industrial context, predictive quality extends this logic by using data-driven forecasting and real-time process knowledge to support prevention, competitiveness, and continuous improvement [32,37].
The essence of the preventive approach in the contemporary perception of quality was emphasized several years ago by Krubasik's team in the context of new technologies that enforce new quality standards. This is the foundation for preventive, holistic, and future-oriented quality management. However, at the same time, low awareness of entrepreneurs in this area was noticed, because with a strong emphasis on production quality, the quality of the project is still neglected. For this very reason, to counteract nonconformities in production, quality management must begin at the earliest stages of the value chain, and the needs of stakeholders play a special role here [38]. Preventive actions that are an integral element of the risk management system should immediately return to favor. They become part of "risk-based thinking", in which risk comes to the forefront [39,40]. This risk is currently expanding to include social issues and it can be seen that searches for effective preventive measures are also taking place in this area. They often refer to relations with the environment [41,42,43,44,45,46,47] or relations with employees [48,49,50,51,52,53,54,55]. This means that the new face of quality needs to include proactive thinking, where stakeholders go beyond the basic standards of compliance with the specifications and requirements related to delivery service and show additional expectations related to saving natural resources, corporate social responsibility, and respect for the employee. Such an extension of the role of the organization in meeting the requirements and expectations towards products to issues related to its entire activity is successfully possible using artificial intelligence, which will allow for a comprehensive response to premises coming from the environment and changes in real-time. This will provide an answer to the desire to personalize products and services because adaptation to individual customer needs is possible only based on justified predictions.
The proactive logic is also important for personalization, because Quality 5.0 connects quality management with the ability to adapt products and processes to individual user expectations while maintaining stability, efficiency, and satisfaction [56]. Consequently, preventive quality management becomes a condition for both operational reliability and customer-oriented customization in Industry 5.0.
In the context of the above, proactive thinking in the Quality 5.0 concept can have a multifaceted positive impact, such as:
- elimination of nonconformities in both the product specification and the technical, social, and environmental conditions of the processes being carried out [57],
- increasing the tailoring of products to individual customer needs [12],
- minimizing failures and downtimes of devices and processes [58],
- improving the flexibility and efficiency of processes [8,28),
- improving the competitiveness of enterprises, increasing customer satisfaction and their loyalty [61],
- longer product life [65],
- improving the image of socially and ecologically responsible entrepreneurs [66].
Such a wide range of possibilities for using the preventive approach in quality makes it necessary to diagnose the readiness of entrepreneurs in this area and establish directions for necessary improvement.
At the strategic level, this diagnosis is relevant because a proactive approach to quality may support industrial competitiveness by linking prevention, process improvement, and long-term development management [37]. It is therefore justified to examine whether enterprises are prepared to implement Quality 5.0 assumptions not only through digital tools, but also through organizational practices oriented toward prevention, learning, and stakeholder value.
3. Materials and Methods
The diagnosis of the preventive approach in quality management in manufacturing enterprises was made by the typical research process, which was discussed in detail in the article [67]. At the design stage, it was determined that the main research problem would be to identify the extent to which preventive actions are important in manufacturing enterprises. The main objective of the actions taken was to assess the general state of the preventive approach level in the surveyed enterprises and to determine the key factors influencing it. The scope of the research covered two groups. In the first stage, carried out in 2019, the respondents were representatives of manufacturing enterprises in which quality is systematically managed based on the guidelines of the ISO 9001 standard. The target group was limited to enterprises located in Poland in the Wielkopolska province. As a result, 79 interviews were conducted. The research method used was an interview using the CATI technique (computer-assisted telephone interviewing). Analyzing the obtained results, it was established that over 90% of respondents considered that the level of preventive approach in quality management in the manufacturing companies they represented could be considered very satisfactory or satisfactory, and only 8.86% were responses indicating an average assessment. Due to the identified high level of preventive approach, the authors extended the research (stage II) to include a group of companies that do not manage quality systematically. The approach imposed by the requirements included in the ISO 9001 standard directly obliges entrepreneurs to adopt a proactive attitude and, in principle, preventive actions should be an integral part of everyday activities. It was decided to check whether, in companies where the proactive attitude is not forced by the standard, preventive actions are also taken. This diagnosis was also expected to answer the question of whether in this group of respondents, we can speak of readiness for quality 5.0.
The second stage of the study conducted in 2020 was similar to the first, with the difference that the respondents were representatives of enterprises that did not have a quality management system implemented. The sample size of enterprises that did not have an implemented and certified quality management system was determined based on the criterion of the minimum (required) sample size. When planning the study, data was available on the number of enterprises from Wielkopolska that did not have an ISO 9001 certificate, which in 2020 was 36,5491. Assuming a maximum error of 5%, the sample size was estimated at 380 enterprises.
A quota-random sampling method was used. The quotas were determined according to the size of enterprises (micro, small, medium, and large2 ). The structure of the population and the research sample are presented in Table 1.
The research sample obtained during the research reflects the percentage structure of the population of enterprises from the first stage of the research.
During the research, the services of a research company specializing in providing call and contact center services were used. The authors developed and used an interview questionnaire.
The factors included in the interview questionnaire were selected based on an in-depth analysis of the 14 Deming principles and Juran principles, commonly considered important from the point of view of preventing non-conformities, conducted by the authors. They were assessed in two ways in the research. First, the company representative indicated the extent to which prevention was important in a given aspect. Then, the extent to which prevention was implemented in the company represented by the interviewee in various areas of the company's functioning was assessed. In providing answers to these questions, a five-point scale was used, organized according to the so-called Likert scale. In this way, the need to examine the leading factors supporting decisions about the preventive approach in quality management in manufacturing companies was addressed.
This article presents the results of research on 10 factors which, according to the authors, directly relate to the readiness of enterprises to take a proactive approach to quality management 5.0.
4. Results
In the initial part of the study, the level of the preventive approach in general was assessed. The results of the study are presented in Figure 1.
According to Figure 1, over 75% of respondents considered the level of preventive approach in the manufacturing companies they represented to be very satisfactory or satisfactory, 21% of responses indicated a medial assessment (only 3% of responses indicated dissatisfaction). It is worth mentioning that when the authors asked the same question to companies with a quality management system implemented based on the ISO 9001 standard, over 90% of respondents indicated a satisfactory and very satisfactory level (stage I of the research).
In general, the presented research results allow the statement that the size of the company does not have a significant impact on the obtained answers (correlation coefficient at the level of 0.15). It should be noted, however, that micro-enterprises much more often than the others assessed the preventive approach as medium (almost 32% of answers), without indicating extreme assessments, i.e. very satisfactory and very dissatisfied, and large enterprises in over 82% of cases placed their answers at the level of very satisfactory and satisfactory.
In the next step, the interview participants assessed the 24 factors indicated in the questionnaire. A summary of the basic research results for 10 factors important from the point of view of the subject of the article is presented in Table 2 and Figure 2.
From the collected answers, the most important factors can be distinguished (selected based on the number of answers indicating the highest rating), i.e. K2 – Maintaining good relations with the environment, K3 – Skillful selection of suppliers and continuous evaluation of cooperation, K7 – Raising employee qualifications and improving their skills and K8 – Ensuring safety and ergonomics of work. Assuming the expected value of the answers at the level of 4 or 5, it can be seen that each of the factors was assessed as important by at least 74% of the respondents, and the factors previously indicated by as many as 90% of the respondents, i.e. over 340 companies.
It can be stated that in general, the importance of factors is always assessed higher than the degree of implementation of a given factor. The largest difference between the importance of a factor and the degree of its implementation for the assessment of 5 was noted for K2 and K7 and amounts to over 15%, and in the case of treating the assessments of 4 and 5 as satisfactory in total, it amounts to 14.75% for K5 - Selection of employees based on their competences and 16.05% for K7, respectively. On this basis, it can be concluded that companies should take action to increase the level of implementation of the indicated factors, due to their significance in the preventive approach to quality management.
Basic statistics regarding the assessment of the importance and degree of implementation of factors K1-K10 are presented in Table 3.
Taking into account the basic statistics of the assessment of the importance and degree of implementation of individual factors, it can be stated that two factors were rated the highest, i.e. K2 – Maintaining good relations with the environment and K8 – Ensuring safety and ergonomics at work.
Except K6 – participatory management, the importance of the remaining factors reached an average value above 4 - satisfactory. Analyzing the level of implementation of a given factor in the surveyed enterprises, it is worth noting that only factor K6 obtained an average below 4, i.e. 3.62. It can therefore be stated that according to the respondents, participatory management is not one of the most important factors of the preventive approach in management and is also not implemented to a high degree. In this respect, it would be worth undertaking in-depth research to identify the cause of this state of affairs. It is interesting whether the obtained assessment results from the management style adopted by the enterprises, or perhaps the question was not fully understood by the respondents. Detailed variability of the examined K1-K10 criteria around the midpoint (median), taking into account the size of enterprises, is presented in Figure 3 (assessment of the importance of criteria) and Figure 4 (assessment of the degree of implementation).
Analyzing the importance ratings of the criteria studied in Figure 3, it can be seen that the median for all factors was at least 4, so they were considered important. In the data set from the group of micro and small enterprises, the median for all factors was at a level of 4. Half of the representatives of medium-sized enterprises considered the criteria K1, K2, K3, K4, K7, and K8 as very important (median equal to 5), and for the remaining factors, the median reached a value of 4. For 50% of respondents from large enterprises, factors K3, K4, K5, K6, K7, and K9 are important (for them the median was 4), and factors K1, K2, K8, and K10 were rated higher. Analyzing the box-and-whisker graphs showed that in the set of answers provided by representatives of small and medium-sized enterprises, the greatest dispersion concerned the importance rating for factor K6, as evidenced by the interquartile range. Only in these two groups were the K6 factor importance assessments at levels 1 (completely unimportant) and 2 (weak impact) among the non-outlier responses. In the group of micro-enterprises, in addition to K6, the K9 factor was also assessed the least favorably. Such an assessment is justified due to the lack of or low employment.
Analyzing the assessment of the implementation of the criteria studied in Figure 4, it can be seen that in each group of enterprises, the median value was equal to 4 for all 10 factors, which means that 50% of respondents assessed the level of implementation of each factor as high or very high. Analyzing in detail the distribution of the assessment of the level of implementation of individual factors in individual groups of enterprises, it can be seen that: - in microenterprises, it is most difficult to take action about factors K6 and K9 (interquartile range between 3 and 4), which may be justified due to the number of employees. The problem also concerns the implementation of factors K7 and K10, because about them, the assessment is at the level of 1 (confirming a complete lack of implementation) and is one of the non-outlier values (it was awarded more often than the other factors). Moreover, for factor K1 the highest level of implementation was confirmed the least often, which despite the median value at the level of 4, resulted in the average rating being lower than 4,
- in small enterprises the most significant problem concerns the implementation of factors K5, K6, K7 and K10, as evidenced by the largest dispersion of responses and the assessment at level 1 belonging to the non-outlier values. In addition, attention should be paid to factor K9, for which the interquartile range is within lower limits than for the remaining factors, i.e. between 3 and 4,
- in medium-sized enterprises the main problem concerns the implementation of factor K6. Only about participatory management did the interquartile range reach the lowest range between 3 and 4, moreover, assessment 2 belongs to the non-outlier values, which resulted in the lowest average value,
- in large enterprises the distribution of responses about factor K6 is analogous to that in the group of medium-sized enterprises. In addition to factor K6, it should be noted that there is also a problem with the implementation of factors K5 and K9 because the score of 5 was very rarely indicated. To more precisely analyze the dependence of the level of importance and the level of implementation of individual factors on the size of the company, it was decided to calculate the Pearson linear correlation coefficient.
Additionally, the correlation analysis was extended to check the impact on the answers given by the number of years a given company has been operating on the market. The results are presented in Table 4.
In Table 4, the Pearson correlation coefficient values indicating a weak strength of the relationship are marked in red (the strength of the relationship is in the range (0.0-0.3). For the remaining values, not marked in the table, the correlation coefficient is close to zero, which means that the correlation does not exist.
The simultaneous occurrence of a weak strength of correlation relationships in the two aspects studied, i.e. the assessment of importance and the assessment of the degree of implementation, was demonstrated for factors K1, K7, and K9.
Among the identified weak relationships between the importance of individual factors and the size of the enterprise, the highest value close to 0.2 (indicating a weak tendency for the factor's importance to increase with the increase in the size of the enterprise) was identified for factors K1 and K7. About the degree of implementation, this value was achieved for factor K8.
In turn, the analysis of correlation coefficients dependent on the number of years of operation on the market confirmed that such a correlation does not exist for most factors. The only exception is the correlation value for the assessment of the importance of factor K10. A weak inversely proportional relationship was demonstrated here, i.e. with the increase in the number of years on the market, the awareness of the importance of shaping the company's culture decreases. By the principle of continuous improvement, a directly proportional relationship would be expected.
5. Discussion
Based on the second stage of the research on the diagnosis of the preventive approach in quality management in manufacturing enterprises, it can be stated that for 75% of the respondents, the preventive approach in the represented manufacturing enterprises is implemented at a very satisfactory or satisfactory level, which is 15% lower compared to the first stage of the research, i.e. when the target group consisted of enterprises that systematically manage quality based on the assumptions of the ISO 9001 standard. The presented data undoubtedly indicate the benefits of applying normative requirements in undertaking proactive actions. The authors also identified the most important factors in preventive management, which include maintaining good relations with the environment (K2), skillful selection of suppliers and continuous evaluation of cooperation (K3), improving employee qualifications and improving skills (K7), and ensuring safety and ergonomics at work (K8). In the context of the functioning of enterprises, factors K2 and K3 are external, and K7 and K8 are internal, having a direct and most significant impact on preventive management in enterprises that do not have a quality management system implemented.
Taking into account additionally the basic statistics of the assessment of the importance and degree of implementation of individual factors, it can be stated that two factors were rated the highest among those previously indicated, so they can be treated as priorities, i.e. maintaining good relations with the environment (K2), as well as ensuring safety and ergonomics at work (K8). These are factors that are particularly important from the point of view of mutual understanding of the needs of internal and external stakeholders and the enterprise and building new, strong relationships based on skillful communication of values significant for each of the parties to the relationship. The research also noted an important relationship between factor K7 - improving employee qualifications and improving their skills. It turns out that for this factor, the largest difference between the assessment of its importance and the degree of implementation (by approx. 15%) can be recognized. In this way, a priority factor was established in directing improvement actions towards a preventive approach to quality management.
In contrast, participatory management was found to have relatively low perceived importance and implementation, indicating an important area for further research. Our findings further show that enterprises operating without formal quality management systems demonstrate a lower level of preventive management maturity compared with organizations applying ISO 9001 principles, highlighting the value of systematic quality management in supporting proactive organizational practices.
Due to the inconclusive research results regarding factor K6 – participatory management, the authors recognized the need to undertake in-depth research to identify the reasons for considering this factor irrelevant and not implemented in favor of a preventive approach.
According to the authors, directing management actions towards building mutually beneficial relationships with stakeholders based on common values can be considered an indicator of the readiness of companies to undertake actions toward the concept of Quality 5.0.
6. Conclusions
This study contributes to the growing body of knowledge on Quality 5.0 by identifying the preventive management practices that support organizational readiness for sustainable, human-centered, and proactive management. Based on empirical research conducted among 380 manufacturing enterprises without implemented or certified quality management systems, the findings demonstrate that preventive management is recognized and applied by a majority of respondents, although at a lower level than in organizations operating according to ISO 9001 requirements. This confirms that systematic quality management supports the development of a more mature preventive approach.
The results indicate that maintaining good relationships with the environment, ensuring occupational safety and ergonomics, careful supplier selection and continuous evaluation, and improving employees' qualifications and skills constitute the most important determinants of preventive management. Among these, environmental relations and workplace safety achieved the highest levels of both perceived importance and implementation, emphasizing their strategic role in building organizational resilience and long-term stakeholder value. At the same time, the considerable implementation gap observed for employee development suggests that organizations recognize its importance but require more effective mechanisms to translate this awareness into practice.
The findings also demonstrate that proactive management in the context of Quality 5.0 extends beyond compliance with formal quality standards. It requires balancing external stakeholder expectations with internal organizational capabilities while strengthening relationships based on trust, responsibility, sustainability, and continuous improvement. In this respect, preventive management may be regarded as one of the organizational foundations supporting the transition toward Quality 5.0.
The study provides managers with evidence-based priorities for developing preventive management systems, particularly in enterprises that have not yet implemented formal quality management systems. Focusing on environmental responsibility, employee safety, competence development, and supplier relationship management may significantly enhance organizational preparedness for future Quality 5.0 challenges.
The study is subject to several limitations. The research was conducted exclusively among manufacturing enterprises located in Greater Poland and focused on organizations without certified quality management systems. Furthermore, the study relied on managers' self-assessments collected through CATI interviews, which may introduce subjective bias.
Future research will investigate the reasons for the relatively low importance and implementation of participatory management and examine how leadership styles, organizational culture, and digital transformation influence the adoption of preventive management practices. Comparative studies involving organizations with and without certified quality management systems, as well as international research, could contribute to understanding the role of preventive management in supporting the implementation of the Quality 5.0 concept.
References
- Salimbeni, S.; Redchuk, A.; Rousserie, H. Quality 4.0: technologies and readiness factors in the entire value flow life cycle. Prod. Manuf. Res. 2023, 11(1), 2238797. [Google Scholar] [CrossRef]
- Misztal, A.; Bachorz, S. Quality planning of parts machine production based on housing of cylinder head milling machines. Appl. Mech. Mater. 2014, Vol. 657, 986–990. [Google Scholar] [CrossRef]
- Antony, J.; Sony, M.; Furterer, S.; McDermott, O.; Pepper, M. Quality 4.0 and its impact on organizational performance: an integrative viewpoint. TQM J. 2022, 34(6), 2069–2084. [Google Scholar] [CrossRef]
- Zonnenshain, A.; Kenett, R. S. Quality 4.0—the challenging future of quality engineering. Qual. Eng. 2020, 32(4), 614–626. [Google Scholar] [CrossRef]
- Khan, F. I.; Haddara, M. R. Risk-based maintenance (RBM): A quantitative approach for maintenance/inspection scheduling and planning. J. Loss Prev. Process Ind. 2003, 16(6), 561–573. [Google Scholar] [CrossRef]
- Arsovski, S. Social oriented quality: From Quality 4.0 towards Quality 5.0. Proc. Eng. Sci. 2019, 1(2), 397–404. [Google Scholar] [CrossRef]
- Frick, J.; Grudowski, P. Quality 5.0: A Paradigm Shift Towards Proactive Quality Control in Industry 5.0. Int. J. Bus. Adm. 2023, 14(2), 51–56. [Google Scholar] [CrossRef]
- Stefanovic, M.; Wawak, S.; Popkova, E. G.; Eric, M.; Mitrovic, S.; Djordjevic, A.; Zahar Djordjevic, M. From Quality 4.0 to Quality 5.0: The transition roadmap. Int. J. Qual. Res. 2024, 18(4), 1199–1210. [Google Scholar] [CrossRef]
- Díaz-Martínez, M. A.; Román-Salinas, R. V.; Rivera-García, G. E.; Grande-Ramírez, J. R.; Fuentes-Rubio, Y. A. Quality management in industrial processes: Benefits and challenges of industry 4.0 and its projection towards industry 5.0 - A systematic review. Cogent Eng. 2025, 12(1), 2573853. [Google Scholar] [CrossRef]
- Breque, M.; De Nul, L.; Petridis, A. Industry 5.0: Towards a sustainable, human-centric and resilient European industry; Publications Office of the European Union, 2021. [Google Scholar] [CrossRef] [PubMed]
- Xu, X.; Lu, Y.; Vogel-Heuser, B.; Wang, L. Industry 4.0 and Industry 5.0—Inception, conception and perception. J. Manuf. Syst. 2021, 61. [Google Scholar] [CrossRef]
- Skrzypek, E.; Grudowski, P. Conditions and consequences of quality development – from quality 4.0 to 5.0, Scientific papers of silesian university of technolog. Organ. Manag. 2025, 221, 529–546. [Google Scholar] [CrossRef]
- Macot, M. Corrective/preventive action: Simplified process, ASQ'S 57th Annual Quality Congress Proceedings: Expanding Horizon: Global, Personal, Tools, Networking, Solutions. 2003, 349–357. [Google Scholar]
- Shojaie, A.A.; Kahedi, E. Auto parts manufacturing quality assessment using design for six sigma (DFSS), case study in ISACO company. Int. J. Syst. Assur. Eng. Manag. 2019, 10(1), 35–43. [Google Scholar] [CrossRef]
- Fraser, J. The many faces of quality data. Manag. Autom. 2010, 25(6). [Google Scholar]
- Nahavandi, S. Industry 5.0 - A Human Centric Solution. Sustainability 2019, 11(16), 4371. [Google Scholar] [CrossRef]
- Hardoroudi, A.H.; Dareshuri, A.F.; Sarkan, H.Md.; Nourizadeh, M. Robust Corrective and Preventive Action(CAPA). In 2011 IEEE International Systems Conference (SysCon); 2011; pp. 177–181. [Google Scholar] [CrossRef]
- Kim, E.; Lim, C. Survey of risk-based quality management status and establishment of operational model in clinical trials. Yonsei Med. J. 2020, 61(5), 423–430. [Google Scholar] [CrossRef] [PubMed]
- Arévalo Arévalo, H.A.; Menjura Rojas, E.M.; Barragán Fonseca, K.B.; Vásquez Mejía, S.M. Implementation of the HACCP system for production of Tenebrio molitor larvae meal. Food Control 2022, 138, 109030. [Google Scholar] [CrossRef]
- Özçakmak, S. A model of hazard and risk analysis for bread production and the awareness of food safety. Qual. Assur. Saf. Crops Foods 2019, 11(8), 719–724. [Google Scholar] [CrossRef]
- Banerjee, S. Assessment of the trends and challenges in quality management system/iso-9001:2008/ implementation: The case of agro-food industries in India. Int. J. Adv. Sci. Technol. 2019, 28(17), 542–595. [Google Scholar]
- Klimczak, W. Zarządzanie ryzykiem czy działania zapobiegawcze w systemie zarządzania? Probl. Jakości 2014, 46(2), 16–21. [Google Scholar] [CrossRef]
- Misztal, A.; Belu, N. Model of areas for identifying risks influencing the compliance of technological processes and products. IOP Conf. Ser. Mater. Sci. Eng. 2016, 145(4), 042003. [Google Scholar] [CrossRef]
- Xu, X.; Tang, J.; Pai, Z.; Wang, L. Human-centric manufacturing: Re-thinking, re-justifying, and re-envisioning. J. Manuf. Syst. 2026, 8, 259–268. [Google Scholar] [CrossRef]
- Deleryd, M.; Fundin, A. Towards societal satisfaction in a fifth generation of quality – The sustainability model. Total Qual. Manag. Bus. Excell. 2022, 33, 7–8. [Google Scholar] [CrossRef]
- Ciasullo, M. V.; Ferrara, M. The nexus between sustainability and Industry 5.0: A hybrid systematic review and future research agenda. Glob. Bus. Organ. Excell. 2025, 45(1), 61–79. [Google Scholar] [CrossRef]
- Maljugić, B.; Ćoćkalo, D.; Bakator, M.; Stanisavljev, S. The Role of the Quality Management Process within Society 5.0. Societies 2024, 14(7), 111. [Google Scholar] [CrossRef]
- Fiałkowska-Filipek, M.; Dobrowolska, A. Quality 5.0: Towards sustainable quality improvement in organizations. Ekon. – Wroc. Econ. Rev. 2023, 29(3), 49–61. [Google Scholar] [CrossRef]
- Mazur, A.; Marczewska-Kuźma, R. Assessment of Importance of Conditions and Safety of Work for Shaping Management Image. Procedia Manuf. 2015. [Google Scholar] [CrossRef] [PubMed]
- Jamkhaneh, H.B.; Shahin, A.; Parkouhi, S.V.; Shahin, R. The new concept of quality in the digital era: a human resource empowerment perspective. “TQM Journal” 2022, 34(1), 125–144. [Google Scholar] [CrossRef]
- Catti, P.; Bakopoulos, E.; Stipankov, A.; Cardona, N.; Nikolakis, N.; Alexopoulos, K. Human-centric proactive quality control in Industry 5.0: The critical role of explainable AI . In: 2024 IEEE International Conference on Engineering, Technology, and Innovation (ICE/ITMC); IEEE, 2024. [Google Scholar] [CrossRef]
- Santos, E. M.; Nunes, E. P.; Rodrigues, C. M. Predictive quality in industry 5.0: A paradigm shift in quality management. In Predictive Quality in Industry 5.0; 2024; pp. 317–338. [Google Scholar] [CrossRef]
- Fundin, A.; Lilja, J.; Lagrosen, Y.; Bergquist, B. Quality 2030: quality management for the future. Total Qual. Manag. Bus. Excell. 2020, 36(3–4), 264–280. [Google Scholar] [CrossRef]
- Moreno-Marcial, A. P.; Bueno-García, M. An analysis of Leadership and proactivity to face the challenges of industry 5.0. E3S Web Conf. 2024, 532, 02997. [Google Scholar] [CrossRef]
- Butlewski, M.; Dahlke, G.; Drzewiecka-Dahlke, M.; Hankiewicz, K.; Górny, A.; Gajšek, B. Use of the methodology of network thinking for a fatigue criteria investigation based on the example of mining companies. In Tehnicki Vjesnik; 2020. [Google Scholar] [CrossRef] [PubMed]
- Desai, A.; Mital, A. Managing quality: The transition from reactive to proactive strategies. Int. J. Product. Dev. 2009, 8(1), 63–79. [Google Scholar] [CrossRef]
- Radolov, V. S.; Chaynikov, V. N. From quality to competitiveness: A proactive approach in the industrial development management system. In Proceedings of the PRO series, 2026; pp. 2512–04. [Google Scholar] [CrossRef]
- Krubasik, S.; Dirlea, V.; Kidambi, R.; Sachseneder, C. Quality 4.0: Preventive, holistic, future-proof. Kearney. 2015. Available online: https://www.atkearney.com/industrial-goods-services/article/?/a/quality-4-0-preventive-holistic-future-proof.
- Ezrahovich, A.Y.; Vladimirtsev, A.V.; Livshitz, I.I.; Lontsikh, P.A.; Karaseva, V.A. Risk-based thinking of ISO 9001:2015 - The new methods, approaches and tools of risk management. Proceedings of the 2017 International Conference Quality Management, Transport and Information Security, Information Technologies, (IT and QM and IS0) 2017, Article 8085872, 506–511. [Google Scholar] [CrossRef]
- Ivanov, N. Decision making with visualizations: a cognitive framework for quality management in construction. IOP Conf. Ser. Mater. Sci. Eng. 2020, 869(6), 062002. [Google Scholar] [CrossRef]
- Figge, F. Value-based environmental management. From environmental shareholder value to environmental option value. Corp. Soc. Responsib. Environ. Manag. 2005, 12(1), 19–30. [Google Scholar] [CrossRef]
- Junquera, B.; Del Brío, J.Á. Preventive command and control regulation: A Case Analysis. Sustainability 2016, 8(1), 1–17. [Google Scholar] [CrossRef]
- Katsuki, A.; Miriam, W. The Role of Ambidexterity in Managing Buyer-Supplier Relationships: The Toyota Case. Organ. Sci. 2017, 28(6), 1080–1097. [Google Scholar] [CrossRef]
- Olszewska, B.; Piwoni-Krzeszowska, E. Factors influencing company relations with market stakeholders, in the face of crises in company development. Manag. Prod. Eng. Rev. J. 2014, 5(2), 45–53. [Google Scholar] [CrossRef]
- Salem, M.A.; Shawtari, F.A.; Shamsudin, M.F.; Hussain, H.I. The relation between stakeholders’ integration and environmental competitiveness. Soc. Responsib. J. 2016, 12(4), 755–769. [Google Scholar] [CrossRef]
- Solana-Ibáñez, J.; Caravaca-Garratón, M. Stakeholder engagement and corporate social reputation: The influence of exogenous factors on efficiency performance (stakeholder engagement and exogenous factors. Corp. Soc. Responsib. Environ. Manag. 6 2021, 1–15. [Google Scholar] [CrossRef]
- Walecka, A. Analysis of the relationship between the enterprise and the environment in the context of managing the Relational Capital. Management 2018, 22(2), 25–41. [Google Scholar] [CrossRef]
- Beltrán-Martín, I.; Bou-Llusar, J. C.; Roca-Puig, V.; Escrig-Tena, A. B. The relationship between high-performance work systems and employee proactive behavior: role breadth self-efficacy and flexible role orientation as mediating mechanisms. Hum. Resour. Manag. J. 2017, 27(3), 403–422. [Google Scholar] [CrossRef]
- Biggs, D.M.; Swailes, S.; Baker, S. The measurement of worker relations: the development of a three-component scale. Leadersh. Organ. Dev. J. 2016, 37(1), 2–12. [Google Scholar] [CrossRef]
- Bjerke, R. Towards an HR framework for developing a health-promoting performance culture at work: A Norwegian health care management case study. Int. J. Environ. Res. Public Health 2020, 17(24), 9164. [Google Scholar] [CrossRef] [PubMed]
- Greguras, G. J.; Diefendorff, J. M. Why does proactive personality predict employee life satisfaction and behaviors? A field investigation of the mediating role of the self-concordance model. Pers. Psychol. 2010, 63, 539–560. [Google Scholar] [CrossRef]
- Ladegaard, Y.; Skakon, J.; Elrond, A.F.; Netterstrøm, B. How do line managers experience and handle the return to work of employees on sick leave due to work-related stress? A one-year follow-up study. Disabil. Rehabil. 2019, 41(1), 44–52. [Google Scholar] [CrossRef] [PubMed]
- Sahoo, R.; Sahoo, C.K. Organizational justice, conflict management, and employee relations: The mediating role of the climate of trust. Int. J. Manpow. 2019, 40(4), 783–799. [Google Scholar] [CrossRef]
- Thomas, J.P.; Whitman, D.S.; Viswesvaran, C. Employee proactivity in organizations: A comparative meta-analysis of emergent proactive constructs. J. Occup. Organ. Psychol. 2010, 83(2), 275–300. [Google Scholar] [CrossRef]
- Zhang, J.; Bal, P.M.; Akhtar, M.N.; Long, L.; Zhang, Y.; Ma, Z. High-performance work system and employee performance: the mediating roles of social exchange and thriving and the moderating effect of employee proactive personality. Asia Pac. J. Hum. Resour. 2019, 57(3), 369–395. [Google Scholar] [CrossRef]
- Tadić, D. The Quality 5.0 model in the function of production personalization and user satisfaction. Tehnika 2023, 78(1), 97–102. [Google Scholar] [CrossRef]
- Glevitzky, M.; Glevitzky, I.; Mucea-Ștef, P.; Popa, M. The “Daily Challenge” tool: A practical approach for managing non-conformities in industry. Sustainability 2025, 17(13), 5918. [Google Scholar] [CrossRef]
- Jha, U. C.; Sai, R. J.; Reddy, M. V. B. K.; Singh, A. Analysis of predictive maintenance in Industry 4.0: A review. Int. J. Mech. Eng. 2022, 7, 103–109. [Google Scholar]
- Antonaci, F. G.; Olivetti, E. C.; Marcolin, F.; Castiblanco Jimenez, I. A.; Eynard, B.; Vezzetti, E.; Moos, S. Workplace Well-Being in Industry 5.0: A Worker-Centered systematic review. Sensors 2024, 24(17), 5473. [Google Scholar] [CrossRef] [PubMed]
- Davila-Gonzalez, S.; Martin, S. Human digital twin in Industry 5.0: A holistic approach to worker safety and well-being through advanced AI and emotional analytics. Sensors 2024, 24(2), 655. [Google Scholar] [CrossRef] [PubMed]
- Navarro, G.; Naranjo, G. Quality Culture, Quality Management, and Organizational Performance: A Structural Model for the Manufacturing Sector. Sustainability 2025, 17(9), 3934. [Google Scholar] [CrossRef]
- Abualfaraa, W.; Salonitis, K.; Al-Ashaab, A.; Ala'raj, M. Lean-green manufacturing practices and their link with sustainability: A critical review. Sustainability 2020, 12(3), 981. [Google Scholar] [CrossRef]
- Elemure, I.; Dhakal, H. N.; Leseure, M.; Radulovic, J. Integration of Lean Green and Sustainability in Manufacturing: A Review on Current State and Future Perspectives. Sustainability 2023, 15(13), 10261. [Google Scholar] [CrossRef]
- Vasconcelos, D.C.; Viana, F.E.; Neto, J. de P. Lean and green: thecontribution of lean production and environmental management to the wastereduction. Rev. De Adm. Da UFSM 2019, 12(2), 365–383. [Google Scholar] [CrossRef]
- Siwiec, D.; Pacana, A. A framework for total quality product in life cycle assessment (TQLCA). Res. Eng. Des. 2025, 36(16). [Google Scholar] [CrossRef]
- Chen, C.C.; Khan, A.; Hongsuchon, T.; Ruangkanjanases, A.; Chen, Y.T.; Sivarak, O.; Chen, S.C. The role of corporate social responsibility and corporate image in times of crisis: The mediating role of customer trust. Int. J. Environ. Res. Public Health 2021, 18(16), 8275. [Google Scholar] [CrossRef] [PubMed]
- Misztal, A.; Drzewiecka-Dahlke, M.; Marczewska-Kuźma, R.; Gruszka, J. Identification of leading factors supporting decisions in preventive quality management. Zesz. Nauk. Politech. Śląskiej. Organ. I Zarządzanie 2022, 162, 473–499. [Google Scholar] [CrossRef]
| 1 | The number of enterprises in the national economy registered in REGON, and declaring business activity in section C of PKD (Polskiej Klasyfikacji Działalności: Polish Classification of Economic Activities) – Industrial Processing – valid for 30 VI 2020 |
| 2 | The classification of enterprises into individual groups was made by the Recommendation of the Commission of the European Communities of 6 May 2003 concerning the definition of size [Recommendation of the Commission of the European Communities of 6 May 2003 concerning the definition of micro, small, and medium-sized enterprises (notified under document number C(2003) 1422). Official Journal of the European Union (2003/361/EC)]. |
Figure 1.
Percentage of responses to the question regarding the assessment of the general level of preventive approach in management in manufacturing enterprises. Source: own study.
Figure 1.
Percentage of responses to the question regarding the assessment of the general level of preventive approach in management in manufacturing enterprises. Source: own study.
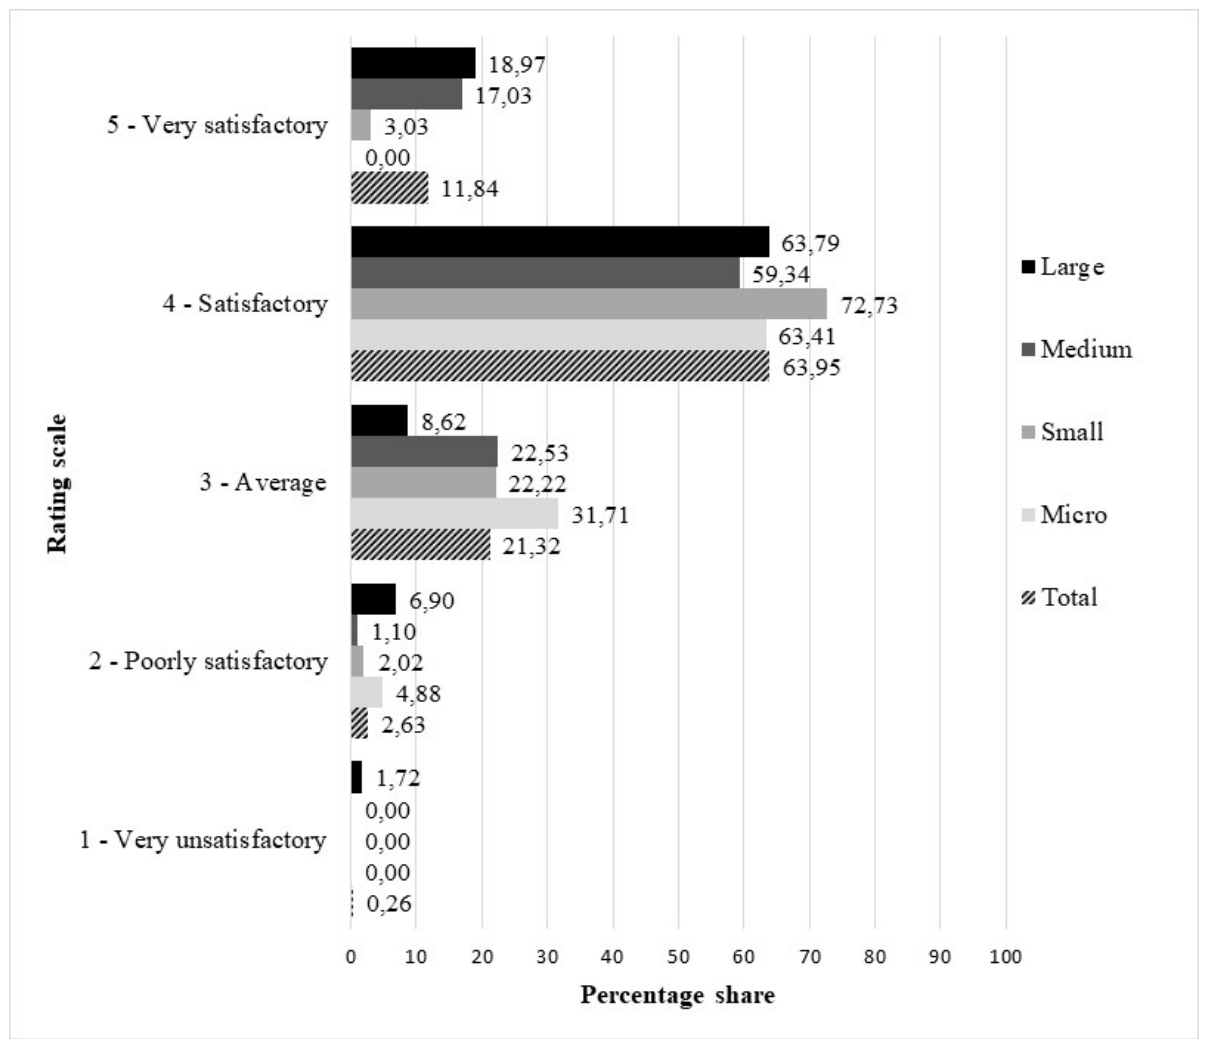
Figure 2.
Graphical presentation of the percentage of responses to the question regarding the assessment of the importance of individual factors (a) and regarding the assessment of the level of their implementation (b) on a 5-point scale. Source: own study.
Figure 2.
Graphical presentation of the percentage of responses to the question regarding the assessment of the importance of individual factors (a) and regarding the assessment of the level of their implementation (b) on a 5-point scale. Source: own study.
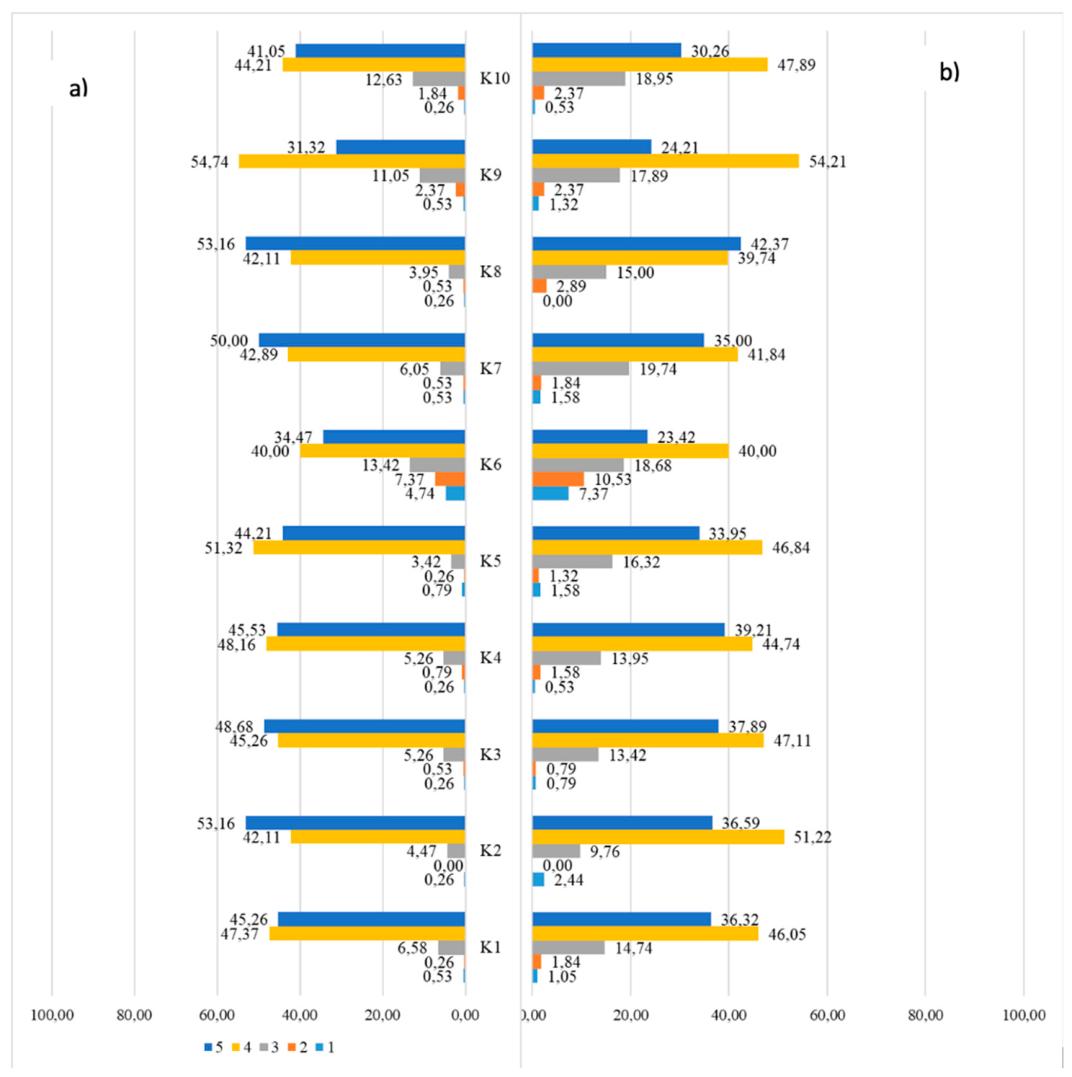
Figure 3.
Variability of assessments of the importance of K1-K10 criteria around the median, taking into account the size of the enterprise. Source: own study.
Figure 3.
Variability of assessments of the importance of K1-K10 criteria around the median, taking into account the size of the enterprise. Source: own study.
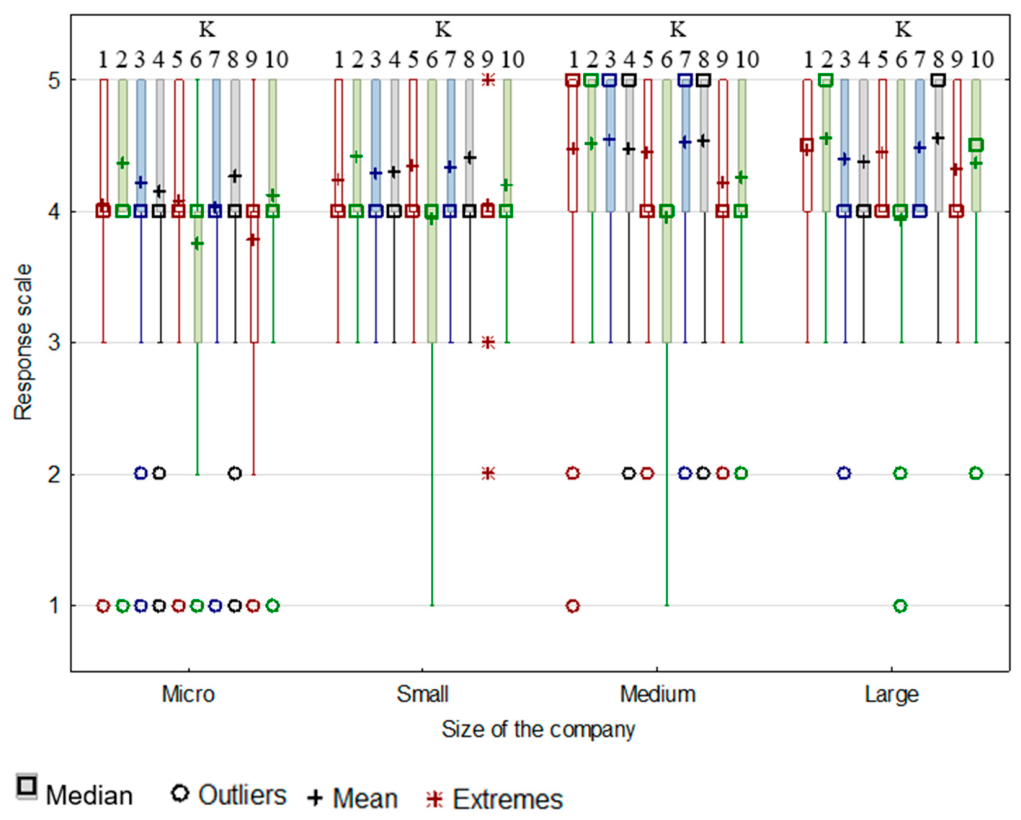
Figure 4.
Variability of assessments of the implementation of the K1-K10 criteria, taking into account the size of the enterprise. Source: own study.
Figure 4.
Variability of assessments of the implementation of the K1-K10 criteria, taking into account the size of the enterprise. Source: own study.
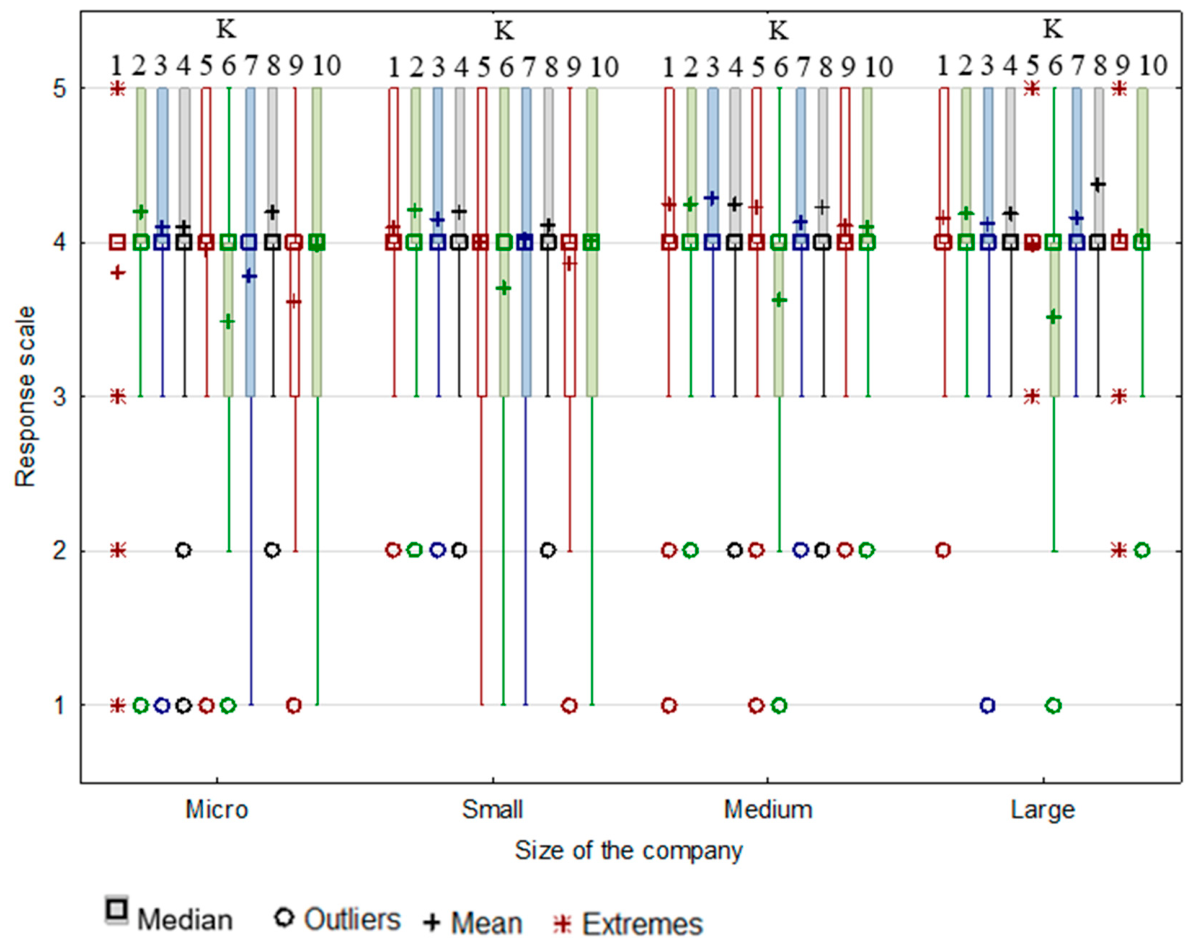

Table 1.
Structure of population and research sample.
| Stage I of the research – companies with implemented QMS | Stage II of the research – companies without implemented QMS | ||||||
| Number of companies | Percentage share in the population | Total number | Calculated sample size* | Research sample size | Percentage share of the research sample | ||
| Companies | Micro | 53 | 10,77 | 32 917 | 40,93 | 41 | 10,79 |
| Small | 128 | 26,02 | 2 693 | 98,86 | 99 | 26,05 | |
| Medium | 236 | 47,97 | 762 | 182,28 | 182 | 47,89 | |
| Large | 75 | 15,24 | 177 | 57,93 | 58 | 15,26 | |
| Total | 492 | 100,00 | 36 549 | 380 | 380 | 100,00 | |
Source: own work. * The size of the research sample was determined adequately to the percentage structure of enterprises from the first stage of the research. The premise of this decision was to enable comparison of results achieved in both groups of entities.
Table 2.
Result of analysis of importance and level of realization of social factors of preventive approach.
Table 2.
Result of analysis of importance and level of realization of social factors of preventive approach.
| Importance assessment for each factor | Factor | Realization assessment for each factor | ||||||||
| Percentage of responses sorted by scale [%] | Percentage of responses sorted by scale [%] | |||||||||
| 1 | 2 | 3 | 4 | 5 | 1 | 2 | 3 | 4 | 5 | |
| 0,53 | 0,26 | 6,58 | 47,37 | 45,26 | K1 Constant monitoring of interested parties | 1,05 | 1,84 | 14,74 | 46,05 | 36,32 |
| 0,26 | 0,00 | 4,47 | 42,11 | 53,16 | K2 Maintaining good relations with the client | 2,44 | 0,00 | 9,76 | 51,22 | 36,59 |
| 0,26 | 0,53 | 5,26 | 45,26 | 48,68 | K3 Skillful selection of suppliers and continuous evaluation of cooperation | 0,79 | 0,79 | 13,42 | 47,11 | 37,89 |
| 0,26 | 0,79 | 5,26 | 48,16 | 45,53 | K4 Consistent pursuit of the set goals | 0,53 | 1,58 | 13,95 | 44,74 | 39,21 |
| 0,79 | 0,26 | 3,42 | 51,32 | 44,21 | K5 Selection of employees based on their competencies | 1,58 | 1,32 | 16,32 | 46,84 | 33,95 |
| 4,74 | 7,37 | 13,42 | 40,00 | 34,47 | K6 Participatory management | 7,37 | 10,53 | 18,68 | 40,00 | 23,42 |
| 0,53 | 0,53 | 6,05 | 42,89 | 50,00 | K7 Raising employee qualifications and improving their skills | 1,58 | 1,84 | 19,74 | 41,84 | 35,00 |
| 0,26 | 0,53 | 3,95 | 42,11 | 53,16 | K8 Ensuring safety and ergonomics at work | 0,00 | 2,89 | 15,00 | 39,74 | 42,37 |
| 0,53 | 2,37 | 11,05 | 54,74 | 31,32 | K9 Leading employees | 1,32 | 2,37 | 17,89 | 54,21 | 24,21 |
| 0,26 | 1,84 | 12,63 | 44,21 | 41,05 | K10 Shaping the culture of the company | 0,53 | 2,37 | 18,95 | 47,89 | 30,26 |
Źródło/Source: own work.
Table 3.
Basic statistics regarding the assessment of the importance and degree of implementation of individual factors.
Table 3.
Basic statistics regarding the assessment of the importance and degree of implementation of individual factors.
| Importance assessment for each factor | Factor | Realization assessment for each factor | ||||||||
| Descriptive statistics | Descriptive statistics | |||||||||
| mean | median | mode | mode frequency | standard deviation | mean | median | mode | mode frequency | standard deviation | |
| 4,37 | 4,00 | 4 | 180,00 | 0,67 | K1 Constant monitoring of interested parties | 4,15 | 4,00 | 4 | 175,00 | 0,81 |
| 4,48 | 5,00 | 5 | 202,00 | 0,61 | K2 Maintaining good relations with the client | 4,22 | 4,00 | 4 | 179,00 | 0,73 |
| 4,42 | 4,00 | 5 | 185,00 | 0,64 | K3 Skillful selection of suppliers and continuous evaluation of cooperation | 4,21 | 4,00 | 4 | 179,00 | 0,76 |
| 4,38 | 4,00 | 4 | 183,00 | 0,65 | K4 Consistent pursuit of the set goals | 4,21 | 4,00 | 4 | 170,00 | 0,78 |
| 4,38 | 4,00 | 4 | 195,00 | 0,64 | K5 Selection of employees based on their competencies | 4,10 | 4,00 | 4 | 178,00 | 0,83 |
| 3,92 | 4,00 | 4 | 152,00 | 1,09 | K6 Participatory management | 3,62 | 4,00 | 4 | 152,00 | 1,17 |
| 4,41 | 4,50 | 5 | 190,00 | 0,68 | K7 Raising employee qualifications and improving their skills | 4,07 | 4,00 | 4 | 159,00 | 0,87 |
| 4,47 | 5,00 | 5 | 202,00 | 0,63 | K8 Ensuring safety and ergonomics at work | 4,22 | 4,00 | 5 | 161,00 | 0,80 |
| 4,14 | 4,00 | 4 | 208,00 | 0,74 | K9 Leading employees | 3,98 | 4,00 | 4 | 206,00 | 0,80 |
| 4,24 | 4,00 | 4 | 168,00 | 0,76 | K10 Shaping the culture of the company | 4,05 | 4,00 | 4 | 182,00 | 0,80 |
Źródło/Source: own work.
Table 4.
Correlation of the importance and degree of implementation of factors K1-K10 with the size of the enterprise.
Table 4.
Correlation of the importance and degree of implementation of factors K1-K10 with the size of the enterprise.
| Importance assessment for each factor | Factors | Realization assessment for each factor | ||
| Correlation coefficients with the size of the company | Correlation coefficients with the number of years the company has been operating on the market | Correlation coefficients with the size of the company | Correlation coefficients with the number of years the company has been operating on the market | |
| 0,206911 | -0,012401 | K1 Constant monitoring of interested parties | 0,125004 | 0,016184 |
| 0,100054 | -0,068034 | K2 Maintaining good relations with the client | 0,009246 | 0,006070 |
| 0,134237 | -0,065025 | K3 Skillful selection of suppliers and continuous evaluation of cooperation | 0,037351 | -0,014468 |
| 0,130404 | 0,028867 | K4 Consistent pursuit of the set goals | 0,036523 | 0,007777 |
| 0,154994 | -0,044824 | K5 Selection of employees based on their competencies | 0,057672 | -0,008660 |
| 0,034410 | -0,001881 | K6 Participatory management | -0,011179 | 0,003851 |
| 0,198024 | -0,019395 | K7 Raising employee qualifications and improving their skills | 0,117379 | 0,047803 |
| 0,138202 | -0,002000 | K8 Ensuring safety and ergonomics at work | 0,199308 | 0,017456 |
| 0,082191 | -0,013313 | K9 Leading employees | 0,173275 | 0,079865 |
| 0,086419 | -0,127880 | K10 Shaping the culture of the company | 0,035219 | 0,043373 |
Źródło/Source: own work.
Disclaimer/Publisher’s Note: The statements, opinions and data contained in all publications are solely those of the individual author(s) and contributor(s) and not of MDPI and/or the editor(s). MDPI and/or the editor(s) disclaim responsibility for any injury to people or property resulting from any ideas, methods, instructions or products referred to in the content. |
© 2026 by the authors. Licensee MDPI, Basel, Switzerland. This article is an open access article distributed under the terms and conditions of the Creative Commons Attribution (CC BY) license (http://creativecommons.org/licenses/by/4.0/).
Copyright: This open access article is published under a Creative Commons CC BY 4.0 license, which permit the free download, distribution, and reuse, provided that the author and preprint are cited in any reuse.