Preprint
Article

This version is not peer-reviewed.

Biochar and Mycorrhiza Modulate Potato Growth in Irrigated Soil Conditions

Submitted:

12 August 2026

Posted:

13 August 2026

You are already at the latest version

Abstract

Arbuscular mycorrhizal fungi (AMF) and biochar may improve crop growth in drought-prone sandy soils, but their interactive effects under different water regimes remain unclear. We investigated their effects on potato growth and nutrient uptake under water deficit. A semi-field rainout-shelter experiment was conducted in Denmark using low-phosphorus (P) sandy soil (Olsen P: 18.3 mg kg−1), unamended (BC−) or amended with wheat-straw biochar (BC+). Potato plants were grown without (M−) or with Rhizophagus irregularis inoculation (M+) and irrigated at three soil water thresholds (75, 50, and 25% of field capacity). Biochar increased P and nitrogen (N) uptake and tuber biomass, with biomass gains strongly correlated with nutrient uptake. Under high irrigation, BC+M+ increased tuber biomass, P uptake, and N uptake by 55, 73, and 32%, respectively, compared with BC−M−. Without biochar, AMF did not increase nutrient uptake and reduced tuber biomass. AMF root colonization and its soil lipid biomarker were affected by water deficit, with responses also associated with soil pH and P availability. Overall, adequate water availability was critical for realizing the benefits of combined biochar and AMF application in low-P sandy soil.
Keywords: 
;  ;  ;  ;  ;  ;  ;  

1. Introduction

Potato (Solanum tuberosum L.) is a major crop typically grown on sandy soils inherently characterized with low water and nutrients holding capacity [1] in a world facing human population growth [2]. Simultaneously, climate change increases frequency, duration, and severity of agricultural drought i.e., soil water deficit [3], even in humid regions where the crop thrives well [4,5,6]. Irrigation is required to ensure sustainable production [7,8,9], also partly due to potato’s sparse root system growing to 50-60 cm depth [10,11].
Deficit irrigation- a water management strategy where crops are intentionally given less water than their potential (evapo-)transpiration- has been shown to increase water use efficiency of potato plants [7,12]. Deficit of 20-25% [12,13] produced similar or even higher potato yield compared to full irrigation [7]. However, other studies have found that deficit irrigation reduced total biomass and tuber yields [9,14]. Decline of leaf area was observed [8,9] when available soil water was below 60% of field capacity [15], and the lower limit for irrigation while maintaining tuber yield was suggested as 80% of crop evapotranspiration [13]. Therefore, uncertainties in deficit irrigation call for complementary agronomic strategies targeting the root zone such as roots symbiosis with arbuscular mycorrhizal fungi (AMF) [16], biochar [17], or both.
The AMF induces modifications in the rhizosphere soil condition [18] and in the water- and nutrient transport environment, due to the mycelium [19], supplying the plants with phosphorus (P) and nitrogen (N) [20,21], and in return, the plants supplies carbon (C) to the AMF [22]. The AM influence on growth of potatoes varies and Velivelli, Kromann [16] evaluated isolates of mycorrhizal inoculants which increased yield of potato under field condition with conventional chemical fertilization. Black and Tinker [23] found AMF to increase tuber yield only in absence of P fertilization, but Liu, Ravnskov [24] found significantly increased biomass of potato under P fertilization and full irrigation. The AMF effect on potato growth could be either due to AMF facilitated plant nutrients uptake [24], or increased potato susceptibility to AMF by P starvation [25]. However, a study also reported low AMF abundance to negligibly affect yield gain of potato [26].
Biochar on the other hand increases the water holding capacity of sandy soils due to its high surface area and large micro- and meso-porosity [27,28]. Studies investigating interaction of biochar and AMF show positive [29,30,31], neutral [32], or negative results [33]. Biochar could act as a physical growth matrix for AMF [30,31], and also the biochar itself is a nutrient source [30], but it mostly alters soil microorganism groups [29]. Green-waste biochar did not significant influence potato growth [34], however, Liu, Liu [35] reported wood biochar to reduce the biomass of AM potato plants grown in a low-P soil as result of decreased P and N uptake. Due to its sparse root system, potato crops are susceptible to P deficiency [36]. This situation may be worsened by low soil water content, occurring when deficit irrigation regimes are imposed, which hamper P transport from soil to root [35]. However, the interacting effects of AMF and biochar remain poorly understood, particularly under varying water availability. More detailed knowledge of both crop responses and associated soil variables is needed to elucidate the mechanisms underlying their individual and combined effects on crop performance.
The objectives of this study were to evaluate the responses of potato growth to soil amended with biochar and AMF inoculation under different irrigation levels. We quantified soil nutrient status, water consumption, nutrient uptake and yield of potato under well-controlled semifield conditions. We also hypothesize that (i) biochar increases growth of potato via altered soil water and nutrient status under water deficit; (ii) combined biochar and AMF inoculation may improve plant water and nutrient uptake, especially under low irrigation level; and (iii) biochar effect on AMF root colonization will differ between irrigation levels.

2. Materials and Methods

2.1. Semifield Experiment Description

A randomized three-factor experiment with potato (cv. Sava) was conducted under semi-field conditions from 12 July to 22 September 2017. The first factor was biochar applied at 1.5% soil dry weight (BC+) or without biochar (BC−). The second was AMF inoculation with a diatomite carrier (M+) or carrier without AMF spores (M−), applied before planting. The third factor was irrigation, initiated when soil water content reached 75%, 50%, or 25% of field capacity, for high, medium, or low, respectively, and replenished to 90% of field capacity. Each treatment was replicated three times, resulting in 36 pots.
The cylindrical pots (height: 40cm, diameter: 29.5 cm) were filled with 25 kg soil or also 375 g biochar to height of 34-36 cm. All pots were irrigated to 90% of soil water holding capacity two weeks before planting after biochar incorporation, to ensure that eventual release of toxic gases (e.g., ethylene) from fresh biochar [37] had ceased. Potato tubers were planted in the middle of the pots by removing a soil with an auger (height: 8 cm, diameter: 15 cm), planting the mother tuber and then refill the removed soil column into the pot to the originally layer. The potato plants emerged around 8 days after planting (DAP) and from there only a single shoot from each plant was allowed to grow in each pot. After thinning, the single shoot was passed through a hole in a plastic sheet, which covered the soil surface to prevent potential transport of microbes from outside and influence of late blight pesticide use on AMF in the soil. During precipitation events, an automated rain shelter controlled by a rain sensor covered the area. The fertilizer, consisting of in total 1.35 g N (15.85% NO3, 9.00% NH4), 1.62 g K (KCl), 0.27 g S, and 0.14 g Mg (MgSO4 7 H2O), was applied to each pot, split in two applications. During the whole growth season, the pesticide Revus (205 g mandipropamid per liter) was sprayed weekly to prevent potato late blight infections by Phytophthora infestance.

2.2. Biochar and Soil Properties

The biochar was produced at the UK Biochar Research Center from wheat straw pellets at 550 ℃. The basic properties of biochar are: surface area 26.4 m2 g-1, C 68.26%, N 1.39%, P 0.14%, K 1.56% (w/w), pH 9.94. The sandy loam was typical agricultural soil collected from Foulumgaard in Denmark (56.5 N, 9.6 E), then sieved through 1 cm mesh and mixed with 1/3 sand in volume, with total C 9.27 g kg-1, total N 0.66 g kg-1, Olsen P 1.9 g kg-1, water soluble P 2.85 mg kg-1, pH 5.43 in 1 M KCl.

2.3. Sterilization and AMF Inoculation

To eliminate microbes, the biochar and the soil were heated separately in an oven to a 80 °C for 48 h twice, with a 24 h interval. Sterilization of pots was done in two steps: (1) washing with soap and water, and (2) immersing in 2% (w/v) NaOCl for 3 min, each procedure followed by rinsing in tap water. The same sterilization procedure was applied to other equipment. Potato mother tubers were sterilized by immersed in 10% H2O2 for 10 min, and rinsed thoroughly with deionized water before pre-germinated [38]. The AMF product contained 1000 spores of Rhizophagus irregularis in 1 g powder of diatomite (carrier), and same weight of diatomite without spores were ordered from Symbiom Ltd. (Czech Republic). 1 g AM inoculum or 1 g clean diatomite for M+/M- pots was evenly mixed with the soil column (height: 15 cm, diameter: 10 cm) in the middle of the pot, 3 cm below the surface, respectively. Wetted potatoes were coated with 1 g inoculum [Rhizophagus irregularis (M+) or AMF free diatomite (M-)] on surface 1 day before planting.

2.4. Sampling and Measurement

After biochar and AMF application, two 40-cm Time Domain Reflectometry (TDR) rods, spaced 6 cm apart and positioned 8 cm from the pot centre, were installed vertically in each pot. Soil water content was measured at least weekly using a TDR-100 system (Campbell, UT, USA) connected to a handheld computer with in-house software. Irrigation volume (W, L) was calculated after each measurement as W = V × (θpθa), where V is pot soil volume (L), θp is the target water content (0.9 × θfc), θfc is field capacity (measured as 20.1% v/v), and θa is the measured volumetric water content.
At harvest (73 DAP), shoots were cut at the soil surface, tubers collected, and roots washed from the soil. Roots were cut into 1–2 cm sections, mixed, and a 1-g fresh subsample was cleared in water at 90 °C for 14 min and stained with 5% blue ink at 90 °C for 7 min. After washing, roots were stored in 90% glycerol [39] and distributed on an 11-cm Petri dish with 15 observation sites. AMF colonization was assessed at ×20 magnification by counting root intersections containing AM hyphae, vesicles, or arbuscules relative to total root intersections. Total root length was estimated as R = πNA/2H, where N is the number of root-line intersections, A is the Petri dish area, and H is the total length of observation lines [40].
Stems, leaves, tubers, and remaining roots were weighed separately after drying at 70 °C for 72 h. Dried samples were finely ground and analyzed for total N using a LECO CNS-1000 analyzer (LECO Corp., St. Joseph, MI, USA) according to ISO 13878, and for total P by inductively coupled plasma optical emission spectrometry (ICP-OES; iCAP 6600, Thermo Fisher Scientific, Waltham, MA, USA).
Soil inorganic N (NH4-N and NO3-N) was extracted from 10 g soil with 1 M KCl and determined by flow colorimetry (AutoAnalyzer III, Bran + Luebbe GmbH, Norderstedt, Germany). Water-soluble P was extracted from 1 g soil and determined spectrometrically [41]. Soil pH was determined in 1 M KCl by PHM210 standard pH meter.
Neutral Lipid Fatty Acids (NLFAs) were extracted and analysed based on the method by Frostegård, Tunlid [42]. Concisely, 3.0 g soil was utilized for lipids extraction via chloroform:methanol:citrate buffer (1:2:0.8 v/v/v). The extracted lipids were separatedinto neutral lipids, glycolipids, and phospholipid fatty acids on silica acid columns. The neutral lipids were methylated using 0.2 M KOH in methanol and separated on a gas chromatograph (6890N, Agilent, USA) equipped with a flame ionization detector. Peak areas were quantified by adding methyl nonadecanoate fatty acid (19:0) as the internal standard before the methylation step. NLFA 16:1ω5 was used as an indicator of AMF biomass [43].

2.5. Statistic Analysis

Analyses of Variance (ANOVA) was conducted with the agricolae package [44] in R studio (R v. 3.1.1). Prior to ANOVA, homogeneity of variances was tested with Barlett’s test and normal distribution of residuals was assessed with Shapiro-Wilk’s test, followed by log transformation when residuals were not normally distributed. The responses of measured parameters to biochar, AMF inoculation, and irrigation, and their interactions were tested with one-, two-, or three-way ANOVA, separately. Multiple comparisons of means were carried out using Turkey’s HSD at 0.05 level of significance. Linear regression analyses were performed using SigmaPlot software.

3. Results

3.1. Arbuscular Mycorrhizal Fungi Colonization

Biochar significantly decreased AMF hyphal colonization, while medium irrigation increased it by 53% compared with low irrigation. A significant biochar × irrigation interaction was observed (Table 1): irrigation affected hyphal colonization without biochar (BC−), but not with biochar (BC+). Also, low irrigation significantly decreased AMF vesicle colonization by 40% compared with high irrigation. Biochar increased vesicle colonization under high and low irrigation but had the opposite effect under medium irrigation. Similarly, AMF arbuscule colonization increased with biochar under medium irrigation but did not differ significantly under high and low irrigation, reflecting a significant biochar × irrigation interaction (Table 1). Total AMF root and hyphal colonization showed similar responses to biochar, irrigation, and their interaction as vesicle colonization. NLFA 16:1ω5 decreased with biochar application but increased under medium irrigation, with a significant biochar × irrigation interaction. However, the biochar-induced decrease depended on irrigation level, as biochar did not significantly reduce NLFA 16:1ω5 under high or low irrigation (Table 1).

3.2. Effects on Soil Properties

Soil NO3-N decreased with biochar, AMF, and high irrigation (Table 2; Figure 1a). However, NO3-N did not differ between BC− and BC+ irrespective of AMF inoculation. A significant AMF × irrigation interaction showed that AMF decreased NO3-N only under low irrigation, while three-way biochar × AMF × irrigation interaction increased NO3-N under low irrigation. NH4-N showed similar responses to biochar, AMF, and irrigation as NO3-N, with significant two- and three-way interactions (Table 2; Figure 1b). Biochar had no effect on NH4-N under medium irrigation. The three-way interaction increased NH4-N with biochar in M+ treatments but decreased it in M− treatments under low irrigation (Figure 1).
Water-soluble P increased with biochar and decreased with AMF and under medium and low compared with high irrigation. However, AMF did not decrease P in BC+ treatments due to a biochar × AMF interaction. The three-way interaction resulted in decreased P with AMF in BC+ treatments under low irrigation (Table 2; Figure 1c). Soil pH increased with biochar and low irrigation but decreased with AMF. The irrigation-induced increase was significant only in BC+ treatments, reflecting a biochar × irrigation interaction. However, AMF increased pH in BC− treatments under high and low irrigation, resulting in a three-way interaction (Figure 1d).

3.3. Effects on Plant Properties

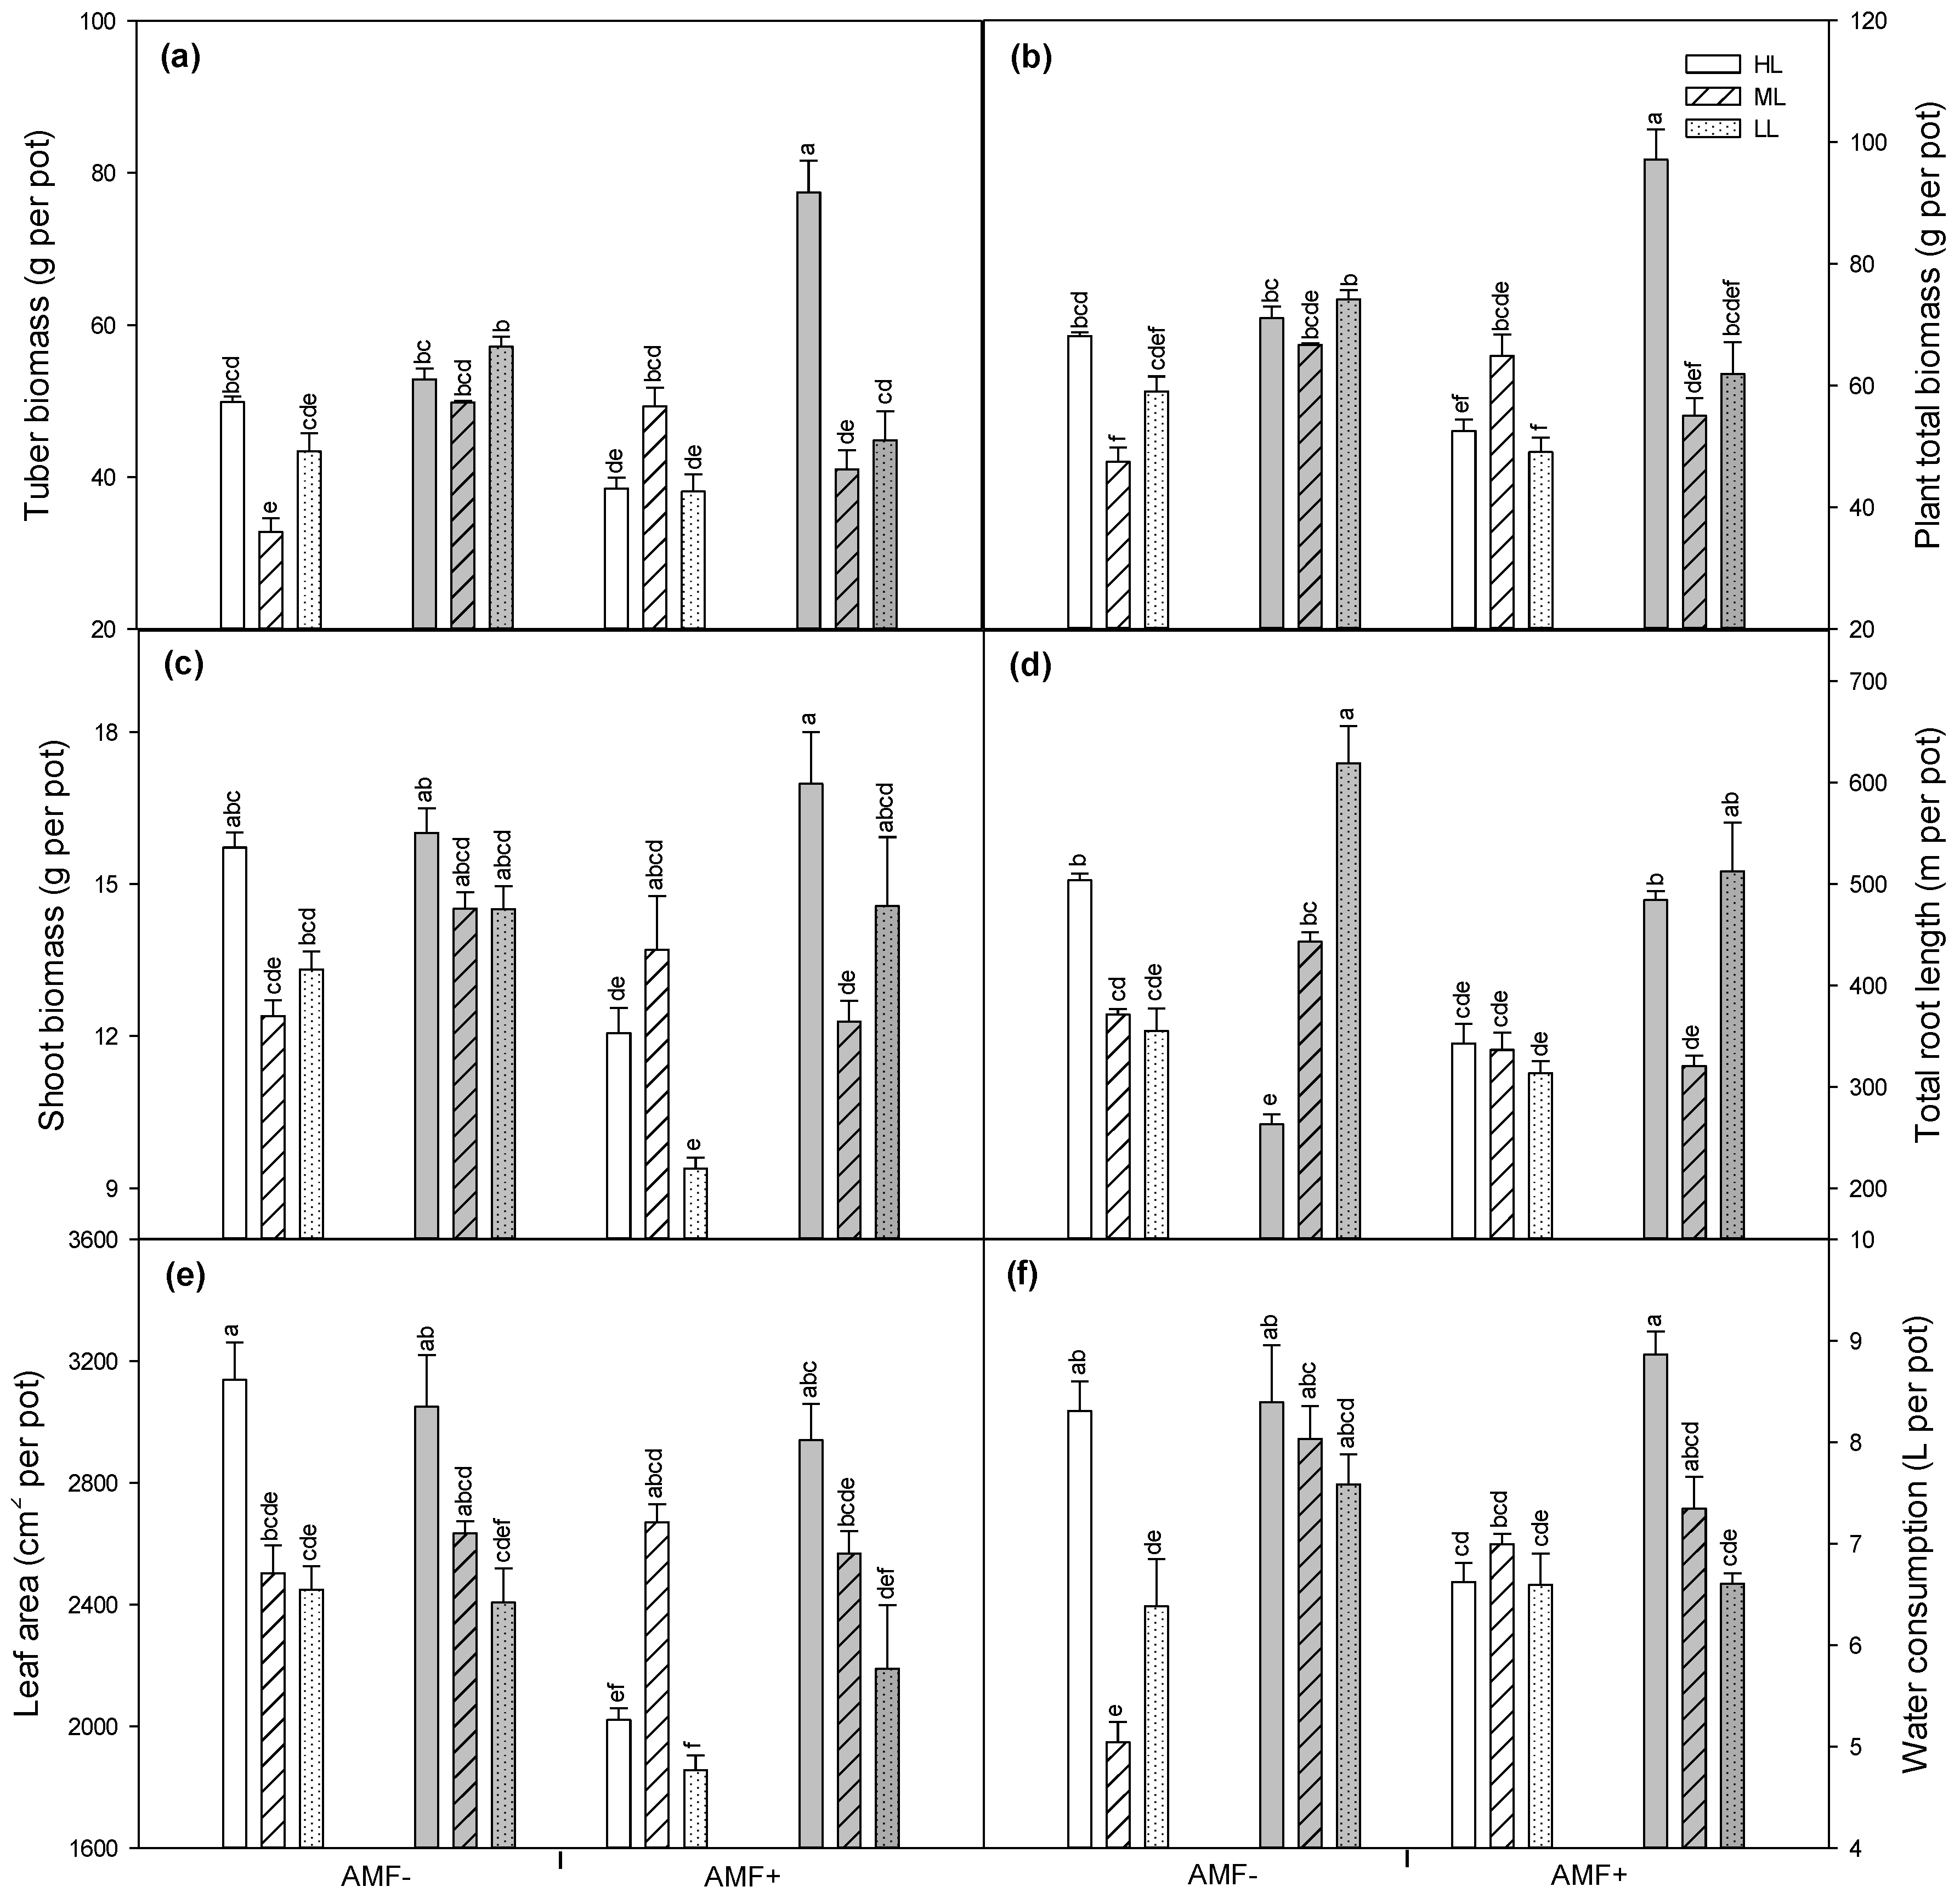
Tuber biomass increased by 28% with BC+ compared with BC− and was higher under high than medium and low irrigation (Table 2; Figure 2a). The biochar-induced increase was absent under medium irrigation, resulting in a biochar × irrigation interaction. Although AMF had no significant main effect, an AMF × irrigation interaction occurred, with AMF increasing tuber biomass under high irrigation. This increase was significant only in BC+, resulting in a significant biochar × AMF × irrigation interaction.
Biochar increased shoot biomass, whereas AMF decreased it, and low irrigation reduced shoot biomass compared with high irrigation. However, biochar significantly increased shoot biomass only in M+ treatments under high and low irrigation, contributing to the three-way interaction (Table 2; Figure 2c).
Biochar, AMF, and irrigation significantly affected total root length, which increased with BC+ but decreased with M+. Low irrigation reduced root length compared with medium irrigation. The biochar-induced increase was significant only in M+ and under low irrigation. Two- and three-way interactions were also observed, with root length decreasing in M+ under low irrigation and in M+BC+ under medium irrigation (Table 2; Figure 2d).
Biochar increased leaf area, whereas AMF and low irrigation decreased it (Table 2; Figure 2e). The AMF-induced decrease was significant in BC− but not BC+, indicating a biochar × AMF interaction, and was not significant under medium or low irrigation. A significant three-way interaction was also observed, with neither biochar nor AMF significantly affecting leaf area under medium irrigation.

3.4. Crop Water Consumption

Similarly to the effects on leaf area, crop water consumption increased at BC+ compared with BC- (Figure 2f), and at high compared to medium and low irrigation levels (Figure 2f). Although no effect of AMF inoculation on water consumption was found, there was significant two-way interaction, with reduced water consumption at AMF inoculation and medium irrigation (Table 2, Figure 2f). In addition, increased water consumption also occurred at BC+ and M- treatments under medium irrigation and M+ under high irrigation (Table 2, Figure 2f).

3.5. Crop Nutrients Uptake

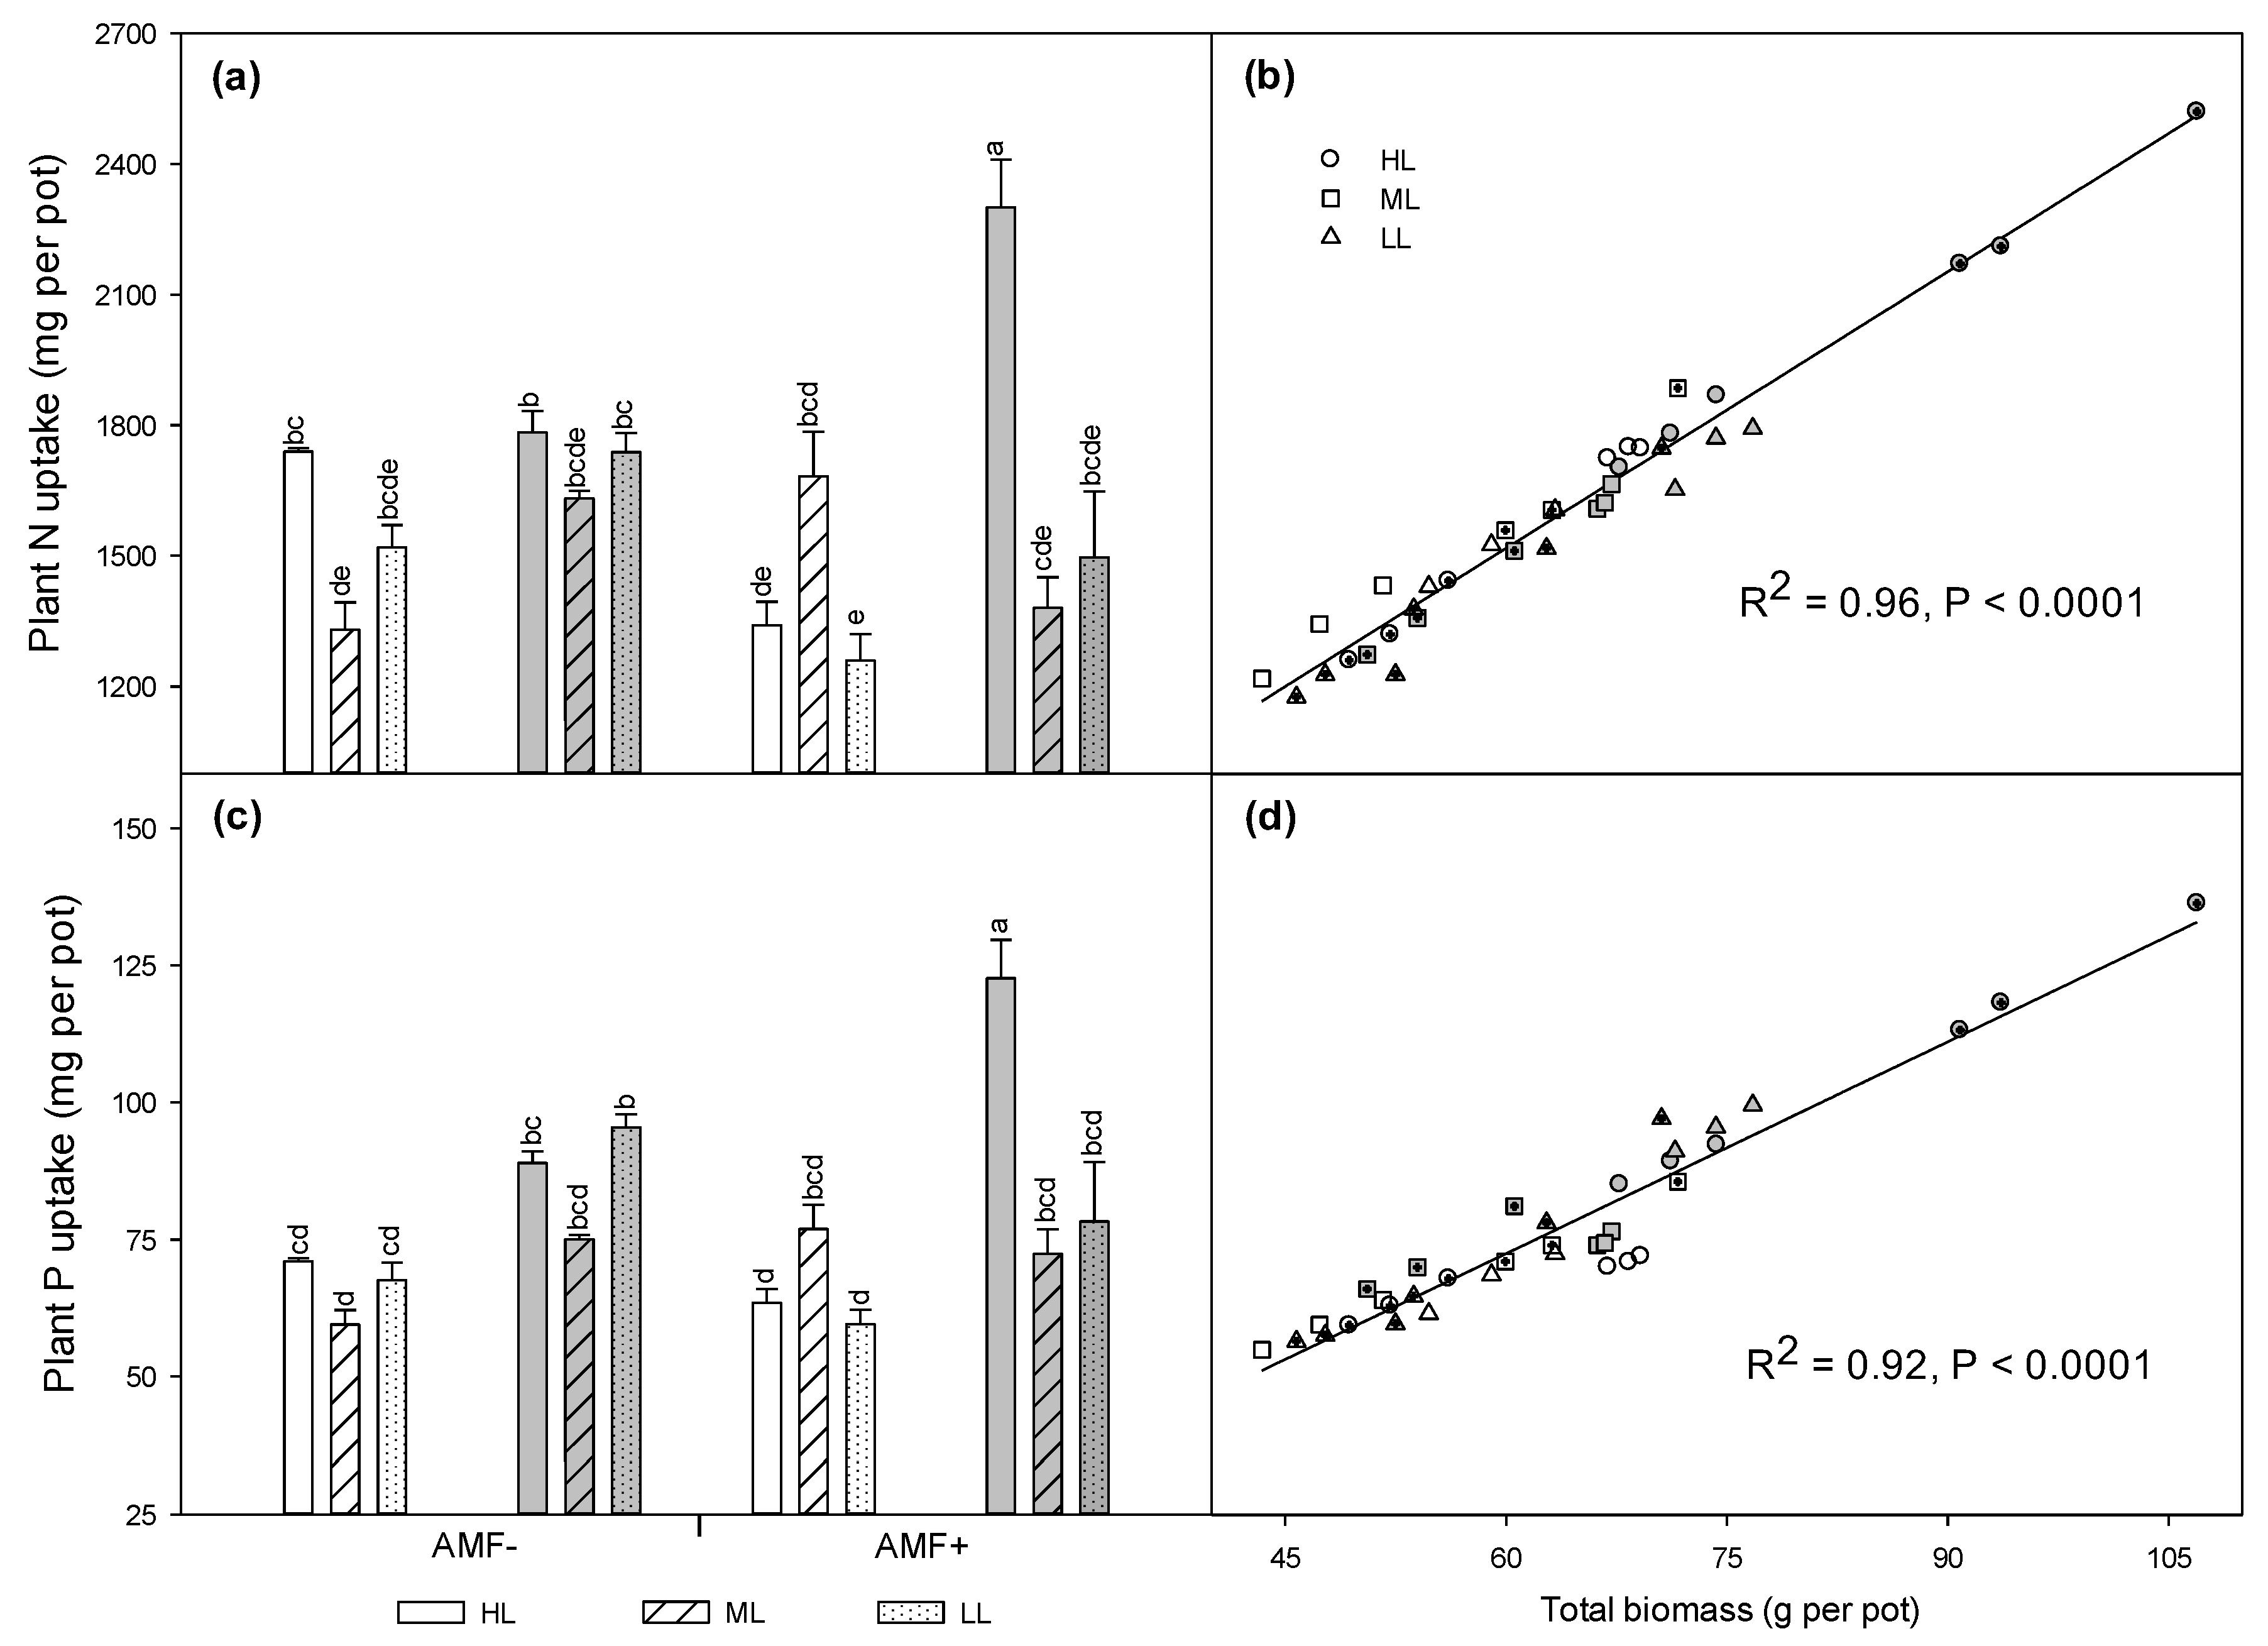
Both biochar and irrigation significantly increased total crop N uptake (Table 2, Figure 3a) but increase related to biochar was not significant at medium and low irrigation levels. No significant effect also for AMF inoculation on total N uptake, but a two-way interaction and AMF inoculation showed a tendency to increase total N uptake at high and medium irrigation level, while decreased it at low irrigation level (Figure 3a). Furthermore, there was also significant three-way interaction and biochar increased total N uptake significantly at M+ and high irrigation level (Table 2, Figure 3a). Finally, tight positive correlations between total N uptake and total biomass weight (R2=0.96, P<0.001) as well as between total P uptake and total biomass weight (R2=0.92, P<0.001) were found (Figure 3b,d).

4. Discussion

Biochar generally increased potato N and P uptake and biomass, supporting the first hypothesis. The combined benefits of biochar and AMF occurred only under high irrigation, while AMF alone did not significantly affect N or P uptake, providing only partial support for the second hypothesis. Biochar also affected AMF root colonization differently across irrigation levels, supporting the third hypothesis that water availability modulates AMF responses.

4.1. Soil Properties and Plant Nutrients Uptake Affected by Biochar, Arbuscular Mycorrhiza Fungi and Irrigation

Biochar increased soil pH and water-soluble P. Each pot received 1.35 g N, equivalent to nearly 200 kg N ha−1 and within the 125–200 kg N ha−1 range considered optimal for potato [45,46]. Potato N content often exceeded applied N, while residual soil N was inversely related to plant uptake, suggesting that N availability did not limit growth. Continued nitrification also suggests survival or re-establishment of nitrifying microorganisms after soil sterilization. Moreover, BC+ did not reduce N uptake, indicating limited immobilization of N by labile biochar C.
Mass flow and diffusion govern soil NO3 and NH4+ transport; therefore, adequate soil moisture can enhance crop N acquisition [35]. Accordingly, high irrigation generally increased potato N uptake. Under high irrigation and BC+, AMF further increased N uptake, possibly because AM mycelia can acquire and transfer N forms less accessible to roots [20,47], including NH4+ [48]. This may also explain the lower residual soil NH4+ (Table 2; Figure 1b). In contrast, without biochar, AMF reduced N uptake under high irrigation, potentially reflecting fungal N retention [49,50]. Further studies tracing N fluxes through roots and AM mycelia are needed to clarify these interactions across biochar and irrigation treatments.
Biochar-induced increases in soil pH may also have enhanced P availability according to Fixen and Bruulsema [36]. Initial Olsen P was only 18.3 mg P kg−1 soil, below the suggested 33 mg P kg−1 soil for optimal potato growth. Under this low-P condition [24], AMF alone did not enhance P acquisition [51]., as indicated by similar P uptake in M+ and M− plants. However, under high irrigation, P uptake increased when biochar and AMF were combined, suggesting that biochar-derived P or increased P availability supported AMF-mediated P acquisition [30]. This agrees with previous findings that AMF enhanced plant P uptake under adequate water supply but not under water deficit [24]. Under medium and low irrigation, AMF did not affect P uptake, likely because reduced soil moisture restricted P transport to root and mycorrhizal surfaces [52].

4.2. Integrative Effect of Biochar, Arbuscular Mycorrhiza Fungi and Irrigation on Plant Growth and Production

Potato biomass was significantly correlated with both N and P uptake, with slightly stronger relationship for N based on the R2 values (Figure 3). However, because soil N was sufficient while P was limiting, N uptake likely followed biomass accumulation, whereas growth was primarily constrained by P availability and uptake [53]. Accordingly, the combination of high irrigation, biochar, and AMF produced the highest tuber yield and total biomass, suggesting that biochar-derived P, adequate water supply, and AMF-mediated P acquisition jointly favored potato growth. Biochar generally increased biomass, while irrigation effects were less pronounced, except for increasing leaf area. Overall, growth responses to biochar, AMF, and irrigation were closely associated with plant P and N uptake.
Low irrigation significantly reduced leaf area compared with high irrigation, consistent with previous studies [8,9]. An exception occurred in M+ plants without biochar (BC−), where leaf area did not differ between high and low irrigation. This may indicate competition between AMF and the host plant for P under BC- [19], might exist. Biochar counteracted this response, possibly by increasing nutrient availability to the AMF–plant system [30,54].
Root responses depended strongly on biochar, AMF, and irrigation. Without AMF, biochar decreased root length under high irrigation but increased it under low irrigation, possibly because improved water retention supported greater root exploration during soil drying. Without biochar, medium and low irrigation reduced root length, consistent with Lahlou and Ledent [55]. With AMF, biochar increased root length under both high and low irrigation. Under high irrigation, this response may reflect improved P acquisition, for which greater soil exploration by roots is important [56]. Under low irrigation, biochar may have improved nutrient and water availability, reducing competition between AMF and the host plant [30,54], Further research should quantify carbon allocation between potato and AMF to clarify how biochar and water availability regulate the costs and benefits of this symbiosis.

4.3. The Role of Arbuscular Mycorrhiza Fungi Under Biochar and Irrigation

AMF responses to biochar depended not only on soil pH but also on soil water status and P availability. Across the three irrigation levels, biochar increased or decreased AMF colonization and soil NLFA 16:1ω5 depending on water availability. Changes in root colonization closely corresponded with NLFA 16:1ω5, a sensitive indicator of soil AMF abundance [43]. Without biochar, medium irrigation significantly increased vesicle abundance, AMF root colonization, and NLFA 16:1ω5. This response may reflect increased plant dependence on AMF under moderate water and P limitation [25] caused by low soil P status and water deficit associated decrease in soil P availability [52], as soil P plays a key role in the symbiosis between plants and AMF [57]. Increased vesicle formation may also represent greater fungal storage under stress [57]. In contrast, severe water deficit reduced AMF root colonization, consistent with evidence that both insufficient and excessive soil moisture can restrict AMF development [58,59].
Biochar effects on AMF may arise from changes in soil pH and nutrient availability, including nutrients supplied or adsorbed by biochar [30,54,60]. Consistent with Mickan, Abbott [32], biochar did not significantly affect total AMF root colonization under high irrigation, although vesicle abundance increased. Greater soil moisture and associated P availability may reduce plant dependence on AMF for P acquisition [61] or development in anaerobic conditions [62], potentially shifting fungal allocation from nutrient-exchange structures such as arbuscules toward storage structures such as vesicles [63].
Overall, the contrasting AMF responses across irrigation treatments cannot be explained by soil pH alone. Soil pH was lower under high irrigation than under medium and low irrigation, whereas AMF colonization differed among these water regimes despite similar pH under medium and low irrigation. This indicates that soil moisture and associated changes in P availability interact with biochar-induced changes in soil properties to regulate AMF colonization and functioning.

5. Conclusions

In conclusion, biochar, AMF inoculation, and irrigation, as well as their interactions, affected potato growth, soil properties, and plant nutrient uptake. Under low soil P, crop biomass was strongly correlated with P uptake. Overall, N and P uptake in AMF-inoculated plants was comparable to non-mycorrhizal plants but increased when AMF was combined with biochar under high irrigation. This response may be related to biochar-derived P and its effects on soil P availability and plant P acquisition. Further research is needed to determine the soil P conditions that promote AMF-mediated P uptake by potatoes. The highest potato biomass under combined biochar, AMF inoculation, and high irrigation highlights the importance of adequate water availability for realizing the potential agronomic benefits of biochar–AMF interactions. Future studies could integrate soil-moisture and nutrient sensors, UAV or satellite remote sensing, and process-based or data-driven models to monitor crop water and nutrient status and support precision management of irrigation, biochar, and AMF.

Supplementary Materials

The following supporting information can be downloaded at the website of this paper posted on Preprints.org. Figure S1: title; Table S1: title; Video S1: title.

Author Contributions

Conceptualization, Q.Y., S.R. and M.N.A.; methodology, Q.Y., S.R. and M.N.A; software, Q.Y.; validation, Q.Y., K.M., S.R., S.N. and M.N.A.; formal analysis, Q.Y.; investigation, Q.Y., K.M., S.R., S.N. and M.N.A.; resources, Q.Y.; data curation, Q.Y.; writing—original draft preparation, Q.Y.; writing—review and editing, Q.Y., K.M., S.R., S.N. and M.N.A; visualization, Q.Y. and K.M.; supervision, K.M., S.R. and M.N.A; project administration, Q.Y., K.M. and M.N.A.; funding acquisition, Q.Y. and M.N.A. All authors have read and agreed to the published version of the manuscript.

Funding

This research was partially funded by China Scholarship Council, grant number 201607940004, and S.C Van Fonden, grant number 1709.

Data Availability Statement

The data presented in this study are available on request from the corresponding and the first author due to institutional data-sharing policies.

Conflicts of Interest

The authors declare no conflicts of interest.

Acknowledgments

We thank the China Scholarship Council for the support of this research. We also extend our appreciation to the colleagues at the semi-field facility for support with the experimental infrastructure.

Abbreviations

The following abbreviations are used in this manuscript:
AMF Arbuscular mycorrhizal fungi
BC Biochar
M Rhizophagus irregularis inoculation
N Nitrogen
P Phosphorus

References

  1. Zhou, Z.; et al. Yield and crop growth of table potato affected by different split-N fertigation regimes in sandy soil. Eur. J. Agron. 2018, 92, 41–50. [Google Scholar] [CrossRef]
  2. Devaux, A.; Kromann, P.; Ortiz, O. Potatoes for sustainable global food security. Potato Res. 2014, 57(3), 185–199. [Google Scholar] [CrossRef]
  3. Allen, C.D.; et al. A global overview of drought and heat-induced tree mortality reveals emerging climate change risks for forests. For. Ecol. Manag. 2010, 259(4), 660–684. [Google Scholar] [CrossRef]
  4. Zhang, P.; et al. Physiological and Growth Responses of Potato (Solanum Tuberosum L.) to Air Temperature and Relative Humidity under Soil Water Deficits. Plants 2022, 11(9), 1126. [Google Scholar] [CrossRef] [PubMed]
  5. Salehi-Soghadi, Z.; et al. Transpiration Efficiency of Some Potato Genotypes under Drought. Agronomy 2023, 13(4), 996. [Google Scholar] [CrossRef]
  6. Peng, J.; et al. Agro-environmental profile of potato cultivation under water and nitrogen managements – A case study in Denmark. Eur. J. Agron. 2026, 172, 127874. [Google Scholar] [CrossRef]
  7. Shahnazari, A.; et al. Effects of partial root-zone drying on yield, tuber size and water use efficiency in potato under field conditions. Field Crops Res. 2007, 100(1), 117–124. [Google Scholar] [CrossRef]
  8. Liu, F.; et al. Effects of deficit irrigation (DI) and partial root drying (PRD) on gas exchange, biomass partitioning, and water use efficiency in potato. Sci. Hortic. 2006, 109(2), 113–117. [Google Scholar] [CrossRef]
  9. Zin El-Abedin, T.K.; et al. Comparative effects of two water-saving irrigation techniques on soil water status, yield, and water use efficiency in potato. Sci. Hortic. 2017, 225, 525–532. [Google Scholar] [CrossRef]
  10. Ahmadi, S.H.; et al. Effects of irrigation strategies and soils on field grown potatoes: Root distribution. Agric. Water Manag. 2011, 98(8), 1280–1290. [Google Scholar] [CrossRef]
  11. Opena, G.B.; Porter, G.A. Soil Management and Supplemental Irrigation Effects on Potato: II. Root Growth. Agron. J. 1999, 91, 426–431. [Google Scholar] [CrossRef]
  12. Kifle, M.; Gebretsadikan, T.G. Yield and water use efficiency of furrow irrigated potato under regulated deficit irrigation, Atsibi-Wemberta, North Ethiopia. Agric. Water Manag. 2016, 170, 133–139. [Google Scholar] [CrossRef]
  13. Badr, M.; El-Tohamy, W.; Zaghloul, A. Yield and water use efficiency of potato grown under different irrigation and nitrogen levels in an arid region. Agric. Water Manag. 2012, 110, 9–15. [Google Scholar] [CrossRef]
  14. Sun, Y.; Cui, X.; Liu, F. Effect of irrigation regimes and phosphorus rates on water and phosphorus use efficiencies in potato. Sci. Hortic. 2015, 190, 64–69. [Google Scholar] [CrossRef]
  15. Weisz, R.; Kaminski, J.; Smilowitz, Z. Water deficit effects on potato leaf growth and transpiration: Utilizing fraction extractable soil water for comparison with other crops. Am. Potato J. 1994, 71(12), 829–840. [Google Scholar] [CrossRef]
  16. Velivelli, S.L.S.; et al. Identification of mVOCs from Andean Rhizobacteria and Field Evaluation of Bacterial and Mycorrhizal Inoculants on Growth of Potato in its Center of Origin. 2015, 69(3), 652–667. [Google Scholar] [CrossRef] [PubMed]
  17. Abel, S.; et al. Impact of biochar and hydrochar addition on water retention and water repellency of sandy soil. Geoderma 2013, 202, 183–191. [Google Scholar] [CrossRef]
  18. Augé, R.M. Water relations, drought and vesicular-arbuscular mycorrhizal symbiosis. Mycorrhiza 2001, 11(1), 3–42. [Google Scholar] [CrossRef]
  19. Smith, S.E.; Smith, F.A. Fresh perspectives on the roles of arbuscular mycorrhizal fungi in plant nutrition and growth. Mycologia 2012, 104(1), 1–13. [Google Scholar] [CrossRef] [PubMed]
  20. Hodge, A.; Fitter, A.H. Substantial nitrogen acquisition by arbuscular mycorrhizal fungi from organic material has implications for N cycling. Proc. Natl. Acad. Sci. 2010, 107(31), 13754–13759. [Google Scholar] [CrossRef] [PubMed]
  21. Smith, F.A.; Smith, S.E. What is the significance of the arbuscular mycorrhizal colonisation of many economically important crop plants? Plant Soil 2011, 348, 63–79. [Google Scholar] [CrossRef]
  22. Parniske, M. Arbuscular mycorrhiza: the mother of plant root endosymbioses. Nat. Rev. Microbiol. 2008, 6, 763. [Google Scholar] [CrossRef] [PubMed]
  23. Black, R.L.B.; Tinker, P.B. Interaction between effects of vesicular–arbuscular mycorrhiza and fertiliser phosphorus on yields of potatoes in the field. Nature 1977, 267, 510. [Google Scholar] [CrossRef]
  24. Liu, C.; et al. Arbuscular mycorrhizal fungi alleviate abiotic stresses in potato plants caused by low phosphorus and deficit irrigation/partial root-zone drying. J. Agric. Sci. 2018, 156(1), 46–58. [Google Scholar] [CrossRef]
  25. McArthur, D.; Knowles, N.R. Influence of Vesicular-Arbuscular Mycorrhizal Fungi on the Response of Potato to Phosphorus Deficiency. Plant Physiol. 1993, 101(1), 147–160. [Google Scholar] [CrossRef] [PubMed]
  26. Loján, P.; et al. Potato field-inoculation in Ecuador with Rhizophagus irregularis: no impact on growth performance and associated arbuscular mycorrhizal fungal communities. Symbiosis 2017, 73(1), 45–56. [Google Scholar] [CrossRef]
  27. Joseph, S.; Lehmann, J. Biochar for environmental management: science, technology and implementation. In Biochar for environmental management: an introduction; London Earthscan, 2009. [Google Scholar]
  28. Atkinson, C.J.; Fitzgerald, J.D.; Hipps, N.A. Potential mechanisms for achieving agricultural benefits from biochar application to temperate soils: a review. Plant Soil 2010, 337(1-2), 1–18. [Google Scholar] [CrossRef]
  29. Luo, S.; et al. Long-term biochar application influences soil microbial community and its potential roles in semiarid farmland. Appl. Soil Ecol. 2017, 117-118, 10–15. [Google Scholar] [CrossRef]
  30. Hammer, E.C.; et al. A mycorrhizal fungus grows on biochar and captures phosphorus from its surfaces. Soil Biol. Biochem. 2014, 77, 252–260. [Google Scholar] [CrossRef]
  31. Han, Y.; Douds, J.D.D.; Boateng, A.A. Effect of biochar soil-amendments on Allium porrum growth and arbuscular mycorrhizal fungus colonization. J. Plant Nutr. 2016, 39(11), 1654–1662. [Google Scholar] [CrossRef]
  32. Mickan, B.S.; et al. Interactions between biochar and mycorrhizal fungi in a water-stressed agricultural soil. Mycorrhiza 2016, 26(6), 565–574. [Google Scholar] [CrossRef] [PubMed]
  33. George, C.; et al. Divergent consequences of hydrochar in the plant–soil system: Arbuscular mycorrhiza, nodulation, plant growth and soil aggregation effects. Appl. Soil Ecol. 2012, 59, 68–72. [Google Scholar] [CrossRef]
  34. Upadhyay, K.P.; et al. The Influence of Biochar on Growth of Lettuce and Potato. J. Integr. Agric. 2014, 13(3), 541–546. [Google Scholar] [CrossRef]
  35. Liu, C.; et al. Impact of wood biochar and its interactions with mycorrhizal fungi, phosphorus fertilization and irrigation strategies on potato growth. J. Agron. Crop Sci. 2017, 203(2), 131–145. [Google Scholar] [CrossRef]
  36. Fixen, P.E.; Bruulsema, T.W. Potato Management Challenges Created by Phosphorus Chemistry and Plant Roots. Am. J. Potato Res. 2014, 91(2), 121–131. [Google Scholar] [CrossRef]
  37. Spokas, K.A.; Baker, J.M.; Reicosky, D.C. Ethylene: Potential key for biochar amendment impacts. Plant Soil 2010, 333(1-2), 443–452. [Google Scholar] [CrossRef]
  38. Wenke, L. N, P contribution and soil adaptability of four arbuscular mycorrhizal fungi. Acta Agric. Scand. Sect. B–Soil Plant Sci. 2008, 58(3), 285–288. [Google Scholar] [CrossRef]
  39. Vierheilig, H.; et al. Ink and vinegar, a simple staining technique for arbuscular-mycorrhizal fungi. Appl. Environ. Microbiol. 1998, 64(12), 5004–5007. [Google Scholar] [CrossRef] [PubMed]
  40. Newman, E.I. A Method of Estimating the Total Length of Root in a Sample. J. Appl. Ecol. 1966, 3(1), 139–145. [Google Scholar] [CrossRef] [PubMed]
  41. Sissingh, H. Analytical technique of the Pw method, used for the assessment of the phosphate status of arable soils in the Netherlands. Plant Soil 1971, 34(1), 483–486. [Google Scholar] [CrossRef]
  42. Frostegård, Å.; Tunlid, A.; Bååth, E. Microbial biomass measured as total lipid phosphate in soils of different organic content. J. Microbiol. Methods 1991, 14(3), 151–163. [Google Scholar] [CrossRef]
  43. Olsson, P.A. Signature fatty acids provide tools for determination of the distribution and interactions of mycorrhizal fungi in soil. FEMS Microbiol. Ecol. 1999, 29(4), 303–310. [Google Scholar] [CrossRef]
  44. Mendiburu, F.d. Agricolae: Statistical Procedures for Agricultural Research. 2016; R package version 1.2-4. Available online: https://CRAN.R-project.org/package=agricolae.
  45. CRAAQ, Fertilisation reference guide, 2nd ed.; Centre de Références en Agriculture et Agroalimentaire du Québec, 2010.
  46. NBDAFA, <italic>Crop fertilization guide</italic>. 2001: New Brunswick Dept, Agriculture, Fisheries and Aquaculture.
  47. Leigh, J.; Hodge, A.; Fitter, A.H. Arbuscular mycorrhizal fungi can transfer substantial amounts of nitrogen to their host plant from organic material. New Phytol. 2009, 181(1), 199–207. [Google Scholar] [CrossRef] [PubMed]
  48. López-Pedrosa, A.; et al. GintAMT1 encodes a functional high-affinity ammonium transporter that is expressed in the extraradical mycelium of Glomus intraradices. Fungal Genet. Biol. 2006, 43(2), 102–110. [Google Scholar] [CrossRef] [PubMed]
  49. Corrêa, A.; et al. Shedding light onto nutrient responses of arbuscular mycorrhizal plants: Nutrient interactions may lead to unpredicted outcomes of the symbiosis. Plant Sci. 2014, 221-222, 29–41. [Google Scholar] [CrossRef] [PubMed]
  50. Nouri, E.; et al. Phosphorus and Nitrogen Regulate Arbuscular Mycorrhizal Symbiosis in Petunia hybrida. PLoS ONE 2014, 9(3), e90841. [Google Scholar] [CrossRef] [PubMed]
  51. Smith, S.E.; Smith, F.A.; Jakobsen, I. Functional diversity in arbuscular mycorrhizal (AM) symbioses: the contribution of the mycorrhizal P uptake pathway is not correlated with mycorrhizal responses in growth or total P uptake. New Phytol. 2004, 162(2), 511–524. [Google Scholar] [CrossRef]
  52. Schachtman, D.P.; Reid, R.J.; Ayling, S.M. Phosphorus Uptake by Plants: From Soil to Cell. Plant Physiol. 1998, 116(2), 447. [Google Scholar] [CrossRef] [PubMed]
  53. Fernandes, Sun. !!! INVALID CITATION !!! 2015. [Google Scholar] [PubMed]
  54. Yamato, M.; et al. Effects of the application of charred bark of Acacia mangium on the yield of maize, cowpea and peanut, and soil chemical properties in South Sumatra, Indonesia. Soil Sci. Plant Nutr. 2006, 52(4), 489–495. [Google Scholar] [CrossRef]
  55. Lahlou, O.; Ledent, J.-F. Root mass and depth, stolons and roots formed on stolons in four cultivars of potato under water stress. Eur. J. Agron. 2005, 22(2), 159–173. [Google Scholar] [CrossRef]
  56. Richardson, A.E.; et al. Acquisition of phosphorus and nitrogen in the rhizosphere and plant growth promotion by microorganisms. Plant Soil 2009, 321(1), 305–339. [Google Scholar] [CrossRef]
  57. Smith, S.E.; Read, D.J. Mycorrhizal Symbiosis; Springer: Berlin, 2010. [Google Scholar]
  58. Abbaspour, H.; et al. Tolerance of Mycorrhiza infected Pistachio (Pistacia vera L.) seedling to drought stress under glasshouse conditions. J. Plant Physiol. 2012, 169(7), 704–709. [Google Scholar] [CrossRef] [PubMed]
  59. Anuradha, J.H.A.; Tripathi, A.S.A.K. V. D. Effect of soil moisture on growth and arbuscular mycorrhizal colonization of crops and tree seedlings in alfisol. Indian Phytopathol. 2010, 63(4), 411–417. [Google Scholar]
  60. Coughlan, A.P. Soil pH-induced changes in root colonization, diversity, and reproduction of symbiotic arbuscular mycorrhizal fungi from healthy and declining maple forests. Can. J. For. Res. 2000, 30(10), 1543–1554. [Google Scholar] [CrossRef]
  61. Tuheteru, F.D.; Wu, Q. Arbuscular Mycorrhizal Fungi and Tolerance of Waterlogging Stress in Plants, in Arbuscular Mycorrhizas and Stress Tolerance of Plants; Wu, Q.-S., Ed.; Springer Singapore: Singapore, 2017; pp. 43–66. [Google Scholar]
  62. Orchard, S.; et al. The response of fine root endophyte (Glomus tenue) to waterlogging is dependent on host plant species and soil type. 2016, 403(1), 305–315. [Google Scholar] [CrossRef]
  63. García, I.; Mendoza, R.; Pomar, M.C. Deficit and excess of soil water impact on plant growth of Lotus tenuis by affecting nutrient uptake and arbuscular mycorrhizal symbiosis. Plant Soil 2008, 304(117). [Google Scholar] [CrossRef]
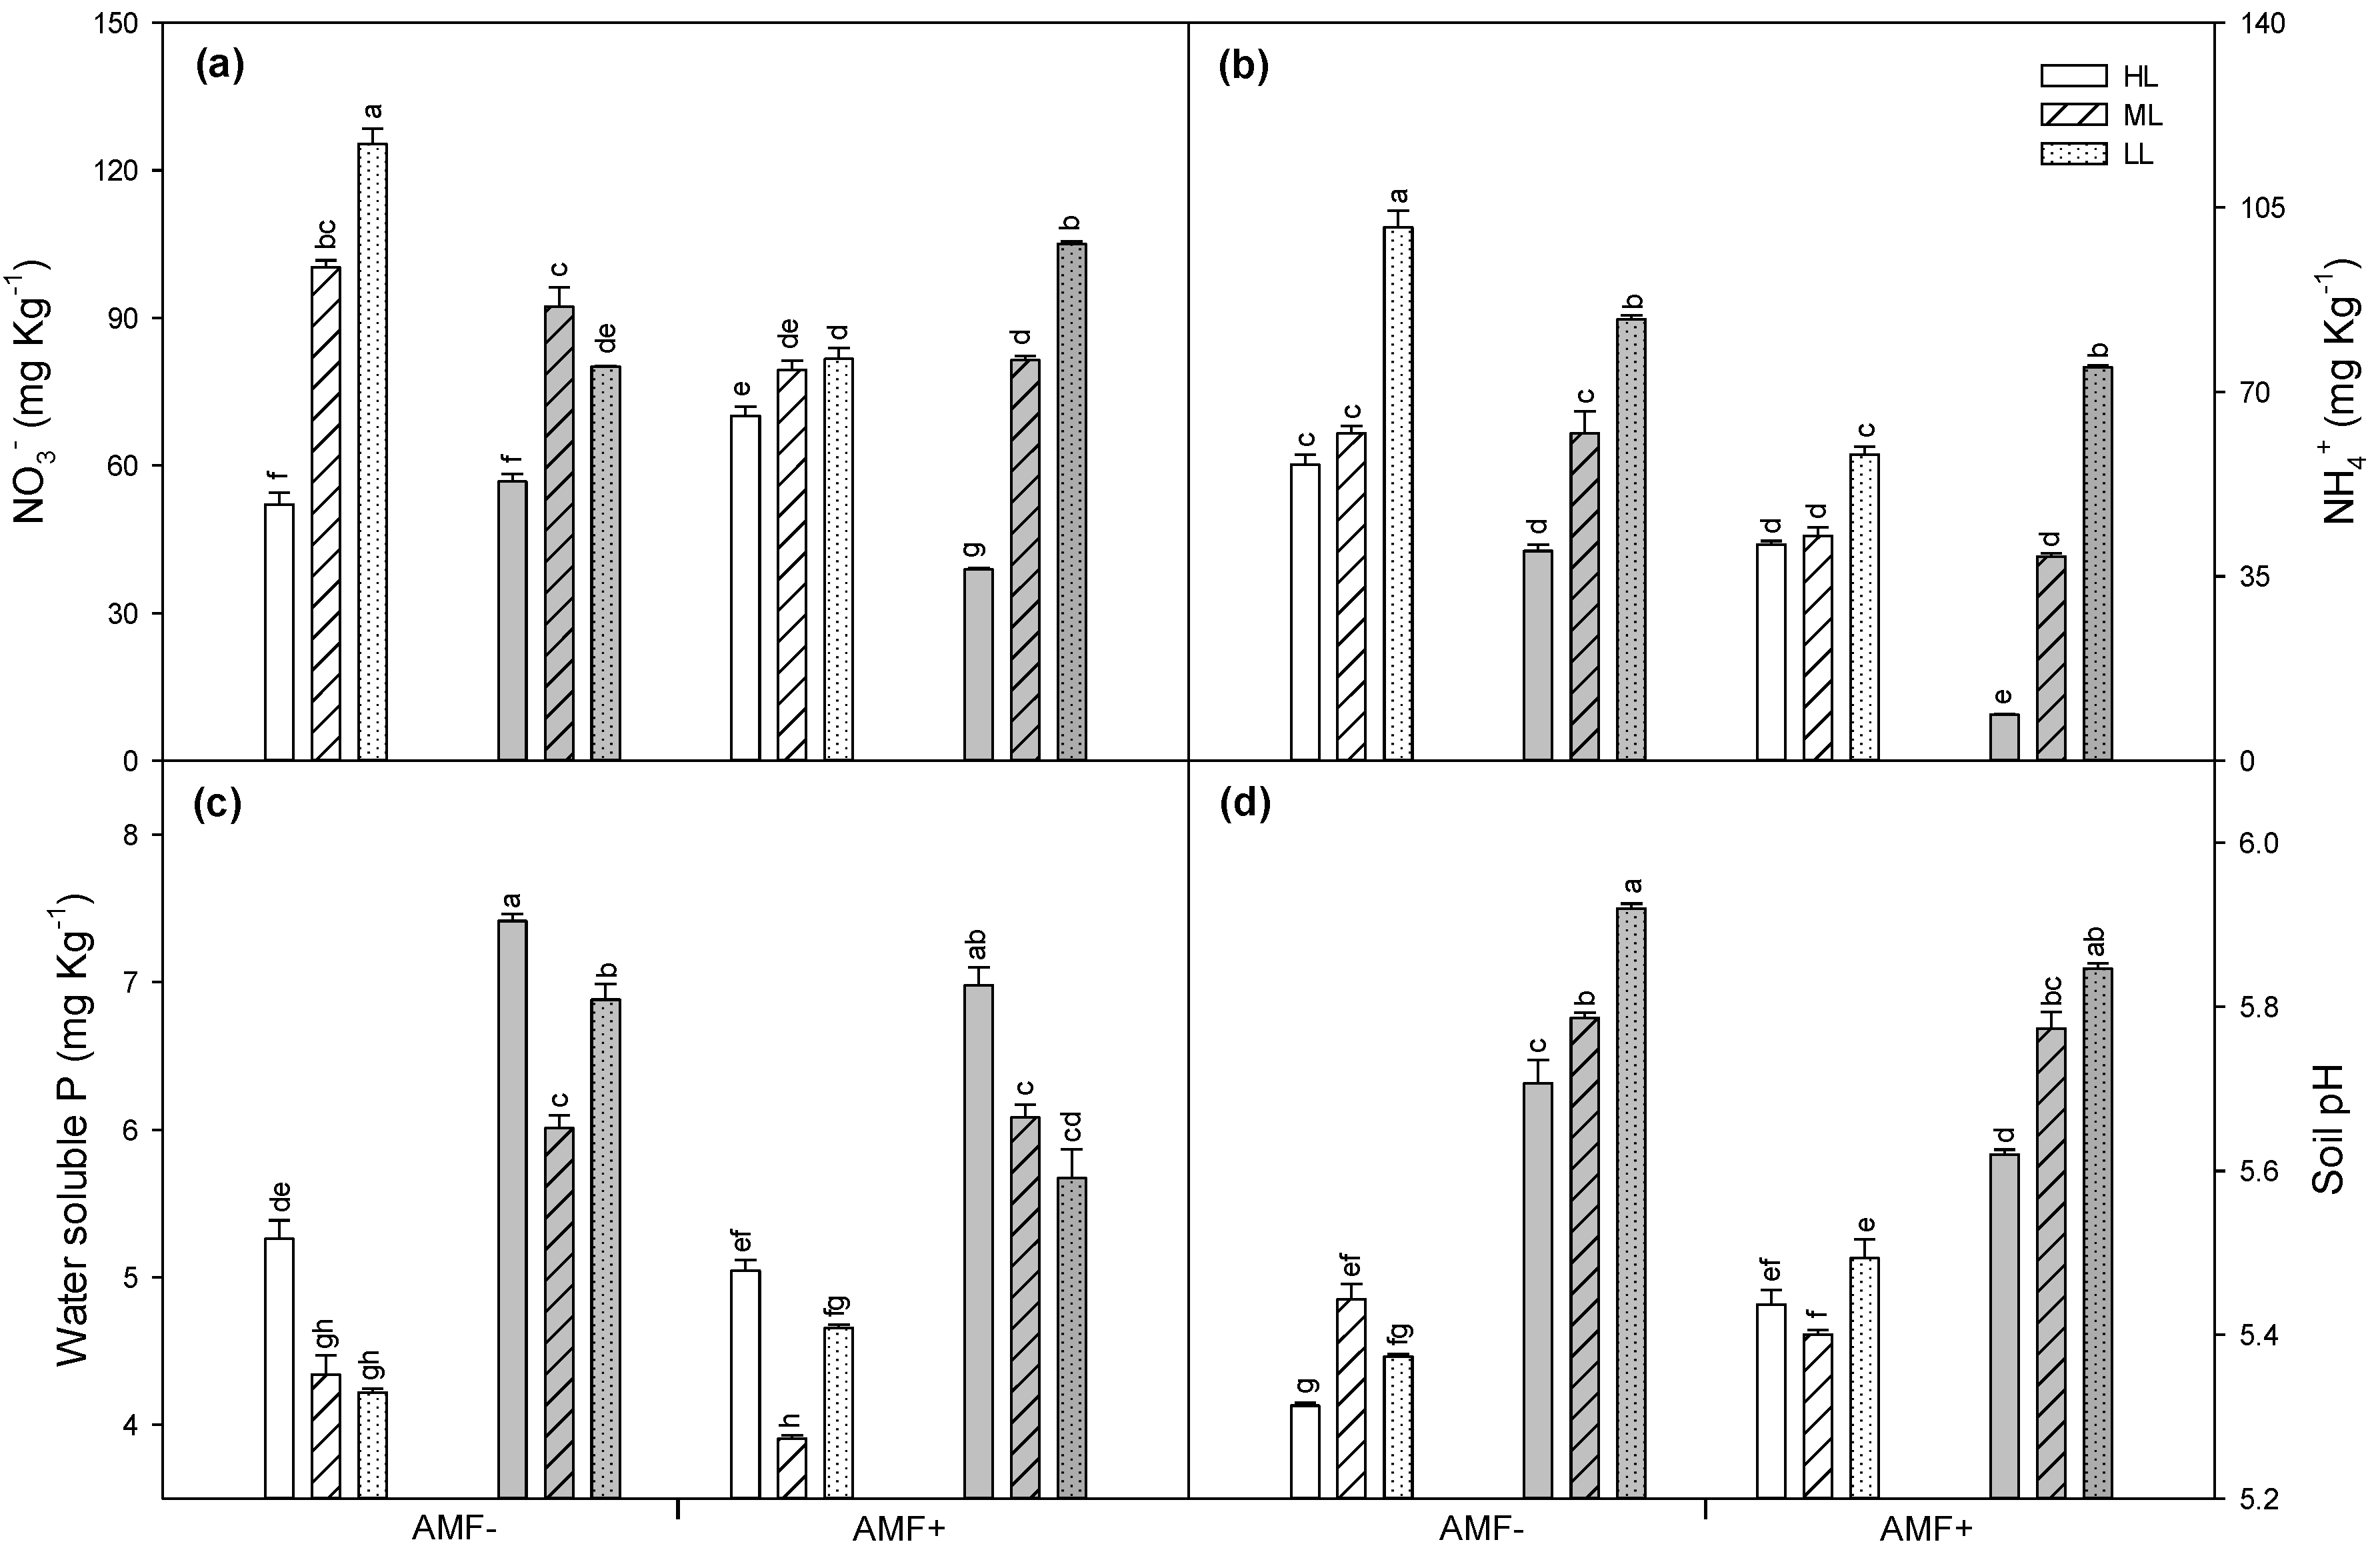
Figure 1. Responses of soil (a) nitrate, (b) ammonium, (c) water soluble phosphorus, and (d) pH to biochar application, AMF inoculation, and irrigation (HL, ML, and LL represent high, medium, and low irrigation level, respectively). Columns in white or grey denote treatment without or with biochar addition, respectively. Error bars indicate standard error of mean (n=3), treatments sharing same letter are not significantly different (Tukey’s HSD test p > 0.05).
Preprints 228093 g001
Figure 2. Responses of potato (a) tuber, (b) total biomass, (c) shoot biomass, (d) total root length, (e) leaf area, and (f) water consumption to biochar application, AMF inoculation, and irrigation (HL, ML, and LL represent high, medium, and low irrigation level, respectively). Columns in white or grey denote treatment without or with biochar addition, respectively. Error bars indicate standard error of mean (n=3), treatments sharing same letter are not significantly different (Tukey’s HSD test p > 0.05).
Preprints 228093 g002
Figure 3. Responses of plant total uptake of (a) nitrogen and (c) phosphorus, and respective linear regression outcome between plant total biomass and (b) nitrogen and (d) phosphorus to biochar application, AMF inoculation, and irrigation (HL, ML, and LL represent high, medium, and low irrigation level, respectively). Columns and symbols in white or grey denote treatment without or with biochar addition, respectively. x-symbols show data with AMF inoculation. Error bars indicate standard error of the mean (n=3), treatments sharing same letter are not significantly different (Tukey’s HSD test p > 0.05).
Preprints 228093 g003
Table 1. Interactive effect of biochar and irrigation level on arbuscular mycorrhizal fungi (AMF) properties in potato roots in soil without (BC-) and with biochar (BC+) at high (H), medium (M) and low irrigation,. Values with different capital letter in column and row for single effect of biochar and irrigation level respectively are significantly different (Tukey’s HSD test p < 0.05). Values with different lowercase for interactions of biochar and irrigation level are significantly different (Tukey’s HSD test p < 0.05).
HL ML LL Mean HL ML LL Mean HL ML LL Mean
Hyphae colonization (%) Vesicles colonization (%) Arbuscules colonization (%)
BC- 6.20±0.67 ab 9.67±1.57 a 4.17±0.46 b 6.68 A 5.62±0.68 bc 12.29±1.30 a 3.20±0.41 c 7.04 4.15±1.33 ab 7.65±0.55 a 3.79±1.12 b 5.20
BC+ 3.08±0.71 b 2.89±0.41 b 4.02±0.20 b 3.33 B 12.09±0.61 a 2.10±0.15 c 7.34±1.11 b 7.18 3.46±0.35 b 4.43±0.37 ab 5.61±0.37 ab 4.50
Mean 4.64 AB 6.28 A 4.10 B 8.85 A 7.20 AB 5.27 B 3.81 B 6.04 A 3.81 B
AMF root colonization (%) AMF colonized root length (m) NLFA 16:1ω5 (nmole g-1)
BC- 15.97±0.60 b 29.61±1.01 a 11.16±096 c 18.91 A 54.92±5.03 b 99.25±1.56 a 35.00±3.43 c 63.06 1.49±0.05 bc 3.23±0.39 a 0.78±0.29 bc 1.83 A
BC+ 18.63±0.79 b 9.43±0.78 c 16.97±0.99 b 15.00 B 90.22±4.35 a 30.11±2.09 c 86.07±4.18 a 68.80 0.94±0.06 bc 0.66±0.09 c 1.75±0.10 b 1.12 B
Mean 17.30 A 19.52 A 14.06 B 72.57 A 64.69 AB 60.54 B 1.22 B 1.94 A 1.27 B
Table 2. Analysis of variance showing effects of biochar (BC), arbuscular mycorrhiza (AM), irrigation level (IL), and their interaction on soil and plant variables. *, **, *** indicate significance level at P < 0.05, P < 0.01, and P < 0.001 respectively, NS denotes not significant.
Vari-ation NO3- NH4+ Water soluble phosphorus Soil pH Tuber biomass Total biomass Shoot biomass Total root length Leaf area Water consumption Total nitrogen uptake Total phosphorus uptake
BC *** *** *** *** *** *** *** *** ** *** *** ***
AM *** *** *** NS NS NS ** ** *** NS NS NS
IL *** *** *** *** *** *** *** *** *** *** *** ***
BC×AM *** * *** * NS NS * ** ** NS NS NS
BC×IL ** *** NS ** *** *** * *** * NS *** ***
AM×IL *** NS NS NS *** *** NS ** *** * * **
BC×AM
×IL
*** *** *** ** *** *** *** *** ** *** *** ***
Disclaimer/Publisher’s Note: The statements, opinions and data contained in all publications are solely those of the individual author(s) and contributor(s) and not of MDPI and/or the editor(s). MDPI and/or the editor(s) disclaim responsibility for any injury to people or property resulting from any ideas, methods, instructions or products referred to in the content.
Copyright: This open access article is published under a Creative Commons CC BY 4.0 license, which permit the free download, distribution, and reuse, provided that the author and preprint are cited in any reuse.