

Submitted:
12 August 2026
Posted:
13 August 2026
You are already at the latest version
Abstract
Introduction/Aim of the study: Vitamin D participates in the regulation of calcium and phosphate metabolism and exerts pleiotropic effects that encompass numerous physiological processes. The study aimed to assess vitamin D status in Polish military personnel and to analyze its association with supplementation, the frequency of consumption of selected products that are sources of vitamin D, demographic and anthropometric factors, seasonality and the GC rs2282679 polymorphism. Methods: The study included 331 soldiers aged 21–65 years, 88.2% of whom were men. 25(OH)D levels were determined by electrochemiluminescence, the frequency of product consumption was assessed using the FFQ questionnaire, and GC rs2282679 genotyping was performed by real-time PCR using TaqMan probes. Suboptimal vitamin D status was defined as a concentration of 25(OH)D <30 ng/mL. Results: The concentration of 25(OH)D <30 ng/mL was determined in 50.2% of the subjects. Multivariable analysis showed the following independent factors associated with the suboptimal status of vitamin D: blood collection in the spring, less frequent supplementation and the GG genotype of the GC rs2282679 polymorphism. Age, sex and BMI showed no independent association with this endpoint. The frequency of consumption of most analyzed products was not significantly associated with 25(OH)D levels. The concentration of 25(OH)D showed a negative correlation with PTH and homocysteine and a weak positive correlation with inorganic phosphorus. The analysis of the classification tree indicated that the GG genotype identified the subgroup with the lowest 25(OH)D concentration. Conclusions: The suboptimal vitamin D status occurred in about half of the examined soldiers. The results indicated the importance of regular supplementation, seasonality and GC rs2282679 polymorphism in the identification of individuals particularly susceptible to suboptimal vitamin D status.
Keywords:
25-hydroxyvitamin D
; vitamin D deficiency
; GC rs2282679
; genetic polymorphism
; vitamin D supplementation
; military personnel
1. Introduction
The interest in the role of vitamin D in maintaining human health has increased significantly in recent years. Although it is traditionally associated primarily with the regulation of calcium and phosphate metabolism, and skeletal system health, a growing body of evidence indicates its role in numerous non-skeletal processes [1,2].
Researchers suggested a link between vitamin D deficiency and the development of cardiovascular, neurodegenerative, autoimmune and neoplastic diseases as well as disorders of the immune system, deterioration of general health status or an impact on the course of a recent COVID-19 infection [3,4,5,6].
In addition, numerous authors recognized vitamin D deficiency as a risk factor and predictor of obesity, prediabetes and type 2 diabetes [7].
A link was also demonstrated between low vitamin D levels and an increased risk of depression [8], while its adequate levels were associated with a lower incidence of chronic fatigue [9]. In addition, regular vitamin D supplementation may reduce the risk of acute respiratory infections [10].
Vitamin D is a group of steroid compounds that serve as precursors of biologically active metabolites with hormonal properties [11,12]. The most important forms are vitamin D₂ (ergocalciferol) and vitamin D₃ (cholecalciferol). Cholecalciferol is mainly formed in the skin from 7-dehydrocholesterol under the influence of UVB radiation (290-315 nm). It is then hydroxylated in the liver to 25-hydroxyvitamin D [25(OH)D] and in the kidneys to the active hormonal form – 1,25-dihydroxyvitamin D [1,25(OH)₂D₃] [13]. The long half-life and the reflection of the total supply from skin synthesis and diet make serum 25(OH)D concentration considered the best marker of vitamin D status [13]. Concentrations of 25(OH)D ≥30 ng/mL are usually considered sufficient, 20–29 ng/mL – insufficient, while concentrations <20 ng/mL are defined as deficiency [14,15].
The basic function of vitamin D is to regulate calcium and phosphate metabolism and maintain normal bone metabolism [16]. Vitamin D affects the differentiation and activity of osteoblasts and the process of osteoclastogenesis, thereby ensuring normal osteogenesis [3]. Its severe deficiency leads to rickets in children and osteomalacia in adults, while chronic deficiency is one of the most common causes of secondary hyperparathyroidism in the adult population. It is also associated with increased bone turnover, bone mass loss and an increased risk of fractures, including stress fractures, osteopenia and osteoporosis [17,18]. The potential relationship between vitamin D and the regulation of homocysteine concentration is also increasingly emphasized, although the mechanisms of this relationship have not been fully elucidated [16].
The concentration of 25(OH)D is influenced by numerous environmental and individual factors. Exposure to solar radiation, latitude, season, diet, age and body weight are of key importance [19,20]. Approximately 80% of vitamin D comes from UVB-induced skin synthesis [21]. However, the process may be limited by the use of sunscreen, cloudiness, air pollution, age and obesity [22,23]. Natural sources of vitamin D in the diet are limited and include mainly oily saltwater fish, fish liver oil, egg yolks and selected species of mushrooms [24,25]. Therefore, fortified food and supplementation play an important role [26]. In Poland, vitamin D supplementation is recommended from October to April and throughout the year in people with insufficient exposure to the sun [15].
Genetic determinants are also an important source of interindividual variability in 25(OH)D concentrations [19,20]. Particular importance is assigned to variants of the GC gene encoding vitamin D-binding protein (DBP), responsible for its transport in the circulation. rs2282679 is one of the best known polymorphisms. Its G allele is associated with a lower concentration of 25(OH)D in the serum [27]. People with the GG genotype show the lowest values of 25(OH)D, while heterozygotes are characterized by intermediate values. Some authors also suggested a weaker response of G allele carriers to standard vitamin D supplementation [28].
Vitamin D deficiency remains one of the most common nutritional deficiencies worldwide [29]. In Poland, it may affect 50–80% of the adult population [15,30,31]. Military personnel is a particularly interesting group. Despite high physical activity levels, soldiers may be exposed to limited skin synthesis of vitamin D due to uniforms, indoor work and specific operating conditions [32]. At the same time, the adequate status of vitamin D may be important for operational readiness by affecting the musculoskeletal system, regeneration, immunity and psychophysical capacity [33,34,35]. Recruits with low 25(OH)D levels were found to have a higher incidence of stress fractures [33].
Despite the growing number of studies in civilian populations, data on Polish military personnel remain limited. There is also a lack of a comprehensive assessment of the impact of nutritional, supplementation and genetic factors on vitamin D status in this group.
The study aimed to assess the 25(OH)D status in Polish military personnel and to analyze its association with the frequency of consumption of selected products that are sources of vitamin D, supplementation and the GC rs2282679 polymorphism taking account of seasonality, age, sex and BMI. Moreover, the analysis comprised associations between the concentration of 25(OH)D and parameters of mineral and metabolic status, including calcium, phosphorus, parathyroid hormone and homocysteine.
2. Materials and Methods
2.1. Participants
The study included 331 Polish soldiers on active duty (age: 21–65 years; 88.2% of men), serving in the Air Force (52.9%) and the Land Forces (47.1%).
The participants were recruited from among soldiers covered by the initiatives carried out as part of the National Health Program for 2021-2025. Individuals who gave their informed consent to participate were included in the study.
The final sample size was determined based on the number of program participants meeting the eligibility criteria for whom a complete set of clinical, biochemical, questionnaire and genetic data was available.
The criteria for inclusion in the study were: active military service, age ≥18 years, good health status confirmed by the military occupational medicine service and the lack of diagnosed chronic diseases and disorders affecting bone metabolism. The participants did not use drugs that could affect vitamin D metabolism.
The exclusion criteria were: the occurrence of chronic diseases (including liver or kidney diseases, endocrine diseases, autoimmune diseases and malabsorption syndromes), diagnosed skeletal diseases (e.g., osteoporosis, osteomalacia or Paget's disease) and the use of pharmacotherapy that may affect vitamin D metabolism (e.g., glucocorticoids or anticonvulsants).
2.2. Assessment of the Nutritional Status
Anthropometric measurements were performed in accordance with standard procedures. Body height was measured using a stadiometer (Holtain, Crymych, UK) to an accuracy of 0.1 cm, and body weight was measured in light clothing after emptying the bladder.
Body mass index (BMI) was calculated as the ratio of body weight (kg) to the square of body height (m²). According to the World Health Organization (WHO) criteria, overweight was defined as the BMI of 25.0–29.9 kg/m², while obesity as BMI ≥30.0 kg/m² [36].
Body composition was assessed using the Bioelectrical Impedance Analysis (BIA) using the Tanita MC-790MA segment analyzer (Tanita, Tokyo, Japan).
Waist circumference was measured with an unstretchable tape measure halfway between the lower edge of the costal arch and the iliac crest.
2.3. Assessment of the Frequency of Consumption of Food Products That Are a Source of Vitamin D and Supplementation
The assessment of the diet and the use of supplements was conducted using the validated Food Frequency Questionnaire (FFQ) for the Polish population [37], modified for the purposes of this study by extending the response category.
The participants determined the frequency of consumption of individual products over the past 12 months using an 8-point scale: (1) never or almost never, (2) once a quarter or less, (3) once a month or less, (4) several times a month, (5) once a week, (6) several times a week, (7) daily and (8) several times a day. For the purposes of statistical analysis, the variables describing the frequency of consumption were treated as ordinal variables with values from 1 to 8.
2.4. Laboratory Tests
Fasting blood samples were collected in the morning from the antecubital vein by qualified medical personnel. The serum was obtained after centrifugation. It was then analyzed in the Laboratory Diagnostics Department of the Military Institute of Aviation Medicine in Warsaw.
The concentration of 25-hydroxyvitamin D [25(OH)D] was determined by electrochemiluminescent immunoassay (ECLIA) using a Vitamin D Total kit on a Cobas e411 analyzer (Roche Diagnostics, Basel, Switzerland).
Vitamin D status was classified according to the current guidelines for the population of Central Europe as: deficiency (<20 ng/mL), insufficient concentration (20 to <30 ng/mL), sufficient concentration (30 to 50 ng/mL) and high concentration (>50 ng/mL) [15].
Additionally, concentrations of parathyroid hormone (PTH), total calcium, inorganic phosphorus and homocysteine were determined using standard laboratory methods on Roche Diagnostics and Abbott automated diagnostic platforms. Homocysteine concentration was determined by spectrophotometric method with the Cobas 8000 analyzer (Roche Diagnostics, Basel, Switzerland). The respective reference ranges were 15–65 pg/mL for PTH, 8.4–10.2 mg/dL for total calcium and 0.81–1.45 mmol/L for inorganic phosphorus.
2.5. GC rs2282679 Genotyping
Genomic DNA was isolated from cheek swabs (Copan FLOQSwabs, Interpath, Australia) and then extracted using the High Pure PCR Template Preparation Kit (Roche Diagnostics, Germany). The quantity and quality of DNA was assessed using the NanoPhotometer NP80 spectrophotometer (Implen, Germany). The samples were stored at -20°C until analysis.
Genotyping was performed by real-time PCR using the QuantStudio 1 apparatus (Applied Biosystems, USA) and the TaqMan SNP Genotyping Assay kit (C_26407519_10). PCR reactions (10 μL) included TaqPath ProAmp Master Mix, TaqMan probe, and genomic DNA.
Thermal cycle conditions included initial denaturing at 95°C for 5 minutes followed by 40 cycles: 95°C for 15 seconds and 60°C for 1 minute. Genotypes were determined using QuantStudio Design and Analysis Software v1.5.1.
Genetic analysis was conducted using a recessive model (GG vs. TT+TG) as the primary approach. Moreover, the comparative analysis of the concentration of 25(OH)D between the three genotypic groups (TT, TG and GG) was carried out. The conformity of genotype distribution with the Hardy-Weinberg equilibrium was assessed using the chi-square test.
2.6. Study Period and Ethical Approval
The study was conducted in the years 2023-2025. The seasons were classified based on the date of blood collection. Due to the very low number of observations occurring during the winter, the group was not included in the seasonal analysis.
All research procedures were approved by the Bioethics Committee of the Military Institute of Aviation Medicine in Warsaw (Decision No. 01/2018 dated March 9, 2018) and were conducted in accordance with the principles of the 1964 Declaration of Helsinki and its subsequent amendments. Written informed consent to participate in the study was obtained from all the subjects. Data collection and processing was carried out in accordance with the provisions of the General Data Protection Regulation (GDPR).
2.7. Statistical Analysis
Descriptive statistics are presented as the mean ± standard deviation (SD) or the median with the interquartile range (IQR), depending on the data distribution. The normality of the distribution of variables was assessed with the Shapiro-Wilk test.
Intergroup comparisons for quantitative and ordinal variables were performed using the Mann-Whitney U test or the Kruskal-Wallis test, depending on the number of groups. Categorical variables were analyzed using the chi-square test. Associations between two variables were calculated using the Spearman’s rank correlation coefficient.
Multivariable logistic regression was used to identify factors independently associated with suboptimal vitamin D status, defined as 25(OH)D concentrations <30 ng/mL. The 25(OH)D status <30 ng/mL (yes/no) constituted a dependent variable. The following covariates were included in the model: age, sex, BMI, season, frequency of vitamin D supplementation and the genotype of GC rs2282679 polymorphism. The results are presented as odds ratios (OR) with 95% confidence intervals (95% CI). Furthermore, classification trees were used to divide the set of observations into subsets differing in the serum level of vitamin D. Suboptimal vitamin D status, defined as a concentration of 25(OH)D <30 ng/mL (yes/no), constituted the dependent variable. The following covariates were included in the model: age, sex, BMI, season, frequency of vitamin D supplementation and the genotype of GC rs2282679 polymorphism. CRT was used as a tree-building algorithm.
The rs2282679 polymorphism was analyzed in the recessive model as the primary approach. Moreover, an exploratory analysis of 25(OH)D concentrations was performed between the three genotypic groups (TT, TG and GG).
All analyses were carried out using PS IMAGO PRO 10 (IBM SPSS Statistics 29). The level of statistical significance was assumed at p <0.05.
3. Results
3.1. Nutritional Status Assessment
Table 1 shows the characteristics of the study group. The study included 331 soldiers (292 men and 39 women) at the average age of 39.4 ± 9.3 years and the mean BMI of 27.5 ± 4.7 kg/m². The median concentration of 25(OH)D was 29.9 ng/mL. Men were older and had higher values of most anthropometric parameters and body composition than women (p < 0.05), while women had a higher body fat percentage (%BF) (p < 0.001). No significant sex-related differences were observed in the concentration of 25(OH)D, total calcium, phosphates, PTH or homocysteine (p > 0.05).
According to the BMI classification, 31.4% of the soldiers had a normal body weight, 44.7% were overweight, and 23.9% were obese (Table 2). Women were more likely than men to have a normal body weight (66.7% vs. 26.7%; p <0.001). The analysis of body fat content showed significant differences between the sexes (p <0.001). Over half of men (57.6%) were classified as overfat or obese. As regards women, the percentage was 25.6%.
The distribution of 25(OH)D concentrations in the study population is shown in Figure 1. Vitamin D deficiency (<20 ng/mL) was found in 12.4% of the participants, while 37.8% were characterized by suboptimal concentrations (20–29 ng/mL). Normal concentrations of 25(OH)D (30–50 ng/mL) were observed in 41.1% of the subjects, and high concentrations (>50–100 ng/mL) in 8.8%. No significant differences occurred between men and women in the distribution of 25(OH)D concentration categories. The percentage of individuals with vitamin D deficiency was comparable in both groups (15.4% in women vs. 12.0% in men).
The distribution of vitamin D status categories did not differ significantly between sexes (χ² test, p=0.1289).
The concentration of 25(OH)D differed significantly across BMI categories (p=0.0051; Table 3). Vitamin D concentration tended to decrease with an increase in BMI. The median 25(OH)D concentration was 31.53 ng/mL (IQR: 24.42–41.04) in individuals with normal body weight, 29.97 ng/mL (IQR: 25.00-38.20) in overweight ones and 27.32 ng/mL (IQR: 20.00-34.00) in those with obesity.
A similar association was observed in relation to fat content (p=0.004). In participants with normal or reduced body fat, the median concentration of 25(OH)D was 31.96 ng/mL (IQR: 25.00-41.93), while in the group with excessive body fat content corresponding to obesity, it was 27.52 ng/mL (IQR: 20.00-34.86). The results indicated that higher body weight and higher fat content were associated with a lower concentration of 25(OH)D in the studied population of soldiers.
3.2. Frequency of the Consumption of Selected Food Products That Are Dietary Sources of Vitamin D
The frequency of the consumption of products that are sources of vitamin D is shown in Table 4. Fatty and lean fish were most often eaten several times a month or less frequently (approx. 60% in total). Conversely, eggs were often present in the diet, i.e., 53.5% of the respondents consumed them several times a week, and 12.4% – daily.
Among fat-containing products, vegetable oils were most often consumed (58.2% – at least several times a week) and butter (61,9%), while margarine was rarely consumed (63.8% – never or sporadically). Dairy products constituted an important part of the diet – 66.9% of the respondents consumed milk and natural milk beverages at least several times a week, and cheeses and curd cheeses were regularly consumed by over 40% of the participants.
In the sex-stratified analysis, significant associations were observed in men for the consumption of eggs (ρ=0.167; p=0.004) and omega-3 acid supplements (ρ=0.149; p=0.011). In women, the associations were significant only for the consumption of sweetened milk drinks (ρ=−0.381; p=0.017). The remaining correlations revealed no statistical significance. Spearman's correlations between the frequency of the consumption of selected foods that are sources of vitamin D and the concentration of vitamin D depending on sex are presented in the Supplement – Table S1.
3.3. Frequency of Supplementation and Total Vitamin D Levels in the Blood of Soldiers
The frequency of vitamin D supplementation and its association with 25(OH)D levels are shown in Figure 2 and Table 5. Daily vitamin D supplementation was declared by 23.6% of the respondents, without significant differences between men and women (p>0.05). A significant correlation was found between the frequency of vitamin D supplementation and serum 25(OH)D concentration (p<0.0001). Individuals supplementing vitamin D daily were characterized by a significantly higher concentration of 25(OH)D compared to those supplementing no more than several times a week (37.82±13.64 vs. 30.82±12.57 ng/mL; p<0.0001).
Soldiers declaring daily vitamin D supplementation were more likely to achieve optimal concentrations of 25(OH)D (30–50 ng/mL) than those supplementing vitamin D no more than several times a week (56.4% vs. 36.4%) (Figure 3). In contrast, vitamin D deficiency (<20 ng/mL) occurred much less frequently in the daily supplementation group (3.8% vs. 15.0%), as did suboptimal concentrations (20 to <30 ng/mL) (25.6% vs. 41.5%). The percentage of subjects with 25(OH)D levels >50 ng/mL was higher in the daily supplementation group than in those who supplemented less frequently (14.1% vs. 7.1%).
The season-stratified analysis showed significantly lower concentrations of 25(OH)D in subjects whose blood was collected for testing in the spring, compared to subjects tested in the summer and autumn period (30.99±12.47 vs. 33.70±13.00 ng/mL; p=0.0293).
Due to the very small size of the study group in winter (n=9), the group was not included in the seasonal analysis, which limits the possibility of fully assessing winter drops in 25(OH)D concentrations.
The frequency of vitamin D supplementation did not differ significantly between the sexes (χ² test, p=0.1259).
3.4. Correlations Between 25(OH)D Concentration and Mineral and Metabolic Status Parameters
The Spearman's correlation analysis (Table 6) was used to assess the associations between the concentration of 25(OH)D and the parameters of mineral and metabolic status. There was a significant negative correlation between the concentration of 25(OH)D and PTH (rho=−0.269; p<0.001) and between 25(OH)D and homocysteine (rho=−0.134; p=0.015). A weak positive correlation was also demonstrated between the concentration of 25(OH)D and inorganic phosphorus (rho=0.109; p<0.05). No significant correlation occurred between the concentration of 25(OH)D and total calcium.
3.5. Associations Between the GC rs2282679 Polymorphism and Serum 25(OH)D Concentrations
The following distribution of GC rs2282679 polymorphism genotypes was noted: TT – 158 people (47.7%), TG – 128 people (38.7%) and GG – 45 people (13.6%). The frequency of the T allele was 0.671, while the G allele frequency was 0.329. The respective expected genotype frequencies, assuming the Hardy-Weinberg equilibrium, were: TT – 148.9, TG – 146.2 and GG – 35.9. The distribution of genotypes was not consistent with the Hardy-Weinberg equilibrium (χ²=5.14; df=1; p=0.023), mainly due to a lower than expected number of TG heterozygotes and a higher number of TT and GG homozygotes.
The analysis of the recessive model showed a significantly lower concentration of 25(OH)D in GG homozygotes compared to subjects with TT and TG genotypes analyzed jointly (p=0.0001; Table 7). The comparative analysis of the three genotypic groups, the concentration of 25(OH)D differed significantly between the TT, TG and GG groups (p=0.0002; Table 8), with the lowest values being observed in individuals with the GG genotype.
Consistently with this result, deficiency and suboptimal 25(OH)D concentrations were more frequently observed and optimal concentrations were less frequently observed in subjects with the GG genotype compared to those with the TT and TG genotypes analyzed jointly (p=0.0001; Figure 4).
3.6. Factors Associated with Suboptimal Vitamin D Status—Multivariable Logistic Regression Analysis
Multivariable logistic regression was used to evaluate factors associated with suboptimal vitamin D status, defined as 25(OH)D concentrations <30 ng/mL. The model included the age, sex, BMI, season when testing was performed, frequency of vitamin D supplementation and the genotype of the GC rs2282679 polymorphism analyzed in the recessive model (GG vs. TT+TG) (Table 9).
The multivariable analysis showed that performing tests in the spring was significantly associated with a higher risk of 25(OH)D concentration being <30 ng/mL compared to the summer and autumn period (OR=1.99; 95% CI: 1.18-3.38; p=0.010).
The frequency of vitamin D supplementation was also significantly associated with the risk of suboptimal vitamin D status. The risk of 25(OH)D <30 ng/mL was over four times higher in participants declaring supplementation several times a week or less frequently compared to those supplementing daily (OR=4.48; 95% CI: 2.37–8.47; p<0.001).
The GG genotype of the GC rs2282679 polymorphism was significantly associated with a greater risk of suboptimal vitamin D status. Individuals with the GG genotype had a more than sixfold higher risk of 25(OH)D <30 ng/mL than subjects with the TT or TG genotype (OR = 6.57; 95% CI: 2.87–15.01; p < 0.001).
No significant association was demonstrated between the age, sex, or BMI and the risk of suboptimal vitamin D status in the multivariable model. The results indicated that, in the studied military population, the risk of 25(OH)D concentrations being <30 ng/mL was primarily associated with the blood collection season, the frequency of supplementation and the GG genotype of the GC rs2282679 polymorphism.
3.7. Identification of Subgroups Associated with the Risk of Suboptimal Vitamin D Status Using a Classification Tree
In order to identify subgroups differing in terms of the risk of suboptimal vitamin D status (defined as a concentration of 25(OH)D <30 ng/mL), an analysis using a classification tree was carried out (Figure 5). The model included the age, sex, BMI, season when testing was performed, frequency of vitamin D supplementation and the GC rs2282679 polymorphism analyzed in the recessive model (GG vs. TT+TG).
The genotype of the GC rs2282679 polymorphism was the first differentiating factor of the respondents. As regards participants with the GG genotype, a concentration of 25(OH)D below 30 ng/mL was found in 77.8%, while in the group of people with the TT or TG genotypes, the percentage was 45.8%.
In the group with TT or TG genotypes, the frequency of vitamin D supplementation was another differentiating factor. Among those declaring daily supplementation, a concentration of 25(OH)D ≥30 ng/mL was observed in 77.4% of the respondents, while in the group supplementing vitamin D no more than several times a week, the percentage was 47.8%. The remaining variables included in the model, i.e., age, sex, BMI and the season when the blood was collected, were not selected as being contributory to subsequent divisions of the classification tree.
The structure of the tree was used to distinguish three subgroups for which 25(OH)D concentrations were compared (Table 10). The concentration of 25(OH)D differed significantly between the subgroups identified in the classification tree analysis (Kruskal–Wallis, p<0.0001). The highest values were observed in individuals with TT/TG genotypes using daily vitamin D supplementation, intermediate in those with TT/TG genotypes supplementing vitamin D no more than several times a week, and the lowest in individuals with the GG genotype.
The obtained results indicated that the GG genotype of the GC rs2282679 polymorphism identified a subgroup with the least favorable concentration profile of 25(OH)D, while in individuals with TT or TG genotypes, the frequency of supplementation was an additional factor differentiating the vitamin D status.
4. Discussion
The aim of this study was to assess the status of vitamin D in active Polish military personnel and to identify factors related to 25(OH)D concentration, including supplementation, diet, demographic and anthropometric factors, seasonality and the GC rs2282679 polymorphism. It was demonstrated that about half of the surveyed soldiers were deficient or suboptimal as regards vitamin D levels.
The independent factors associated with the suboptimal status of vitamin D were: blood collection in the spring, less frequent supplementation and the GG genotype of the GC rs2282679 polymorphism. No significant association was demonstrated between the age, sex, or BMI and the risk of suboptimal vitamin D status in the multivariable model. The frequency of the consumption of most analyzed products that are sources of vitamin D was not significantly associated with 25(OH)D levels.
In the study population, the incidence of vitamin D deficiency was lower than in the general Polish population for which Płudowski et al. reported concentrations <20 ng/mL in about 66% of the respondents [38], while in the present study the percentage was 12.4%. At the same time, suboptimal 25(OH)D concentrations, i.e., 20 to <30 ng/mL, were observed in 37.8% of the soldiers, indicating a persistent problem of suboptimal vitamin D status.
Similar observations were made in other military populations, including Portuguese soldiers and US military personnel, where a high incidence of vitamin D deficiency was also demonstrated [39]. Ruohola et al. [40] also showed that the concentration of 25(OH)D <30.4 ng/mL was associated with over a threefold risk of stress fractures.
The above results highlighted the importance of adequate vitamin D status in the context of musculoskeletal health, limiting the risk of stress fractures and maintaining the physical fitness of military personnel [40,44]. According to Endocrine Society guidelines, maintaining 25(OH)D concentrations above 30 ng/mL in adults may require the supplementation of at least 1500–2000 IU of vitamin D per day [14].
In the US Army, attention was paid to the possibility of implementing nutritional interventions aimed at improving the bone health of recruits, an example of which is the Performance Readiness Bar – a snack fortified with calcium and vitamin D, used during basic military training [35]. A similar approach was described by Dyches et al., indicating that interventions involving calcium and vitamin D constituted a part of a strategy to reduce the risk of stress injuries in the military population [45].
The present study revealed no significant association between the consumption of most analyzed foods and the concentration of 25(OH)D. This result may confirm the limited role of diet in shaping vitamin D status compared to skin synthesis and supplementation. Despite being the main natural source of vitamin D, oily fish were eaten relatively rarely, which may have limited their effect on the concentration of 25(OH)D.
Low fish consumption is consistent with population data for Poland, where fish consumption remains lower than in many European countries [46,47]. This may be due to both economic factors and established dietary habits.
A positive correlation was observed between egg intake and 25(OH)D concentration in men. Eggs are one of the few natural sources of vitamin D, containing both cholecalciferol and 25(OH)D. Similar observations were presented by Daly et al. [48] who indicated a potential impact of egg consumption on limiting seasonal decreases in 25(OH)D concentration.
In men, a weak positive correlation was confirmed between the use of omega-3 acid supplements and the concentration of 25(OH)D. This association may reflect the co-occurrence of health-promoting behaviors, including a greater propensity to take supplements on a regular basis, rather than the direct effect of omega-3 acids on vitamin D status. However, it cannot be ruled out that some supplements, especially those containing fish liver oil, may have served as an additional source of vitamin D. This result should be interpreted with caution and confirmed in research taking account of the composition and doses of the supplements used.
In women, a negative correlation was found between the frequency of the consumption of sweetened milk-based beverages and 25(OH)D concentrations. This result should be interpreted with caution due to the small size of the group of women and the exploratory nature of the correlation analysis. Sweetened milk products are not a typical or main source of vitamin D. Their composition may vary depending on the type of product and possible fortification [49,50]. The negative trend in the association may reflect the co-occurrence of specific dietary or lifestyle patterns rather than the direct impact of this group of products on vitamin D status. The accidental nature of this observation cannot be ruled out either, especially in the context of the numerous nutritional variables analyzed. This association requires confirmation in larger research, taking account of the quantitative intake of vitamin D, information on product fortification and exposure to sunlight.
The frequency of supplementation was the strongest of the modifiable factors related to vitamin D status. Supplementing vitamin D several times a week or less frequently was associated with over a fourfold risk of 25(OH)D concentration <30 ng/mL compared to daily supplementation. This result is consistent with the literature data indicating the key role of regular supplementation in maintaining the normal concentration of 25(OH)D [15,26,51,52]. A meta-analysis of European clinical trials showed that oral vitamin D supplementation significantly increased the concentration of 25(OH)D in healthy adults, and the magnitude of the response depended on such factors as the dose and baseline concentration of 25(OH)D [52].
Seasonality was also important. Stratified analysis revealed that the concentration of 25(OH)D was lower in subjects in whom the blood was collected in the spring, compared to those whose blood was collected in the summer and autumn. In addition, based on the multivariable analysis, blood collection in the spring was associated with almost double the risk of 25(OH)D <30 ng/mL. This observation corresponds to the phenomenon referred to as "post-winter depletion" resulting from limited skin synthesis in the winter and the gradual depletion of body reserves [53,54,55]. These results are consistent with population-based observations indicating seasonal fluctuations in 25(OH)D concentrations in Europe [49]. In the military population, this effect may be further intensified by limited exposure to UV radiation resulting from wearing uniforms and working indoors, despite high levels of physical activity.
The present study demonstrated a significant association between the GC rs2282679 polymorphism and 25(OH)D concentration. In the recessive model, individuals with the GG genotype were characterized by a significantly lower concentration of 25(OH)D compared to those with TT and TG genotypes analyzed jointly. The comparative analysis of the three genotypic groups also showed significant differences in 25(OH)D concentrations among the TT, TG and GG groups, with the lowest values being observed in GG homozygotes. The results are consistent with previous reports indicating the participation of the rs2282679 variant in the regulation of vitamin D-binding protein concentration and 25(OH)D status [20,27,56,57].
Multivariable analysis confirmed the importance of this association. The GG genotype was associated with over a sixfold increase in the risk of 25(OH)D concentrations <30 ng/mL compared to TT and TG genotypes analyzed jointly. This result indicates that the homozygous GG genotype may identify a subgroup particularly susceptible to the risk of suboptimal vitamin D status.
The results of the classification tree analysis further indicate the hierarchical importance of genetic and behavioral factors in shaping vitamin D status. The GC rs2282679 genotype analyzed in the recessive model was the first differentiating factor in the study group. Individuals with the GG genotype formed a subgroup with the highest percentage of 25(OH)D concentrations <30 ng/mL and the lowest concentration of 25(OH)D. In individuals with TT or TG genotypes, the frequency of vitamin D supplementation was another differentiating factor. The highest 25(OH)D concentrations were observed in individuals with TT/TG genotypes supplementing vitamin D on a daily basis, intermediate in those supplementing vitamin D less frequently, and the lowest in individuals with the GG genotype. These results suggest that the GG genotype identified a subgroup with a particularly unfavorable vitamin D status, whereas in people with TT or TG genotypes, regular supplementation constituted an additional differentiating factor. However, the observation requires confirmation in prospective studies, taking account of supplementation doses and the formal analysis of genotype-supplementation interactions.
No significant associations occurred between the concentration of 25(OH)D and the age and sex. Similar observations were presented by Câmara et al. [58], who did not confirm such a relationship either. In contrast to our results, Kelly et al. [59] reported higher rates of vitamin D deficiency in female military personnel and in older age groups. The association between age and vitamin D status was also observed in population studies conducted outside the military environment [22,60]. Minter et al. demonstrated a higher incidence of vitamin D deficiency in men than in women [61], as did Cheng et al. [62]. The lack of significant associations in the present study may result from the predominant role of supplementation, seasonality and genetic factors. In case of sex, we also cannot rule out limited statistical power resulting from the relatively low number of women in the study group.
As regards BMI, the obtained results partially correspond to previous research indicating a higher risk of suboptimal vitamin D status in people with excessive body weight [22,23,57,63]. The relationship between body weight and the concentration of 25(OH)D is complex and may result from such factors as the sequestration of vitamin D in the adipose tissue, its modified distribution and limited bioavailability [64,65]. According to current recommendations, obese individuals may require higher supplementation doses than those with normal body weight [15,66,67]. Moreover, previous analyses indicated that weight reduction might be associated with increased concentrations of 25(OH)D, which further confirms the multifactorial nature of the relationship between obesity and vitamin D status [68].
In this study, higher BMI categories and higher body fat content were associated with lower concentrations of 25(OH)D in univariate analyses. However, BMI did not remain a significant factor associated with the risk of suboptimal vitamin D status in the multivariable model. This may suggest that in the study population, the importance of BMI was weaker than the importance of other factors, such as the blood collection season, the frequency of supplementation and the GG genotype of the GC rs2282679 polymorphism. At the same time, the lack of detailed data on supplement doses limits the possibility of assessing whether supplementation was adequate for the body weight of the study group soldiers.
Spearman's correlation analysis showed a significant negative association between 25(OH)D and PTH and homocysteine. These results are consistent with the physiology of the vitamin D-parathyroid axis and reports suggesting a relationship between vitamin D and homocysteine metabolism [5,69,70,71,72]. Moreover, a weak positive correlation was found between the concentration of 25(OH)D and inorganic phosphorus, which may reflect the contribution of vitamin D in the regulation of phosphate metabolism. However, due to the low strength of this correlation, this result should be interpreted with caution.
The lack of a significant correlation between the concentration of 25(OH)D and total calcium may result from compensatory mechanisms that maintain calcium homeostasis.
The obtained results indicate that the status of vitamin D in the military population is shaped by the interaction of environmental, behavioral and genetic factors. The most significant factors in the study population were the frequency of supplementation, seasonality and the GG genotype of the GC rs2282679 polymorphism. The results of the classification tree analysis additionally indicate that the factors may act hierarchically, and the GG genotype may identify a group that is particularly susceptible to unfavorable vitamin D status.
From the perspective of military medicine, maintaining proper vitamin D status may be important to reduce the risk of injury, support musculoskeletal health, and maintain the physical fitness and operational readiness of military personnel.
5. Strengths and Limitations
The most important strengths of this study include a comprehensive assessment of factors related to vitamin D status in the military population. Unlike many previous studies analyzing single determinants of 25(OH)D concentration, this paper simultaneously comprised nutritional factors, supplementation, seasonality, anthropometric and demographic characteristics, and genetic conditions. Such an approach enabled a multidimensional assessment of factors associated with suboptimal vitamin D status. An important advantage of the study is the analysis of active military personnel, which is a relatively rarely studied population in the context of vitamin D status, especially in Europe. The obtained results may be of practical significance for preventive actions aimed at maintaining the health, physical fitness and operational readiness of soldiers.
An additional strength of the study was the inclusion of the analysis of the GC rs2282679 polymorphism encoding vitamin D-binding protein (DBP), which made it possible to assess the association between genetic predisposition and the risk of suboptimal vitamin D status. Furthermore, the use of multivariable logistic regression allowed for the identification of factors independently related to the concentration of 25(OH)D <30 ng/mL after comprising potential confounding factors.
However, the presented results should be interpreted taking account of several limitations. Firstly, genetic analysis included only the rs2282679 polymorphism of the GC gene. Although this variant is one of the best documented markers associated with 25(OH)D concentrations, vitamin D metabolism is polygenic and encompasses numerous genes involved in its synthesis, transport, activation, and degradation. Therefore, the influence of other genetic variants cannot be ruled out, including ones occurring in the VDR, CYP2R1, CYP27B1 and CYP24A1 genes.
Secondly, the distribution of GC rs2282679 polymorphism genotypes deviated from the Hardy-Weinberg equilibrium. This deviation may result from the specific structure of the study population including active military personnel, which does not constitute a random sample of the general population, as well as from potential selection effects related to the health and fitness requirements of military personnel. However, the influence of population structure or technical limitations of genetic analysis cannot be entirely excluded. Therefore, the observed association between rs2282679 and vitamin D status should be interpreted with caution and confirmed in larger studies.
Thirdly, the Food Frequency Questionnaire (FFQ) was used to evaluate the diet. This method makes it possible to assess long-term eating habits, but it is based on self-reported data and is subject to the risk of memory errors and reporting inaccuracies. In addition, the FFQ does not allow for the precise estimation of the actual intake of vitamin D or the size of the consumed portions.
The lack of detailed data on the doses of vitamin D supplements used is another limitation. Only the frequency of supplementation was considered in the analysis, which makes it impossible to assess the dose-response relationship between supplementation and the concentration of 25(OH)D.
The cross-sectional nature of the study also constitutes its limitation, as it does not allow to infer causal relationships between the analyzed factors and vitamin D status.
Moreover, the size of the group of people whose blood was collected in the winter was very small (n=9). Therefore, this group was not included in the seasonal analysis. This limits the possibility of fully evaluating winter-related declines in 25(OH)D concentration and year-round variability in vitamin D status. This limitation resulted from the implementation schedule of the program, under which the recruitment and collection of biological material was carried out.
Individual exposure to sunlight, the use of photoprotective agents, and time spent outdoors, which may significantly affect skin vitamin D synthesis and constitute potential uncontrolled confounding factors, have not been evaluated either.
The study population included only 11.8% of women, which could limit the possibility of detecting sex-specific associations and reduce the possibility of generalizing the results to the population of women performing military service. Nevertheless, the gender structure reflects the actual participation of women in the Polish Armed Forces, which increases the representativeness of the sample for the professional population of soldiers.
Finally, the study population had a specific nature (military personnel), which may limit the generalizability of the results to the general population.
6. Conclusions
- Approximately half of the study group soldiers were found to be deficient or suboptimal in vitamin D, which indicates the common occurrence of suboptimal vitamin D status in this population. Vitamin D status was primarily associated with seasonality, frequency of supplementation and the GC rs2282679 polymorphism.
- BMI and body fat content were associated with 25(OH)D concentrations in univariate analyses. However, they were not independent factors associated with the risk of suboptimal vitamin D status in the multivariable model. No independent associations were demonstrated between the age, or sex and the risk of suboptimal vitamin D status. The frequency of consumption of most analyzed products that are sources of vitamin D was not significantly associated with 25(OH)D levels.
- 25(OH)D concentrations were negatively associated with parathyroid hormone and homocysteine concentrations and weakly positively associated with inorganic phosphorus concentrations. No significant association was noted between the concentration of 25(OH)D and total calcium.
- The GG genotype of the GC rs2282679 polymorphism was associated with a 6.5-fold increased risk of 25(OH)D concentrations being <30 ng/mL compared to TT and TG genotypes.
- The analysis of the classification tree indicated that the GG genotype of the GC rs2282679 polymorphism identified the subgroup with the lowest 25(OH)D concentration and the highest incidence of <30 ng/mL values. As regards people with TT or TG genotypes, daily vitamin D supplementation was associated with the highest 25(OH)D concentrations.
- The obtained results indicate that the analysis of the GC rs2282679 polymorphism, comprising information on vitamin D supplementation and seasonality, may support the identification of individuals particularly exposed to suboptimal vitamin D status. However, further prospective studies in the field of nutrigenetics are needed to assess the clinical usefulness of information on this genetic variant in the individualization of recommendations for prevention and vitamin D supplementation.
- Based on the obtained results, we recommend considering the determination of 25(OH)D concentrations in recruits starting military service and as part of periodic medical assessment of soldiers. Currently, serum 25(OH)D determination is not performed as part of standard diagnostics at any stage of military service.
Supplementary Materials
The following supporting information can be downloaded at the website of this paper posted on Preprints.org. Table S1: Spearman's correlations between the frequency of the consumption of selected vitamin D source foods and vitamin D concentrations by sex.
Author Contributions
Conceptualization, A.G., M.K. and P.J.; methodology, A.G. and P.J.; software, A.G., M.K. and P.J.; validation, A.G., M.K., S.S. and P.J.; formal analysis, A.G. and P.J.; investigation, A.G.; resources, A.G.; data curation, M.K.; writing—original draft preparation, A.G., M.K., P.J. and S.S.; writing—review and editing, A.G., M.K., S.S. and P.J.; visualization, A.G.; supervision, A.G.; project administration, A.G.; funding acquisition, A.G. All authors have read and agreed to the published version of the manuscript.
Funding
This research was funded by the Ministry of National Defence of the Republic of Poland, grant number 240/2021/DA. The funder had no role in the design of the study; in the collection, analyses, or interpretation of data; in the writing of the manuscript; or in the decision to publish the results.
Institutional Review Board Statement
This study was approved by the Ethics Committee of the Military Institute of Aviation Medicine (decision No. 01/2018 of 9 March 2018).
Informed Consent Statement
Informed consent was obtained from all subjects involved in this study.
Data Availability Statement
The data are not publicly available because they concern active-duty military personnel and are subject to institutional and confidentiality restrictions. De-identified data may be made available from the corresponding author upon reasonable request and subject to approval by the relevant institutional authorities.
Acknowledgments
We would like to thank our colleagues Karolina Bertrandt-Tomaszewska and Patrycja Urbańska who entered the survey data into the database.
Conflicts of Interest
The authors declare no conflicts of interest.
References
- Wang, H.; Chen, W.; Li, D.; Yin, X.; Zhang, X.; Olsen, N.; Zheng, S.G. Vitamin D and Chronic Diseases. Aging Dis. 2017, 8, 346–353. [Google Scholar] [CrossRef] [PubMed]
- Christakos, S.; Dhawan, P.; Verstuyf, A.; Verlinden, L.; Carmeliet, G. Vitamin D: Metabolism, Molecular Mechanism of Action, and Pleiotropic Effects. Physiol. Rev. 2016, 96, 365–408. [Google Scholar] [CrossRef] [PubMed]
- Jeon, S.M.; Shin, E.A. Exploring vitamin D metabolism and function in cancer. Exp. Mol. Med. 2018, 50, 1–14. [Google Scholar] [CrossRef] [PubMed]
- Carlberg, C.; Velleuer, E. Vitamin D and the risk for cancer: A molecular analysis. Biochem Pharmacol. 2022, 196, 114735. [Google Scholar] [CrossRef] [PubMed]
- Verdoia, M.; Gioscia, R.; Nardin, M.; Rognoni, A.; De Luca, G. Low levels of vitamin D and coronary artery disease: Is it time for therapy? Kardiol. Pol. 2022, 80, 409–416. [Google Scholar] [CrossRef] [PubMed]
- Tomaszewska, A.; Rustecka, A.; Lipińska-Opałka, A.; Piprek, R.P.; Kloc, M.; Kalicki, B.; Kubiak, J.Z. The Role of Vitamin D in COVID-19 and the Impact of Pandemic Restrictions on Vitamin D Blood Content. Front Pharmacol. 2022, 13, 836738. [Google Scholar] [CrossRef] [PubMed]
- González-Molero, I.; Rojo-Martínez, G.; Morcillo, S.; Gutierrez, C.; Rubio, E.; Pérez-Valero, V.; Esteva, I.; Ruiz de Adana, M.S.; Almaraz, M.C.; Colomo, N.; Olveira, G.; Soriguer, F. Hypovitaminosis D and incidence of obesity: A prospective study. Eur. J. Clin. Nutr. 2013, 67, 680–682. [Google Scholar] [CrossRef] [PubMed]
- Wilczyński, K.M.; Chęcińska, K.; Kulczyk, K.; Janas-Kozik, M. Vitamin D deficiency and depressive symptoms: meta-analysis of studies. Psychiatr. Pol. 2022, 56, 1327–1344. [Google Scholar] [CrossRef] [PubMed]
- Predescu, O.R.; Vreju, F.A.; Musetescu, A.E.; Florescu, A.; Dinescu, S.C.; Bita, C.E.; Barbulescu, A.L. Effects of Vitamin D Supplementation on Fatigue and Disease Activity in Systemic Lupus Erythematosus. Cureus 2025, 17, e78830. [Google Scholar] [CrossRef] [PubMed]
- Martineau, A.R.; Jolliffe, D.A.; Hooper, R.L.; Greenberg, L.; Aloia, J.F.; Bergman, P.; Dubnov-Raz, G.; Esposito, S.; Ganmaa, D.; Ginde, A.A.; Goodall, E.C.; Grant, C.C.; Griffiths, C.J.; Janssens, W.; Laaksi, I.; Manaseki-Holland, S.; Mauger, D.; Murdoch, D.R.; Neale, R.; Rees, J.R.; Simpson, S., Jr.; Stelmach, I.; Kumar, G.T.; Urashima, M.; Camargo, C.A., Jr. Vitamin D supplementation to prevent acute respiratory tract infections. BMJ. 2017, 356, i6583. [Google Scholar] [CrossRef] [PubMed]
- Rosen, C.J.; Adams, J.S.; Bikle, D.D.; Black, D.M.; Demay, M.B.; Manson, J.E.; Murad, M.H.; Kovacs, C.S. The nonskeletal effects of vitamin D. Endocr. Rev. 2012, 33, 456–492. [Google Scholar] [CrossRef] [PubMed]
- Deepika; Kumari, A.; Singh, S.; Ahmad, M.F.; Chaki, D.; Poria, V.; Kumar, S.; Saini, N.; Yadav, N.; Sangwan, N.; BinMowyna, M.N.; Alsharari, Z.D.; Kambal, N.; Min, J.H.; Raposo, A. Vitamin D: recent advances, associated factors, and its role in combating non-communicable diseases. npj Sci. Food 2025, 9, 100. [Google Scholar] [CrossRef] [PubMed]
- Holick, M.F. Vitamin D status: measurement interpretation, and clinical application. Ann. Epidemiol. 2009, 19, 73–78. [Google Scholar] [CrossRef] [PubMed]
- Holick, M.F.; Binkley, N.C.; Bischoff-Ferrari, H.A.; Gordon, C.M.; Hanley, D.A.; Heaney, R.P.; Murad, M.H.; Weaver, C.M. Evaluation, Treatment, and Prevention of Vitamin D Deficiency: An Endocrine Society Clinical Practice Guideline. J. Clin. Endocrinol. Metab. 2011, 96, 1911–1930. [Google Scholar] [CrossRef] [PubMed]
- Płudowski, P.; Kos-Kudła, B.; Walczak, M.; Fal, A.; Zozulińska-Ziółkiewicz, D.; Sieroszewski, P.; Peregud-Pogorzelski, J.; Lauterbach, R.; Targowski, T.; Lewiński, A.; Spaczyński, R.; Wielgoś, M.; Pinkas, J.; Jackowska, T.; Helwich, E.; Mazur, A.; Ruchała, M.; Zygmunt, A.; Szalecki, M.; Bossowski, A.; Czech-Kowalska, J.; Wójcik, M.; Pyrżak, B.; Żmijewski, M.A.; Abramowicz, P.; Konstantynowicz, J.; Marcinowska-Suchowierska, E.; Bleizgys, A.; Karras, S.N.; Grant, W.B.; Carlberg, C.; Pilz, S.; Holick, M.F.; Misiorowski, W. Guidelines for Preventing and Treating Vitamin D Deficiency: A 2023 Update in Poland. Nutrients 2023, 15, 695. [Google Scholar] [CrossRef] [PubMed]
- Gasmi, A.; Bjørklund, G.; Peana, M.; Mujawdiya, P.K.; Pivina, L.; Ongenae, A.; Piscopo, S.; Severin, B. Phosphocalcic metabolism and the role of vitamin D, vitamin K2, and nattokinase supplementation. Crit. Rev. Food Sci. Nutr. 2022, 62, 7062–7071. [Google Scholar] [CrossRef] [PubMed]
- Bover, J.; Gunnarsson, J.; Csomor, P.; Kaiser, E.; Cianciolo, G.; Lauppe, R. Impact of nutritional vitamin D supplementation on parathyroid hormone and 25-hydroxyvitamin D levels in non-dialysis chronic kidney disease: A meta-analysis. Clin. Kidney J. 2021, 14, 2177–2186. [Google Scholar] [CrossRef] [PubMed]
- Miller, W.L.; Imel, E.A. Rickets, Vitamin D, and Ca/P Metabolism. Horm. Res. Paediatr. 2022, 95, 579–592. [Google Scholar] [CrossRef] [PubMed]
- Mazahery, H.; von Hurst, P.R. Factors Affecting 25-Hydroxyvitamin D Concentration in Response to Vitamin D Supplementation. Nutrients 2015, 7, 5111–5142. [Google Scholar] [CrossRef] [PubMed]
- Fernández-Araque, A.; Giaquinta-Aranda, A.; Moreno-Sainz, C.; Martínez-Martínez, M.C.; Velasco-González, V.; Sainz-Gil, M.; Martín-Arias, L.H.; Carretero-Molinero, S.; García-Hidalgo, M.; Verde, Z. Haplotypes in the GC, CYP2R1 and CYP24A1 Genes and Biomarkers of Bone Mineral Metabolism in Older Adults. Nutrients 2022, 14, 259. [Google Scholar] [CrossRef] [PubMed]
- Bocheva, G.; Slominski, R.M.; Slominski, A.T. The Impact of Vitamin D on Skin Aging. Int. J. Mol. Sci. 2021, 22, 9097. [Google Scholar] [CrossRef] [PubMed]
- Serdar, M.A.; Batu Can, B.; Kilercik, M.; Durer, Z.A.; Aksungar, F.B.; Serteser, M.; Coskun, A.; Ozpinar, A.; Unsal, I. Analysis of Changes in Parathyroid Hormone and 25 (OH) Vitamin D Levels with Respect to Age, Gender and Season: A Data Mining Study. J. Med. Biochem. 2017, 36, 73–83. [Google Scholar] [CrossRef] [PubMed]
- Orces, C. The Association between Body Mass Index and Vitamin D Supplement Use among Adults in the United States. Cureus 2019, 11, e5721. [Google Scholar] [CrossRef] [PubMed]
- Schmid, A.; Walther, B. Natural vitamin D content in animal products. Adv. Nutr. 2013, 4, 453–462. [Google Scholar] [CrossRef] [PubMed]
- Alonso, N.; Zelzer, S.; Eibinger, G.; Herrmann, M. Vitamin D Metabolites: Analytical Challenges and Clinical Relevance. Calcif. Tissue Int. 2023, 112, 158–177. [Google Scholar] [CrossRef] [PubMed]
- Dominguez, L.J.; Farruggia, M.; Veronese, N.; Barbagallo, M. Vitamin D Sources, Metabolism, and Deficiency: Available Compounds and Guidelines for Its Treatment. Metabolites 2021, 11, 255. [Google Scholar] [CrossRef] [PubMed]
- Asghari, G.; Yuzbashian, E.; Nikparast, A.; Najd Hassan Bonab, L.; Mahdavi, M.; Daneshpour, M.S.; Hosseinpanah, F.; Mirmiran, P. Impact of daily vitamin D3 supplementation on the risk of vitamin D deficiency with the interaction of rs2282679 in vitamin D binding protein gene (GC) among overweight and obese children and adolescents: A one-year randomized controlled trial. Front. Nutr. 2022, 9, 1061496. [Google Scholar] [CrossRef] [PubMed]
- Asghari, G.; Yuzbashian, E.; Najd-Hassan-Bonab, L.; Mirmiran, P.; Daneshpour, M.S.; Azizi, F. Association of rs2282679 polymorphism in vitamin D binding protein gene (GC) with the risk of vitamin D deficiency in an iranian population: season-specific vitamin D status. BMC Endocr. Disord. 2023, 23, 217. [Google Scholar] [CrossRef] [PubMed]
- Holick, M.F. Vitamin D deficiency pandemic. Rev. Endocr. Metab. Disord. 2017, 18, 153–165. [Google Scholar] [CrossRef] [PubMed]
- Marcinowska-Suchowierska, E.; Walicka, M.; Tałałaj, M.; Horst-Sikorska, W.; Ignaszak-Szczepaniak, M.; Sewerynek, E. Vitamin D supplementation in adults - guidelines. Endokrynol. Pol. 2010, 61, 723–729. [Google Scholar] [PubMed]
- Zgliczyński, W.S.; Rostkowska, O.M.; Sarecka-Hujar, B. Vitamin D Knowledge, Attitudes and Practices of Polish Medical Doctors. Nutrients 2021, 13, 2443. [Google Scholar] [CrossRef] [PubMed]
- Trovato, B.; Godos, J.; Varrasi, S.; Roggio, F.; Castellano, S.; Musumeci, G. Physical Activity, Sun Exposure, Vitamin D Intake and Perceived Stress in Italian Adults. Nutrients 2023, 15, 2301. [Google Scholar] [CrossRef] [PubMed]
- Davey, T.; Lanham-New, S.A.; Shaw, A.M.; Hale, B.; Cobley, R.; Berry, J.L.; Roch, M.; Allsopp, A.J.; Fallowfield, J.L. Low serum 25-hydroxyvitamin D is associated with increased risk of stress fracture during Royal Marine recruit training. Osteoporos. Int. 2016, 27, 171–179. [Google Scholar] [CrossRef] [PubMed]
- Yoon, S.; Kwon, O.; Kim, J. Vitamin D in athletes: focus on physical performance and musculoskeletal injuries. Phys. Act. Nutr. 2021, 25, 20–25. [Google Scholar] [CrossRef] [PubMed]
- Fogleman, S.A.; Janney, C.; Cialdella-Kam, L.; Flint, J.H. Vitamin D Deficiency in the Military: It's Time to Act! Mil. Med. 2022, 187, 144–148. [Google Scholar] [CrossRef] [PubMed]
- World Health Organization. Obesity and Overweight Factsheet. Available online: https://www.who.int/news-room/fact-sheets/detail/obesity-and-overweight (accessed on 10 June 2026).
- Wądołowska, L. Walidacja kwestionariusza częstotliwości spożycia żywności - FFQ. ocena powtarzalności. Bromat Chem. Toksykol. 2005, 18, 27–33. [Google Scholar]
- Płudowski, P.; Ducki, C.; Konstantynowicz, J.; Jaworski, M. Vitamin D status in Poland. Pol. Arch. Med. Wewn. 2016, 126, 530–539. [Google Scholar] [CrossRef] [PubMed]
- Henriques, M.; Rodrigues, D.; Viegas, S.; Serranheira, F.; Sacadura-Leite, E. Vitamin D status in active duty Navy military personnel: a systematic review. Occup. Env. Med. 2023, 80, 353–360. [Google Scholar] [CrossRef] [PubMed]
- Ruohola, J.P.; Laaksi, I.; Ylikomi, T.; Haataja, R.; Mattila, V.M.; Sahi, T.; Tuohimaa, P.; Pihlajamäki, H. Association between serum 25(OH)D concentrations and bone stress fractures in Finnish young men. J. Bone Min. Res. 2006, 21, 1483–1488. [Google Scholar] [CrossRef] [PubMed]
- Dao, D.; Sodhi, S.; Tabasinejad, R.; Peterson, D.; Ayeni, O.R.; Bhandari, M.; Farrokhyar, F. Serum 25-hydroxyvitamin D levels and stress fractures in military personnel. Am. J. Sports Med. 2015, 43, 2064–2072. [Google Scholar] [CrossRef] [PubMed]
- Burgi, A.A.; Gorham, E.D.; Garland, C.F.; Mohr, S.B.; Garland, F.C.; Zeng, K.; Thompson, K.; Lappe, J.M. High serum 25-hydroxyvitamin D is associated with a low incidence of stress fractures. J. Bone Miner. Res. 2011, 26, 2371–2377. [Google Scholar] [CrossRef] [PubMed]
- Richards, T.; Wright, C. British Army recruits with low serum vitamin D take longer to recover from stress fractures. BMJ Mil. Health 2020, 166, 240–242. [Google Scholar] [CrossRef] [PubMed]
- Lappe, J.; Cullen, D.; Haynatzki, G.; Recker, R.; Ahlf, R.; Thompson, K. Calcium and Vitamin D Supplementation Decreases Incidence of Stress Fractures in Female Navy Recruits. J. Bone Miner. Res. 2008, 23, 741–749. [Google Scholar] [CrossRef] [PubMed]
- Dyches, K.D.; Friedl, K.E.; Greeves, J.P.; Keller, M.F.; McClung, H.L.; McGurk, M.S.; Popp, K.L.; Teyhen, D.S. Physiology of Health and Performance: Enabling Success of Women in Combat Arms Roles. Mil. Med. 2023, 188, 19–31. [Google Scholar] [CrossRef] [PubMed]
- Utri-Khodadady, Z.; Skolmowska, D.; Głąbska, D. Determinants of Fish Intake and Complying with Fish Consumption Recommendations-A Nationwide Cross-Sectional Study among Secondary School Students in Poland. Nutrients 2024, 16, 853. [Google Scholar] [CrossRef]
- De Roos, B.; Sneddon, A.A.; Sprague, M.; Horgan, G.W.; Brouwer, I.A. The potential impact of compositional changes in farmed fish on its health-giving properties: is it time to reconsider current dietary recommendations? Public Health Nutr. 2017, 20, 2042–2049. [Google Scholar] [CrossRef] [PubMed]
- Daly, R.M.; De Ross, B.; Gianoudis, J.; Tan, S.Y. Dose-Response Effect of Consuming Commercially Available Eggs on Wintertime Serum 25-Hydroxyvitamin D Concentrations in Young Australian Adults: a 12-Week Randomized Controlled Trial. J. Nutr. 2022, 152, 1702–1710. [Google Scholar] [CrossRef] [PubMed]
- Cashman, K.D.; Dowling, K.G.; Škrabáková, Z.; Gonzalez-Gross, M.; Valtueña, J.; De Henauw, S.; Moreno, L.; Damsgaard, C.T.; Michaelsen, K.F.; Mølgaard, C.; Jorde, R.; Grimnes, G.; Moschonis, G.; Mavrogianni, C.; Manios, Y.; Thamm, M.; Mensink, G.B.M.; Rabenberg, M.; Busch, M.A.; Cox, L.; Meadows, S.; Goldberg, G.; Prentice, A.; Dekker, J.M.; Nijpels, G.; Pilz, S.; Swart, K.M.; Van Schoor, N.M.; Lips, P.; Eiriksdottir, G.; Gudnason, V.; Cotch, M.F.; Koskinen, S.; Lamberg-Allardt, C.; Durazo-Arvizu, R.A.; Sempos, C.T.; Kiely, M. Vitamin D deficiency in Europe: Pandemic? Am. J. Clin. Nutr. 2016, 103, 1033–1044. [Google Scholar] [CrossRef] [PubMed]
- Calvo, M.S.; Whiting, S.J.; Barton, C.N. Vitamin D fortification in the United States and Canada: current status and data needs. Am. J. Clin. Nutr. 2004, 80, 1710S–1716S. [Google Scholar] [CrossRef] [PubMed]
- Sivakumar, G.; Koziarz, A.; Farrokhyar, F. Vitamin D Supplementation in Military Personnel: A Systematic Review of Randomized Controlled Trials. Sports Health 2019, 11, 425–431. [Google Scholar] [CrossRef] [PubMed]
- Rupprecht, M.; Wagenpfeil, S.; Schöpe, J.; Vieth, R.; Vogt, T.; Reichrath, J. Meta-Analysis of European Clinical Trials Characterizing the Healthy-Adult Serum 25-Hydroxyvitamin D Response to Vitamin D Supplementation. Nutrients 2023, 15, 3986. [Google Scholar] [CrossRef] [PubMed]
- Holick, M.F. Vitamin D deficiency. N Engl. J. Med. 2007, 357, 266–281. [Google Scholar] [CrossRef] [PubMed]
- Webb, A.R.; Engelsen, O. Calculated ultraviolet exposure levels for a healthy vitamin D status. Photochem Photobiol. 2006, 82, 1697–1703. [Google Scholar] [CrossRef] [PubMed]
- Osredkar, J.; Vičič, V.; Hribar, M.; Benedik, E.; Siuka, D.; Jerin, A.; Čegovnik Primožič, U.; Fabjan, T.; Kumer, K.; Pravst, I.; Žmitek, K. Seasonal variation of total and bioavailable 25-hydroxyvitamin D [25(OH)D] in the healthy adult Slovenian population. Acta Biochim Pol. 2024, 71, 13108. [Google Scholar] [CrossRef] [PubMed]
- Thongthai, P.; Chailurkit, L.O.; Chanprasertyothin, S.; Nimitphong, H.; Sritara, P.; Aekplakorn, W.; Ongphiphadhanakul, B. Vitamin D binding protein gene polymorphism as a risk factor for vitamin D deficiency in Thais. Endocr. Pract. 2015, 21, 221–225. [Google Scholar] [CrossRef] [PubMed]
- Stroia, C.M.; Pallag, A.; Vrânceanu, M.; de Lorenzo, D.; Grimaldi, K.A.; Pallag, C.R.; Vindis, K.; Bei, D.; Burlou-Nagy Fati, C.; Ghitea, T.C. The Association of VDR, CYP2R1, and GC Gene Polymorphisms, Dietary Intake, and BMI in Regulating Vitamin D Status. Diseases 2025, 13, 219. [Google Scholar] [CrossRef] [PubMed]
- Câmara, A.B.; Brandão, I.A. The relationship between vitamin D deficiency and oxidative stress can be independent of age and gender. Int. J. Vitam. Nutr. Res. 2021, 91, 108–123. [Google Scholar] [CrossRef] [PubMed]
- Kelly, D.C.; Fan, M.; Langton, R.S.; Stahlman, S.L. Vitamin D deficiency trends, risk factors, and occupational risk in active component service members of the U.S. Armed Forces, 2018-2022. MSMR 2024, 31, 2–7. [Google Scholar] [PubMed]
- AlQuaiz, A.M.; Kazi, A.; Fouda, M.; Alyousefi, N. Age and gender differences in the prevalence and correlates of vitamin D deficiency. Arch. Osteoporos. 2018, 13, 49. [Google Scholar] [CrossRef] [PubMed]
- Minter, M.; Augustin, H.; van Odijk, J.; Vanfleteren, L.E.G.W. Gender Differences in Vitamin D Status and Determinants of Vitamin D Insufficiency in Patients with Chronic Obstructive Pulmonary Disease. Nutrients 2023, 15, 426. [Google Scholar] [CrossRef] [PubMed]
- Cheng, Q.; Du, Y.; Hong, W.; Tang, W.; Li, H.; Chen, M.; Zheng, S. Factors Associated to Serum 25-Hydroxyvitamin D Levels among Older Adult Populations in Urban and Suburban Communities in Shanghai, China. BMC Geriatr. 2017, 17, 246. [Google Scholar] [CrossRef] [PubMed]
- Dewansingh, P.; Reckman, G.A.R.; Mijlius, C.F.; Krijnen, W.P.; van der Schans, C.P.; Jager-Wittenaar, H.; van den Heuvel, E.G.H.M. Protein, Calcium, Vitamin D Intake and 25(OH)D Status in Normal Weight, Overweight, and Obese Older Adults: A Systematic Review and Meta-Analysis. Front. Nutr. 2021, 8, 718658. [Google Scholar] [CrossRef] [PubMed]
- Wortsman, J.; Matsuoka, L.Y.; Chen, T.C.; Lu, Z.; Holick, M.F. Decreased bioavailability of vitamin D in obesity. Am. J. Clin. Nutr. 2000, 72, 690–693. [Google Scholar] [CrossRef] [PubMed]
- Earthman, C.P.; Beckman, L.M.; Masodkar, K.; Sibley, S.D. The link between obesity and low circulating 25-hydroxyvitamin D concentrations: considerations and implications. Int. J. Obes. 2012, 36, 387–396. [Google Scholar] [CrossRef] [PubMed]
- Bassatne, A.; Chakhtoura, M.; Saad, R.; Fuleihan, G.E. Vitamin D supplementation in obesity and during weight loss: A review of randomized controlled trials. Metabolism 2019, 92, 193–205. [Google Scholar] [CrossRef] [PubMed]
- Milewicz, A.; Kos-Kudła, B.; Ruchała, M.; Hubalewska-Dydejczyk, A.; Kajdaniuk, D.; Marek, B. Is vitamin D deficiency a risk factor for obesity-related morbidity, prediabetes, and type 2 diabetes — a literature review and proposals from the experts of the Polish Society of Endocrinology. Endokrynol. Pol. 2025, 76, 579–585. [Google Scholar] [CrossRef] [PubMed]
- Pannu, P.K.; Zhao, Y.; Soares, M.J. Reductions in body weight and percent fat mass increase the vitamin D status of obese subjects: A systematic review and metaregression analysis. Nutr. Res. 2016, 36, 201–213. [Google Scholar] [CrossRef] [PubMed]
- Lips, P. Vitamin D physiology. Prog. Biophys. Mol. Biol. 2006, 92, 4–8. [Google Scholar] [CrossRef] [PubMed]
- Amer, M.; Qayyum, R. The relationship between 25-hydroxyvitamin D and homocysteine in asymptomatic adults. J. Clin. Endocrinol. Metab. 2014, 99, 633–638. [Google Scholar] [CrossRef] [PubMed]
- Lee, Y.A.; Kang, S.G.; Song, S.W.; Kim, S.H. Association between Homocysteine and Vitamin D Levels in Asymptomatic Korean Adults. Nutrients 2024, 16, 1155. [Google Scholar] [CrossRef] [PubMed]
- Sai, A.J.; Walters, R.W.; Fang, X.; Gallagher, J.C. Relationship between vitamin D, parathyroid hormone, and bone health. J. Clin. Endocrinol. Metab. 2011, 96, E436–E446. [Google Scholar] [CrossRef] [PubMed]
Figure 1.
Distribution of serum 25(OH)D concentration categories according to sex among the studied soldiers.
Figure 1.
Distribution of serum 25(OH)D concentration categories according to sex among the studied soldiers.
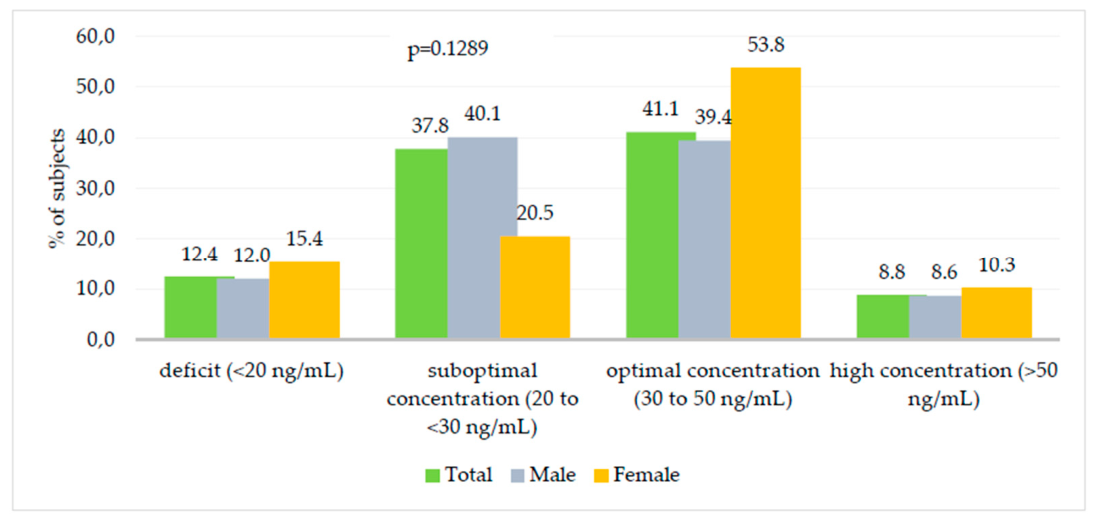
Figure 2.
Frequency of vitamin D supplementation according to the soldiers’ sex.
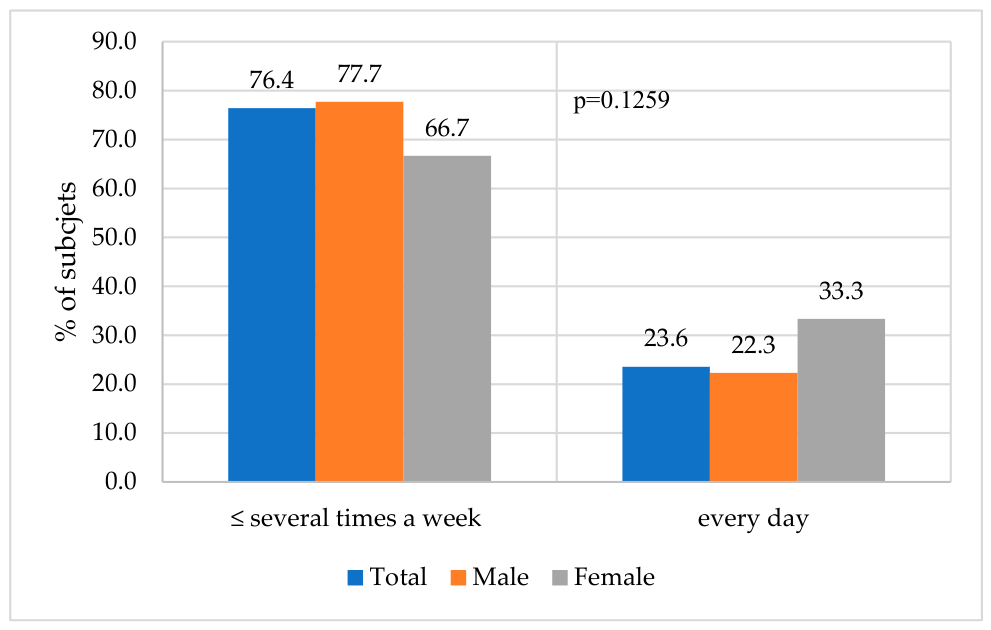
Figure 3.
Relationship between vitamin D supplementation and vitamin D concentration in soldiers.
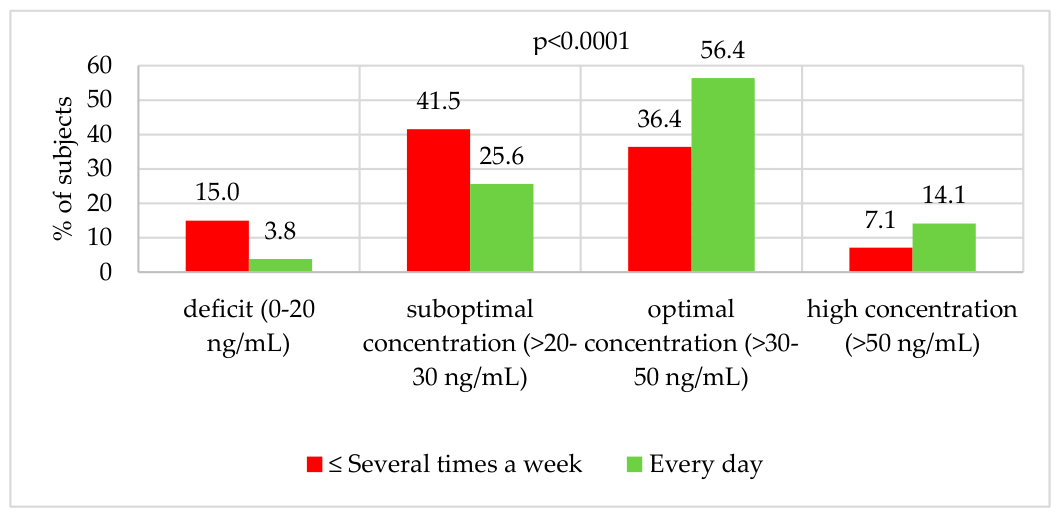
Figure 4.
Distribution of serum 25(OH)D concentration categories across GC rs2282679 genotype groups in the recessive model.
Figure 4.
Distribution of serum 25(OH)D concentration categories across GC rs2282679 genotype groups in the recessive model.
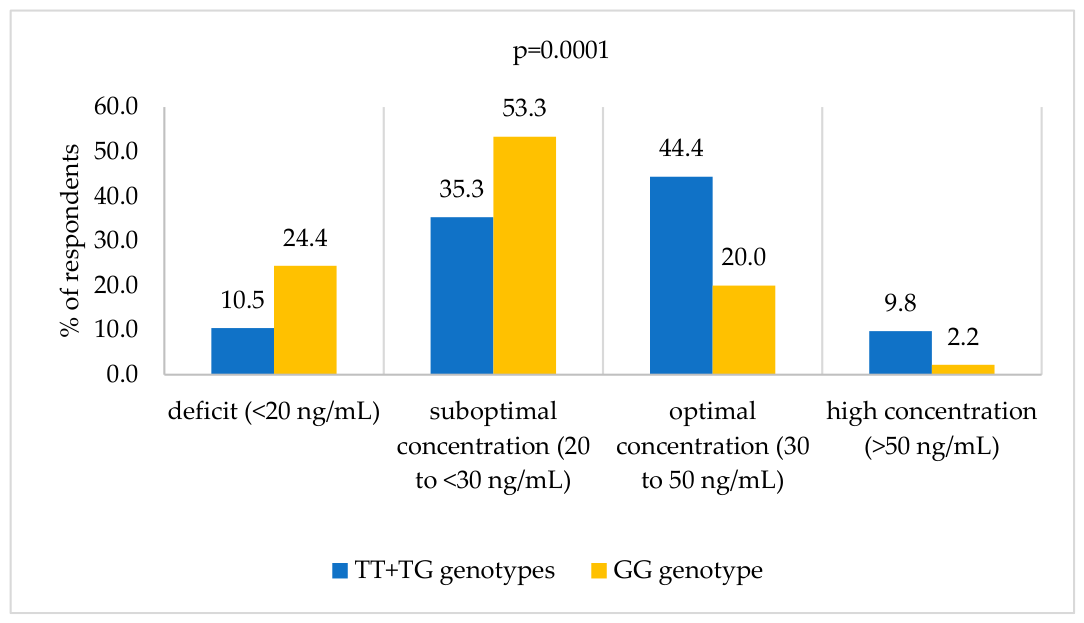
Figure 5.
Classification tree identifying subgroups at different risk of suboptimal vitamin D status (serum 25(OH)D <30 ng/mL).
Figure 5.
Classification tree identifying subgroups at different risk of suboptimal vitamin D status (serum 25(OH)D <30 ng/mL).
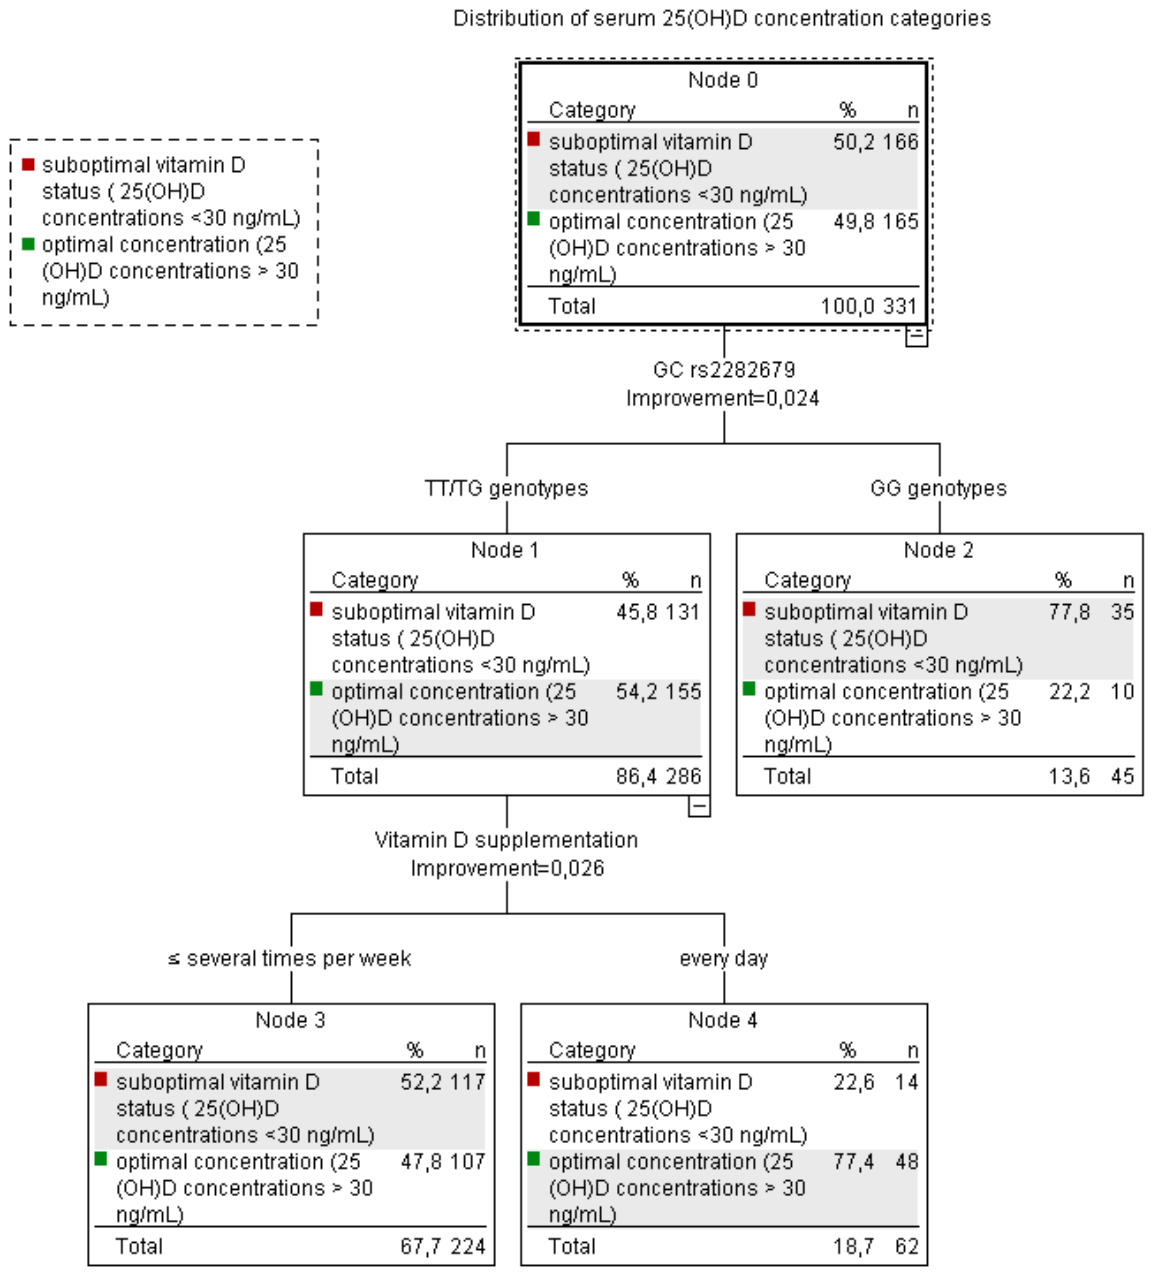

Table 1.
Demographic and anthropometric characteristics of the study population.
| Variables |
Total (N=331) |
Male (N=292) |
Female (N=39) |
|||||
| M | SD |
Me (IQR) |
Min | Max |
Me (IQR) |
Me (IQR) |
U Mann–Whitney Test p-value |
|
| Age [years] | 39.4 | 9.3 | 39.0 (32.0-46.0) |
21.0 | 65.0 | 40.0 (32.0-47.0) |
36.0 (32.0-40.0) |
0.0371 |
| Height [cm] | 178.5 | 7.9 | 179.0 (173.0-183.5) |
153.0 | 200.0 | 180.0 (176.0-184.0) |
167.0 (163.0-169.0) |
<0.0001 |
| Weight [kg] | 88.0 | 17.1 | 87.4 (78.0-96.9) |
49.7 | 182.1 | 89.5 (80.3-97.8) |
63.7 (57.1-70.8) |
<0.0001 |
| BMI [kg/m2] | 27.5 | 4.7 | 26.8 (24.4-29.9) |
18.1 | 53.2 | 27.1 (24.8-30.1) |
22.3 (20.6-26.3) |
<0.0001 |
| BF [%] | 22.5 | 6.3 | 21.7 (18.0-26.4) |
9.9 | 46.1 | 21.1 (17.2-25.6) |
25.9 (23.6-33.1) |
<0.0001 |
| BF [kg] | 20.4 | 9.3 | 18.3 (14.2-24.2) |
6.7 | 83.9 | 18.7 (14.2-24.3) |
16.3 (13.4-23.8) |
0.2807 |
| MM [kg] | 64.2 | 10.0 | 66.2 (59.6-70.2) |
37.0 | 93.4 | 66.8 (61.5-70.8) |
44.8 (41.2-48.2) |
<0.0001 |
| LBM [kg] | 67.6 | 10.4 | 69.6 (62.8-73.8) |
39.0 | 98.2 | 70.3 (64.9-74.5) |
47.2 (43.4-50.8) |
<0.0001 |
| TBW [kg] | 48.2 | 7.6 | 49.1 (44.6-52.8) |
27.8 | 74.1 | 49.7 (46.2-53.1) |
33.8 (31.0-36.3) |
<0.0001 |
| EW [kg] | 19.5 | 2.8 | 19.7 (18.2-21.1) |
11.8 | 31.7 | 20.1 (18.7-21.3) |
14.3 (13.1-15.6) |
<0.0001 |
| IW [kg] | 28.7 | 4.9 | 29.3 (26.2-31.7) |
15.7 | 43.6 | 29.6 (27.5-32.1) |
19.5 (17.8-21.2) |
<0.0001 |
| WC [cm] | 95.5 | 13.7 | 94.0 (86.0-105) |
65.0 | 158.0 | 95.5 (88.0-105.0) |
78.0 (71.0-85.0) |
<0.0001 |
| HC [cm] | 105.1 | 9.1 | 104.0 (100-109) |
90 | 197.0 | 104.0 (100.0-109.0) |
99.0 (95.0-107.0) |
0.0002 |
| 25(OH)D [ng/mL] | 32.5 | 13.1 | 29.9 (24.0-38.1) |
11.4 | 90.2 | 29.7 (23.9-37.4) |
32.9 (25.0-43.0) |
0.1076 |
| Total calcium [mg/dL] | 9.7 | 0.5 | 9.8 (9.5-10.0) |
8.9 | 11.3 | 9.8 (9.5-10.0) |
9.7 (9.5-9.9) |
0.3430 |
| Phosphorus [mmol/L] | 1.0 | 0.3 | 1.0 (0.9-1.1) |
0.6 | 3.9 | 1.0 (0.9-1.1) |
1.1 (1.0-1.2) |
0.0170 |
| PTH [pg/mL] | 32.7 | 11.0 | 31.3 (25.54-38.13) |
13.0 | 77.4 | 31.3 25.6-38.2 |
32.1 (24.9-36.7) |
0.7811 |
| HCY [µmol/L] | 12.3 | 3.4 | 12.1 (10.2-14.3) |
0.9 | 27.5 | 12.2 (10.2-14.5) |
11.6 (10.1-14.1) |
0.2230 |
Abbreviations: N – group size, BMI – Body Mass Index, BF – Body Fat, MM – Muscle Mass, LBM – Lean Body Mass, TBW – Total Body Water, EW – Extracellular Water, IW – Intracellular water, WC – Waist Circumference, HC – Hip Circumference, PTH – Parathyroid hormone, HCY – Homocysteine, M – Mean, SD – Standard Deviation, Me – Median, IQR – Interquartile Range, p <0.05 level.
Table 2.
Prevalence of overweight and obesity according to BMI and body fat percentage in the study group of soldiers.
Table 2.
Prevalence of overweight and obesity according to BMI and body fat percentage in the study group of soldiers.
| Variable | Category |
Total (N=331) |
Male (N=292) |
Female (N=39) |
||||
| N | % | N | % | N | % | Chi2 p-value |
||
| BMI category | Normal 18.5 to <25 | 104 | 31.4 | 78 | 26.7 | 26 | 66.7 | <0.0001 |
| Overweight 25 to <30 | 148 | 44.7 | 140 | 47.9 | 8 | 20.5 | ||
| Obese ≥30 | 79 | 23.9 | 74 | 25.3 | 5 | 12.8 | ||
| Body fat category | Underfat | 6 | 1.8 | 0 | 0 | 6 | 15.4 | <0.0001 |
| Normal | 147 | 44.4 | 124 | 42.5 | 23 | 59.0 | ||
| Overfat | 99 | 29.9 | 89 | 30.5 | 10 | 25.6 | ||
| Obese | 79 | 23.9 | 79 | 27.1 | 0 | 0 | ||
Abbreviations: N – group size, p <0.05 level.
Table 3.
Total Vitamin D concentration in soldiers' blood in relation to BMI and body fat.
| Group | Category | N | Me (IQR) | M±SD | Min–Max |
ANOVA Kruskal-Wallis p-value |
| BMI | Normal weight | 104 | 31.53 (24.42–41.04) |
34.38±14.25 | 13.00–90.19 | 0.0051 |
| Overweight | 148 | 29.97 (25.00–38.20) |
33.30±13.28 | 11.40–82.79 | ||
| Obese | 79 | 27.32 (20.00–34.00) |
28.39±10.40 | 11.55–66.00 | ||
| Body fat | Underfat/Normal | 153 | 31.96 (25.00–41.93) |
34.54±13.96 | 13.00–90.19 | 0.004 |
| Overweight | 99 | 29.35 (24.04–35.00) |
32.47±13.08 | 12.55–82.79 | ||
| Obese | 79 | 27.52 (20.00–34.86) |
28.45±10.60 | 11.40–67.33 |
Abbreviations: N – group size, M – mean, SD – standard deviation, Me – median, IQR – Interquartile Range, Min – minimum, Max – maximum, p <0.05 level.
Table 4.
Frequency of the consumption of selected food products that are dietary sources of vitamin D in the group of soldiers.
Table 4.
Frequency of the consumption of selected food products that are dietary sources of vitamin D in the group of soldiers.
| In the past 12 months, how often did you drink or eat: | Never or almost never | Once a quarter or less frequently | Once a month or less | Several times a month | Once a week | Several times a week | Every day | Several times a day |
| Oily fish, e.g., salmon, sardines, herring, mackerel, large carp, eel | 3.0% | 14.3% | 27.1% | 32.8% | 17.9% | 4.6% | 0.3% | 0.0% |
| Lean fish, e.g., pollock, cod, perch, hake, carp, tuna, panga, trout | 2.1% | 15.2% | 32.2% | 28.3% | 17.9% | 4.0% | 0.3% | 0.0% |
| Eggs | 0.0% | 0.0% | 2.1% | 9.7% | 22.2% | 53.5% | 11.2% | 1.2% |
| Oil (all kinds) | 0.6% | 3.0% | 8.2% | 17.4% | 12.5% | 45.1% | 12.5% | 0.6% |
| Butter (all types) | 6.8% | 6.5% | 8.7% | 9.0% | 7.1% | 34.2% | 25.8% | 1.9% |
| Margarine in cubes (for baking, frying), margarine in cups (for spreading) – all types | 47.1% | 16.7% | 11.2% | 7.9% | 3.6% | 8.2% | 4.9% | 0.3% |
| Cream (acidified or sweet) for dishes or drinks | 11.6% | 10.6% | 18.2% | 31.3% | 11.6% | 14.9% | 1.8% | 0.0% |
| Other animal fats such as lard | 29.6% | 23.2% | 20.4% | 15.2% | 7.6% | 3.7% | 0.3% | 0.0% |
| Mayonnaise and dressings, i.e., salad dressings – all types | 5.2% | 16.8% | 20.1% | 33.2% | 11.0% | 12.5% | 1.2% | 0.0% |
| Milk and natural dairy beverages, e.g., milk, milk soups, natural yogurt, kefir, natural buttermilk | 1.5% | 2.1% | 4.6% | 13.1% | 11.9% | 34.7% | 26.1% | 6.1% |
| Sweetened dairy beverages, e.g., fruit yogurts, yogurts with chocolate flakes, flavored buttermilk, fruit yogurt, cocoa with milk | 11.6% | 10.7% | 17.4% | 21.6% | 12.8% | 21.0% | 4.0% | 0.9% |
| Cheeses, e.g., yellow cheese, moldy cheeses, melted cheeses, cheese spreads | 1.8% | 4.0% | 5.8% | 17.4% | 14.3% | 44.5% | 10.1% | 2.1% |
| Natural cottage cheeses, e.g., assorted cottage cheeses, natural cottage cheese, mozzarella, cottage cheese with herbs | 1.5% | 2.1% | 7.0% | 23.7% | 17.9% | 37.4% | 9.4% | 0.9% |
| Flavored cottage cheeses, e.g., fruit, chocolate, vanilla | 30.7% | 14.9% | 22.2% | 16.1% | 7.0% | 7.6% | 1.5% | 0.0% |
| Omega-3 fatty acids | 38.2% | 11.9% | 9.5% | 11.3% | 4.6% | 9.8% | 14.7% | 0.0% |
Table 5.
Serum 25(OH)D concentrations according to vitamin D supplementation frequency and the season of blood sampling.
Table 5.
Serum 25(OH)D concentrations according to vitamin D supplementation frequency and the season of blood sampling.
| Variable | Group | N |
Me (IQR) |
M±SD | Min–Max |
U Mann–Whitney Test p-value |
| Supplementation | ≤ several times a week | 253 | 29.00 23.00-34.95 |
30.82±12.57 | 11.4-90.19 | <0.0001 |
| Every day | 78 | 36.0 29.00-44.70 |
37.82±13.64 | 14.00–89.00 | ||
| Season | Spring | 99 | 29.00 21-38 |
30.99±12.47 | 11.4–89.00 | 0.0293 |
| Summer/Autumn | 223 | 31.00 25.00-39.04 |
33.70±13.00 |
15.00–90.19 |
Abbreviations: N – group size, M – mean, SD – standard deviation, Me – median, IQR – Interquartile Range, Min – minimum, Max – maximum, p <0.05 level.
Table 6.
Correlations between 25(OH)D concentration and mineral and metabolic status parameters.
| Variable | 25(OH)D | |
| Rho | P | |
| Calcium | 0.039 | 0.476 |
| Phosphorus | 0.109 | 0.047 |
| Parathyroid hormone | -0.269 | <0.001 |
| Homocysteine | -0.134 | 0.015 |
The Spearman's rank correlation coefficient was used. Statistical significance was set at p<0.05.
Table 7.
Association of GC rs2282679 (recessive model) with serum 25(OH)D.
| Genotype group | N |
Me (IQR) |
25(OH)D [ng/mL] M±SD |
Min–Max |
U Mann–Whitney Test p-value |
| TT+TG | 286 | 31.00 (25.0-39.04) |
33.38±13.39 | 11.40-90.19 |
0.0001 |
| GG | 45 | 24.00 (20.07-29.23) |
26.65±9.77 | 16.0-62.70 |
Abbreviations: N – group size, M – mean, SD – standard deviation, Me – median, IQR – Interquartile Range, Min – minimum, Max – maximum, p <0.05 level.
Table 8.
Serum 25(OH)D concentrations across GC rs2282679 genotype groups.
| Genotype group | N |
Me (IQR) |
25(OH)D [ng/mL] M±SD |
Min–Max |
ANOVA Kruskal-Wallis p-value |
| TT | 158 | 31.06 (25.70-41.75) |
34.09±13.71 | 11.55-90.19 |
0.0002 |
| TG | 128 | 30.00 (24.00-38.00) |
32.51±12.98 | 11.40-89.00 | |
| GG | 45 | 24.00 (20.07-29.23) |
26.65±9.77 | 16.00-62.70 |
Abbreviations: N – group size, M – mean, SD – standard deviation, Me – median, IQR – Interquartile Range, Min – minimum, Max – maximum, p <0.05 level.
Table 9.
Multivariable logistic regression model for serum 25(OH)D concentration <30 ng/mL in the studied soldiers.
Table 9.
Multivariable logistic regression model for serum 25(OH)D concentration <30 ng/mL in the studied soldiers.
| Variable | B | SE | P | OR | 95% CI |
| Age (years) | 0.007 | 0.014 | 0.614 | 1.01 | 0.98-1.03 |
| Sex (female vs. male) | 0.391 | 0.408 | 0.338 | 1.48 | 0.66-3.29 |
| Season (spring vs. summer/autumn) | 0.690 | 0.269 | 0.010 | 1.99 | 1.18-3.38 |
| Vitamin D supplementation (≤ several times per week vs. every day) | 1.500 | 0.325 | <0.001 | 4.48 | 2.37-8.47 |
| GC rs2282679 (GG vs. TT+TG) | 1.882 | 0.422 | <0.001 | 6.57 | 2.87-15.01 |
| BMI (kg/m²) | -0.027 | 0.030 | 0.355 | 0.97 | 0.92-1.03 |
Abbreviations: B – regression coefficient; SE – standard error; OR – odds ratio; CI – confidence interval; p <0.05 level.
Table 10.
Vitamin D Total concentration in the soldiers' blood according to subgroups identified with classification trees.
Table 10.
Vitamin D Total concentration in the soldiers' blood according to subgroups identified with classification trees.
| Classification tree subgroups | N | Me (IQR) |
25(OH)D [ng/mL] M±SD |
Min–Max |
ANOVA Kruskal-Wallis p-value |
| TT/TG genotypes, daily vitamin D supplementation | 62 | 37.50 (30.00-45.13) | 39.65±13.85 | 14.00-89.00 |
<0.0001 |
| TT/TG genotypes, Vitamin D supplementation ≤ several times per week | 224 | 29.72 (23.95-36.12) | 31.65±12.75 | 11.40-90.19 | |
| GG genotypes | 45 | 24.00 (20.07-29.23) | 26.65±9.77 | 16.00-62.70 |
Abbreviations: N – group size, M – mean, SD – standard deviation, Me – median, IQR – Interquartile Range, Min – minimum, Max – maximum, p <0.05 level.
Disclaimer/Publisher’s Note: The statements, opinions and data contained in all publications are solely those of the individual author(s) and contributor(s) and not of MDPI and/or the editor(s). MDPI and/or the editor(s) disclaim responsibility for any injury to people or property resulting from any ideas, methods, instructions or products referred to in the content. |
© 2026 by the authors. Licensee MDPI, Basel, Switzerland. This article is an open access article distributed under the terms and conditions of the Creative Commons Attribution (CC BY) license.
Copyright: This open access article is published under a Creative Commons CC BY 4.0 license, which permit the free download, distribution, and reuse, provided that the author and preprint are cited in any reuse.