

Submitted:
12 August 2026
Posted:
13 August 2026
You are already at the latest version
Abstract
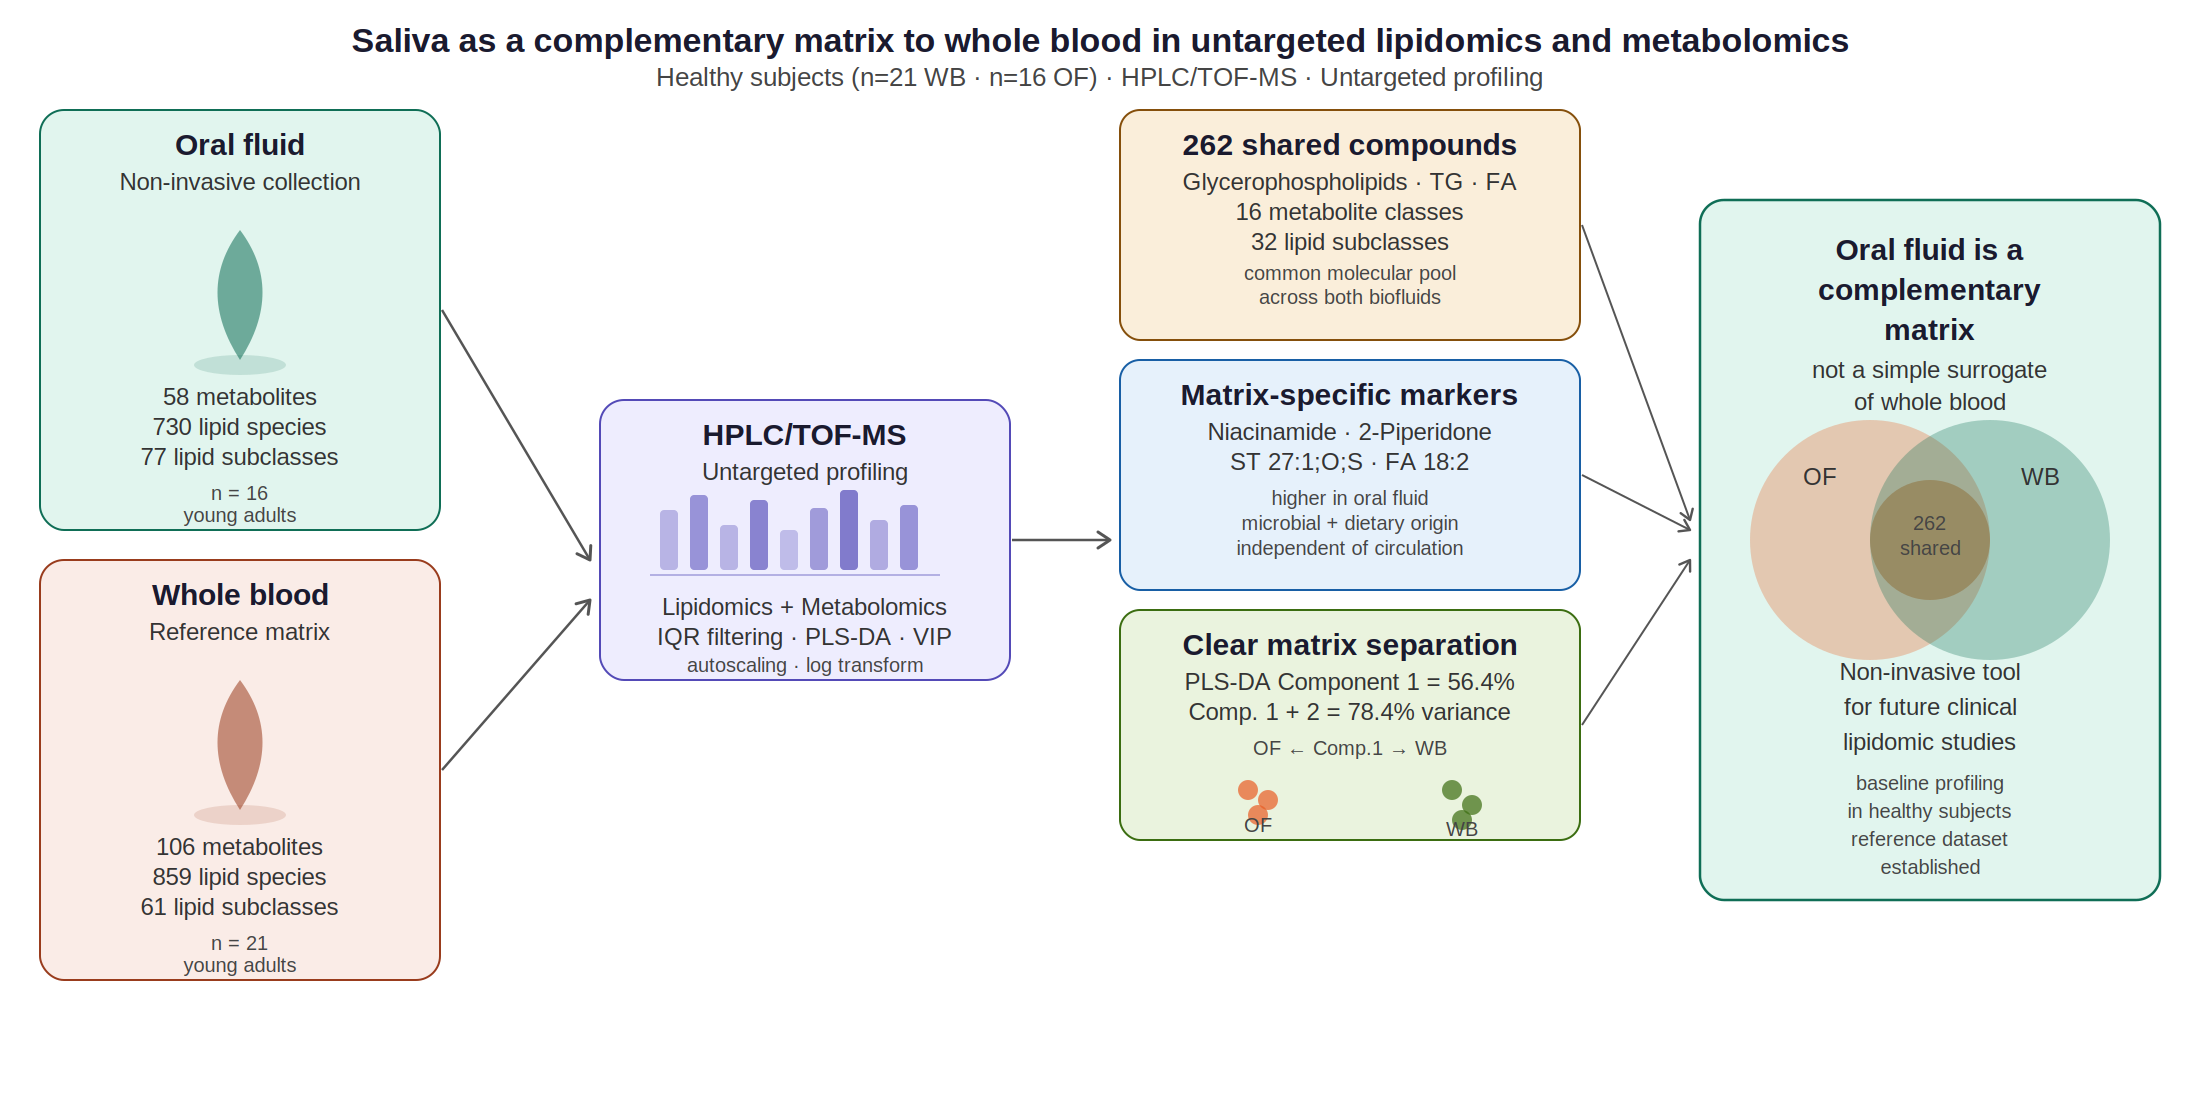
Background/Objectives: Oral fluid (OF) is a promising non-invasive matrix for metabolomic and lipidomic profiling, owing to its simple and repeatable collection. However, a direct, simultaneous comparison of the OF and whole blood (WB) lipidome and metabolome using a harmonized analytical workflow in healthy subjects has not yet been systematically addressed. This study aimed to characterize and compare the untargeted lipidomic and metabolomic profiles of OF and WB in a cohort of healthy adults, and to identify the degree of biochemical overlap and matrix-specific molecular signatures between the two biofluids. Methods: Untargeted HPLC/TOF-MS-based lipidomic and metabolomic analyses were performed on OF (n = 16) and WB (n = 21) samples collected simultaneously from 21 healthy subjects (mean age 29.6 ± 4 years). Data were processed using interquartile range filtering (IQR = 10%), logarithmic transformation, and autoscaling. Multivariate statistical analysis included partial least squares discriminant analysis (PLS-DA), VIP score ranking, hierarchical clustering, and volcano plot analysis (p < 0.05, |log₂FC| > 1). Results: OF yielded 58 metabolites (25 chemical classes) and 730 lipid species (77 subclasses), with amino acids, purines, and ether phosphatidylethanolamines as dominant groups. WB yielded 106 metabolites (24 classes) and 859 lipid species (61 subclasses), with fatty acids, glycerophospholipids, and sphingomyelins predominating. After quality filtering, 262 compounds were shared between the two matrices, with glycerophospholipids, triglycerides, and fatty acids constituting the molecular backbone of their biochemical overlap. PLS-DA revealed a clear matrix-specific separation (Component 1 = 56.4% variance), driven by niacinamide, 2-piperidone, ST 27:1;O;S, and linoleic acid (FA 18:2), whose differential abundance reflects the independent metabolic contribution of the oral cavity. Conclusions: OF and WB generate distinct yet partially overlapping molecular signatures. These findings support the concept that OF represents a complementary biological matrix rather than a simple surrogate of WB and establish a reference lipidomic and metabolomic dataset for the future application of salivary profiling as a non-invasive diagnostic tool.
Keywords:
lipidomics
; metabolomics
; oral fluid
; saliva
; whole blood
; HPLC/TOF-MS
; untargeted profiling
; biomarker
; PLS-DA
; healthy subjects
1. Introduction
In the last few decades, the progress of omics technologies has been assisted by rapid advances in bioinformatics and high-throughput analytical platforms capable of monitoring thousands of molecules, while generating large amounts of information. Omics platforms include genomics, transcriptomics, proteomics and metabolomics studies [1]. The latter consists of profiling all metabolites (sugars, nucleotides, ammino acids and lipids) within biological samples defining the phenotype of the organism [2]. Phenotype, as opposed to the genotype, studies the current state of the organism, so metabolomics is more convenient for biomarker discoveries of several diseases like cancers [3,4], diabetes [5], respiratory diseases [6], neurogenerative diseases [7], kidney diseases [8], mental illnesses [9,10]. All these pathologies can also be related to dysregulation of lipids, as these have fundamental biological functions such as being energy storage, building blocks of cellular and subcellular membranes and signaling molecules; indeed, lipidomics can be considered a subgroup of metabolomics [11]. Having this importance at a physiological level, dysregulation of the lipid profile can be a sign of several disorders. The lipid profile is dynamic and is subject to endogenous and exogenous factors including genetics, nutrition, and inflammatory processes. Therefore, studying and understanding lipid levels, chemical composition, and distribution through lipidomic studies is crucial in several fields such as biology, biochemistry, and medicine [12]. Already in 2003, Han and Gross underlined the importance of studying the interaction of lipids with each other and with cellular proteins and quantifying the alterations of lipids after a cell perturbation to gain new insights into health and diseases [13]. According to LIPID MAPS®, lipids can be classified into 8 classes: Fatty Acyls [FA], Glycerolipids [GL], Glycerophospholipids [GP], Sphingolipids [SP], Sterol Lipids [ST], Prenol Lipids [PR], Saccharolipids [SL] and Polyketides [PK] [14]. The amphiphilic nature of lipid molecules, resulting from the combination of a polar/ionic head group and a non-polar acyl chain, has direct implications for their analysis: it necessitates biphasic extraction strategies and is exploited in reversed-phase chromatographic separations, which are the basis of the LC-MS workflows most widely used in lipidomics today. The untargeted lipidomic analysis can be performed on several biological matrices such as plasma [15], blood, urine [16], feces [17], human milk [18], oral fluid (OF) [19]. These analyses, in the past, were achieved with thin layer chromatography (TLC) or gas chromatography (GC), but the derivatization was necessary. Nowadays, Mass Spectrometry (untargeted and targeted mode) is the most widely used technique either direct infusion or coupled with liquid-phase separation techniques: HPLC (high-performance liquid chromatography) or (UHP)SFC (ultrahigh-performance supercritical fluid chromatography). As ionization technique, ESI (electrospray ionization) is the most used; this pathway has several advantages such as easy coupling with LC, high sensitivity, usable for a huge range of lipids analyzable in both positive- and negative-ion mode and very low sample consumption. Also, APCI (atmospheric pressure chemical ionization) and APPI (atmospheric pressure photoionization) are possible alternatives for some lipid subclasses [11]. Whole blood lipidomic analysis is challenging because it is a complex mixture of both polar and non-polar lipids with several abundances. In general, the lipidome profile of whole blood is understudied; indeed, in the literature, lipidomic profiling is more commonly investigated using plasma or serum as biological matrices [20]. Using whole blood has advantages over plasma, because it mirrors the variation in lipids at the cellular level, and secondly this would avoid centrifugation for plasma collection, thus facilitating lipidomic analysis in the clinical setting. These studies could lead to the use of dried blood spots in lipidomic analysis in the future, which are increasingly being considered in lipidomic approaches in recent years [21,22]. Oral fluid (OF) is a complex biological matrix collected from the oral cavity that consists predominantly of salivary gland secretions together with additional endogenous and exogenous constituents present in the mouth. Salivary secretions are produced by the major salivary glands (parotid, submandibular, and sublingual) and by approximately 300–1,000 minor salivary glands distributed throughout the oral mucosa, with a total daily production of approximately 0.5–1.5 L. Besides water (approximately 99%), OF contains electrolytes, proteins, enzymes, immunoglobulins, nucleic acids, desquamated epithelial cells, microorganisms, food debris, and, when present, xenobiotics such as drugs. Unlike saliva, which is the secretion obtained directly from individual salivary glands, OF represents the composite specimen collected from the oral cavity and therefore includes additional cellular and particulate components. OF contains five groups of lipids: fatty acyls, glycerolipids, glycerophospholipids, sphingolipids, and sterol lipids [23]. This classification reflects the five major lipid categories identified at the LIPID MAPS® class level; at the subclass level, however, the salivary lipidome displays considerably greater molecular diversity, encompassing dozens of distinct lipid subclasses that differ in head group composition, chain length, degree of unsaturation, and presence of functional modifications. A recent study highlighted that 28.4% of the metabolites present in OF are lipids [24]. Blood remains the reference biofluid in lipidomic and metabolomic research, owing to its systemic representativeness and the well-established biochemical stability of its lipid constituents. However, venipuncture requires trained personnel, is perceived as burdensome by patients, and limits the feasibility of longitudinal or large-scale sampling, particularly in community-based or pediatric settings [25]. OF offers a compelling alternative: its collection is non-invasive, repeatable, and does not require specialized clinical staff, making it suitable for point-of-care and remote diagnostic applications [4,25]. The biochemical rationale for using OF as a surrogate matrix is grounded in the fact that a fraction of salivary components originates directly from blood, through passive diffusion or active transport across the salivary gland epithelium; accordingly, several salivary metabolites and lipids mirror their counterparts in plasma [23]. Cross-matrix metabolomic studies have identified a substantial overlap between the two biofluids, encompassing metabolites involved in amino acid, energy, and lipid metabolism [26]. In the specific context of lipidomics, a correlation between salivary and serum cholesterol levels has been reported in healthy adults [23,27] and the validity of fatty acid profiling in saliva as a surrogate for blood-based matrices has been demonstrated, with salivary profiles showing good agreement with those obtained from plasma and erythrocytes for several key species [27]. Alterations in salivary lipid profiles have furthermore been documented in systemic conditions such as cystic fibrosis [28,29], diabetes, and oral cancer [23], often paralleling those observed in blood. Furthermore, disease-induced modifications of the salivary lipidome can arise not only from passive transfer from the circulation but also from active remodeling of salivary gland secretory activity in response to systemic mediators [30], suggesting that OF may carry both redundant and complementary information relative to blood [26,31]. Despite this evidence, a direct, simultaneous comparison of the lipidomic and metabolomic profiles of OF and whole blood in the same cohort of healthy subjects, obtained with a harmonized analytical workflow, has not yet been systematically addressed. Establishing such a comparative baseline in healthy individuals is a prerequisite for any future application of salivary lipidomics as a non-invasive diagnostic tool, as it allows quantification of the degree of biochemical concordance between the two matrices and identification of the lipid classes and metabolites most faithfully mirrored in OF. In this study, untargeted lipidomic and metabolomic analyses were performed on blood and OF samples simultaneously collected from the same cohort of healthy subjects, using a harmonized HPLC/TOF-MS workflow. The dual-matrix design allowed direct comparison of the lipidome and metabolome of the two biofluids, with the aim of characterizing their degree of biochemical overlap and identifying matrix-specific molecular signatures. By establishing reference lipidomic and metabolomic profiles in a well-characterized healthy population, this work provides a foundation for evaluating the potential of OF as a minimally invasive surrogate for blood in future clinical and epidemiological lipidomic studies, and for identifying shared and matrix-specific molecular features that may inform the suitability of OF as a non-invasive source of systemic biomarkers. Throughout this manuscript, the terms 'OF' and 'oral fluid' are used interchangeably.
2. Materials and Methods
2.1. Volunteers’ Information
Twenty-one healthy donors (5 males and 16 females; median age: 29.6 years, range: 23–35 years) were enrolled at the Transfusion Medicine Department of IRCCS Ca’ Granda Ospedale Maggiore Policlinico in Milan, in compliance with current national and European regulations. All participants provided whole blood samples; however, oral fluid collection was unsuccessful in 5 subjects (4 men and 1 woman) due to insufficient oral fluid flow, resulting in a final cohort of 16 individuals (1 man and 15 women) with paired oral fluid samples available for analysis. Whole blood and oral fluid samples were therefore analyzed as partially overlapping datasets, with 16 subjects contributing both matrices and 5 contributing bloods only.
All participants underwent a comprehensive clinical assessment, including a detailed medical history, evaluation of medication and drug use, identification of risk factors for transmissible diseases, and a physical examination. Data were recorded and managed using dedicated software (EMONET, GPI Italy). Donors who consented to participate provided additional blood and OF samples for biobanking purposes. Exclusion criteria included poor oral hygiene, respiratory diseases, obstructive sleep apnea syndrome or habitual snoring, congenital syndromes, pregnancy, immunosuppression, xerostomia, salivary gland disorders, hematological or renal diseases, any other systemic condition, and the use of tobacco products (both smoking and chewing). Written informed consent was obtained from all participants prior to enrolment. The study was conducted in accordance with the Declaration of Helsinki (revised 2013) and approved by the Comitato Etico Milano Area 2, Fondazione IRCCS Ca' Granda Ospedale Maggiore Policlinico, Milan, Italy (approval number: 654_2022bis, date: 11 July 2022; protocol code: Ts.Bs.01), and subsequently by the Comitato Etico Territoriale Lombardia 3, Milan, Italy (approval number: 3005_SA_05.06.2023_P, date: 25 July 2023).
2.2. OF and Blood Collection
Salivary samples were collected using the passive drooling technique, following a standardized protocol [32]. A single trained operator performed all collections to minimize inter-operator variability, and all samples were processed in the same analytical batch by the same laboratory technician. No randomization was applied. To ensure blinding during data analysis, all samples were anonymized. OF collection was carried out in the morning, following a brief mouth rinse to eliminate food and beverage residues. Participants self-collected approximately 2 mL of OF by expectoration into sterile 50 mL plastic tubes. Immediately after collection, samples were vortexed and centrifuged (10 minutes at 2,000 rpm) to remove cellular debris. Protease and phosphatase inhibitors were added to prevent protein degradation. Samples were then frozen at –80°C and stored in the Biobank of Policlinico, Milan, prior to analysis at the Unitech Omics platform, University of Milan. Blood samples were collected via standard venipuncture from fasting participants in the morning and were immediately stored at −80 °C until analysis.
2.3. Lipidomic and Metabolomic Analysis
2.3.1. Chemicals
Methanol, acetonitrile, pure water, chloroform, isopropanol and ammonium acetate were acquired from Supelco (Merk, Darmstadt, Germany). Methionine-d5 (1 mg/mL) was purchased from Sigma-Aldrich (Milan, Italy) while butylated hydroxytoluene (BHT) was acquired from Alfa Aesar (Fisher Scientific, Milan, Italy).
2.3.2. Sample Preparation
Aliquots of 100 μL of OF (or 25 μL of whole blood diluted with 75 μL of H₂O) were processed for both metabolomic and lipidomic analyses using distinct extraction protocols. For metabolomic analysis, 10 μL of internal standard (methionine-d5) were added to each sample and brought to a final volume of 1 mL by the cold addition of 800 μL of an organic EtOH:MeOH (1:1, v/v) mixture. Samples were mixed for 15 minutes and then centrifuged for 10 minutes at 13,400 RPM. The organic phase was subsequently dried under a nitrogen flow and reconstituted in 70 μL of 95% acetonitrile. For lipidomic analysis, 100 μL of OF were added to 850 μL of an organic MeOH/CHCl₃ mixture. Samples were mixed for 1 hour at 4 °C and centrifuged for 10 minutes at 13,400 RPM. Then, 900 μL of the organic phase were collected, dried under nitrogen flow, and reconstituted in 75 μL of an IPA/ACN (2:1, v/v) mixture containing 0.1 mM BHT. For both analyses, blank samples were prepared using 100 μL of pure water and processed following the same procedures. Additionally, pooled quality control (QC) samples were prepared by combining 2–5 μL of each processed sample.
2.3.3. Untargeted Metabolomic and Lipidomic Analyses
Liquid chromatography-mass spectrometer configuration included a 1290 Infinity II LC system (Agilent) coupled to a Zeno TOF 7600 mass spectrometer (ABSciex), equipped with a Turbo V™ Ion Source with ESI probe. For both analyses, 5 μL of extracts were injected, and samples were analyzed in both positive and negative ionization modes using IDA (Information Dependent Acquisition). Each sample was injected duplicate, and a pooled quality control (QC) sample was analyzed every ten injections. For metabolomic analysis, chromatographic separation was achieved on an Atlantis BEH Z-HILIC column (100 mm × 2.1 mm, 1.7 μm; Waters) maintained at 45 °C, using a 30 min gradient at a flow rate of 0.4 mL/min as follows: 0.0 min, 99% B; 20 min, 25% B; 24.20 min, 99% B. Mobile phase A consisted of 10 mM ammonium acetate in water/ACN (50:50, v/v), while mobile phase B consisted of 10 mM ammonium acetate in IPA/ACN (90:10, v/v) with 0.1% formic acid. Mass spectra were acquired over an m/z range of 50–1000 Da, with a collision energy of 30 ± 15 eV. For lipidomic analysis, chromatographic separation was performed on a CSH C18 column (100 mm × 2.1 mm, 1.7 μm; Waters) maintained at 55 °C, using a 30 min gradient at a flow rate of 0.4 mL/min as follows: 0.0 min, 40% B; 2.5 min, 50% B; 12.5 min, 55% B; 13 min, 70% B; 19 min, 99% B; 24.20 min, 40% B. Mobile phase A consisted of 10 mM ammonium acetate in water/ACN (60:40, v/v) with 0.1% formic acid, while mobile phase B consisted of 10 mM ammonium acetate in IPA/ACN (90:10, v/v) with 0.1% formic acid. Mass spectra were acquired over an m/z range of 200–2500 Da, with a collision energy of 35 ± 15 eV.
2.3.4. Bioinformatic and Statistical Analysis
For UHPLC-QTOF/MS analysis, raw data were imported into ABSciex OS and MS-DIAL software for baseline filtering, peak detection, integration, retention time correction, and peak alignment. For metabolomic analysis, MS1 and MS2 tolerances were set at 0.01–0.02 and 0.5, respectively, whereas for lipidomics these values were set at 0.01 for MS1 and 0.05 for MS2. For both analytical approaches, a minimum peak height threshold of 1000 was applied. Metabolite identification was performed using the MSMS public experiment spectra library (neg/pos-VS19), with a retention time tolerance of 0.1 min and a score cut-off between 70 and 80. For lipidomic analysis, the MS-DIAL library was used, applying the same parameters as for metabolomics. For both techniques, peak alignment was carried out using central QC samples, with a retention time tolerance of 0.1 min, an MS1 tolerance of 0.015 Da, and a sample-to-blank average ratio of 10. The resulting compound lists, along with their intensities, were then subjected to further analysis. Fold change (FC) and coefficient of variation (CV%) were calculated using blank and QC intensities to filter the compounds detected by MS-DIAL. The applied thresholds were 10 for FC and 30% for CV; therefore, only compounds with FC >10 and CV% <30 were retained. Subsequent analyses were performed using MetaboAnalyst 6.0. Prior to multivariate statistical analysis, data were filtered using an interquartile range (IQR) threshold between 10% and 25% and then normalized by log transformation. Partial least squares discriminant analysis (PLS-DA) was used to identify differentially expressed metabolites, defined by a variable importance in projection (VIP) score >1 and a p-value <0.05.
3. Results
3.1. Metabolomic and Lipidomic Composition of Oral Fluid (OF)
Untargeted metabolomic analysis of OF identified 77 metabolites, 58 of which were consistently detected across all samples and assigned to 25 chemical classes. Figure 1 shows the 11 classes containing more than one metabolite and the category “Other” which refers to the remaining 14 classes represented by a single metabolite (24 %). Amino acids constituted the most abundant class (24%), followed by purines and derivatives (14%) and pyridines and derivatives (7%); together, these three classes accounted for more than 60% of the total metabolite pool (Figure 1).
Additional metabolite groups, including organonitrogen compounds, fatty acids and conjugates, pyrimidines and derivatives, benzoic acids and derivatives, pyrimidine nucleotides, phenylpropanoic acids, and carbohydrate-related compounds, were detected at lower relative abundances. Carbohydrates were also detected, consistent with passive diffusion of glucose from plasma across the salivary gland epithelium [33,34]. Lipidomic analysis identified 730 lipid species belonging to 77 lipid classes. Their distribution was highly variable, with most classes (59 out of 77) containing fewer than 10 identified lipids. Figure 2 shows the lipid subclasses containing more than 10 members.
These subclasses can be grouped into broader lipid categories, namely glycerophospholipids, glycerolipids, sphingolipids and fatty acids. The category labeled “Other” includes all subclasses with fewer than 10 detected lipids (59 classes containing 222 species, 30%). The dominant subclasses included ether phosphatidylethanolamines (EtherPE, 13%), sphingomyelins (SM, 8%), phosphatidylethanolamines and phosphatidylcholines (PE and PC, 6%) (Figure 2). Additional subclasses — including ether phosphatidylcholines (EtherPC), triglycerides (TG), cardiolipins (CL), oxidized triglycerides (OxTG), oxidized fatty acids (OxFA), and lysophosphatidylcholines (LPC) — were present at lower proportions. Minor lipid species such as ceramides, hexosylceramides, phosphatidylglycerols, and PE-ceramides collectively represented a smaller fraction of the OF lipidome.
3.2. Metabolomic and Lipidomic Composition of Whole Blood (WB)
Untargeted metabolomic analysis of WB identified 106 metabolites, 102 of which were consistently detected across all samples, and assigned to 24 chemical classes. Figure 3 shows the 14 classes containing more than one metabolite, while the category "Other" includes classes represented by a single metabolite (10 classes, 9%). Fatty acids and conjugates constituted the most abundant class (~21%), followed by amino acids and derivatives (15%), fatty acid esters (14%), and purines and derivatives (8%) (Figure 3).
Additional classes, including organonitrogen compounds, pyridines and derivatives, benzoic acids and derivatives, bile acids, keto acids and derivatives, phenylpropanoic acids, indoles and derivatives and carbohydrate-related compounds, were detected at lower proportions. Lipidomic analysis identified 859 lipid species belonging to 61 lipid classes. Their distribution was highly variable, with most classes (44 out of 61) containing fewer than 10 detected lipids. Figure 4 shows the lipid subclasses containing more than 10 species. The category “Other” includes all subclasses with fewer than 10 detected lipids (44 classes containing 154 species, 18%).
Glycerophospholipids represented the dominant lipid category (56%), followed by sphingolipids (31%), glycerolipids (6.6%), fatty acids (3.4%), and sterol lipids (1.9%) (Figure 4). At the subclass level, sphingomyelins (SM) were the most abundant (~14%), followed by phosphatidylcholines (PC, 12%), ether phosphatidylethanolamines (EtherPE, 11%), ether phosphatidylcholines (EtherPC, 10%), and phosphatidylethanolamines (PE, 8%). Additional subclasses, including sulfohexosylceramides (SHexCer), triglycerides, phosphatidylserines, lysophosphatidylcholines, cardiolipins, phosphatidylinositols, ceramides, and cholesteryl esters, were detected at lower abundances.
3.3. Comparative Analysis of Oral Fluid (OF) and Whole Blood (WB)
A total of 292 compounds were detected in common between the two matrices. Of these, 30 were excluded following data filtration, transformation, and scaling steps, as they did not meet the predefined quality criteria (10% interquartile range filtering, logarithmic transformation, and autoscaling). The remaining 262 compounds were distributed across 16 metabolite classes and 32 lipid subclasses. Among shared lipids, glycerophospholipids, triglycerides, and fatty acids were the most abundant classes detected in both biofluids.
Differential abundance analysis (volcano plot, Figure 5) revealed that 138 compounds were significantly downregulated in OF compared to WB, whereas 44 were significantly upregulated; 80 compounds exhibited no statistically significant difference between matrices, based on a threshold of p-value < 0.05 and |log₂ fold change| > 2. PLS-DA performed on the full dataset revealed a clear separation between OF and WB samples (Figure 6).
Component 1 accounted for 56.4% of the total variance, Component 2 for 22%, resulting in a cumulative variance of 78.4% captured by the first two components. OF samples clustered on the negative side of Component 1, while WB samples were distributed on the positive side. VIP score analysis identified the compounds contributing most strongly to the PLS-DA separation (Figure 7).
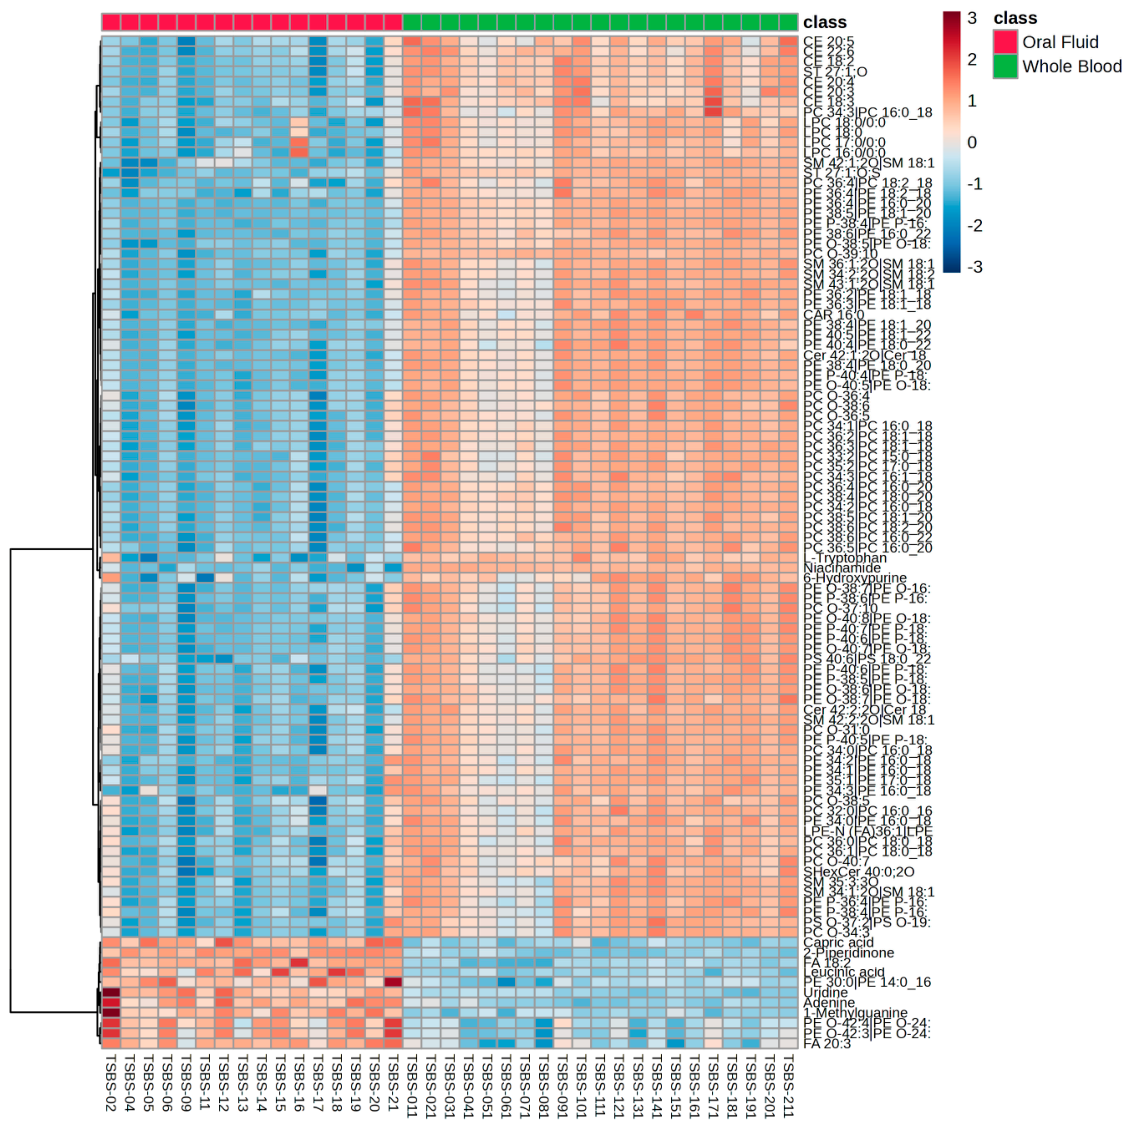
Among the top-ranking species were glycerophospholipids (phosphatidylethanolamines and phosphatidylcholines) and metabolites including 2-piperidone, niacinamide, ST 27:1;O;S (a sulfatides species), and FA 18:2. Hierarchical clustering confirmed the PLS-DA findings: all samples clustered according to their biological matrix, forming two distinct groups (Figure 8). Most glycerophospholipid species showed higher abundance in WB, while a subset of metabolites and neutral lipids exhibited higher abundance in OF.
4. Discussion
Untargeted lipidomic and metabolomic profiling of OF and WB from healthy subjects revealed distinct matrix-specific molecular signatures, with 262 compounds shared between the two biofluids after data quality filtering. These data provide a comparative reference for assessing the suitability of OF versus WB for biomarker identification in future translational studies. The predominance of amino acids in the OF metabolome is consistent with previous untargeted LC-MS studies in healthy subjects. A non-targeted LC-MS analysis of saliva from 27 healthy volunteers identified 99 salivary metabolites, with amino acids — including standard, methylated, and acetylated forms — representing the largest and most diverse metabolic group, reflecting their central role in salivary gland secretion and local protein turnover [35]. Similarly, purine metabolites have been consistently reported as a major component of the salivary metabolome in healthy adults, with levels sensitive to collection and storage conditions [36]. The detection of pyridine derivatives, including niacinamide, is in line with the reported contribution of the oral microbiome to local NAD⁺ precursor metabolism in saliva [26]. Overall, the metabolite class distribution observed in oral fluid is thus in broad agreement with the compositional landscape of the healthy salivary metabolome reported in the literature.
Accordingly, the lipid class distribution observed in OF is consistent with the salivary lipidome previously described. Caterino et al., using a targeted platform on saliva from patients with cystic fibrosis and healthy controls, identified seven major lipid classes including glycerophospholipids, triacylglycerols, ceramides, diacylglycerols, sphingomyelins, cholesterol esters, and acylcarnitines [29], substantially overlapping with the classes detected in the present untargeted analysis. Matczuk et al. reported that non-esterified fatty acids — with palmitic acid as the most abundant species, followed by stearic, oleic, and linoleic acids — constitute a major fraction of the salivary lipidome in healthy subjects [28], consistent with the prominent detection of fatty acyls in oral fluid samples. These lipid classes play important physiological roles in the oral cavity, contributing to salivary pellicle stabilization, lubrication, and antimicrobial protection [37]. The predominance of glycerophospholipids and sphingomyelins in the WB lipidome is consistent with the well-characterized composition of blood cell membranes. Studies on erythrocyte membrane lipids in healthy subjects have consistently identified phosphatidylcholines and phosphatidylethanolamines as the two most abundant classes, accounting for approximately 68% of the total phospholipid pool, with sphingomyelins representing about 18% [38]. Lipidomic analysis of human platelets from healthy donors has confirmed the co-dominance of phosphatidylcholine, phosphatidylethanolamine, and sphingomyelin as major lipid constituents [39], underscoring the central contribution of blood cell membranes to the overall whole blood lipidome. The high abundance of sphingomyelin is consistent with its structural role in the outer leaflet of erythrocyte and platelet plasma membranes [40]. The identification of 262 shared compounds is broadly consistent with previous comparative metabolomic studies of saliva and blood. Barnes et al., using an untargeted metabolomic platform on paired saliva and plasma from 161 healthy and diabetic subjects, detected 772 metabolites in plasma and 475 in saliva, with a substantial shared fraction encompassing amino acid, lipid, carbohydrate, and nucleotide pathways [41]. Although that study employed a different analytical platform and included a mixed disease population, the scale of biochemical overlap is comparable to that observed in the present study. A more recent study comparing salivary and plasma metabolomic profiles in subjects with hepatocellular carcinoma similarly demonstrated distinct matrix-specific profiles while identifying overlapping metabolites, suggesting that complementary diagnostic information may derive from both biofluids regardless of the clinical context [42]. Among the shared lipid classes, glycerophospholipids — as the principal structural components of cell membranes — are released into both biofluids primarily through membrane turnover and cell lysis. Their predominant downregulation in OF relative to WB reflects the substantially lower cellularity of saliva compared to blood, where erythrocytes, leukocytes, and platelets represent major phospholipid sources [23,25,28]. Triglycerides and fatty acids, conversely, showed relatively higher abundance in OF. Salivary fatty acid profiles may reflect short-term dietary fat intake and local oral metabolism more directly than blood, where these species are distributed across multiple lipid classes and subject to extensive metabolic conversion [19]. The enrichment of triglycerides and fatty acids in OF may therefore reflect active secretion by salivary glands and local lipolytic activity, rather than simple diffusion from the circulation. Among the top discriminating compounds, niacinamide, a direct NAD⁺ precursor essential for ATP production and DNA repair via PARP-1 [43], showed higher abundance in OF, likely reflecting the active metabolic activity of the oral epithelium and the contribution of the oral microbiome to local NAD⁺ precursor cycling [26], independent of systemic circulation. 2-Piperidone, a lactam derived from lysine and cadaverine catabolism [44] with documented antifungal and anticonvulsant activities and biomarker status for CYP2E1 activity [45], was enriched in oral fluid, consistent with its predominantly local microbial origin through amino acid fermentation [26]. ST 27:1;O;S, a sulfated galactosylceramide implicated in neurodegeneration and autoimmune diseases through abnormal sulfatide metabolism, showed differential abundance between the two matrices, likely reflecting the contribution of oral epithelial cell turnover to the salivary lipidome [28]. FA 18:2 (linoleic acid), an essential omega-6 fatty acid, was enriched in OF, consistent with evidence that salivary fatty acid profiles mirror short-term dietary omega-6 intake more directly than blood [19,25]. The application of salivary metabolomics to disease populations is already documented in conditions such as periodontitis [46], cystic fibrosis [29], and hepatocellular carcinoma [42], supporting the translational relevance of the baseline profiles established in the present study in healthy subjects and confirming the sensitivity of the salivary metabolome to both local and systemic pathological states.
Taken together, the biological identity of the top discriminating compounds supports a dual interpretation: niacinamide, 2-piperidone, and FA 18:2 point to the oral cavity as a site of active and partially independent metabolism — shaped by the microbiome, epithelial secretion, and direct dietary exposure — while ST 27:1;O;S reflects the specific cellular composition of each matrix [25,26]. These findings reinforce the conclusion that lipid metabolism represents the primary molecular driver differentiating OF from WB, and that the two biofluids generate distinct and complementary molecular signatures shaped by matrix-specific biological processes.
Limitations
The present study has several limitations. The study population was relatively small (n = 21 for whole blood; n = 16 for oral fluid) and predominantly female, which may limit the generalizability of the findings and reduce the statistical power to detect sex-related differences in lipid and metabolite profiles. On the other hand, the predominance of female donors reflects the voluntary nature of recruitment and the characteristics of the eligible donor population at the study site. The age range was restricted to young adults (25–35 years), and the observed profiles may not be representative of other age groups, in which salivary metabolome composition is known to differ substantially. Furthermore, oral fluid collection was unsuccessful in five participants due to insufficient salivary flow, introducing a potential selection bias in the oral fluid dataset and resulting in a partially overlapping rather than fully paired design. The cross-sectional nature of the study precludes any inference about intra-individual variability over time or the effects of dietary, hormonal, or circadian fluctuations on matrix-specific profiles. Finally, metabolite and lipid identification was performed at the annotation level through spectral library matching. Absolute quantification and confirmation with reference standards were not available for most of the detected species, a limitation which should be considered when interpreting abundance comparisons between matrices.
5. Conclusions
The baseline reference profiles established in this study open several avenues for future investigation. The identification of lipid classes and metabolites selectively enriched in oral fluid — including matrix-specific markers of microbial metabolism and dietary exposure — provides a rational basis for the design of targeted salivary assays for non-invasive monitoring in clinical and epidemiological settings. Future studies should extend this comparative framework to larger and more demographically diverse cohorts, including subjects across a broader age range and with balanced sex representation. The application of this dual-matrix workflow to disease populations — including metabolic, inflammatory, and neurodegenerative conditions — would allow assessment of whether the degree of biochemical concordance between oral fluid and blood observed in healthy individuals is maintained, altered, or selectively disrupted in pathological states, thereby informing the translational potential of salivary lipidomics as a surrogate diagnostic tool.
Taken together, the present study provides a comprehensive characterization of the lipidomic and metabolomic profiles of oral fluid and whole blood in healthy subjects, identifying 262 compounds shared between the two matrices and demonstrating that glycerophospholipids, triglycerides, and fatty acids constitute the molecular backbone of their biochemical overlap. The clear separation observed in multivariate analysis, driven by matrix-specific compounds including niacinamide, 2-piperidone, ST 27:1;O;S, and FA 18:2, underscores the independent metabolic contribution of the oral cavity and confirms that the two biofluids, while biochemically connected, generate distinct and complementary molecular signatures. These findings support the concept that oral fluid represents a complementary biological matrix rather than a simple surrogate of blood and establish a reference dataset for the future application of salivary lipidomics and metabolomics as a non-invasive diagnostic tool.
Author Contributions
Conceptualization, M.O., P.D., G.M.T. and D.G; methodology, S.C. and M.D.C; validation, S.C., M.B., E.T. and M.D.C; formal analysis, M.O.; investigation, S.C., M.B., E.T. and M.D.C; resources, G.M.T., G.R. and A.B; data curation, M.B; writing—original draft preparation, M.O.; writing—review and editing, M.O., P.D., D.G., S.C., E.T., G.M.T., C.F., M.M., M.B., ; visualization, M.B.; supervision, M.O., P.D. and D.G.; project administration, M.O., G.M.T., D.G. and P.D. All authors have read and agreed to the published version of the manuscript.
Funding
This study was partially funded by Italian Ministry of Heath - Current research (RC25) Fondazione IRCSS Ca' Granda Ospedale Maggiore Policlinico.
Conflicts of Interest
The authors declare no conflicts of interest.
Abbreviations
The following abbreviations are used in this manuscript:
| OF WB LC-MS HPLC TOF-MS ESI APCI APPI IDA PLS-DA VIP IQR FC CV% QC BHT NAD⁺ PARP-1 PC PE SM EtherPE EtherPC TG FA SHexCer LPC CL OxTG OxFA FA 18:2 |
oral fluid whole blood liquid chromatography-mass spectrometry high-performance liquid chromatography time-of-flight mass spectrometry electrospray ionization atmospheric pressure chemical ionization atmospheric pressure photoionization information dependent acquisition partial least squares discriminant analysis variable importance in projection interquartile range fold change coefficient of variation quality control butylated hydroxytoluene nicotinamide adenine dinucleotide poly(ADP-ribose) polymerase 1 phosphatidylcholine phosphatidylethanolamine sphingomyelin ether-linked phosphatidylethanolamine ether-linked phosphatidylcholine triglyceride fatty acid sulfohexosylceramide lysophosphatidylcholine cardiolipin oxidized triglyceride oxidized fatty acid linoleic acid |
References
- Davis, V.W.; Bathe, O.F.; Schiller, D.E.; Slupsky, C.M.; Sawyer, M.B. Metabolomics and Surgical Oncology: Potential Role for Small Molecule Biomarkers. J. Surg. Oncol. 2011, 103, 451–459. [Google Scholar] [CrossRef] [PubMed]
- Vailati-Riboni, M.; Palombo, V.; Loor, J.J. What Are Omics Sciences? In Periparturient Diseases of Dairy Cows; Springer International Publishing: Cham, 2017; pp. 1–7. [Google Scholar]
- García-Perdomo, H.A.; Dávila-Raigoza, A.M.; Korkes, F. Metabolomics for the Diagnosis of Bladder Cancer: A Systematic Review. Asian J. Urol. 2024, 11, 221–241. [Google Scholar] [CrossRef] [PubMed]
- Lorentzen, G.M.; Łaniewski, P.; Cui, H.; Mahnert, N.D.; Mourad, J.; Borst, M.P.; Willmott, L.; Chase, D.M.; Roe, D.J.; Herbst-Kralovetz, M.M. Cervicovaginal Metabolome and Tumor Characteristics for Endometrial Cancer Detection and Risk Stratification. Clin. Cancer Res. 2024, 30, 3073–3087. [Google Scholar] [CrossRef] [PubMed]
- Shahisavandi, M.; Wang, K.; Ghanbari, M.; Ahmadizar, F. Exploring Metabolomic Patterns in Type 2 Diabetes Mellitus and Response to Glucose-Lowering Medications—Review. Genes 2023, 14, 1464. [Google Scholar] [CrossRef] [PubMed]
- Seyfinejad, B.; Nemutlu, E.; Taghizadieh, A.; Khoubnasabjafari, M.; Ozkan, S.A.; Jouyban, A. Biomarkers in Exhaled Breath Condensate as Fingerprints of Asthma, Chronic Obstructive Pulmonary Disease and Asthma–Chronic Obstructive Pulmonary Disease Overlap: A Critical Review. Biomark. Med. 2023, 17, 811–837. [Google Scholar] [CrossRef] [PubMed]
- Oka, T.; Matsuzawa, Y.; Tsuneyoshi, M.; Nakamura, Y.; Aoshima, K.; Tsugawa, H.; Weiner, M.; Aisen, P.; Petersen, R.; Jack, C.R.; et al. Multiomics Analysis to Explore Blood Metabolite Biomarkers in an Alzheimer’s Disease Neuroimaging Initiative Cohort. Sci. Rep. 2024, 14, 6797. [Google Scholar] [CrossRef] [PubMed]
- Ragi, N.; Sharma, K. Deliverables from Metabolomics in Kidney Disease: Adenine, New Insights, and Implication for Clinical Decision-Making. Am. J. Nephrol. 2024, 55, 421–438. [Google Scholar] [CrossRef] [PubMed]
- Chen, J.; Amdanee, N.; Zuo, X.; Wang, Y.; Gong, M.; Yang, Y.; Li, H.; Zhang, X.; Zhang, C. Biomarkers of Bipolar Disorder Based on Metabolomics: A Systematic Review. J. Affect. Disord. 2024, 350, 492–503. [Google Scholar] [CrossRef] [PubMed]
- Liu, M.; Ma, W.; He, Y.; Sun, Z.; Yang, J. Recent Progress in Mass Spectrometry-Based Metabolomics in Major Depressive Disorder Research. Molecules 2023, 28, 7430. [Google Scholar] [CrossRef] [PubMed]
- Holčapek, M.; Liebisch, G.; Ekroos, K. Lipidomic Analysis. Anal. Chem. 2018, 90, 4249–4257. [Google Scholar] [CrossRef] [PubMed]
- dos Santos, A.C.A.; Vuckovic, D. Current Status and Advances in Untargeted LC-MS Tissue Lipidomics Studies in Cardiovascular Health. TrAC Trends Anal. Chem. 2024, 170, 117419. [Google Scholar] [CrossRef]
- Han, X.; Gross, R.W. Global Analyses of Cellular Lipidomes Directly from Crude Extracts of Biological Samples by ESI Mass Spectrometry: A Bridge to Lipidomics. J. Lipid Res. 2003, 44, 1071–1079. [Google Scholar] [CrossRef] [PubMed]
- Fahy, E.; Subramaniam, S.; Murphy, R.C.; Nishijima, M.; Raetz, C.R.H.; Shimizu, T.; Spener, F.; van Meer, G.; Wakelam, M.J.O.; Dennis, E.A. Update of the LIPID MAPS Comprehensive Classification System for Lipids. J. Lipid Res. 2009, 50, S9–S14. [Google Scholar] [CrossRef] [PubMed]
- Arévalo, C.; Rojas, L.; Santamaria, M.; Molina, L.; Arbeláez, L.; Sánchez, P.; Ballesteros-Ramírez, R.; Arevalo-Zambrano, M.; Quijano, S.; Cala, M.P.; et al. Untargeted Metabolomic and Lipidomic Analyses Reveal Lipid Dysregulation in the Plasma of Acute Leukemia Patients. Front. Mol. Biosci. 2023, 10. [Google Scholar] [CrossRef] [PubMed]
- Hu, L.; Peng, Z.; Bai, G.; Fu, H.; Tan, D.J.; Wang, J.; Li, W.; Cao, Z.; Huang, G.; Liu, F.; et al. Lipidomic Profiles in Serum and Urine in Children with Steroid Sensitive Nephrotic Syndrome. Clin. Chim. Acta 2024, 555, 117804. [Google Scholar] [CrossRef] [PubMed]
- Van Meulebroek, L.; De Paepe, E.; Vercruysse, V.; Pomian, B.; Bos, S.; Lapauw, B.; Vanhaecke, L. Holistic Lipidomics of the Human Gut Phenotype Using Validated Ultra-High-Performance Liquid Chromatography Coupled to Hybrid Orbitrap Mass Spectrometry. Anal. Chem. 2017, 89, 12502–12510. [Google Scholar] [CrossRef] [PubMed]
- Garwolińska, D.; Młynarczyk, M.; Kot-Wasik, A.; Hewelt-Belka, W. The Influence of Storage on Human Milk Lipidome Stability for Lipidomic Studies. J. Proteome Res. 2022, 21, 438–446. [Google Scholar] [CrossRef] [PubMed]
- Abodi, M.; Mazzocchi, A.; Risé, P.; Marangoni, F.; Agostoni, C.; Milani, G.P. Salivary Fatty Acids in Humans: A Comprehensive Literature Review. Clin. Chem. Lab. Med. (CCLM) 2025, 63, 14–26. [Google Scholar] [CrossRef] [PubMed]
- Aristizabal Henao, J.J.; Metherel, A.H.; Smith, R.W.; Stark, K.D. Tailored Extraction Procedure Is Required To Ensure Recovery of the Main Lipid Classes in Whole Blood When Profiling the Lipidome of Dried Blood Spots. Anal. Chem. 2016, 88, 9391–9396. [Google Scholar] [CrossRef] [PubMed]
- Ferreira, H.B.; Melo, T.; Guerra, I.M.S.; Moreira, A.S.P.; Laranjeira, P.; Paiva, A.; Goracci, L.; Bonciarelli, S.; Domingues, P.; Domingues, M.R. Whole Blood and Plasma-Based Lipid Profiling Reveals Distinctive Metabolic Changes in Systemic Lupus Erythematosus and Systemic Sclerosis. J. Proteome Res. 2023, 22, 2995–3008. [Google Scholar] [CrossRef] [PubMed]
- Snowden, S.G.; Korosi, A.; de Rooij, S.R.; Koulman, A. Combining Lipidomics and Machine Learning to Measure Clinical Lipids in Dried Blood Spots. Metabolomics 2020, 16, 83. [Google Scholar] [CrossRef] [PubMed]
- Agatonovic-Kustrin, S.; Morton, D.W.; Smirnov, V.; Petukhov, A.; Gegechkori, V.; Kuzina, V.; Gorpinchenko, N.; Ramenskaya, G. Analytical Strategies in Lipidomics for Discovery of Functional Biomarkers from Human Saliva. Dis. Markers 2019, 2019, 1–11. [Google Scholar] [CrossRef] [PubMed]
- Zaura, E.; Brandt, B.W.; Prodan, A.; Teixeira de Mattos, M.J.; Imangaliyev, S.; Kool, J.; Buijs, M.J.; Jagers, F.L.P.W.; Hennequin-Hoenderdos, N.L.; Slot, D.E.; et al. On the Ecosystemic Network of Saliva in Healthy Young Adults. ISME J. 2017, 11, 1218–1231. [Google Scholar] [CrossRef] [PubMed]
- Abdshah, A.; Alyamani, M.; Burgess, R.A.; Parekh, D.J.; Spieler, B.; Singal, R.; Abramowitz, M.C.; Merchan, J.R.; Pannunzio, L.; Mahal, B.A.; et al. Metabolomic Insights Into Saliva as a Non-Invasive Surrogate for Serum to Enable Community-Based Biomarker Investigation. Prostate 2026, 86, 771–783. [Google Scholar] [CrossRef] [PubMed]
- Zhao, X.; Chen, X.; Zhou, Z.; Zheng, J.; Lin, Y.; Zheng, Y.; Xu, R.; Hu, S.; Cui, L. Advancements and Challenges in Salivary Metabolomics for Early Detection and Monitoring of Systemic Diseases. MedComm 2025, 6. [Google Scholar] [CrossRef] [PubMed]
- Abodi, M.; Comotti, A.; Turolo, S.; Syren, M.-L.; Tartaglia, G.M.; Cenzato, N.; Bertoni, C.; Bettocchi, S.; Agostoni, C.V.; Mazzocchi, A.; et al. Validity of Fatty Acid Profiling in Saliva: A Comparative Analysis with Blood-Based Matrices. Nutrition 2026, 145, 113086. [Google Scholar] [CrossRef] [PubMed]
- Matczuk, J.; Żendzian-Piotrowska, M.; Maciejczyk, M.; Kurek, K. Salivary Lipids: A Review. Adv. Clin. Exp. Med. 2017, 26, 1021–1029. [Google Scholar] [CrossRef] [PubMed]
- Caterino, M.; Fedele, R.; Carnovale, V.; Castaldo, A.; Gelzo, M.; Iacotucci, P.; Ruoppolo, M.; Castaldo, G. Lipidomic Alterations in Human Saliva from Cystic Fibrosis Patients. Sci. Rep. 2023, 13, 600. [Google Scholar] [CrossRef] [PubMed]
- Gao, K.; Zhou, H.; Zhang, L.; Lee, J.W.; Zhou, Q.; Hu, S.; Wolinsky, L.E.; Farrell, J.; Eibl, G.; Wong, D.T. Systemic Disease-Induced Salivary Biomarker Profiles in Mouse Models of Melanoma and Non-Small Cell Lung Cancer. PLoS ONE 2009, 4, e5875. [Google Scholar] [CrossRef] [PubMed]
- Spick, M.; Lewis, H.-M.; Frampas, C.F.; Longman, K.; Costa, C.; Stewart, A.; Dunn-Walters, D.; Greener, D.; Evetts, G.; Wilde, M.J.; et al. An Integrated Analysis and Comparison of Serum, Saliva and Sebum for COVID-19 Metabolomics. Sci. Rep. 2022, 12, 11867. [Google Scholar] [CrossRef] [PubMed]
- Costa, M.M.; Benoit, N.; Saby, F.; Pradines, B.; Granjeaud, S.; Almeras, L. Optimization and Standardization of Human Saliva Collection for MALDI-TOF MS. Diagnostics 2021, 11, 1304. [Google Scholar] [CrossRef] [PubMed]
- Jurysta, C.; Bulur, N.; Oguzhan, B.; Satman, I.; Yilmaz, T.M.; Malaisse, W.J.; Sener, A. Salivary Glucose Concentration and Excretion in Normal and Diabetic Subjects. BioMed Res. Int. 2009, 2009. [Google Scholar] [CrossRef] [PubMed]
- Goodson, M.; Hartman, M.; Barake, R.; Alsmadi, O.; Al-Mutawa, S.; Ariga, J.; Soparkar, P.; Behbehani, J.; Behbehani, K.; Welty, F. Salivary Glucose Concentration Exhibits Threshold Kinetics in Normal-Weight, Overweight, and Obese Children. Diabetes Metab. Syndr. Obes. 2014, 9. [Google Scholar] [CrossRef] [PubMed]
- Teruya, T.; Goga, H.; Yanagida, M. Human Age-Declined Saliva Metabolic Markers Determined by LC–MS. Sci. Rep. 2021, 11, 18135. [Google Scholar] [CrossRef] [PubMed]
- Nam, M.; Jo, S. rom; Park, J.H.; Kim, M.-S. Evaluation of Critical Factors in the Preparation of Saliva Sample from Healthy Subjects for Metabolomics. J. Pharm. Biomed. Anal. 2023, 223, 115145. [Google Scholar] [CrossRef] [PubMed]
- Fischer, C.L.; Walters, K.S.; Drake, D.R.; Dawson, D. V.; Blanchette, D.R.; Brogden, K.A.; Wertz, P.W. Oral Mucosal Lipids Are Antibacterial against Porphyromonas Gingivalis, Induce Ultrastructural Damage, and Alter Bacterial Lipid and Protein Compositions. Int. J. Oral Sci. 2013, 5, 130–140. [Google Scholar] [CrossRef] [PubMed]
- Aoun, M.; Corsetto, P.A.; Nugue, G.; Montorfano, G.; Ciusani, E.; Crouzier, D.; Hogarth, P.; Gregory, A.; Hayflick, S.; Zorzi, G.; et al. Changes in Red Blood Cell Membrane Lipid Composition: A New Perspective into the Pathogenesis of PKAN. Mol. Genet. Metab. 2017, 121, 180–189. [Google Scholar] [CrossRef] [PubMed]
- Heimerl, S.; Höring, M.; Kopczynski, D.; Sigruener, A.; Hart, C.; Burkhardt, R.; Black, A.; Ahrends, R.; Liebisch, G. Quantification of Bulk Lipid Species in Human Platelets and Their Thrombin-Induced Release. Sci. Rep. 2023, 13, 6154. [Google Scholar] [CrossRef] [PubMed]
- Zalloua, P.; Kadar, H.; Hariri, E.; Abi Farraj, L.; Brial, F.; Hedjazi, L.; Le Lay, A.; Colleu, A.; Dubus, J.; Touboul, D.; et al. Untargeted Mass Spectrometry Lipidomics Identifies Correlation between Serum Sphingomyelins and Plasma Cholesterol. Lipids Health Dis. 2019, 18, 38. [Google Scholar] [CrossRef] [PubMed]
- Barnes, V.M.; Kennedy, A.D.; Panagakos, F.; Devizio, W.; Trivedi, H.M.; Jönsson, T.; Guo, L.; Cervi, S.; Scannapieco, F.A. Global Metabolomic Analysis of Human Saliva and Plasma from Healthy and Diabetic Subjects, with and without Periodontal Disease. PLoS ONE 2014, 9, e105181. [Google Scholar] [CrossRef] [PubMed]
- Hershberger, C.E.; Raj, R.; Mariam, A.; Aykun, N.; Allende, D.S.; Brown, M.; Aucejo, F.; Rotroff, D.M. Characterization of Salivary and Plasma Metabolites as Biomarkers for HCC: A Pilot Study. Cancers 2023, 15, 4527. [Google Scholar] [CrossRef] [PubMed]
- Dollerup, O.L.; Christensen, B.; Svart, M.; Schmidt, M.S.; Sulek, K.; Ringgaard, S.; Stødkilde-Jørgensen, H.; Møller, N.; Brenner, C.; Treebak, J.T.; et al. A Randomized Placebo-Controlled Clinical Trial of Nicotinamide Riboside in Obese Men: Safety, Insulin-Sensitivity, and Lipid-Mobilizing Effects. Am. J. Clin. Nutr. 2018, 108, 343–353. [Google Scholar] [CrossRef] [PubMed]
- Callery, P.S.; Geelhaar, L.A. Biosynthesis of 5-Aminopentanoic Acid and 2-Piperidone from Cadaverine and 1-Piperideine in Mouse. J. Neurochem. 1984, 43, 1631–1634. [Google Scholar] [CrossRef] [PubMed]
- Cheng, J.; Chen, C.; Kristopher, K.W.; Manna, S.K.; Scerba, M.; Friedman, F.K.; Luecke, H.; Idle, J.R.; Gonzalez, F.J. Identification of 2-Piperidone as a Biomarker of CYP2E1 Activity Through Metabolomic Phenotyping. Toxicol. Sci. 2013, 135, 37–47. [Google Scholar] [CrossRef] [PubMed]
- Wang, L.; Lu, W.; Ju, W.; Yao, W.; Shi, C.; Yang, X.; Qian, W. The Salivary Metabolomics Analyses Reveal the Variable Metabolites in Distinct Staging of Periodontitis. BMC Oral Health 2025, 25, 480. [Google Scholar] [CrossRef] [PubMed]
Figure 1.
Distribution of metabolite classes detected in OF (n = 16). Pie chart shows the relative proportions of the 25 chemical classes identified among the 58 metabolites detected by untargeted metabolomic analysis. Amino acids (24%), purines and derivatives (14%), and pyridines and derivatives (7%) were the most abundant classes.
Figure 1.
Distribution of metabolite classes detected in OF (n = 16). Pie chart shows the relative proportions of the 25 chemical classes identified among the 58 metabolites detected by untargeted metabolomic analysis. Amino acids (24%), purines and derivatives (14%), and pyridines and derivatives (7%) were the most abundant classes.
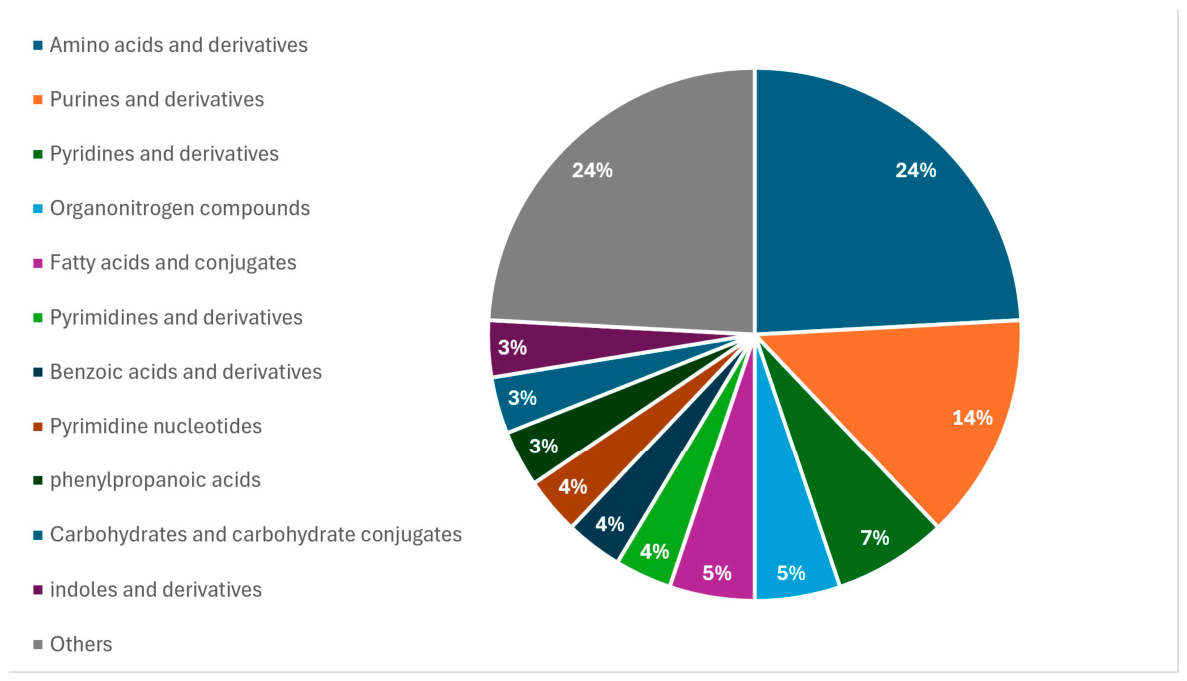
Figure 2.
Distribution of lipid subclasses detected in OF (n = 16). Pie chart shows the 77 lipid subclasses identified among the 730 lipid species detected by untargeted lipidomic analysis. Ether phosphatidylethanolamines (EtherPE, 13 %), sphingomyelins (SM, 8%), phosphatidylethanolamines and phosphatidylcholines (PE and PC, 6%) were the predominant subclasses.
Figure 2.
Distribution of lipid subclasses detected in OF (n = 16). Pie chart shows the 77 lipid subclasses identified among the 730 lipid species detected by untargeted lipidomic analysis. Ether phosphatidylethanolamines (EtherPE, 13 %), sphingomyelins (SM, 8%), phosphatidylethanolamines and phosphatidylcholines (PE and PC, 6%) were the predominant subclasses.
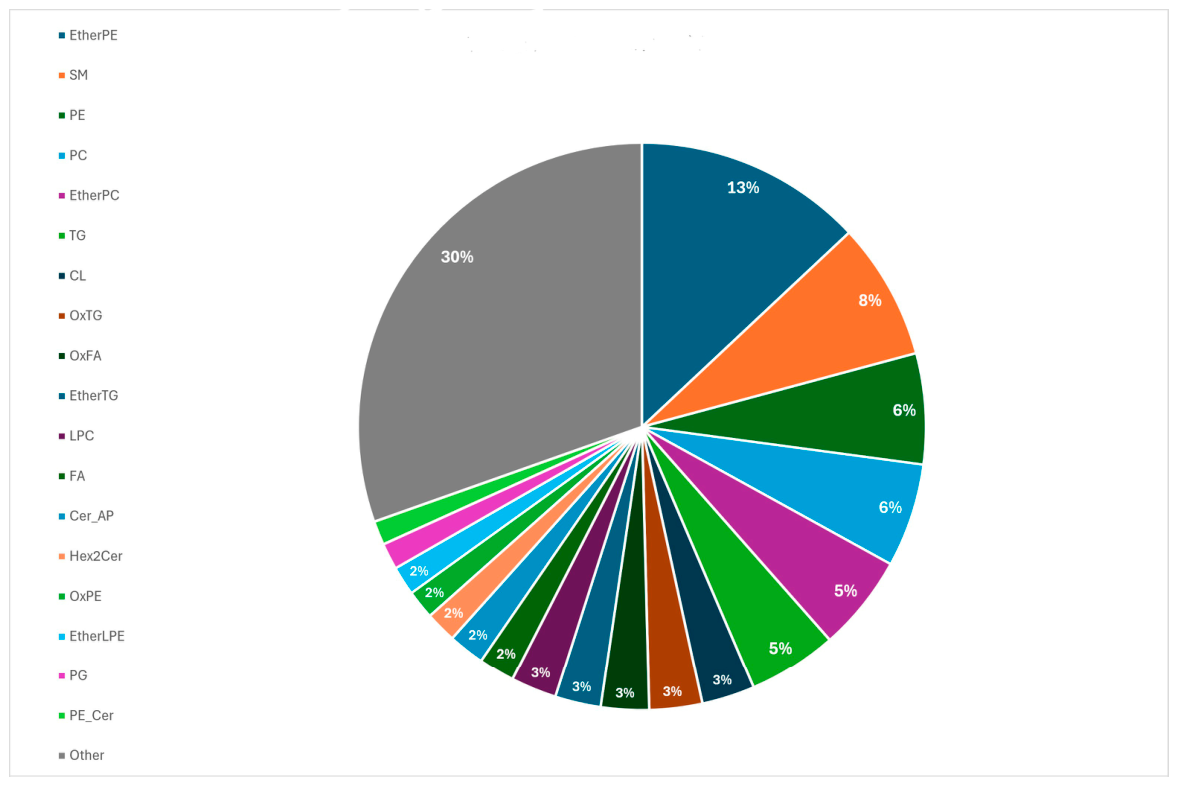
Figure 3.
Distribution of metabolite classes detected in WB (n = 21). Pie chart shows the relative proportions of the 24 chemical classes identified among the 106 metabolites detected. Fatty acids and conjugates (21%), amino acids and derivatives (15%), and fatty acid esters (14%) were the most abundant classes.
Figure 3.
Distribution of metabolite classes detected in WB (n = 21). Pie chart shows the relative proportions of the 24 chemical classes identified among the 106 metabolites detected. Fatty acids and conjugates (21%), amino acids and derivatives (15%), and fatty acid esters (14%) were the most abundant classes.
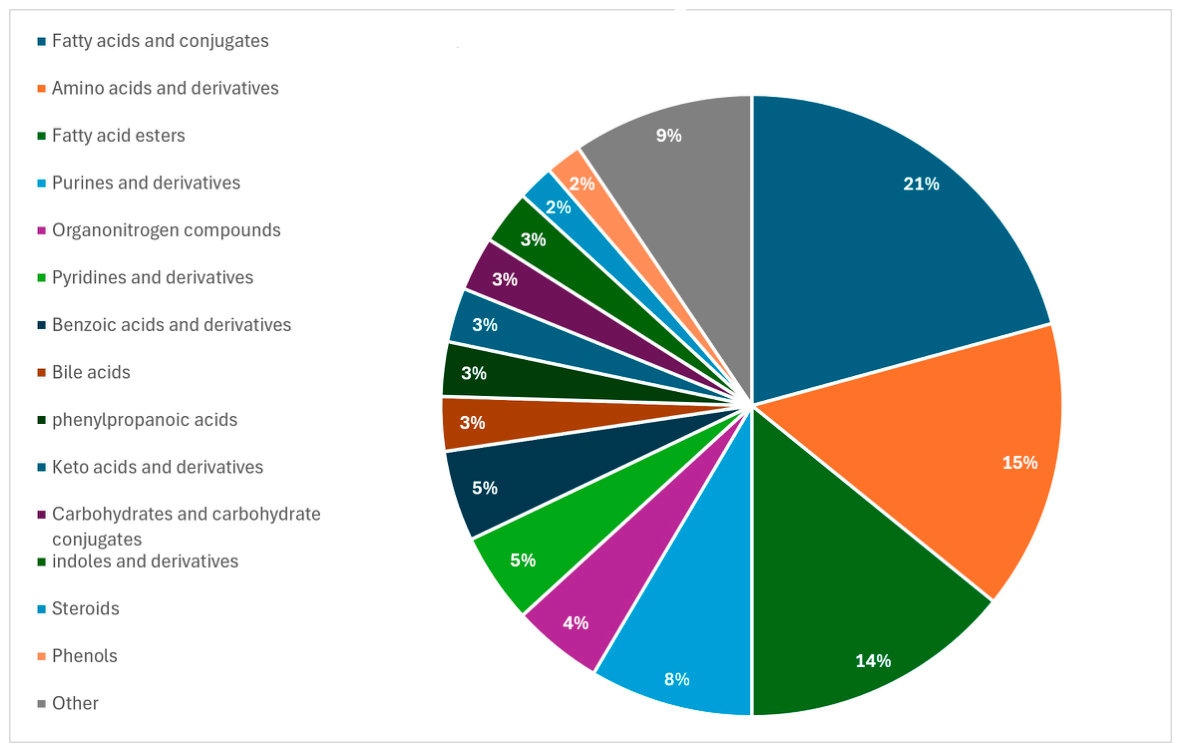
Figure 4.
Distribution of lipid subclasses detected in WB (n = 21). Pie chart shows the 61 lipid subclasses identified among the 859 lipid species detected. Sphingomyelins (SM, ~14%), phosphatidylcholines (PC, 12%), and ether phosphatidylethanolamines (EtherPE, 11%) were the predominant subclasses.
Figure 4.
Distribution of lipid subclasses detected in WB (n = 21). Pie chart shows the 61 lipid subclasses identified among the 859 lipid species detected. Sphingomyelins (SM, ~14%), phosphatidylcholines (PC, 12%), and ether phosphatidylethanolamines (EtherPE, 11%) were the predominant subclasses.
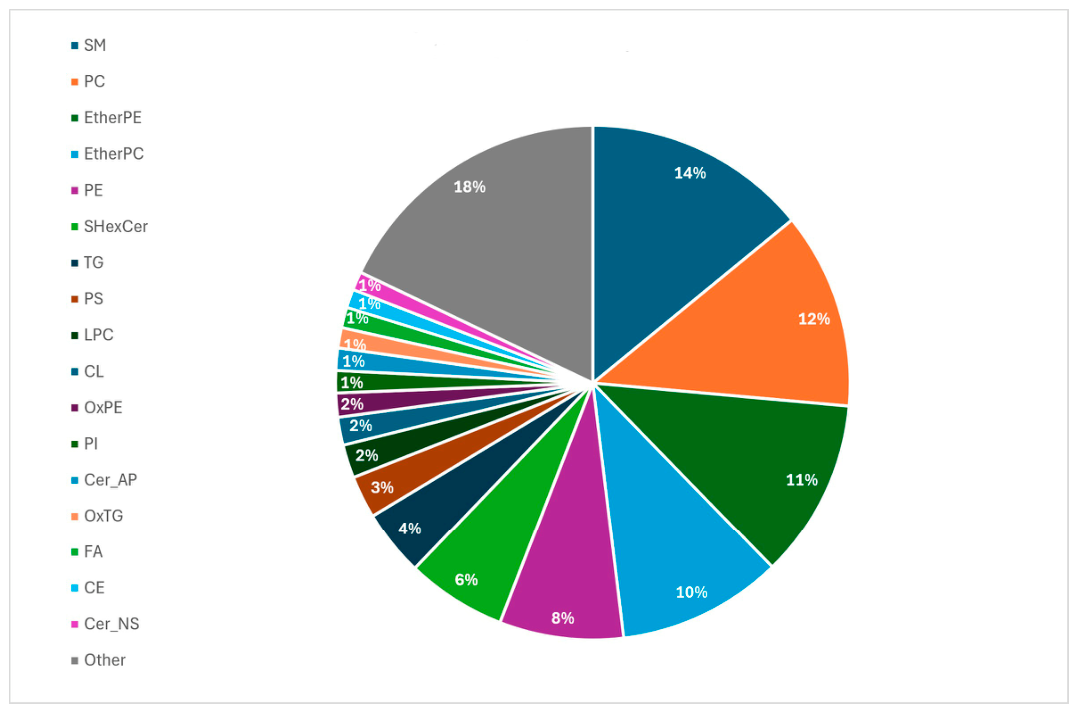
Figure 5.
Volcano plot showing differential abundance between OF and WB. Log₂ fold change (OF vs. WB) is plotted against −log₁₀(p-value). Blue: compounds significantly downregulated in OF (n = 138); red: compounds significantly upregulated (n = 44); grey: not significant compounds (n = 80).
Figure 5.
Volcano plot showing differential abundance between OF and WB. Log₂ fold change (OF vs. WB) is plotted against −log₁₀(p-value). Blue: compounds significantly downregulated in OF (n = 138); red: compounds significantly upregulated (n = 44); grey: not significant compounds (n = 80).
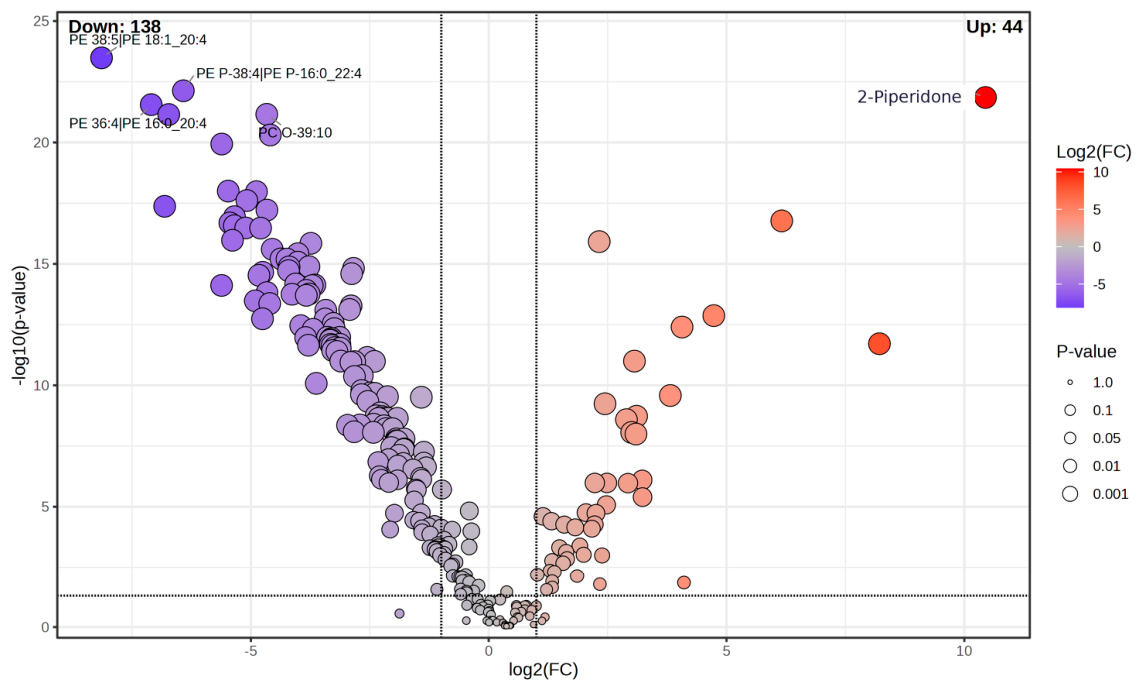
Figure 6.
PLS-DA score plot of OF (red) and WB (green) samples. Component 1 (56.4%) and Component 2 (22%) account for 78.4% of the total variance. Ellipses indicate 95% confidence regions.
Figure 6.
PLS-DA score plot of OF (red) and WB (green) samples. Component 1 (56.4%) and Component 2 (22%) account for 78.4% of the total variance. Ellipses indicate 95% confidence regions.
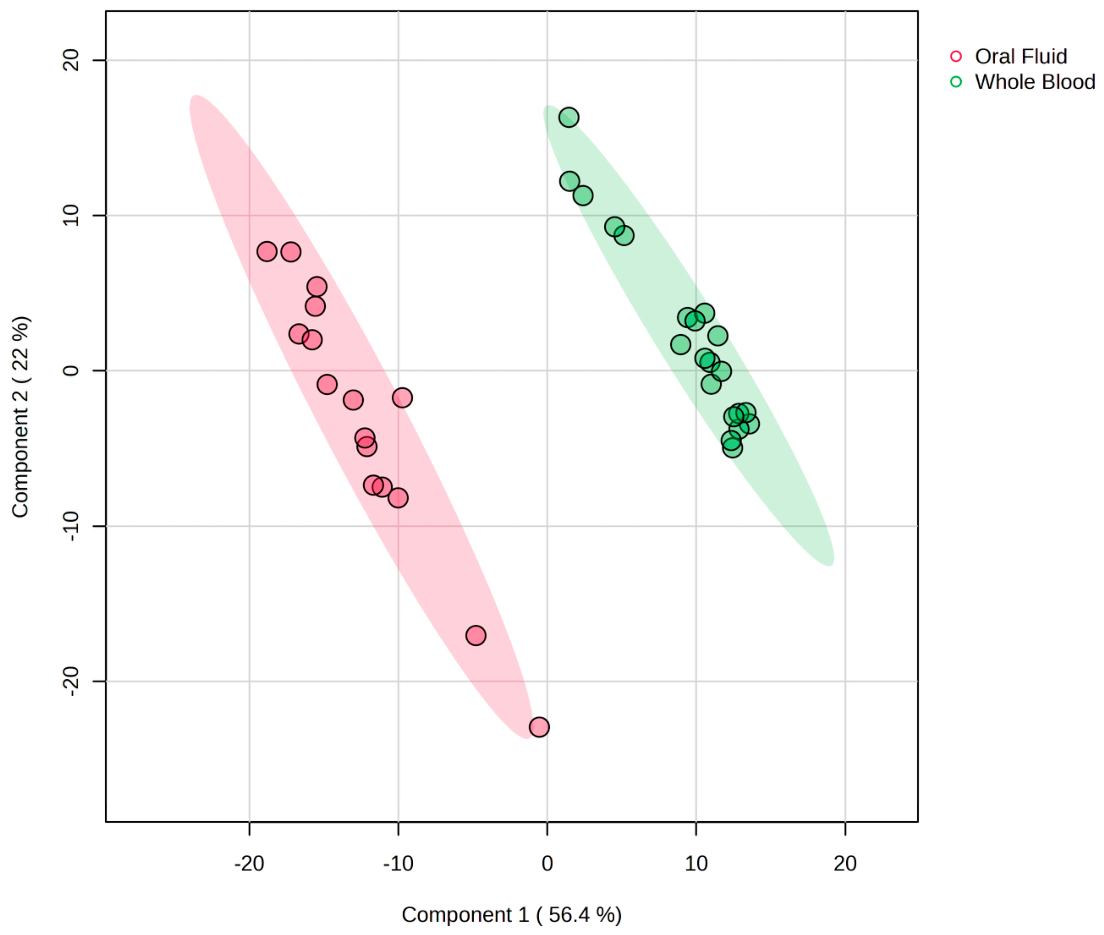
Figure 7.
VIP score plot from the PLS-DA model. Compounds are ranked by their contribution to the separation between OF and WB. Colored boxes indicate relative abundance in each matrix.
Figure 7.
VIP score plot from the PLS-DA model. Compounds are ranked by their contribution to the separation between OF and WB. Colored boxes indicate relative abundance in each matrix.
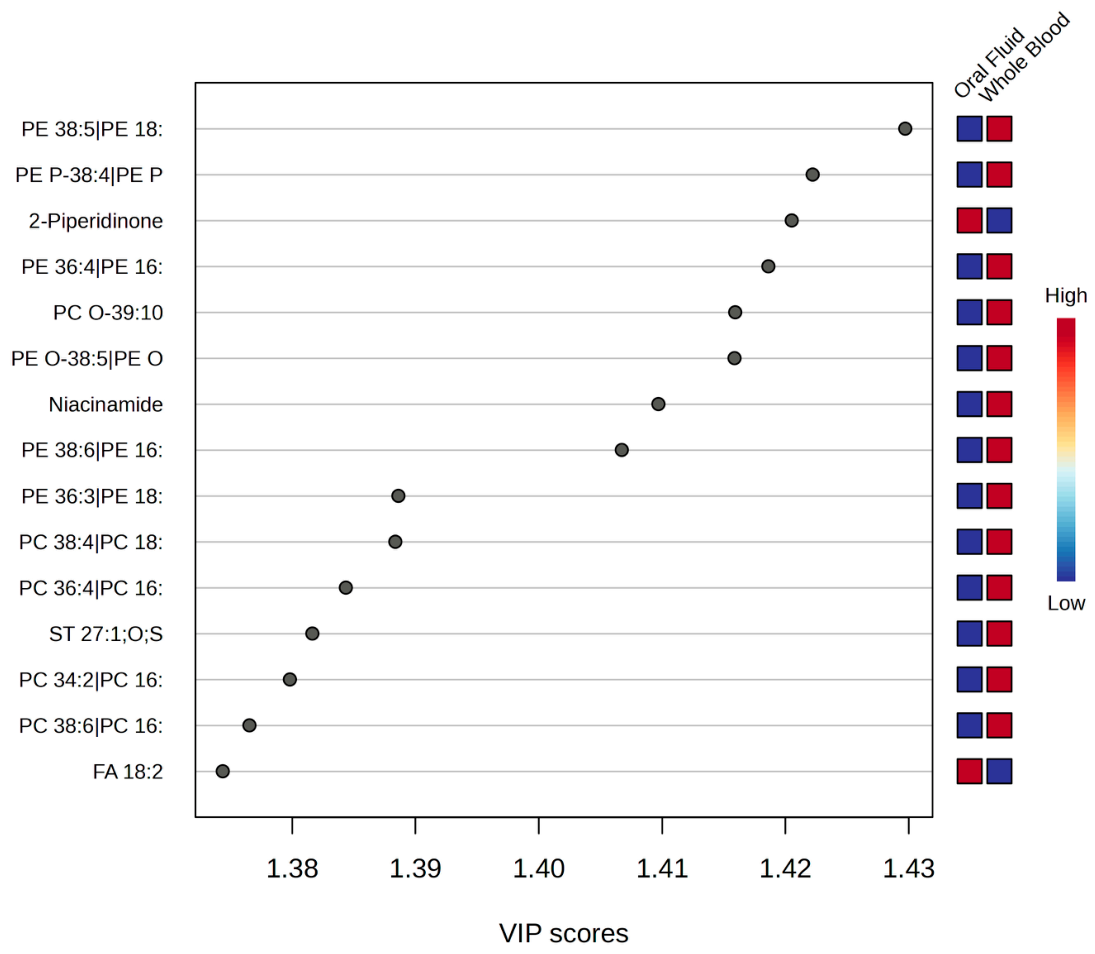
Figure 8.
Hierarchical clustering heatmap of metabolites and lipid species differentiating OF (left cluster) and WB (right cluster). Color scale: red = higher abundance; blue = lower abundance.
Figure 8.
Hierarchical clustering heatmap of metabolites and lipid species differentiating OF (left cluster) and WB (right cluster). Color scale: red = higher abundance; blue = lower abundance.
Disclaimer/Publisher’s Note: The statements, opinions and data contained in all publications are solely those of the individual author(s) and contributor(s) and not of MDPI and/or the editor(s). MDPI and/or the editor(s) disclaim responsibility for any injury to people or property resulting from any ideas, methods, instructions or products referred to in the content. |
© 2026 by the authors. Licensee MDPI, Basel, Switzerland. This article is an open access article distributed under the terms and conditions of the Creative Commons Attribution (CC BY) license (http://creativecommons.org/licenses/by/4.0/).
Copyright: This open access article is published under a Creative Commons CC BY 4.0 license, which permit the free download, distribution, and reuse, provided that the author and preprint are cited in any reuse.