

Submitted:
12 August 2026
Posted:
13 August 2026
You are already at the latest version
Abstract
Diesel exhaust (DE) is a major traffic-related pollutant linked to adverse health outcomes, but existing methods for estimating indoor DE exposure fall short, as common surrogates like black carbon (BC), NOx, and PM2.5 are not sufficiently specific to diesel sources. 1-Nitropyrene (1-NP), a nitro-PAH preferentially formed during diesel combustion, has rarely been studied as an indoor exposure indicator. We measured 1-NP and isomeric nitro-PAHs (2-nitropyrene, 2-nitrofluoranthene) in indoor air and house dust from 40 homes in the eastern San Francisco Bay Area, CA, across two sampling events, alongside continuous indoor BC monitoring. We assessed 1-NP’s utility as a DE proxy using summary statistics, diagnostic nitro-PAH ratios, correlations with monitored pollutants, and single-predictor mixed-effects models relating 1-NP to spatial DE predictors. 1-NP was frequently detected in air (74%) and dust (97%), with median concentrations of 0.42 pg/m³ (IQR 0.32 - 0.54) and 340 pg/g (IQR 190 - 620), respectively. Air and dust 1-NP were moderately correlated (r=0.40, p = 0.02), as was BC with 1-NP (air r=0.38, dust r=0.47; p<0.01). Diagnostic ratios (2-NFl:1-NP <5) indicated dominant primary emission sources. Dust 1-NP showed numerous significant associations with spatial DE predictors, while air 1-NP showed fewer. Overall, 1-NP shows promise as a diesel-specific indoor exposure proxy integrating longer-term exposure and aligning with spatial DE predictors.
Keywords:
diesel exhaust
; 1-nitropyrene
; indoor air pollution
; black carbon
; air
; dust
1. Introduction
Traffic-related air pollution contributes to a range of acute and chronic adverse health outcomes. Diesel exhaust (DE) is of particular concern and has been classified by the International Agency for Research on Cancer (IARC) as carcinogenic to humans (Group 1) [1]. The State of California also lists diesel engine exhaust as a carcinogen under Proposition 65, which identifies chemicals that may cause cancer, birth defects, or other reproductive harm. DE exposure is also associated with other serious health effects, including asthma, which is of particular concern for children [1]. Although recent regulations in California have significantly reduced DE emissions, many communities continue to experience disproportionately high exposures [2,3,4,5,6,7]. Historically, most DE exposure science has focused on occupational and outdoor residential settings, and comparatively fewer studies have characterized diesel-specific exposure indicators in residential indoor environments, where people spend the majority of their time [8,9].
DE is a complex mixture of gases and particulate matter (PM) that includes polycyclic aromatic hydrocarbons (PAHs) [10]. As a result, DE has traditionally been estimated using surrogate markers, including oxides of nitrogen (NOx, comprising NO and NO2), black carbon (BC), or PM. Although these markers perform well in emissions models and can be measured easily and relatively inexpensively, they are not sufficiently specific to diesel exhaust [11,12,13,14]. NOx is abundant in exhaust from both gasoline and diesel vehicles, and produced by residential gas combustion, limiting their usefulness for distinguishing diesel from gasoline emissions [15,16]. While these surrogate markers are associated with significant health impacts of their own, the identification of a specific and easily measurable indicator of DE is crucial for studies aiming to characterize its effects on health and to support epidemiologic analyses.
One compound found in DE is 1-nitropyrene (1-NP), a nitrated polycyclic aromatic hydrocarbon (NPAH) formed in the high-temperature and air-rich combustion chambers of diesel engines [1,17]. 1-NP is emerging as a possible marker of DE exposure due to its abundance in DE relative to other combustion sources. 1-NP is the most prevalent of more than 60 NPAHs found in DE particulate matter, and the amount formed through atmospheric photochemical reactions is minor [15,18,19]. The adoption of 1-NP as a DE exposure marker may help exposure studies distinguish DE from other combustion sources [20,21]. The validation of 1-NP as a DE exposure indicator is also important because, like related NPAHs, it is mutagenic and likely carcinogenic, and its measurement can help quantify cancer risk specifically attributable to diesel exhaust [1,22,23,24]. Although 1-NP shows strong potential as a diesel-specific exposure indicator, its use in environmental exposure assessment remains limited. Only five studies that we are aware of have measured 1-NP in residential indoor air [25,26,27,28,29], and measurements in household dust are exceedingly rare, with only one study that we are aware of reporting concentrations in home dust matrices [30]. The current limited literature highlights the need for further characterization of 1-NP in indoor environments and across multiple exposure pathways.
Many studies of traffic-related air pollution use land-use regression (LUR) to predict pollutant concentrations at a finer spatial resolution than is available from fixed-site monitoring and to understand the relationship between relevant variables and air concentration outcomes [31,32,33]. These models often use pollutant concentrations measured at spatially distributed fixed sites along with spatial characteristics and temporal variables to develop exposure models. These variables often include traffic volumes, road and population density, season, and land use [34]. Because 1-NP is a promising diesel-specific exposure indicator that has rarely been evaluated within the LUR framework, it is important to determine whether common LUR predictors (e.g., roadway proximity, truck traffic, built environment variables) explain spatial variability in 1-NP, thereby informing future epidemiologic and exposure modeling studies. For this reason, this study will explore the associations between measured 1-NP and a selection of variables commonly used in this kind of modeling.
This study evaluated 1-NP in indoor air and household dust as a more specific marker of DE exposure. The inclusion of household dust is particularly important because dust can serve as a longer-term integrative reservoir for particle-bound pollutants such as 1-NP, capturing exposures that may not be reflected in shorter-duration air samples. Using measurements of 1-NP in air and dust samples collected from 40 homes as part of the East Bay Diesel Exposure Project [35], we compare concentrations of 1-NP with commonly used DE surrogate markers and identify variables significantly associated with DE exposure in the home. By measuring 1-NP in both indoor air and household dust, this study fills a critical gap in the literature and provides new insight into diesel-related exposures in the residential environment.
2. Materials and Methods
2.1. Study Design
We collected air and dust samples from 40 homes in California’s eastern San Francisco Bay Area during two sampling rounds conducted between January 2018 and February 2019 (Figure 1). We recruited participants in neighborhoods with a range of diesel exhaust exposure using CalEnviroScreen version 3.0, a mapping tool developed by the California Office of Environmental Health Hazard Assessment (OEHHA). This tool ranks California communities based on their cumulative pollution burden, including diesel emissions, and community vulnerability [36]. Particular emphasis was placed on recruiting in high exposure, environmental justice communities such as West Oakland (Alameda County) and Richmond (Contra Costa County). Each family participated in two three-day sampling rounds separated by an average of four months (range: 0.5–8 months). Written informed consent was obtained from participants, and all procedures were reviewed and approved by the UC Berkeley and State of California committees for the protection of human subjects. Further detail on study design and participant recruitment has been described previously [35].
2.2. 1-NP Sampling in Household Dust
The dust sampling methods used in this study have been described previously [35]. House dust samples were collected during the first sampling period from vacuum bags or floor sweepings and analyzed for 1-NP following methods developed by the University of Washington (UW) [35,37]. In addition to 1-NP, dust samples were analyzed for 2-nitropyrene (2-NP) and 2-nitrofluoranthene (2-NFl), two compounds that help determine whether the measured 1-NP originated from primary emissions or from secondary atmospheric reactions [38]. For quality control, a subset of dust samples was split into duplicates and analyzed separately. Concentrations from these replicates were averaged to obtain a single value for analysis. Some dust samples had analytical interferences or insufficient mass for quantification, resulting in a total of 36 valid measurements out of 45 samples. The valid measurements represent 33 of the 40 total homes. One measurement was below the limit of quantification (LOQ) and had no reported value. This sample was substituted with an imputed value of the LOQ divided by the square root of two [35,39]. All concentrations are reported in picograms per gram (pg/g).
2.3. 1-NP and BC Sampling in Indoor Air
The air sampling and laboratory methods used in this study have been described previously [3,35,40]. Aerosol Black Carbon Detectors (ABCDs) were deployed in participants’ homes to monitor BC air concentrations and sample air for 1-NP continuously over each three-day sampling period. The ABCD computes real-time BC concentrations at 5-second intervals based on optical reading of particles collected on a Teflon-coated glass fiber filter (Pall Life Sciences Emfab Filter, Ann Arbor, MI). The ABCD draws air at approximately 111 cc/min for a mean (SD) volume of 0.49 (0.03) m3 sampled during each three-day sampling period. After BC data were downloaded, the ABCD filters were removed and shipped to the UW laboratory for analysis of 1-NP, 2-NP and 2-NFl, following previously described methods [37]. Air 1-NP, 2-NP, and 2-NFl concentrations are reported in picograms per cubic meter (pg/m3). BC measurements flagged as outliers were discarded, and samples flagged for interference relating to high attenuation or flow-rate issues were also removed [3]. The remaining BC measurements were averaged to produce a single value for each sampling location and period. BC concentrations are reported in micrograms per cubic meter (μg/m3).
2.4. Spatial and Temporal Predictor Variables
We aggregated data on several predictor variables (Table 1), which we selected for their known association with DE concentrations and use in LUR modeling [12,21]. To estimate traffic density (TD), we used Annual Average Daily Traffic (AADT) volumes by roadway link from the California Department of Transportation’s Highway Performance and Monitoring System (HPMS). The traffic density for each sampling location was calculated using the following formula:
where TD is the traffic density (vehicles x meters/day/meter2, or VMT/m2), AADT is the annual average daily traffic (vehicles/day), L is the length of road segment (m - meters), and AB is the buffered area around each home location (meters2). We calculated TD for three different buffer sizes based on literature reviews: 350m, 500m, and 1000m [12,14]. These buffers were also used to capture other potential predictors of diesel emissions, such as major road length, length of road in the truck network, and bottleneck road length (Table 1). Distances to possible DE sources were also included as predictors. All spatial data were linked to sampling locations and corresponding buffers using the geographic information system (GIS) program, ArcGIS Pro (ESRI, Redlands, CA).
While not measured directly in this study, meteorological data as well as daily ambient air quality data (NOx, PM2.5, and BC) were extracted from the Bay Area Air Quality Management District’s (BAAQMD) publicly available air monitoring database. We used GIS software to link air quality and meteorological data from the nearest regulatory monitoring station to each residential sampling location. In total there were nine, eight, and two regulatory monitors with data available for NOx, PM2.5, and BC, respectively. Meteorological and air quality data were averaged over each three-day home air sampling period and averaged for dust over the 30 days prior to sample collection. The 30-day span was used to account for the persistence and stability of 1-NP in house dust relative to air [41,42]. This approach provides a more temporally relevant comparison between longer-lived dust reservoirs and shorter-term air concentrations. The summarized air quality data (NOx, PM2.5, and BC) were considered as traditional DE surrogate indicators which were compared to our measured 1-NP concentrations.
2.5. Statistical Analysis
We computed summary statistics for 1-NP and BC in air and 1-NP in dust, and for ratios of 2-NFl to 2-NP and 2-NFl to 1-NP for air and dust. Detection frequencies for 1-NP in air and dust were calculated as the number of samples above their respective LOQs divided by the total number of valid samples. Ratios were only calculated for samples where both measurements were detected. All further analyses were conducted using natural log-transformed values for these air and dust measurements. Beta coefficients from these models were exponentiated, subtracted by 1, and multiplied by 100 to express the results as a percent change in pollutants with respect to a one-unit increase in predictor variables. Additionally, dust measurements below the LOQ were imputed as the detection limit divided by the square root of two, and one extreme but valid dust outlier was imputed with the next highest valid measurement. All reported 1-NP air concentrations, including those below the LOQ, were used in this analysis. Pearson correlation coefficients were calculated between DE surrogate indicators (NOx, PM2.5, and BC) and air measurements over both sample periods, and air and dust measurements for only the first sampling period, as dust was not measured in the second period. Pearson correlation coefficients of air measurements between sampling periods one and two were also calculated.
The effect estimates of spatial predictor variables were characterized through individual mixed-effects models. Each model included a random effect for sampling location and fixed effects for average temperature and average relative humidity for that location and sampling period. Because sample collection occurred over approximately 13 months (January 9, 2018 - February 1, 2019), it is likely that seasonal variation contributed to differences in concentrations between sampling locations and time points. We considered daily ambient meteorological conditions (temperature and humidity) to account for this temporal variability [43,44,45,46,47]. Although concentrations were not highly correlated between sampling periods at the same location, we chose to use mixed-effects models rather than simple linear regressions for robustness. Mixed models were also used to analyze the associations with seasonal period. The seasonal periods were defined as fall/winter (1/9/2018–3/19/2018 and 9/22/2018–2/1/2019) and spring/summer (3/20/2018–9/21/2018). Statistical analyses were performed using the R statistical program version 4.3.2 (R Development Core Team 2023).
3. Results
Table 2 summarizes the measured concentrations of 1-NP and BC in indoor air and 1-NP in house dust, as well as the ratios of 2-NFl to 2-NP and 2-NFl to 1-NP. Measurements of 1-NP in air and dust had high detection frequencies (74% and 97%, respectively). The median and inter-quartile range (IQR) concentrations of 1-NP and BC in air were 0.42 (0.32-0.54) pg/m3 and 0.35 (0.27-0.72) µg/m3, respectively, and the median (IQR) concentration of 1-NP in dust was 340 (190-620) pg/g. One dust sample had a 1-NP concentration approximately 200-fold higher than the next highest sample, and a thorough quality assurance review indicated no laboratory errors. For analysis, this value was replaced with the next highest valid measurement.
2-NFl and 2-NP are formed primarily through secondary atmospheric reactions involving parent PAHs fluoranthene and pyrene rather than through direct combustion emissions. These reactions occur through oxidant-initiated pathways involving hydroxyl (OH) radicals or nitrate (NO3) radicals. The concentration ratio of 2-NFl:1-NP helps estimate the relative contribution of atmospheric reaction formation routes compared with direct emission from primary sources [37]. A 2-NFl:1-NP concentration ratio ≥ 5 is indicative of NPAH levels dominated by atmospheric reactions, and a ratio < 5 indicates mostly primary emissions [48]. The ratio of concentrations of 2-NFl:2-NP is used to assess relative contribution of two distinct production routes for 2-NFl. A 2-NFl:2-NP ratio close to 10 indicates 2-NFl formation mostly via the hydroxyl-initiated pathway, and a ratio closer to 100 indicates predominantly NO3 initiated 2-NFl formation [49,50]. These diagnostic ratios help distinguish secondary photochemically formed NPAHs from those directly emitted by diesel combustion, and for contextualizing the sources contributing to measured indoor concentrations. Because 2-NFl and 2-NP had lower detection frequencies, fewer ratios could be calculated. All detected air and dust samples had a 2-NFl:1-NP ratio of less than five and a 2-NFl:2-NP ratio closer to 10 than 100. Considering only ratios with detected measurements, 2-NFl:1-NP in indoor air had a median of 0.78 and maximum of 4.78, and in dust had a median of 0.28 and a maximum of 0.88. For the ratio 2-NFl:2-NP, the median and maximum in air were 1.53 and 4.28, and in dust were 1.48 and 3.64.
Table 3 presents summary statistics for ambient air monitoring data of selected DE indicators extracted from the BAAQMD database. Shown are the combined three-day averages for each sampling location and period. The median (IQR) for monitored outdoor BC was 0.77 (0.64-0.98) μg/m3, for NOx was 0.02 (0.01-0.02) parts per million (ppm), and for PM2.5 was 8.45 (6.78-11.18) μg/m3. PM2.5 also had a particularly high maximum of 116.34 μg/m3.
Concentrations of 1-NP from air and dust samples collected at the same study visit were moderately correlated (r = 0.4, p = 0.02), and indoor BC was significantly correlated with both air and dust 1-NP concentrations (r = 0.38, p < 0.01; r = 0.47, p < 0.01, respectively) (Figure 2). NOx, PM2.5, and outdoor BC were moderately to highly correlated with one another (p<0.01). Correlations between 1-NP in dust and monitored air quality data were computed using 30-day averages of monitored data, whereas three-day averages were used for correlations with 1-NP in air. All correlations involving dust used data from the first sampling period only because dust was not collected during the second period.
Consistent with well-documented seasonal patterns of air pollution, air 1-NP concentrations were significantly higher in fall and winter months [geometric mean (95% CI) = 0.49 (0.44, 0.56) pg/m3] than in spring and summer months [0.37 (0.33, 0.41) pg/m3] (Figure 3). Indoor BC, outdoor BC, and outdoor NOx all displayed the same pattern as air 1-NP. In contrast, 1-NP in dust and outdoor PM2.5 had lower medians in the fall/winter than in the spring/summer but displayed a wider range of values in fall/winter than in spring/summer. Dust may be less sensitive to temporal trends because it persists and accumulates in the home. Additionally, indoor air 1-NP concentrations were not correlated between sampling periods.
Table 4 presents the results from univariate models of 1-NP and BC in indoor air and 1-NP in house dust. Each model was adjusted for average temperature and humidity, and models of 1-NP and BC in indoor air included a random effect for sampling location to account for the multiple samples taken from each location. Spatial predictors significantly associated (p < 0.05) with 1-NP in indoor air were total length of HPMS road segments and the number of permitted sources within a 1000m buffer of the sampling location. The most significant spatial predictors of indoor BC concentrations were length of major roads within a 350m and 500m buffer, and the number of permitted sources within a 500m buffer. Most spatial predictors had significant associations with 1-NP in house dust. The significant predictors of 1-NP in house dust were (1) distance to the nearest truck network road; (2) length of HPMS road, length of major road, and number of permitted sources within 350m; (3) length of HPMS road, length of major road, all traffic density, and number of permitted sources within 500m; and (4) length of HPMS road, length of major road, and all traffic density within 1000m.
Appendix Table A1 presents results from models that predict outdoor NOx, PM2.5, and BC. Ambient BC and NOx measured by regulatory monitors were significantly associated only with the number of permitted sources within a 500m buffer of each sample location, and PM2.5 had no significant associations.
4. Discussion
In this study, we aimed to evaluate use of 1-NP in indoor air and house dust as an indicator of diesel exhaust (DE) exposure compared with commonly used markers such as NOx, PM2.5, and BC. We found that 1-NP, a diesel engine combustion product with minimal contributions from non-diesel sources, was present in indoor air and dust samples at nearly all sampling locations, indicating widespread exposure to DE in these 40 East Bay homes. The high detection frequencies demonstrate the potential for using 1-NP concentrations in air and dust to characterize DE exposures indoors and at fixed locations. Use of 1-NP in dust is particularly promising for examinations of non-inhalation exposure to diesel combustion products via hand-to-mouth behaviors, floor contact, and dermal absorption in young children [8,51]. Because indoor dust serves as a reservoir for semi-volatile and particle-bound contaminants and accumulates over weeks to months, the ability of dust 1-NP to integrate longer exposure windows is an important advantage over short-term air sampling [41,42,52]. Moderate correlations between 1-NP measured in air and dust further support the utility of either matrix to characterize exposure. Nearly all other correlations between measured and ambient NOx, PM2.5, and BC were similarly strong and significant. 1-NP in indoor air was most highly correlated with outdoor NOx, and 1-NP in house dust was most highly correlated with indoor BC. The consistency of these associations between measured 1-NP and DE-related ambient monitoring data provides further validity to 1-NP’s relationship with DE and supports its potential use as an improved surrogate marker.
It is important to note that diesel sources influencing exposures in this study likely reflect predominantly newer diesel engine technologies, including engines equipped with emission control devices such as diesel particulate filters (DPFs), diesel oxidation catalysts (DOCs), and selective catalytic reduction (SCR) systems. Prior work has shown that modern diesel engines can exhibit substantially lower 1-NP-to-PM emission ratios compared with older diesel technologies, raising concerns about the utility of 1-NP as a surrogate for bulk diesel particulate matter in contemporary settings [53]. However, because 1-NP remains strongly enriched in diesel exhaust relative to other combustion sources, it may function more effectively as a marker of diesel combustion influence rather than as a quantitative proxy for total diesel PM mass.
1-NP is by far the most abundant NPAH in diesel particulate matter and is much less abundant in PM derived from other sources. Levels of 1-NP generally vary depending on local diesel-related activity, such as traffic intensity. In contrast, 2-NFl and 2-NP are formed largely via gas-phase atmospheric reactions from fluoranthene and pyrene which are emitted from multiple anthropogenic and natural sources and vary little with traffic density [18,54]. Atmospheric conditions, such as the abundance of gas-phase parent PAHs, influence the formation of 2-NP and 2-NFl, leading to more day-to-day variation in these compounds compared with 1-NP, which more directly reflects primary diesel combustion emissions [55].
In our study, the ratios showed that at all sampling times and locations with valid 2-NFl and 2-NP measurements, the 1-NP measured was more likely from primary emissions sources rather than secondary atmospheric reactions. Because these ratios were originally developed and validated using airborne particulate matter, their application to dust samples should be interpreted with caution. Dust may contain older, more aged PM; may reflect differential sorption or degradation of NPAHs; and may not strictly conform to diagnostic ratio cut points established for ambient aerosols. Nevertheless, the consistency between the air and dust results strengthens the conclusion that the measured NPAHs were strongly influenced by primary diesel emissions. Future studies confirming the use of co-measured chemical tracers and receptor modeling would further strengthen source attribution of indoor NPAHs.
In addition to evaluating correlations between 1-NP measured in this study and ambient air pollutant data from nearby monitors, we also explored relationships between these measures and commonly used predictors of DE in LUR modeling. Results from these models showed few significant associations of DE predictors with ambient air concentrations of NOx, PM2.5, and BC, including measured indoor 1-NP in air. Conversely, there were numerous significant associations between DE predictors and 1-NP in house dust. Because of the lack of sunlight, biological activity, and other factors, 1-NP is likely to persist and accumulate in house dust, consistent with our finding of both higher detection frequency and stronger associations with spatial DE predictors [41,42,52,56]. Truck and heavy-duty vehicle traffic density was non-significantly positively associated with dust 1-NP (p-value=0.07-0.08). This may reflect the skewed concentration of those vehicle types toward areas further from our sample locations. These findings are expected given that diesel particulate matter infiltrates into homes through windows, doors, and other openings, and accumulates over longer time frames than gas or vapor-phase airborne contaminants. 1-NP and BC measured in indoor air may be more susceptible to short-term influences, such as opening doors and windows as well as running gas appliances.
Taken together, these results suggest that conventional LUR models relying on ambient monitoring data or traditional DE surrogate markers may have limited ability to capture residential-scale spatial contrasts in diesel-related exposures. Incorporating more stable, diesel-specific markers such as 1-NP in dust could improve LUR performance for DE by better representing longer-term infiltration and accumulation processes. Future studies with larger sample sizes could explicitly integrate 1-NP into LUR development to assess whether it enhances model specificity and predictive accuracy for DE exposure.
Questionnaire responses relating to household activities and potential exposures were also collected as part of this study. Data on stove use and fuel type (e.g., gas, electric), smoking, candle or incense burning, sweeping and vacuuming, use of air purifiers, and other factors that could influence measured 1-NP levels were explored. Although certain indoor combustion activities may emit NPAH precursors, associations with available questionnaire data did not indicate meaningful contributions to 1-NP levels and therefore were not included in the manuscript. This further supports our interpretation that the measured 1-NP primarily originated from infiltrated DE.
Selected concentrations of 1-NP in air from previous studies are reported in Appendix Table A2. While there are multiple studies measuring 1-NP concentrations in urban, rural, and industrial outdoor environments, very few have measured 1-NP in indoor residential environments, with even fewer reporting those concentrations. One such study reported indoor concentrations of 0.67 pg/m3 in urban residences and 0.28 pg/m3 in rural residences, values which are consistent with our reported range [28]. Compared with previous studies, the 1-NP concentrations measured in indoor air were similar to outdoor levels reported in Seattle, Washington (median: 0.49 pg/m3) [21]. However, outdoor concentrations of 1-NP were reported to be higher in regions with higher diesel traffic, e.g., near the San Ysidro, CA US-Mexico border crossing (median: 1.3 pg/m3) [57]. To our knowledge, only one other study has measured 1-NP in house dust [30]. This residential study in Greece found concentrations comparable to those presented here (median: 838 pg/g).
One limitation of this study was its relatively small sample size. With 33 dust samples and 76 air samples used in this analysis, we had limited statistical power for more extensive modeling efforts. In addition, because study enrollment was primarily focused in areas expected to have a higher burden of diesel-related exposures, results may not be fully generalizable to other populations. Also, spatial autocorrelation was not examined due to the sparse and irregular spatial distribution of sampling locations, which limited the feasibility of conducting robust spatial diagnostics. However, prior LUR studies have shown that although pollutant concentrations themselves often exhibit spatial autocorrelation, the residuals of LUR models are typically independent [12,31,32,33,34]. Thus, though we were unable to evaluate spatial autocorrelation directly, this limitation is unlikely to substantially bias interpretation of the analyses presented here. An additional consideration is that the lower detection frequency for air relative to dust could be a result of the low total air volume sampled due to the flow rate of the ABCD pumps. Further, monitored PM2.5 concentrations used in this analysis may have been influenced by regional wildfire smoke from the 2018 “Camp Fire”, roughly 150 miles from our study area, which substantially elevated ambient PM2.5 levels across large areas for roughly two weeks. Such episodic, non-traffic-related contributions to PM2.5 could introduce some exposure misclassification with respect to diesel-related pollution, potentially attenuating associations between monitored PM2.5 and diesel-specific markers to an unknown degree. Without further quantification of its contribution, this fire is a potential, but likely limited, source of bias. Finally, the absence of co-measured traffic-related pollutants (NOx, PM2.5, or BC) in dust precluded direct within-matrix comparisons that could further contextualize correlations observed between dust 1-NP and ambient air measurements. Although 1-NP shows significant promise as a more specific marker of DE, minute levels have been detected in some non-diesel combustion emissions, including gasoline combustion, coal smoke, wood smoke, and kerosene heater emissions [1,58]. However, the relative abundance of 1-NP in diesel emissions, combined with its low presence in other combustion profiles, reinforces its specificity.
This study demonstrates that 1-NP, an NPAH characteristic of DE, is reliably measured in residential indoor air and household dust, addressing a methodological gap in non-invasive DE exposure assessment. Dust 1-NP showed higher detection frequency than indoor air 1-NP, stronger associations with spatial predictors of diesel emissions, and diagnostic ratios consistent with primary diesel sources, suggesting that dust may better capture longer-term, cumulative DE exposure than air sampling alone. These patterns are encouraging, but they are best understood as an early signal rather than as validation. Confirming 1-NP’s role as a DE exposure indicator will require larger, geographically diverse studies with repeated sampling, co-located source apportionment to rule out non-diesel NPAH sources, and evaluation against health outcomes. At this stage, we view the present findings as motivation for, rather than confirmation of, 1-NP’s potential utility as a DE exposure measure in epidemiologic studies.
Author Contributions
Conceptualization, A.B. and R.C.; methodology, A.B., R.C., D.K., R.B., R.P., and C.S.; software, A.R. and K.R.; validation, A.R., C.S., M.P., and K.R.; formal analysis, A.R. and K.R.; investigation, A.B., C.S., D.K., M.P., R.C., and R.P.; resources, A.B., C.S., M.P., R.C., and R.P.; data curation, A.R., and K.R.; writing—original draft preparation, K.R.; writing—review and editing, A.B., A.R., C.S., D.K., M.P., K.R., R.B., R.C., and R.P.; visualization, A.R. and K.R.; supervision, A.B.; project administration, D.K. and R.C.; funding acquisition, A.B. All authors have read and agreed to the published version of the manuscript.
Funding
This research was funded in part by California Office of Environmental Health Hazard Assessment (OEHHA) Agreement Number 16-E0017.
Institutional Review Board Statement
The East Bay Diesel Exposure Project (EBDEP) was approved by the University of California, Berkeley Committee for Protection of Human Subjects (protocol number 2017-06-10042; initial approval on 11/7/17) and the California Health and Human Services Agency Committee for the Protection of Human Subjects (project number 2017-048; initial approval on 11/20/17).
Informed Consent Statement
Informed consent was obtained from all adult subjects involved in the study.
Data Availability Statement
De-identified data supporting the findings of this study are available from the authors upon reasonable request. Certain study data cannot be made publicly available due to IRB restrictions and participant privacy considerations, including restrictions on sharing information that could compromise research participant confidentiality or violate the conditions under which participant consent was obtained.
Conflicts of Interest
The authors declare no conflicts of interest.
Acknowledgments
This research was supported by the California Office of Environmental Health Hazard Assessment (OEHHA), Agreement Number 16-E0017. The views expressed are those of the authors and do not necessarily represent those of OEHHA, the California Environmental Protection Agency, or the State of California. We thank Dr. Thomas W. Kirchstetter for providing the air sampling devices used for this study, as well as his expert advice. Finally, we thank the families who participated in this study and the staff and community partners who made this work possible.
Abbreviations
The following abbreviations are used in this manuscript:
| 1-NP | 1-nitropyrene |
| 2-NFl | 2-nitrofluoranthene |
| 2-NP | 2-nitropyrene |
| AADT | Annual average daily traffic |
| ABCD | Aerosol black carbon detector |
| BAAQMD | Bay Area Air Quality Management District |
| BC | Black carbon |
| CI | Confidence interval |
| DE | Diesel exhaust |
| DOC | Diesel oxidation catalyst |
| DPF | Diesel particulate filter |
| HPMS | Highway Performance and Monitoring System |
| IARC | International Agency for Research on Cancer |
| IQR | Interquartile range |
| LOQ | Limit of quantification |
| LUR | Land use regression |
| m3 | Cubic meters |
| mg | Milligram |
| NO2 | Nitrogen dioxide |
| NO3 | Nitrate |
| NOx | Nitrogen oxides |
| NPAH | Nitro-polycyclic aromatic hydrocarbon |
| OEHHA | California Office of Environmental Health Hazard Assessment |
| OH | Hydroxyl |
| PAH | Polycyclic aromatic hydrocarbon |
| pg | Picogram |
| PM2.5 | Particulate matter 2.5 |
| ppm | Parts per million |
| SCR | selective catalytic reduction |
| SD | Standard deviation |
| TD | Traffic density |
| UC | University of California |
| UW | University of Washington |
| VMT | Vehicle meters traveled |
| μg | Microgram |
Appendix A

Table A1.
Results from univariate models predicting outdoor NOx, PM2.5, and black carbon, adjusted for temperature and humidity.
Table A1.
Results from univariate models predicting outdoor NOx, PM2.5, and black carbon, adjusted for temperature and humidity.
| Outdoor NOx | Outdoor PM2.5 | Outdoor BC | |||||
| Percent change (95% CI) | p-value | Percent change (95% CI) | p-value | Percent change (95% CI) | p-value | ||
| Distance to nearest: | |||||||
| Highway/rail crossing | -1 (-8,6) | 0.76 | -1 (-8,7) | 0.78 | 2 (-4,9) | 0.50 | |
| Bottleneck | -2 (-9,5) | 0.56 | -3 (-10,6) | 0.51 | -1 (-8,6) | 0.71 | |
| Truck network road | -4 (-9,2) | 0.17 | -1 (-6,5) | 0.85 | -1 (-6,4) | 0.66 | |
| Major road | -2 (-11,7) | 0.64 | -2 (-11,8) | 0.65 | 0 (-8,9) | 0.91 | |
| Railway | 3 (-5,10) | 0.49 | 1 (-7,10) | 0.75 | 5 (-2,13) | 0.15 | |
| All traffic density within: | |||||||
| 350m | 0.01 (-0.04,0.06) |
0.74 | -0.01 (-0.06,0.04) |
0.70 | 0.01 (-0.04,0.06) |
0.66 | |
| 500m | 0.01 (-0.07,0.08) |
0.82 | -0.02 (-0.10,0.06) |
0.61 | 0.01 (-0.06,0.08) |
0.86 | |
| 1000m | 0.03 (-0.09,0.15) |
0.62 | 0.02 (-0.11,0.14) |
0.79 | 0.01 (-0.10,0.12) |
0.84 | |
| Truck and heavy vehicle traffic density within: | |||||||
| 350m | -0.09 (-1.40,1.25) |
0.90 | -0.60 (-2.0,0.84) |
0.41 | -0.08 (-1.3,1.2) |
0.90 | |
| 500m | 0.03 (-0.80,0.86) |
0.95 | -0.38 (-1.3,0.52) |
0.40 | 0.05 (-0.74,0.83) |
0.91 | |
| 1000m | -0.17 (-2.3,2.0) |
0.88 | -0.02 (-2.3,2.3) |
0.99 | -0.26 (-2.3,1.8) |
0.80 | |
| HPMS road length within: | |||||||
| 350m | 4 (-2,11) | 0.23 | 2 (-5,10) | 0.52 | 4 (-3,10) | 0.26 | |
| 500m | 4 (-1,9) | 0.13 | 2 (-4,7) | 0.53 | 3 (-2,7) | 0.27 | |
| 1000m | 1 (0,2) | 0.10 | 1 (-1,2) | 0.42 | 0 (-1,2) | 0.43 | |
| Major road length within: | |||||||
| 350m | 7 (-6,21) | 0.31 | 1 (-12,15) | 0.91 | 7 (-5,20) | 0.25 | |
| 500m | 3 (-4,11) | 0.36 | -1 (-8,7) | 0.83 | 3 (-4,10) | 0.39 | |
| 1000m | 1 (-2,4) | 0.43 | 0 (-3,3) | 1.00 | 1 (-2,4) | 0.74 | |
| Permitted sources within: | |||||||
| 350m | 4 (-3,12) | 0.24 | -1 (-9,7) | 0.75 | 3 (-4,10) | 0.44 | |
| 500m | 6 (2,11) | 0.01* | 2 (-3,7) | 0.47 | 5 (0,9) | 0.03* | |
| 1000m | 1 (0,2) | 0.06 | 0 (-1,2) | 0.63 | 0 (-1,1) | 0.43 | |
Table A2.
Selected concentrations of 1-NP (pg/m3) in outdoor air measured in other cities.
| Source | Sampling Location |
Year Sampled |
n | Mean (SD) | Median | Min. | Max. |
| Galaviz et al. 2014 | San Ysidro, CA (ambient, roadway) |
2010 | 34 | 2 (2.3) | 1.3 | 0.2 | 9.5 |
| Reisen et al. 2005 | Los Angeles, CA (traffic) |
2002 | 4 | 6.5 | - | 3 | 12 |
| 2003 | 4 | 21 | - | 12 | 38 | ||
| Riverside, CA (downwind) |
2002 | 4 | 6.5 | - | 3 | 14 | |
| 2003 | 4 | 12.2 | - | 8 | 19 | ||
| Bamford et al. 2003 | Baltimore, MD (ambient, urban) |
2001 (winter) |
4 | 27 | - | 14 | 45 |
| 2001 (summer) |
5 | 8.1 | - | 3 | 16 | ||
| Fort Meade, Maryland (ambient, suburban) | 2001 (winter) |
4 | 20 | - | 7.5 | 38 | |
| 2001 (summer) |
4 | 1.4 | - | 0.5 | 2.2 | ||
| Schulte et al. 2015 | Seattle, WA (residential, commercial, and industrial) |
2012 (summer) |
20 | 0.67 (0.49) | 0.49 | 0.26 | 2.5 |
| 2012 (winter) |
21 | 2.1 (0.97) | 1.9 | 1.1 | 5.7 |
References
- IARC DIESEL AND GASOLINE ENGINE EXHAUSTS AND SOME NITROARENES. IARC MONOGRAPHS ON THE EVALUATION OF CARCINOGENIC RISKS TO HUMANS. IARC Monogr. Eval. Carcinog. Risks Hum. 2014, 105, 9–699. [PubMed]
- CARB FINAL REGULATION ORDER Title 13, California Code of Regulations Division 3: Air Resources Board Chapter 1: Motor Vehicle Pollution Control Devices.
- Caubel, J.J.; Cados, T.E.; Kirchstetter, T.W. A New Black Carbon Sensor for Dense Air Quality Monitoring Networks. Sensors 2018, 18, 738. [Google Scholar] [CrossRef] [PubMed]
- Koolik, L.H.; Alvarado, Á.; Budahn, A.; Plummer, L.; Marshall, J.D.; Apte, J.S. PM2.5 Exposure Disparities Persist despite Strict Vehicle Emissions Controls in California. Sci. Adv. 2024, 10, eadn8544. [Google Scholar] [CrossRef] [PubMed]
- Patterson, R.F.; Harley, R.A. Effects of Diesel Engine Emission Controls on Environmental Equity and Justice. Environ. Justice 2021, 14, 360–371. [Google Scholar] [CrossRef]
- Preble, C.V.; Dallmann, T.R.; Kreisberg, N.M.; Hering, S.V.; Harley, R.A.; Kirchstetter, T.W. Effects of Particle Filters and Selective Catalytic Reduction on Heavy-Duty Diesel Drayage Truck Emissions at the Port of Oakland. Environ. Sci. Technol. 2015, 49, 8864–8871. [Google Scholar] [CrossRef] [PubMed]
- Preble, C.V.; Cados, T.E.; Harley, R.A.; Kirchstetter, T.W. In-Use Performance and Durability of Particle Filters on Heavy-Duty Diesel Trucks. Environ. Sci. Technol. 2018, 52, 11913–11921. [Google Scholar] [CrossRef] [PubMed]
- Silvers, A.; Florence, B.T.; Rourke, D.L.; Lorimor, R.J. How Children Spend Their Time: A Sample Survey for Use in Exposure and Risk Assessments. Risk Anal. 1994, 14, 931–944. [Google Scholar] [CrossRef] [PubMed]
- Wallace, Lance.A. Total Exposure Assessment Methodology (TEAM) Study: Summary and Analysis; Office of Acid Deposition, Environmental Monitoring, and Quality Assurance, Environmental Protection Agency: Washington, DC (USA), 1987; Volume 1. [Google Scholar]
- Cuddihy, R.G.; Griffith, W.C.; McClellan, R.O. Health Risks from Light-Duty Diesel Vehicles. Environ. Sci. Technol. 1984, 18. [Google Scholar] [CrossRef] [PubMed]
- Henderson, S.B.; Beckerman, B.; Jerrett, M.; Brauer, M. Application of Land Use Regression to Estimate Long-Term Concentrations of Traffic-Related Nitrogen Oxides and Fine Particulate Matter. Environ. Sci. Technol. 2007, 41, 2422–2428. [Google Scholar] [CrossRef] [PubMed]
- Hoek, G.; Beelen, R.; de Hoogh, K.; Vienneau, D.; Gulliver, J.; Fischer, P.; Briggs, D. A Review of Land-Use Regression Models to Assess Spatial Variation of Outdoor Air Pollution. Atmos. Environ. 2008, 42, 7561–7578. [Google Scholar] [CrossRef]
- Mercer, L.D.; Szpiro, A.A.; Sheppard, L.; Lindström, J.; Adar, S.D.; Allen, R.W.; Avol, E.L.; Oron, A.P.; Larson, T.; Liu, L.-J.S.; et al. Comparing Universal Kriging and Land-Use Regression for Predicting Concentrations of Gaseous Oxides of Nitrogen (NOx) for the Multi-Ethnic Study of Atherosclerosis and Air Pollution (MESA Air). Atmos. Environ. 2011, 45, 4412–4420. [Google Scholar] [CrossRef] [PubMed]
- Wilton, D.; Szpiro, A.; Gould, T.; Larson, T. Improving Spatial Concentration Estimates for Nitrogen Oxides Using a Hybrid Meteorological Dispersion/Land Use Regression Model in Los Angeles, CA and Seattle, WA. Sci. Total Environ. 2010, 408, 1120–1130. [Google Scholar] [CrossRef] [PubMed]
- Zielinska, B.; Sagebiel, J.; McDonald, J.D.; Whitney, K.; Lawson, D.R. Emission Rates and Comparative Chemical Composition from Selected In-Use Diesel and Gasoline-Fueled Vehicles. J. Air Waste Manag Assoc. 2004, 54, 1138–1150. [Google Scholar] [CrossRef] [PubMed]
- Lebel, E.D.; Finnegan, C.J.; Ouyang, Z.; Jackson, R.B. Methane and NOx Emissions from Natural Gas Stoves, Cooktops, and Ovens in Residential Homes. Environ. Sci. Technol. 2022, 56, 2529–2539. [Google Scholar] [CrossRef] [PubMed]
- Riley, E.A.; Carpenter, E.E.; Ramsay, J.; Zamzow, E.; Pyke, C.; Paulsen, M.H.; Sheppard, L.; Spear, T.M.; Seixas, N.S.; Stephenson, D.J.; et al. Evaluation of 1-Nitropyrene as a Surrogate Measure for Diesel Exhaust. Ann. Work Expo. Health 2018, 62, 339–350. [Google Scholar] [CrossRef] [PubMed]
- Arey, J.; Zielinska, B.; Atkinson, R.; Winer, A.M.; Ramdahl, T.; Pitts, J.N. The Formation of Nitro-PAH from the Gas-Phase Reactions of Fluoranthene and Pyrene with the OH Radical in the Presence of NOx. Atmos. Environ. (1967) 1986, 20, 2339–2345. [Google Scholar] [CrossRef]
- Bamford, H.A.; Bezabeh, D.Z.; Schantz, M.M.; Wise, S.A.; Baker, J.E. Determination and Comparison of Nitrated-Polycyclic Aromatic Hydrocarbons Measured in Air and Diesel Particulate Reference Materials. Chemosphere 2003, 50, 575–587. [Google Scholar] [CrossRef] [PubMed]
- Scheepers, P.T.J.; Martens, M.H.J.; Velders, D.D.; Fijneman, P.; Van Kerkhoven, M.; Noordhoek, J.; Bos, R.P. 1-Nitropyrene as a Marker for the Mutagenicity of Diesel Exhaust-Derived Particulate Matter in Workplace Atmospheres. Environ. Mol. Mutagen. 1995, 25, 134–147. [Google Scholar] [CrossRef] [PubMed]
- Schulte, J.K.; Fox, J.R.; Oron, A.P.; Larson, T.V.; Simpson, C.D.; Paulsen, M.; Beaudet, N.; Kaufman, J.D.; Magzamen, S. Neighborhood-Scale Spatial Models of Diesel Exhaust Concentration Profile Using 1-Nitropyrene and Other Nitroarenes. Environ. Sci. Technol. 2015, 49, 13422–13430. [Google Scholar] [CrossRef] [PubMed]
- Andersson, H.; Piras, E.; Demma, J.; Hellman, B.; Brittebo, E. Low Levels of the Air Pollutant 1-Nitropyrene Induce DNA Damage, Increased Levels of Reactive Oxygen Species and Endoplasmic Reticulum Stress in Human Endothelial Cells. Toxicology 2009, 262, 57–64. [Google Scholar] [CrossRef] [PubMed]
- Lewtas, J.; Nishioka, M.G. Nitroarenes: Their Detection, Mutagenicity and Occurrence in the Environment. In Nitroarenes: Occurrence, Metabolism, and Biological Impact; Howard, P.C., Hecht, S.S., Beland, F.A., Eds.; Springer US: Boston, MA, 1990; pp. 61–72. ISBN 978-1-4615-3800-4. [Google Scholar]
- Purohit, V.; Basu, A.K. Mutagenicity of Nitroaromatic Compounds. Chem. Res. Toxicol. 2000, 13, 673–692. [Google Scholar] [CrossRef] [PubMed]
- Chen, Y.; Du, W.; Shen, G.; Zhuo, S.; Zhu, X.; Shen, H.; Huang, Y.; Su, S.; Lin, N.; Pei, L.; et al. Household Air Pollution and Personal Exposure to Nitrated and Oxygenated Polycyclic Aromatics (PAHs) in Rural Households: Influence of Household Cooking Energies. [CrossRef] [PubMed]
- Ramdahl, T.; Zielinska, B.; Arey, J.; Atkinson, R.; Winer, A.M.; Pitts, J.N. Ubiquitous Occurrence of 2-Nitrofluoranthene and 2-Nitropyrene in Air. Nature 1986, 321, 425–427. [Google Scholar] [CrossRef] [PubMed]
- Strandberg, B.; Omelekhina, Y.; Klein, M.; Krais, A.M.; Wierzbicka, A. Particulate-Bound Polycyclic Aromatic Hydrocarbons (PAHs) and Their Nitro- and Oxy-Derivative Compounds Collected Inside and Outside Occupied Homes in Southern Sweden. Polycycl. Aromat. Compd. 2023, 43, 7399–7415. [Google Scholar] [CrossRef]
- Scheepers, P.T.J. Determination of Inhalation Exposure to 1-Nitropyrene in Workplace Atmospheres and Urban Dwellings: Polycyclic Aromatic Compounds: Vol 17, No 1-4 - Get Access. Polycycl. Aromat. Compd. 1999, 17, 267–275. [Google Scholar]
- Yadav, I.C.; Devi, N.L.; Singh, V.K.; Li, J.; Zhang, G. Concentrations, Sources and Health Risk of Nitrated- and Oxygenated-Polycyclic Aromatic Hydrocarbon in Urban Indoor Air and Dust from Four Cities of Nepal. Sci. Total Environ. 2018, 643, 1013–1023. [Google Scholar] [CrossRef] [PubMed]
- Besis, A.; Botsaropoulou, E.; Balla, D.; Voutsa, D.; Samara, C. Toxic Organic Pollutants in Greek House Dust: Implications for Human Exposure and Health Risk. Chemosphere 2021, 284, 131318. [Google Scholar] [CrossRef] [PubMed]
- Jin, L.; Berman, J.D.; Warren, J.L.; Levy, J.I.; Thurston, G.; Zhang, Y.; Xu, X.; Wang, S.; Zhang, Y.; Bell, M.L. A Land Use Regression Model of Nitrogen Dioxide and Fine Particulate Matter in a Complex Urban Core in Lanzhou, China. Environ. Res. 2019, 177, 108597. [Google Scholar] [CrossRef] [PubMed]
- Larkin, A.; Anenberg, S.; Goldberg, D.L.; Mohegh, A.; Brauer, M.; Hystad, P. A Global Spatial-Temporal Land Use Regression Model for Nitrogen Dioxide Air Pollution. Front. Environ. Sci. 2023, 11. [Google Scholar] [CrossRef]
- Saha, P.K.; Hankey, S.; Marshall, J.D.; Robinson, A.L.; Presto, A.A. High-Spatial-Resolution Estimates of Ultrafine Particle Concentrations across the Continental United States. Environ. Sci. Technol. 2021, 55. [Google Scholar] [CrossRef] [PubMed]
- Jerrett, M.; Arain, A.; Kanaroglou, P.; Beckerman, B.; Potoglou, D.; Sahsuvaroglu, T.; Morrison, J.; Giovis, C. A Review and Evaluation of Intraurban Air Pollution Exposure Models. J. Expo. Sci. Environ. Epidemiol. 2005, 15, 185–204. [Google Scholar] [CrossRef] [PubMed]
- Sultana, D.; Kauffman, D.; Castorina, R.; Paulsen, M.H.; Bartlett, R.; Ranjbar, K.; Gunier, R.B.; Aguirre, V.; Rowen, M.; Garban, N.; et al. The East Bay Diesel Exposure Project: A Biomonitoring Study of Parents and Their Children in Heavily Impacted Communities. J. Expo. Sci. Environ. Epidemiol. 2024, 34, 827–835. [Google Scholar] [CrossRef] [PubMed]
- OEHHA CalEnviroScreen 3.0: Update to the California Communities Environmental Health Screening Tool; California Environmental Protection Agency Office of Environmental Health Hazard Assessment, 2017.
- Miller-Schulze, J.P.; Paulsen, M.; Toriba, A.; Tang, N.; Hayakawa, K.; Tamura, K.; Dong, L.; Zhang, X.; Simpson, C.D. Exposures to Particulate Air Pollution and Nitro-Polycyclic Aromatic Hydrocarbons among Taxi Drivers in Shenyang, China. Environ. Sci. Technol. 2010, 44, 216–221. [Google Scholar] [CrossRef] [PubMed]
- Lee, Y.-Y.; Hsieh, Y.-K.; Huang, B.-W.; Mutuku, J.K.; Chang-Chien, G.-P.; Huang, S. An Overview: PAH and Nitro-PAH Emission from the Stationary Sources and Their Transformations in the Atmosphere. Aerosol Air Qual. Res. 2022, 22, 220164. [Google Scholar] [CrossRef]
- Hornung, R.W.; Reed, L.D. Estimation of Average Concentration in the Presence of Nondetectable Values. Appl. Occup. Environ. Hyg. 1990, 5, 46–51. [Google Scholar] [CrossRef]
- Caubel, J.J.; Cados, T.E.; Preble, C.V.; Kirchstetter, T.W. A Distributed Network of 100 Black Carbon Sensors for 100 Days of Air Quality Monitoring in West Oakland, California. Environ. Sci. Technol. 2019, 53, 7564–7573. [Google Scholar] [CrossRef] [PubMed]
- Dodson, R.E.; Camann, D.E.; Morello-Frosch, R.; Brody, J.G.; Rudel, R.A. Semivolatile Organic Compounds in Homes: Strategies for Efficient and Systematic Exposure Measurement Based on Empirical and Theoretical Factors. Environ. Sci. Technol. 2015, 49, 113–122. [Google Scholar] [CrossRef] [PubMed]
- Mercier, F.; Glorennec, P.; Thomas, O.; Le Bot, B. Organic Contamination of Settled House Dust, a Review for Exposure Assessment Purposes. Environ. Sci. Technol. 2011, 45, 6716–6727. [Google Scholar] [CrossRef] [PubMed]
- Alm, S.; Jantunen, M.J.; Vartiainen, M. Urban Commuter Exposure to Particle Matter and Carbon Monoxide inside an Automobile. J. Expo. Sci. Environ. Epidemiol. 1999, 9, 237–244. [Google Scholar] [CrossRef] [PubMed]
- Kaur, S.; Nieuwenhuijsen, M.J. Determinants of Personal Exposure to PM2.5, Ultrafine Particle Counts, and CO in a Transport Microenvironment. Environ. Sci. Technol. 2009, 43, 4737–4743. [Google Scholar] [CrossRef] [PubMed]
- Weichenthal, S.; Dufresne, A.; Infante-Rivard, C.; Joseph, L. Determinants of Ultrafine Particle Exposures in Transportation Environments: Findings of an 8-Month Survey Conducted in Montréal, Canada. J. Expo. Sci. Environ. Epidemiol. 2008, 18, 551–563. [Google Scholar] [CrossRef] [PubMed]
- Weichenthal, S.; Farrell, W.; Goldberg, M.; Joseph, L.; Hatzopoulou, M. Characterizing the Impact of Traffic and the Built Environment on Near-Road Ultrafine Particle and Black Carbon Concentrations. Environ. Res. 2014, 132, 305–310. [Google Scholar] [CrossRef] [PubMed]
- Weichenthal, S.; Van Ryswyk, K.; Kulka, R.; Sun, L.; Wallace, L.; Joseph, L. In-Vehicle Exposures to Particulate Air Pollution in Canadian Metropolitan Areas: The Urban Transportation Exposure Study. Environ. Sci. Technol. 2015, 49, 597–605. [Google Scholar] [CrossRef] [PubMed]
- Ciccioli, P.; Cecinato, A.; Brancaleoni, E.; Frattoni, M.; Zacchei, P.; Miguel, A.H.; de Castro Vasconcellos, P. Formation and Transport of 2-Nitrofluoranthene and 2-Nitropyrene of Photochemical Origin in the Troposphere. J. Geophys. Res. Atmos. 1996, 101, 19567–19581. [Google Scholar] [CrossRef]
- Feilberg, A.; B. Poulsen, M.W.; Nielsen, T. Henrik Skov Occurrence and Sources of Particulate Nitro-Polycyclic Aromatic Hydrocarbons in Ambient Air in Denmark. Atmos. Environ. 2001, 35, 353–366. [Google Scholar] [CrossRef]
- Zielinska, B.; Arey, J.; Atkinson, R.; Winer, A.M. The Nitroarenes of Molecular Weight 247 in Ambient Particulate Samples Collected in Southern California. Atmos. Environ. (1967) 1989, 23, 223–229. [Google Scholar] [CrossRef]
- Landrigan, P.J.; Goldman, L.R. Children’s Vulnerability To Toxic Chemicals: A Challenge And Opportunity To Strengthen Health And Environmental Policy. Health Aff. 2011, 30, 842–850. [Google Scholar] [CrossRef] [PubMed]
- Zhang, J.; Wang, Z.; Wei, Y.; Yang, S.; Yao, S.; Yang, B.; Yang, L. Characteristics, Sources, and Health Risks of PAHs and Their Derivatives in Indoor Dust in Zhengzhou. Atmos. Pollut. Res. 2024, 15, 102246. [Google Scholar] [CrossRef]
- Simpson, C.D. Emission of Polycyclic Aromatic Hydrocarbons (PAHs) and Nitrated Polycyclic Aromatic Hydrocarbons (NPAHs) from Diesel Engines and Vehicles. In Polycyclic Aromatic Hydrocarbons: Environmental Behavior and Toxicity in East Asia; Hayakawa, K., Ed.; Springer: Singapore, 2018; pp. 65–74. ISBN 978-981-10-6775-4. [Google Scholar]
- Ciccioli, P.; Cecinato, A.; Brancaleoni, E.; Draisci, R.; Liberti, A. Evaluation of Nitrated Polycydic Aromatic Hydrocarbons in Anthropogenic Emission and Air Samples: A Possible Means of Detecting Reactions of Carbonaceous Particles in the Atmosphere. Aerosol Sci. Technol. 1989, 10, 296–310. [Google Scholar] [CrossRef]
- Wilson, J.; Octaviani, M.; Bandowe, B.A.M.; Wietzoreck, M.; Zetzsch, C.; Pöschl, U.; Berkemeier, T.; Lammel, G. Modeling the Formation, Degradation, and Spatiotemporal Distribution of 2-Nitrofluoranthene and 2-Nitropyrene in the Global Atmosphere. Environ. Sci. Technol. 2020, 54, 14224–14234. [Google Scholar] [CrossRef] [PubMed]
- Mosallaei, S.; Hashemi, H.; Hoseini, M.; Dehghani, M.; Naz, A. Polycyclic Aromatic Hydrocarbons (PAHs) in Household Dust: The Association between PAHs, Cancer Risk and Sick Building Syndrome. Build. Environ. 2023, 229, 109966. [Google Scholar] [CrossRef]
- Galaviz, V.E.; Yost, M.G.; Simpson, C.D.; Camp, J.E.; Paulsen, M.H.; Elder, J.P.; Hoffman, L.; Flores, D.; Quintana, P.J.E. Traffic Pollutant Exposures Experienced by Pedestrians Waiting to Enter the U.S. at a Major U.S.–Mexico Border Crossing. Atmos. Environ. 2014, 88, 362–369. [Google Scholar] [CrossRef]
- Taga, R.; Tang, N.; Hattori, T.; Tamura, K.; Sakai, S.; Toriba, A.; Kizu, R.; Hayakawa, K. Direct-Acting Mutagenicity of Extracts of Coal Burning-Derived Particulates and Contribution of Nitropolycyclic Aromatic Hydrocarbons. Mutat. Res. Toxicol. Environ. Mutagen. 2005, 581, 91–95. [Google Scholar] [CrossRef] [PubMed]
Figure 1.
Sample location distribution. “Participants” refers to participants’ homes where samples were collected. The circles on the map are used to obscure the exact locations of participants’ homes; however, all analyses were still conducted using exact individual home locations.
Figure 1.
Sample location distribution. “Participants” refers to participants’ homes where samples were collected. The circles on the map are used to obscure the exact locations of participants’ homes; however, all analyses were still conducted using exact individual home locations.
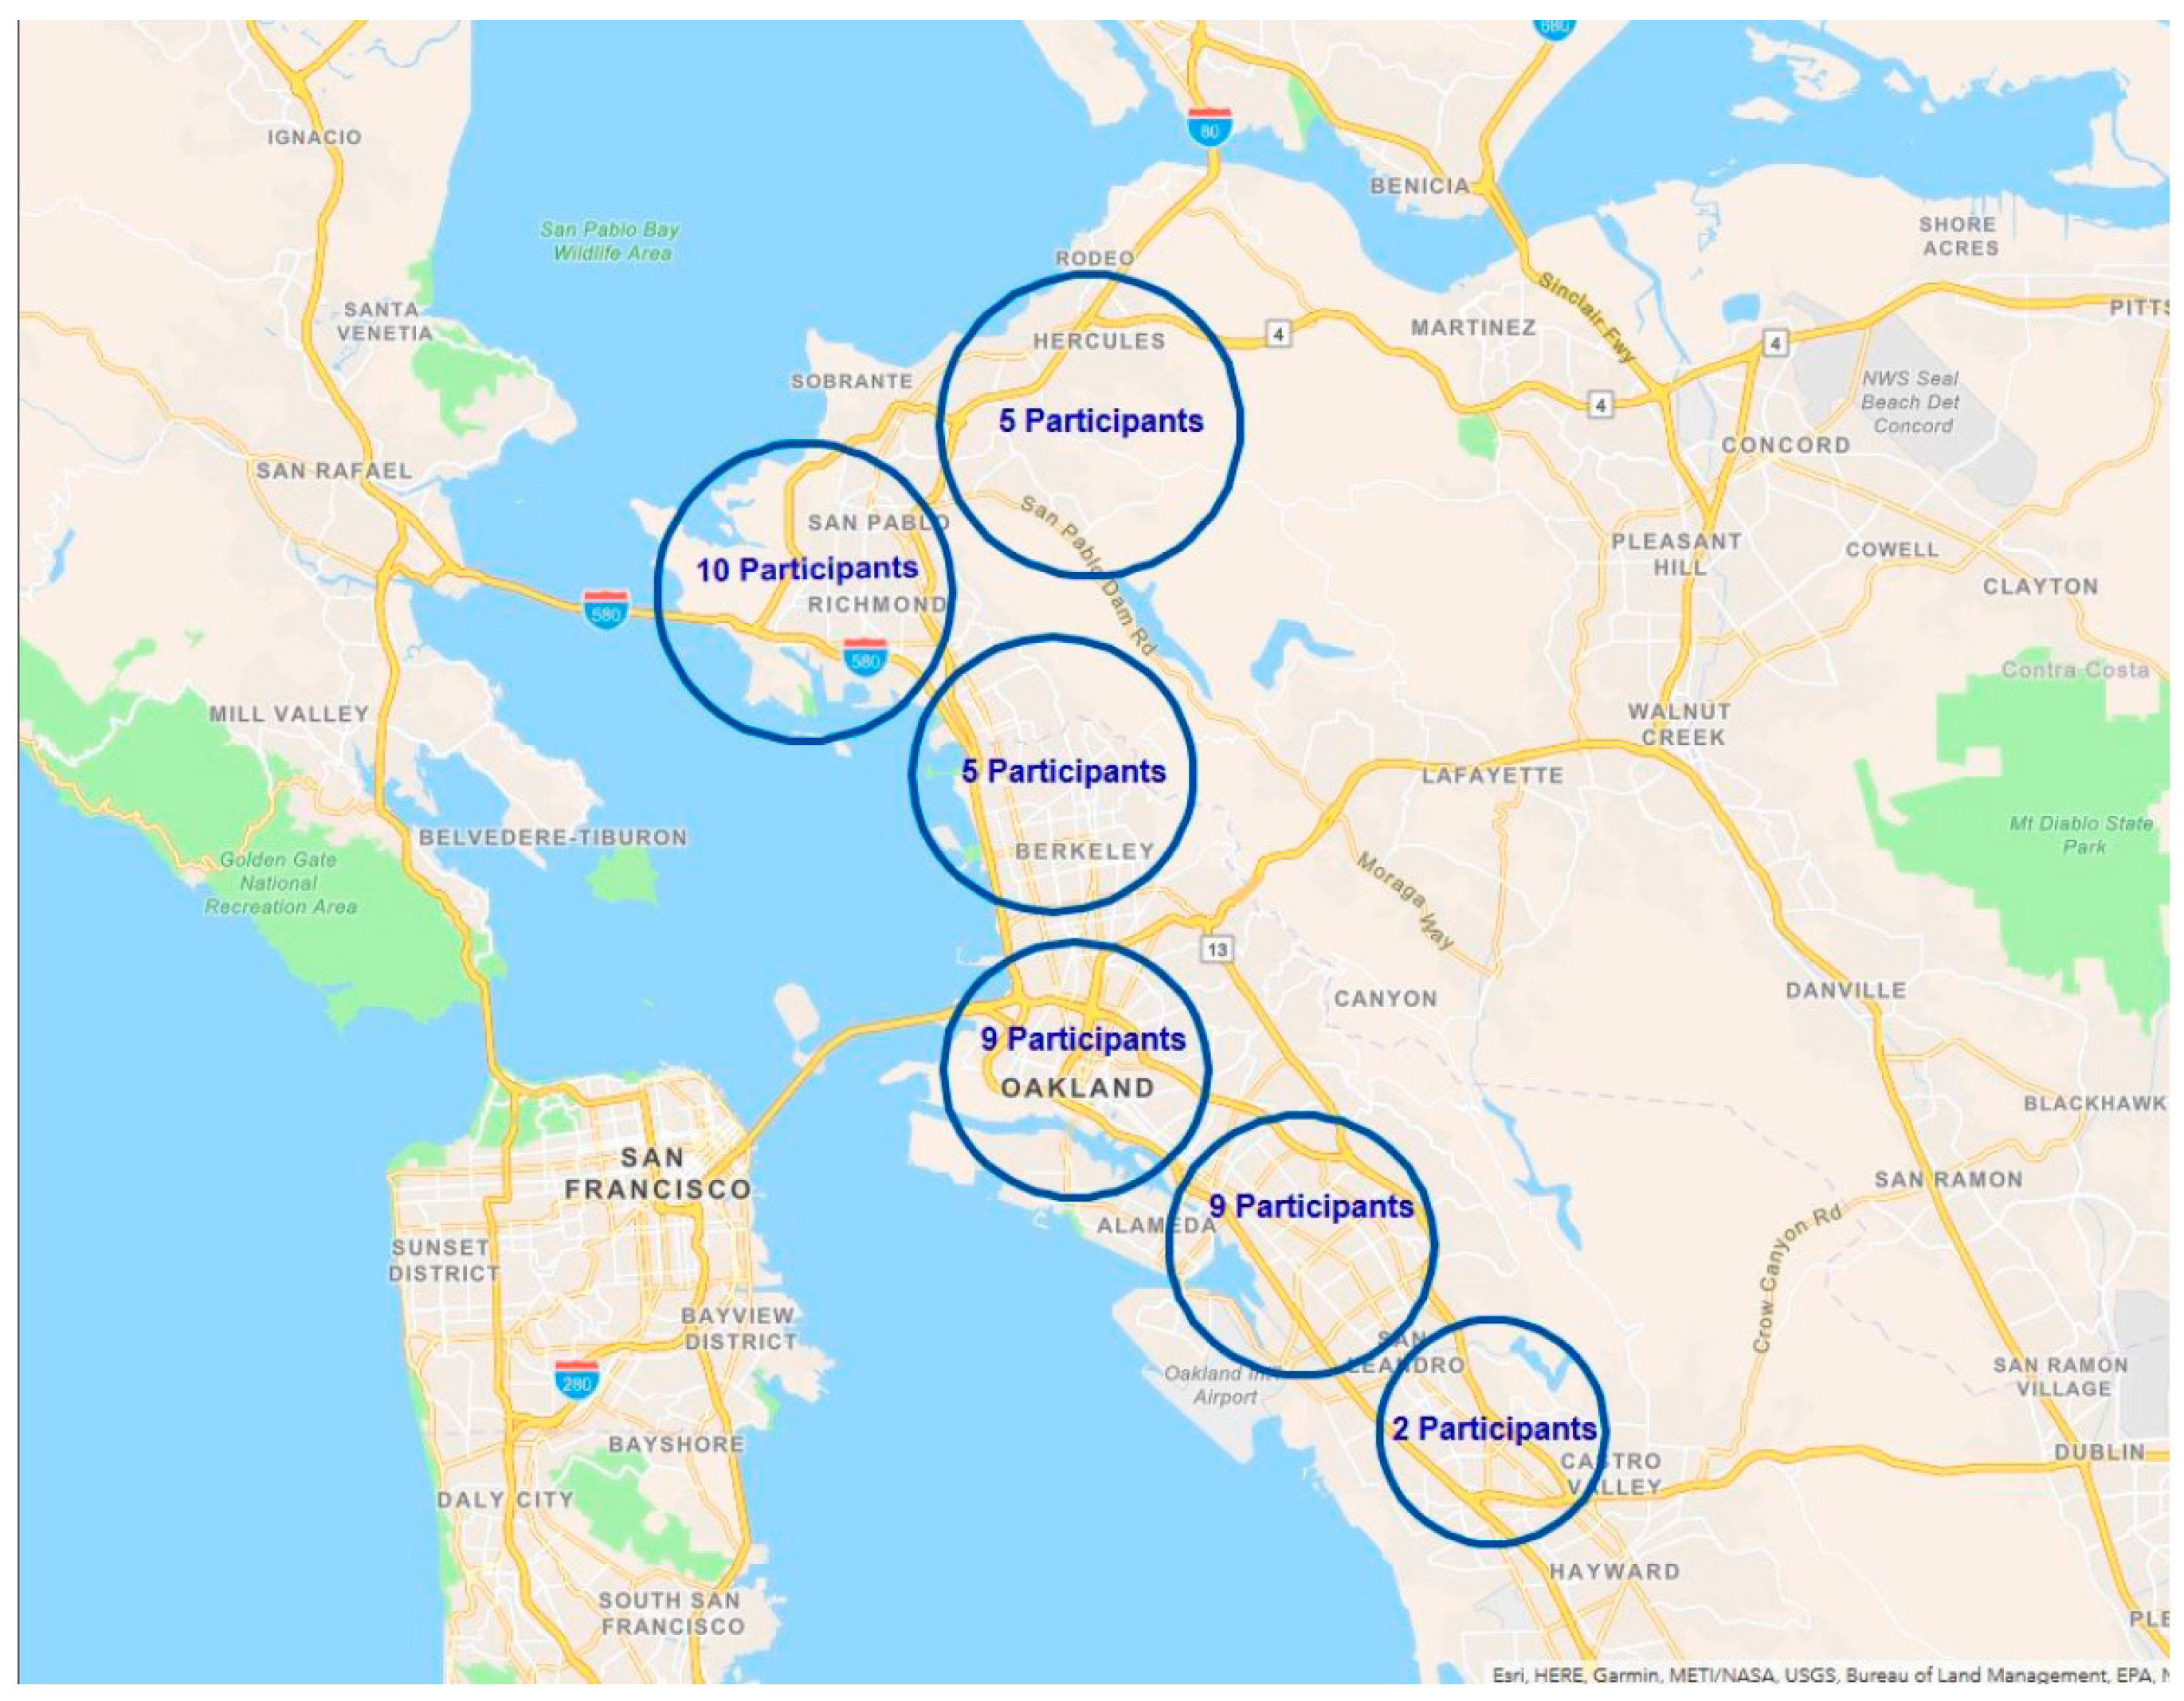
Figure 2.
Correlation matrix of measured and monitored DE indicators. *p-value < 0.05.
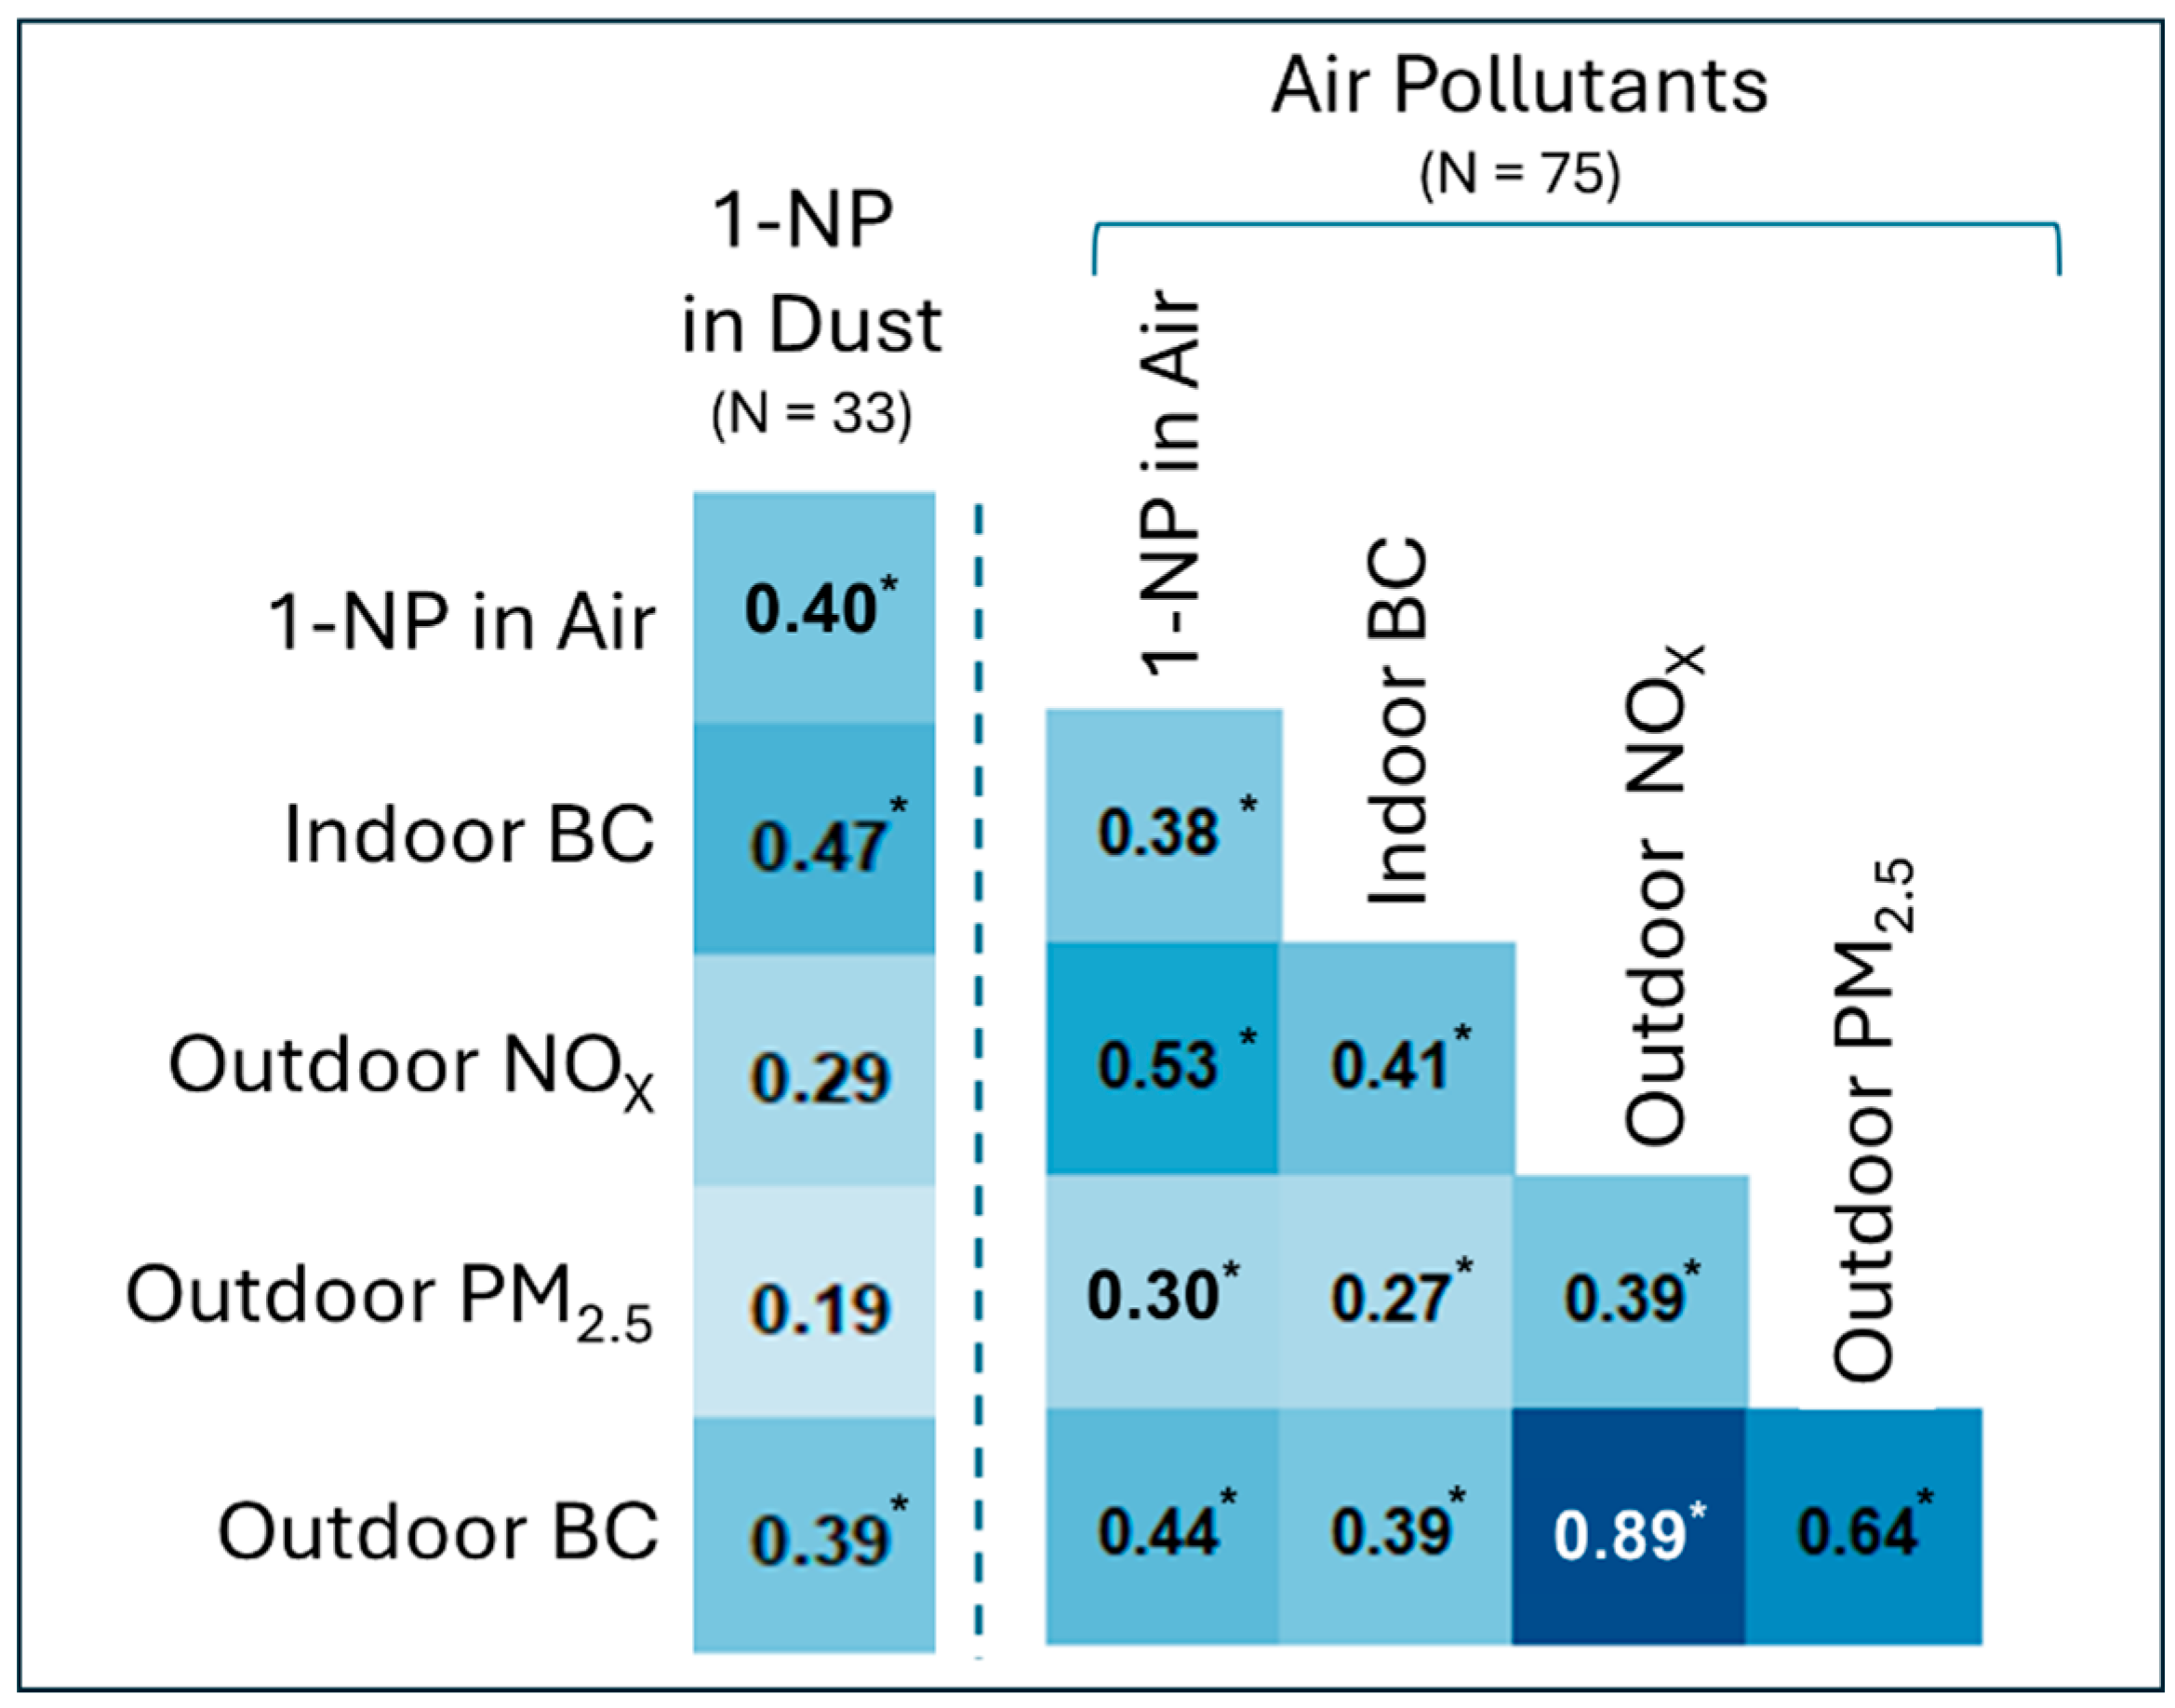
Figure 3.
Seasonal trends for 1-NP, NOx, PM2.5, and BC in and around sampling locations during study period.
Figure 3.
Seasonal trends for 1-NP, NOx, PM2.5, and BC in and around sampling locations during study period.
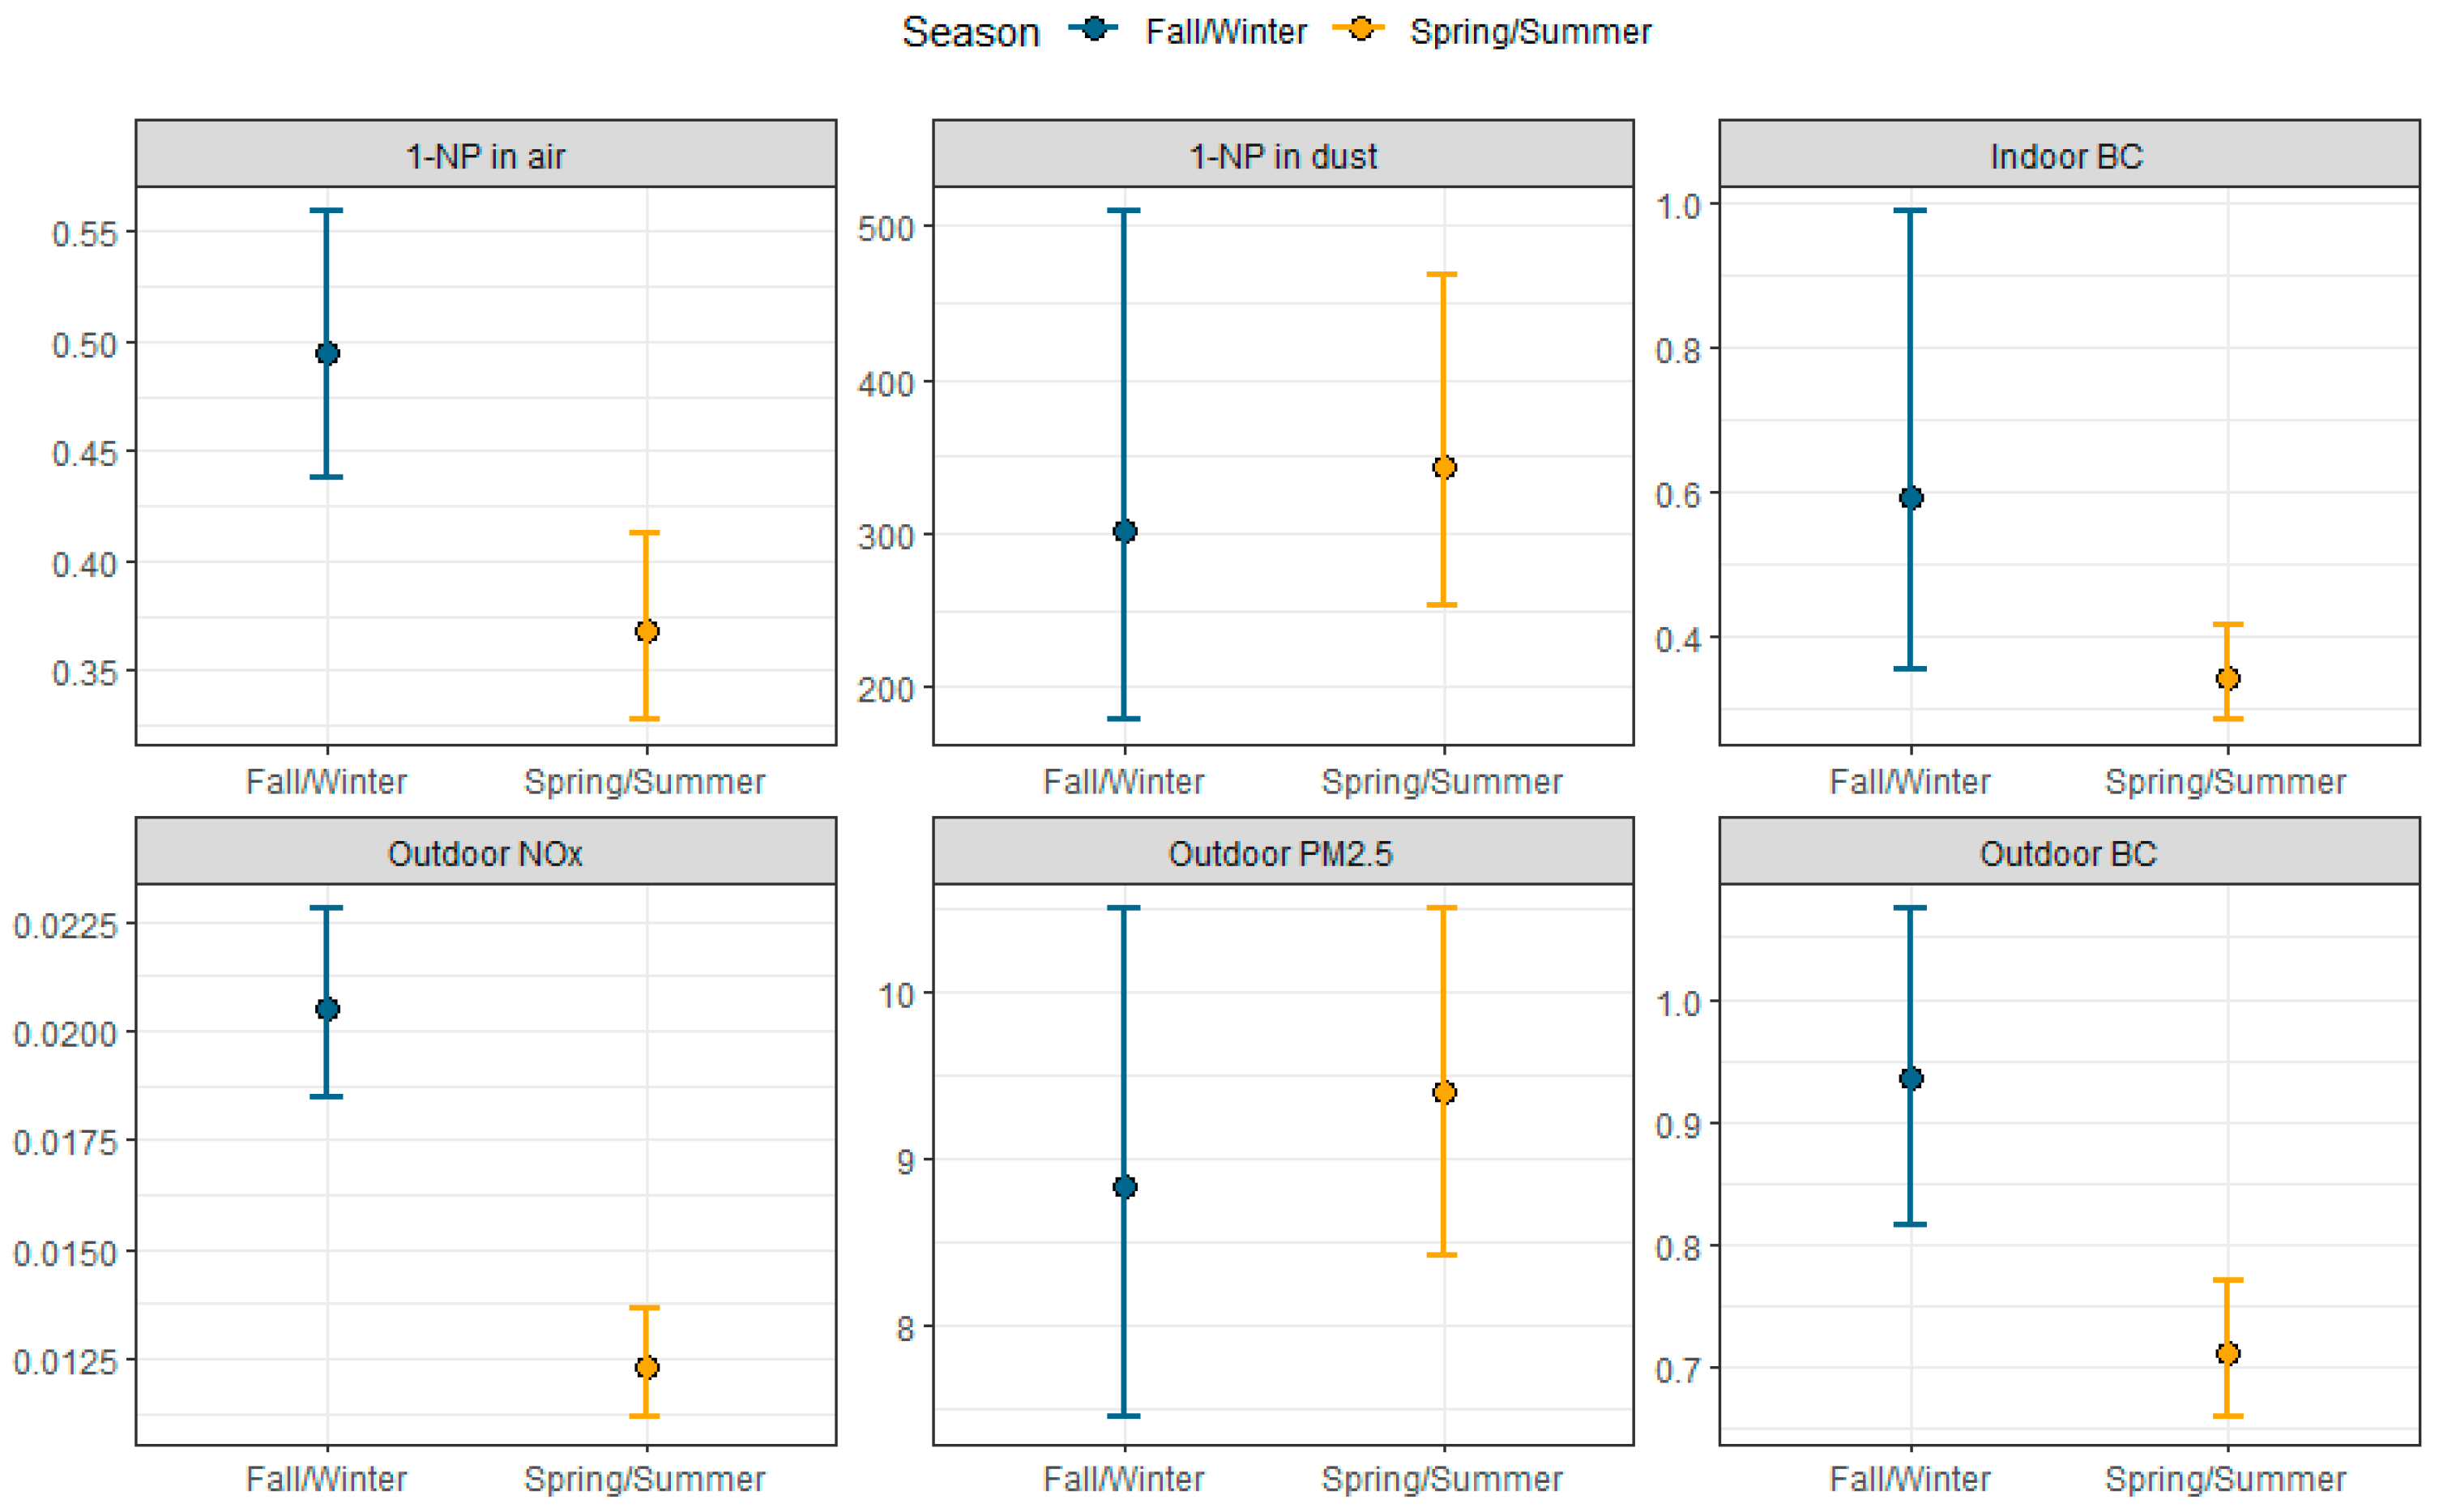
Table 1.
Spatial predictor and covariate descriptions.
| Description | Units | Extent |
| Distance to major road, bottleneck road, truck network road, railway, highway/railway crossing | Kilometers (Km) | Distance from sampling location |
| Length of major roads, HPMS roads | Km | Buffer radii: 350, 500, and 1000 meters (m) |
| Traffic density for all vehicles, combined truck and heavy vehicles | VMT/m2 | Buffer radii: 350, 500, and 1000 m |
| Number of permitted sources a | count | Buffer radii: 350, 500, and 1000 m |
| Air temperature (average) | degrees Fahrenheit (F) | 30- or 3-day average from nearest monitor |
| Humidity (average) | % | 30- or 3-day average from nearest monitor |
a Stationary sources with permits from the Bay Area Air Quality Management District (BAAQMD) to emit diesel exhaust.
Table 2.
Summary statistics for indoor measurements of 1-nitropyrene (1-NP), 2-nitropyrene (2-NP), 2-nitrofluoranthene (2-NFl), and black carbon (BC).
Table 2.
Summary statistics for indoor measurements of 1-nitropyrene (1-NP), 2-nitropyrene (2-NP), 2-nitrofluoranthene (2-NFl), and black carbon (BC).
| Pollutant1 | N2 |
Detection Frequency3 |
Min | Median (IQR) | 90th Percentile | Max | |
| Indoor Air | 1-NP (pg/m3) | 76 | 74% | 0.18 | 0.42 (0.32 - 0.54) | 0.7 | 1.16 |
| 2-NFL:1-NP* | 51 | - | 0.38 | 0.78 (0.61 - 1.23) | 1.83 | 4.78 | |
| 2-NFL:2-NP* | 31 | - | 0.58 | 1.53 (1.05 - 1.94) | 2.77 | 4.28 | |
| BC (μg/m3) | 77 | -4 | 0.0007 | 0.35 (0.27 - 0.72) | 1.73 | 47.72 | |
| House Dust | 1-NP (pg/g) | 36 | 97% | <LOQ | 340 (190 - 620) | 1180 | 910,000 |
| 2-NFL:1-NP* | 31 | - | 0.01 | 0.28 (0.19 - 0.36) | 0.51 | 0.88 | |
| 2-NFL:2-NP* | 29 | - | 0.89 | 1.48 (1.27 - 2) | 2.32 | 3.64 |
1pg=picogram; μg=microgram; mg=milligram; m3=cubic meters. 2N reflects the number of samples collected which produced a valid measurement. 3The detection frequency reflects the number of valid measurements falling above the LOQ divided by the total number of valid measurements, multiplied by 100. 4The detection frequency for BC was not reported because the BC concentrations used in this study are daily averages from continuous monitors. *Indicates ratio.
Table 3.
Summary statistics for monitored outdoor NOx, PM2.5, and BC.
| Pollutant* | N | Min | Median (IQR) | 90th Percentile | Max |
| NOx (ppm) | 78 | 0.01 | 0.02 (0.01 - 0.02) | 0.03 | 0.06 |
| PM2.5 (μg/m3) | 78 | 4.32 | 8.45 (6.78 - 11.18) | 14.47 | 116.34 |
| BC (μg/m3) | 78 | 0.42 | 0.77 (0.64 - 0.98) | 1.22 | 5.06 |
*Summary statistics use 3-day averages of BAAQMD ambient air monitor data per sampling location and period.
Table 4.
Results from univariate models predicting 1-NP in air and dust and indoor black carbon, adjusted for temperature and humidity.1.
Table 4.
Results from univariate models predicting 1-NP in air and dust and indoor black carbon, adjusted for temperature and humidity.1.
| 1-NP in Air | 1-NP in Dust | Indoor BC | |||||
| Percent Change (95% CI) | p-value |
Percent Change (95% CI) |
p-value | Percent Change (95% CI) | p-value | ||
| Distance to nearest: | |||||||
| Highway/rail crossing | -3 (-10, 5) | 0.47 | -17 (-42, 18) | 0.28 | -12 (-33, 16) | 0.35 | |
| Bottleneck | -2 (-10, 6) | 0.54 | -25 (-48, 9) | 0.12 | -13 (-35, 16) | 0.34 | |
| Truck network road | -4 (-9, 2) | 0.16 | -25 (-43, -3) | 0.03* | -4 (-23, 18) | 0.68 | |
| Major road | -1 (-11, 9) | 0.78 | -28 (-54, 11) | 0.13 | -14 (-40, 22) | 0.39 | |
| Railway | 1 (-7, 10) | 0.75 | -8 (-38, 35) | 0.65 | 3 (-24, 39) | 0.85 | |
| All traffic density within: | |||||||
| 350m | -0.002 (-0.05, 0.05) |
0.95 | 0.23 (-0.01, 0.47) |
0.06 | 0.12 (-0.06, 0.31) |
0.19 | |
| 500m | -0.03 (-0.11, 0.05) |
0.49 |
0.37 (0.0004, 0.73) |
0.05* | 0.20 (-0.09, 0.49) |
0.17 | |
| 1000m | 0.004 (-0.12, 0.13) |
0.95 |
0.68 (0.10, 1.3) |
0.02* | 0.29 (-0.16, 0.75) |
0.20 | |
| Truck and heavy vehicle traffic density within: | |||||||
| 350m | -0.89 (-2.29, 0.54) |
0.22 | 6.00 (-0.68, 13) |
0.08 | 0.98 (-4.2, 6.4) |
0.71 | |
| 500m | -0.20 (-1.1, 0.70) |
0.65 | 3.7 (-0.51, 8.1) |
0.08 | 0.53 (-2.8, 3.9) |
0.75 | |
| 1000m | -0.93 (-3.2, 1.4) |
0.43 | 10 (-0.67, 23) |
0.07 | 0.48 (-7.7, 9.4) |
0.91 | |
| HPMS road length within: | |||||||
| 350m | 5 (-3, 13) | 0.20 | 52 (7, 120) | 0.02* | 16 (-10, 50) | 0.24 | |
| 500m | 4 (-1, 10) | 0.16 | 41 (10, 79) | 0.01* | 15 (-5, 38) | 0.15 | |
| 1000m | 1 (0, 3) | 0.03* | 9 (2, 16) | 0.01* | 5 (0, 10) | 0.07 | |
| Major road length within: | |||||||
| 350m | 6 (-8, 22) | 0.40 | 101 (6, 281) | 0.03* | 66 (1, 170) | 0.05* | |
| 500m | 1 (-7, 9) | 0.81 | 49 (4, 113) | 0.03* | 40 (6, 86) | 0.02* | |
| 1000m | 1 (-3, 4) | 0.75 | 21 (4, 40) | 0.02* | 10 (-2, 24) | 0.12 | |
| Permitted sources within: | |||||||
| 350m | 4 (-4, 13) | 0.29 | 57 (10, 120) | 0.01* | 26 (-5, 68) | 0.11 | |
| 500m | 5 (0, 10) | 0.06 | 34 (8, 67) | 0.01* | 24 (4, 47) | 0.02* | |
| 1000m | 1 (0, 3) | 0.02* | 5 (0, 12) | 0.07 | 5 (1, 9) | 0.03* | |
1 β=regression coefficient (slope).
Disclaimer/Publisher’s Note: The statements, opinions and data contained in all publications are solely those of the individual author(s) and contributor(s) and not of MDPI and/or the editor(s). MDPI and/or the editor(s) disclaim responsibility for any injury to people or property resulting from any ideas, methods, instructions or products referred to in the content. |
© 2026 by the authors. Licensee MDPI, Basel, Switzerland. This article is an open access article distributed under the terms and conditions of the Creative Commons Attribution (CC BY) license (http://creativecommons.org/licenses/by/4.0/).
Copyright: This open access article is published under a Creative Commons CC BY 4.0 license, which permit the free download, distribution, and reuse, provided that the author and preprint are cited in any reuse.