

Submitted:
11 August 2026
Posted:
12 August 2026
You are already at the latest version
Abstract
Urbanization drastically alters bird communities, creating an urgent need for practical in-dicators to monitor species colonization and decline. We investigated whether avian boldness, measured by Alert Distance (AD), Flight Initiation Distance (FID), and escape tactics such as escape mode and site, is better related to urban colonization history and ecological opportunities than morphological variables such as body mass. In the high-altitude Neotropical city of La Paz, Bolivia, we assessed five pigeon species in 15 ur-ban green spaces, quantifying abundance and escape behaviors and relating them to sev-eral environmental metrics. The invasive Rock Pigeon exhibited the greatest abundance and boldness, escaping primarily by walking to the ground and preferring impermeable areas. The Eared Dove showed intermediate abundance and boldness but a wider habitat uses than the Rock Pigeon. The recently urbanized Spot-winged Pigeon showed the lowest abundance and boldness, predominantly escaping by flying to elevated perches, demon-strating a strong dependence on tree cover. The Bare-faced Ground Dove was only present in one green area, indicating a process of disappearance in the city, and the Picui Ground Dove was totally absent from our counts, probably due to physiological limitations. Gen-eralized linear models confirmed that body mass did not explain AD or FID, rather, bold-ness was more related to the timing and ecological opportunities for urban colonization in relation to environmental factors. Combining behavioral metrics (AD, FID and escape mode) with population censuses offers a low-cost, highly sensitive tool for monitoring urban wildlife dynamics and guiding biodiversity-friendly urban planning.
Keywords:
boldness
; escape tactics
; behavioral ecology
; urban biodiversity
; urban plannig
; Columbidae
; neotropics
; Andes
1. Introduction
Urbanization poses new ecological and evolutionary challenges for the biodiversity [1,2,3], a phenomenon particularly studied on birds [4,5,6]. Because only some species are able to survive and colonize urban environments in relation to their particular biological and ecological characteristics [7,8,9,10], these species tend to become dominant, while others disappear as urbanization increases, altering community composition, ecological functions, and ecosystem services [11,12]. These processes of colonization or disappearance of species will also depend on the dynamic changes in the characteristics of cities [13,14], so having simple and accessible monitoring programs based on indicator species would allow generating quick information for decision-making and the construction of biodiversity-friendly cities.
The successful colonization of cities by a bird species is a time-dependent process [13,15,16] that is expressed as an increase in population density [15,17]. However, the response to urbanization involves not only an increase in the number of individuals, but also other biological and ecological changes, including behavioral ones such as a reduction in fear of humans i.e., [18,19,20,21,22]. Measuring boldness in birds is easy and practical for monitoring programs through metrics such as Flight initiation distance (FID) and Alert distance (AD) [7], and it has been suggested that FID is strongly related to the timing of urban colonization [16].
Despite the increasing use of FID and AD as indicators of urban response, several species-specific biological traits have been shown to have a strong effect on them, calling into question their applicability as monitoring tools. The main traits reported are body mass [22,23,24,25], color [7,26], diet type [27], and phylogeny [28,29]. Therefore, in order to consider the usefulness of FID and AD as indicators of colonization processes, it is interesting to evaluate their effect by controlling the variables that affect them.
An interesting approach is to work with a group of species that, in addition to being phylogenetically related, share similarities in some biological and ecological traits. Family Columbidae represent and ideal group for that, because in addition to being a monophyletic group, they share several biological characteristic as similar body plans, diet and color but could differ markedly in their degree of urban colonization success and body mass [30,31,32,33]. One of them, the Rock Pigeon (Columba livia), was capable to colonize urban environments worldwide [34,35], even becoming an invasive species, while other pigeon species are restricted to environments little altered by humans [36]. Not only exotic invasive species are able to success in the urban settlements [37], for example, in South America, the native Spot-winged Pigeon (Patagioenas maculosa) and the Eared Dove (Zenaida auriculata), species that normally are abundant in rural environments and even considered pest species for some agricultural crops [38,39,40,41], currently seems to be having success in colonizing urban environments, increasing its populations in there [42,43,44,45].
In the city of La Paz, a high-altitude tropical city, the pigeon species that can be found show differences in their success in colonizing the city, varying mainly in body mass, which would allow us to evaluate the question aforementioned by controlling a single variable. Indeed, Rock Pigeon and Eared Dove were reported before as frequent and abundant, but other native species as the Bare-faced Ground Dove (Metriopelia ceciliae) and the Picui Ground Dove (Columbina picui), seems to be more marginalized [46,47]; but besides that, the Spot-winged Pigeon is involved in a relatively recent colonization process, since [46] showed their absence in green areas two decades ago, but along the time passes it became more common [47].
The objective of this study is to evaluate whether the boldness of pigeon species in the city of La Paz, measured through FID and AD, along with their relative abundance, is better associated with what can be deduced from their time and ecological opportunities of colonization of the city than with morphological characteristics such as body mass, in order to evaluate the usefulness of these variables to monitor the processes of colonization or disappearance of different bird species in cities.
2. Materials and Methods
2.1. Study Area
The city of La Paz is the administrative capital and seat of government of Bolivia, it has experienced an accelerated territorial growth reaching an urbanized area of approximately 75 km2, although it has only around 700,000 inhabitants according to the Bolivian National Institute of Statistics [48]. Urban expansion is characterized by a large proportion of built-up areas in contrast to scarce and small green areas such as gardens, squares and parks [46]. The vegetation in these green areas has been significantly altered and replaced by exotic species. As a result, the diversity and richness of urban wildlife, particularly birds, has decreased with values reaching a mere fraction of their original levels [47,49]. The city presents a wide altitudinal gradient ranging from 3250 to 4100 m including a variety of geographical, geomorphological, and climatic factors, which in turn shape the distribution of bird diversity [47].
For our study we selected fifteen urban green areas (UGA) distributed throughout the city with vegetation cover of native and introduced species of herbs, shrubs, and trees. They included parks, squares, and cemeteries with a separation of at least 250 m between them to achieve independence of their bird communities [50]. In order to control for the potential altitudinal effect [47], our selected UGA varied in altitude only 550 m between them (Supplementary material Table S1).
Regardless of the surface area occupied by each UGA, we considered a one-hectare plot for each one to obtain the measurements of the environmental, boldness, and bird community variables. Therefore, if the size of the UGA was less than one hectare, we included the surrounding streets, if the size of the UGA was greater than one hectare, we located randomly a single plot within it.
2.2. Bird Surveys, AD and FID Measurements
We conducted bird censuses, AD and FID measurements during the austral winter (between 1st July and 16th September of 2021) to avoid the breeding period of pigeons that could alter the antipredator behavior [51,52]. We conducted three independent surveys per UGA with an interval of at least two weeks between each to avoid a potential habituation of the birds. We referred to each of these three surveys as an “observation event” (OE). The measurements occurred only in mornings between 7:00 to 10:00, with a maximum of two hours per OE, on sunny or cloudy days, but never on rainy ones [53,54,55]. The observer was always the same person and used the same clothing (neutral, non-flashy colors) in each OE [56,57].
We determined the abundance of each pigeon species in each UGA locating a ten-minutes point count with a radius of 50 m at the center of each one-hectare plot. Because each UGA was visited three times, we considered the abundance as the maximum number of individuals counted for each species in any of the three OE. Finally, the occurrence of each pigeon species was measured in each UGA, classifying as present or absent.
For the measurement of FID and AD we approached to a pigeon of any of the considered species only when it was on the ground feeding, grooming, foraging, or moving their head, but never in an alert position [54,58]. It does not matter if the individual chosen was alone or in a group. We selected randomly the focal individual with binoculars before to approach [57,59], considering a distance from at least 30 m (mean 32.29 m, maximum 60 m, minimum 30 m) to avoid the effect of starting distance (SD) on FID and AD [60,61]. We determined SD with a laser rangefinder (Bushnell Yardage Pro Scout) as suggested by other authors e.g., [58,62]. We approached towards the individual at a normal walking speed, linearly and continuously with no obstacles between the observer and the focal bird [53,57].
The Alert Distance (AD) is the distance between the observer and the bird when the bird exhibits alerting behavior, including, for example, a vigilant posture, raising its head, stopping current activity, looking around, or directing its gaze toward the approaching person [54,57,63,64]. AD was calculated in meters using a tape measure between the exact position of the observer (positioning a mark) and the point in which the bird exhibited the alert behavior.
Subsequently, we recorded the Flight Initiation Distance (FID). This involved measuring the previously calculated distance and adding the remaining distance when the bird flushed by walking, jumping, or running [64,65] using the same procedure to the one used for AD, recording whether the bird’s escape was aerial (flying) or terrestrial [64,65] and the location to which it escaped classified as “non-ground” or “ground” places. So, FID represents the distance between the initial position of the observer and the exact location from which the bird initiated the escape. We did not used the laser rangefinder for AD and FID as the distance to be measured was often less than 10m, a distance out the accuracy of the equipment.
2.3. Environmental Variables
FID and AD are highly influenced by context-specific environmental variables as the surrounding human presence [22,66,67], the presence of dogs [68], urban vegetation [66,69], the size of the bird group [27], and temperature [25]. To evaluate the effect of these variables on our study we measured them at each OE. We obtained the ambient temperature with a digital thermometer four times throughout the two-hour period of each OE, the temperature for each OE was the average of the four measurements. After the measurement of pigeons’ abundance, we recorded the number of pedestrians (PN) and the number of dogs (DN) using a five-minutes point count situated at the center of the one-hectare plot. We are including the average values of such variables in Supplementary Material Table S2, as reference of the variation between UGAs.
As an effect of the flock size (FS) has been observed e.g., [27,66,70,71], we recorded for each AD and FID measurement the sum of all individuals of the same species (conspecifics) and individuals of different bird species (whether or not they are species of pigeons) accompanying the focal individual in a circular area of approximately 10 m radius [32,63,72] (Supplementary Material Table S2).
After conducting bird censuses and AD and FID measurements, during September 2021 we recorded the independent environmental variables that remained fixed throughout the study. These variables are: number of trees (TN, counting each tree in the one-hectare plot of each green area), average tree height (TH, which is the average of the height of all trees present in the one-hectare plot using the Pythagorean theorem, measuring the horizontal distance to the base of each tree and the height of the last branch using a laser rangefinder), and the percentage of exotic species (ES, the percentage of tree and shrub species with natural distribution outside of South America in relation to the total tree and shrub species present in the one-hectare plot). We did not consider dry, dead or cut trees without branches in the measurements.
Finally, we obtained the normalized difference vegetation index (NDVI) for each one-hectare plot for each green area, this index is one of the most commonly used vegetation indices to assess urban vegetation structure [73] and has also been proposed as a proxy of different properties of bird communities [74]. We obtained NDVI values from high-resolution satellite images provided by the Bolivian Spatial Agency (ABE) [75]. The scale provided by the ABE implies values from – 0.2 to 1 for pixels of 20 x 20 m, we determined the NDVI values considering the average value of the 25 pixels contained in each one-hectare plot. The graphic explanation is found in Supplementary Material Figure S1.
2.4. Statistical Analysis
We performed all statistical analysis excluding the data from the Bare-faced Ground Dove because we obtained for this species only three FID and AD measurements in only one green area. Picui Ground Dove was not recorded in any of the studied green areas. Before analyzing the behavioral response variables of the other three pigeon species in relation to the explanatory variables, we performed a Spearman rank correlation with all of them to select and eliminate the redundant ones. Our explanatory variables are the normalized difference vegetation index (NDVI), the number of trees (TN), the average tree height (TH), the percentage of exotic species (ES); the number of pedestrians (PN), the number of dogs (DN), the average temperature (T); and the flock size (FS). We decided to incorporate in the subsequent analyses all the explanatory variables because all rs values were less than 0.7 (Supplementary Material Figure S2). We run nonparametric Spearman correlations to assess the possible effect of the start distance on AD and FID.
The variables AD and FID are continuous but not normally distributed, so we applied generalized lineal models (GLM) with Gamma probability distribution and log link function. We first analyzed the effect of species mass by including in the model this variable together with the other eight explanatory variables. After that, we ran the model including instead “species” (with three levels) as a fixed factor, with a Bonferroni test as post hoc to evaluate the pair-pair differences between species. To understand the effect of each explanatory variables on AD and FID, we ran separate GLM models for each species with each explanatory variable, and then built models with each of the explanatory variables to select the variables that best explain the AD and FID responses using the corrected Akaike information criterion (AICc) value as reference.
Using the maximum abundance of each pigeon species as a measure of its relative preference over the environmental variables of each of the UGAs, we explored this by building GLM models in the same way as for AD and FID, first running models for each species with the eight explanatory variables and then running models with each of the explanatory variables using AICc values to rank the variables in relation to their explanatory level. Maximum abundance is a count variable, so we used GLMs with a Poisson probability distribution and log link function. We also explored the relationship of the abundances of each pigeon species to each other using non-parametric Spearman correlations.
Finally, for the analysis of the variation of escape mode and escape site among pigeon species, we used GLM models with Binomial probability function and logit link function because we have only two levels for each response variable, walking and flying for escape mode, and ground and non-ground for escape site. We applied a Bonferroni test as a post hoc to assess the pair-pair difference between species. We performed all statistical analysis using R-studio software with the packages: AICcmodavg, ggplot, readxl, mgcv, nlme, ggpubr, rstatix, tidyverse, nnet, and hmisc.
3. Results
3.1. Pigeon Community Composition and Abundance
The abundance and occurrence of the five pigeon species in the 15 GUA was highly variable between species. Rock Pigeon was for far the most abundant, but not present in all the GUA, Eared Dove was observed in all the GUA in second place in abundance, Spot-winged Pigeon was present in 13 GUA with lesser abundances, Bare-faced Ground Dove was registered in only one, and Picui Ground Dove in none (Supplementary Material Table S3).
3.2. Behavioral Tolerance Reflects Different Stages of Urban Colonization
We were able to collect 250 data on Alert Distance (AD) and Flight Initiation Distance (FID) for the four species in total (Table 1). The start distance (SD) did not affect the measurements of AD (rs = -0.003; p = 0.958) nor the measurements of FID (rs = 0.078; p = 0.222). Due to the limited data and its presence in only one UGA, data from Bare-faced ground dove was excluded from the further statistical analysis, so we worked with 247 data.
Generalized linear models that included body mass among the predictive variables were significant for AD (Likelihood Ratio Test: χ2 = 13.329, df = 9, p < 0.001) and for FID (Likelihood Ratio Test: χ2 = 41.720, df = 9, p < 0.001), however, body mass was a variable that did not significantly explain either AD (t value= 1.719, p = 0.086) or FID (t value= 0.070, p = 0.944). When the same analysis was performed using “species” as a factor, the model revealed that species had a significant effect on AD (Likelihood Ratio Test: χ2 = 25.775, df = 10, p < 0.001) and on FID (Likelihood Ratio Test: χ2 = 62.0696, df = 10, p < 0.001). Pairwise comparisons with Post Hoc Bonferroni show that the responses of FID of the three species were significantly different among them, but for AD there were not differences between the Rock Pigeon and the Eared Dove (Figure 1). The Rock Pigeon shows the highest boldness to humans, the Spot-winged Pigeon the lowest boldness and the Eared Dove a comparatively intermediate position closer to the Rock Pigeon. Therefore, the differences in AD and FID did not follow a body mass related pattern, but rather exhibit species-specific patterns and for this reason we ran separate models for AD and FID for each of the three pigeon species.
3.3. Environmental Predictors of Abundance and Behavioral Tolerance
Species-specific GLM models reveal that the predictor variables explaining AD and FID for each species are different. AD for the Rock Pigeon is not significantly explained by any variable, but FID is significantly and inversely related to the number of pedestrians (PN), meaning that boldness increases when there are more people in the green area (Supplementary Material Table S4). For the Spot-winged Pigeon, both AD and FID are significantly and positively explained by average tree height (TH) and number of trees (TN), meaning that boldness decreases when more trees are present in a green area (Supplementary Material Table S5). For the Eared Dove, FID is not significantly explained by any variable, but AD is significantly and negatively explained by the number of pedestrians, so similarly to the Rock Pigeon, boldness increases when there are more people in the green area (Supplementary Material Table S6).
Species-specific GLM models for maximum abundance help to understand the relative preferences of each species for the characteristics present in each green area. The Rock Pigeon significantly prefers green areas with more people, dogs and exotic species while avoiding green areas with more vegetation (Supplementary Material Table S4). The Eared Dove similarly avoids green areas with more vegetation due to a significant and negative relationship with the average of tree height (TH) and the NDVI (Supplementary Material Table S6). In contrast, the Spot-winged Pigeon prefers green areas with more vegetation cover due to the significant and positive relationship with NDVI (Supplementary Material Table S5).
3.4. Relationships Among Species Abundances
These particular preferences are also explained, although not significantly, by the inverse relationship between the maximum abundances of the Spot-winged Pigeon with the Rock Pigeon (rs = -0.257; p = 0.354) and the Eared Dove (rs = -0.471; p = 0.077), while there is a positive relationship between those last two species (rs = 0.191; p = 0.495) (Figure 2).
3.5. Escape Strategies as an Indicator of Urban Habituation
A significant difference in escape behavior was also found between pigeon species for escape mode (χ2 = 37.556, df = 2, p < 0.001) and escape site (χ2 = 47.311, df = 2, p < 0.001). The Rock Pigeon escapes mainly by walking and to the ground, whereas the Spot-winged Pigeon escapes mainly by flying and to elevated structures (above the ground). For the Eared Dove, there was no significant difference in escape mode or escape site for any of the variables (Figure 1).
4. Discussion
4.1. Apparent Temporal Changes in Urban Pigeon Communities
The composition of the pigeon community in the city of La Paz appears to have undergone significant changes in the last two decades. Although there are no systematic population monitoring programs to quantify these trends, the complete absence of the Picui Ground Dove and the presence of the Bare-faced Ground Dove in only one of our sampled green areas are signs that warrant special attention. In 2000, the Bare-faced Ground Dove was recorded in six green areas of La Paz and the Picui Ground Dove in twelve [46]. Subsequently, between 2004 and 2005, the Picui Ground Dove was not recorded in either urban or extra-urban environments of La Paz, while the Bare-faced Ground Dove showed moderate abundance and frequency of occurrence [47]. Our results suggest that both species may be experiencing a progressive decline within the urban matrix of La Paz, which could be explained by differences in their natural history.
The Bare-faced Ground Dove nests mainly on the ground, in rocky walls, or in natural cavities [77,78,79], characteristics that could increase its vulnerability to urbanization. Several studies have shown that ground-dwelling birds, and especially those that nest on the ground, are often among the groups most affected by urban transformation due to the increase in generalist predators and the loss of suitable breeding sites [80,81]. The situation for the Picui Ground Dove appears to be driven by different factors, since this species nests in trees and shrubs and can reach high abundances in both rural and urban environments in other regions of South America [77,82]. The disappearance of the Picui Ground Dove from urban green areas of La Paz is, therefore, more difficult to explain solely by the loss of vegetation, and it is possible that physiological constraints associated with the high- altitude hypoxia [83] may be limiting its establishment in La Paz. This hypothesis requires further evaluation, given that the species is quite abundant in rural and suburban areas of the La Paz River valley below 3250 m (pers. obs).
It is also possible that the gradual increase of Eared Dove and Spot-winged Dove could represent an additional competitive disadvantage for the Bare-faced Ground Dove and the Picui Ground Dove, an aspect that also justifies future research. Nevertheless, our study demonstrates that even within a taxonomically homogeneous group such as pigeons, urbanization processes can reflect changes over time in composition, abundance, or frequency, and these findings are of interest to monitoring programs; and although the number of species is small, they offer potential as a simple and efficient system for urban biodiversity monitoring programs.
4.2. Boldness Reflects the Processes of Urban Colonization, Its Usefulness for Monitoring Programs
Several comparative studies have suggested that body mass is a major predictor of FID and AD, such that larger species should initiate flight at greater distances [22,23,24,25]. However, our results do not support this prediction. Although the Eared Dove exhibited shorter escape distances than the Spot-winged Pigeon, in line with the prediction, more importantly, the Rock Pigeon showed the highest tolerance of all the species studied despite having a similar body mass to the Spot-winged Pigeon. When working with an ecologically and biologically homogeneous group like pigeons, which allow us to control for variables such as phylogeny, color, and diet, other species-specific variables are candidates to explain the observed differences.
The historical process of urban colonization by components of the biota offers a plausible interpretation consistent with the pattern observed in the city of La Paz. The Rock Pigeon has been associated with human settlements for thousands of years and was introduced to the Americas as part of the European colonization process [34,35], which likely allowed it to establish itself early on American cities. The Eared Dove, on the other hand, is a native species that must have gradually colonized urban environments from surrounding wild populations, a process that is being documented recently in some South American cities [42,84]. But the case of the Spot-winged Pigeon is more interesting because the available information for La Paz suggest that this species is only recently integrating into the urban matrix. It was absent from urban green areas at the beginning of this century [46], began to be recorded a few years later, in low in abundance and frequency [47], and our results, by comparison, show that it has become more common in urban green areas. This temporal sequence among the three species closely coincides with the tolerance gradient detected among them (Figure 1).
Our results support the proposal previously presented by [59,60,85], who suggest that the timing of urban colonization is an important determinant of tolerance toward humans. This also supports the central hypothesis of this study: that interspecific differences appear to be primarily associated with the urban colonization process and the ecological opportunities each species has been able to exploit, rather than with morphological characteristics such as body mass. In this context, AD and FID measures not only reflect behavioral differences between species but can also be interpreted as indicators of the degree of progress in the urban colonization process, making them potentially useful tools for monitoring ecological changes in urban bird communities.
The observed abundance patterns were consistent with those obtained using boldness measures, reinforcing the interpretation that both variables reflect different dimensions of the urban colonization process. The Rock Pigeon, the most abundant species in the city, also exhibited the shortest AD and FID, while the less abundant Spot-winged Pigeon showed the highest FID and AD values; the Eared Dove occupied an intermediate position in both abundance and boldness. This suggests that the most widely established species within the urban matrix not only progressively increase their population size but also simultaneously develop greater tolerance toward human presence.
Population growth represents a demographic consequence of the successful colonization process, but behavioral changes revealed by AD and FID may respond more rapidly to new environmental conditions, as they show changes in risk perception and habituation to human presence before a significant population increase can be detected. In this regard, we propose incorporating these behavioral variables into monitoring programs, which could provide early indicators of colonization processes in urban environments, complementing the information obtained through abundance censuses. This approach would be particularly useful for describing the case of the Spot-winged Pigeon in future studies, since, although the species has apparently increased its frequency of occurrence and abundance compared to records from two decades ago [46,47], the high AD and FID values indicate that it is still shy, likely exhibiting behavior typical of a species in the initial stages of urban colonization. Consequently, the combination of abundance and boldness allows for the identification of different stages of the colonization process with a level of detail that would be difficult to achieve using only population data.
4.3. Ecological Determinants of Urban Habituation and Considerations for Monitoring Programs
Generalized linear models (GLM) show that differences between species are expressed not only in their level of tolerance toward human presence, but also in how each species responds to the characteristics of the urban environment. Taken together, these results indicate that the availability of ecological opportunities is a fundamental component in understanding the processes of urban colonization.
In the case of the Rock Pigeon, both abundance and boldness measures show a positive association with environments highly transformed by humans and less vegetation cover. This preference is consistent with numerous studies that describe the species as highly dependent on human structures for nesting and on food resources provided directly or indirectly by people [34,77]. The concentration of large flocks in urban parks with intense human activity, where more than two hundred individuals were recorded per counting point, is a clear manifestation of this. Interestingly, the native Eared Dove, exhibited a partially similar pattern, with greater tolerance to environments with strong human influence, but, unlike the Rock Pigeon, it did not avoid green areas with greater vegetation cover. This greater ecological flexibility explains why it is the most frequent species in urban green areas of La Paz, although at the moment it is not becoming the most abundant species, as is already happening in other cities in South America [45]. In contrast, the Spot-winged Pigeon showed a strong dependence on green areas with abundant vegetation and low levels of disturbance. This association remained consistent in both abundance and boldness models, indicating that vegetation, particularly trees, continues to play a fundamental role in the species’ ecology within the city.
The type of escape and the chosen escape site also provided valuable information for a more detailed interpretation of the degree of integration of each species into the urban environment. The most frequent escape method exhibited by the Spot-winged pigeon was flying towards trees or other elevated structures, in contrast to the Rock Pigeon’s escapes, which primarily involved walking to the ground before resuming its normal activities. Several studies have indicated that escaping walking is a characteristic response of species highly habituated to human presence, which perceive the urban environment as relatively safe and reduce the energy cost associated with flight [65,86,87,88]. Consequently, the greater AD and FID, along with the type of escape observed in the Spot-winged Pigeon, reinforces the evidence that its colonization process is still underway.
Taken together, these results indicate that the urbanization process involves not only an increase in the population of certain species, but also a gradual change in how they utilize available resources within the city. In this context, the patterns detected by generalized linear models (GLMs) and escape type analysis support the hypothesis that the ecological opportunities offered by the urban environment (food, shelter, and nesting sites), along with colonization time, better explain the observed differences in boldness among species than morphological characteristics such as body mass. Furthermore, escape behavior provides information that goes beyond a simple measure of boldness toward humans. The simultaneous incorporation of demographic (abundance) and behavioral (AD, FID, type and location of escape) measures provides a more comprehensive approach than either of these indicators used independently, reinforcing our proposal to use boldness measures to monitor urban colonization processes.
Our study is limited to a small number of species belonging to a single family, and although it was precisely this taxonomic homogeneity that allowed us to reduce the influence of confounding factors, facilitating the identification of the role of the urban colonization process in boldness, it will be necessary to extend this approach to other groups of birds and to more cities with different environmental and biogeographical conditions to assess the generalizability of the observed patterns.
4.4. Implications for Biodiversity-Friendly Cities Design
Urbanization is a dynamic process that continually alters the composition of bird communities, favoring the establishment of some species while others decline or disappear [33,89]. Our results have implications beyond pigeon ecology and provide relevant information for planning more biodiversity-friendly cities. The observed differences indicate that the structural simplification of the urban environment primarily benefits species that are less dependent on vegetation and more closely associated with human activities. Spot-winged Pigeon and Eared Dove use trees and shrubs not only as shelter after escape flights but also as regular nesting sites [41,77]. In contrast, the Rock Pigeon depend mainly on buildings and other artificial structures for reproduction, giving them a competitive advantage in urbanized environments that eliminate green areas in favor of gray infrastructure and impermeable surfaces. The case of the Bare-faced Ground Dove offers an additional perspective, as its apparent decline in most of the city may reflect the limited availability of natural environments capable of supporting species with predominantly terrestrial habits and specific nesting requirements.
Tree cover and natural environments remain essential components for bird native species, even as they show increasing habituation to urban environments. Therefore, planning a city with large green spaces that support a high diversity of plant species in a multi-layered design, maintaining areas with natural vegetation, and dedicating specific areas for rewilding could help reduce this process of biotic simplification [90]. In this context, our results indicate that easily obtainable variables, such as abundance, AD, FID, and the type and choice of escape sites, allow for the rapid detection of differences in the degree of urban habituation and can guide management decisions aimed at conserving native biodiversity within cities.
5. Conclusions
In conclusion, our results support the hypothesis that boldness toward human presence reflects the degree of urban colonization more accurately than morphological characteristics such as body mass. The combination of abundance, AD, FID, and escape behavior constitutes a simple, rapid, and low-cost tool for monitoring species colonization and decline within cities, providing useful information for both ecological research and the design of strategies aimed at conserving more biodiverse and functional urban environments.
Supplementary Materials
The following supporting information can be downloaded at the website of this paper posted on Preprints.org, Table S1. Geographic position and altitude (meters above sea level) of the centroid point of each urban green area (UGA), including environmental variables that were constant throughout the study for each UGA. Abbreviations: normalized difference vegetation index (NDVI), average tree height (TH), number of trees (TN), percentage of exotic species (ES); Table S2. Mean values ± standard deviation (SD) and number of cases (N) of explanatory environmental variables for each urban green area obtained during the observation events. The average values come from all measurements made in each observation event, and in the case of flock size from all counts made during each AD and FID measurements; Table S3. Maximum abundance values of each pigeon species in each urban green area (UGA). Abbreviations: RP: Rock Pigeon (Columba livia), SWP Spot-winged Pigeon (Patagioenas maculosa), ED Eared Dove (Zenaida auriculata), BFGD Bare-faced Ground Dove (Metriopelia ceciliae). The rows at the bottom show the total abundance as the sum of the maximum abundances in each UGA, the mean ± SD of abundance, and the occurrence of each species as the number of UGAs in which were registered out a total of 15; Table S4. Results of the generalized linear models (GLM) analyses for the Rock Pigeon. For Alert Distance (AD) and Flight Initiation Distance (FID) we used models with Gamma probability distribution and log link function, for Maximum Abundance we used models with Poisson probability distribution and log link function. Descriptive Variables abbreviations: normalized difference vegetation index (NDVI), number of trees (TN), average tree height (TH) percentage of exotic species (ES), number of pedestrians (PN), number of dogs (DN), average temperature (T), and flock size (FS); Table S5. Results of the generalized linear models (GLM) analyses for the Spot-winged Pigeon. For Alert Distance (AD) and Flight Initiation Distance (FID) we used models with Gamma probability distribution and log link function, for Maximum Abundance we used models with Poisson probability distribution and log link function. Descriptive Variables abbreviations: normalized difference vegetation index (NDVI), number of trees (TN), average tree height (TH) percentage of exotic species (ES), number of pedestrians (PN), number of dogs (DN), average temperature (T), and flock size (FS); Table S6. Results of the generalized lineal models (GLM) analyses for the Eared Dove. For Alert Distance (AD) and Flight Initiation Distance (FID) we used models with Gamma probability distribution and log link function, for Maximum Abundance we used models with Poisson probability distribution and log link function. Descriptive Variables abbreviations: normalized difference vegetation index (NDVI), number of trees (TN), average tree height (TH) percentage of exotic species (ES), number of pedestrians (PN), number of dogs (DN), average temperature (T), and flock size (FS); Figure S1. Example of NDVI values for two urban green areas: Jardín Cemetery and General Cemetery. We obtained the value of NDVI for each one-hectare plot, averaging the value of each 20x20 m; Figure S2. Correlation values between all the explanatory variables flock size (FS), temperature (T), number of pedestrians (PN), number of dogs (DN), number of trees (TN), average tree height (TH), normalized difference vegetation index (NDVI), exotic species (ES). The values in each cell are the Spearman rank correlation (rs) in relation the bar colors at the bottom. X means no correlation, and the significance p-value appears as * (0.05 to 0.01) or *** (< 0.001).
Author Contributions
Conceptualization, A.P.C-M. and Á.G-Z.; methodology, A.P.C-M.; software, A.P.C-M.; formal analysis, A.P.C-M. and Á.G-Z.; investigation, A.P.C-M. and Á.G-Z.; writing—original draft preparation, A.P.C-M. and Á.G-Z.; writing—review and editing Á.G-Z. and A.P.C-M.; supervision and project administration, Á.G-Z. All authors have read and agreed to the published version of the manuscript.
Funding
This research received no external funding.
Institutional Review Board Statement
Not applicable, no animals were captured nor manipulated.
Informed Consent Statement
Not applicable.
Data Availability Statement
The raw data supporting the conclusions of this article will be made available by the authors upon request.
Acknowledgments
We are very grateful the Instituto de Ecología at Universidad Mayor de San Andrés provided us with the equipment. Daniela Ticona kindly allowed us to use her drawings of the doves and pigeons.
Conflicts of Interest
The authors declare no conflicts of interest.
References
- Aronson, M.F.J.; La Sorte, F.A.; Nilon, C.H.; Katti, M.; Goddard, M.A.; Lepczyk, C.A.; … Winter, M. A global analysis of the impacts of urbanization on bird and plant diversity reveals key anthropogenic drivers. Proc. Biol. Sci. 2014, 281, 20133330. [Google Scholar] [CrossRef] [PubMed]
- Aronson, M.F.; Nilon, C.H.; Lepczyk, C.A.; Parker, T.S.; Warren, P.S.; Cilliers, S.S.; … Zipperer, W. Hierarchical filters determine community assembly of urban species pools. Ecology 2016, 97, 2952–2963. [Google Scholar] [CrossRef] [PubMed]
- Aronson, M.F.J.; Lepczyk, C.A.; Evans, K.L.; Goddard, M.A.; Lerman, S.B.; MacIvor, J.S.; Nilon, C.H.; Vargo, T. Biodiversity in the city: key challenges for urban green space management. Front. Ecol. Environ. 2017, 15, 189–196. [Google Scholar] [CrossRef]
- Rega-Brodsky, C.C.; Aronson, M.F.; Piana, M.R.; Carpenter, E.S.; Hahs, A.K.; Herrera-Montes, A.; … Nilon, C.H. Urban biodiversity: State of the science and future directions. Urban Ecosyst. 2022, 25, 1083–1096. [Google Scholar] [CrossRef]
- Lowry, H.; Lill, A.; Wong, B.B. Behavioural responses of wildlife to urban environments. Biol. Rev. 2013, 88, 537–549. [Google Scholar] [CrossRef] [PubMed]
- Sol, D.; Lapiedra, O.; González-Lagos, C. Behavioural adjustments for a life in the city. Anim. Behav. 2013, 85, 1101–1112. [Google Scholar] [CrossRef]
- Blumstein, D.T.; Fernández-Juricic, E.; Zollner, P.A.; Garity, S.C. Inter-specific variation in avian responses to human disturbance. J. Appl. Ecol. 2005, 42, 943–953. [Google Scholar] [CrossRef]
- MacGregor-Fors, I.; García-Arroyo, M.; Quesada, J. Keys to the city: an integrative conceptual framework on avian urban filtering. J. Urban Ecol. 2022, 8, juac026. [Google Scholar] [CrossRef]
- Hahs, A.K.; Fournier, B.; Aronson, M.F.; Nilon, C.H.; Herrera-Montes, A.; Salisbury, A.B.; … Moretti, M. Urbanisation generates multiple trait syndromes for terrestrial animal taxa worldwide. Nat. Commun. 2023, 14, 4751. [Google Scholar] [CrossRef] [PubMed]
- Neate-Clegg, M.H.; Tonelli, B.A.; Youngflesh, C.; Wu, J.X.; Montgomery, G.A.; Şekercioğlu, Ç.H.; Tingley, M.W. Traits shaping urban tolerance in birds differ around the world. Curr. Biol. 2023, 33, 1677–1688. [Google Scholar] [CrossRef] [PubMed]
- Sol, D.; González-Lagos, C.; Moreira, D.; Maspons, J.; Lapiedra, O. Urbanisation tolerance and the loss of avian diversity. Ecol. Lett. 2014, 17, 942–950. [Google Scholar] [CrossRef] [PubMed]
- Alberti, M. Eco-evolutionary dynamics in an urbanizing planet. Trends Ecol. Evol. 2015, 30, 114–126. [Google Scholar] [CrossRef] [PubMed]
- Ramalho, C.E.; Hobbs, R.J. Time for a change: dynamic urban ecology. Trends Ecol. Evol. 2012, 27, 179–188. [Google Scholar] [CrossRef] [PubMed]
- Alberti, M.; Palkovacs, E.P.; Roches, S.D.; Meester, L.D.; Brans, K.I.; Govaert, L.; … Verrelli, B.C. The complexity of urban eco-evolutionary dynamics. BioScience 2020, 70, 772–793. [Google Scholar] [CrossRef]
- Evans, J.; Boudreau, K.; Hyman, J. Behavioural syndromes in urban and rural populations of song sparrows. Ethology 2010, 116, 588–595. [Google Scholar] [CrossRef]
- Mikula, P.; Grünwald, J.; Reif, J. Species’ urbanization time but not present urban tolerance predicts avian fear responses towards human. BMC Biol. 2025, 23, 295. [Google Scholar] [CrossRef] [PubMed]
- Møller, A.P.; Diaz, M.; Flensted-Jensen, E.; Grim, T.; Ibáñez-Álamo, J.D.; Jokimäki, J.; … Tryjanowski, P. High urban population density of birds reflects their timing of urbanization. Oecologia 2012, 170, 867–875. [Google Scholar] [CrossRef] [PubMed]
- Atwell, J.W.; Cardoso, G.C.; Whittaker, D.J.; Campbell-Nelson, S.; Robertson, K.W.; Ketterson, E.D. Boldness behavior and stress physiology in a novel urban environment suggest rapid correlated evolutionary adaptation. Behav. Ecol. 2012, 23, 960–969. [Google Scholar] [CrossRef] [PubMed]
- Myers, R.E.; Hyman, J. Differences in measures of boldness even when underlying behavioral syndromes are present in two populations of the song sparrow (Melospiza melodia). J. Ethol. 2016, 34, 197–206. [Google Scholar] [CrossRef]
- Patankar, S.; Jambhekar, R.; Suryawanshi, K.R.; Nagendra, H. Which Traits Influence Bird Survival in the City? A Review. Land 2021, 10, 92. [Google Scholar] [CrossRef]
- Garitano-Zavala, Á.; Calbimonte, R.; Esteve-Herraiz, G. The Behavioral Responses of the Chiguanco Thrush to Urbanization in a Neotropical City comes from Preadapted Behavioral Traits. Front. Ecol. Evol. 2022, 10, 830902. [Google Scholar] [CrossRef]
- Mikula, P.; Tomášek, O.; Romportl, D.; Aikins, T.K.; Avendaño, J.E.; Braimoh-Azaki, B.D.; … Albrecht, T. Bird tolerance to humans in open tropical ecosystems. Nat. Commun. 2023, 14, 2146. [Google Scholar] [CrossRef] [PubMed]
- Samia, D.S.; Nakagawa, S.; Nomura, F.; Rangel, T.F.; Blumstein, D.T. Increased tolerance to humans among disturbed wildlife. Nat. Commun. 2015, 6, 8877. [Google Scholar] [CrossRef] [PubMed]
- del Barco-Trillo, J. Shyer and larger bird species show more reduced fear of humans when living in urban environments. Biol. Lett. 2018, 14, 20170730. [Google Scholar] [CrossRef] [PubMed]
- Díaz, M.; Grim, T.; Markó, G.; Morelli, F.; Ibáñez-Alamo, J.D.; Jokimäki, J.; … Møller, A.P. Effects of climate variation on bird escape distances modulate community responses to global change. Sci. Rep. 2021, 11, 12826. [Google Scholar] [CrossRef] [PubMed]
- Møller, A.P.; Liang, W.; Samia, D.S. Flight initiation distance, color and camouflage. Curr. Zool. 2019, 65, 535–540. [Google Scholar] [CrossRef] [PubMed]
- Morelli, F.; Benedetti, Y.; Díaz, M.; Grim, T.; Ibáñez-Álamo, J.D.; Jokimäki, J.; … Møller, A.P. Contagious fear: escape behavior increases with flock size in European gregarious birds. Ecol. Evol. 2019, 9, 6096–6104. [Google Scholar] [CrossRef] [PubMed]
- Callaghan, C.T.; Major, R.E.; Wilshire, J.H.; Martin, J.M.; Kingsford, R.T.; Cornwell, W.K. Generalists are the most urban-tolerant of birds: a phylogenetically controlled analysis of ecological and life history traits using a novel continuous measure of bird responses to urbanization. Oikos 2019, 128, 845–858. [Google Scholar] [CrossRef]
- Callaghan, C.T.; Palacio, F.X.; Benedetti, Y.; Morelli, F.; Bowler, D.E. Large-scale spatial variability in urban tolerance of birds. J. Anim. Ecol. 2023, 92, 403–416. [Google Scholar] [CrossRef] [PubMed]
- Leveau, L.M.; Leveau, C.M. Comunidades de aves en un gradiente urbano de la ciudad de Mar del Plata, Argentina. El Hornero 2004, 19, 13–21. [Google Scholar] [CrossRef]
- Blumstein, D.T. Developing an evolutionary ecology of fear: how life history and natural history traits affect disturbance tolerance in birds. Anim. Behav. 2006, 71, 389–399. [Google Scholar] [CrossRef]
- Gendall, J.; Lill, A.; Beckman, J. Tolerance of disturbance by humans in long-time resident and recent colonist urban doves. Avian Res. 2015, 6, 1–8. [Google Scholar] [CrossRef]
- Cristaldi, M.A.; Sarquis, J.A.; Leveau, L.M.; Giraudo, A.R. Bird community responses to urbanization in a medium-sized Argentine city: Santo Tomé (Santa Fe Province) as a case study. El Hornero 2022, 37, 105–120. [Google Scholar] [CrossRef]
- Johnston, R.F.; Janiga, M. Feral pigeons, 1st ed.; Oxford University Press. Inc.: New York, USA, 1995. [Google Scholar]
- Lowther, P.E.; Johnston, R.F. Rock Pigeon (Columba livia). In Birds of the World, version 1.0; Billerman, S.M., Ed.; Cornell Lab of Ornithology: Ithaca, New York, USA, 2020. [Google Scholar] [CrossRef]
- Winkler, D.W.; Billerman, S.M.; Lovette, I.J. Pigeons and Doves (Columbidae). In Birds of the World, version 1.0; Billerman, S.M., Keeney, B.K., Rodewald, P.G., Schulenberg, T.S., Eds.; Cornell Lab of Ornithology: Ithaca, New York, USA, 2020. [Google Scholar] [CrossRef]
- Suárez-Rodríguez, M.; Schondube, J.E.; Camacho-Cervantes, M. How close can we get? Tolerance to human approximation of invasive doves vs. native doves. Urban Ecosyst. 2022, 26, 117–125. [Google Scholar] [CrossRef]
- Codesido, M.; Zufiaurre, E.; Bilenca, D. Relationship between pest birds and landscape elements in the Pampas of central Argentina. Emu 2015, 115, 80–84. [Google Scholar] [CrossRef]
- Fernandez-Maldonado, V.N.; Gorla, D.E.; Borghi, C.E. Landscape features influencing nesting site selection of Columba livia and Patagioenas maculosa in a South American desert city. El Hornero 2017, 32, 257–268. [Google Scholar] [CrossRef]
- Baptista, L.F.; Trail, P.W.; Horblit, H.M.; Boesman, P.F.D.; Garcia, E.; Pantoja-Maggi, V. Eared Dove (Zenaida auriculata). In Birds of the World, version 1.0; del Hoyo, J., Elliott, A., Sargatal, J., Christie, D.A., de Juana, E., Medrano, F., Eds.; Cornell Lab of Ornithology: Ithaca, NY, USA, 2024. [Google Scholar] [CrossRef]
- del Hoyo, J.; Baptista, L.F.; Collar, N.; Trail, P.W.; Kirwan, G.M.; Horblit, H.M.; Boesman, P.F.D.; Garcia; E. Pantoja-Maggi, V. Spot-winged Pigeon (Patagioenas maculosa). In Birds of the World, version 1.2; Keeney, B.K., Medrano, F., Eds.; Cornell Lab of Ornithology: Ithaca, USA, 2024. [Google Scholar] [CrossRef]
- Leveau, L.M. Primary productivity and habitat diversity predict bird species richness and composition along urban-rural gradients of central Argentina. Urban For. Urban Green. 2019, 43, 126349. [Google Scholar] [CrossRef]
- Leveau, L.M.; Leveau, C.M. Street design in suburban areas and its impact on bird communities: Considering different diversity facets over the year. Urban For. Urban Green. 2020, 48, 126578. [Google Scholar] [CrossRef]
- Galiano, L.; Leveau, C.M.; Leveau, L.M. Long-Term Changes in Bird Communities in the Urban Parks of Mar del Plata City, Argentina. Birds 2024, 5, 814–831. [Google Scholar] [CrossRef]
- Garizábal-Carmona, J.A.; Mancera-Rodríguez, N.J.; MacGregor-Fors, I. Birds under pressure: associations of highly-, moderately-, and lowly-abundant birds with landscape and local variables in a dense Neotropical city. J. Avian Biol. 2025, 2025, e03463. [Google Scholar] [CrossRef]
- Garitano-Zavala, Á.; Gismondi, P. Variación de la riqueza y diversidad de la ornitofauna en áreas verdes urbanas de las ciudades de La Paz y El Alto (Bolivia). Ecol. En. Boliv. 2003, 38, 65–78. [Google Scholar]
- Villegas, M.; Garitano-Zavala, Á. Bird community responses to different urban conditions in La Paz, Bolivia. Urban Ecosyst. 2010, 13, 375–391. [Google Scholar] [CrossRef]
- Instituto Nacional de Estadística. Available online: https://censo.ine.gob.bo/resultados/ (accessed on 15 July 2024).
- Leveau, L.M.; Leveau, C.M.; Villegas, M.; Cursach, J.A.; Suazo, C.G. Bird communities along urbanization gradients: a comparative analysis among three Neotropical cities. Ornitol. Neotrop. 2017, 28, 77–87. [Google Scholar] [CrossRef]
- Ralph, C.J.; Droege, S.; Sauer, J.R. Managing and monitoring birds using point counts: standards and applications. In Monitoring bird populations by point counts, 1st ed.; Ralph, C.J., Sauer, J.R., Droege, S., Eds.; U.S. Forest Service, Pacific Southwest Research Station: Albany, USA, 1995; pp. 161–175. [Google Scholar]
- Frid, A.; Dill, L. Human-caused Disturbance Stimuli as a Form of Predation Risk. Conserv. Ecol. 2002, 6. [Google Scholar] [CrossRef]
- Piratelli, A.J.; Favoretto, G.R.; Maximiano, M.F.D.A. Factors affecting escape distance in birds. Zoologia 2015, 32, 438–444. [Google Scholar] [CrossRef]
- Fernández-Juricic, E.; Jimenez; M.D. Lucas, E. Bird tolerance to human disturbance in urban parks of Madrid (Spain): management implications. In Avian ecology and conservation in an urbanizing world, 1st ed.; Marzluff, J.M., Bowman, R., Donnelly, R., Eds.; Kluwer Academic Publishers: Norwell, Massachusetts, USA, 2001; pp. 259–273. [Google Scholar]
- Fernández-Juricic, E.; Jimenez; M.D. Lucas, E. Alert distance as an alternative measure of bird tolerance to human disturbance: implications for park design. Environ. Conserv. 2001, 28, 263–269. [Google Scholar] [CrossRef]
- Fernández-Juricic, E.; Jimenez, M.D.; Lucas, E. Factors affecting intra- and inter-specific variations in the difference between alert distances and flight distances for birds in forested habitats. Can. J. Zool. 2002, 80, 1212–1220. [Google Scholar] [CrossRef]
- Gutzwiller, K.J.; Marcum, H.A. Bird reactions to observer clothing color: implications for distance-sampling techniques. J. Wildl. Manag. 1997, 61, 935–947. [Google Scholar] [CrossRef]
- Fernández-Juricic, E.; Schroeder, N. Do variations in scanning behavior affect tolerance to human disturbance? Appl. Anim. Behav. Sci. 2003, 84, 219–234. [Google Scholar] [CrossRef]
- Hall, M.J.; Burns, A.L.; Martin, J.M.; Hochuli, D.F. Flight initiation distance changes across landscapes and habitats in a successful urban coloniser. Urban Ecosyst. 2020, 23, 785–791. [Google Scholar] [CrossRef]
- Møller, A.P. Flight distance of urban birds, predation, and selection for urban life. Behav. Ecol. Sociobiol. 2008, 63, 63–75. [Google Scholar] [CrossRef]
- Møller, A.P. Interspecific variation in fear responses predicts urbanization in birds. Behav. Ecol. 2010, 21, 365–371. [Google Scholar] [CrossRef]
- Møller, A.P.; Garamszegi, L.Z. Between individual variation in risk-taking behavior and its life history consequences. Behav. Ecol. 2012, 23, 843–853. [Google Scholar] [CrossRef]
- García-Arroyo, M.; MacGregor-Fors, I. Tolerant to humans? Assessment of alert and flight initiation distances of two bird species in relation to sex, flock size, and environmental characteristics. Ethol. Ecol. Evol. 2020, 32, 445–456. [Google Scholar] [CrossRef]
- Blumstein, D.T.; Fernández-Juricic, E.; LeDee, O.; Larsen, E.; Rodriguez-Prieto, I.; Zugmeyer, C. Avian risk assessment: effects of perching height and detectability. Ethology 2004, 110, 273–285. [Google Scholar] [CrossRef]
- Tätte, K.; Møller, A.P.; Mänd, R. Towards an integrated view of escape decisions in birds: relation between flight initiation distance and distance fled. Anim. Behav. 2018, 136, 75–86. [Google Scholar] [CrossRef]
- Carlen, E.J.; Li, R.; Winchell, K.M. Urbanization predicts flight initiation distance in feral pigeons (Columba livia) across New York City. Anim. Behav. 2021, 178, 229–245. [Google Scholar] [CrossRef]
- Burger, J.; Gochfeld, M. Human Distance and Birds: Tolerance and Response Distances of Resident and Migrant Species in India. Environ. Conserv. 1991, 18, 158–165. [Google Scholar] [CrossRef]
- Morelli, F.; Mikula, P.; Benedetti, Y.; Bussière, R.; Jerzak, L.; Tryjanowski, P. Escape behaviour of birds in urban parks and cemeteries across Europe: evidence of behavioural adaptation to human activity. Sci. Total Environ. 2018, 631, 803–810. [Google Scholar] [CrossRef] [PubMed]
- Weston, M.A.; Fitzsimons, J.A.; Wescott, G.; Miller, K.K.; Ekanayake, K.B.; Schneider, T. Bark in the park: A review of domestic dogs in parks. Environ. Manag. 2014, 54, 373–382. [Google Scholar] [CrossRef] [PubMed]
- Møller, A.P.; Tryjanowski, P.; Díaz, M.; Kwieciński, Z.; Indykiewicz, P.; Mitrus, C.; …; Polakowski, M. Urban habitats and feeders both contribute to flight initiation distance reduction in birds. Behav. Ecol. 2015, 26, 861–865. [Google Scholar] [CrossRef]
- Blumstein, D.T. Attention, habituation, and antipredator behaviour: implications for urban birds. In Avian urban ecology, 1st ed.; Gil, D., Brumm, H., Eds.; Oxford University Press: Oxford, UK, 2014; pp. 41–53. [Google Scholar]
- Deboelpaep, E.; Keleman, P.J.; Vanschoenwinkel, B.; Koedam, N. Gallant geese, fearful flocks? Flock size and heterospecifics alter the escape behaviour of an invasive goose. Belg. J. Zool. 2018, 148, 135–147. [Google Scholar] [CrossRef]
- Rodriguez-Prieto, I.; Fernández-Juricic, E.; Martín; J. Regis, Y. Antipredator behavior in blackbirds: habituation complements risk allocation. Behav. Ecol. 2009, 20, 371–377. [Google Scholar] [CrossRef]
- Dobbs, C.; Nitschke, C.; Kendal, D. Assessing the drivers shaping global patterns of urban vegetation landscape structure. Sci. Total Environ. 2017, 592, 171–177. [Google Scholar] [CrossRef] [PubMed]
- Benedetti, Y.; Callaghan, C.T.; Ulbrichová, I.; Galanaki, A.; Kominos, T.; Abou Zeid, F.; … Morelli, F. EVI and NDVI as proxies for multifaceted avian diversity in urban areas. Ecol. Appl. 2023, 33, e2808. [Google Scholar] [CrossRef] [PubMed]
- Bolivian Spatial Agency. Available online: https://www.abe.bo/ (accessed on 25 July 2025).
- Dunning, J.B. CRC Handbook of Avian Body Masses, 2nd ed.; CRC Press, Taylor & Francis Group LLC: Florida, USA, 2008. [Google Scholar]
- Baptista, L.F.; Trail, P.W.; Horblit, H.M. Family Columbidae (pigeons and doves). In Handbook of the Birds of the World, 1st ed.; del Hoyo, J., Elliott, A., Sargatal, J., Eds.; Lynx Edicions: Barcelona, Spain, 2015; Volume 4, pp. 60–243. [Google Scholar]
- Gibbs, D.; Barnes, E.; Cox, J. Pigeons and doves: a guide to the pigeons and doves of the world, 1st ed.; Yale University Press: New Haven, Connecticut, USA, 2001. [Google Scholar]
- Brooks, D.M. Behavior and reproduction of the bare-faced ground dove (Metriopelia ceciliae) (aves, columbidae). Kempffiana 2010, 6, 48–53. [Google Scholar]
- Lakatos, T.; Chamberlain, D.E.; Garamszegi, L.Z.; Batary, P. No place for ground-dwellers in cities: A meta-analysis on bird functional traits. Glob. Ecol. Conserv. 2022, 38, e02217. [Google Scholar] [CrossRef]
- Yang, M.; Callaghan, C.T.; Wu, J. How do birds with different traits respond to urbanization? A phylogenetically controlled analysis based on citizen science data and a diverse urbanization measurement. Landsc. Urban Plan. 2023, 237, 104801. [Google Scholar] [CrossRef]
- Arévalo, C.; Amaya-Espinel, J.D.; Henríquez, C.; Ibarra, J.T.; Bonacic, C. Urban noise and surrounding city morphology influence green space occupancy by native birds in a Mediterranean-type South American metropolis. Sci. Rep. 2022, 12, 4471. [Google Scholar] [CrossRef] [PubMed]
- Alfaro, C.; Perez, D.F.; Sabat, P.; Sallaberry, M.; Canals, M.; Alfaro, C.; … Canals, M. Comparison of the oxygen diffusing capacity of the Picui Ground Dove (Columbina picui) with other doves of Chile. Int. j. Morphol. 2010, 28, 127–133. [Google Scholar] [CrossRef]
- Curzel, F.E.; Leveau, L.M. Bird taxonomic and functional diversity in three habitats in Buenos Aires City, Argentina. Birds 2021, 2, 217–229. [Google Scholar] [CrossRef]
- Symonds, M.R.E.; Weston, M.A.; van Dongen, W.F.D.; Lill, A.; Robinson, R.W.; Guay, P.J. Time Since Urbanization but not encephalisation is associated with increased tolerance of human proximity in birds. Front. Ecol. Evol. 2016, 4, 117. [Google Scholar] [CrossRef]
- Rodriguez-Prieto, I.; Fernández-Juricic, E.; Martín, J. To run or to fly: low cost versus low risk escape strategies in blackbirds. Behaviour 2008, 145, 1125–1138. [Google Scholar] [CrossRef]
- Barnett, S.C.; van Dongen, W.F.; Plotz, R.D.; Weston, M.A. Leash Status of Approaching Dogs Mediates Escape Modality but Not Flight-Initiation Distance in a Common Urban Bird. Birds 2023, 4, 277–283. [Google Scholar] [CrossRef]
- Díaz, M.; Møller, A.P.; Benedetti, Y.; Blumstein, D.T.; Markó, G.; Morelli, F.; … Grim, T. Developing an integrative understanding of escape mode decisions. Anim. Behav. 2025, 229, 123338. [Google Scholar] [CrossRef]
- Chace, J.F.; Walsh, J.J. Urban effects on native avifauna: a review. Landsc. Urban Plan. 2006, 74, 46–69. [Google Scholar] [CrossRef]
- Esperon-Rodriguez, M.; Svenning, J.C. Urban rewilding as a nature-based solution: a critical perspective. Crit. Insights Plant Sci. 2025, 1, 2629049. [Google Scholar] [CrossRef]
Figure 1.
Results of the escape behavior of the three pigeon species quantitatively analyzed in the city of La Paz. A. White bars represent the average values of the Alert Distance (AD) and striped bars the average values of the Flight Initiation Distance (FID) including homogenous subgroups in relation to the Bonferroni test (groups a-c for FID; groups d-e for AD). B. Percentage of cases of the selected escape site categorized as towards the ground (brown bars) and above the ground (green). C. Percentage of cases of the selected escape mode categorized into walking (yellow) and flying (blue). Drawings of the birds reproduced with the kind consent of Daniela Ticona.
Figure 1.
Results of the escape behavior of the three pigeon species quantitatively analyzed in the city of La Paz. A. White bars represent the average values of the Alert Distance (AD) and striped bars the average values of the Flight Initiation Distance (FID) including homogenous subgroups in relation to the Bonferroni test (groups a-c for FID; groups d-e for AD). B. Percentage of cases of the selected escape site categorized as towards the ground (brown bars) and above the ground (green). C. Percentage of cases of the selected escape mode categorized into walking (yellow) and flying (blue). Drawings of the birds reproduced with the kind consent of Daniela Ticona.
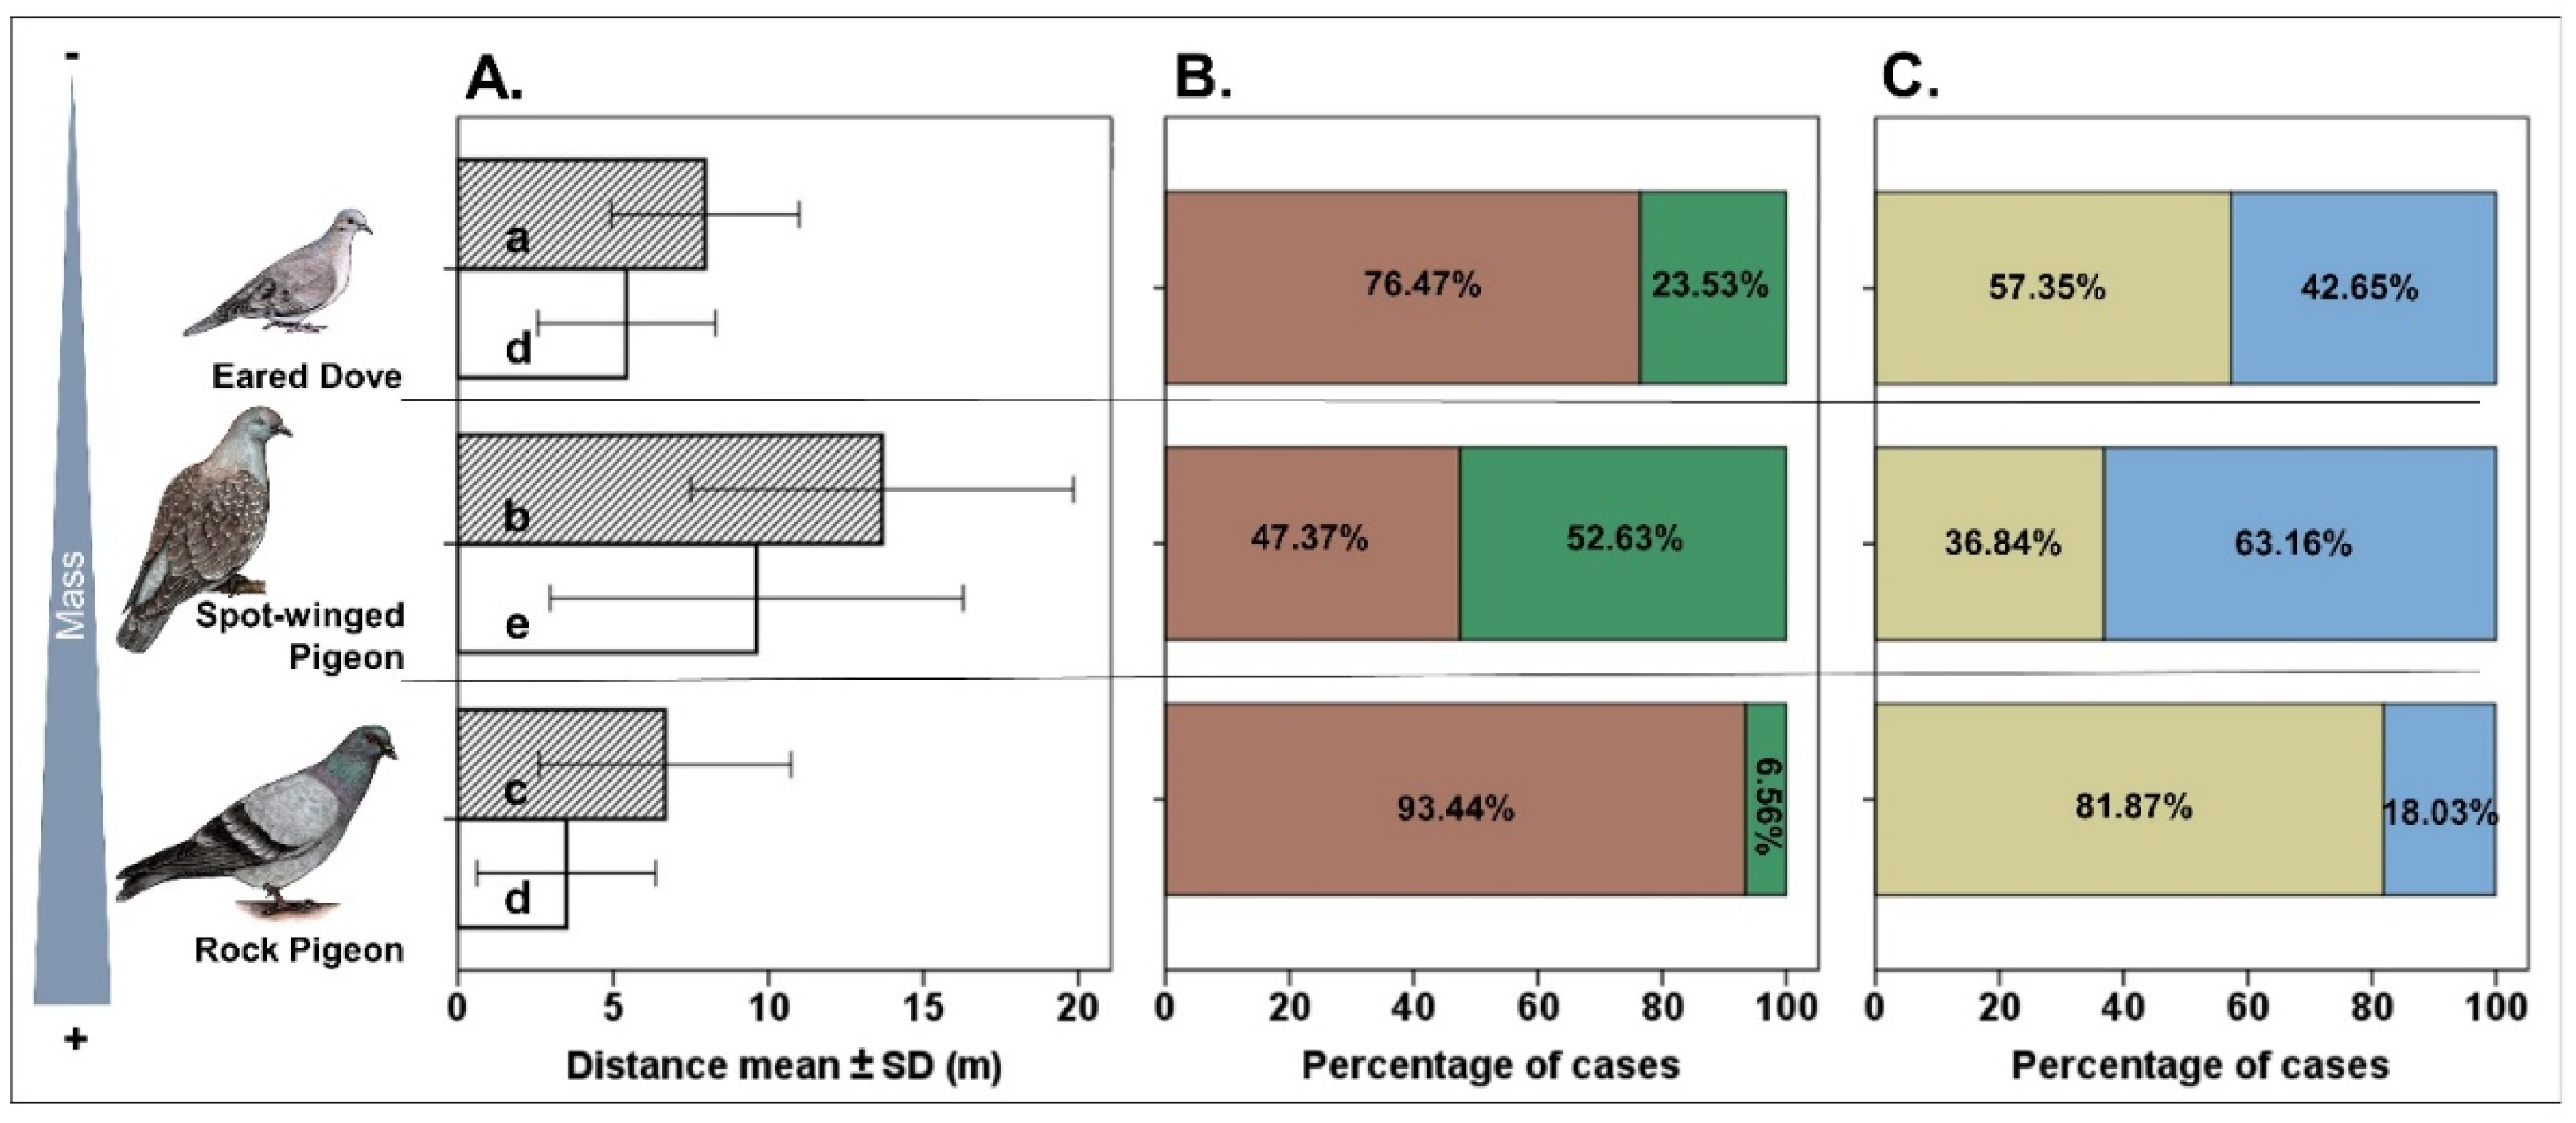
Figure 2.
Scatterplots between the variables maximum abundance of Rock Pigeon (MARP), maximum abundance of Spot-winged Pigeon (MASWP), and maximum abundance of Eared Dove (MAED) in the 15 urban green areas studied in the city of La Paz.
Figure 2.
Scatterplots between the variables maximum abundance of Rock Pigeon (MARP), maximum abundance of Spot-winged Pigeon (MASWP), and maximum abundance of Eared Dove (MAED) in the 15 urban green areas studied in the city of La Paz.
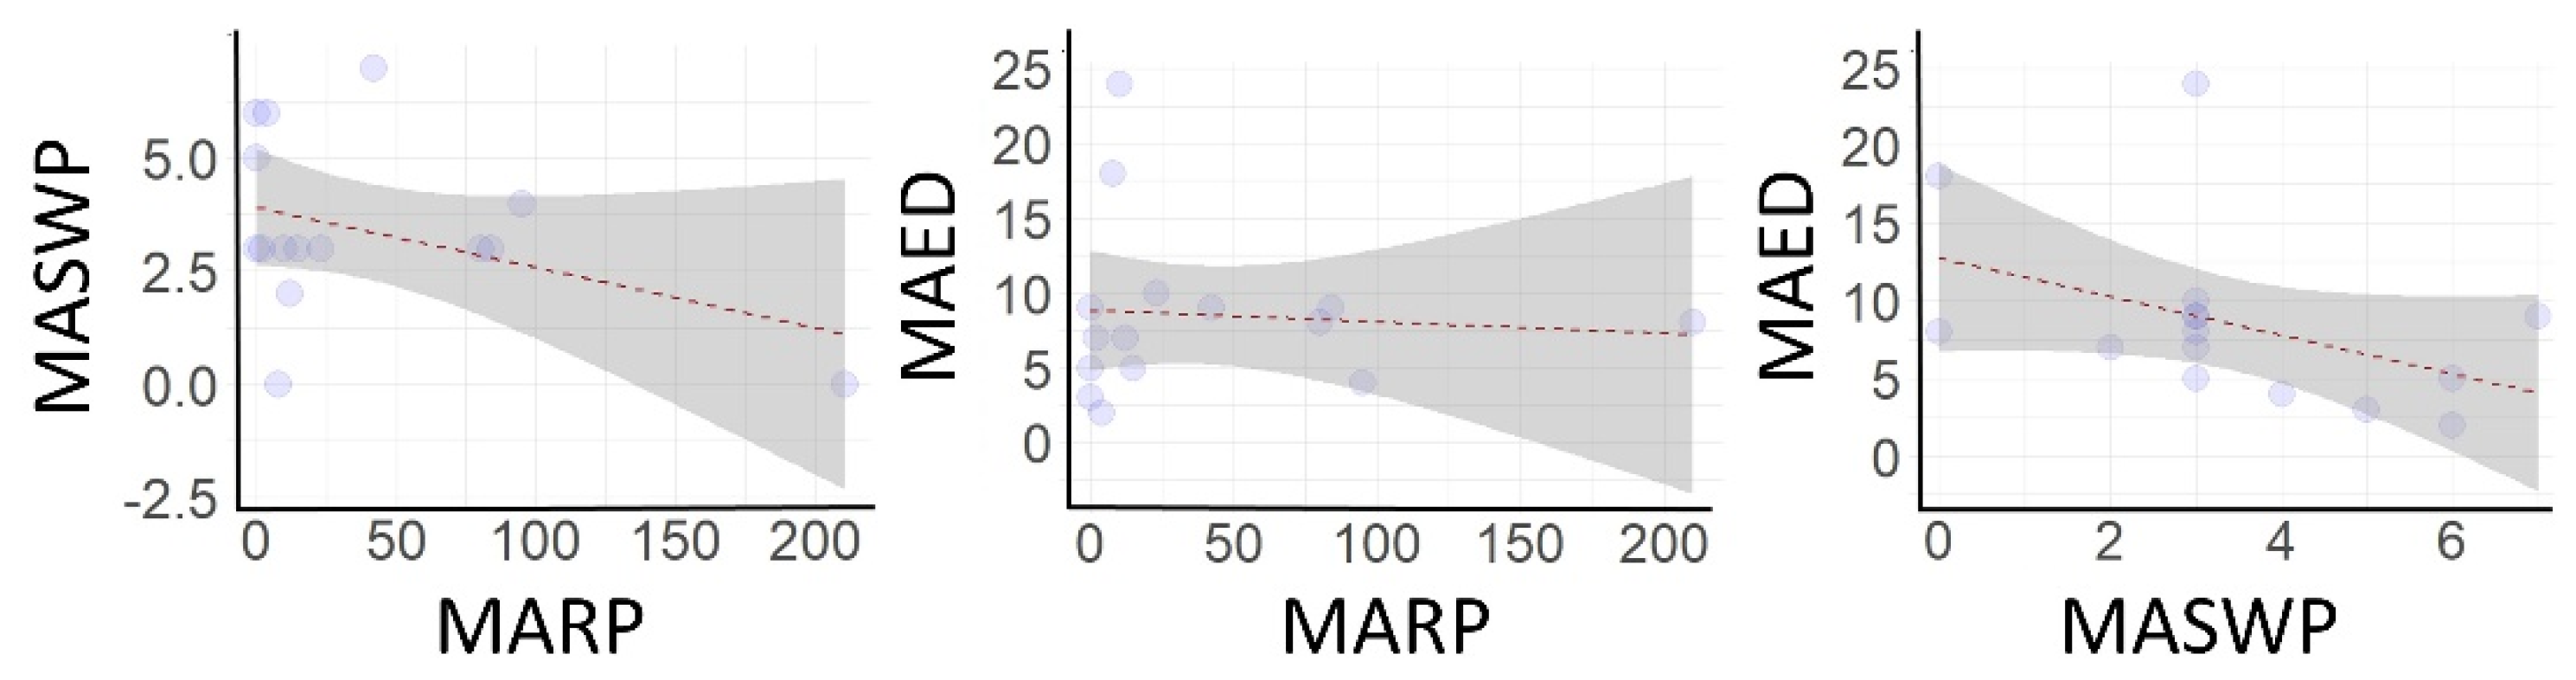

Table 1.
Descriptive values of mean ± SD and range (in parenthesis) for the boldness variables Alert distance (AD) and Flight Initiation distance (FID). N is the number of cases. The mean mass for each pigeon species was obtained from [76], in the case of Rock Pigeon the value corresponds to the mean between male’s and female’s data.
Table 1.
Descriptive values of mean ± SD and range (in parenthesis) for the boldness variables Alert distance (AD) and Flight Initiation distance (FID). N is the number of cases. The mean mass for each pigeon species was obtained from [76], in the case of Rock Pigeon the value corresponds to the mean between male’s and female’s data.
| Species | Mass (g) | AD | FID | N |
|---|---|---|---|---|
| Rock Pigeon | 354.5 | 6.68 ± 4.05; (0.78-22) | 3.50 ± 2.87; (0.34-15.4) | 122 |
| Spot-winged Pigeon | 347 | 13.68 ± 6.17; (4.3-30.4) | 9.63 ± 6.65; (1.23-30.4) | 57 |
| Eared Dove | 136 | 7.97 ± 3.03; (2.64-14.1) | 5.44 ± 2.86; (1.34-14.1) | 68 |
| Bare-faced ground dove | 55.1 | 8.74 ± 0.85; (7.8-9.44) | 6.71 ± 2.26; (4.48-9) | 3 |
Disclaimer/Publisher’s Note: The statements, opinions and data contained in all publications are solely those of the individual author(s) and contributor(s) and not of MDPI and/or the editor(s). MDPI and/or the editor(s) disclaim responsibility for any injury to people or property resulting from any ideas, methods, instructions or products referred to in the content. |
© 2026 by the authors. Licensee MDPI, Basel, Switzerland. This article is an open access article distributed under the terms and conditions of the Creative Commons Attribution (CC BY) license.
Copyright: This open access article is published under a Creative Commons CC BY 4.0 license, which permit the free download, distribution, and reuse, provided that the author and preprint are cited in any reuse.