
Submitted:
12 August 2026
Posted:
12 August 2026
You are already at the latest version
Abstract
Unmanned Aerial Vehicles (UAVs) are revolutionizing power grid inspection, yet ensuring reliable, high-quality image transmission in complex environments remains a significant challenge for autonomous operations. Traditional path planning algorithms often neglect communication constraints, risking mission failure in areas with poor connectivity—a critical concern for future UAV swarm deployments where inter-agent coordination depends on sustained link quality. This paper proposes a novel communication-aware path planning framework to address this gap. We formulate the problem as a multi-objective optimization that simultaneously considers safety, complete inspection coverage, path length, and communication quality. The core of our solution is an Improved Grey Wolf Optimizer (IGWO), which incorporates a nonlinear convergence factor, a genetic mutation strategy, and a modified leader update mechanism to enhance global search capability and avoid local optima. To evaluate the proposed framework, we adopt a dual-scenario validation strategy: in the mountainous setting, we employ a synthetic conical-peak terrain model with the standardized 3rd Generation Partnership Project (3GPP) Rural Macrocell (RMa) channel model; in the urban setting, we use real-world building footprints from OpenStreetMap (Hangzhou, China) with deterministic ray-tracing propagation modeling. Comprehensive simulations in both scenarios demonstrate that IGWO achieves a 50% success rate in dense urban areas, significantly outperforming Particle Swarm Optimization (PSO) at 10% and Genetic Algorithm (GA) at 28%. Crucially, communication-aware paths reduce average outage duration by over 65% while often yielding shorter paths. This work confirms that explicit communication modeling is indispensable for reliable UAV inspection and that the proposed IGWO offers a robust and scalable solution for future autonomous and cooperative power grid maintenance systems.
Keywords:
UAV
; path planning
; grey wolf optimizer
; power inspection
; communication constraints
; channel modeling
1. Introduction
Unmanned Aerial Vehicles (UAVs) have emerged as a transformative technology for power grid inspection, offering unparalleled advantages in efficiency, cost-effectiveness, and access to hazardous or remote areas. The cornerstone of autonomous UAV inspection lies in robust path planning, which traditionally prioritizes objectives such as obstacle avoidance, path shortness, and complete coverage of inspection points. However, the critical requirement for real-time, high-quality image transmission to ground stations for analysis is often compromised in complex environments like mountainous regions and dense urban canyons. Fading channels, signal blockages, and dynamic link quality can lead to communication outages during flight, directly jeopardizing the mission’s success. Consequently, there exists a significant gap in developing path planning algorithms that explicitly and effectively integrate communication constraints as a first-class objective, ensuring end-to-end mission reliability beyond mere physical trajectory optimization.
UAV path planning for power inspection has gained significant attention in recent years. Mendu and Mbuli [1] provided a comprehensive state-of-the-art review on the application of UAVs in power line inspections, systematically surveying the evolution from manual inspection methods to predictive maintenance and multi-UAV operations, while identifying key challenges including UAV-grid connectivity and large-scale automation. Similarly, Ahmed et al. [2] offered a complementary review of power transmission line inspection methods covering various inspection platforms, data acquisition techniques, and automated defect detection approaches.
Substantial research efforts have been dedicated to UAV path planning. Classical algorithms like A* and Rapidly-exploring Random Tree (RRT) focus on geometric feasibility and computational efficiency but often lack the sophistication for multi-objective optimization under complex constraints [3,4]. While heuristic algorithms such as Particle Swarm Optimization (PSO) and Genetic Algorithm (GA) possess strong global search capabilities, they are prone to premature convergence and parameter sensitivity, limiting their performance in high-dimensional search spaces [5,6]. Recent studies have begun to acknowledge the importance of communication. For instance, Tang et al. [7] applied an Artificial Potential Field (APF) method considering 5G communication quality, yet such approaches can easily fall into local optima. Similarly, while the standard Grey Wolf Optimizer (GWO) demonstrates promising global exploration ability [8], its linear convergence mechanism and lack of solution diversity preservation hinder its effectiveness in finding high-quality paths that simultaneously satisfy safety, coverage, energy, and stringent communication constraints.
Recent systematic reviews have identified a critical gap in UAV path planning research: communication constraints are frequently treated as an optional or secondary factor, despite their decisive impact on mission reliability in real-world deployments [9]. This observation underscores the urgent need for planning frameworks that explicitly couple trajectory optimization with communication quality modeling — a need that our proposed work directly addresses.
To bridge this gap, this paper proposes a novel communication-aware path planning framework for power inspection UAVs, centered around an Improved Grey Wolf Optimizer (IGWO). The primary objective is to develop a robust algorithm that generates flight paths which are not only collision-free and cover all inspection targets but also maintain superior communication link quality throughout the mission.
The main contributions of this work are fourfold. First, we formulate the path planning problem with an integrated cost function that jointly optimizes for safety, complete inspection coverage, path length, and communication quality, using realistic channel models for both mountainous (3GPP RMa) and urban (ray-tracing) environments. Second, we introduce four key improvements to the standard GWO: a non-linear decreasing convergence factor for better balance between global and local search; an integrated genetic mutation strategy to enhance population diversity and escape local optima; a modified leader update mechanism that preserves historical best solutions to prevent performance regression; and auxiliary cost terms to guide the search towards smoother and more feasible paths. Third, we rigorously evaluate our proposed IGWO against state-of-the-art algorithms (PSO and GA) and baseline GWO in two realistic scenarios—a complex mountainous region and a dense urban area—demonstrating its superior performance in success rate, solution quality, and robustness. Finally, our results provide concrete evidence that explicitly modeling communication constraints is indispensable for mission success and that the proposed IGWO offers an effective and practical solution for autonomous power inspection systems.
Although this paper focuses on single-UAV planning, the proposed IGWO framework is inherently scalable to multi-UAV cooperative missions, making it directly relevant to the intelligent cooperation of UAV swarm systems.
The remainder of this paper is organized as follows. Section 2 provides a thematic review of related work in UAV path planning and communication-aware navigation. Section 3 details the system model, including the environment modeling (terrain and channel) and the formulation of the comprehensive cost function. Section 4 elaborates on the proposed Improved Grey Wolf Optimizer. Section 5 presents and discusses the simulation results and comparative analysis. Finally, Section 6 concludes the paper and suggests directions for future research.
2. Related Work
The problem of UAV path planning has been extensively studied, yet the integration of reliable communication as a core constraint remains a challenging frontier. Previous research can be thematically categorized into three areas: classical planning algorithms, modern meta-heuristics, and the nascent field of communication-aware planning.
2.1. Classical Path Planning Algorithms and Their Limitations
Classical algorithms form the foundation of robotic path planning. Deterministic methods like Dijkstra’s algorithm [10] and A* [3] guarantee finding an optimal path if one exists but suffer from high computational complexity in large, continuous 3D spaces. While improvements exist, such as heuristic enhancements to A* [11], they primarily address geometric efficiency and remain less suited for complex multi-objective optimization. Sampling-based methods like the RRT [4] and its variants [12,13] are effective in high-dimensional spaces but often produce non-optimal, jerky paths that require post-processing smoothing.
APF methods [14] are known for their real-time performance but are notoriously prone to getting trapped in local minima [15]. Recent work has sought to address these limitations through hybrid approaches. Choi [16] proposed an A-star-guided potential field (AGPF) method that integrates the optimal pathfinding capability of A-star with the real-time responsiveness of APF, achieving smoother and more optimal paths while effectively handling moving and previously unknown obstacles. This demonstrates that hybrid strategies combining classical algorithms with reactive methods represent a promising direction for robust path planning.
Despite their widespread use, classical algorithms have also been extended to specific UAV applications. For instance, Prasad and Ramkumar [17] applied Dijkstra’s algorithm to trajectory planning for relay UAVs in emergency communication scenarios, where the edge weights were designed as a weighted sum of communication power and movement cost. However, such graph-based approaches still require discretization of the continuous state space and cannot easily accommodate the dynamic, multi-modal nature of communication-aware path planning problems. These limitations have motivated the development of hybrid strategies that combine classical planning with reactive methods.
To address the limitations of individual classical algorithms, hybrid approaches that combine global and local planning have recently gained attention. Huang et al. [18] proposed a dynamic path-planning method that integrates an improved RRT Star (RRT*) algorithm with the Dynamic Window Approach (DWA) for UAV-based power inspection. Their method incorporates a target-biased search strategy and a gravitational field function to enhance global path efficiency, while introducing a target-point evaluation function into the DWA algorithm to improve local obstacle avoidance in dense environments. Simulation results demonstrated that their hybrid approach achieved 8%–12% optimization in path length and over 95% reduction in planning time compared to traditional RRT*.
2.2. Meta-Heuristic Algorithms for Complex Optimization
To overcome the limitations of classical methods in complex environments, meta-heuristic algorithms have been widely adopted. Population-based algorithms like PSO [5] and GA [6] simulate social or biological processes to explore the solution space. PSO is praised for its rapid convergence but is highly sensitive to parameters and often converges prematurely to local optima [19]. GA, with its crossover and mutation operators, maintains population diversity but can have slow convergence speeds and may struggle with fine-tuning solutions in the late stages of optimization [20]. Other algorithms like Ant Colony Optimization (ACO) [21] perform well on discrete path problems but can be slow to converge. The Grey Wolf Optimizer (GWO), proposed by Mirjalili et al. [8], has gained attention for its simple structure, few parameters, and strong global search capability. However, its linear convergence factor and over-reliance on the alpha, beta, and delta wolves can lead to an imbalance between exploration and exploitation, causing stagnation in local optima for highly constrained problems [22,23,24]. While these meta-heuristics are powerful tools for general path planning, their application in scenarios demanding the simultaneous optimization of multiple, competing objectives—especially when one is a complex, spatially varying function like communication throughput—reveals their limitations in maintaining solution diversity and achieving robust convergence.
As comprehensively surveyed by Mendu and Mbuli [1], recent advances in power line inspection include predictive maintenance strategies, multi-UAV coordinated operations, and real-time data analysis frameworks.
2.3. The Emergence of Communication-Aware Path Planning
Recognizing the criticality of communication, a growing body of research has begun to incorporate link quality into planning. Some studies, such as those by Sonny et al. [5], have explored PSO-based approaches for UAV path planning, with communication relay positioning as one potential application scenario. Tang et al. [7] made a significant step by integrating 5G signal quality into a 3D APF, using attractive fields towards high-quality zones. However, this approach inherits APF’s vulnerability to local minima, requiring additional mechanisms like fuzzy control for escape. Similarly, Zhang et al. [22] proposed an adaptive GWO for UAV path planning with improved convergence, while Dewangan et al. [23] and Qu et al. [24] respectively demonstrated the effectiveness of GWO for 3D multi-UAV path planning and introduced a hybrid GWO framework. This reveals a critical gap: existing communication-aware studies often treat communication as a secondary or isolated factor, and the algorithms employed are not specifically designed to handle the added complexity and multi-modal nature of the joint optimization problem. There is a lack of a dedicated algorithmic framework that tightly couples a high-fidelity communication model with a robust meta-heuristic capable of navigating the resulting complex fitness landscape.
Recent studies in Drones have further emphasized the importance of communication-aware planning. Huang et al. [18] demonstrated the effectiveness of deep reinforcement learning for UAV path planning in urban environments with communication constraints. Similarly, Abbas et al. [25] and Banafaa et al. [26] explored the integration of 5G communication capabilities into UAV navigation systems for smart city applications. Mardani et al. [27] and Duo et al. [28] specifically addressed communication-aware UAV path planning, showing significant improvements in mission reliability. Chen et al. [29] explored the integration of communication awareness and obstacle avoidance for UAV path planning in urban environments, while Liu et al. [30] proposed adaptive path planning for UAV-assisted power infrastructure monitoring with QoS guarantees, providing valuable insights for maintaining communication links during inspection missions.
Beyond path planning, the practical deployment of UAV inspection systems also demands efficient onboard data processing to reduce communication burden. Yan et al. [31] proposed a lightweight real-time strand breakage detection method that performs on-site defect identification using computationally efficient segmentation and classification networks, reducing the volume of data that must be transmitted back to ground stations—a critical consideration for communication-constrained inspection missions.
2.4. Theoretical Framework and Our Position
The literature landscape illustrates the evolution of path planning focus from pure geometry to incorporating communication, and the corresponding need for more sophisticated optimization algorithms. Ghambari et al. [32] provided a comprehensive taxonomy of UAV path planning techniques, categorizing existing methods into classical approaches, soft-computing techniques, and hybrid methods, while also offering detailed analysis of environment modeling, path structures, and optimality criteria. Our work is positioned at the intersection of high-fidelity communication modeling and enhanced meta-heuristic optimization.
A recent comprehensive review of UAV swarm trajectory planning paradigms [33] categorizes existing methods into traditional deterministic algorithms, bio-inspired metaheuristics, and modern AI-based approaches, while highlighting the critical trade-offs between computational efficiency, scalability, and inter-UAV coordination in multi-agent environments. This taxonomy provides a useful framework for positioning our IGWO — a bio-inspired metaheuristic with enhanced diversity preservation — within the broader landscape of swarm planning methods.
3. Methodology
This section details the proposed communication-aware path planning framework. We begin by describing the system model, including the flight environment and communication channel. Then, we formally define the path planning problem as a multi-objective optimization task. Finally, we elaborate on the core of our solution: the IGWO.
3.1. System Model
3.1.1. Flight Environment Modeling
Accurate environmental representation is fundamental to effective path planning, particularly in terrains with complex morphological characteristics. This study considers two representative inspection scenarios: mountainous regions with heterogeneous elevation profiles and dense urban canyons with high-rise obstructions. To capture the salient geometric features of each environment, we adopt distinct mathematical formulations for obstacle representation.
Mountainous Terrain: The mountainous landscape is synthesized using a superposition of conical primitives, each parameterized by its base center, height, and radius. Specifically, the elevation contributed by the i-th peak at a horizontal coordinate is given by:
where denotes the peak height, is the base radius, and represents the planar distance from to the peak center :
The composite terrain model is constructed by linearly superimposing the elevation fields of all N peaks:
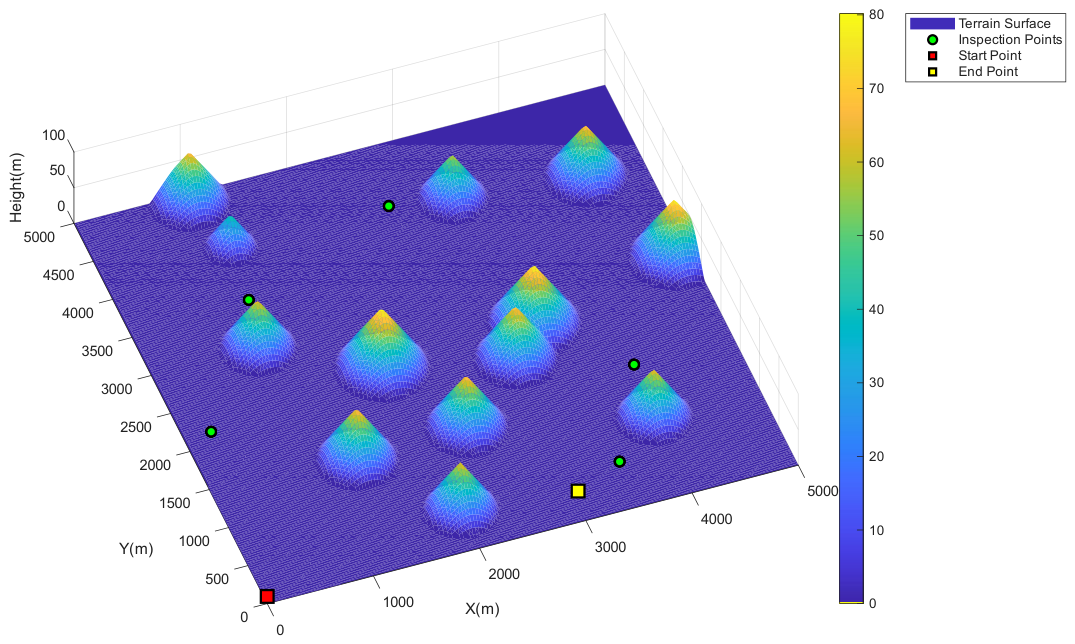
This formulation yields a continuous, differentiable surface that realistically emulates the undulating topography characteristic of power line corridors traversing mountainous regions. The resulting terrain, illustrated in Figure 8, comprises 13 conical peaks strategically arranged along a southwest-to-northeast ridge line. To ensure both operational safety and communication link reliability, the UAV flight altitude is constrained to the interval m above ground level throughout the inspection mission. This synthetic terrain, while not representing any specific geographic location, is designed to capture the essential topographic characteristics of power line corridors crossing hilly regions—namely, irregular elevation profiles, ridge lines, and shadow zones behind peaks. Its parametric nature allows controlled evaluation of communication-aware planning under systematically varying obstacle geometries.
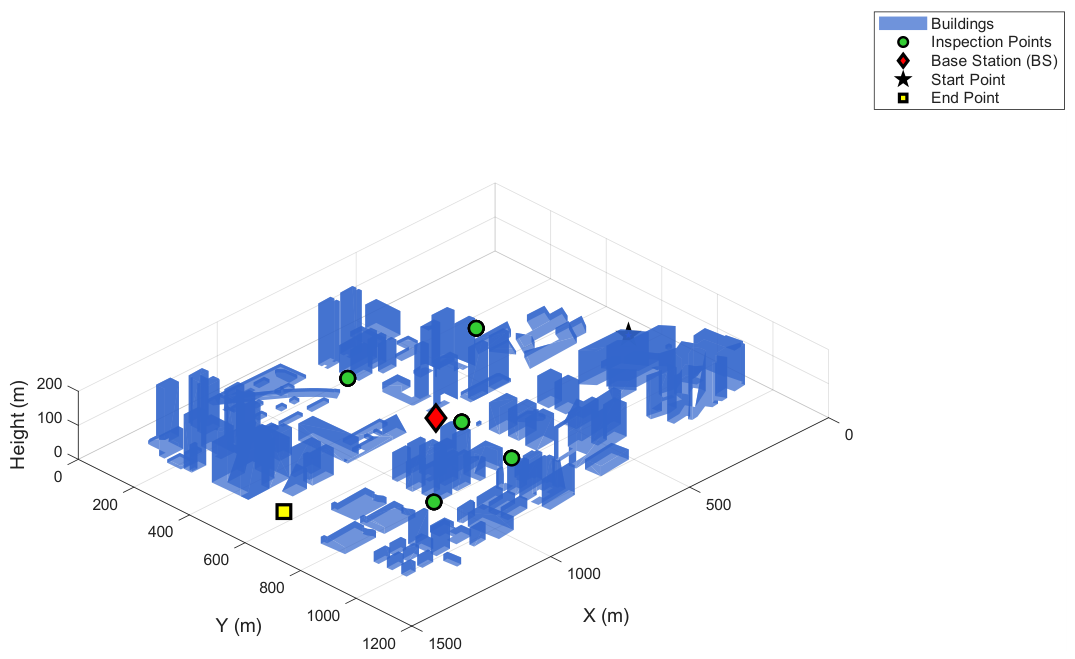
Urban Terrain: For the urban inspection scenario, we construct a three-dimensional city model using building footprint data extracted from OpenStreetMap (Hangzhou, China), as depicted in Figure 9. Each building is represented as a prismatic extrusion of its polygonal footprint. For a building with a vertex set , where , the extrusion height is determined as:
The lateral surfaces of each building are constructed by extruding each edge of the footprint vertically. For adjacent vertices , the corresponding side face is given by:
with the convention that . The complete urban model is then expressed as the union of all building surfaces:
where denotes the total number of buildings in the extracted scene. This modeling approach produces a geometrically rich environment characterized by numerous vertical obstructions and narrow street canyons, which are critical for evaluating both collision avoidance performance and air-to-ground propagation characteristics in dense urban settings. Unlike the synthetic mountainous terrain, this urban model is reconstructed from real-world building footprint data extracted from OpenStreetMap (Hangzhou, China). The use of actual building geometries ensures that the propagation environment reflects genuine street layouts, building densities, and height variations, providing a realistic testbed for ray-tracing-based communication evaluation.
3.1.2. Air-to-Ground Channel Modeling
Accurate modeling of the air-to-ground (A2G) communication channel is essential for communication-aware path planning. This study employs two complementary channel models: the 3GPP Rural Macrocell (RMa) model for the mountainous scenario, and a deterministic ray-tracing model for the urban canyon scenario. Both models are configured at a carrier frequency of GHz.
Mountainous Scenario (3GPP RMa-AV Model): For the mountainous environment, we adopt the 3GPP TR 36.777 RMa-AV (Rural Macrocell - Aerial Vehicle) channel model [34], which is specifically designed for UAV communication in rural and mountainous areas. The model accounts for the elevated antenna height of the UAV and provides separate path loss formulations for Line-of-Sight (LoS) and Non-Line-of-Sight (NLoS) conditions.
Figure 1 illustrates the geometric relationships among the key parameters of the RMa-AV model, including the elevation angle , the 2D horizontal distance , and the 3D line-of-sight distance . The LoS path loss is given by:
where is the UAV altitude in meters, and is the carrier frequency in GHz.
The NLoS path loss is defined as the maximum of the LoS path loss and a second term that accounts for additional propagation loss due to terrain blockage:
The LoS probability in the RMa-AV model is determined by the UAV altitude and the surrounding terrain morphology. For a given UAV altitude , the LoS probability is computed based on the 3GPP specifications, and the overall path loss is obtained by averaging over the LoS and NLoS cases:
The shadow fading is modeled as a zero-mean Gaussian random variable with standard deviation ( dB for LoS, dB for NLoS), and is added to the final path loss:
Finally, the received signal-to-noise ratio (SNR) is computed from the path loss:
where is the transmit power, and are the antenna gains, is the noise power spectral density, and B is the system bandwidth. The achievable throughput is then mapped from the SNR using Shannon’s capacity formula:
Urban Scenario (Ray-Tracing Model): For the dense urban environment, where reflections and blockages dominate, we employ a deterministic ray-tracing approach. Recent studies have demonstrated the practical value of this approach for UAV communication evaluation in urban environments [35]. Ray tracing can effectively capture site-specific propagation effects—such as diffraction at building edges and multi-path reflections from building facades—that statistical models like the 3GPP Urban Microcell (UMi) and Urban Macrocell (UMa) formulas fail to resolve due to their reliance on environment-averaged parameters.
The signal from the base station reaches the UAV through multiple paths: the direct LoS path, reflections from building facades, diffraction at building edges, and multi-path propagation. The received power is calculated by summing the contributions of all significant paths.
Ray tracing is a deterministic propagation modeling technique based on geometric optics (GO) and the uniform theory of diffraction (UTD) [36]. By tracing rays emitted from the transmitter as they interact with environmental objects—undergoing reflection, diffraction, and scattering—the propagation paths from the transmitter to the receiver can be identified.
Figure 2 shows the typical propagation environment in an urban canyon with multiple ray-tracing paths. The total received field at the receiver is obtained by coherently summing the contributions of all identified rays:
where is the number of traced rays, and represents the complex electric field of the k-th ray, accounting for path length, reflection/diffraction coefficients, and antenna radiation patterns.
For a given ray k with propagation length , the received power contribution is given by the Friis transmission equation with a ray-specific loss term:
where is the wavelength, is the reflection coefficient at the m-th reflection (typically modeled using Fresnel equations), and is the diffraction coefficient at the n-th edge. The total received power is then obtained by coherent superposition of all multi-path components:
The path loss is subsequently derived as:
3.2. Problem Formulation: Multi-Objective Cost Function
The path planning problem is formulated as minimizing a comprehensive cost function J. This function aggregates several critical objectives into a single, quantifiable metric.
The five terms in Equation (17) are designed to encode distinct mission-critical behaviors:
- :
- Safety behavior. Penalizes trajectories that intersect with terrain or buildings, emulating the swarm’s hard constraint for collision-free navigation.
- :
- Coverage behavior. Ensures all inspection points are visited, encoding the mission’s primary task completion objective.
- :
- Energy-aware behavior. Promotes path economy, which is particularly important for UAV swarms with limited onboard battery capacity.
- :
- Communication-preserving behavior. Discourages flight through regions with poor signal coverage, directly addressing the swarm’s need for sustained ground connectivity.
- :
- Path-quality behavior. Penalizes undesirable geometric features (e.g., sharp turns, irregular segment lengths, path self-intersections), ensuring that the generated trajectories are practically executable.
This decomposition provides a clear mapping between the mathematical cost and the physical decisions that a UAV (or a UAV swarm) must make during autonomous inspection missions.
The constituent cost terms are defined as follows:
- Collision Cost (): Penalizes paths that intersect with obstacles. A collision detection algorithm checks each path segment and node against all terrain objects (mountains or buildings). A high constant penalty is applied per collision event, with node collisions penalized more heavily.
- Inspection Target Cost (): Ensures all m designated inspection points are covered. A point is considered covered if a path node or segment passes within a threshold distance L. The cost is multiplied by the number of missed targets .
- Path Length Cost (): Promotes shorter paths for energy efficiency. It is the sum of the Euclidean distances of all segments in the path.
-
Communication Quality Cost (): This is a core contribution. The path is sampled at regular intervals (e.g., every 15 meters). At each sample point, the throughput T is calculated based on the channel model described in Section 3.1.2. The communication cost is computed as:In this formulation, N is the number of sample points, serves as a spatial weighting factor, ensuring that longer segments with poor throughput incur a proportionally higher penalty. This design prevents the optimizer from circumventing the communication constraint by simply inserting un-sampled long gaps between waypoints. Physically, guides the UAV to prioritize LoS regions and avoid deep shadow zones behind obstacles, which is a critical decision-making heuristic for both single-UAV and swarm operations in urban canyons.A cumulative penalty mechanism further discourages prolonged periods of poor connectivity. Figure 3 illustrates this mechanism. As shown in Figure 3(a), the throughput is sampled at regular intervals along the path. Blue circles indicate throughput above the threshold Mbps, while red circles indicate throughput below the threshold, triggering a communication penalty. The gray-shaded region highlights a continuous low-throughput area from 600 to 900 m, where the UAV would experience sustained communication degradation.In contrast, Figure 3(b) compares the two penalty mechanisms. The blue curve shows the instant penalty ((Eq. (18))), which increases linearly as the path traverses low-throughput regions but does not differentiate between isolated and continuous outages. The red curve shows the cumulative penalty (Eq. (19)), which grows progressively during continuous poor connectivity, with the penalty factor accelerating as the UAV remains in communication-degraded areas. This mechanism ensures that the optimizer avoids paths with extended periods of poor communication quality, which is critical for reliable image transmission during inspection missions.The cumulative penalty is implemented as:where is the penalty growth factor, and is an indicator function that evaluates to 1 if the i-th sampled point lies in a continuously poor connectivity region, and 0 otherwise.
-
Auxiliary Cost (): The Auxiliary cost Function (AF) is introduced to enhance the convergence behavior and solution quality of the optimization algorithm, particularly in complex environments where the original cost terms alone are insufficient to guide the search effectively. This auxiliary term penalizes structural deficiencies in the generated paths, thereby promoting smoother, more uniform, and more practical trajectories. It is defined as the sum of three sub-costs:where penalizes overly clustered path nodes, penalizes abnormally long or short path segments, and penalizes self-intersections of the path in the 2D projection.(1) Node clustering cost : This term counts the number of node pairs whose mutual distance falls below a minimum threshold . It encourages the path nodes to be distributed evenly throughout the solution space, preventing excessive aggregation that may reduce the effective coverage of the search. The cost is given bywhere n is the number of path nodes, and are the coordinates of the i-th and j-th nodes, respectively, and is an indicator function.(2) Segment length abnormality cost : This term penalizes path segments whose lengths deviate from a desirable interval . Segments shorter than incur a fixed penalty, while segments longer than incur a penalty that increases linearly with the excess length. This design discourages both excessive fragmentation and overly long jumps between waypoints, leading to more physically feasible paths. The cost is computed as(3) Path crossing cost : This term penalizes intersections between non-adjacent path segments in the 2D horizontal projection. By discouraging self-crossing trajectories, it helps eliminate redundant loops and unnecessary detours, resulting in more efficient and cleaner path geometries. The cost is given bywhere are the horizontal coordinates of the i-th node, and .The coefficients , , and are positive constants that balance the relative contributions of these auxiliary terms. In our implementation, these coefficients are empirically tuned according to the specific scenario (mountainous or urban) to ensure that the auxiliary cost effectively guides the optimization without dominating the primary mission objectives. Simulation results demonstrate that the inclusion of significantly improves the success rate of path planning, particularly in dense urban environments, by steering the search away from structurally inferior solutions and facilitating convergence to high-quality feasible paths.
3.3. The Improved Grey Wolf Optimizer (IGWO)
The standard GWO [8] mimics the social hierarchy and hunting behavior of grey wolves. While effective for many optimization problems, it has three critical limitations for our complex path planning task: (1) the linear convergence factor often leads to an imbalance between exploration and exploitation, causing premature convergence to suboptimal solutions; (2) the lack of diversity preservation mechanisms causes the population to converge prematurely, especially in multi-modal fitness landscapes with numerous local optima; and (3) the leader update strategy, which selects new leaders each iteration, may discard historically good solutions, leading to performance regression. To address these limitations, we propose three key enhancements to the standard GWO, collectively termed the IGWO.
Recognizing GWO’s potential for multi-agent optimization, several recent studies have explored its extensions to multi-UAV and multi-robot scenarios. Zhang and Wang [37] proposed a chaotic grey wolf optimizer (CGWO) that enhances population diversity through chaotic initialization and local search, demonstrating improved convergence in multi-UAV cooperative path planning tasks. Similarly, an Improved Hybrid Strategy Gray Wolf Optimizer (IHS-GWO) was developed for multi-UAV logistics trajectory optimization, incorporating adaptive convergence factors and weighted guidance to achieve better performance than PSO and GA in path length and collision avoidance [38]. These studies confirm that GWO variants offer a promising foundation for multi-agent planning problems, motivating our development of IGWO for communication-aware inspection missions.
The social hierarchy of grey wolves is illustrated in Figure 4, where the population is divided into four levels: (the best solution, leader), (the second-best, advisor), (the third-best, subordinate), and (the remaining solutions, followers). The hunting process is guided by the , , and wolves, while the wolves follow them to explore the search space.
3.3.1. Non-Linear Convergence Factor
In the standard GWO, the convergence factor a decreases linearly from 2 to 0 over the course of iterations:
where t is the current iteration and is the maximum number of iterations. This linear decay strategy often leads to premature convergence, as the algorithm transitions too quickly from exploration to exploitation.
To address this limitation, we propose a non-linear decay strategy:
As shown in Figure 5, this non-linear strategy allows a more rapid decrease in the early iterations (emphasizing global exploration) and a slower decrease later (enabling finer local exploitation near the suspected optimum). The exploration-exploitation balance is controlled by the coefficient vectors and , which are computed as:
where and are random vectors in . When , the algorithm emphasizes exploration; when , it emphasizes exploitation. The non-linear decay of a ensures that for a longer portion of the early iterations, enhancing global search capability.
3.3.2. Genetic Mutation Strategy
To prevent premature convergence and maintain population diversity, we integrate a mutation operator from Genetic Algorithms into the GWO framework. After the standard GWO position update, each wolf (solution) has a probability of having one of its path nodes randomly reinitialized within the solution space.
Let denote the i-th wolf, where each represents a 3D path node . The mutation operation is defined as:
where generates a random point within the feasible solution space bounds. The mutation is applied as:
Figure 6 illustrates this operation, where a randomly selected node (highlighted in red) is reinitialized to a new position while the other nodes remain unchanged. This operation introduces random perturbations that can help the pack escape local optima and maintain population diversity throughout the optimization process.
3.3.3. Modified Leader Update Mechanism
In the standard GWO, the three best wolves (, , ) are selected anew in every iteration, which can cause the loss of good solutions found in previous iterations. We modify this to a greedy selection mechanism.
Let denote the fitness (cost) of a solution X. The positions of , , and are updated only if a wolf in the current iteration finds a solution better than the current , , or :
Similarly, for and :
This greedy selection ensures that the guiding solutions are monotonically non-degrading, preserving historical best knowledge and enhancing the algorithm’s robustness and convergence stability.
3.3.4. Position Update
With the enhanced components above, the position of each wolf is updated using the standard GWO equations, guided by , , and :
3.3.5. Algorithm Workflow and Pseudo-Code
The complete workflow of the proposed IGWO is summarized in Algorithm 1 and Figure 7.
| Algorithm 1 Improved Grey Wolf Optimizer (IGWO) for Path Planning |
|
3.3.6. Computational Complexity Analysis
The computational complexity of the proposed IGWO is dominated by three components: population initialization, fitness evaluation, and position update. For a population of n wolves, a path dimension of d (number of waypoints), and a maximum iteration count of , the overall complexity is
This linear scaling with respect to n and d is inherited from the standard GWO framework [8]. The additional genetic mutation operation incurs only a constant-time overhead per iteration, as the mutation probability is fixed and applied element-wise. Consequently, the overall complexity remains , which is identical to that of PSO and GA under the same parameter settings. More importantly, for a swarm of M UAVs, the extended state vector increases the dimension from d to , yielding a complexity of — a linear growth that is practically manageable for moderate swarm sizes (e.g., ). This favorable scalability ensures that the IGWO is suitable for real-time or near-real-time planning in both single-UAV and multi-UAV cooperative scenarios.
The convergence behavior of IGWO is empirically validated in Section 4.3.1. The greedy leader update mechanism ensures monotonic non-degradation of the best solution, while the nonlinear convergence factor and genetic mutation strategy collectively prevent premature convergence. This combination results in stable convergence across all test scenarios.
3.3.7. Discussion on Extension to Multi-UAV Swarms
Although the current formulation and experimental validation focus on a single-UAV scenario, the proposed IGWO framework is algorithmically extensible to multi-UAV cooperative missions. We provide the analytical extension below to lay the groundwork for future swarm implementations, while noting that comprehensive multi-UAV validation remains an important direction for subsequent work.
For a swarm of M UAVs, the joint state vector for the i-th wolf can be naturally extended as
where denotes the path node sequence of the k-th UAV. To ensure safe and coordinated operation in a shared airspace, an additional mutual collision avoidance term is incorporated into the auxiliary cost :
where and represent the instantaneous positions of UAV k and l, respectively, and is the required safety separation distance. In this extended formulation, all UAVs share the same communication-aware cost , while the leader update and mutation operators operate on the joint state space. This extension preserves the computational efficiency of the single-UAV case, as the population size and iteration count remain unchanged, and the dimension of each search agent increases linearly with M [18,27].
3.4. Success Criteria and Evaluation Metrics
To enable rigorous performance evaluation and meaningful cross-algorithm comparison, we define a set of explicit success criteria that a candidate path must simultaneously satisfy to be considered a successful planning outcome. These criteria directly correspond to the five cost terms in Eq. (17) and reflect the operational requirements of autonomous power inspection missions.
A path is deemed successful if and only if all of the following conditions hold:
- Collision-Free Navigation: The path must not intersect with any terrain or building obstacle. Formally,where is an indicator function that returns 1 if node lies inside an obstacle and 0 otherwise. The path segments are verified using continuous collision detection between consecutive nodes.
-
Complete Inspection Coverage: All m designated inspection points must be visited. An inspection point is considered covered if the minimum Euclidean distance from to any point along the path is within a threshold distance :In our implementation, for the mountainous scenario and for the urban scenario, reflecting the different spatial scales of the two environments.
- Communication Reliability: The communication throughput along the entire path must remain above the minimum required threshold for at least of the path length. Specifically,where is the throughput at arc length s along the path, is the total path length, and is the indicator function. In this work, we set to require that the vast majority of the mission maintains reliable communication, while tolerating only negligible transient outages. For the cumulative penalty mechanism in Eq. (20), we additionally require that no continuous outage segment exceeds seconds. Based on typical UAV inspection mission profiles, we set .
-
Path Feasibility: The path must satisfy basic geometric constraints to be practically executable. These include:
- All nodes must lie within the operational boundary: , ;
- Flight altitude must remain within the prescribed range: , ;
- The maximum turn angle between consecutive segments must not exceed a feasible limit for fixed-wing UAVs (or appropriate value for multirotor platforms).
For statistical evaluation across multiple independent runs, we report the success rate as:
where is the number of runs that satisfy all four criteria above, and is the total number of runs (set to 50 in our experiments). Additionally, we report the following secondary metrics to provide deeper insight into algorithm performance:
- Average number of missed targets: ;
- Average number of collisions: ;
- Average communication outage duration: ;
- Average total cost: .
These metrics collectively capture the multi-objective nature of the planning problem and enable fair comparison across different algorithms.
4. Experiments and Results
4.1. Environmental Settings
4.1.1. Mountainous Scenario
The mountainous scenario is constructed over a m area with 13 conical peaks, each defined by its base center, height, and radius. The UAV flight altitude is constrained between 10 m and 40 m. A single base station is placed outside the operational area at to create significant communication variation across the inspection region. The terrain parameters are summarized in Table 1, and the resulting 3D terrain model is visualized in Figure 8.
Five inspection points are distributed across the operational area to simulate power transmission towers, as listed in Table 2. The start point is located at and the end point at .
Figure 8.
Three-dimensional terrain model for the mountainous inspection scenario.
4.1.2. Urban Scenario
The urban scenario is reconstructed from OpenStreetMap data (Hangzhou, China), covering a m area. The UAV flight altitude is constrained between 10 m and 40 m. A base station is placed at the center of the operational area at to simulate a typical urban cell. The building layout and inspection points are illustrated in Figure 9.
Figure 9.
Three-dimensional urban environment reconstructed from OpenStreetMap (Hangzhou, China).
4.2. Communication Throughput Heatmaps
Before presenting the simulation results, it is worth clarifying the complementary roles of our two evaluation pipelines. The mountainous scenario—with its synthetic terrain and 3GPP RMa channel model—serves as a controlled, reproducible benchmark where terrain-induced shadowing can be systematically analyzed. The urban scenario, in contrast, leverages real-world building data and deterministic ray-tracing to capture the complex multipath propagation and site-specific blockage effects that are characteristic of dense city environments. This dual approach combines the rigor of controlled experimentation with the authenticity of real-world data, providing a comprehensive assessment of the proposed IGWO framework under diverse propagation conditions.
4.2.1. Mountainous Scenario
To quantify the communication quality variation across the operational area, we compute the throughput heatmaps at four different altitudes (10 m, 20 m, 30 m, and 40 m) using the 3GPP RMa channel model. Figure 10 presents the spatial distribution of throughput at these altitudes.
As expected, the throughput improves significantly with increasing altitude. At 10 m (Figure 10a), large areas behind the mountains experience throughput below 4 Mbps (blue regions), which would cause communication outages for UAVs flying at low altitudes. At 20 m (Figure 10b), the shadowed regions shrink but still cover a substantial portion of the operational area. At 30 m and 40 m (Figure 10c and Figure 10d), the throughput becomes more uniform, with most regions achieving throughput above 6 Mbps. These results confirm that flight altitude is a critical factor for ensuring reliable communication during power line inspection missions.
4.2.2. Urban Scenario
For the urban scenario, we compute the received power heatmaps at four different altitudes (10 m, 20 m, 30 m, and 40 m) using the ray-tracing model. Figure 11 presents the communication quality heatmaps overlaid on the OpenStreetMap building layout.
4.3. Performance Evaluation of the Improved GWO
4.3.1. Convergence Comparison of Improvement Strategies
To understand the contribution of each individual improvement strategy, we compare the convergence behavior of three enhanced GWO variants against the standard GWO. Figure 12 presents the convergence curves of four configurations: (1) the standard GWO (baseline), (2) GWO with greedy leader update, (3) GWO with genetic mutation, and (4) GWO with nonlinear convergence factor. All configurations are evaluated under the same experimental conditions with the auxiliary cost function enabled.
As shown in Figure 12, all three improvement strategies effectively reduce the total cost compared to the standard GWO. The standard GWO converges prematurely around iteration 30, settling at a relatively high cost. The greedy leader update mechanism achieves the most significant improvement, maintaining a steady downward trend in the cost. The genetic mutation strategy yields notable improvement by introducing random perturbations that help escape local optima. The nonlinear convergence factor, while showing the least improvement, still outperforms the standard GWO by providing a better exploration-exploitation balance.
4.3.2. Success Rate Comparison
Figure 13 compares the success rates of four algorithm configurations over 100 independent runs in the urban scenario. The four configurations are: (a) the original GWO without auxiliary cost function (GWO), (b) the original GWO with auxiliary cost function (GWO+AF), (c) the proposed IGWO without auxiliary cost function (IGWO), and (d) the proposed IGWO with auxiliary cost function (IGWO+AF).
The standard GWO without any enhancements achieves only a 15% success rate, indicating that the original GWO struggles significantly in complex urban environments. Adding the auxiliary cost function (GWO+AF) dramatically improves the success rate to 41%. The proposed IGWO without auxiliary function achieves a 57% success rate, demonstrating the effectiveness of the three algorithmic enhancements. Remarkably, the full IGWO with auxiliary function achieves the highest success rate of 63% among all configurations in this ablation study, representing a 48% improvement over the standard GWO. This demonstrates that the algorithmic improvements and the auxiliary cost function are synergistic rather than redundant. It is worth noting that the 63% figure is obtained from an ablation study, while the 50% benchmark in Table 7 is from a standardized cross-algorithm comparison under identical settings for all algorithms.
4.4. Impact of Communication Constraints
4.4.1. Mountainous Scenario
We first evaluate the impact of communication constraints in the mountainous scenario. The base station is located at m, creating significant communication variation across the operational area.
Figure 14 shows representative paths from a single run with and without communication constraints, overlaid on the 3D terrain model. The path without communication constraints (blue dashed line) passes through areas with poor signal coverage behind the mountain peaks, while the communication-aware path (red solid line) navigates around these regions to maintain better link quality.
To quantify the communication quality along each path, we sample the throughput at regular intervals of 15 m. Figure 15 presents the throughput profiles of the two paths. The unconstrained path exhibits significant throughput degradation in the middle section (around 400–700 m along the path), with throughput frequently dropping below the threshold Mbps. In contrast, the communication-aware path maintains throughput above the threshold throughout the entire mission.
The quantitative results over 50 independent runs are summarized in Table 5. Both approaches achieve similar success rates in finding feasible paths (56% with communication constraints vs. 54% without). However, the paths planned with communication constraints show a fundamental advantage in reliability: they completely avoid communication outages, whereas the unconstrained paths suffer from prolonged periods of poor connectivity (44.14 s on average).
4.4.2. Urban Scenario
The same comparison was conducted in the more challenging urban canyon environment. Figure 16 compares the paths with and without communication constraints. The unconstrained path (blue dashed line) navigates through narrow street canyons with tall buildings on both sides, while the communication-aware path (red solid line) preferentially routes through more open areas with better signal coverage.
The throughput profiles in the urban scenario, shown in Figure 17, reveal even more pronounced differences. The unconstrained path suffers multiple communication outages, with throughput dropping to nearly 0 Mbps in deep urban canyons. In contrast, the communication-aware path maintains throughput above the threshold for the vast majority of the mission.
A counter-intuitive yet significant finding is that incorporating communication constraints can lead to more efficient paths in the urban scenario. Table 6 shows that the communication-aware paths are on average shorter (2675.8 m) than the unconstrained paths (2883.3 m), while also reducing the average communication outage by over 65%. We posit that the communication cost function acts as an informative heuristic that guides the search away from problematic regions.
4.5. Comparative Analysis of Different Algorithms
To further validate the effectiveness of the proposed IGWO algorithm, we benchmark it against PSO and GA in the dense urban scenario with communication constraints enabled. All algorithms are configured with the same population size (50), maximum iterations (200), and the comprehensive cost function described in Section 3.2.
The comparative results over 50 independent runs are summarized in Table 7. The proposed IGWO demonstrates clear and superior overall performance across multiple evaluation metrics.

Table 7.
Comparative performance of IGWO, PSO, and GA in the urban scenario under standardized experimental settings (50 independent runs).
Table 7.
Comparative performance of IGWO, PSO, and GA in the urban scenario under standardized experimental settings (50 independent runs).
| Evaluation Metric | IGWO (Proposed) | PSO | GA |
|---|---|---|---|
| Success Rate | 50% (25/50) | 10% (5/50) | 28% (14/50) |
| Avg. Missed Targets | 0.32 | 1.08 | 0.14 |
| Avg. Collisions | 1.04 | 0.56 | 2.02 |
| Avg. Path Length | 2,675.8 m | 2,718.2 m | 3,289.1 m |
| Avg. Comm. Outage | 3.94 s | 3.12 s | 8.10 s |
| Avg. Total Cost | 41,072 | 88,422 | 45,261 |
As shown in Table 7, IGWO achieves the highest success rate of 50%, significantly outperforming PSO (10%) and GA (28%). This demonstrates IGWO’s superior ability to find feasible paths that satisfy all constraints simultaneously in complex urban environments.
The poor performance of PSO can be attributed to its sensitivity to parameter settings and tendency to converge prematurely to local optima in complex, multi-modal landscapes. While PSO yields the fewest collisions on average (0.56), it fails to maintain adequate communication quality and frequently misses inspection targets (1.08 on average), resulting in the lowest success rate and the highest average total cost (88,422).
GA maintains better population diversity through its crossover and mutation operators, achieving the lowest average missed targets (0.14). However, its convergence speed is relatively slow, and it struggles to fine-tune solutions in the late stages of optimization. This is reflected in its excessively long average path length (3,289.1 m) and the highest average communication outage duration (8.10 s), indicating that GA-produced paths, while covering most inspection points, tend to be inefficient and may traverse communication-degraded areas.
In contrast, IGWO combines the strengths of both approaches: the social hierarchy and hunting mechanism of GWO provide effective guidance, while the nonlinear convergence factor and genetic mutation strategy maintain diversity and prevent premature convergence. IGWO achieves the most balanced performance across all four metrics—safety, coverage, communication, and length efficiency—as evidenced by its lowest average total cost (41,072). While IGWO does not achieve the absolute best performance in every individual metric (PSO has fewer collisions, GA misses fewer targets), it is the only algorithm that consistently satisfies all constraints simultaneously, making it the most reliable and practical choice for the complex multi-objective path planning problem with communication constraints.
These results confirm that IGWO possesses a more robust global search capability and is better suited for this complex optimization problem than PSO and GA.
5. Discussion and Conclusions
5.1. Summary of Contributions
This paper has addressed the critical challenge of reliable communication in autonomous UAV power inspection by introducing a comprehensive, communication-aware path planning framework. The core contribution is a multi-faceted IGWO algorithm, specifically designed to navigate the complex solution space of multi-objective path planning under stringent communication constraints. We have established a rigorous system model that integrates high-fidelity terrain modeling with realistic air-to-ground channel characterization—employing the 3GPP RMa model for mountainous regions and deterministic ray-tracing for urban canyons—and formulated a comprehensive cost function that holistically balances the competing demands of collision avoidance, complete inspection coverage, path length, and communication quality. Through a suite of algorithmic enhancements—including a nonlinear convergence factor, a genetic mutation operator, and a greedy leader update mechanism—the IGWO consistently outperforms state-of-the-art meta-heuristics in both controlled and realistic scenarios.
5.2. Key Findings
The empirical results yield three principal findings. First, the proposed IGWO algorithm significantly outperforms both the original GWO and other meta-heuristics, achieving a success rate of 50% in dense urban environments compared to 10% for PSO and 28% for GA. This superior performance stems from the synergistic effects of the three enhancements: the nonlinear convergence factor enables effective reallocation of computational resources from aggressive global exploration to meticulous local exploitation; the genetic mutation strategy provides stochastic perturbations that help escape local optima; and the greedy leader update mechanism ensures a monotonically non-degrading search process that enhances convergence stability.
Second, explicitly modeling communication constraints is not merely beneficial but essential for mission-level reliability. Communication-aware paths reduce average outage duration by over 65% in urban canyons compared to unconstrained paths, often while also yielding shorter trajectories. A counter-intuitive yet significant finding is that the communication cost function acts as an informative heuristic that guides the search away from problematic regions, revealing that communication awareness can simplify-rather than complicate-the overall path planning problem by implicitly discouraging exploration of high-risk, low-efficiency trajectories.
Third, the performance gains are consistent across fundamentally different operating environments—mountainous and urban—confirming the versatility and robustness of the proposed framework across diverse propagation conditions and terrain geometries.
5.3. Theoretical and Practical Implications
Theoretically, this work contributes to multi-objective optimization in robotics by demonstrating that for complex real-world tasks, cost functions must be carefully designed to capture all mission-critical objectives, and that the choice of optimizer must match the landscape’s complexity. The success of a diversity-enhanced GWO variant suggests that maintaining solution diversity throughout the optimization process is as important as convergence pressure for high-dimensional, constrained problems.
From a practical standpoint, this research provides a directly applicable solution for utility companies and drone service providers. By guaranteeing communication quality, the framework mitigates the risk of mission failure due to data transmission loss—a major operational concern. The algorithm’s ability to function in both rural and urban settings with the same core architecture enhances its versatility and deployment potential, extending the research direction established by Liu et al. [30] and Mardani et al. [27] in power grid inspection applications.
5.4. Limitations and Future Work
Despite the promising results, this study has several limitations that point to fruitful future research directions. First, the environmental and channel models, while more realistic than simple grid-worlds, are still static and pre-computed. They do not account for dynamic obstacles (e.g., vehicles, birds) or time-varying channel conditions (e.g., fading). Second, the computational cost of the ray-tracing model, while used here for offline evaluation, is prohibitive for real-time onboard planning, motivating the development of lightweight surrogate models or deep learning-based channel predictors. Finally, this work focused on a single UAV; the next logical step is to extend this framework to multi-UAV systems, investigating cooperative path planning where UAVs can act as communication relays for teammates.
In summary, this work provides both a practical algorithm and a conceptual advancement for the field, demonstrating that the future of fully autonomous UAV operations hinges on the tight integration of perception, communication, and action. The IGWO framework offers a robust and versatile solution for current power inspection needs, while its identified limitations—handling dynamic environments and multi-UAV systems—chart a clear and promising course for future research. The algorithmic extensibility of IGWO to multi-UAV swarms, as outlined in Section 3.3.7, positions this work as a foundational planning module for future intelligent cooperation of UAV swarm systems, though comprehensive multi-UAV validation is reserved for subsequent studies.
Author Contributions
Conceptualization, investigation, and writing, S.W. and B.J.; methodology, software and validation, X.W., H.W. and B.J.; project administration and funding acquisition, B.J. and Y.D. All authors have read and agreed to the published version of the manuscript.
Funding
This work was supported by the Science and Technology Project of State Grid Jiangsu Electric Power Co., Ltd. (Grant No. J2025043).
Data Availability Statement
The original contributions presented in the study are included in the article and supplementary material. Further inquiries can be directed to the corresponding author.
Conflicts of Interest
The authors declare no conflict of interest.
Acknowledgments
The authors acknowledge the use of DeepSeek-V4-Pro for language refinement and assistance with abstract and conclusion summarization during the preparation of this work. The authors have reviewed and edited all AI-generated content and assume full responsibility for the final manuscript.
Abbreviations
The following abbreviations are used in this manuscript:
| 3GPP | 3rd Generation Partnership Project |
| A2G | Air-to-Ground |
| ACO | Ant Colony Optimization |
| AF | Auxiliary Function |
| AGPF | A-star-Guided Potential Field |
| APF | Artificial Potential Field |
| BS | Base Station |
| CGWO | Chaotic Grey Wolf Optimizer |
| DWA | Dynamic Window Approach |
| GA | Genetic Algorithm |
| GO | Geometric Optics |
| GWO | Grey Wolf Optimizer |
| IGWO | Improved Grey Wolf Optimizer |
| IHS-GWO | Improved Hybrid Strategy Gray Wolf Optimizer |
| LoS | Line-of-Sight |
| NLoS | Non-Line-of-Sight |
| OSM | OpenStreetMap |
| PSO | Particle Swarm Optimization |
| RMa | Rural Macrocell |
| RRT | Rapidly-exploring Random Tree |
| RRT* | Rapidly-exploring Random Tree Star |
| SNR | Signal-to-Noise Ratio |
| UAV | Unmanned Aerial Vehicle |
| UMa | Urban Macrocell |
| UMi | Urban Microcell |
| UTD | Uniform Theory of Diffraction |
References
- Mendu, B.; Mbuli, N. State-of-the-Art Review on the Application of Unmanned Aerial Vehicles (UAVs) in Power Line Inspections: Current Innovations, Trends, and Future Prospects. Drones 2025, 9, 265. [CrossRef]
- Ahmed, M.F.; Mohanta, J.C.; Keshari, A. Power Transmission Line Inspections: Methods, Challenges, Current Status and Usage of Unmanned Aerial Systems. Journal of Intelligent & Robotic Systems 2024, 110, 54. [CrossRef]
- Hart, P.E.; Nilsson, N.J.; Raphael, B. A Formal Basis for the Heuristic Determination of Minimum Cost Paths. IEEE Transactions on Systems Science and Cybernetics 1968, 4, 100–107. [CrossRef]
- Pharpatara, P.; Hérissé, B.; Bestaoui, Y. 3-D Trajectory Planning of Aerial Vehicles Using RRT*. IEEE Transactions on Control Systems Technology 2017, 25, 1116–1123. [CrossRef]
- Sonny, A.; Yeduri, S.R.; Cenkeramaddi, L.R. Autonomous UAV Path Planning Using Modified PSO for UAV-Assisted Wireless Networks. IEEE Access 2023, 11, 70353–70367. [CrossRef]
- Jin, Z.; Zhang, L.; Zou, Z. 3D Trajectory Planning of UAV Based on DPGA. IEEE Access 2021, 9, 105667–105677. [CrossRef]
- Tang, Y.; Chen, H.; MA, Z.; Jin, Z.; Yin, H. Application of Artificial Potential Field Method in Three-Dimensional Path Planning for UAV Considering 5G Communication. IEEE Access 2024, 12, 79238–79250. [CrossRef]
- Mirjalili, S.; Mirjalili, S.M.; Lewis, A. Grey wolf optimizer. Advances in Engineering Software 2014, 69, 46–61. [CrossRef]
- Ejaz, M.M.; Bingi, K.; Ibrahim, R.; Rajamallaiah, A.; Omar, M.B. Communication-aware path planning in multi-UAV networks: A systematic review and cross-layer analysis. Vehicular Communications 2026, 60, 101043. [CrossRef]
- Dijkstra, E.W. A note on two problems in connexion with graphs. Numerische Mathematik 1959, 1, 269–271.
- Li, J.; Geng, Q.; Ma, F.; et al. A 3D UAV trajectory planning method based on improved convex corner A-star algorithm. In Proceedings of the 2024 43rd Chinese Control Conference (CCC). IEEE, 2024, pp. 3791–3796.
- Zhang, J.; An, Y.; Cao, J.; Ouyang, S.; Wang, L. UAV Trajectory Planning for Complex Open Storage Environments Based on an Improved RRT Algorithm. IEEE Access 2023, 11, 23189–23204. [CrossRef]
- Li, N.; Han, S.I. Adaptive Bi-Directional RRT Algorithm for Three-Dimensional Path Planning of Unmanned Aerial Vehicles in Complex Environments. IEEE Access 2025, 13, 23748–23767. [CrossRef]
- Khatib, O. Real-time obstacle avoidance for manipulators and mobile robots. In Proceedings of the Proceedings. 1985 IEEE International Conference on Robotics and Automation, 1985, Vol. 2, pp. 500–505. [CrossRef]
- Pan, Z.; Zhang, C.; Xia, Y.; et al. An improved artificial potential field method for path planning and formation control of the multi-UAV systems. IEEE Transactions on Circuits and Systems II: Express Briefs 2022, 69, 1129–1133. [CrossRef]
- Choi, J.; Choi, Y. Path Planning for Unmanned Aerial Vehicle: A-Star-Guided Potential Field Method. Drones 2025, 9, 545. [CrossRef]
- Prasad, N.L.; Ramkumar, B. 3-D deployment and trajectory planning for relay based UAV assisted cooperative communication for emergency scenarios using Dijkstra’s algorithm. IEEE Transactions on Vehicular Technology 2023, 72, 5049–5063. [CrossRef]
- Huang, Z.; Jiang, C.; Shen, C.; Liu, B.; Huang, T.; Zhang, M. A Hybrid Dynamic Path-Planning Method for Obstacle Avoidance in Unmanned Aerial Vehicle-Based Power Inspection. World Electric Vehicle Journal 2025, 16, 22. [CrossRef]
- Geng, Q.; Zhao, Z. A kind of route planning method for UAV based on improved PSO algorithm. In Proceedings of the 2013 25th Chinese Control and Decision Conference (CCDC). IEEE, 2013, pp. 2328–2331.
- Wu, X.; Yin, Y.; Xu, L.; Wu, X.; Meng, F.; Zhen, R. MULTI-UAV Task Allocation Based on Improved Genetic Algorithm. IEEE Access 2021, 9, 100369–100379. [CrossRef]
- Wang, Y.; Zhu, J.; Huang, H.; Xiao, F. Bi-Objective Ant Colony Optimization for Trajectory Planning and Task Offloading in UAV-Assisted MEC Systems. IEEE Transactions on Mobile Computing 2024, 23, 12360–12377. [CrossRef]
- Zhang, W.; Zhang, S.; Wu, F.; et al. Path planning of UAV based on improved adaptive grey wolf optimization algorithm. IEEE Access 2021, 9, 89400–89411. [CrossRef]
- Dewangan, R.K.; Shukla, A.; Godfrey, W.W. Three dimensional path planning using Grey wolf optimizer for UAVs. Applied Intelligence 2019, 49, 2201–2217. [CrossRef]
- Qu, C.; Gai, W.; Zhang, J.; et al. A novel hybrid grey wolf optimizer algorithm for unmanned aerial vehicle (UAV) path planning. Knowledge-Based Systems 2020, 194, 105530. [CrossRef]
- Abbas, N.; Abbas, Z.; Liu, X.; Khan, S.S.; Foster, E.D.; Larkin, S. A Survey: Future Smart Cities Based on Advance Control of Unmanned Aerial Vehicles (UAVs). Applied Sciences 2023, 13. [CrossRef]
- Banafaa, M.K.; Pepeoğlu, �.; Shayea, I.; Alhammadi, A.; Shamsan, Z.A.; Razaz, M.A.; Alsagabi, M.; Al-Sowayan, S. A Comprehensive Survey on 5G-and-Beyond Networks With UAVs: Applications, Emerging Technologies, Regulatory Aspects, Research Trends and Challenges. IEEE Access 2024, 12, 7786–7826. [CrossRef]
- Mardani, A.; Chiaberge, M.; Giaccone, P. Communication-aware UAV path planning. IEEE Access 2019, 7, 52609–52621. [CrossRef]
- Duo, B.; Kong, A.; Wu, Q.; Yuan, X.; Li, Y. Joint Path and Pick-Up Design for Connectivity-Aware UAV-Enabled Multi-Package Delivery. IEEE Transactions on Intelligent Transportation Systems 2024, 25, 20017–20031. [CrossRef]
- Chen, W.; Yang, F.; Liu, J.; Zhang, R. Integration of Communication Awareness and Obstacle Avoidance for UAV Path Planning in Urban Environments. IEEE Transactions on Vehicular Technology 2023, 72, 7456–7470. [CrossRef]
- Liu, Y.; Zhao, W.; Zhang, T.; Wang, J. Adaptive Path Planning for UAV-Assisted Power Infrastructure Monitoring with QoS Guarantees. IEEE Internet of Things Journal 2023, 10, 13892–13906. [CrossRef]
- Yan, J.; Zhang, X.; Shen, S.; He, X.; Xia, X.; Li, N.; Wang, S.; Yang, Y.; Ding, N. A Real-Time Strand Breakage Detection Method for Power Line Inspection with UAVs. Drones 2023, 7, 574. [CrossRef]
- Ghambari, S.; Golabi, M.; Jourdan, L.; Lepagnot, J.; Idoumghar, L. UAV path planning techniques: a survey. RAIRO - Operations Research 2024, 58, 2951–2989. [CrossRef]
- Arshid, K.; Krayani, A.; Marcenaro, L.; Gomez, D.M.; Regazzoni, C. Toward Autonomous UAV Swarm Navigation: A Review of Trajectory Design Paradigms. Sensors 2025, 25, 5877. [CrossRef]
- 3rd Generation Partnership Project (3GPP). Study on enhanced LTE support for aerial vehicles: TR 36.777. Technical report, 3GPP, 2017.
- Sharifi, M.J.; Ni, Q.; Zhang, L. Ray tracing based flying altitude optimization for UAV communications in urban environment 2024. pp. 89–95. [CrossRef]
- Yun, Z.; Iskander, M.F. Ray tracing for radio propagation modeling: Principles and applications. IEEE Antennas and Propagation Magazine 2015, 57, 27–41. [CrossRef]
- Zhang, S.; Wang, L. Multi-UAV cooperative path planning based on chaotic grey wolf optimiser. The Aeronautical Journal 2026, 130, 741–761. [CrossRef]
- Deng, J.; Zhang, H.; Zhang, Y.; Zhong, G. UAV Trajectory optimization method based on improved grey wolf optimizer with hybrid strategy. Journal of King Saud University - Computer and Information Sciences 2026, 38, 69. [CrossRef]
Figure 1.
Geometric relationship in the 3GPP RMa-AV channel model.
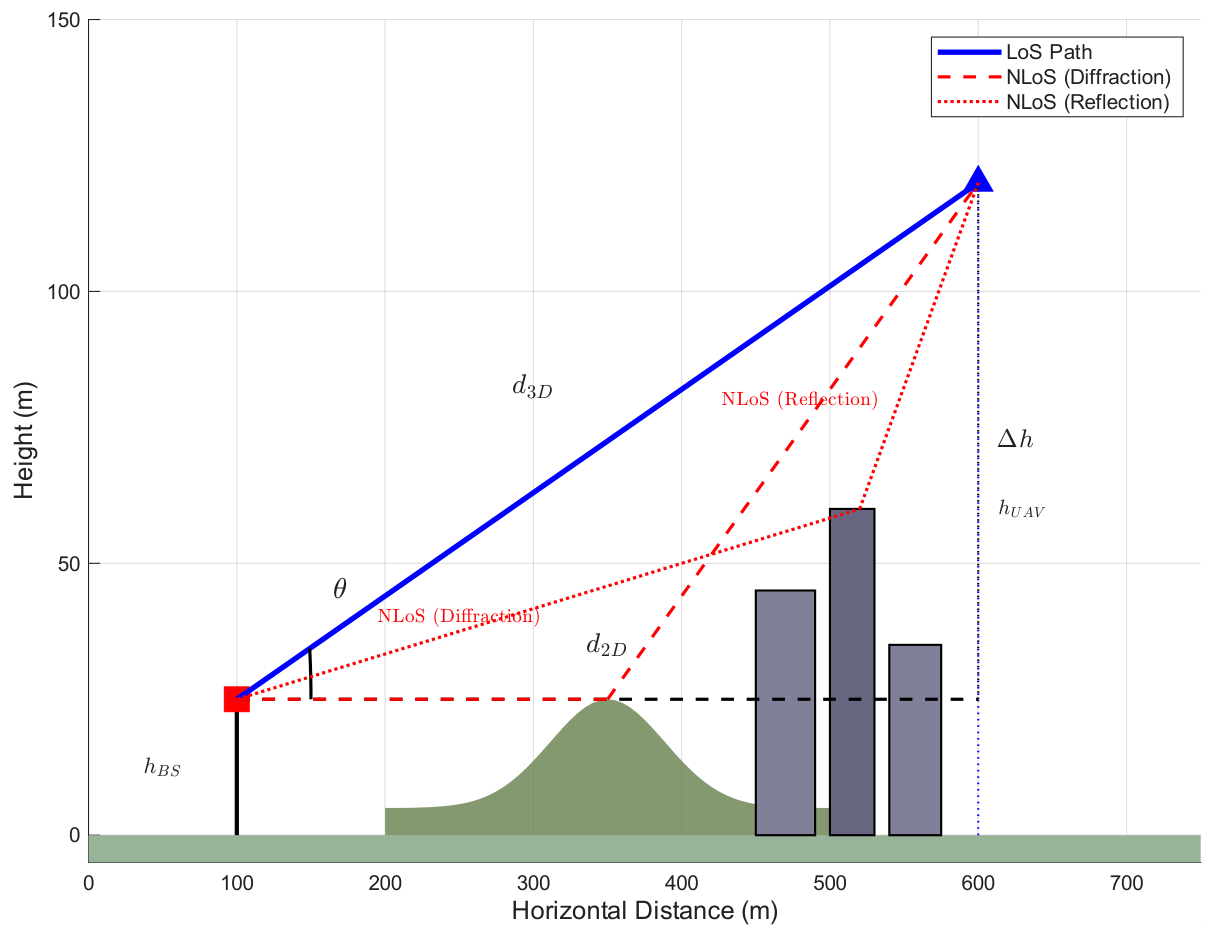
Figure 2.
Ray-tracing propagation paths in an urban canyon.
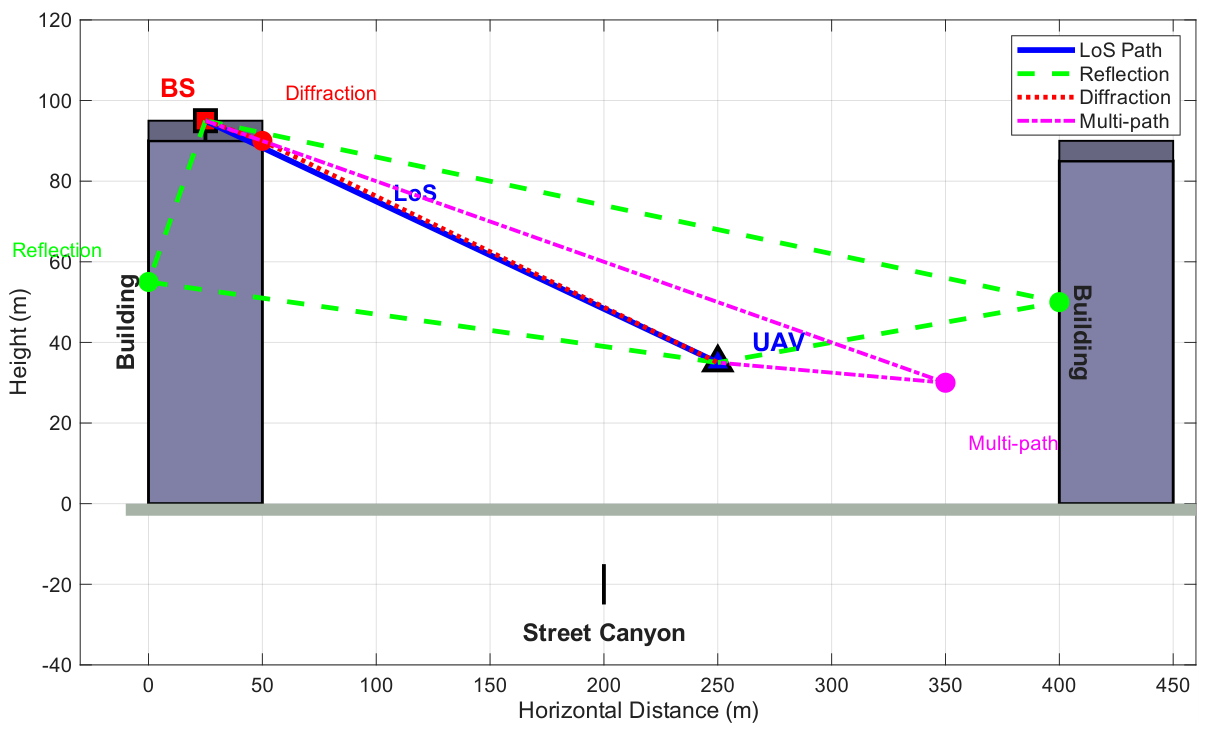
Figure 3.
Comparison of instant and cumulative communication penalty mechanisms. (a) Throughput sampling along a path with threshold Mbps. (b) Accumulated penalty growth during continuous outages.
Figure 3.
Comparison of instant and cumulative communication penalty mechanisms. (a) Throughput sampling along a path with threshold Mbps. (b) Accumulated penalty growth during continuous outages.
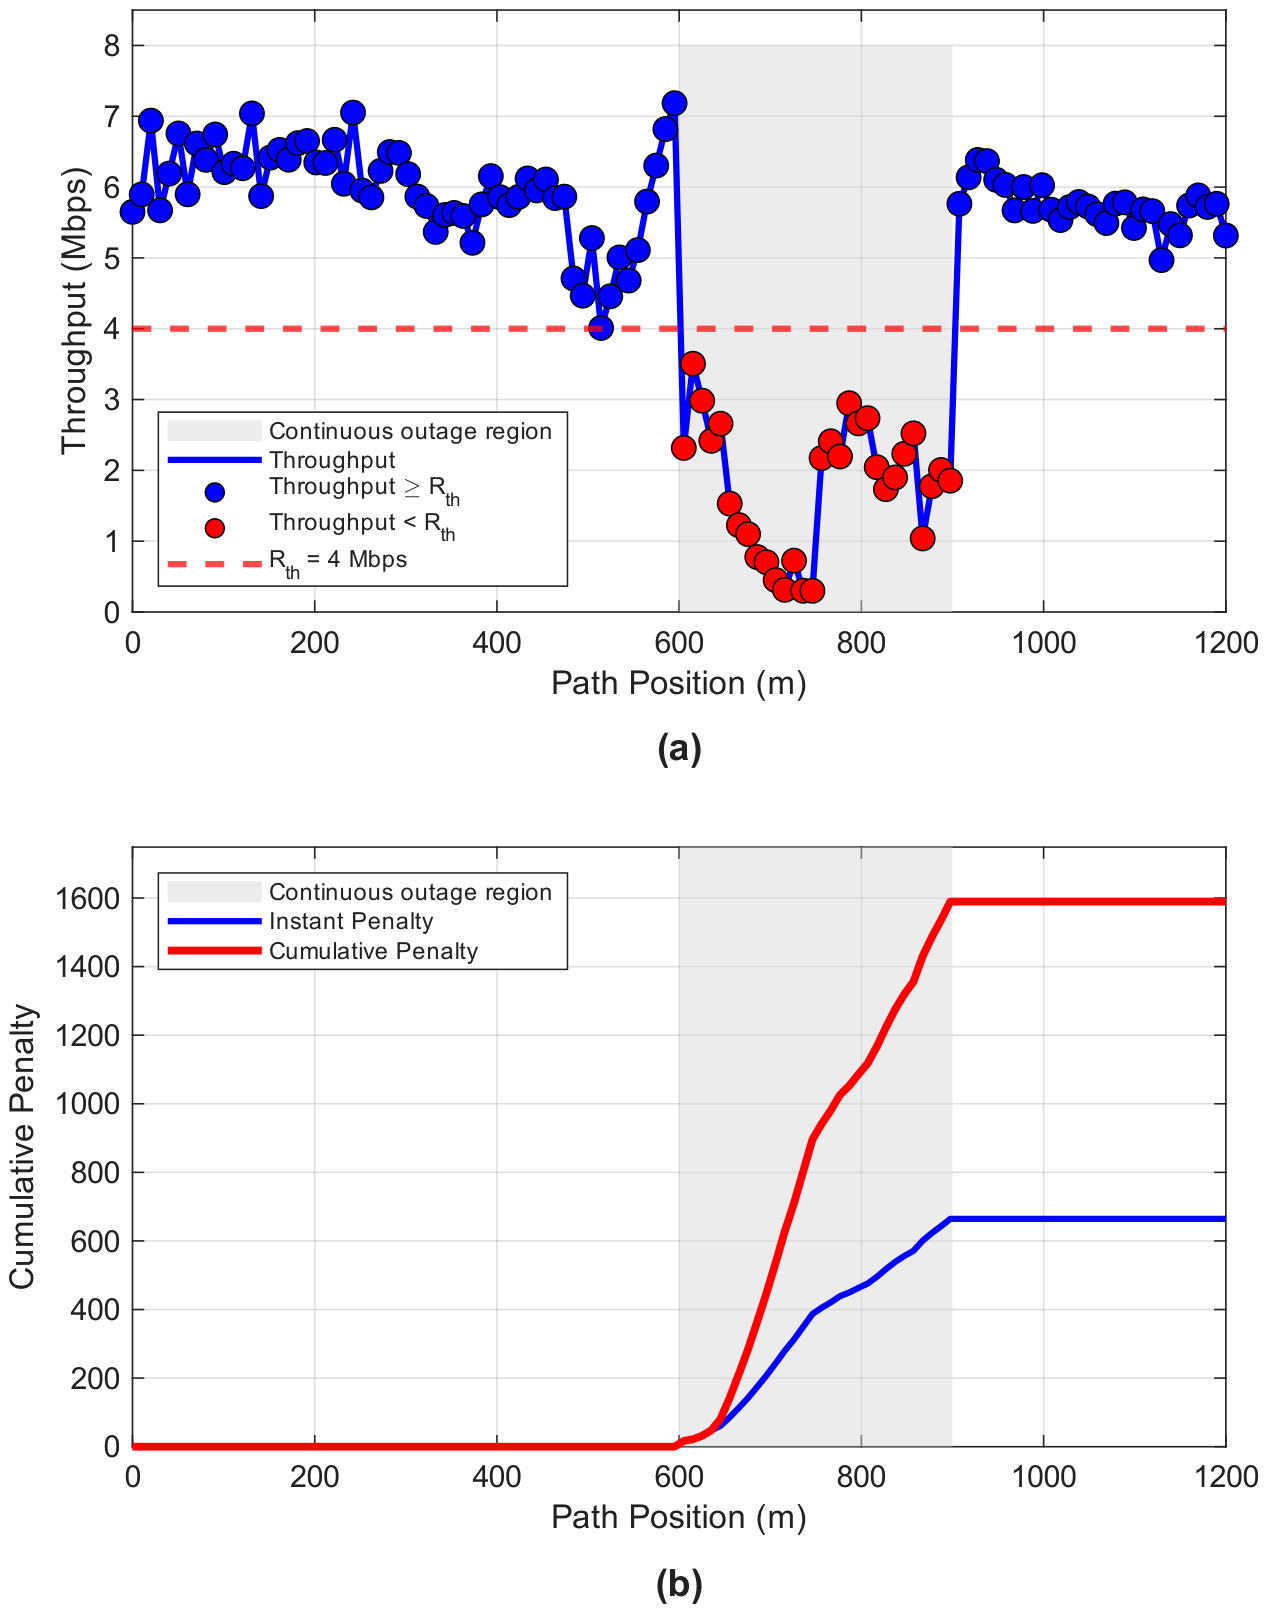
Figure 4.
Social hierarchy of grey wolves in the GWO algorithm.
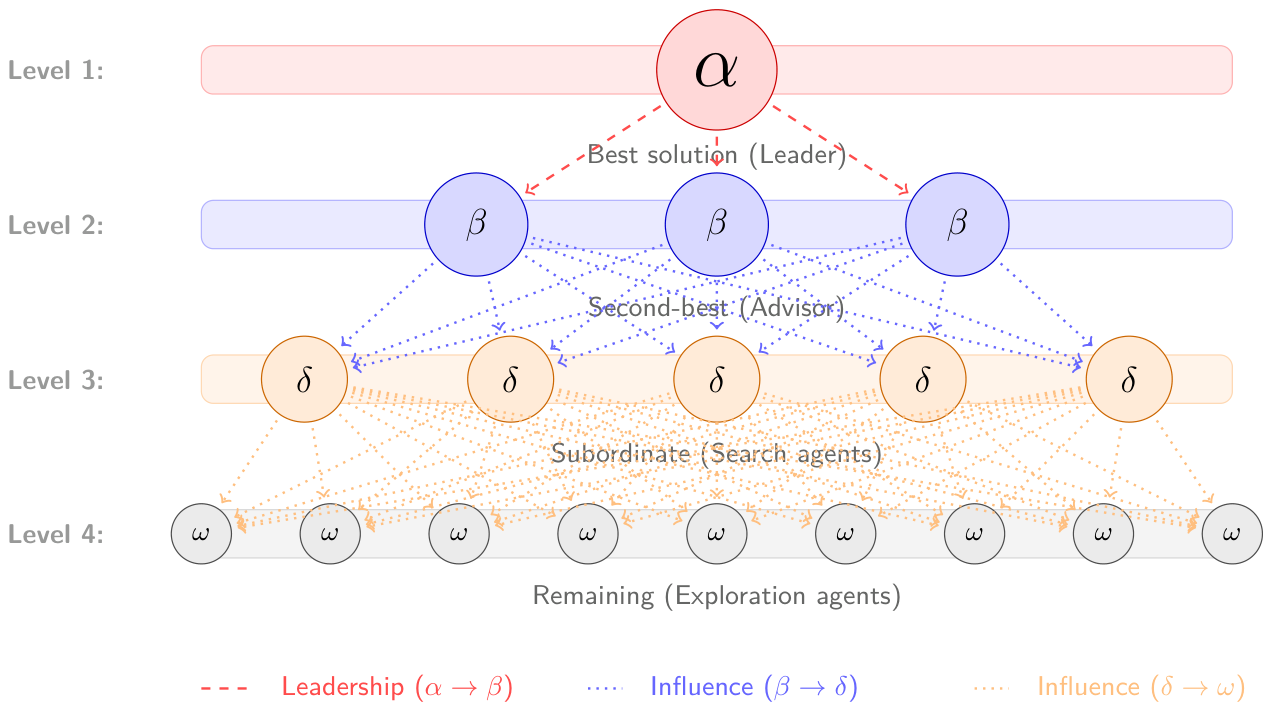
Figure 5.
Comparison of linear and nonlinear convergence factor decay.
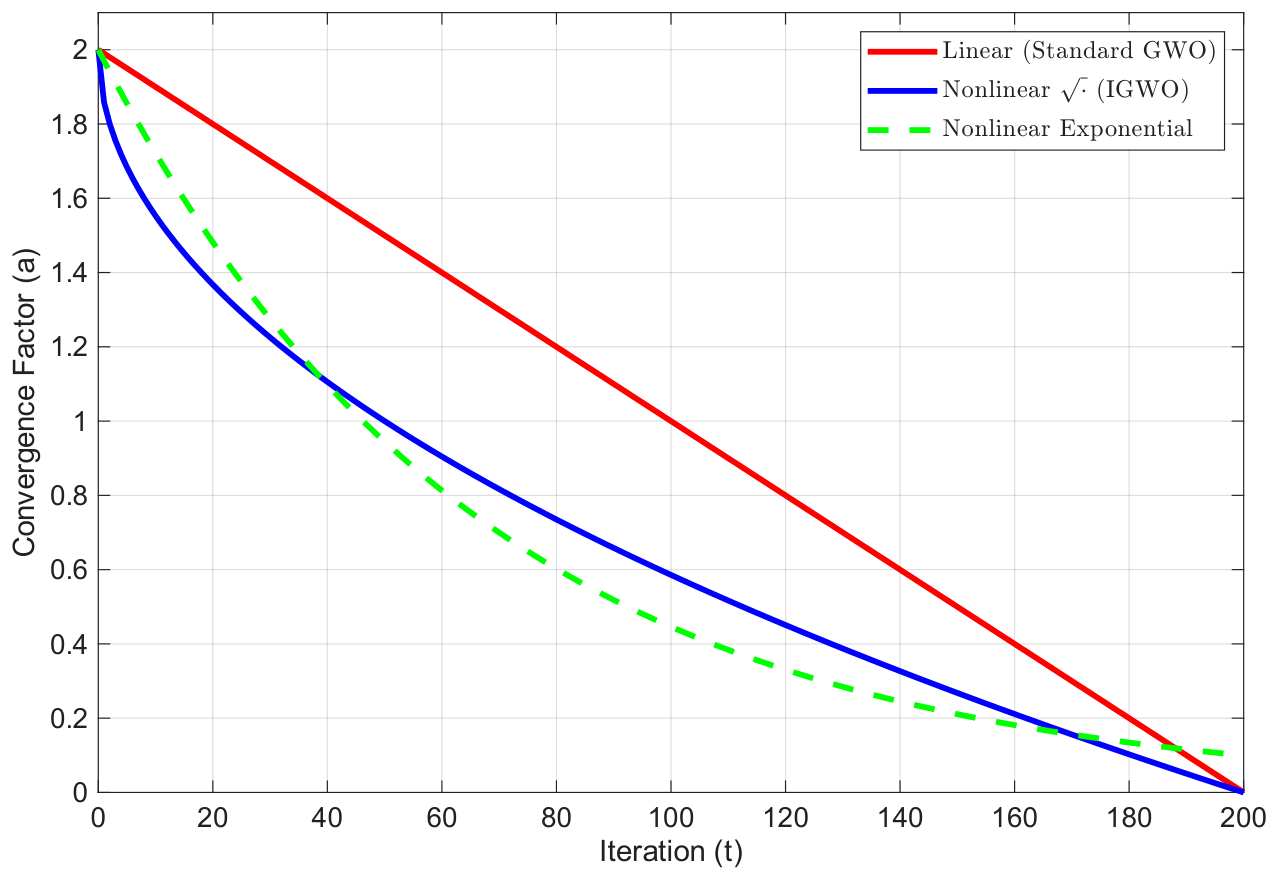
Figure 6.
Illustration of the genetic mutation operation on a path node.
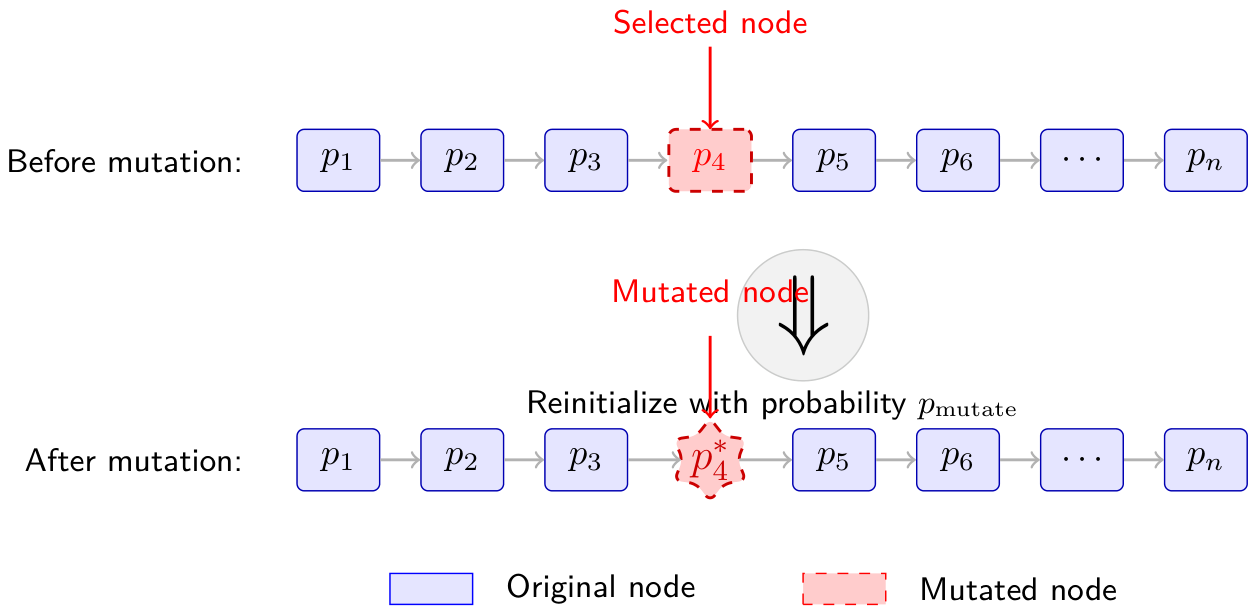
Figure 7.
Flowchart of the proposed Improved Grey Wolf Optimizer (IGWO) algorithm.
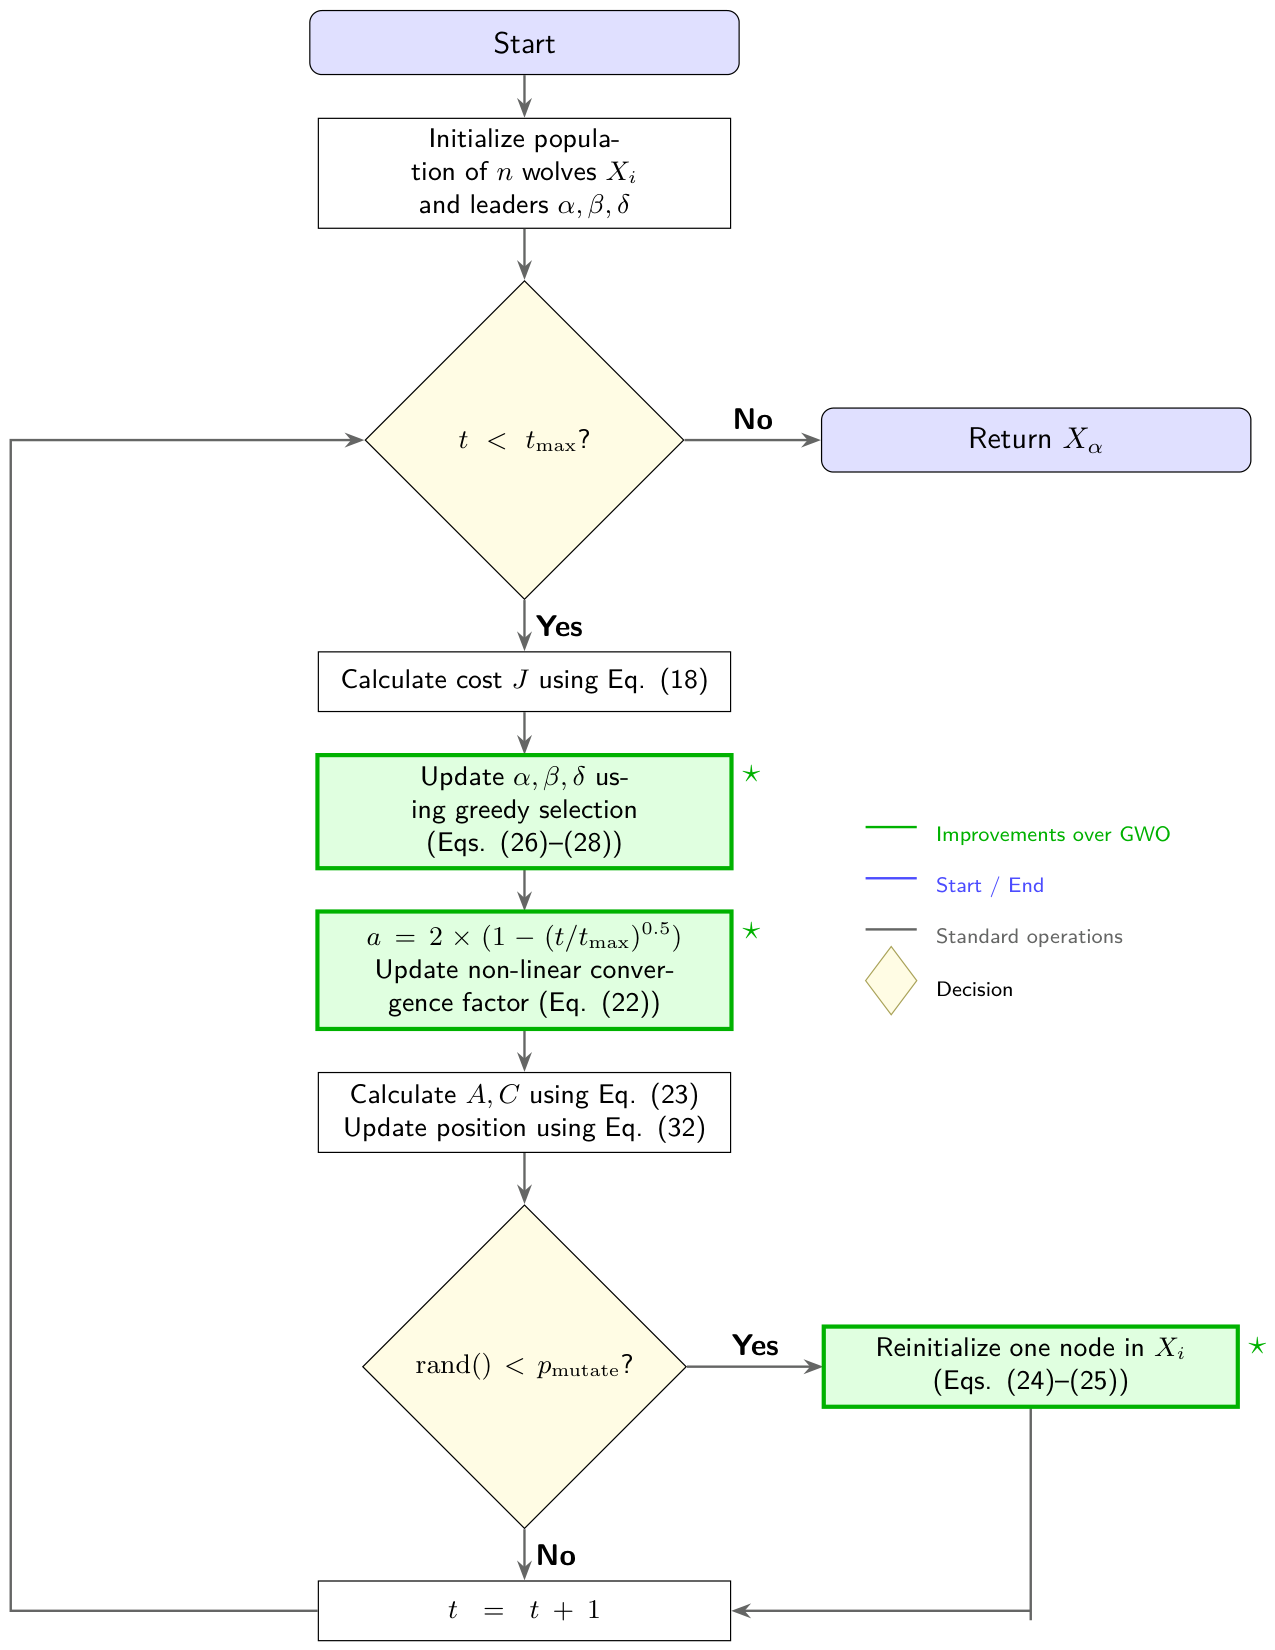
Figure 10.
Throughput heatmaps at different altitudes in the mountainous scenario using the 3GPP RMa model: (a) 10 m, (b) 20 m, (c) 30 m, (d) 40 m.
Figure 10.
Throughput heatmaps at different altitudes in the mountainous scenario using the 3GPP RMa model: (a) 10 m, (b) 20 m, (c) 30 m, (d) 40 m.
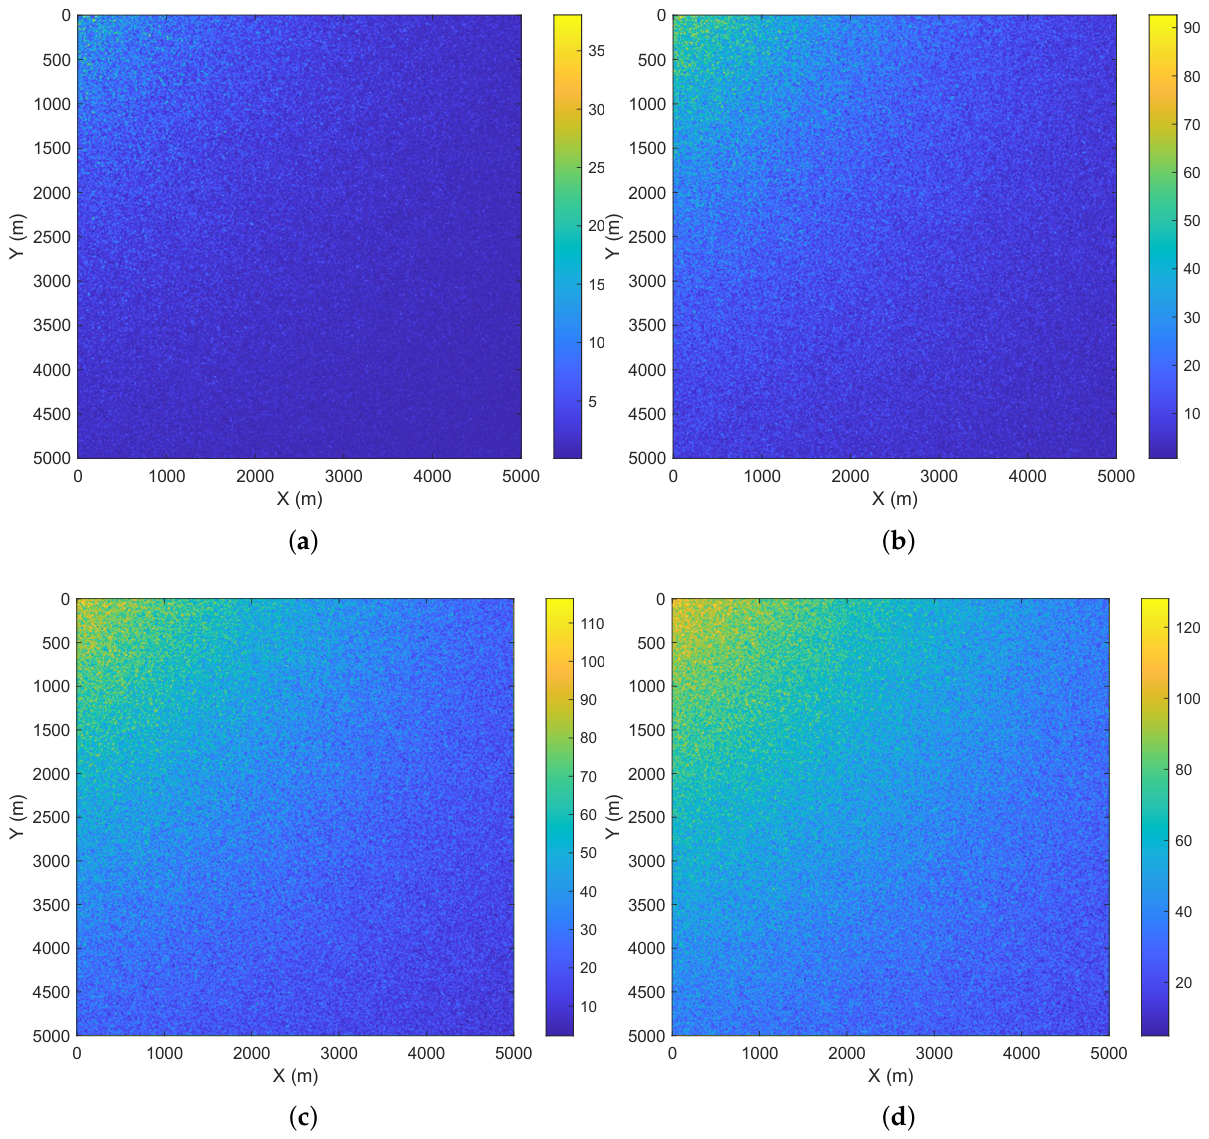
Figure 11.
Received power heatmaps at different altitudes in the urban scenario: (a) 10 m, (b) 20 m, (c) 30 m, (d) 40 m.
Figure 11.
Received power heatmaps at different altitudes in the urban scenario: (a) 10 m, (b) 20 m, (c) 30 m, (d) 40 m.
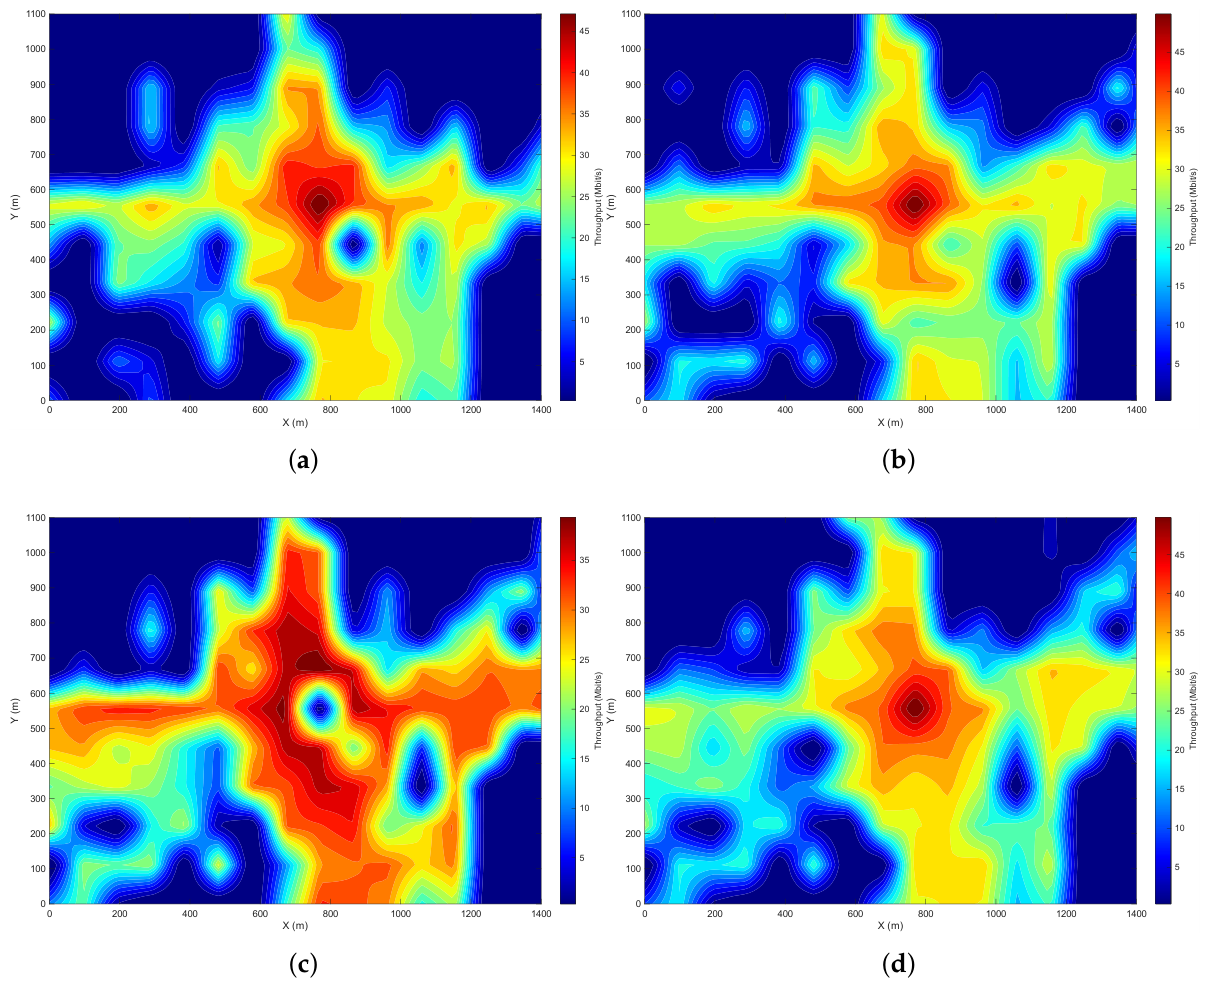
Figure 12.
Convergence comparison of different improvement strategies on the standard GWO.
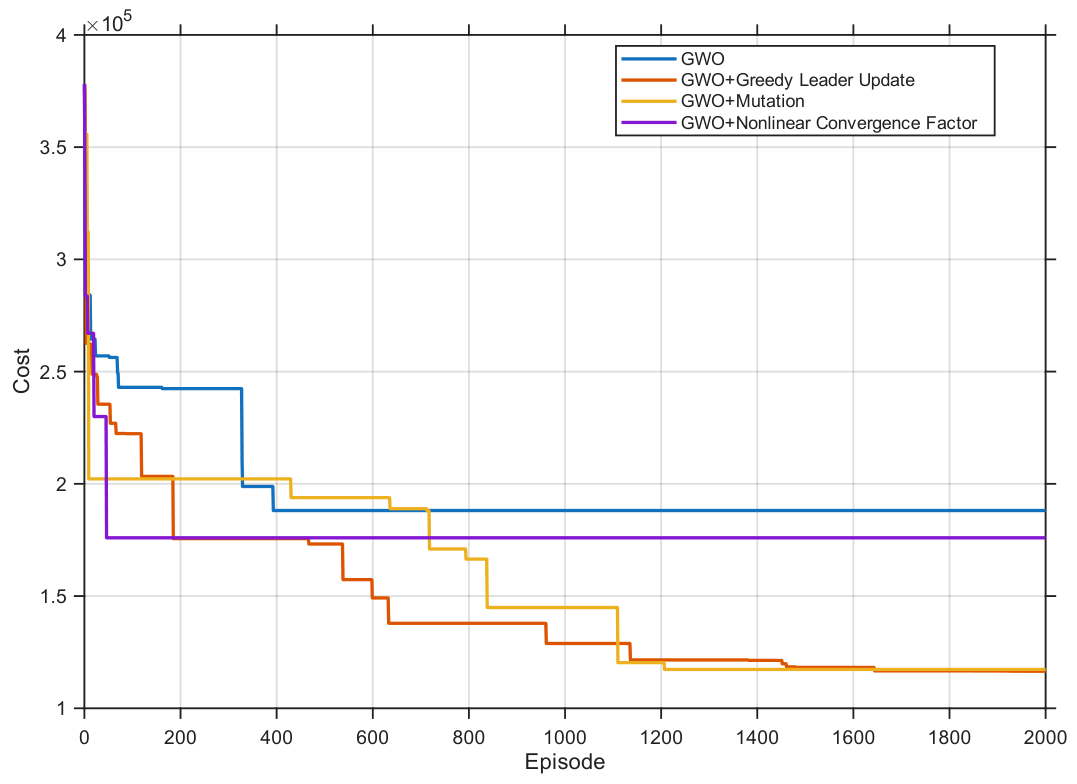
Figure 13.
Success rate comparison of different enhancement configurations (ablation study over 100 independent runs).
Figure 13.
Success rate comparison of different enhancement configurations (ablation study over 100 independent runs).
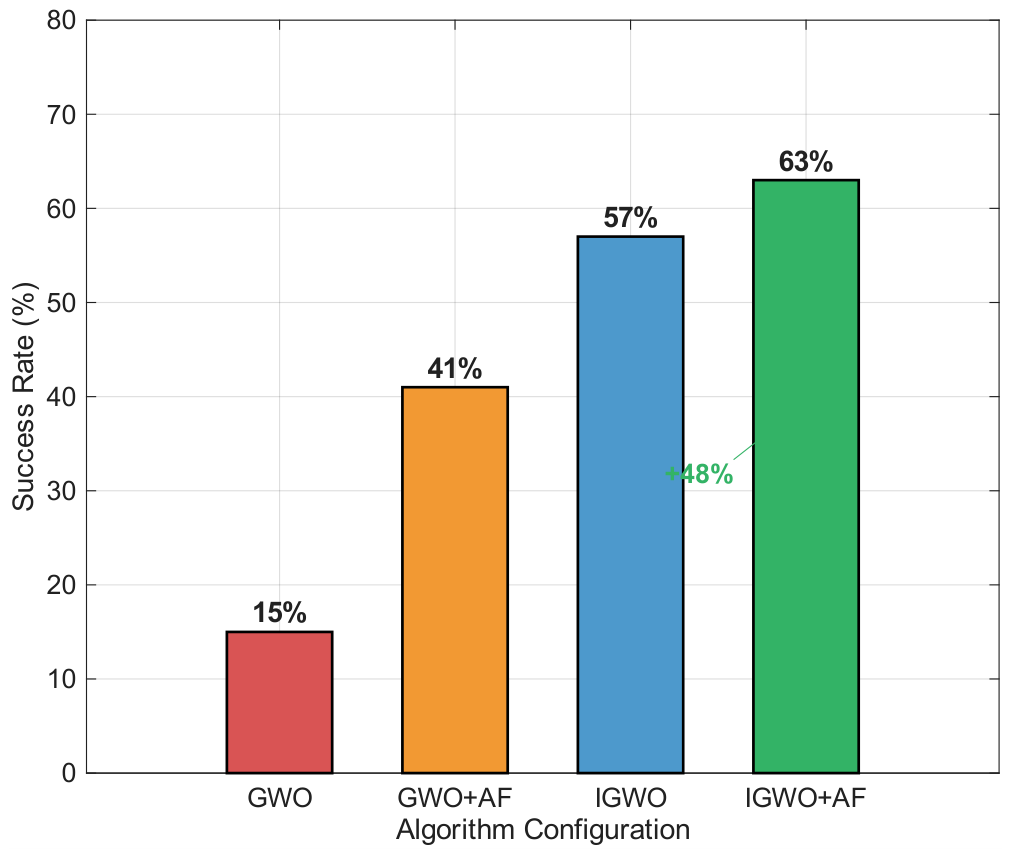
Figure 14.
Path comparison with and without communication constraints in the mountainous scenario.
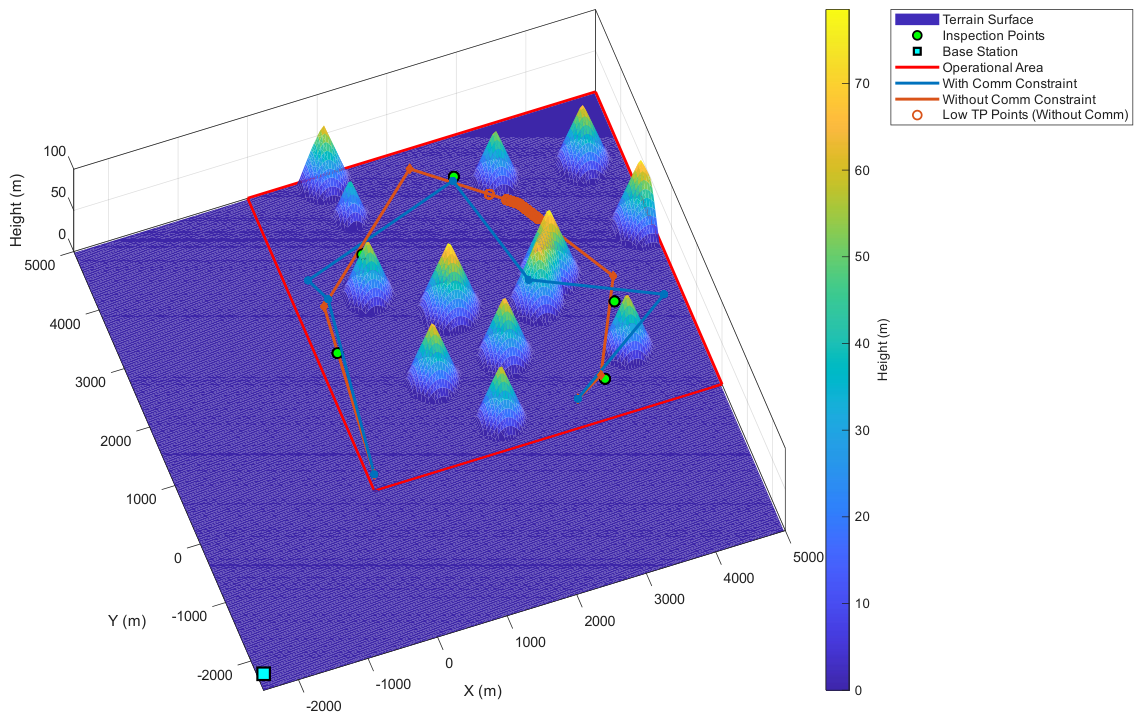
Figure 15.
Communication throughput along the paths in the mountainous scenario.
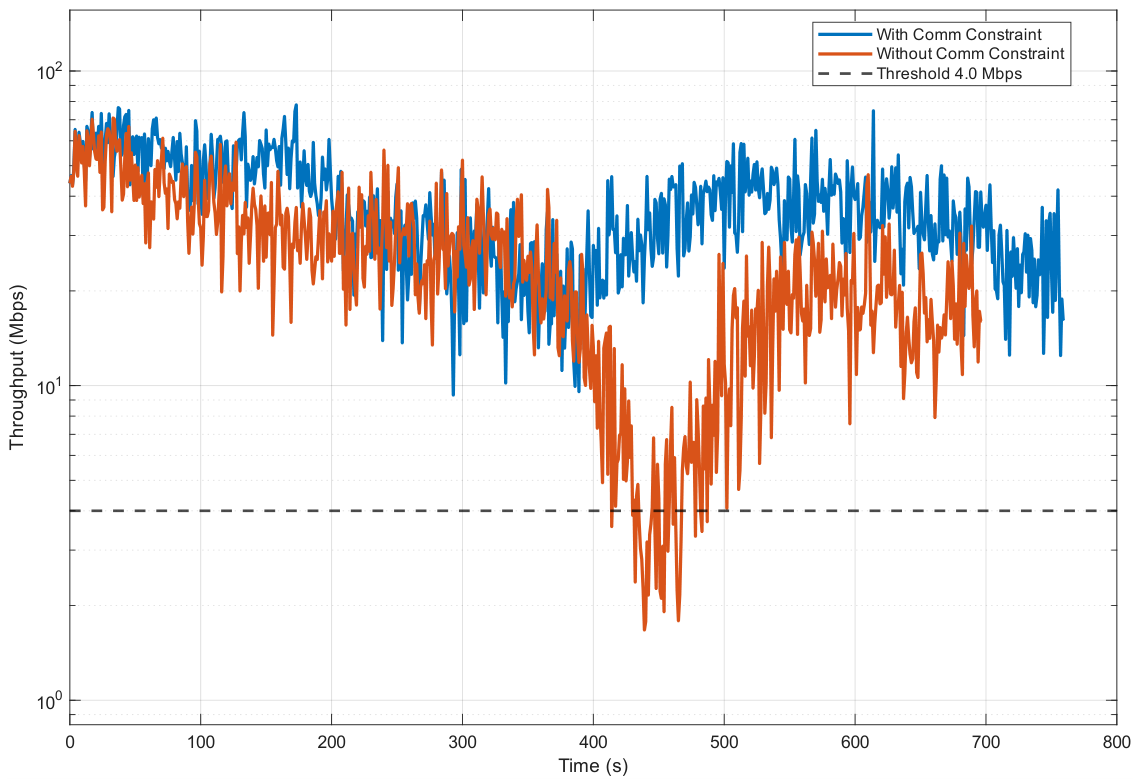
Figure 16.
Path comparison with and without communication constraints in the urban canyon scenario.
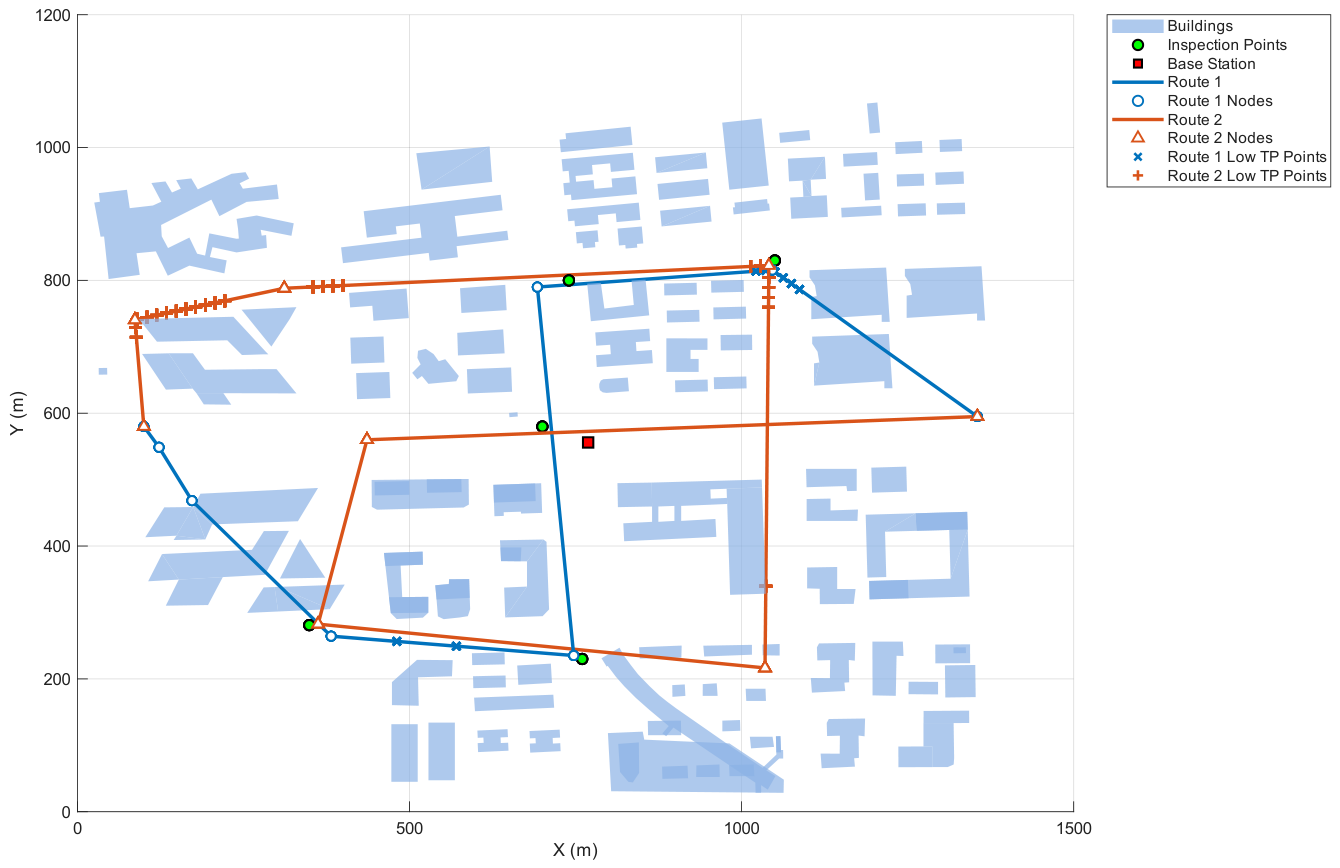
Figure 17.
Communication throughput along the paths in the urban canyon scenario.
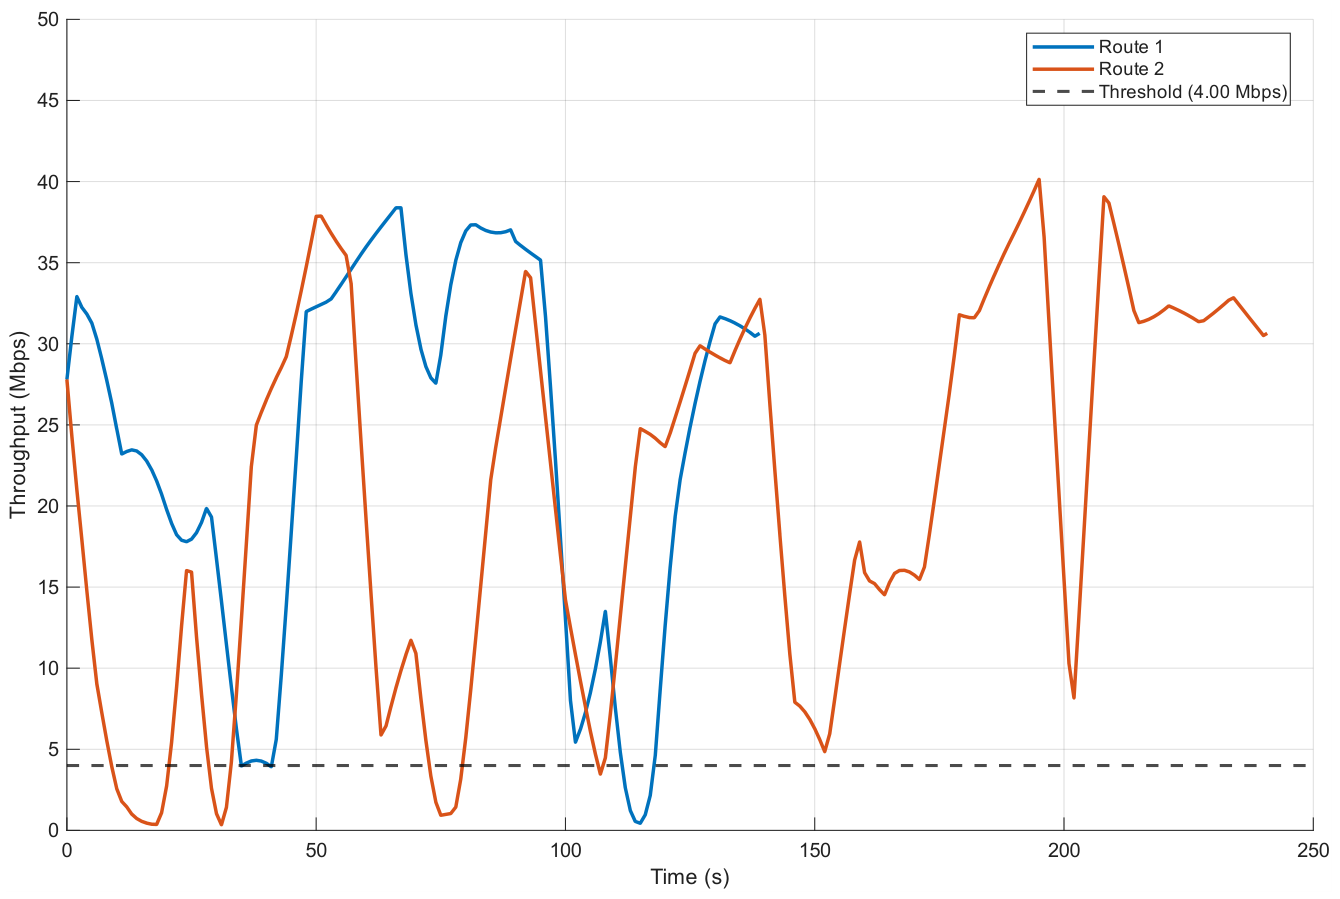
Table 1.
Mountain parameters for the mountainous scenario.
| Peak Index | Center | Height (m) | Radius (m) |
|---|---|---|---|
| 1 | (4450, 4000) | 72 | 360 |
| 2 | (1350, 1400) | 72 | 360 |
| 3 | (3100, 2100) | 73 | 365 |
| 4 | (3400, 2450) | 82 | 410 |
| 5 | (4850, 2800) | 80 | 400 |
| 6 | (2400, 1450) | 72 | 360 |
| 7 | (3250, 4150) | 61 | 305 |
| 8 | (1200, 4250) | 46 | 230 |
| 9 | (1050, 4900) | 70 | 350 |
| 10 | (1950, 2400) | 83 | 415 |
| 11 | (1000, 3000) | 67 | 335 |
| 12 | (4000, 1000) | 67 | 335 |
| 13 | (2000, 500) | 67 | 335 |
Table 2.
Inspection point coordinates in the mountainous scenario.
| Point Index | Coordinates (m) |
|---|---|
| 1 | (200, 2000, 20) |
| 2 | (1100, 3500, 10) |
| 3 | (2600, 4000, 30) |
| 4 | (4000, 1500, 20) |
| 5 | (3500, 500, 10) |
Table 3.
Inspection point coordinates in the urban scenario.
| Point Index | Coordinates (m) |
|---|---|
| 1 | (349, 281, 30) |
| 2 | (700, 580, 20) |
| 3 | (740, 800, 20) |
| 4 | (760, 230, 30) |
| 5 | (1050, 830, 30) |
Table 4.
Simulation parameters for both scenarios.
| Parameter | Mountainous | Urban | Description |
|---|---|---|---|
| 60,000 | 10,000 | Collision cost constant | |
| 80,000 | 70,000 | Inspection target cost constant | |
| 3,000 | 1,000 | Communication quality cost constant | |
| 2.4 GHz | 2.4 GHz | Carrier frequency | |
| 30 dBm | 30 dBm | BS transmit power | |
| 4 Mbps | 4 Mbps | Throughput threshold |
Table 5.
Mountainous scenario: 50-run comparison with and without communication constraints.
| Metric | With Comm. Constraint | Without Comm. Constraint |
|---|---|---|
| Success Rate | 56% (28/50) | 54% (27/50) |
| Avg. Path Length | 12,010 m | 11,913 m |
| Avg. Comm. Outage Duration | 0 s | 44.14 s |
Table 6.
Urban scenario: 50-run comparison with and without communication constraints
| Metric | With Comm Constraint | Without Comm Constraint |
|---|---|---|
| Success Rate | 50% (25/50) | 44% (22/50) |
| Avg. Path Length | 2,675.8 m | 2,883.3 m |
| Avg. Comm. Outage Duration | 3.94 s | 11.46 s |
Disclaimer/Publisher’s Note: The statements, opinions and data contained in all publications are solely those of the individual author(s) and contributor(s) and not of MDPI and/or the editor(s). MDPI and/or the editor(s) disclaim responsibility for any injury to people or property resulting from any ideas, methods, instructions or products referred to in the content. |
© 2026 by the authors. Licensee MDPI, Basel, Switzerland. This article is an open access article distributed under the terms and conditions of the Creative Commons Attribution (CC BY) license (http://creativecommons.org/licenses/by/4.0/).
Copyright: This open access article is published under a Creative Commons CC BY 4.0 license, which permit the free download, distribution, and reuse, provided that the author and preprint are cited in any reuse.


