
Submitted:
11 August 2026
Posted:
12 August 2026
You are already at the latest version
Abstract
Background: Food swamps, which have a high density of outlets selling unhealthy food relative to healthier options, are a major driver of diet-related disparities in urban communities. However, no validated food swamp measurement tools exist at the neighborhood level. Methods: We developed the Food Swamp Environment Audit Tool (FS-EAT) using community-based participatory research. FS-EAT includes 19 items as-sessing street-level food outlet types, accessibility features, food marketing, pricing, social features, and store-level information and food availability. Reliability and validity testing were performed using stakeholder surveys and feedback from the community advisory board (CAB). We compared secondary National Establishment Time Series (NETS) 2020 with FS-EAT food store data using positive predictive values and sensitivity scores. We computed Spearman's rank correlation coefficients to measure the alignment between block group-level food swamp and non-food swamp classifications, comparing FS-EAT data with NETS 2020 data. Results: Interrater reliability was strong (κ = 0.82), and 80% of stakeholders rated FS-EAT items as relevant/extremely relevant. CAB members con-firmed that FS-EAT maps aligned better with lived experiences than the secondary NETS data. GIS analyses showed that FS-EAT maps captured more accurate and timely food swamp exposure compared to NETS. When validated against the NETS 2020 business list, the FS-EAT demonstrated an overall sensitivity of 45.3% and a PPV of 68.2%. We con-firmed fewer than half of NETS-listed outlets through FS-EAT ground observation, yet more than two-thirds of audit-identified stores were also present in the NETS database. Sensitivity was highest for convenience stores (74.4%) and lowest for limited-service restaurants (29.2%). Resident perceptions were moderately correlated with FS-EAT scores (r = 0.5). While both sources agreed on the food swamp classification in 18 block groups, 15 block groups (38.5%) were classified as food swamps by the FS-EAT audit data but as non-food swamps by the NETS data. Discussion: The FS-EAT tool captures nuanced features needed to assess the level of neighborhood food swamp exposure and contributes a systematic, cost-effective way to identify neighborhood-level food swamps.
Keywords:
food swamp
; community-based participatory research
; tool development and validation
1. Introduction
The Social Ecological Model and the Getting to Equity (GTE) framework emphasize the multilevel and structural nature of diet-related disparities and highlight the need for addressing the structural and environmental contributors to poor health, especially in communities affected by racialized poverty [1]. Poor diet is a major contributor to obesity and associated diseases, and neighborhood and community food retail environments create and maintain disparities in people’s food habits, body weight, and overall health. Recent research points to an association between food swamps and obesity prevalence [2,3,4,5,6,7,8]. Food swamps are best described as geographic areas where unhealthy food retail outlets (e.g., fast-food restaurants, corner stores) inundate healthier alternatives (e.g., grocery stores, supermarkets) [9,10,11]. This is important as living in a food swamp has been linked to suboptimal health behaviors including food acquisition behaviors, diet quality, higher intake of sugary drinks, and lower intake of fruits and vegetables (F&V). Previous research has also established associations between food swamps and health disparities such as increased obesity risk, obesity-related cancer mortality, heightened diabetes severity and hospitalizations, early-onset colorectal cancer mortality, metabolic-dysfunction-associated steatotic liver disease mortality, and adverse post-operative outcomes among patients undergoing colorectal surgery [12,13,14,15,16].
Food swamp severity has increased over the past two decades, especially in urban areas where healthier food outlets are sparse [12,17,18]. Studies show that adults with limited access to supermarkets are 25–46% less likely to maintain a healthy diet [19]. This issue is even more acute among older adults due to mobility limitations [20]. Racial and ethnic minorities, particularly Black and Latino populations, are disproportionately affected by food swamps due to structural disparities in food and economic systems [17]. These communities frequently report transportation, economic, and social barriers to food access. Perceptions of the local food environment also shape shopping behaviors and diet quality, suggesting a strong role for subjective and community-informed assessments [11].
Despite growing research, public health policies have largely focused on addressing food deserts, defined as areas where people have limited access to grocery stores [21]. Efforts toward addressing food deserts by opening full-service supermarkets in underserved areas have improved perceived access but have not consistently improved diet or body mass index (BMI) [9,10,11,22,23]. This has prompted a shift in attention toward food swamps, where unhealthy options are not just available but disproportionately concentrated and more accessible. Several policy strategies, such as zoning laws, healthy retail ordinances, and nutritional labeling, have been proposed to mitigate food swamps. Yet, implementation is limited by the lack of standardized, validated tools for identifying food swamps [9,10,11,22,23,24,25,26,27].
There is a need for more accurate, context-based, validated tools for food swamps. This would advance food swamp research by improving the quality of the underlying food store data. Existing food environment research frequently depends on secondary government and commercial data sources such as the US Department of Agriculture (USDA)’s Economic Research Service (ERS) Food Environment Atlas, SNAP retailer locator, Nielsen, InfoUSA, Dunn and Bradstreet, or the National Establishment Time Series (the longitudinal version of Dunn and Bradstreet) [27,28,29]. However, validation studies of secondary food outlet databases have shown that they may lack accuracy, timeliness, and context [30,31,32,33]. Liese and colleagues found that the accuracy of store-level identification improved from 55% (D&B) and 65% (InfoUSA) to 81% after combining the two commercial datasets [31]. Mui et al. subsequently leveraged their approach to combine InfoUSA and Dunn and Bradstreet (D&B) food store data to compute food swamp scores [34]. While this approach effectively improved the food store accuracy rate, it may not always be practical or cost-effective for researchers to purchase multiple commercial datasets simultaneously. In prior food swamp research using audit data, Hager et al. measured food swamp exposure using Baltimore City Food Environment Map data compiled by the Johns Hopkins Center for a Livable Future’s original Healthy Food Availability Index (HFAI) tool [35]. Notably, food swamps were identified based on proximity to corner and convenience stores, as the HFAI tool does not include any fast-food, carry-out, or sit-down restaurants.
Context-based, validated tools would also facilitate more consistent food swamp measurement via data completeness. Currently, food swamp research is undermined by the use of several food swamp measures reflecting relative balance (vs. absolute) in the food environment, such as fast-food percentages, the Retail Food Environment Index (RFEI), the modified Food Retail Environment Index (mRFEI), and the Food Swamp Index (FSI). For instance, using Nielsen food store data, Colón-Ramos et al. defined food swamps as areas where ≥71% of food outlets are fast-food retailers. [36]. As a second example, Cooksey Stowers et al. integrated fast-food, convenience-store, and grocery store data from the USDA Food Environment Atlas to calculate adapted RFEI scores, finding stronger associations between food swamps and obesity than with food deserts [9,13]. A longitudinal study of changes in food swamp exposure in 69,904 US census tracts from 2000 to 2019 computed mRFEI scores and found racial disparities in the presence of food swamps and market concentration. Notably, each relative food swamp measure requires data on different types of food outlets. FSI cannot be computed without data on ‘Intermediate’ stores such as sit-down restaurants and mixed-specialty stores. Thus, across studies, there is no consistent measurement approach, making comparisons between studies difficult [18,37].
Lastly, in line with the growing momentum for community-engaged and community-based participatory research (CBPR) in public health research, there is a need for CBPR approaches to food swamp research, including the development of measures [1].
Given the above gaps, a valid, reliable, and community-informed food swamp tool is urgently needed to assess neighborhood-level food swamp exposure. The present study uses CBPR methods to:1) develop the Food Swamp Environment Audit (FS-EAT) tool; 2) assess content and face validity; 3) test the tool’s interrater reliability; and 4) assess convergent validity by ground truthing FS-EAT data against secondary NETS data and comparing food swamps vs. non-food swamps by data source.
2. Materials and Methods
2.1. Study Design: A Community Participatory Approach to Tool Development
The Food Swamp Environment Audit Tool (FS-EAT) was developed between 2019 and 2021 using a CBPR approach, informed by literature on neighborhood food swamps as structural drivers of diet-related health inequities and adapted from existing tools [9,11,12,14,15,16,38,39,40,41]. The development was a collaboration between academic researchers and two community principal investigators (Community PIs). The Community PIs were leaders from two local advocacy organizations- Hartford Food System and the Hispanic Health Council-and shared the funding as well as scientific and administrative oversight to ensure the research aligned with local priorities. Further, a Community Advisory Board (CAB) including local leaders was convened to guide the tool’s design and ensure cultural and contextual relevance.
The CAB was intentionally structured to reflect the experiential diversity of the North Hartford Promise Zone (NHPZ), including representatives from resident groups, neighborhood associations, public health advocacy groups, a local hospital’s community engagement center, a charitable nonprofit, a not-for-profit community development financial institution, and churches. The CAB was also designed to ensure representation across racial and ethnic backgrounds, income levels, and age groups. The CAB, which had 12 members, met bimonthly, initially in person (August 2019–March 2020) and later via Zoom during the COVID-19 pandemic. The Community PI’s organizations were supported by subawards under the parent grant (Academic PI: Cooksey Stowers), and resident CAB members were compensated for their time and contributions with gift cards and meals. The tool was validated by a brief survey with 26 key stakeholders (non-profit leaders, public health officials, community organizers, residents’ advisory board) and feedback sessions with the Community Advisory Board (CAB).
This study involved two multi-phased processes, namely i) tool development and reliability testing, and ii) face, content, and convergent validity tests. The details are provided below:
2.2. Setting
The study sites were six low-income, ethnically diverse urban neighborhoods in Hartford, Connecticut: Northeast, Upper Albany, Clay Arsenal, Asylum Hill, Frog Hollow, and Barry Square. These neighborhoods were purposively selected because they are predominantly low-income and minority, yet also exhibit diversity in income, ethnicity, percent foreign-born, urbanicity, and health risk factors. Further, during community meetings, the Community Principal Investigators (PIs) and additional local leaders acknowledged the varied food retail environments. These neighborhoods also vary by ‘North Hartford Promise Zone’ (NHPZ) status. In 2015, under the Obama Administration, three neighborhoods in Hartford (i.e., Northeast, Upper Albany, Clay Arsenal) were identified as one of 22 “high-poverty, high capacity” communities in the U.S. by the Department of Housing and Urban Development Promise Zone initiative [42]. This designation indicates that they are high-poverty, distressed areas with alarming rates of unemployment, food insecurity, and crime, and that targeted strategies are needed to advance their revitalization. The poverty rate in the NHPZ is 49% (compared to 33.6% in Hartford and 10.8% in CT) [23]. Residents of North Hartford die on average 10 years earlier than residents in a suburban community less than five miles away. Adults in the NHPZ are twice as likely to be obese as residents of the three non-NHPZ sites and have higher rates of poverty, diabetes, coronary heart disease, and hypertension [23,24]. The NHPZ comprises 19 census block groups, and the comparison sites comprise 26. Table 1 presents key demographic data of the six neighborhoods.
2.3. Tool Development
Tool development followed a three-stage process:1) initial item drafting based on a literature review and community feedback; 2) assessing content validity via a key stakeholder survey; and 3) tool pretesting on 18 streets.
2.3.1. Initial Tool Drafting and Community Feedback
This audit tool builds on existing food environment audit tools, such as NEMS-R, NEMS-S, and NEMS-CS [26,44], as well as neighborhood-level tools, including the Food Environment Audit for Diverse Neighborhoods and the Healthy Food Availability Index [40,41]. In accordance with the study’s CBPR approach, the list of food outlet types and characteristics was refined based on feedback from the Community PIs and from two feedback sessions with the CAB (n=6) and residents (n=6) on the tool's subcomponents. As a result, the initial draft of the FS-EAT Tool included subcomponents for a variety of food outlets (e.g., grocery stores, restaurants, convenience stores, food pantries), social features (e.g., loitering, graffiti, cleanliness), and fast-food restaurant accessibility (e.g., drive-thru).
2.3.2. Assessing Content Validity Via Key Stakeholder Survey
A short survey was conducted with 26 key stakeholders (e.g., non-profit leaders, public health officials, community organizers, residents) to help validate food environment-relevant items from the literature for inclusion in the FS-EAT tool (e.g., food retail outlets, social features, and food promotion). Each stakeholder was asked to quantify the relevance of 19 items that could describe the food retail environment in their neighborhood by selecting a value between 1 and 4 (where 1 is “not relevant” and 4 is “extremely relevant”).
See Figure 1 for the list of questions, which include types of food retail outlets, social features, and food promotion. In addition to the feedback sessions (referenced above in Section 2.4), these numerical ratings reflect the importance of potential retail food environment features and help ensure that the food retail items included in the tool are appropriate for the study sites.
2.3.4. Pretesting Tool & Refinement
The first draft of the FS-EAT tool was pretested by two trained observers (a postdoctoral fellow and a graduate student) in three randomly selected streets in each of the six study neighborhoods (18 streets in total) between December 2019 and January 2020. As a result of the pre-testing, revisions were made to the tool, including reframing questions for clarity, adding additional instructions, reordering questions for sequential flow, and incorporating the mystery shopper protocol to differentiate small grocery stores from corner stores, bodegas, or convenience stores. Additional details regarding the mystery shopper protocol are outlined below. These revisions, along with CAB feedback, resulted in the final version of the FS-EAT tool, which was used for data collection and evaluated in subsequent phases of the project, as described below.
The scope and content of the final FS-EAT tool included 19 items across the following topics: 1) street-level counts of food outlets by type; 2) store-level food and beverage marketing exposure; 3) store-level social features; [41] 4) store-level mystery shopper protocol to identify small grocers vs. corner stores and bodegas; 5) store-level mystery shopper protocol to collect beverage pricing; 6) store-level accessibility (parking, transit lines nearby), and 7) fast-food restaurant accessibility features (drive-thru type, pre-ordering options, and on-site playgrounds). The FS-EAT was programmed in Research Electronic Data Capture (REDCap) version 10. To achieve street-level counts of food outlets by type (section 1), longitude and latitude were captured for each outlet and street segment via REDCap’s built-in feature. Furthermore, to differentiate between small grocery stores and convenience stores, a Mystery Shopper Protocol was used, in which stores were assessed for the presence of fresh produce and meat sections (typical features of small grocery stores) to support accurate classification [45,46,47].
2.4. Tool Evaluation
Tool evaluation followed a three-stage process: i) inter-rater reliability test; ii) convergent validity testing by ground truthing FS-EAT audit data against secondary NETS business listings, and iii) face validity via feedback sessions with Community PIs and CAB.
2.4.1. Inter-Rater Reliability
The final version of the FS-EAT was used in a comprehensive assessment of all food stores across the 40 streets within the 45 block groups that make up the 6 neighborhoods. This assessment was conducted by two independent teams, each consisting of two trained observers. Each team visited with a printed data collection schedule that included a list of streets’ start and end points cross-referenced on Google Maps, geocoded food stores from the purchased 2015 National Establishment Time-Series (NETS) Database to confirm stores on street boundaries, and an iPad with the FS-EAT tool on REDCap. Each team was assigned streets to visit to avoid duplicate audits, and the full audit was completed over 16 weeks between February and May 2020. During the data collection, the data points were “ground-truthed” (i.e., confirmed directly by direct observation on the ground) to identify stores that were in operation, closed, or had been replaced [29,34,48,49,50,51,52,53].
Then, the stores data were scored; these scores were compared, differences were reconciled, and kappa scores were computed to assess interrater reliability. Interrater reliability was assessed by comparing the independent ratings from the two teams using Cohen’s kappa (κ) statistic to quantify agreement for the overall FS-EAT tool and its major subcomponents, including street-level outlet counts, store-level marketing exposure, social features, fast-food accessibility characteristics, and pricing measures. Detailed reliability estimates are presented in the results section.
2.4.2. Assessing Convergent Validity
After establishing the reliability of the FS-EAT data, the tool's convergent validity was assessed by ground-truthing the food store data from FS-EAT against NETS 2020 data.
For the objective alignment assessment, food store types from both the FS-EAT tool and NETS data were categorized as healthy, intermediate, or unhealthy based on prior research [34,54,55]. Food outlets that provide access to produce or a wider selection of fresh, nutrient-rich foods were included in the “healthy” category (e.g., grocery stores/supermarkets, produce/fruit and vegetable markets, fish and seafood markets, and superstores such as wholesale clubs). Food outlets with mixed evidence on whether they should be classified as “healthy” or “unhealthy” were included in the “intermediate” category (e.g., full-service restaurants and mixed-specialty stores such as Top Taste Caribbean Bakery & Grill and Scotts Jamaican Bakery). Food outlets that sell predominantly unhealthy foods high in fat, sugar, or salt were categorized as Unhealthy (e.g., fast-food chain restaurants, limited-service/carry-out restaurants, convenience stores, corner stores, unhealthy specialty stores, dollar stores, pharmacy chain stores, and gas station chains). Table 2 shows the food store category by data source type.
Food swamp indices (Food Swamp Index, Physical Food Environment Index, and Modified Retail Food Environment Index) and food swamp maps were then generated for different food store categories in the FS-EAT and NETS datasets. These indices and maps provide proxies for food swamp exposure needed to complete the validity tests. Three food swamp indices were computed as follows:
- Food Swamp Index (FSI) = (Unhealthy + Intermediate) / Total Stores × 100
- Modified Retail Food Environment Index (mRFEI) = Healthy / Total Stores × 100
- Physical Food Environment Index (PFEI) = Unhealthy / Total Stores × 100
Indices were scaled from 0 to 100, with higher FSI and PFEI values indicating greater concentration of unhealthy food outlets, and lower mRFEI values indicating fewer healthy options.
Sensitivity analyses were conducted at two decision points: (1) varying the name-similarity and geographic-proximity thresholds used to match food outlets between the FS-EAT and NETS datasets, and (2) comparing block group food swamp classifications derived from using the mean versus the median audit FSI as the classification cutoff. These checks were important because both the store-matching criteria and the classification threshold can shape how block groups are ultimately designated as food swamps, and confirming dependability across specifications strengthens confidence that the convergent validity findings reflect real patterns in the data rather than a single analytic choice.
2.4.3. Assessing Face Validity via Feedback sessions with Community PIs and CAB
In line with the study's CBPR approach, feedback sessions with the Community PIs were held every 2 weeks and lasted 60-90 minutes, while those with the CAB were held monthly for 1 hour. To establish face validity, during these feedback sessions, the Academic PI presented preliminary results and solicited targeted feedback regarding the following topics: 1) agreement with their lived and professional experiences in the neighborhood; 2) data interpretation and clarity in how the data was presented; and 3) next steps for revisions to data analyses or subsequent waves of data collection. CAB meetings were recorded and transcribed verbatim. Academic PI (XXX) and a notetaker also took meeting minutes.
3. Data Analysis
3.1. Tool Development: Key Stakeholder Survey Ratings
Relevance scores from the stakeholder survey were analyzed descriptively. Each of the 19 FS-EAT items was rated on a scale from 1 (“not relevant”) to 4 (“extremely relevant”). Mean scores were calculated for each item. Items with a mean score of ≥2 (“somewhat relevant” or higher) were retained in the final tool used to collect data and during the tool evaluation phase.
3.2. Tool Development: Community Advisory Board (CAB) Feedback Session Notes
Community Advisory Board meeting minutes and transcripts were analyzed via an iterative content analysis approach. Between monthly CAB meetings, the meeting notes and transcripts were systematically categorized according to the previously outlined topics (i.e., alignment with lived and professional experience, data interpretation and clarity in how data was presented, and next steps for data analysis or data collection). Then, action items, including edits, were identified before the next call. Using a participatory approach, each CAB feedback session began with a debrief of the previous meeting, presenting key highlights from the notes and how their input directly shaped revisions to the FS-EAT draft. All clarifications or amendments to the researcher’s interpretations were noted in the meeting minutes and reconciled during the subsequent round of edits.
3.3. Tool Evaluation: Interrater Reliability
Reliability of the FS-EAT tool was evaluated by measuring interrater agreement using Cohen’s kappa statistic. Pairs of trained raters independently audited stores, and kappa values were computed for the full tool and its subcomponents using Python 3.8.5 [56]. A pooled kappa score of ≥0.40 was considered an acceptable level of agreement.
3.4. Measures
3.4.1. Sensitivity and Positive Predictive Value (PPV)
Sensitivity and positive predictive value (PPV) were calculated to assess the accuracy of the secondary database compared with direct ground observations. Sensitivity measures how often the NETS database identified food sources when they were present, and PPV measures how often food sources were present when the secondary database reported their existence.
- Sensitivity = TP / (TP + FN)
- PPV = TP / (TP + FP)
3.4.2. Neighborhood-Level and Block-Group Level Food Swamp Indices
The three food swamp indices (FSI, PFEI, and mRFEI) were computed from store counts at two geographic levels (neighborhood- and block-level) using formulas including:
Neighborhood-level indices (audit store counts aggregated by neighborhood): Neighborhood-level indices were calculated from audit data by aggregating store category counts across each of the six study neighborhoods (Clay Arsenal, Northeast, Upper Albany, Asylum Hill, Frog Hollow, and Barry Square) and by study site designation (North Hartford Promise Zone vs. comparison sites). These neighborhood-level scores were compared with resident-perceived food swamp exposure scores.
Block group–level indices (audit and NETS store counts via spatial join): Block group–level indices were calculated for both the audit data and the secondary NETS data. Using the geocoded locations of food outlets, store data points were spatially joined to 2020 Hartford census block groups in ArcGIS Pro using a one-to-one spatial join with the intersect match option [57]. This produced counts of healthy, unhealthy, and intermediate stores per block group for each data source. For classification purposes, block groups with FSI > 50 were designated as food swamp areas and those with FSI ≤ 50 as non-food swamp areas. Choropleth maps were generated at the block group level using equal interval classification (three classes: 0 - 33.33, 33.34 - 66.67, 66.68 - 100.00) to facilitate direct visual comparison between datasets. A bivariate choropleth map was also produced to display the combined audit-derived and NETS-derived FSI simultaneously. The GIS maps and histograms resulting from these analyses were assessed through iterative feedback sessions with CAB members.
3.5. Statistical and Geospatial (GIS) Analyses
Statistical analyses were performed using STATA version 19. The threshold of statistical significance was set at p < 0.05 for all two-sided tests.
3.5.1. Ground Truthing (Validation against Secondary Data)
Statistical analyses were performed using STATA version 19. The threshold of statistical significance was set at p < 0.05 for all two-sided tests.
3.5.1. Ground Truthing (Validation by Secondary Data)
To assess data accuracy and completeness, descriptive statistics were used to compare food outlet counts from the FS-EAT audit (primary dataset) with listings from the 2020 NETS database (secondary dataset). Comparisons included total store counts and category classifications: Healthy, Intermediate, and Unhealthy food outlets.
To determine the match between the primary and secondary datasets, a systematic matching process was applied using two criteria: business name similarity and geographic proximity. Business name similarity was assessed by comparing the spelling of store names across the two datasets, yielding a similarity score ranging from 0 (completely different) to 1 (identical match). Geographic proximity was determined by calculating the straight-line distance in meters between the geocoded coordinates of each store pair. For the sensitivity and PPV analysis, stores were considered matched (True Positives) if they met a name similarity score of ≥ 0.6 combined with a distance of ≤ 100m, or a name similarity of ≥ 0.8 regardless of distance, or a distance of ≤ 50m with a name similarity of ≥ 0.4. Stores found in the primary dataset but not matched to any secondary listing were classified as false negatives (FN), while secondary listings not matched to any audit store were classified as false positives (FP). For the extended matching analysis, additional categories were defined: confirmed match (name similarity ≥ 0.8 and distance ≤ 100m), likely match (name similarity ≥ 0.6 and distance ≤ 100m), proximity match (distance ≤ 50m and name similarity ≥ 0.4), name match distant (name similarity ≥ 0.8 and distance > 100m), and possible match (name similarity ≥ 0.6 with weaker geographic evidence).
3.5.2. Agreement Between Objective Primary FS-EAT and Secondary NETS Data Food Swamp Measures
Food swamp indices (FSI, mRFEI, and PFEI) were computed at the census block group level for both the primary audit data and the secondary NETS data, as described in Section 3.4.1. To compare food swamp classification between the two data sources, each block group was classified as either a food swamp (FSI > 50) or a non-food swamp (FSI ≤ 50), and a cross-tabulation was generated to assess alignment.
To assess convergent validity, several complementary agreement statistics were computed at the block group level (n=39). Spearman rank-order correlations were used to assess the association between audit-derived and NETS-derived food swamp indices and store category counts, given the non-normal distribution of the scores. The three food swamp indices (FSI, mREI, and PFEI) were compared. In addition, correlations were computed for store category counts (healthy, unhealthy, and intermediate).
Cohen’s kappa was computed on the binary food swamp classification (FSI > the mean (74.8) to quantify agreement beyond chance. The intraclass correlation coefficient (ICC; two-way random, single measures, absolute agreement) was calculated to assess whether the two methods yielded the same FSI values, rather than merely consistent rankings. A Wilcoxon signed-rank test was used to assess whether the paired audit-derived and NETS-derived FSI scores differed systematically across block groups.
Additional GIS analyses were conducted to compare the spatial distributions of food swamp exposure between the two data sources using side-by-side choropleth maps and a bivariate choropleth map displaying both indices simultaneously.
4. Results
4.1. Tool Evaluation Results
4.1.1. Validity Testing
The FS-EAT tool was validated with: 1) a key stakeholder survey (content validity); 2) feedback sessions with the Community PIs and CAB (face validity); and 3) Ground truthing compared to NET 2020 data (convergence validity).
4.1.2. Key Stakeholder Survey
Among the 26 stakeholders surveyed, 80% (n = 16) rated FS-EAT items as either "relevant" or "extremely relevant" (scores of 3 or 4 out of 4). All 19 items, spanning food outlet type, marketing, and social factors, were retained in the final version of the tool.
4.2. Interrater Reliability Test
Regarding interrater reliability results, the overall pooled kappa score for the tool was 0.82, and the sub-component kappa scores were 0.90 for street-level store count, 0.61 for store-level social features, 0.90 for store-level beverage marketing exposure, 0.53 for fast-food restaurant accessibility, and 0.83 for pricing.
4.3. Ground Truthing Compared to Secondary NETS Data
4.3.1. Descriptive Analysis of Food Store Audits
Store-Level Comparison
A total of 236 food retail outlets were identified in the secondary dataset (NETS, 2020) across the six study-site neighborhoods. Ground-truthing using the FS-EAT audit identified 168 food outlets, of which five stores were no longer in operation, five were nonexistent, one was located in a restricted-access building, and one had been converted to a non-food establishment. As a result, 157 stores (92.9%) were successfully audited using the FS-EAT tool. Of the 157 active stores, 38 (24.2%) were classified as healthy food outlets, 50 (31.8%) as intermediate food outlets, and 69 (43.9%) as unhealthy food outlets. By comparison, the NETS 2020 secondary data identified 88 (37.3%) healthy, 82 (34.7%) intermediate, and 66 (28.0%) unhealthy food outlets among its 236 stores. Considerable discrepancies emerged between the two data sources. The NETS 2020 data identified substantially more healthy food outlets (88 vs. 38) and more intermediate outlets (82 vs. 50), while the FS-EAT audit data recorded slightly more unhealthy outlets (69 vs. 66) despite having fewer total stores. Table 3 presents food store counts by classification: Healthy, Intermediate, and Unhealthy, based on the typology shown in Table 2.
Comparison of Audit and NETS 2020 Data
To assess the validity of the FS-EAT audit data, we compared it against the NETS 2020 business list using business name and geographic proximity. Of the 157 active audit stores, 107 (68.2%) were matched to a corresponding NETS 2020 entry (True Positives). The remaining 50 audit stores (31.8%) were not found in the NETS 2020 data (False Negatives), while 129 NETS 2020 listings had no corresponding ground-truthed store (False Positives). Table 4 presents the concordance between the FS-EAT audit and NETS 2020 data.
To further explore the extent of overlap between the two datasets, we applied additional matching criteria beyond the initial name-similarity and proximity thresholds used in the PPV analysis. Table 5 presents the results of this extended matching. Of the 157 audit stores matched against the 236 NETS 2020 stores, 5 (3.2%) were identified as likely matches with moderate name similarity (≥ 0.6) within 100m, and 12 stores (7.6%) were matched by proximity alone (within 50m with name similarity ≥ 0.4). Thirty-seven stores (23.6%) matched by name but were geographically distant, and 53 (33.8%) were classified as possible matches based on moderate name similarity with weaker geographic evidence. In total, 107 stores (68.2%) were matched between the two datasets. Fifty audit stores (31.8%) had no corresponding match in the NETS 2020 data, while 129 NETS 2020 stores (54.6%) were not found in the audit data.
Table 6 presents sensitivity and PPV results by store type from the perspective of the FS-EAT audit tool, In this analysis, sensitivity represents how often the FS-EAT audit confirmed a food outlet when the NETS 2020 database reported its existence (sensitivity = TP/[TP+FP]), and PPV represents how often an FS-EAT-identified food outlet was also listed in the NETS 2020 database (PPV = TP/[TP+FN]). Overall, the FS-EAT tool demonstrated a sensitivity of 0.453 (45.3%), indicating that fewer than half of NETS 2020 listings were confirmed as active food outlets through ground observation. Sensitivity was highest for convenience stores (74.4%), followed by grocery stores (45.2%), and lowest for limited-service restaurants (29.2%) and specialty food outlets (29.4%), suggesting that NETS substantially overrepresented these categories. The FS-EAT tool demonstrated an overall PPV of 0.682 (68.2%), meaning that more than two-thirds of stores identified through ground observation were also present in the NETS database. PPV was highest for grocery stores (86.8%) and full-service restaurants (84.6%), indicating strong overlap between the audit and secondary data for these outlet types. In contrast, limited-service restaurants had the lowest PPV (26.9%), with 19 of 26 audit-identified outlets absent from the NETS data, highlighting the FS-EAT tool’s ability to capture food outlets that commercial databases miss.
4.3.2. Block Group–Level Comparison of Food Swamps Constructed with Secondary (NETS) vs. Primary (Audit) Data
4.3.2.1. NETS-Based Food Swamp Index
Table 7 presents the summary statistics of food swamp scores from the Audit and NET Data. The secondary NETS data FSI exhibited a mean of 61.31 and a median of 64.00, indicating generally elevated food swamp conditions across the 39 study block groups within the study area. The distribution was slightly left-skewed (skewness = −0.51), indicating that although several block groups had very high FSI values, the overall distribution remained relatively balanced. FSI values ranged from 0 to 100, with most block groups (74.4%) clustering between 40 and 90. Using the audit-derived FSI mean (74.82) as the classification threshold, the majority of block groups (25; 64.1%) were classified as non-food swamps (FSI 0.00–74.81), and 14 (35.9%) were classified as food swamps (FSI 74.82–100.00).
4.3.2.2. Audit-Food Swamp Index
The audit-derived FSI had a higher mean (74.82) and median (75.00) than the secondary NETS data-derived measure. The distribution was more strongly left-skewed (skewness = −1.23), showing a greater concentration of block groups at the upper end of the FSI range. Using the same classification threshold (FSI ≥ 74.82), a larger proportion 23(59.0%) of block groups were classified as food swamps (FSI 74.82–100.00) compared to only 35.9% under the NETS data., 23 (59.0%) of block groups were classified as food swamps (FSI 74.82–100.00) compared to only 35.9% with the NETS data.
4.3.2.3. Comparative Assessment of Food Swamp Classification by Block Group
To compare food swamp classification between the primary (audit) and secondary (NETS 2020) data sources, each block group was classified as either a food swamp or a non-food swamp using the audit-derived FSI mean (74.82) as the classification threshold. Block groups with an FSI at or above the threshold were designated as food swamps. Because the audit mean and median were nearly identical (74.82 and 75.00, respectively), both thresholds produced the same classification results. Appendix Table 1 presents the classification for each of the 45 block groups in the study area. Six of the 45 block groups were excluded because they lacked food outlet data from one or both sources, three had no food outlets identified by either data source, and three had NETS-listed stores but no audit-confirmed outlets. Of the 39 block groups with data from both sources, 18 (46.2%) had aligned classifications, and 21 (53.8%) did not. Using the audit-derived threshold, the audit classified 23 block groups (59.0%) as food swamps compared to only 14 (35.9%) in the NETS data.
A cross-tabulation shows a systematic pattern of disagreement between the two data sources (Table 8). While both sources agreed on the food swamp classification in 18 block groups (8 both food swamp and 10 both non-food swamp), the predominant direction of misalignment was that the NETS data underestimated food swamp exposure. 15 block groups (38.5%) were classified as food swamps by the FS-EAT audit data but as non-food swamps by the NETS data. Only 6 block groups (15.4%) showed the reverse pattern (i.e., non-food swamps per FS-EAT data classified as food swamps by NETS).
4.3.2.4. Visual Comparison
Figure 2 presents comparisons of Food Swamp Index (FSI) values based on FS-EAT vs. NETS data. A visual comparison of the two maps indicates considerable differences in the spatial patterning of food swamp exposure. The NETS-derived map (left panel) shows a greater mixture of FSI categories across the study area, with several block groups in the low-to-moderate range (light pink), particularly in the western and southern regions of the study area. In contrast, the audit-derived map (right panel) displays a more uniformly high FSI pattern, with the majority (59.0%) of block groups classified in the highest category (dark red, 75.0–100.00). This visual pattern is consistent with the finding that the audit-derived mean FSI (74.82) was substantially higher than the NETS-derived mean FSI (61.31), indicating that the FS-EAT identified a greater concentration of unhealthy and intermediate food outlets relative to total food outlets.
Several block groups that appeared as moderate food swamp areas in the NETS data were classified as high food swamp areas based on the audit data, particularly in the central and southern portions of the study area corresponding to the Frog Hollow and Barry Square neighborhoods. Conversely, some block groups in the northern portion of the study area (Upper Albany and Clay Arsenal) showed high FSI values in both data sources, suggesting greater concordance in areas with the most concentrated food swamp conditions. The audit-derived map also shows more block groups with no food outlets (grey areas), indicating a smaller total number of stores identified through the FS-audit observations compared to the NETS secondary data.
Figure 3 presents a bivariate choropleth map that simultaneously displays the NET-derived FSI and audit-derived FSI for each block group, providing a direct visual representation of concordance between the two data sources. In this map, the color of each block group reflects the combined levels of both indices: dark purple indicates block groups where both data sources assigned high FSI values (high concordance), pink indicates block groups where the NETS data assigned a high FSI but the audit data assigned a low FSI (NETS overestimation), and cyan/light blue indicates block groups where the audit data assigned a high FSI but the NETS data assigned a low FSI (NETS underestimation). Lavender areas represent concordant low FSI values from both sources.
The bivariate map reveals a predominantly cyan/light blue pattern across much of the study area, visually supporting the cross-tabulation finding that the largest source of disagreement was NETS underestimation of food swamp exposure (15 block groups, 38.5%). A few block groups displayed dark purple, most prominently at the northern tip of the study area (Northeast neighborhood), indicating that both data sources identified these areas as having high food swamp exposure. Fewer block groups appear in pink, indicating areas where the NETS data assigned higher FSI values than the audit, consistent with the cross-tabulation finding that only 6 block groups (15.4%) showed this reverse pattern. The lavender block groups represent areas where both sources agreed on lower food swamp conditions. The overall spatial pattern of inconsistency, with a statistically insignificant weak negative correlation between the two data sources (ρ = −0.19, p = .2452), demonstrates the importance of ground-truthing secondary food environment data, particularly in high-poverty urban neighborhoods where the food retail environment may change rapidly and is characterized by a variety of non-traditional food outlets.
4.3.3. Statistical Agreement and Correlation Between Block-Group-Level Primary and Secondary Food Swamp Measures
To quantify the level of agreement and correlation between the two data sources, we computed four complementary statistics, Spearman’s rank correlation, Cohen’s kappa, the intraclass correlation coefficient (ICC), and the Wilcoxon signed-rank test, across all food swamp indices and store category counts. Table 9 presents complete results.
Food Swamp Indices
The FSI derived from NETS 2020 data showed a weak negative correlation with the audit-derived FSI (ρ = −0.19, p = .2452), indicating poor convergence between the two measures. The mRFEI yielded identical results (ρ = −0.19, p = .2452), as the two indices are mathematically complementary (FSI = 100 − mRFEI). The PFEI showed a similar weak negative correlation (ρ = −0.18, p = .2852). None of the index correlations were statistically significant, and the negative direction indicates a slight tendency for block groups that ranked higher on food swamp exposure using one data source to rank lower using the other.
Cohen’s kappa, computed on binary classifications using audit-derived means as thresholds, confirmed this lack of agreement. For the FSI and mRFEI, κ = −0.03 (p = .5691), indicating less than chance agreement. The PFEI showed slightly better but still negligible agreement (k = 0.09, p = .2062). These results suggest that the NETS 2020 and audit-derived food swamp classifications were independent at the block-group level.
The ICC for absolute agreement was negative for all three indices: −0.18 for the FSI and mRFEI (F (38, 38) = 0.68, p = .883) and −0.11 for the PFEI (F (38, 38) = 0.76, p = .798). The negative ICC values indicate that between-method variability exceeded between-block-group variability, confirming that the two data sources produced fundamentally discordant food environment scores.
Wilcoxon signed-rank tests revealed a consistent pattern of directional disagreement. The audit-derived FSI (mean = 74.82) was higher than the NETS-derived FSI (mean = 61.31), approaching but not reaching significance (z = 1.878, p = .0603). The mRFEI showed the same pattern in reverse (z = −1.892, p = .0583). Notably, the PFEI showed a statistically significant difference (z = 2.656, p = .0070), indicating that the audit identified a significantly higher density of unhealthy food outlets than the NETS data at the block-group level.
Store Category Counts
Among the store category counts, intermediate food outlets demonstrated the strongest convergence between the two data sources across all analyses. The Spearman correlation was moderate and statistically significant (ρ = 0.39, p = .0153), and the ICC reached 0.43 (F(38, 38) = 2.81, p = .001), the only measure to achieve a statistically significant ICC. However, despite this relative agreement, the Wilcoxon test revealed that the NETS data identified significantly more intermediate outlets than the audit data (z = −2.915, p = .0029).
Healthy food outlet counts showed a marginally non-significant ICC of 0.20 (p = .052) and a negligible Spearman correlation (ρ = 0.09, p = .6014), with a highly significant Wilcoxon test (z = −3.501, p = .0003), indicating that the NETS data identified significantly more healthy stores than the audit. Unhealthy food outlet counts showed poor agreement (ICC = 0.11, p = .262) and a weak non-significant Spearman correlation (ρ = 0.16, p = .3200), but no significant difference in overall counts between the two sources (z = 0.188, p = .8384), showing that although the two data sources did not agree on which block groups had more unhealthy outlets, they produced similar overall counts at the block group level.
4.4. Feedback Sessions with Community PIs and the CAB
First, regarding tool development, the CAB validated the importance of including ‘nontraditional’ food outlets such as gas stations and dollar stores. Second, regarding tool evaluation, the CAB confirmed that the maps generated using primary FS-EAT audits were a more timely and nuanced representation of food swamp exposure in the study sites than those using secondary NETS data. Face validity was confirmed through review of FS-EAT-generated maps by Community PIs and CAB members. The CAB, local leaders and residents confirmed that these GIS maps aligned with their lived experiences in the neighborhoods.
5. Discussion
With the growing interest in community-based interventions for health promotion, a robust neighborhood-level evaluation tool is needed to measure exposure to food swamps. Leveraging CBPR, we developed and validated the FS-EAT for use in low-income urban neighborhoods. Overall, results support the FS-EAT as a feasible tool with strong interrater reliability, content validity, and face validity. Notably, our study also highlights some important nuances in measurement performance across subcomponents of the tool, such as identifying subcategories of grocery retailers and restaurants that are salient in urban food swamps. Ultimately, our results prove the value of the FS-EAT tool as a primary data collection instrument that captures a more complete and accurate picture of neighborhood food swamp exposure than NETS commercial food store data alone. Key findings from the current project will help inform future public health interventions and policy efforts that require standardized, evidence-based approaches for identifying food swamp neighborhoods and tracking related place-based health disparities.
The inter-rater reliability scores for the subcomponents and the complete tool indicated a range from moderate to excellent agreement among observers across all items. The moderate to high kappa statistic suggested that raters had little difficulty following the tool's training instructions. Additionally, content validity was established through a stakeholder survey, which confirmed that the food outlet types included in the FS-EAT were highly relevant to neighborhood-level food environment assessments. In addition, feedback sessions with the study’s CAB confirmed that the geospatial representation of food swamp exposure based on FS-EAT data aligned with their lived experiences in the neighborhoods and was more timely and accurate than those generated using NETS secondary food store data. The present study also found that food swamp exposure varied across all block groups within the 6 study neighborhoods.
Key findings from our analyses examining the convergent validity of block group-level food swamp identification suggest that the FS-EAT-based assessment captured a higher food swamp intensity and a slightly higher concentration of unhealthy food retailers (e.g., fast-food restaurants, gas stations selling food) than the secondary NETS dataset. Regarding our comparative assessment of how NETs vs. FS-EAT data classify block groups as food swamps vs. non-food swamps, the audit-based measure consistently indicated higher levels of unhealthy retail concentration and greater clustering in the high food swamp category. In particular, 15 block groups (38.5%) were classified as food swamps by the FS-EAT audit data but as non-food swamps by the NETS data. Thus, the predominant direction of misalignment was the NETS data underestimating food swamp exposure. Our ground-truthing findings suggest that this result may be driven by the overreporting of healthy food outlets and the underreporting of unhealthy food outlets, such as limited-service restaurants and corner stores.
Our results are consistent with prior store-level validation research demonstrating that secondary commercial data sources systematically undercount food retailers relative to ground-truth observations. Lucan et al. compared Infogroup business list data against direct street-level observation from the Bronx (New York City) and reported an overall sensitivity of only 39.3% and PPV of 45.5% under strict matching criteria, indicating that the commercial list both missed a substantial proportion of food outlets actually present on the ground and included listings for outlets that no longer existed [28]. Similarly, Caspi and Friebur found that commercial business listings across three rural sites in Minnesota had an average PPV of 0.57 and a sensitivity of 0.62, further showing the limited accuracy of secondary datasets [29]. While these earlier studies evaluated store-level concordance between commercial lists and field observations, the present study expands this work by comparing secondary and primary data at the block group level to identify food swamps versus non-food swamps, a compositional, area-level determination in addition to store-by-store matches. Nonetheless, the directionality of misalignment observed here, with the NETS data underestimating food swamp exposure in 38.5% of block groups, corresponds to the pattern of underdetection documented in prior validation work [32,33], reinforcing the concern that reliance on secondary commercial datasets alone may produce systematic underestimation of food swamp exposure.
This pattern suggests that primary audit data may capture dimensions of retail healthfulness not fully reflected in secondary business listing data. Finally, our statistical findings reinforced our GIS mapping results, providing converging evidence that the NETS 2020 business list and the FS-EAT audit produce fundamentally discordant assessments of the food environment at the block group level. The weak negative Spearman correlations for the composite indices are consistent with the negative ICC values and non-significant kappa statistics. The Wilcoxon tests reveal a systematic directional bias: the NETS data consistently underestimate food swamp exposure relative to the audit for the FSI and PFEI, while overestimating healthy and intermediate store counts. Among all food store classifications (i.e., unhealthy, healthy, and intermediate), intermediate food outlets (e.g., sit-down restaurants) showed the strongest agreement between the two data sources, with the highest Spearman correlation and the only statistically significant ICC. Overall, our results illustrate the value of primary audit tools such as the FS-EAT for accurate characterization of neighborhood food swamps and reveal a few data limitations of relying solely on secondary business listing data for food swamps assessments. As discussed above, this pattern of NETS underestimation is consistent with the low sensitivity and PPV values reported across prior food environment validation studies [28,29,32]. However, the present study uniquely demonstrates these discrepancies at the neighborhood level for food swamp classification rather than at the level of individual store identification. These collective findings underscore the need for researchers and policymakers to incorporate primary audit tools when characterizing food swamp exposure, particularly in low-income communities of color, where inaccuracies in secondary data may compound existing measurement gaps in documenting place-based health inequities.
By linking standardized outlet-level observations to neighborhood-level food swamp classification, FS-EAT advances existing approaches to observational food environment assessment. Unlike the NEMS instruments, which provide detailed and validated assessments of food availability, quality, and pricing within individual food store types (e.g., grocery stores, corner stores, and restaurants) [25,26,58], FS-EAT situates these outlet-level characteristics within the broader composition of the neighborhood retail environment. This makes it possible to examine not only what is available within individual outlets, but also how healthy, unhealthy, and intermediate outlets are distributed relative to one another, a defining feature of food swamp exposure [9,11]. FS-EAT also builds on the attention to racially and ethnically diverse urban settings reflected in the Food Environment Audit for Diverse Neighborhoods (FEAD-N) [41] by incorporating a CBPR process through which community stakeholders identified the importance of measuring limited/quick service restaurants that are not national chains and nontraditional food stores such as gas stations and dollar stores. Its inclusion of the full range of store and restaurant categories further extends the set of tools, such as the Healthy Food Availability Index (HFAI), which has been used in Baltimore food swamp research but focuses on healthy food availability within stores and does not capture fast-food, carry-out, or sit-down restaurants [59]. Overall, these features position FS-EAT as a complementary advancement in food environment measurement: it retains the systematic observational strengths of existing tools while integrating lived experiences in the community and geographic aggregation to characterize the relative concentration and contextual features of food outlets that shape neighborhood-level food swamp exposure.
An important strength of this study is that FS-EAT was developed with input from community stakeholders, including Community PIs and a CAB, who provided content relevant to low-income, ethnically diverse community settings. Thus, findings from this project will be highly generalizable to other low-income urban neighborhoods across the country. Second, the FS-EAT tool offers the opportunity to present time-relevant data compared to secondary datasets, which may be lagged by at least 1 to 2 years. Third, FS-EAT offers a systematic approach to compiling nuanced features (e.g., marketing, produce sections within small food retailers) of the neighborhood food environment that are tied to health-promoting behaviors but have not been captured in previous food environment audit tools [40]. Fourth, data compiled via the FS-EAT can be translated to easy-to-understand formats such as food swamp maps or street-level food swamp scores that can be aggregated to any geographic unit of interest (e.g., block group, census tract, neighborhood by name or boundary, county, state, etc.) to inform decision making, policy planning, and food environment interventions spearheaded by researchers, policymakers, or other key stakeholders. Further, the FS-EAT reflects diverse retail settings by measuring nontraditional markets and culturally distinct food outlets. For instance, the FS-EAT facilitates the identification of healthy vs. unhealthy ethnic specialty stores and restaurants, rather than classifying all ethnic stores as unhealthy. This will help strengthen the tool’s generalizability and can meaningfully inform policy and practice outcomes across diverse populations. Finally, considering accessibility, the FS-EAT makes it more feasible for smaller community-based organizations that may not have large budgets to purchase large secondary datasets (and perhaps even multiple datasets per Lierse et al) to accurately identify food swamps for research, advocacy, and program evaluation.
Still, this current study has some limitations that should be considered. The current version of the FS-EAT tool does not collect detailed information about hours of operation. This was not feasible in the first round because of concerns about the time and staff resources required for in-store data collection. Based on our Community PI’s concerns about the resources allocated to add a mystery shopper protocol to distinguish small food retailers with and without produce sections, hours of operation were not initially included to limit the time research team members would need to spend in the store. Relatedly, we wanted to limit the data collection to details that could not easily be gathered online or via telephone. Future iterations of this tool should leverage the existing mystery shopper protocol to measure hours of operation as another dimension of food access. Also, our testing only included urban neighborhoods, which could restrict its applicability to areas with different food access challenges such as suburban or rural areas. Future studies should test the FS-EAT tool in rural and suburban food retail landscapes to enhance its generalizability.
Regarding future work, psychometric testing, including a validation test comparing the FS-EAT with existing food environment assessment tools such as the Food Retail Outlet Survey Tool, may be warranted [53]. Also, future research should expand the mystery shopper protocol to collect additional store inventory or menu information as well as residents’ interactions with food swamps using approaches such as receipt data, photovoice, or focus group discussions. Future iterations of the tool could also develop a scoring system that incorporates not only outlet type but also social features, accessibility, pricing, and food and beverage marketing to provide a further enhanced measure of food swamp exposure. Furthermore, while this study demonstrates the FS-EAT tool's ability to measure food swamp exposure, it does not establish clear linkages to health outcomes or policies. Future longitudinal studies could focus on correlating the FS-EAT's findings with public health interventions such as neighborhood revitalization or zoning policy changes.
Although FS-EAT provides an objective, audit-based measure of neighborhood food swamp exposure, a complementary subjective measure is needed to capture how residents perceive and experience these environments. Perceived food swamp measures may reflect dimensions of accessibility, affordability, safety, convenience, and cultural relevance that objective outlet counts and environmental observations alone cannot fully represent [11,38]. Prior research documenting racial differences in perceived exposure to food swamps and food deserts, as well as associated disparities in self-reported dietary habits, further supports the importance of measuring this experiential dimension of the food environment [11]. Accordingly, the next phase of this work will focus on developing and validating a subjective food swamp measure that parallels FS-EAT and can be linked at various levels of the neighborhood food environment (e.g., block group, census, zip code). Used together, the two instruments could distinguish between objectively observed food swamp conditions and residents' lived experiences of those conditions, identify areas of convergence or mismatch, and provide a more comprehensive foundation for community-informed interventions.
6. Conclusions
The current study found that the FS-EAT tool is content valid and has higher interrater reliability. Importantly, the FS-EAT tool categorizes food stores based on more nuanced characteristics and more timely information about whether they are open for business. It also provides a novel means to comprehensively measure neighborhood-level food swamp exposure, which can be used to identify priority action areas. The tool is intended for use by researchers, public health practitioners, policymakers, and community-based organizations, with standardized training recommended to ensure reliable implementation. Notably, even with the required investments in training data collectors, we anticipate that the FS-EAT will be a more economical, systematic approach for resource-limited community-based organizations and public health departments to identify food swamps for policy prioritization and investment.
Thus, the FS-EAT can be applied to the development, implementation, and monitoring of land-use zoning policies targeting food swamps (e.g., zoning restrictions, stocking standards) as well as to other public health interventions or resource allocations. Without equity-centered planning, urban food environments risk deepening inequities through processes like gentrification and exclusionary zoning [12,39]. Future research could further incorporate pricing and cultural sensitivity into the tool by addressing identified limitations such as biases toward ethnic food stores. Future research will retest the tool in suburban and rural environments and further refine the technology to ease the burden of data collection. The long-term research goal for this line of research is to utilize the FS-EAT tool to better understand the effect of food swamp environments on diet, food purchasing patterns, diet-related health inequities, and the efficacy of macro-level (zoning changes, addition of supermarkets, neighborhood development) and micro-level nutrition interventions (i.e., in schools, food pantries, child care settings, fast food restaurants) and policy changes (i.e., introduction of a supermarket, zoning law changes, etc.) to alleviate them.
Funding
This research was funded by NHLBI, the Robert Wood Johnson/ Reinvestment Fund Invest Health, and the University of Connecticut Institute for Collaboration in Intervention and Policy (InCHIP) Community-Engaged Research Seed Grant,.
Institutional Review Board Statement
The study was conducted in accordance with the Declaration of Helsinki and approved by the Institutional Review Board (or Ethics Committee) of the University of XXX.
Informed Consent Statement
Informed consent was obtained from all subjects involved in the study.
Data Availability Statement
Data are available from authors upon reasonable request.
Acknowledgments
We thank all our graduate-level research assistants in our lab for their support to the authorship team: Soochi Vadehra and Monika Maciorowski. We are grateful to Alyssa Jones from Hartford Food System for supporting food store audits. Thank you to the Invest Health Hartford Team, Community Action Task Force, and other members of the Community Advisory Board.
Conflicts of Interest
The authors declare no conflict of interest.
Appendix A

Table A1.
Food Swamp Classification by Block Group (Audit FSI Mean/Median Threshold).
| Block Group (GEOID) | NET 2020 (Secondary) | Audit (Primary) | Alignment |
| 90035001001 | Non-Food Swamp (66.7) | Food Swamp (100.0) | Not Aligned |
| 90035001002 | Non-Food Swamp (57.1) | Non-Food Swamp (33.3) | Aligned |
| 90035002001 | Non-Food Swamp (50.0) | Food Swamp (100.0) | Not Aligned |
| 90035009001 | Non-Food Swamp (66.7) | Non-Food Swamp (60.0) | Aligned |
| 90035012001 | Non-Food Swamp (42.9) | Food Swamp (75.0) | Not Aligned |
| 90035012002 | Non-Food Swamp (42.9) | Food Swamp (100.0) | Not Aligned |
| 90035013001 | Food Swamp (75.0) | Food Swamp (100.0) | Aligned |
| 90035013002 | Non-Food Swamp (66.7) | Food Swamp (100.0) | Not Aligned |
| 90035014001 | Non-Food Swamp (50.0) | Food Swamp (100.0) | Not Aligned |
| 90035014002 | Food Swamp (100.0) | Non-Food Swamp (66.7) | Not Aligned |
| 90035014003 | Non-Food Swamp (0.0) | Food Swamp (100.0) | Not Aligned |
| 90035015001 | Food Swamp (100.0) | Non-Food Swamp (0.0) | Not Aligned |
| 90035015002 | Non-Food Swamp (0.0) | No Food Outlet | N/A |
| 90035017001 | Food Swamp (88.9) | Non-Food Swamp (50.0) | Not Aligned |
| 90035018001 | Non-Food Swamp (50.0) | Food Swamp (100.0) | Not Aligned |
| 90035018002 | Non-Food Swamp (42.9) | Non-Food Swamp (60.0) | Aligned |
| 90035018003 | Non-Food Swamp (50.0) | Non-Food Swamp (50.0) | Aligned |
| 90035026001 | Food Swamp (100.0) | Food Swamp (75.0) | Aligned |
| 90035026002 | Non-Food Swamp (40.0) | Food Swamp (100.0) | Not Aligned |
| 90035027001 | Non-Food Swamp (71.4) | Food Swamp (75.0) | Not Aligned |
| 90035027002 | Food Swamp (100.0) | Food Swamp (100.0) | Aligned |
| 90035027003 | Food Swamp (100.0) | Non-Food Swamp (50.0) | Not Aligned |
| 90035028001 | Non-Food Swamp (40.0) | Food Swamp (75.0) | Not Aligned |
| 90035028002 | Food Swamp (75.0) | Food Swamp (100.0) | Aligned |
| 90035028003 | Non-Food Swamp (0.0) | Food Swamp (100.0) | Not Aligned |
| 90035029001 | Food Swamp (80.0) | Food Swamp (100.0) | Aligned |
| 90035029002 | Non-Food Swamp (40.0) | No Food Outlet | N/A |
| 90035029003 | Non-Food Swamp (0.0) | Food Swamp (100.0) | Not Aligned |
| 90035030001 | Non-Food Swamp (64.0) | Non-Food Swamp (42.9) | Aligned |
| 90035030002 | Non-Food Swamp (50.0) | Non-Food Swamp (66.7) | Aligned |
| 90035031011 | Non-Food Swamp (66.7) | Food Swamp (75.0) | Not Aligned |
| 90035031021 | Non-Food Swamp (42.9) | Non-Food Swamp (0.0) | Aligned |
| 90035031022 | Food Swamp (100.0) | No Food Outlet | N/A |
| 90035031023 | Food Swamp (80.0) | Non-Food Swamp (66.7) | Not Aligned |
| 90035033001 | No Food Outlet | No Food Outlet | N/A |
| 90035033002 | No Food Outlet | No Food Outlet | N/A |
| 90035033003 | No Food Outlet | No Food Outlet | N/A |
| 90035035001 | Non-Food Swamp (63.6) | Non-Food Swamp (72.7) | Aligned |
| 90035037001 | Non-Food Swamp (42.9) | Non-Food Swamp (66.7) | Aligned |
| 90035037002 | Food Swamp (75.0) | Food Swamp (100.0) | Aligned |
| 90035244001 | Food Swamp (86.7) | Food Swamp (90.9) | Aligned |
| 90035244002 | Food Swamp (80.0) | Food Swamp (100.0) | Aligned |
| 90035246001 | Non-Food Swamp (33.3) | Food Swamp (100.0) | Not Aligned |
| 90035246002 | Non-Food Swamp (50.0) | Non-Food Swamp (0.0) | Aligned |
| 90035246003 | Food Swamp (100.0) | Non-Food Swamp (66.7) | Not Aligned |
| Total Aligned n (%) | 18(46.2%) | ||
| Total Not Aligned n (%) | 21 (53.8%) |
Note. Food Swamp = FSI ≥ 74.66 (audit mean); Non-Food Swamp = FSI < 74.66. Both the mean (74.66) and median (75.00) thresholds produced identical classifications. Green = aligned; Red = not aligned; Gray = insufficient data.
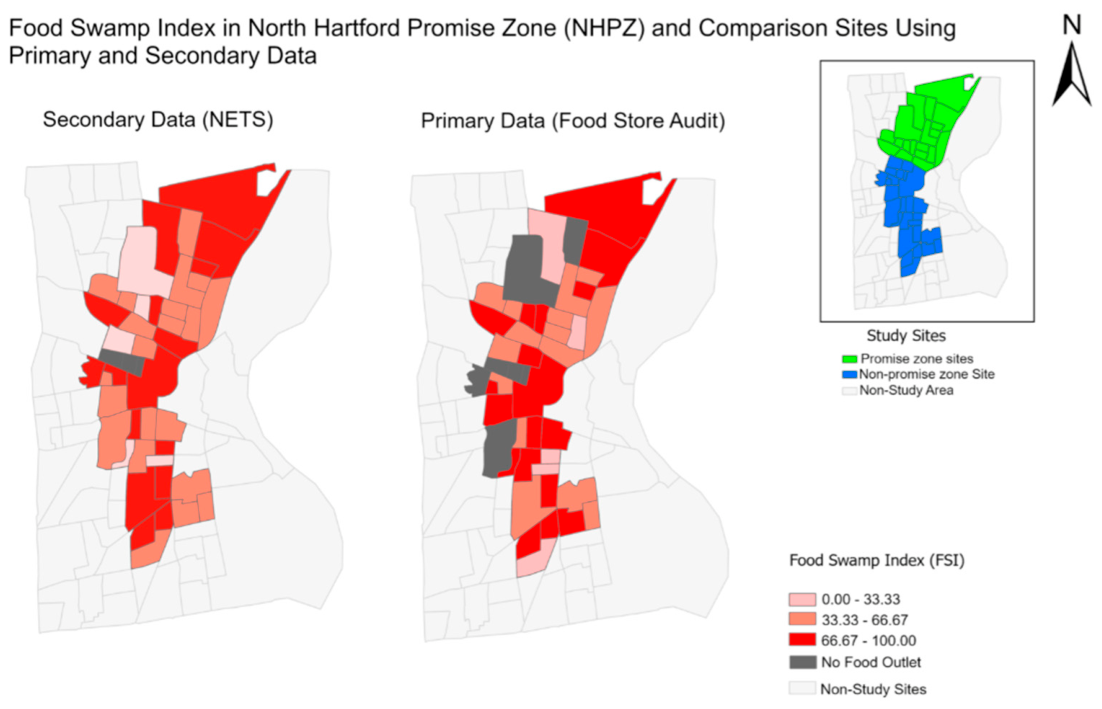
Table A2.
Calculated Neighborhood-level Food Swamp Index (FSI), Physical Food Environment Index (PFEI) and Modified Retail Food Environment Index (mRFEI) from Primary FS-EAT Audit Data.
Table A2.
Calculated Neighborhood-level Food Swamp Index (FSI), Physical Food Environment Index (PFEI) and Modified Retail Food Environment Index (mRFEI) from Primary FS-EAT Audit Data.
| Neighborhood | FSI | PFEI | mRFEI |
| Asylum Hill | 72.73 | 50.00 | 27.27 |
| Barry Square | 80.65 | 58.06 | 19.35 |
| Clay Arsenal | 56.25 | 37.50 | 43.75 |
| Frog Hollow | 76.92 | 46.15 | 23.08 |
| Northeast | 81.48 | 25.93 | 18.52 |
| Upper Albany | 76.47 | 44.12 | 23.53 |
| North Hartford | 70.85 | 36.60 | 29.15 |
| Comparison sites | 77.89 | 52.79 | 22.11 |
References
- Kumanyika, S. Getting to Equity in Obesity Prevention: A New Framework. NAM Perspect. 2017, 7. Available online: chrome-extension: https://nam.edu/wp-content/uploads/2017/01/Getting-to-Equity-in-Obesity-Prevention-A-New-Framework.pdf.
- Madlala, S.S.; Hill, J.; Kunneke, E.; Lopes, T.; Faber, M. Adult food choices in association with the local retail food environment and food access in resource-poor communities: a scoping review. BMC Public Health 2023, 23, 1083. [Google Scholar] [CrossRef] [PubMed]
- Myers, C.A. Impact of the Neighborhood Food Environment on dietary intake and obesity: A Review of the Recent Literature. Curr. Diab Rep. 2023, 23, 371–386. [Google Scholar] [CrossRef] [PubMed]
- Tafuri, D.; Latino, F. Association of dietary intake with chronic disease and human health. Nutrients 2025, 17, 446. [Google Scholar] [CrossRef] [PubMed]
- Mozaffarian, D. Dietary and policy priorities for cardiovascular disease, diabetes, and obesity. Circulation 2016, 133, 187–225. [Google Scholar] [CrossRef] [PubMed]
- Hafeez, M.; Siddique, U.; Sabir, S.; Suleman, R.; Syed, F. A brief review of environmental factors influencing adult's eating behaviors. J. Health Clim. Change 2025, 4, 1–9. Available online: https://jhcc.supp.journalrmc.com/index.php/public/article/view/15.
- Engler-Stringer, R.; Le, H.; Gerrard, A.; Muhajarine, N. The community and consumer food environment and children's diet: a systematic review. BMC Public Health 2014, 14, 522. [Google Scholar] [CrossRef] [PubMed]
- Bivoltsis, A.; Christian, H.; Ambrosini, G.L.; Hooper, P.; Pulker, C.E.; Thorton, L.; Trapp, G.S.A. The community food environment and its association with diet, health or weight status in Australia: A systematic review with recommendations for future research. Health Promot J. Austr 2023, 34, 328–365. [Google Scholar] [CrossRef] [PubMed]
- Cooksey-Stowers, K.; Schwartz, M.B.; Brownell, K.D. Food swamps predict obesity rates better than food deserts in the United States. Int. J. Env. Res. Public Health 2017, 14, 1366. [Google Scholar] [CrossRef] [PubMed]
- Bridle-Fitzpatrick, S. Food deserts or food swamps?: A mixed-methods study of local food environments in a Mexican city. Soc. Sci. Med. 2015, 142, 202–213. [Google Scholar] [CrossRef] [PubMed]
- Cooksey Stowers, K.; Jiang, Q.; Atoloye, A.T.; Lucan, S.; Gans, K. Racial differences in perceived food swamp and food desert exposure and disparities in self-reported dietary habits. Int. J. Env. Res. Public Health 2020, 17, 7143. [Google Scholar] [CrossRef] [PubMed]
- Phillips, A.Z.; Rodriguez, H.P. U.S. county "food swamp" severity and hospitalization rates among adults with diabetes: A nonlinear relationship. Soc. Sci. Med. 2020, 249, 112858. [Google Scholar] [CrossRef] [PubMed]
- Baxter, C.; Park, Y.M. Food Swamp versus food desert: Analysis of geographic disparities in obesity and diabetes in North Carolina using GIS and Spatial Regression. Prof. Geogr. 2024, 76, 409–424. [Google Scholar] [CrossRef]
- Paik, A.; Henry, L.; de Avila, L.; Nader, F.; Paik, J.M.; Younossi, Z.M. Food swamps and food deserts impact on metabolic dysfunction–associated Steatotic Liver Disease mortality in US Counties. Clin. Gastroenterol. Hepatol. 2025, 23, 997–1007.e5. [Google Scholar] [CrossRef] [PubMed]
- Bevel, M.S.; Sheth, A.; Tsai, M.H.; Parham, A.; Andrzejak, S.; Jones, S.R.; Moore, J. Examining racial disparities in the association between food swamps and early-onset Colorectal Cancer Mortality. JCO Oncol Adv. 2024. Available online: https://api.semanticscholar.org/CorpusID:272670476.
- Khalil, M.; Munir, M.M.; Woldesenbet, S.; Endo, Y.; Tsilimigras, D.I.; Kalady, M.F.; Huang, E.; Husain, S.; Harzman, A.; Pawlik, T.M. Association of county-level food deserts and food swamps on post-operative outcomes among patients undergoing colorectal surgery. J. Gastrointest. Surg. 2024, 28, 494–500. [Google Scholar] [CrossRef] [PubMed]
- Jiang, Q.; Ghosh, D.; Steinbach, S.; Cooksey Stowers, K. A longitudinal assessment of racial and ethnic inequities in food environment exposure and retail market concentration. Public Health Nutr. 2023, 26, 1850–1861. [Google Scholar] [CrossRef] [PubMed]
- Lyu, W.; Chen, X.; Miao, C.; Lin, Q.; Xiang, X.; Zhang, G.; Xu, R. Revisiting the modified Retail Food Environment Index (mRFEI): Examining food access inequities over a decade in the United States. Discov. Public Health 2025, 22, 318. [Google Scholar] [CrossRef]
- Moore, L.V.; Diez Roux, A.V.; Nettleton, J.A.; Jacobs, D.R., Jr. Associations of the local food environment with Diet Quality—A comparison of assessments based on Surveys and Geographic Information Systems: The multi-ethnic study of Atherosclerosis. Am. J. Epidemiol. 2008, 167, 917–924. [Google Scholar] [CrossRef] [PubMed]
- Huang, D.L.; Rosenberg, D.E.; Simonovich, S.D.; Belza, B. Food access patterns and barriers among midlife and older adults with mobility disabilities. J. Aging Res. 2012, 231489. [Google Scholar] [CrossRef] [PubMed]
- US Department of Agriculture; Economic Research Service. Access to affordable and nutritious food: Measuring and understanding food deserts and Their consequences. Washington, DC, USA. 2009. Available online: https://www.ers.usda.gov/media/8465/ap-036.pdf?v=29366.
- Healthy Food Policy Project. State policy options to increase access to healthy food. 2026. Available online: https://healthyfoodpolicyproject.org/key-issues/state-policy-options-to-increase-access-to-healthy-food.
- Abraham, M.; Seaberry, C. Greater Hartford Community Wellbeing Index 2019; DataHaven, 2019. Available online: https://www.ctdatahaven.org/sites/ctdatahaven/files/DataHaven_Greater_Hartford_Index_2019_PrelimFinal.pdf.
- Arias, E.; Escobedo, L.; Kennedy, J.; Fu, C.; Cisewski, J. U.S. Small-Area Life Expectancy Estimates Project: Methodology and results summary; National Center for Health Statistics: Hyattsville, MD, USA, 2018; Available online: https://www.cdc.gov/nchs/data/series/sr_02/sr02_181.pdf.
- Green, S.H.; Glanz, K. Development of the Perceived Nutrition Environment Measures Survey. Am. J. Prev. Med. 2015, 49, 50–61. [Google Scholar] [CrossRef] [PubMed]
- Glanz, K.; Sallis, J.F.; Saelens, B.E.; Frank, L.D. Nutrition Environment Measures Survey in Stores (NEMS-S): Development and evaluation. Am. J. Prev. Med. 2007, 32, 282–289. [Google Scholar] [CrossRef] [PubMed]
- Goodman, M.; Thomson, J.; Landry, A. Food environment in the Lower Mississippi Delta: Food deserts, food swamps and hot spots. Int. J. Env. Res. Public Health 2020, 17, 3354. [Google Scholar] [CrossRef] [PubMed]
- Lucan, S.C.; Maroko, A.R.; Bumol, J.; Torrens, L.; Varona, M.; Berke, E.M. Business List vs Ground Observation for measuring a food environment: Saving time or waste of time (or worse)? J. Acad. Nutr. Diet. 2013, 113, 1332–1339. [Google Scholar] [CrossRef] [PubMed]
- Caspi, C.E.; Friebur, R. Modified ground-truthing: An accurate and cost-effective food environment validation method for town and rural areas. Int. J. Behav. Nutr. Phys. Act. 2016, 13, 37. [Google Scholar] [CrossRef] [PubMed]
- Liese, A.D.; Barnes, T.L.; Lamichhane, A.P.; Hibbert, J.D.; Colabianchi, N.; Lawson, A.B. Characterizing the food retail environment: Impact of count, type, and geospatial error in 2 secondary data sources. J Nutr. Educ. Behav 2013, 45, 435–442. [Google Scholar] [CrossRef] [PubMed]
- Liese, A.D.; Colabianchi, N.; Lamichhane, A.P.; Barnes, T.L.; Hibbert, J.D.; Porter, D.E.; Nichols, M.D.; Lawson, A.B. Validation of 3 Food Outlet Databases: Completeness and geospatial accuracy in rural and urban food environments. Am. J. Epidemiol. 2010, 172, 1324–1333. [Google Scholar] [CrossRef] [PubMed]
- Powell, L.M.; Han, E.; Zenk, S.N.; Khan, T.; Quinn, C.M.; Gibbs, K.P.; Pugach, O.; Barker, D.C.; Resnick, E.A.; Myllyluoma, J.; Chaloupka, F.J. Field validation of secondary commercial data sources on the retail food outlet environment in the U.S. Health Place 2011, 17, 1122–1131. [Google Scholar] [CrossRef] [PubMed]
- Fleischhacker, S.E.; Rodriguez, D.A.; Evenson, K.R.; Henley, A.; Gizlice, Z.; Soto, D.; Ramachandran, G. Evidence for validity of five secondary data sources for enumerating retail food outlets in seven American Indian Communities in North Carolina. Int. J. Behav. Nutr. Phys. Act. 2012, 9, 137. [Google Scholar] [CrossRef] [PubMed]
- Mui, Y.; Jones-Smith, J.C.; Thornton, R.L.J.; Pollack Porter, K.; Gittelsohn, J. Relationships between vacant homes and food swamps: A longitudinal study of an urban food environment. Int. J. Env. Res. Public Health 2017, 14, 1426. [Google Scholar] [CrossRef] [PubMed]
- Hager, E.R.; Cockerham, A.; O'Reilly, N.; Harrington, D.; Harding, J.; Hurley, K.M.; Black, M.M. Food swamps and food deserts in Baltimore City, MD, USA: associations with dietary behaviours among urban adolescent girls. Public Health Nutr. 2017, 20, 2598–2607. [Google Scholar] [CrossRef] [PubMed]
- Colón-Ramos, U.; Monge-Rojas, R.; Cremm, E.; Rivera, I.M.; Andrade, E.L.; Edberg, M.C. How Latina mothers navigate a 'food swamp' to feed their children: A photovoice approach. Public Health Nutr. 2017, 20, 1941–1952. [Google Scholar] [CrossRef] [PubMed]
- Becker, C.; Ra, J.; Kwicklis, M.; Du, J.; Chen, C.; Nanavati, H.; Delhey, L.; Lisabeth, L.; Morgenstern, L. Association between the Food Environment and Ischemic Stroke Risk: A population-based study. Stroke 2026, 57 (Suppl. 1). [Google Scholar] [CrossRef]
- Abdul Razak, S.; Atoloye, A.T.; Antrum, C.J.; Niroula, K.; Bannor, R.; Ray, S.; Coman, E.; Huedo-Medina, T.; Duffy, V.B.; Cooksey Stowers, K. Food Swamps and transportation access: Intersecting structural determinants of food shopping and access in marginalized urban communities. Int. J. Env. Res. Public Health 2025, 22, 1481. [Google Scholar] [CrossRef] [PubMed]
- Bevel, M.S.; Tsai, M.H.; Parham, A.; Andrzejak, S.E.; Jones, S.; Moore, J.X. Association of food deserts and food swamps with obesity-related cancer mortality in the US. JAMA Oncol. 2023, 9, 909–916. [Google Scholar] [CrossRef] [PubMed]
- Misiaszek, C.; Kvit, A.; Burns, C.; Harding, J.; Buczynski, A.; Freishtat, H.; Palmer, A. Reliability of an audit tool to measure healthy food availability in food outlets across Baltimore City. J. Hunger Env. Nutr. 2020, 15, 628–642. [Google Scholar] [CrossRef]
- Izumi, B.T.; Zenk, S.N.; Schulz, A.J.; Mentz, G.B.; Sand, S.L.; de Majo, R.F.; Wilson, C.; Odoms-Young, A. Inter-Rater Reliability of the Food Environment Audit for Diverse Neighborhoods (FEAD-N). J. Urban Health 2012, 89, 486–499. [Google Scholar] [CrossRef] [PubMed]
- Radelat, A. Struggling Hartford neighborhood now first in line for Federal Aid. CT Mirror. 2015. Available online: https://ctmirror.org/2015/04/28/struggling-hartford-neighborhood-now-first-in-line-for-federal-aid/.
- American Community Survey 2018; US Census Bureau. 2018. Available online: https://www.census.gov/programs-surveys/acs/news/data-releases.2018.html#list-tab-1133175109.
- Glanz, K.; Fultz, A.K.; Sallis, J.F.; McLaughlin, K.C.; Green, S.; Saelens, B.E. Use of the Nutrition Environment Measures Survey: A Systematic Review. Am. J. Prev. Med. 2023, 65, 131–142. [Google Scholar] [CrossRef] [PubMed]
- Allon, G.; Federgruen, A.; Pierson, M. How much is a reduction of your customers' wait worth? An Empirical study of the fast-food drive-thru industry based on Structural Estimation Methods. Manuf. Serv. Oper. Manag 2011, 13, 489–507. [Google Scholar] [CrossRef]
- Nykiforuk, C.I.J.; Campbell, E.J.; Macridis, S.; McKennitt, D.; Atkey, K.; Raine, K.D. Adoption and diffusion of zoning bylaws banning fast food drive-through services across Canadian municipalities. BMC Public Health 2018, 18, 137. [Google Scholar] [CrossRef] [PubMed]
- Lydon, C.A.; Rohmeier, K.D.; Yi, S.C.; Mattaini, M.A.; Williams, W.L. How far do you have to go to get a cheeseburger around here? the realities of an environmental design approach to curbing the consumption of fast-food. Behav. Soc. Issues 2011, 20, 6–23. [Google Scholar] [CrossRef]
- Sharkey, J.R.; Horel, S. Neighborhood socioeconomic deprivation and minority composition are associated with better potential spatial access to the ground-truthed food environment in a large rural area. J. Nutr. 2008, 138, 620–627. [Google Scholar] [CrossRef] [PubMed]
- Wong, M.; Peyton, J.M.; Shields, T.M.; Curriero, F.C.; Gudzune, K.A. Comparing the accuracy of food outlet datasets in an urban environment. Geospat. Health 2017, 12. [Google Scholar] [CrossRef] [PubMed]
- Díez, J.; Cebrecos, A.; Galán, I.; Pérez-Freixo, H.; Franco, M.; Bilal, U. Assessing the Retail food environment in Madrid: An evaluation of administrative data against ground truthing. Int. J. Env. Res. Public Health 2019, 16, 3538. [Google Scholar] [CrossRef] [PubMed]
- Rossen, L.M.; Pollack, K.M.; Curriero, F.C. Verification of retail food outlet location data from a local health department using ground-truthing and remote-sensing technology: Assessing differences by neighborhood characteristics. Health Place 2012, 18, 956–962. [Google Scholar] [CrossRef] [PubMed]
- Coakley, H.L.; Steeves, E.A.; Jones-Smith, J.C.; Hopkins, L.; Braunstein, N.; Mui, Y.; Gittelsohn, J. Where do low-income children get food? Combining ground-truthing and technology to improve accuracy in establishing children's food purchasing behaviors. J. Hunger Env. Nutr. 2014, 9, 418–430. [Google Scholar] [CrossRef] [PubMed]
- Hosler, A.S.; Dharssi, A. Identifying retail food stores to evaluate the food environment. Am. J. Prev. Med. 2010, 39, 41–44. [Google Scholar] [CrossRef] [PubMed]
- Mui, Y.; Gittelsohn, J.; Jones-Smith, J.C. Longitudinal associations between change in neighborhood social disorder and change in food swamps in an urban setting. J. Urban Health 2017, 94, 75–86. [Google Scholar] [CrossRef] [PubMed]
- Rundle, A.; Neckerman, K.M.; Freeman, L.; Lovasi, G.S.; Purciel, M.; Quinn, J.; Richards, C.; Sircar, N.; Weiss, C. Neighborhood food environment and walkability predict obesity in New York City. Env. Health Perspect. 2018, 117, 442–449. [Google Scholar] [CrossRef] [PubMed]
- Python Software Foundation. Available online: http://www.python.org.
- ArcGIS Desktop: Release 10.4; Environmental Systems Research Institute (Esri): Redlands, CA, USA, 2016.
- Honeycutt, S.; Davis, E.; Clawson, M.; Glanz, K. Training for and dissemination of the Nutrition Environment Measures Surveys (NEMS). Prev. Chronic Dis. 2010, 7, A126. Available online: https://pmc.ncbi.nlm.nih.gov/articles/PMC2995598/. [PubMed]
- Franco, M.; Diez Roux, A.V.; Glass, T.A.; Caballero, B.; Brancati, F.L. Neighborhood characteristics and availability of healthy foods in Baltimore. Am. J. Prev. Med. 2008, 35, 561–567. [Google Scholar] [CrossRef] [PubMed]
Figure 1.
Key Stakeholder Survey Questions.
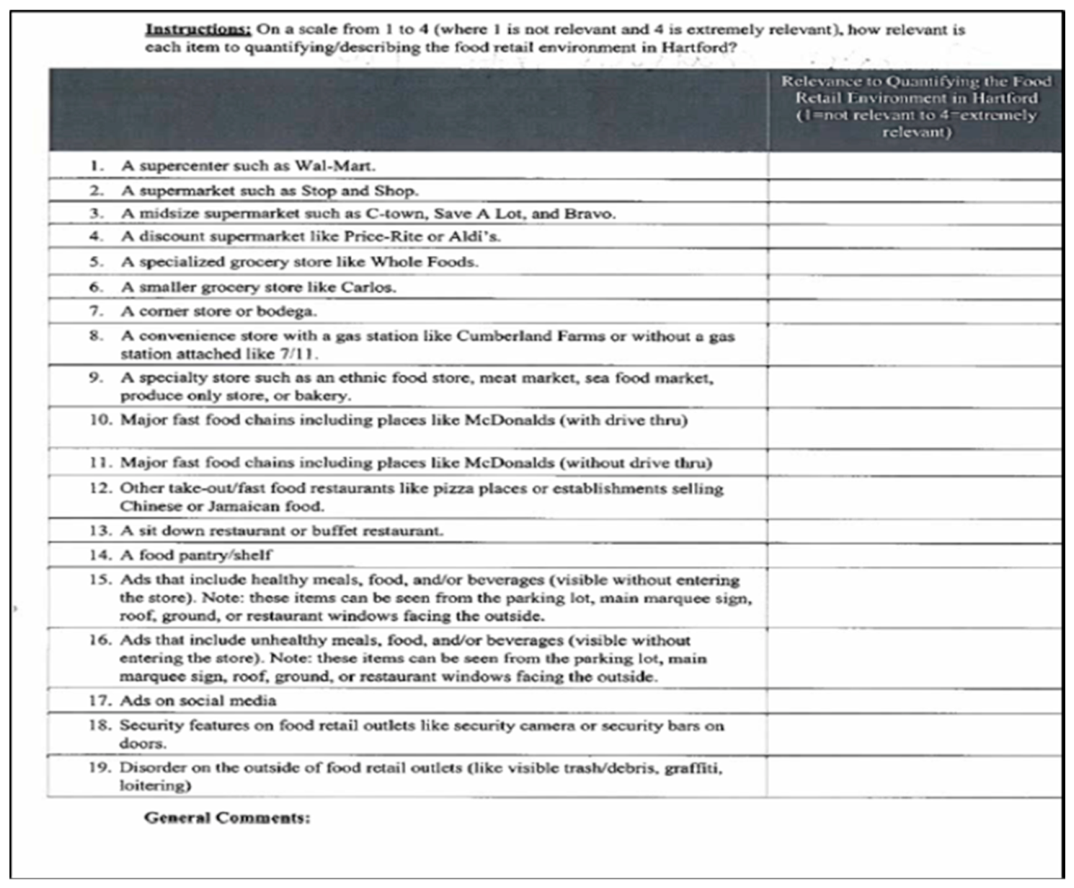
Figure 2.
Food Swamp Index in North Hartford Promise Zone (NHPZ) and Comparison Sites Using Audit and NETS Data. Note: Side-by-side choropleth maps of the Food Swamp Index (FSI) across the study area block groups, comparing values derived from the secondary data (NETS, left panel) and the primary data (food store audit, right panel). The FSI was classified into two categories: low to moderate (0.00–74.99) and high (75.00–100.00). Block groups with no food outlets identified by the respective data source are displayed in gray. Inset map shows the location of Promise Zone sites (green), non-Promise Zone sites (blue), and non-study areas within Hartford.
Figure 2.
Food Swamp Index in North Hartford Promise Zone (NHPZ) and Comparison Sites Using Audit and NETS Data. Note: Side-by-side choropleth maps of the Food Swamp Index (FSI) across the study area block groups, comparing values derived from the secondary data (NETS, left panel) and the primary data (food store audit, right panel). The FSI was classified into two categories: low to moderate (0.00–74.99) and high (75.00–100.00). Block groups with no food outlets identified by the respective data source are displayed in gray. Inset map shows the location of Promise Zone sites (green), non-Promise Zone sites (blue), and non-study areas within Hartford.
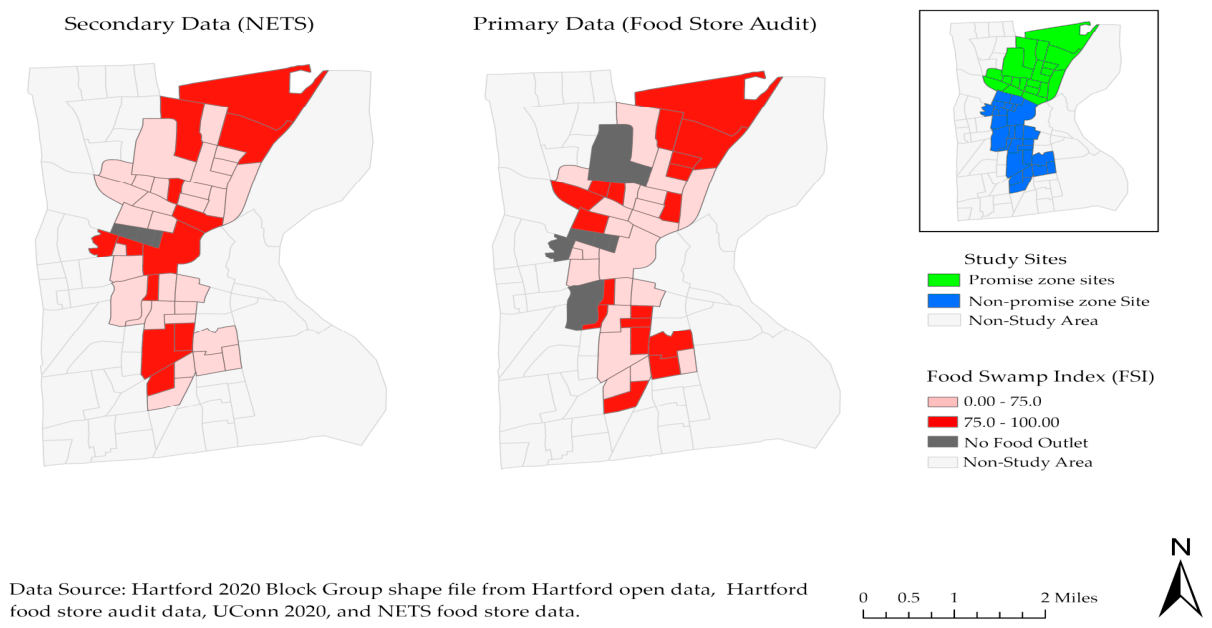
Figure 3.
Bivariate Map of Food Swamp Index (FSI) by Data Source Across Hartford Study Block Groups. Bivariate choropleth map displaying the spatial concordance between NET-derived and audit-derived Food Swamp Index (FSI) scores across Hartford study block groups. Dark purple indicates agreement on high food swamp conditions; lavender indicates agreement on low conditions. Pink block groups indicate higher NET FSI relative to audit; cyan indicates higher audit FSI relative to NET. Grey block groups had no food outlets identified by one or both data sources.
Figure 3.
Bivariate Map of Food Swamp Index (FSI) by Data Source Across Hartford Study Block Groups. Bivariate choropleth map displaying the spatial concordance between NET-derived and audit-derived Food Swamp Index (FSI) scores across Hartford study block groups. Dark purple indicates agreement on high food swamp conditions; lavender indicates agreement on low conditions. Pink block groups indicate higher NET FSI relative to audit; cyan indicates higher audit FSI relative to NET. Grey block groups had no food outlets identified by one or both data sources.
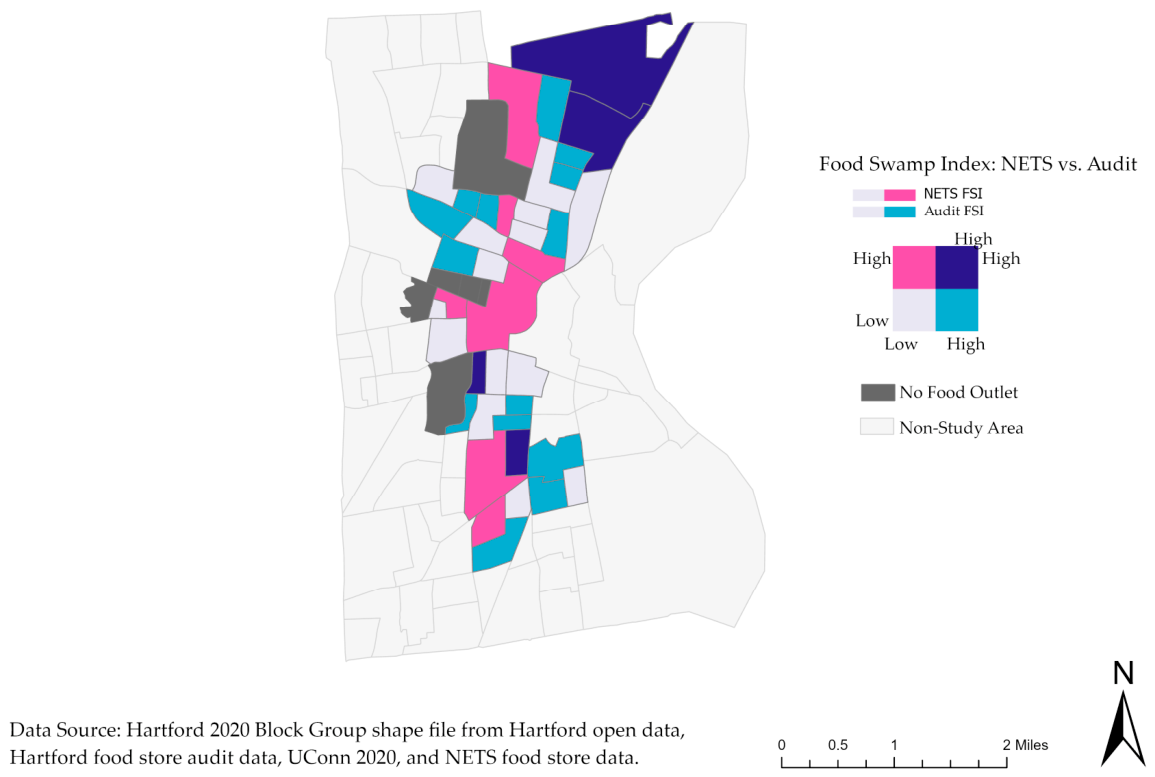
Table 1.
Summary of Key Demographic Characteristics of the Study Sites.
| Neighborhood |
Total Population |
Percent Hispanic | Percent White | Percent Black | Other Races | Poverty Rate | Low-Income Rate |
| Asylum Hill | 10,005 | 27 | 13 | 48 | 13 | 28 | 57 |
| Barry Square | 15,702 | 60 | 16 | 17 | 8 | 32 | 63 |
| Clay Arsenal | 7,287 | 61 | 2 | 35 | 2 | 43 | 78 |
| Frog Hollow | 8,393 | 66 | 10 | 21 | 3 | 34 | 59 |
| Northeast | 10,919 | 28 | 2 | 68 | 2 | 37 | 63 |
| Upper Albany | 6,529 | 18 | 1 | 76 | 4 | 32 | 58 |
Data source: American Community Survey 2018 [43].
Table 2.
Food Outlet Category by Data Type.
| Primary FS-EAT Tool Data | Secondary NETS Data (2020) | ||||
| Healthy Outlets | Unhealthy Outlets | Intermediate Outlets | Healthy Outlets | Unhealthy Outlets | Intermediate Outlets |
| Supermarket | Convenience store | Mixed specialty | F&V store (NAICS 445230) | Convenience store (NAICS 445120) | Full-service restaurant (NAICS 722511) |
| Supercenter | Convenience with gas station | Full-service restaurant and Healthy Ethnic Carryout | Meat shop (NAICS 445210) | Convenience with gas station (NAICS 447110) | Mixed specialty (NAICS 445299) |
| Midsize grocery store | Limited-service restaurant | Seafood and fish shop (NAICS 445220) | Limited-service restaurant (NAICS 722513) | ||
| Small-size grocery store | Unhealthy specialty | Supermarkets and Other Grocery (NAICS 44511) | Unhealthy specialty stores (NAICS 722515) | ||
| Ethnic store | Dollar Store | Supercenter (NAICS 452910) | |||
| Specialized store | Corner store | ||||
| Discount store | |||||
| Fast Food Restaurant | |||||
| Pharmacy | |||||
Table 3.
Counts of Food Outlet by Store Category.
| Store category | Primary data | Secondary data |
| Healthy food outlets | 38 | 88 |
| Unhealthy food outlets | 69 | 61 |
| Intermediate food outlets | 50 | 87 |
| Total | 157 | 236 |
Table 4.
Concordance Between FS-EAT Audit (Ground Truth) and NETS 2020 Data.
| Match Status | Descriptions | Count | % of Audit | % of NET | Classification |
| Matched (TP) | In both audit and NETS | 107 | 68.2% | 45.3% | True Positive |
| In audit only (FN) | On ground, not in NETS | 50 | 31.8% | — | False Negative |
| In NETS only (FP) | In NETS, not on ground | 129 | — | 54.7% | False Positive |
| Total Audit (active) | 157 | 100% | |||
| Total NETS 2020 | 236 | 100% |
Note.TP = True Positive; FN = False Negative; FP = False Positive. Matching was performed using business name similarity (threshold ≥ 0.6) combined with geographic proximity (≤ 100m).
Table 5.
Extended Matching of Food Outlets Between Audit and NETS 2020 Data.
| Match Category | Criteria | Count | % of Audit | Cumulative % |
| Likely Match | Name ≥ 0.6 + ≤ 100m | 5 | 3.2% | 3.2% |
| Proximity Match | ≤ 50m + Name ≥ 0.4 | 12 | 7.6% | 10.8% |
| Name Match (distant) | Name ≥ 0.8, > 100m | 37 | 23.6% | 34.4% |
| Possible Match | Name ≥ 0.6, weaker | 53 | 33.8% | 68.2% |
| No Match | Below thresholds | 50 | 31.8% | 100% |
| Total Matched | 107 | 68.2% | ||
| Not in Audit Data | NET 2020 only | 129 |
Table 6.
Sensitivity and PPV of FS-EAT Audit Data Relative to NETS 2020 Business List by Store Type.
Table 6.
Sensitivity and PPV of FS-EAT Audit Data Relative to NETS 2020 Business List by Store Type.
| Store Type | FS-EAT (n) | NETS (n) | TP | FN | FP | Sensitivity | PPV |
| Convenience Store | 42 | 39 | 29 | 13 | 10 | 74.4% | 69.0% |
| Full-Service Restaurant | 39 | 83 | 33 | 6 | 50 | 39.8% | 84.6% |
| Grocery | 38 | 73 | 33 | 5 | 40 | 45.2% | 86.8% |
| Limited-Service Restaurant | 26 | 24 | 7 | 19 | 17 | 29.2% | 26.9% |
| Specialty Food | 12 | 17 | 5 | 7 | 12 | 29.4% | 41.7% |
| Overall | 157 | 236 | 107 | 50 | 129 | 45.3% | 68.2% |
Table 7.
Summary Statistics of Food Swamp Scores from the Audit and NET Data.
| Data | Mean | SD | Median | IQR | |
| Food Swamp Index (FSI) Audit NET |
74.8 63.8 |
29.6 28.5 |
75.0 60.3 |
0-100 0-100 |
|
| Modified Retail Food Environment (mRFEI) Audit NET |
25.2 38.7 |
29.6 27.0 |
25.0 36.0 |
0-100 0-100 |
|
| Physical Food Environment Index (PFEI) Audit NET |
46.8 25.1 |
35.0 19.9 |
50.0 25.0 |
0-100 0-80 |
|
Table 8.
Cross-Tabulation of Food Swamp Classification Between Audit and NETS 2020 Data (n = 39).
| FS-EAT Audit: Food Swamp | FS-EAT Audit: Non-Food Swamp | |
| NETS: Food Swamp | 8 (20.5%) | 6 (15.4%) |
| NETS: Non-Food Swamp | 15 (38.5%) | 10 (25.6%) |
| Total | 23 (59.0%) | 16 (41.0%) |
Note.Green cells indicate agreement between the two data sources; red cells indicate disagreement. The largest source of disagreement was block groups classified as Non-Food Swamp by the NETS data but as Food Swamp by the audit (15 block groups, 38.5%).
Table 9.
Correlation and Agreement Statistics Between Block-Group-Level Audit and NETS 2020 Food Swamp Measures (n = 39).
Table 9.
Correlation and Agreement Statistics Between Block-Group-Level Audit and NETS 2020 Food Swamp Measures (n = 39).
| Statistic | Estimate | p-value | Interpretation |
| Food Swamp Index (FSI) | |||
| Spearman’s ρ | −0.19 | .2452 | Weak negative |
| Cohen’s κ (FSI ≥ 74.82) | −0.03 | .5691 | Less than chance |
| ICC (2,1) absolute agreement | −0.18 | .8830 | Poor |
| Wilcoxon Signed-Rank | z = 1.878 | .0603 | Not significant |
| Modified Retail Food Environment Index (mRFEI) | |||
| Spearman’s ρ | −0.19 | .2452 | Weak negative |
| Cohen’s κ (mRFEI ≥ 25.18) | −0.03 | .5691 | Less than chance |
| ICC(2,1) absolute agreement | −0.18 | .8830 | Poor |
| Wilcoxon Signed-Rank | z = −1.892 | .0583 | Not significant |
| Physical Food Environment Index (PFEI) | |||
| Spearman’s ρ | −0.18 | .2852 | Weak negative |
| Cohen’s κ (PFEI ≥ 46.79) | 0.09 | .2062 | Slight |
| ICC (2,1) absolute agreement | −0.11 | .7980 | Poor |
| Wilcoxon Signed-Rank | z = 2.656 | .0070* | Significant |
| Healthy food outlets | |||
| Spearman’s ρ | 0.09 | .6014 | Negligible |
| ICC (2,1) absolute agreement | 0.20 | .0520 | Poor to fair |
| Wilcoxon Signed-Rank | z = −3.501 | .0003* | Significant |
| Unhealthy food outlets | |||
| Spearman’s ρ | 0.16 | .3200 | Weak positive |
| ICC (2,1) absolute agreement | 0.11 | .2620 | Poor |
| Wilcoxon Signed-Rank | z = 0.188 | .8384 | Not significant |
| Intermediate food outlets | |||
| Spearman’s ρ | 0.39 | .0153* | Moderate positive |
| ICC (2,1) absolute agreement | 0.43 | .0010* | Moderate |
| Wilcoxon Signed-Rank | z = −2.915 | .0029* | Significant |
Note.* = significant at p < .05. ρ = Spearman’s rho; κ = Cohen’s kappa; ICC = intraclass correlation coefficient (two-way random, single measures, absolute agreement). Cohen’s kappa classification thresholds based on audit-derived means for each index. Wilcoxon signed-rank test compares paired scores between audit and NET data (exact p-values reported). Cohen’s kappa was computed only for composite indices, not for store category counts. FSI and mRFEI produced identical kappa, Spearman, and ICC values because the two indices are mathematically complementary (FSI = 100 − mRFEI).
Disclaimer/Publisher’s Note: The statements, opinions and data contained in all publications are solely those of the individual author(s) and contributor(s) and not of MDPI and/or the editor(s). MDPI and/or the editor(s) disclaim responsibility for any injury to people or property resulting from any ideas, methods, instructions or products referred to in the content. |
© 2026 by the authors. Licensee MDPI, Basel, Switzerland. This article is an open access article distributed under the terms and conditions of the Creative Commons Attribution (CC BY) license (http://creativecommons.org/licenses/by/4.0/).
Copyright: This open access article is published under a Creative Commons CC BY 4.0 license, which permit the free download, distribution, and reuse, provided that the author and preprint are cited in any reuse.


