

Submitted:
11 August 2026
Posted:
12 August 2026
You are already at the latest version
Abstract
Background:
Long-term health conditions such as diabetes and heart disease are rising quickly, especially in South Asia, and poor diet is a major contributor. Existing dietary tracking apps are mostly built for Western food and struggle with mixed, culturally diverse dishes such as those found in Pakistani cuisine.
Objective:
This study aimed to build a machine learning-based system that can recognise Pakistani dishes, estimate portion sizes, and calculate their nutritional value.
Methods:
We developed a multi-stage automated dietary assessment pipeline for Pakistani cuisine using a newly compiled, multi-source dataset spanning 85 dish classes across 10 categories. Following data cleaning, class balancing, and targeted augmentation, multiple deep learning architectures were evaluated for classification and segmentation tasks. Specifically, ResNet-50, MobileNetV2, and YOLOv8 were used for food recognition, while YOLOv8-Seg and Mask R-CNN provided pixel-level segmentation for downstream portion and nutrient estimation. All models were optimized using transfer learning and evaluated on standard classification and mask-quality metrics. At the end, usability testing of mobile application was conducted.
Results: A dataset of Pakistani food images across ten categories and 85 dishes was collected from multiple sources and used to train and compare several deep learning models for food classification and segmentation. Portion size was estimated using a segmentation and depth-based approach that does not need any reference object in the photo, and nutritional values were calculated using standardised recipes matched against established food databases. The models were then combined into a mobile application and tested with users for real-world usability. Among the classification models, a YOLO-based architecture performed best, and a related YOLO model gave the most practical results for segmentation, offering a good balance between accuracy and speed suited to real-time use on a phone. Portion size estimates were reasonably close to actual measured values, and early usability testing showed that users found the app easy to use, although some improvements were suggested.
Conclusion:
Overall, this work shows that a culturally adapted, AI-based dietary assessment system for Pakistani food is achievable, and it lays the groundwork for further development, particularly around reducing processing demands and improving the reliability of depth-based portion estimation.
Keywords:
computer vision
; machine learning
; nutrition assessment
; public health
1. Introduction
The global prevalence of long-term conditions such as diabetes, hypertension, cardiovascular diseases and chronic pain is rising rapidly, particularly in low- and middle-income countries. In these countries, healthcare infrastructure is over-burdened and fragmented and rapid urbanization, and lifestyle changes have worsened health outcomes [1]. Over three-quarters of deaths from long-term conditions occur in these regions, and South Asian and Black African communities living in high-income countries show similar trends due to genetic risk, lifestyle factors, and unequal healthcare access [2,3,4]. Among the lifestyle factors, poor dietary habits contribute significantly to the development and progression of long-term conditions, underscoring the need for scalable strategies to promote healthy eating and nutritional awareness [5].
Dietary assessment tools are mainstay of the current strategies to monitor and improve dietary intake. Traditional methods, such as food diaries and 24-hour recalls, can support behavior change but are often burdensome, time-consuming, and prone to inaccuracy [6,7,8]. They also fail to capture culturally specific foods and mixed dishes, reducing accuracy in nutrient and calorie estimation, particularly for South Asian diets [9,10,11].
Recent research has explored AI-driven approaches for automated dietary assessment, offering a promising alternative for automated dietary tracking via consumer devices [12]. These systems are well established for Western diets, with commercial nutrition apps widely being evaluated [13]. However, research on South Asian cuisine remains largely at the prototype stage and does not capture food and culinary diversity among South Asian countries [14].
Consequently, many AI-based systems misidentify mixed or traditional South Asian [i.e., Pakistani] dishes, providing inaccurate nutrient estimates and culturally irrelevant advice [15,16]. Existing state-of-the-art systems [e.g., goFOOD, FoodAI] rely on structured meals and Western datasets. This limits their performance in mixed-dish South Asian meals, where visual overlap between ingredients and high intra-dish variability are common. Specific technical limitations include the lack of diverse annotated datasets, difficulties in segmenting mixed foods, and challenges in estimating portion sizes for complex dishes such as curries, rice meals, and flatbreads without physical reference objects [17,18,19].
Despite these advances, there remains a lack of end-to-end, culturally adaptive dietary assessment systems capable of accurately recognizing, segmenting, and estimating portions of complex mixed dishes in South Asian Pakistani cuisine. Therefore, the aim of this study was to develop a machine learning-based system for accurate nutrient profiling of Pakistani cuisine. We achieved this by following objectives:
- Set up a culturally specific, multi-sourced labeled dataset of Pakistani cuisine;
- Develop a hybrid segmentation and monocular depth-based portion estimation pipeline that does not require physical reference objects;
- Develop and test an end-to-end machine learning system integrating image classification, instance segmentation, monocular depth estimation, and nutritional computation into a unified mobile pipeline;
- Conduct preliminary validation of both system accuracy and real-world usability.
2. Methodology
2.1. Overview of the Proposed System
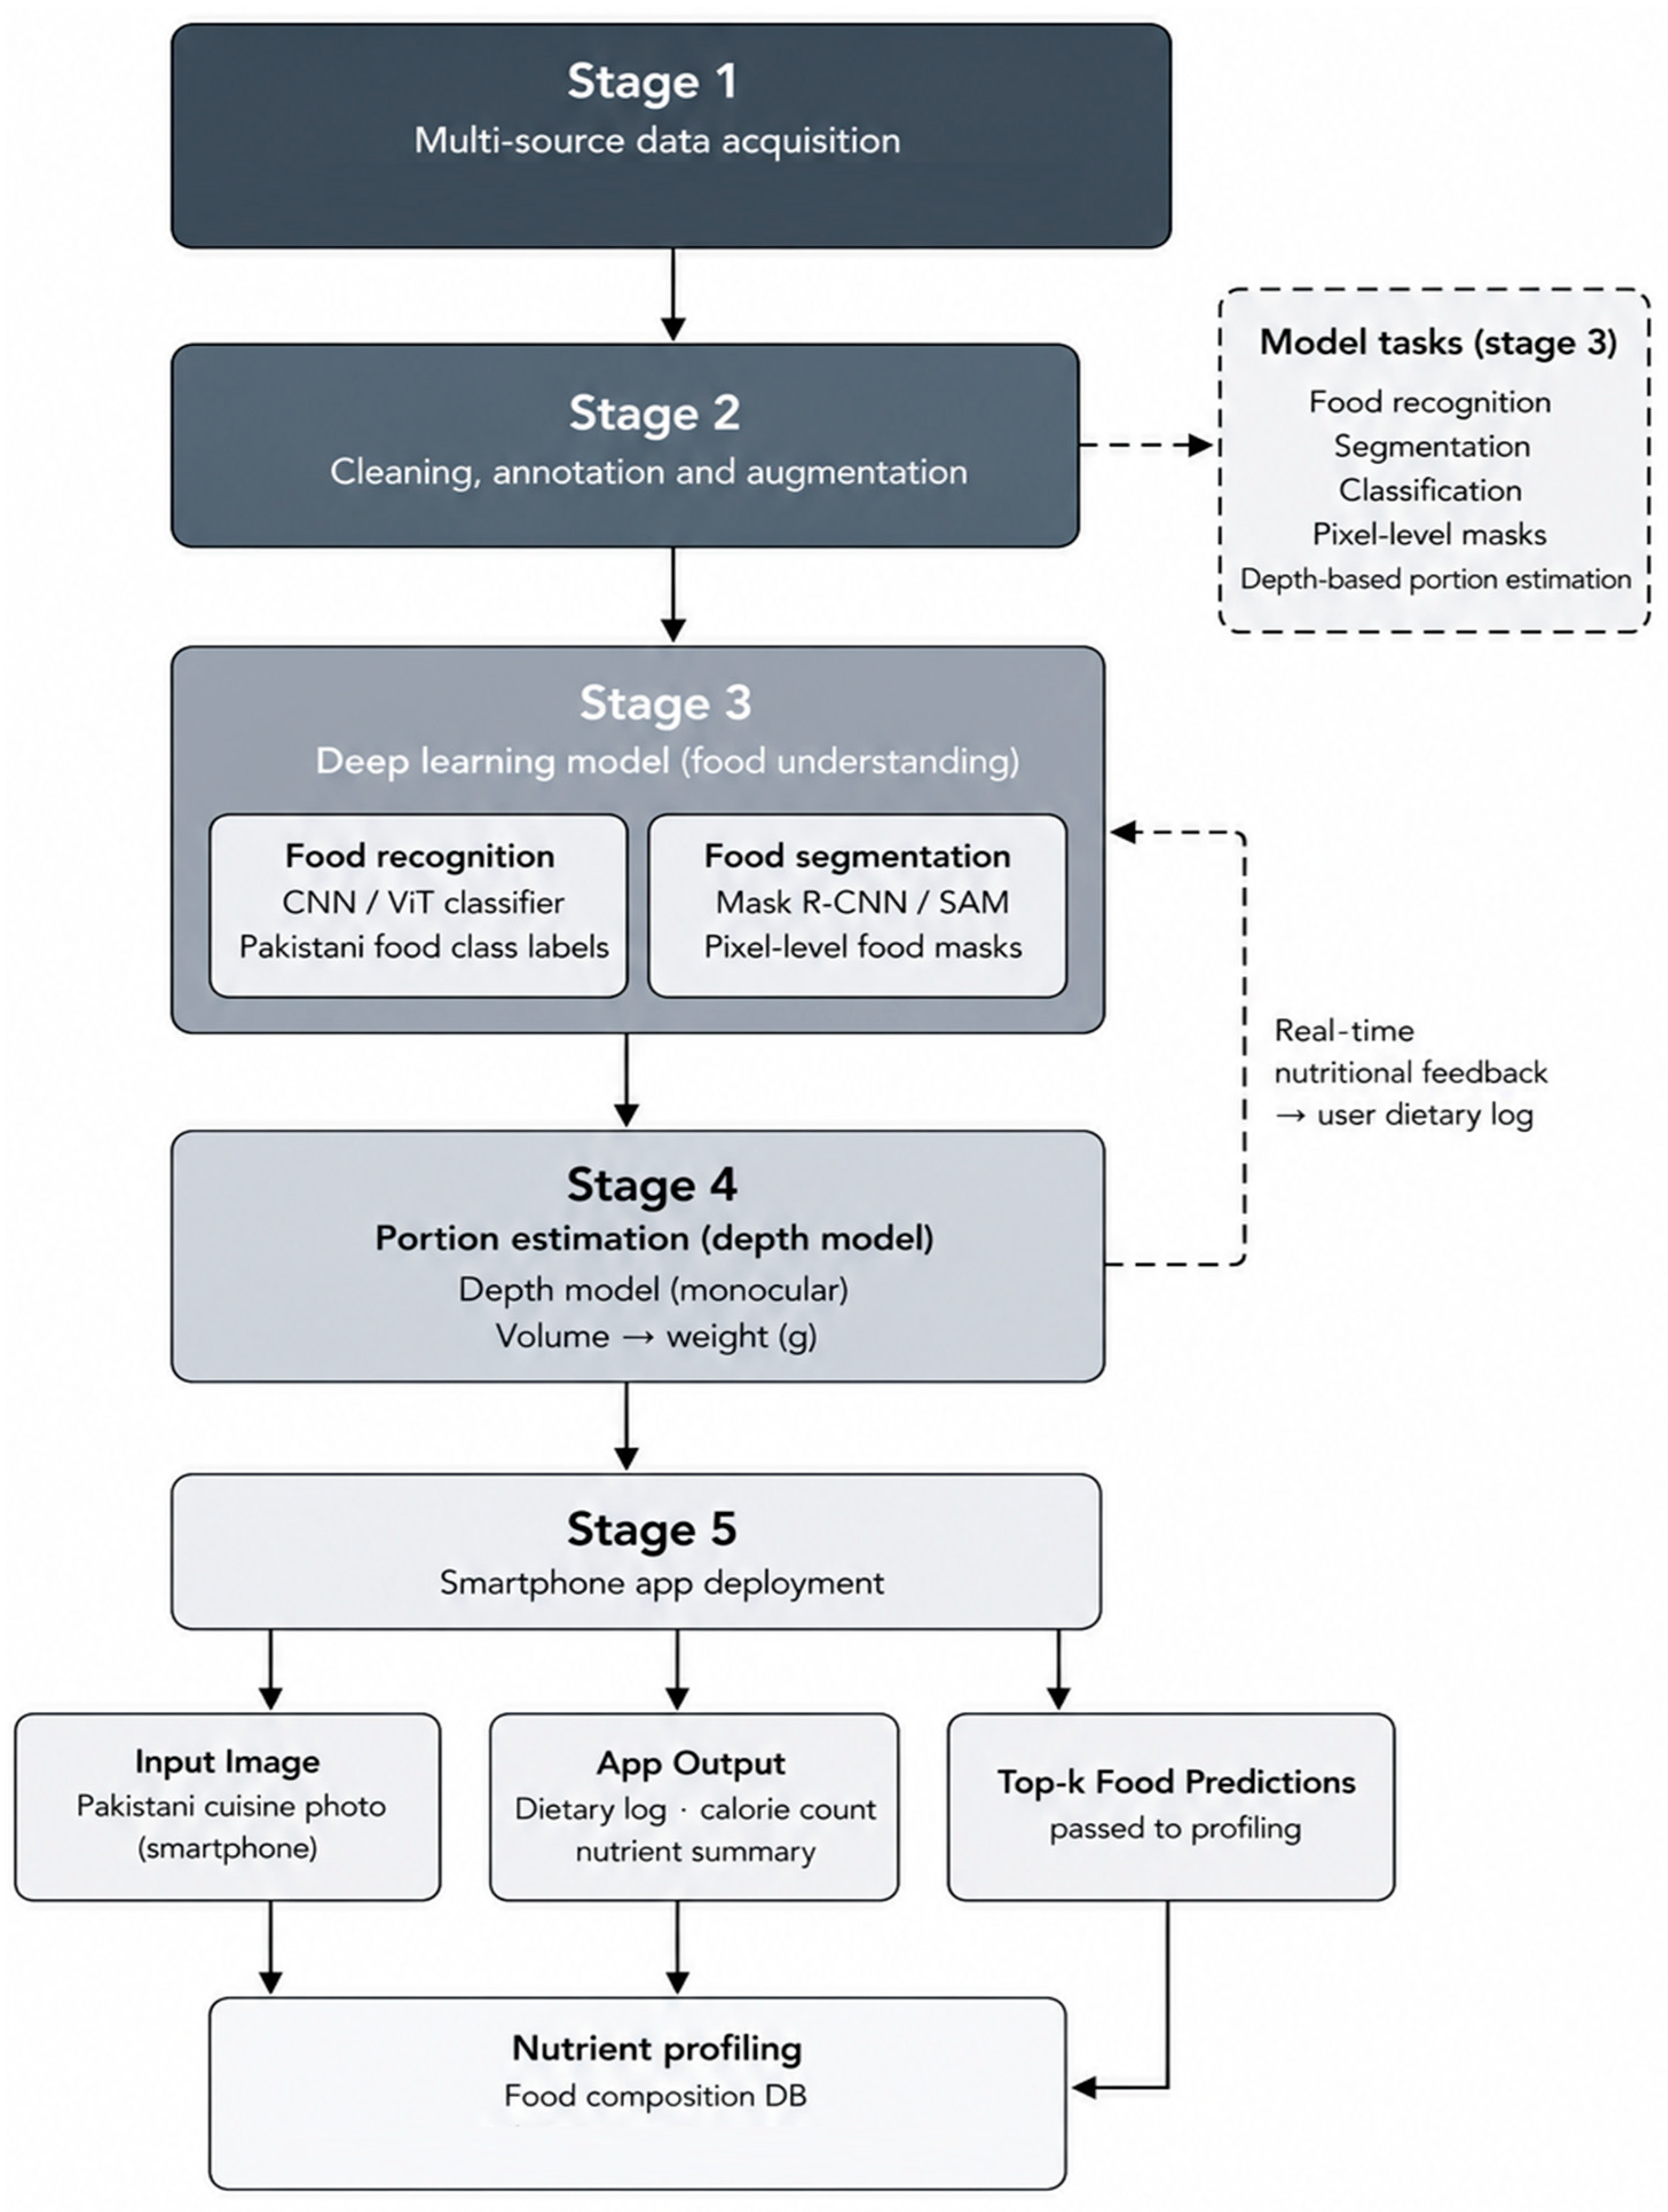
This study proposes a multi-stage pipeline for automated dietary assessment of Pakistani cuisine. The proposed pipeline consists of the following stages:
[i] multi-source dataset construction from publicly available images, e.g., cafeteria captures, and user-contributed photographs;
[ii] data cleaning, annotation, and class balancing with targeted augmentation;
[iii] training and evaluation of deep learning models for food recognition, segmentation, and depth-based portion estimation;
[iv] integration of deep learning models into a nutrient profiling module based on standardized food composition data; and
[v] deployment as a smartphone application for real-time dietary analysis.
Figure 1.
Flow diagram, showing linkages between different stages.
2.2. Dataset Acquisition
A multi-source image acquisition strategy was adopted, including web scraping and YouTube thumbnails, crowd-sourced contributions, and publicly available external datasets [see supplementary materials for details – dataset acquisition]. Using this approach, we constructed a balanced dataset of Pakistani food images organized into ten semantically distinct categories, capturing the diversity of Pakistani cuisine, as summarized in Table 1. The dataset is further divided into 85 fine-grained dish classes, forming the basis for dataset construction, annotation, and subsequent model training and evaluation. A stratified split of 70% for training, 15% for validation, and 15% for testing was applied to preserve class distribution, better generalization or un-biased evaluation.
2.3. Data Preprocessing and Quality Assurance
The dataset was preprocessed to ensure data quality using established practices in food recognition systems [20], including removal of duplicate and low-quality images [e.g., blurred or heavily occluded samples], as well as resizing and normalizing model input requirements. Class labels were manually verified to ensure annotation accuracy prior to model training.
To improve model robustness and generalizability, data augmentation techniques were applied exclusively to the training set. These transformations included random rotation within ±15°, horizontal flipping with a probability of 0.5, brightness and contrast adjustments within ±20%, Gaussian noise injection, and random scaling within a range of 0.8–1.2. Augmentation parameters were selected conservatively to preserve the structural characteristics of food items. No augmentation was applied to validation or test sets to prevent data leakage.
To ensure dataset reliability and support robust model training, a series of validation and quality assurance measures were implemented. The distribution of images across the ten food categories was analyzed to identify class imbalance [21]. Initial analysis revealed that certain categories, such as rice dishes and meat curries, were overrepresented, while others, including desserts and lentil-based dishes, were underrepresented. To address this imbalance, a combination of controlled oversampling of minority classes and targeted data augmentation was applied.
A combination of controlled oversampling of minority classes and targeted data augmentation was applied by maintaining the category distribution within a controlled range [8-15% of the dataset]. Oversampling helped reduce class bias for fair model training thereby improving generalization.
2.4. Model Selection and Architecture
To address the variability in food appearance, texture, and presentation in Pakistani cuisine, multiple deep learning architectures were selected and evaluated based on their complementary strengths. The selection criteria focused on three key aspects, including classification accuracy, computational efficiency, and suitability for mobile deployment.
For image classification, ResNet-50 [22] was employed due to its residual learning framework, which enables deep feature extraction while mitigating vanishing gradient issues. Transfer learning using ImageNet-pretrained weights [23] facilitated adaptation to domain-specific food features. MobileNetV2 [24] was selected as a lightweight alternative optimized for mobile environments, utilizing depth wise, separable convolutions to reduce computational complexity while maintaining competitive performance.
For real-time classification, YOLOv8 [classification variant] [25] was included due to its low latency and strong performance in single-stage inference scenarios.
For segmentation tasks, YOLOv8-Seg [25] was used to provide pixel-level localization of food items, which is essential for portion estimation. Additionally, Mask R-CNN [26] was employed as a benchmark segmentation model, leveraging region-based detection and a parallel mask prediction branch for precise boundary extraction. Transfer learning with COCO-pretrained weights [27] was applied to improve segmentation performance.
2.5. Model Training and Evaluation Matrix
All models were implemented in PyTorch [version 2.0+] and trained using the Ultralytics YOLOv8 framework. Training was conducted using NVIDIA Tesla P100 and T4 GPUs.
Input preprocessing varied based on model architecture. Images were resized to 224 × 224 pixels for ResNet-50 and MobileNetV2, while YOLO-based models utilized multi-scale inputs ranging from 320 to 640 pixels to improve generalization.
Training was performed for 50 epochs across all models using the AdamW optimizer [27] with an initial learning rate of 1 × 10⁻⁴. Learning rate scheduling was implemented using ReduceLROnPlateau [28] with a patience of 5 epochs and a reduction factor of 0.5. A weight decay of 1 × 10⁻⁵ was applied to prevent overfitting, and dropout with a rate of 0.3 was used in fully connected layers of classification models. Early stopping with a patience of 10 epochs was employed based on validation loss.
Batch sizes were set to 32 and 16 for classification and segmentation models respectively, due to higher memory requirements. Cross-entropy loss was used for classification tasks, while segmentation models employed a combination of binary cross-entropy and Dice loss to improve mask accuracy.
Model performance was evaluated using standard metrics for both classification and segmentation tasks. For classification models, accuracy, precision, recall, and F1-score were computed, along with confusion matrix analysis to identify misclassification patterns among visually similar dishes.
For segmentation models, Intersection over Union [IoU] and mean Average Precision [mAP] were calculated at IoU thresholds of 0.5 and 0.75 to assess mask quality and boundary precision. These metrics enabled consistent comparison across models and supported the selection of the best-performing architectures for downstream tasks.
2.6. Segmentation-Based Portion and Nutrition Estimation
2.6.1. Segmentation Process
Image segmentation was performed for all food categories using the Roboflow platform [29], which provided annotation and dataset management capabilities for preparing segmentation masks. Segmentation annotations were created as pixel-level masks using polygon-based labeling to ensure precise boundary representation of food items. To accommodate dataset size and organizational constraints, the annotation process was distributed across multiple dataset partitions while maintaining a consistent labeling schema across all categories.
Annotated datasets were exported in both YOLO and COCO formats to support compatibility with different segmentation models. The YOLO format was used for training the YOLOv8-based segmentation model, while the COCO format was utilized for training and evaluation with the Mask R-CNN architecture.
Segmentation performance was evaluated using standard metrics including Mean Intersection over Union [mIoU], Dice coefficient, and mean Average Precision [mAP]. mIoU measures the average overlap between predicted and ground-truth masks, Dice coefficient evaluates the similarity between two segmentations, and mAP assesses detection and segmentation accuracy across different confidence thresholds.
2.6.2. Portion Estimation Methodology
Accurate portion estimation is a key methodological challenge in image-based dietary assessment, particularly for mixed and visually complex dishes [16]. To address this, a segmentation-driven approach combined with monocular depth estimation was employed to estimate food volume and mass from a single RGB image without requiring external reference objects. Details about portion estimation methodology are reported in supplementary materials [see portion estimation methodology].
To evaluate the accuracy of the proposed portion estimation method, a validation dataset comprising 200 food images was collected. The ground-truth mass was measured using a digital kitchen scale under controlled conditions.
The estimated mass obtained from the segmentation and depth-based pipeline was compared against the corresponding ground-truth measurements. Quantitative evaluation was performed using standard regression metrics, including Mean Absolute Error [MAE] and Root Mean Square Error [RMSE], defined as:
where Mipred and Mitrue represent the predicted and actual mass values for the i-th sample, respectively, and N denotes the total number of validation samples.
These metrics provided an objective assessment of the deviation between predicted and actual portion sizes, enabling evaluation of the reliability and practical applicability of the proposed estimation approach.
2.6.3. Nutritional Profiling Methodology
For the nutritional profiling of 85 commonly consumed Pakistani and South Asian dishes, we focused on portion-based estimation of caloric and macronutrient intake, supporting automated dietary assessment and meal planning within the overall system pipeline.
For each dish, a standardized recipe was established based on commonly reported proportions in South Asian culinary literature [30]. Ingredient quantities were normalized to represent a 100g serving of the finished dish. Nutrient calculations were based on the cooked weight of the final dish. Changes in food weight resulting from moisture gain or loss during cooking were incorporated into recipe standardization procedures to ensure that nutrient values reflected the edible cooked product. Ingredient-level nutritional data were obtained from the USDA FoodData Central database [31]. USDA FoodData Central was selected because of its comprehensive nutrient coverage and standardized food composition information. For ingredients commonly consumed in Pakistan, nutrient values were cross-checked with South Asian food composition references where available to ensure reasonable comparability. Raw ingredient forms were used wherever available, unless only processed alternatives existed [e.g., canned chickpeas]. For Pakistani-specific ingredients without direct matches in the USDA database [e.g., ajwain, atta], the closest compositionally equivalent entries were selected.
All cooking components, including oils, ghee, butter, and spices, were incorporated using their corresponding USDA nutritional profiles. Cooking water was excluded from energy calculations but accounted for in nutrient dilution to maintain realistic composition of the final dish.
To ensure the accuracy and reliability of the nutritional profiles, a cross-validation strategy was employed using two established dietary analysis platforms, including ReciPal [32] and FoodWorks Online [33]. ReciPal, a cloud-based recipe analysis system utilizing the USDA database, was used to compute aggregate nutritional values from standardized recipes and generate consistent per-100 g nutrient profiles. FoodWorks Online, a professional dietary analysis software, was used for secondary validation, including detailed micronutrient estimation [e.g., calcium, iron, folate, and vitamin C], assessment of recipe variations [such as the use of ghee versus vegetable oil], and benchmarking against Pakistan-specific recommended dietary allowances [34]. This dual-platform validation approach ensured consistency, improved accuracy, and enhanced the reliability of the nutritional profiles derived across all food categories. However, the present study primarily focused on energy and macronutrient estimation, while micronutrient outputs were generated for validation purposes and will be explored in future work. Details of the methods for nutrient profiling are reported in supplementary materials [see portion-based nutritional computation methodology].
2.7. Model Integration into Mobile Application
To enable real-time dietary assessment, the trained models were deployed across both server-side and mobile environments, ensuring a balance between computational efficiency and user accessibility.
High-performance models, including ResNet-50 and Mask R-CNN, were deployed on the server side using RESTful APIs implemented with FastAPI [35]. This setup allowed computationally intensive inference tasks to be executed remotely, supporting scalable and efficient processing for web-based and connected mobile applications.
For on-device inference, lightweight models such as MobileNetV2 and YOLOv8n were optimized and exported to TensorFlow Lite [TFLite] [36] and ONNX formats [37]. These models were integrated into the mobile application to enable low-latency predictions without requiring continuous internet connectivity, thereby supporting offline functionality and improving user experience.
A cross-platform mobile application was developed using React Native, integrating modules for food recognition, segmentation, portion estimation, and nutritional analysis. The application provided real-time feedback to users, presenting estimated calorie and macronutrient information based on captured meal images. We also enhanced the system’s adaptability capabilities, which are outlined in the supplementary materials [see continuous learning and system evolution].
2.8. Usability Testing
To evaluate the usability of the proposed mobile application, a task-based testing approach was employed with users, combined with qualitative feedback and the System Usability Scale [SUS] for quantitative assessment [38,39]. Usability scores were interpreted using SUS score ranges, where above 80.3 is excellent usability and below 51 is poor usability. Details of the methodology are presented in supplementary materials [usability testing method].
3. Findings
The finding section outlines the experimental results of the proposed nutrient profiling system. We first present dataset acquisition and augmentation, followed by performance evaluation of classification, segmentation and portion estimation models. Lastly, we conclude it with the usability testing findings.
3.1. Dataset Acquisition and Expansion
A total of approximately 20,000 raw images were acquired from three primary sources. Web scraping and YouTube thumbnails, crowdsourcing and external datasets contributed approximately 80% [~16,000], 10% [~2,000], and 10% [~2,000] of images, respectively. After data cleaning, pixel-level annotations and applying augmentation techniques, the dataset expanded to ~30,000 images, providing a more robust foundation for model training.
3.2. Model Selection, Training, and Validation
3.2.1. Performance of Classification Models
Multiple deep learning models were evaluated. YOLOv8 achieved the highest classification accuracy [~79%], outperforming ResNet-50 [~76%] and MobileNetV2 [~45%]. ResNet-50 demonstrated competitive performance but required higher computational resources, making it less suitable for real-time deployment scenarios. The superior performance of YOLOv8 can be attributed to its ability to capture multi-scale features, which is essential for distinguishing visually diverse and fine-grained food categories.
3.2.2. Performance of Segmentation Models
To evaluate segmentation performance for portion estimation, multiple instance and semantic segmentation models were assessed on the dataset. Given the real-time and multi-object requirements of the application, both accuracy and computational efficiency were considered in model selection.
3.2.3. Training of Segmentation Models
We first trained Mask R-CNN as a baseline for instance segmentation. After ~85k iterations, the model learned coarse food categories but struggled with visually similar dishes. We then continued training, which improved overall localization and mask consistency, though fine-grained class errors remained. The final quantitative results [on our test set] were modest as shown in the table. This moderate performance reflects the challenges of our dataset, which has high intra-class similarity and many small items. A breakdown by class highlighted this: classes like jeera_rice, ras_malai, and white_rice had high AP [68–74%], whereas under-represented or similar-looking items [puri, kofta, beef_karahi] had very low AP [0–7%]. The model also struggled with object size: AP was only 1.27% for small items, 14.55% for medium, and 35.84% for large items, confirming that small-object segmentation is a serious limitation of Mask R-CNN in our context.

Table 2.
Baseline Model [Mask R-CNN] Performance.
| Metric | Value [%] |
| Bounding Box mAP | 33.47 |
| Segmentation mAP | 32.67 |
| AP50 | 42.87 |
| AP75 | 35.99 |
We selected YOLOv8-Seg as our primary segmentation model after comparing it with SAM [40], Mask2Former [41], SegFormer [MiT-B2] [42] and a YOLO-based two-stage segmentation pipeline [YOLO26-Seg], as summarized in the supplementary material under Comparison Results. We selected YOLOv8-Seg as our primary segmentation model due to its unified, real-time design. This single-stage model was trained on our pixel-annotated food masks. Qualitatively, YOLOv8-Seg produced clean, accurate masks that closely followed food boundaries, even in crowded plates under varying lighting. It successfully isolated multiple food items in one pass. Although we did not compute standard metrics [mIoU/Dice] in early testing, later evaluation yielded mIoU ≈ 0.6406 and Dice ≈ 0.4487. The model’s strength is its balance of mask accuracy with very fast inference, making it well-suited for real-time applications. Its weakness is that it inherently operates on multi-class segmentation in one shot, which in some cases reduced precise classification confidence compared to a two-stage approach.
The Table 3 shows YOLOv8-Seg [single-shot] achieved the second-highest mask mIoU among models, behind only the class-agnostic SAM. Mask R-CNN [baseline] had lower overlap but provided strong instance discrimination. Mask2Former lagged in overlap, whereas SegFormer’s metrics rivaled SAM’s. The two-stage YOLOv8 pipeline combined detection and segmentation to slightly exceed YOLOv8-Seg’s mask accuracy.
3.2.4. Portion Estimation
Portion estimation was performed by combining segmentation outputs with pixel-to-weight scaling. The predicted food area was mapped to gram values using calibrated reference portions.
To evaluate performance, predicted portion sizes were compared against manually measured ground truth values for a subset of test samples.
3.2.5. Performance Evaluation
Performance evaluation of the portion estimation module yielded a Mean Absolute Error [MAE] of ±18–25g and a Root Mean Square Error [RMSE] of 9–12%. Overall, the findings demonstrate that the proposed approach estimates food portions with an average deviation of less than 12% from the ground truth, providing sufficient accuracy for downstream calorie and macronutrient estimation in the nutritional profiling pipeline.
Although the proposed approach achieves satisfactory portion estimation accuracy, the remaining errors primarily result from irregular food shapes, overlapping food items, variations in food thickness that are not captured in 2D images, and occlusions in plates containing multiple food items. Despite these challenges, the model demonstrates consistent and reliable portion approximation, making it suitable for practical dietary assessment applications. However, from a nutritional perspective, the level of error mentioned above is unlikely to substantially affect estimation of overall dietary patterns. Deviations may be more pronounced for energy-dense foods, where small differences in portion size can result in larger differences in calorie estimation.
We evaluated both a single-stage YOLOv8-Seg model and a two-stage YOLOv8-Classification + Mask R-CNN pipeline [see Supplementary Material: Combined and Independent Models]. While the two-stage approach achieved better classification and segmentation performance, particularly for visually similar food items, YOLOv8-Seg was selected as the primary model due to its faster inference and suitability for real-time applications.
3.3. Nutrient Profiling
Following the proposed pipeline, nutritional profiles were generated for 85 dishes across ten food categories.
Table 4.
Nutritional values of example dishes [see supplementary materials for complete table].
| Category | Dish Name | Cal [kcal] | Protein [g] | Carbs [g] | Fat [g] | Na [mg] |
| Rice Dishes | White Rice | 130 | 2.7 | 28.2 | 0.3 | 1 |
| Meat Curries | Chicken Karahi | 200 | 16 | 6 | 13 | 450 |
| Snacks / Street Food | Samosa | 275 | 5.5 | 33 | 13.5 | 380 |
| BBQ / Grills | Chicken Tikka | 185 | 22 | 3.5 | 9 | 450 |
| Desserts | Gulab Jamun | 310 | 5.5 | 50 | 10 | 80 |
| Breads | Roti | 265 | 8.5 | 52 | 3.5 | 380 |
| Beverages | Chai | 45 | 1 | 7.5 | 1 | 15 |
| Vegetable Dishes | Saag | 95 | 3.2 | 10.5 | 5.2 | 180 |
| Lentils [Daal] | Maash Daal | 172 | 9.1 | 18.5 | 7.8 | 215 |
Table 5.
Macronutrients by food category [per 100g].
| Category | Dishes [n] | Calories kcal/100g | Protein g/100g | Carbohydrates g/100g | Fat g/100g |
| Rice Dishes | 11 | 130–200 | 2.7–11.5 | 19.5–28.2 | 0.3–8.0 |
| Meat Curries | 12 | 140–240 | 10.0–16.0 | 4.0–8.0 | 9.5–17.0 |
| Vegetable Dishes | 11 | 55–115 | 1.5–3.5 | 7.0–15.0 | 2.0–5.0 |
| BBQ / Grills | 6 | 185–280 | 17.0–22.0 | 3.0–8.0 | 9.0–20.0 |
| Breads | 5 | 265–335 | 7.0–8.5 | 44.0–52.0 | 3.5–14.0 |
| Desserts / Sweets | 10 | 145–380 | 2.5–8.0 | 20.0–58.0 | 5.0–15.0 |
| Snacks / Street food | 9 | 140–310 | 3.5–11.0 | 14.0–40.0 | 7.5–16.0 |
| Beverages | 6 | 40–90 | 0.1–3.0 | 7.0–13.0 | 0.5–2.5 |
| Condiments/Sides | 5 | 25–100 | 0.5–2.5 | 4.5–8.5 | 0.3–8.5 |
| Dal [Lentils] | 3 | 110–120 | 6.0–7.5 | 16.0–17.5 | 2.0–2.5 |
3.4. Usability Testing
Twenty participants performed usability tasks - capturing a food image, viewing detected items, reviewing nutritional information, and accessing meal analysis results – and completed SUS. Most participants completed tasks successfully with minimal assistance. Overall, participants’ feedback was generally positive, valuing the intuitive interface, speed of processing and obtaining nutritional information from a single food image for dietary monitoring. However, participants felt that the color scheme lacked visual cohesion and did not strongly convey a health/nutrition theme. Moreover, few participants experienced difficulties in framing food correctly within the capture region and navigating between screens. According to the standard SUS interpretation benchmarks the tool was found to be of ‘good usability’, with average SUS score of 78.0 [range 70.0 to 87.5]. The findings suggest that the tool is acceptable, but further improvements are recommended for future development and real-world testing.
4. Discussion
Automated dietary assessment remains a challenging problem due to the need to accurately recognize food items, estimate portion sizes, and translate these observations into meaningful nutritional information [5,8]. This study addresses these challenges through an integrated machine learning framework specifically developed for Pakistani cuisine. The overall findings indicate that the proposed pipeline can effectively combine these interdependent tasks within a mobile application, demonstrating potential for practical deployment in real-world settings for population health benefits.
The experimental results demonstrate that the proposed framework can integrate food recognition, segmentation, portion estimation, and nutrient profiling into a unified dietary assessment system. Among the evaluated classification models, YOLOv8 achieved the best overall performance while maintaining the computational efficiency required for real-time deployment. Its ability to learn multi-scale visual features proved advantageous for recognizing the diverse appearance of Pakistani food items. Similarly, YOLOv8-Seg provided an effective balance between segmentation accuracy and inference speed, enabling reliable extraction of food regions from complex meal images. Although the two-stage detection–segmentation pipeline produced marginally higher classification and segmentation accuracy, the single-stage YOLOv8-Seg architecture was preferred [43] because it offers substantially lower computational complexity and faster inference, making it more suitable for mobile applications.
The portion estimation results further demonstrate the practicality of the proposed framework. The observed estimation errors remained within an acceptable range for dietary assessment, indicating that the predicted portion sizes are sufficiently accurate for subsequent calorie and nutrient calculations. Most estimation errors can be attributed to inherent challenges associated with monocular image analysis, including irregular food geometry, overlapping food items, occlusion, and the absence of depth information. Nevertheless, these inaccuracies are unlikely to substantially affect overall dietary assessment, particularly when evaluating long-term dietary patterns rather than individual meal measurements. Collectively, these findings suggest that an efficient, real-time pipeline may offer greater practical value than a marginal increase in predictive accuracy achieved through computationally more demanding architectures, while some challenges remain.
Firstly, inter-class confusion was observed between visually similar food categories, such as white rice and semolina, reflecting the inherent difficulty of distinguishing foods with comparable color, texture, and appearance. This suggests that incorporating additional contextual or multimodal information could further improve classification performance [44]. Similarly, although the segmentation and portion estimation modules achieved promising results, their performance may decline in more complex scenarios involving overlapping food items, irregular shapes, varying food thickness, and visually similar textures. These findings indicate that aggregate evaluation metrics may not fully capture the challenges encountered in real-world dietary assessment [45].
Secondly, future research should investigate a unified architecture that jointly performs food classification and segmentation, thereby reducing computational overhead, minimizing error propagation between sequential stages, and improving inference efficiency. Integrating these tasks into a single architecture could reduce computational requirements and inference time while minimizing error propagation between sequential processing stages [46]. Such a design has the potential to improve both the efficiency and consistency of the dietary assessment pipeline, particularly for real-time mobile applications where computational resources are limited.
Another area for future research is the enhancement of the depth estimation module. Although the monocular depth estimation provides a practical means of estimating food portions without requiring a physical reference object, it predicts relative rather than absolute depth, which may reduce estimation accuracy under certain imaging conditions, such as when no clear food object is visible or when images are captured from suboptimal camera positions. Future work should focus on improving the robustness of depth estimation, incorporating real-time feedback to guide users in capturing suitable images, and exploring 3D food reconstruction techniques to enable more accurate volume and portion estimation [47].
5. Conclusions
This study presents an end-to-end system for automated dietary assessment of Pakistani cuisine, bringing together dataset development, food classification, segmentation, portion estimation, and nutrient mapping within a single mobile application. This type of image processing pipeline can offer a practical balance between accuracy and speed for the visually complex, fine-grained food categories found in Pakistani cuisine, and that portion size can be estimated to a reasonable degree of accuracy without specialised hardware. Early usability testing also suggested that the application was manageable for non-expert users, though further testing and reporting are still needed. Despite challenges related to dataset diversity, visually similar dishes, and the limits of depth estimation without a reference object, this work lays a methodological foundation for culturally adaptive, AI-based dietary assessment tools for underrepresented populations. Building on this foundation, future work should focus on reducing the processing burden of using multiple separate models and on improving the reliability of depth-based portion estimation, both of which would help move this system closer to real-world, everyday use.
Supplementary Materials
The following supporting information can be downloaded at the website of this paper posted on Preprints.org.
Author Contributions
Conceptualization: SMA, SRB, MF; Methodology: SMA, SRB, MF, MU, NS; Experimentation validation, and formal analysis: SRB, MU, MF, AUF, FK, HI; Writing—original draft: AUF, FK, MU; Writing—review & editing: SMA, MU, NS; Supervision: MF, SMA, SRB, MU, NS; Project administration: SMA. All authors have read and agreed to the published version of the manuscript.
Funding
This work did not receive any funding.
Institutional Review Board Statement
Not applicable.
Informed Consent Statement
Not applicable.
Data Availability Statement
The data supporting the findings of this study are available from the corresponding author upon reasonable request.
Conflicts of Interest
The authors declare no conflicts of interest.
References
- Afshin A, Sur PJ, Fay KA, Cornaby L, Ferrara G, Salama JS, et al. Health effects of dietary risks in 195 countries, 1990–2017: a systematic analysis for the Global Burden of Disease Study 2017. Lancet [Internet]. 2019 May;393[10184]:1958–72. Available from: https://linkinghub.elsevier.com/retrieve/pii/S0140673619300418.
- Mathur R, Hull SA, Hodgson S, Finer S. Characterisation of type 2 diabetes subgroups and their association with ethnicity and clinical outcomes: a UK real-world data study using the East London Database. Br J Gen Pract [Internet]. 2022 Jun;72[719]:e421–9. [CrossRef]
- Hayanga B, Stafford M, Bécares L. Ethnic inequalities in multiple long-term health conditions in the United Kingdom: a systematic review and narrative synthesis. BMC Public Health [Internet]. 2023 Jan 27;23[1]:178. Available from: https://bmcpublichealth.biomedcentral.com/articles/10.1186/s12889-022-14940-w.
- Kazmi T, Nagi M, Razzaq S, Hussnain S, Shahid N, Athar U. Burden of noncommunicable diseases in Pakistan. East Mediterr Heal J [Internet]. 2022 Nov 30;28[11]:798–804. Available from: https://applications.emro.who.int/EMHJ/V28/11/1020-3397-2022-2811-798-804-eng.pdf.
- Fadnes LT, Celis-Morales C, Økland JM, Parra-Soto S, Livingstone KM, Ho FK, et al. Life expectancy can increase by up to 10 years following sustained shifts towards healthier diets in the United Kingdom. Nat Food [Internet]. 2023 Nov 20;4[11]:961–5. Available from: https://www.nature.com/articles/s43016-023-00868-w.
- Shim JS, Oh K, Kim HC. Dietary assessment methods in epidemiologic studies. Epidemiol Health [Internet]. 2014 Jul 22;36:e2014009. [CrossRef]
- Illner AK, Freisling H, Boeing H, Huybrechts I, Crispim S, Slimani N. Review and evaluation of innovative technologies for measuring diet in nutritional epidemiology. Int J Epidemiol [Internet]. 2012 Aug;41[4]:1187–203. [CrossRef]
- Raber M, Liao Y, Rara A, Schembre SM, Krause KJ, Strong L, et al. A systematic review of the use of dietary self-monitoring in behavioural weight loss interventions: delivery, intensity and effectiveness. Public Health Nutr [Internet]. 2021 Dec 20;24[17]:5885–913. Available from: https://www.cambridge.org/core/product/identifier/S136898002100358X/type/journal_article.
- Almiron-Roig E, Aitken A, Galloway C, Ellahi B. Dietary assessment in minority ethnic groups: a systematic review of instruments for portion-size estimation in the United Kingdom. Nutr Rev [Internet]. 2017 Mar;75[3]:188–213. [CrossRef]
- Bhagtani D, Amoutzopoulos B, Steer T, Collins D, Abraham S, Holmes BA, et al. The Adaptation, Implementation, and Performance Evaluation of Intake24, a Digital 24-h Dietary Recall Tool for South Asian Populations: The South Asia Biobank. Curr Dev Nutr [Internet]. 2025 Feb;9[2]:104543. Available from: https://linkinghub.elsevier.com/retrieve/pii/S2475299125000022.
- Gulyani P, Gupta S, Ng AH, Trakman G. A systematic review of dietary assessment methods used for South Asian migrants in high-income host countries. Nutr Metab Cardiovasc Dis [Internet]. 2025 Mar;35[3]:103795. Available from: https://linkinghub.elsevier.com/retrieve/pii/S0939475324004290.
- Cofre S, Sanchez C, Quezada-Figueroa G, López-Cortés XA. Validity and accuracy of artificial intelligence-based dietary intake assessment methods: a systematic review. Br J Nutr [Internet]. 2025 May 14;133[9]:1241–53. Available from: https://www.cambridge.org/core/product/identifier/S0007114525000522/type/journal_article.
- Li X, Yin A, Choi HY, Chan V, Allman-Farinelli M, Chen J. Evaluating the Quality and Comparative Validity of Manual Food Logging and Artificial Intelligence-Enabled Food Image Recognition in Apps for Nutrition Care. Nutrients [Internet]. 2024 Aug 5;16[15]:2573. Available from: https://www.mdpi.com/2072-6643/16/15/2573.
- M.N. A, Jeyaraj SS. Artificial intelligence in dietary assessment: a narrative review. Glob Perspect Nutr [Internet]. 2026 Mar 18;1[1]. Available from: https://academic.oup.com/gpn/article/doi/10.1093/gpnutr/woag001/8525112.
- Probst Y, Nguyen D, Tran M, Li W. Dietary Assessment on a Mobile Phone Using Image Processing and Pattern Recognition Techniques: Algorithm Design and System Prototyping. Nutrients [Internet]. 2015 Jul 27;7[8]:6128–38. Available from: https://www.mdpi.com/2072-6643/7/8/5274.
- Tahir GA, Loo CK. A Comprehensive Survey of Image-Based Food Recognition and Volume Estimation Methods for Dietary Assessment. Healthcare [Internet]. 2021 Dec 3;9[12]:1676. Available from: https://www.mdpi.com/2227-9032/9/12/1676.
- Ye H, Zou Q. Food Recognition and Dietary Assessment for Healthcare System at Mobile Device End Using Mask R-CNN. In 2020. p. 18–35. Available from: http://link.springer.com/10.1007/978-3-030-43215-7_2.
- Tay W, Kaur B, Quek R, Lim J, Henry CJ. Current Developments in Digital Quantitative Volume Estimation for the Optimisation of Dietary Assessment. Nutrients [Internet]. 2020 Apr 22;12[4]:1167. Available from: https://www.mdpi.com/2072-6643/12/4/1167.
- Vasiloglou MF, van der Horst K, Stathopoulou T, Jaeggi MP, Tedde GS, Lu Y, et al. The Human Factor in Automated Image-Based Nutrition Apps: Analysis of Common Mistakes Using the goFOOD Lite App. JMIR mHealth uHealth [Internet]. 2021 Jan 13;9[1]:e24467. Available from: http://mhealth.jmir.org/2021/1/e24467/.
- Gilal NU, Qaraqe M, Schneider J, Agus M. Autocleandeepfood: auto-cleaning and data balancing transfer learning for regional gastronomy food computing. Vis Comput [Internet]. 2025 Mar 9;41[4]:2691–708. Available from: https://link.springer.com/10.1007/s00371-024-03560-7.
- Lemaitre G, Nogueira F, Aridas CK. Imbalanced-learn: A Python Toolbox to Tackle the Curse of Imbalanced Datasets in Machine Learning. 2016 Sep 21; Available from: http://arxiv.org/abs/1609.06570.
- He K, Zhang X, Ren S, Sun J. Deep Residual Learning for Image Recognition. In: 2016 IEEE Conference on Computer Vision and Pattern Recognition [CVPR] [Internet]. IEEE; 2016. p. 770–8. Available from: http://ieeexplore.ieee.org/document/7780459/.
- Deng J, Dong W, Socher R, Li LJ, Kai Li, Li Fei-Fei. ImageNet: A large-scale hierarchical image database. In: 2009 IEEE Conference on Computer Vision and Pattern Recognition [Internet]. IEEE; 2009. p. 248–55. Available from: https://ieeexplore.ieee.org/document/5206848/.
- Sandler M, Howard A, Zhu M, Zhmoginov A, Chen LC. MobileNetV2: Inverted Residuals and Linear Bottlenecks. In: 2018 IEEE/CVF Conference on Computer Vision and Pattern Recognition [Internet]. IEEE; 2018. p. 4510–20. Available from: https://ieeexplore.ieee.org/document/8578572/.
- Jocher G, Chaurasia A, Qiu J. Ultralytics YOLO. GitHub [Internet]. 2023 [cited 2026 Mar 3]. Available from: https://github.com/ultralytics/ultralytics.
- He K, Gkioxari G, Dollar P, Girshick R. Mask R-CNN. In: 2017 IEEE International Conference on Computer Vision [ICCV] [Internet]. IEEE; 2017. p. 2980–8. Available from: http://ieeexplore.ieee.org/document/8237584/.
- Lin TY, Maire M, Belongie S, Hays J, Perona P, Ramanan D, et al. Microsoft COCO: Common Objects in Context. In 2014. p. 740–55. Available from: http://link.springer.com/10.1007/978-3-319-10602-1_48.
- Loshchilov I, Hutter F. Decoupled Weight Decay Regularization. 2019 Jan 4; Available from: http://arxiv.org/abs/1711.05101.
- Roboflow. Roboflow [Internet]. 2024. Available from: https://roboflow.com.
- Khan I, Yasmeen F, Ahmad J, Abdullah A, Din ZU. Developing a mean-planning exchange list for commonly consumed Pakistani dishes. Prog Nutr [Internet]. 2019. [CrossRef]
- U.S. Department of Agriculture. Agriculture Research Services, FoodData Central [Internet]. Available from: https://fdc.nal.usda.gov/.
- ReciPal. ReciPal Nutrition Analysis Software [Internet]. 2024. Available from: https://www.recipal.com.
- Xyris Software. FoodWorks Online [Internet]. 2024. Available from: https://www.xyris.com.au.
- Pakistan Medical Research Council, Aga Khan University, UNICEF. National Nutrition Survey Pakistan 2011. Islamabad; 2012.
- Ramírez S. FastAPI [Internet]. 2024. Available from: https://fastapi.tiangolo.com.
- TensorFlow. TensorFlow Lite [Internet]. 2024. Available from: https://www.tensorflow.org/lite.
- Bai J, Lu F, Zhang, K et al. ONNX: Open Neural Network Exchange [Internet]. 2019. Available from: https://onnx.ai.
- Sharma S, Kumar BA. A systematic review of user-based usability testing practices in self-care mHealth apps. Digit Heal [Internet]. 2025 May 29;11. [CrossRef]
- Ferrara G, Kim J, Lin S, Hua J, Seto E. A Focused Review of Smartphone Diet-Tracking Apps: Usability, Functionality, Coherence With Behavior Change Theory, and Comparative Validity of Nutrient Intake and Energy Estimates. JMIR mHealth uHealth [Internet]. 2019 May 17;7[5]:e9232. Available from: http://mhealth.jmir.org/2019/5/e9232/.
- Kirillov A, Mintun E, Ravi N, Mao H, Rolland C, Gustafson L, et al. Segment Anything. In: 2023 IEEE/CVF International Conference on Computer Vision [ICCV] [Internet]. IEEE; 2023. p. 3992–4003. Available from: https://ieeexplore.ieee.org/document/10378323/.
- Cheng B, Misra I, Schwing AG, Kirillov A, Girdhar R. Masked-attention Mask Transformer for Universal Image Segmentation. In: 2022 IEEE/CVF Conference on Computer Vision and Pattern Recognition [CVPR] [Internet]. IEEE; 2022. p. 1280–9. Available from: https://ieeexplore.ieee.org/document/9878483/.
- Xie E, Wang W, Yu Z, Anandkumar A, Alvarez JM, Luo P. SegFormer: Simple and efficient design for semantic segmentation with transformers. Adv Neural Inf Process Syst. 2021;34:12077–90.
- Hasan M, Rabby MKM, Jahan I, Soeb MJA, Jubayer MF. The Evolution and Advancement of YOLO Algorithms in Object Detection: From Real-Time Breakthroughs to Modern Architectures [Internet]. 2025. Available from: https://www.preprints.org/manuscript/202510.2019/v1.
- Pan X, He J, Zhu F. FMiFood: Multi-Modal Contrastive Learning for Food Image Classification. In: 2024 IEEE 26th International Workshop on Multimedia Signal Processing [MMSP] [Internet]. IEEE; 2024. p. 1–6. Available from: https://ieeexplore.ieee.org/document/10743395/.
- Min W, Jiang S, Liu L, Rui Y, Jain R. A Survey on Food Computing. ACM Comput Surv [Internet]. 2020 Sep 30;52[5]:1–36. [CrossRef]
- Zhang Y, Yang Q. A Survey on Multi-Task Learning. IEEE Trans Knowl Data Eng [Internet]. 2022 Dec 1;34[12]:5586–609. Available from: https://ieeexplore.ieee.org/document/9392366/.
- Lo FPW, Sun Y, Qiu J, Lo B. Food Volume Estimation Based on Deep Learning View Synthesis from a Single Depth Map. Nutrients [Internet]. 2018 Dec 18;10[12]:2005. Available from: https://www.mdpi.com/2072-6643/10/12/2005.
Table 1.
Dataset Categorization of Pakistani Food Types Used for Model Training.
| Category | Examples |
| Rice Dishes | Biryani, Pulao, Fried Rice, Tahari, Zeera Rice |
| Meat Curries / Gravies | Karahi, Nihari, Qorma, Haleem, Paya, Kofta Curry |
| Vegetarian Dishes | Aloo Bhujia, Bhindi Masala, Baingan Bharta, Palak Sabzi |
| Lentil-Based Dishes [Dals] | Dal Chana, Dal Mash, Dal Gosht, Mixed Dal Fry |
| Condiments/Sides | Raita, Salad, Kachumar Salad |
| Breads | Roti, Naan, Paratha, Poori, Sheermal |
| Snacks & Street Foods | Samosa, Pakora, Gol Gappay, Bun Kebab, Chana Chaat |
| BBQ/Grills | Chicken Tikka, Malai Boti, Seekh Kebab |
| Desserts & Sweets | Gulab Jamun, Jalebi, Kheer, Falooda, Shahi Tukray |
| Beverages | Lemon Sode, Sattu, Soft Drinks, Coffee |
Table 3.
Segmentation models and their performance.
| Models | mIoU | Dice | maskAP | Key Strength |
| YOLOV8-seg | 0.6406 | 0.4487 | 0.5433 | Real-time multi-object segmentation |
| MaskRCNN | – | – | 0.3267 | Robust instance-level detail |
| SAM | 0.8752 | 0.9274 | – | Highly precise boundaries |
| SegFormer | 0.8720 | 0.9180 | – | Efficient end-to-end segmentation |
| Mask2Former | 0.4511 | 0.5965 | – | General semantic segmentation |
| Yolo26-seg | 0.6929 | 0.6658 | 0.5751 | Combined detection + segmentation |
*Values are approximate validation results from our experiments [mIoU/Dice mask overlap; mask AP is for YOLO-based models;]. Mask R-CNN’s mask AP is 32.67% as reported above.
Disclaimer/Publisher’s Note: The statements, opinions and data contained in all publications are solely those of the individual author(s) and contributor(s) and not of MDPI and/or the editor(s). MDPI and/or the editor(s) disclaim responsibility for any injury to people or property resulting from any ideas, methods, instructions or products referred to in the content. |
© 2026 by the authors. Licensee MDPI, Basel, Switzerland. This article is an open access article distributed under the terms and conditions of the Creative Commons Attribution (CC BY) license (http://creativecommons.org/licenses/by/4.0/).
Copyright: This open access article is published under a Creative Commons CC BY 4.0 license, which permit the free download, distribution, and reuse, provided that the author and preprint are cited in any reuse.