

Submitted:
11 August 2026
Posted:
12 August 2026
You are already at the latest version
Abstract
The design of multipurpose processes in rural agroindustry considers quality criteria, environmental sustainability, and economic feasibility. The problem arises from the limited integration between process simulation and environmental assessment in traditional production systems of granulated panela (GP) and sugarcane honey (SH) in Pastaza, Ecuador. The objective was to propose a methodology for the design of sustainable multipurpose processes through simulation and the application of the GREENSCOPE tool. The methodology combined mass and energy balances, quality attribute analysis under sigma level, economic evaluation using net present value (NPV), internal rate of return (IRR), and discounted payback period (DPP), along with environmental analysis through efficiency, energy, economic, and environmental indicators. Different production scenarios were simulated with percentage combinations of GP and SH in batches of 10, 120, and 1560 units. Results show that the alternative consisting of 60% GP and 40% SH in 120 batches achieved the highest profitability, with an NPV of 141,014.59 USD and an IRR of 45.80%, while meeting technical and quality criteria. The GREENSCOPE analysis identified environmental impacts mainly associated with emissions from biomass combustion. The multipurpose production of 60% granulated panela and 40% sugarcane honey in 120 batches was identified as the best technological and economic alternative for the analyzed rural agroindustry.
Keywords:
multipurpose process design
; GREENSCOPE
; sustainability assessment
; techno-economic analysis
; granulated panela
; sugarcane honey
; non-centrifugal cane sugar
1. Introduction
The design of agroindustrial products at present must consider quality criteria that ensure a safe product for consumers and that the technology used remains consistent with the concept of sustainability. The implementation of process design (PD) for multiple products, or multipurpose design, in the development of new agroindustrial technologies has been scarcely explored. However, since this type of design represents a set of decision-making techniques aimed at allocating available resources to specific tasks according to the products to be manufactured, it offers several advantages. The main issue addressed by this type of design is the determination of production batch size [1]. It is necessary to consider that defining the batch size of the final product at industrial or semi-industrial scale requires incorporating a large number of batches from the same raw material, which generates uncertainty in product traceability.
Traceability is widely recognized as a key element in food supply chains, as it is directly linked to product quality and safety [2]. Considering the relationship between final product batch size and the effort required to trace raw material batches, it is necessary to establish a strategy that enables the definition of batch size while taking into account the impact on traceability. A second issue, present in both single-purpose and multipurpose process design, is environmental sustainability. This concern arises from the scarcity of natural resources and the degradation of environmental quality in terms of health and well-being; therefore, it is necessary to integrate these aspects into the accounting of process design [3].
The possible solutions to the previously mentioned issues lead to the need to consider an extended multipurpose process design that includes principles of anticipation, reflexivity, inclusion, and responsiveness. At the same time, this implies that professionals and institutions involved in design must develop anticipatory, participatory, and integrative capabilities [4]. Current and future requirements of industrial process design demand methodologies that integrate a greater number of criteria, allowing engineers to achieve designs that simultaneously meet diverse specifications, including economic, environmental, and social needs [5].
Authors such as [6], present a procedure to address process design tasks in the sugar industry and its derivatives, considering technical, environmental, and economic criteria through a heuristic approach. In contrast, [7] developed a strategy to reduce quality uncertainty in process design within the sugar industry. Life Cycle Assessment (LCA) is a methodology used to evaluate environmental impacts associated with all stages of a product’s life cycle. Researchers such as [8], have conducted LCA studies on complex manufacturing facilities involving multiple lines and products, where the allocation approach supports the systematic development of multi-scale process models and avoids arbitrary assumptions. Meanwhile, [9] investigated the optimization of multi-path production chains and multi-criteria decision-making through sustainability evaluation using the GREENSCOPE methodology (Gauging Reaction Effectiveness for the Environmental Sustainability of Chemistries with a multi-Objective Process Evaluator). The reviewed literature indicates the absence of a standardized method for allocating resource use and environmental impacts among multiple products, particularly in the food industry.
The value of conducting an LCA of one or several products depends on understanding the environmental consequences of the technological systems responsible for their production; therefore, in order to compare energy and chemical production systems throughout the life cycle, it is necessary to consider the inputs and outputs of materials and energy in the previous and subsequent stages. These extended stages include raw material acquisition, precursor manufacturing, product manufacturing, transportation, use, and end of life [8]. Meanwhile, to analyze the multidimensional impacts of process design and operation, researchers from the Environmental Protection Agency (EPA) developed the GREENSCOPE methodology and tool. These sets of indicators, defined mathematically, represent a quantifiable measure of sustainability of process performance, raw materials, utilities, equipment, and output information. This approach uses a dimensionless sustainability scale that provides indicator results as percentage scores (0–100% sustainability) [10].
The GREENSCOPE methodology can be applied flexibly to a process, subprocess, or equipment, and the user can apply GREENSCOPE at any point, from conceptual design. This flexibility makes possible a direct comparison between several processes that manufacture the same product but use different raw materials, reaction processes, separation technologies, or generate different emissions and wastes. In addition, this methodology can be implemented to evaluate sustainability performance before or after making modifications in the process [9].
In most panela-producing facilities, non-centrifugal sugar is obtained in block and granulated forms (granulated panela, GP), and only rarely sugarcane honey (SH). The agroindustry of GP and SH is rural, traditional, and artisanal worldwide, characterized by poorly organized production, where process conditions, final product characteristics, and sustainability indicators are not controlled [11]. The planning and scheduling of design processes in medium-scale or artisanal production are not supported by tools that ensure efficiency and effectiveness in operational development. However, there is market potential for organic sweeteners due to the popularity and importance of sugarcane-derived sweeteners in human diets. In addition, the trend toward consuming healthier foods and reducing refined sugar intake opens the possibility of introducing substitute products such as GP and SH, since they contain fewer calories than sugar and honey and are also more economical [12]. Quality in GP and SH as an early stage in PD and its consideration as a parameter remains poorly documented. In the Amazon region of Ecuador, there are products that share a common technological process base; for example, the production of GP and SH shares unit operations and processes, and another case is the production of ethanol, agricultural rum, and fuel bioethanol. Therefore, the implementation of multipurpose process design would provide effective and efficient algorithms that ensure the quality of multiple food products [13].
The objective of this research was to propose a methodology for the design of sustainable multipurpose processes using process simulation and GREENSCOPE. For this purpose, a case study was taken as a basis through a multipurpose simulation of GP and SH from sugarcane in the locality of Pastaza, considering in this design their quality attributes and the operating conditions of the technological process for different production quantities of both products.
2. Materials and Methods
Methodological Criteria for Process Design and/or Simulation
The methodology used was a modification of the proposal presented in [14]. Both procedures are combined and complement each other for the design of a multipurpose process [15] supported by the GREENSCOPE tool, as shown in Figure 1. The actions, tools, and objectives of each of the steps used are described below. The actions, tools, and objectives of each of the steps used are presented in Table S1.
Generation of Multipurpose Design Alternatives
In the multipurpose design, three types of batches of 10, 120, and 1560 were determined, as in the work proposed by [16]. A batch of 10 corresponds to one day of production, 120 corresponds to one month, and 1560 corresponds to one year. The three types of batches were divided into (20% GP and 80% SH), (40% GP and 60% SH), (60% GP and 40% SH), (80% GP and 20% SH), 100% GP, and 100% SH. Each multipurpose batch was simulated five times (Table 1). The common unit operations in the multipurpose process were programmed in a script. The proposed equations were grouped into mass balances, energy balances, equipment design, environmental indicators, economic analysis, models for quality attributes, sigma level determination, and defective lots per million opportunities (DPMO) [7].
3. Results
3.1 Demanded Products
Granulated panela (GP) and sugarcane honey (SH) were identified as the demanded products considered in the multipurpose process. [17] reported that 24.06% of the surveyed population preferred granulated panela, whereas 2.83% consumed other sweeteners, including sugarcane honey. No official records of the annual production of GP and SH in Ecuador were identified in the reviewed sources.
The quality criteria selected for GP were 83% sucrose and 3% moisture, according to [18]. At the international level, product color was related to the ICUMSA unit through the mathematical model proposed by [19] (Equation 2). For SH, [20] establishes a reducing sugar content of 59% and a moisture content of 26.5%. Viscosity, flavor, and crystal presence were defined as organoleptic quality attributes and calculated using the models reported by [21] (Equations 3–5).
3.2 Technology Selection
The technology selected for SH production corresponded to the process proposed by [7] (Figure 2A). The process begins with sugarcane milling, where the juice is extracted and bagasse is obtained as a by-product. The juice is filtered to remove bagacillo and other impurities, followed by clarification using mucilage. During heating, CaCO₃ is added to regulate acidity and facilitate impurity removal. The clarified juice then passes through three successive evaporation stages until reaching 74–78 °Brix. The final stages include cooling and the addition of citric acid. Acid hydrolysis is applied to maintain the sucrose content below 60% (w/w) and prevent crystallization, according to [21].
The technology selected for GP production corresponded to the process proposed by [22] (Figure 2B). The process begins with sugarcane milling, where the juice is extracted and bagasse is separated. The juice is filtered to remove bagacillo and other impurities, followed by clarification using mucilage. During heating, CaCO₃ is added to regulate acidity to pH 5.8 and facilitate impurity removal. The clarified juice then passes through three evaporation stages, reaching 65–75 °Brix. The concentration stage begins when soluble solids reach 88–92 °Brix, followed by crystallization until values between 92 and 94 °Brix are obtained.
3.3 Are There Common Unit Operations and Processes?
GP and SH share a common processing sequence that begins with sugarcane milling, where juice is extracted and bagasse is obtained as a by-product. The extracted juice passes through filtration to remove bagasse and other impurities [23], followed by heating and three successive evaporation stages [16]. During heating, CaCO₃ is added to regulate the pH of the sugarcane juice [11]. Milling, filtration, heating, evaporation 1, evaporation 2, evaporation 3, and CaCO₃ addition were identified as the common operations and processes involved in GP and SH production (Figure 3).
3.4 Multipurpose Design
The identification of common and product-specific operations supported the selection of a multipurpose process design. For SH production, the specific operations comprise cooling and acid hydrolysis through the addition of citric acid (C₆H₈O₇). For GP production, the specific operations comprise concentration, where soluble solids reach 88–92 °Brix [11], and crystallization, where values between 92 and 94 °Brix are obtained [22]. Therefore, the common processing stages can be integrated into a shared production line, while cooling and hydrolysis are assigned to the SH route and concentration and crystallization are assigned to the GP route (Figure 3).
3.5 Definition of the Technological Scheme
After identifying the common and specific unit operations, the multipurpose technological scheme was defined (Figure 4). In agreement with [24], the proposed scheme corresponds to a multipurpose process in which the products do not necessarily follow the same sequence of operations or require all stages of the production process. Under this arrangement, different products can be obtained simultaneously, and each product may follow a different route within the technological process.
3.6 Capacity Estimation
According to [25] , for each cultivated hectare, between 70 and 100 t of sugarcane are obtained (Table 3), and for each ton of sugarcane, a yield between 58 and 63% can be achieved [26]. Therefore, an average of 102,953.62–133,706 t of sugarcane and 59,713.10–84,234.78 t of sugarcane juice are available in the main parishes of Pastaza. A tentative multipurpose production capacity of 2,000 kg of juice is estimated.
3.7 Macrolocation
According to [27], Tarqui recorded the largest sugarcane cultivation area among the analyzed parishes, with 198.75 ha (Table 3). Based on the availability of raw material, Tarqui was selected as the macrolocation for the proposed multipurpose plant.
3.8 Mass and Energy Balance
Mass and energy balances were performed across the unit operations included in the multipurpose process. A total of 1,155.89 kg of sugarcane at 15 °Brix entered the milling stage. Juice extraction generated 809.12 kg of sugarcane juice and 346.76 kg of bagasse, equivalent to mass fractions of 70.00 and 30.00%, respectively. The difference of 0.01 kg between the inlet and outlet streams was associated with numerical rounding. During filtration, 54.48 kg of bagasse and suspended impurities were removed, leaving 754.64 kg of filtered juice. The calculated mass recovery during filtration was 93.27%, while the separated solid fraction represented 6.73% of the juice entering this operation.
The filtered juice entered the heating stage at pH 5.5. Water removal increased the concentration of soluble solids throughout the evaporation sequence. The stream associated with evaporator 1 reached 148.45 kg at 25 °Brix, followed by 133.17 kg at 38 °Brix in evaporator 2. The outlet stream from evaporator 3 was 116.09 kg at 78 °Brix. Mass reductions of 10.29 and 12.83% were calculated between evaporators 1–2 and 2–3, respectively. The 116.09 kg stream leaving evaporator 3 represented the common basis used to distribute the material between the GP and SH processing routes (Table 4).
The complete stream from evaporator 3 was directed toward the GP route in the 100% GP–0% SH configuration, producing 101.29 kg after concentration and crystallization. This value represented a mass recovery of 87.25% relative to the stream entering the product-specific operations. In the 0% GP–100% SH configuration, the entire 116.09 kg stream was assigned to cooling and hydrolysis. Intermediate configurations distributed the common stream according to the predefined production proportions. The SH stream decreased from 92.87 to 23.21 kg when its participation changed from 80 to 20%, while the stream directed toward the GP route increased from 23.21 to 92.87 kg. Final GP production increased from 20.38 to 81.31 kg under the same configurations, with calculated recoveries between 87.55 and 87.82% after concentration and crystallization (Table 4).
3.8.1 Quality Performance of SH
Process capability was evaluated through the sigma level and defective lots per million opportunities (DPMO), according to [28]. A sigma level equal to or greater than 3 was established as the acceptance criterion. Simulations producing at least one quality response below this limit were repeated using a new combination of randomly generated operating conditions.
The SH simulation generated Beta-distributed values within pH 3.5–4.5 and soluble solids concentrations of 74–78 °Brix, according to the operating intervals reported by [7]. Viscosity, flavor, and crystal presence were calculated simultaneously using the respective response models (Equations 3–5). Acceptance of a simulated batch required the three quality attributes to satisfy the predefined sigma-level criterion.
The configurations containing 100% SH required additional iterations in the groups of 10, 120, and 1560 batches. Additional repetitions were also recorded in the multipurpose configurations containing SH. The occurrence of a new iteration depended on the combined response of viscosity, flavor, and crystal presence under the randomly generated pH and °Brix conditions. The behavior of the three quality attributes across the simulated production configurations is presented in Figure 5 (Figure 5).
3.8.2 Quality Performance of GP
The GP simulation incorporated operating limits associated with ICUMSA color development during concentration and crystallization. Beta-distributed values in the concentrator ranged from pH 5.5 to 7.0, soluble solids from 89 to 93 °Brix, and processing time from 20 to 30 min. The crystallizer operated within pH 5.5–7.0, soluble solids concentrations of 90–94 °Brix, agitation times of 10–20 min, and temperatures of 40–60 °C.
An acceptance interval of 7,000–12,000 ICUMSA units was established together with a sigma level equal to or greater than 3. The 100% GP configurations reached the required quality level without additional iterations. Multipurpose configurations presented iterations when the simultaneous SH responses failed to satisfy the acceptance criterion, because the quality attributes of both products were evaluated within the same computational run.
The concentration stage reached pH 6.4 and 91.65 °Brix, values located within the programmed operating intervals. During crystallization, pH varied from 5.70 to 6.98, while soluble solids reached 94.23 °Brix. The pH values remained within the established limits, whereas the soluble solids response exceeded the predefined upper value by 0.23 °Brix. The ICUMSA responses obtained for the production proportions and the three batch groups are presented in Figure 6 (Figure 6).
3.8.1 Gantt Diagram of the Multipurpose Process
Based on the mass balances of the process, the production times of the multipurpose stages were determined. In Figure 7, the Gantt diagram shows that the production of 60% GP – 40% SH begins with milling at 1:00 AM, lasting 30 minutes until 1:30 AM, followed by filtration from 1:10 AM to 1:40 AM. Heating then occurs from 1:20 AM to 1:50 AM, followed by three evaporation stages of 30 minutes each until 3:20 AM. Cooling takes place from 3:20 AM to 3:50 AM, hydrolysis from 3:50 AM to 4:10 AM, concentration from 3:20 AM to 3:50 AM, and finally crystallization from 3:50 AM to 4:10 AM.
In contrast, the production of 100% GP – 0% SH omits cooling and hydrolysis, starting with milling at 3:50 AM and ending with crystallization at 7:21 AM. Finally, the production of 0% GP – 100% SH does not include concentration or crystallization, beginning with milling at 7:01 AM and ending with hydrolysis at 9:56 AM. In comparison, exclusive SH production is the shortest process due to the absence of concentration and crystallization, GP-only production has a longer duration due to crystallization, and multipurpose production includes all unit operations, resulting in a more extensive and versatile process.
3.9 Availability of Raw Materials
There is an availability of 59,713.10–84,234.78 t of sugarcane juice in the province of Pastaza. The consumption of sugarcane juice in the technological process is 809.12 kg of sugarcane; therefore, raw material availability for the implementation of the technological process is ensured.
3.10 Environmentally Compatible LCA
Environmental indicators were calculated for the production scenarios of 10, 120, and 1560 batches. The variables included raw material consumption, sugarcane juice consumption, energy demand, solid waste discharge, and gaseous residue generation. Similar numerical patterns were obtained among the three batch sizes, although the indicator values varied according to the GP–SH production ratio (Table 5).
The highest GP-related values occurred in the 20% GP–80% SH configuration, with 56.70 kg sugarcane/kg GP, 37.01 kg juice/kg GP, 14,226.51 J/kg GP, 19.68 kg solid residues/kg GP, and 31.41 kg gaseous residues/kg GP. The highest SH-related values were obtained in the 80% GP–20% SH configuration, reaching 49.78 kg sugarcane/kg SH, 32.50 kg juice/kg SH, 12,361.77 J/kg SH, 17.28 kg solid residues/kg SH, and 27.50 kg gaseous residues/kg SH (Table 5).
3.11 Technological Modifications
The simulation results supported the modification of the operating conditions applied in the traditional multipurpose process. The proposed adjustments included the control of pH, soluble solids concentration, and temperature during evaporation, concentration, hydrolysis, and crystallization. A final color response of 7,560.30 IU was obtained for GP, while SH reached 75.6 °Brix. These values were selected as process-control references for obtaining the required quality attributes without replacing the common technological sequence.
3.12 Equipment Design, Availability, and Acquisition Cost
The heat-transfer areas of the equipment associated with the common processing stages remained constant across the three batch sizes and the simulated GP–SH configurations. The calculated areas were 0.62 m² for the filter, 0.97 m² for the heater, and 3.94, 0.15, and 0.19 m² for evaporators 1, 2, and 3, respectively.
The areas of the product-specific equipment varied according to the proportion of GP. The concentrator area increased from 0.08 m² in the 20% GP–80% SH configuration to 0.54 m² in the 100% GP–0% SH configuration. The crystallizer area increased from 0.24 to 1.18 m² within the same production range. No concentrator or crystallizer was required for the 0% GP–100% SH configuration because these operations are not included in the SH production route (Table 6).
3.13 Automatic Control
The selected control variables were pH and °Brix in the feed juice and intermediate streams [29]. The SH route included °Brix control during evaporation, while the GP route included °Brix at the outlet of evaporator 4, agitation time, and crystallizer temperature [7,30].
3.14 Economic Analysis of Investment and Production
Equipment acquisition costs remained unchanged across the three batch sizes for each production configuration. The highest cost corresponded to 100% GP–0% SH, with USD 24,300.52, while the lowest value was obtained for 20% GP–80% SH, with USD 7,873.76. The remaining multipurpose configurations presented costs between USD 12,755.28 and USD 19,494.77, whereas 100% SH required USD 18,396.80 (Table 7).
Total investment cost varied among the production configurations (Figure 8). The 100% GP configuration reached USD 265,496.58, followed by 100% SH with USD 239,809.37. The multipurpose configurations ranged from USD 70,181.40 for 20% GP–80% SH to USD 187,720.95 for 80% GP–20% SH. The 60% GP–40% SH configuration required an investment of USD 140,133.25.
Unit production costs were USD 1.10/kg for GP and USD 0.83/kg for SH. A profit margin of 17% was applied according to Mortimer and Weeks (2019), resulting in selling prices of USD 1.29/kg for GP and USD 0.97/kg for SH. Annual costs included raw materials, labor, packaging, labeling, manufacturing, distribution, and sales (Table 8).
The annual GP cost increased from USD 36,592.48 to USD 75,858.23 as its participation increased from 20 to 80%, reaching USD 88,940.80 in the 100% GP configuration. The annual SH cost decreased from USD 158,456.49 to USD 64,474.81 as its participation declined from 80 to 20%, while the 100% SH configuration reached USD 200,834.64 (Table 8).
3.15 Economically Feasible Alternative
Economic feasibility was evaluated using NPV, IRR, DPP, and profit margin, according to [31]. All simulated configurations presented positive NPV values, ranging from USD 38,295.04 to USD 141,014.59, while IRR ranged from 22.21 to 45.80%. DPP varied between 1.00 and 2.65 years, and profit margin ranged from 0.13 to 0.30 (Table 9).
The highest NPV was obtained for the 120-batch configuration with 60% GP–40% SH, reaching USD 141,014.59. This alternative also presented the highest IRR and profit margin, with values of 45.80% and 0.30, respectively, and a DPP of 1.36 years. The next highest NPV values corresponded to the 10-batch configurations with 80% GP–20% SH and 40% GP–60% SH, reaching USD 136,566.51 and USD 135,432.36, respectively (Table 9).
3.16 Existence of Other Technologies and New Capacities
The selection of the GP technology proposed by [22], was mainly based on the study area, the province of Pastaza, due to the limited availability of scientific literature on GP production in the region. An additional advantage of this work is the possibility of comparing results within the same study context. The selection of the SH technology proposed by [7], was based on its simulation approach, where random values with Beta distribution are generated. Other studies were not considered because few works relate the three quality attributes analyzed in SH. The selected study allows comparison of sigma levels with the present work.
New capacities were not evaluated because economic and environmental indicators, as well as quality attributes, were favorable. In addition, five simulations per batch were considered sufficient. Each multipurpose configuration involved 15 simulations, resulting in a total of 90 simulations, excluding additional iterations required when the sigma level was lower than 3.
3.17 General Greenscope Análisis
The 120-batch configuration with 60% GP–40% SH was selected for the GREENSCOPE assessment because it achieved the highest economic profitability. The indicators were normalized between 0% and 100%, where 0% represents the least favorable reference condition and 100% represents the best condition [14]. Health Hazard–irritation factor (HHirritation), Health Hazard–chronic toxicity factor (HHchronic toxicity), Safety Hazard–acute toxicity (SHacute tox), and Global Warming Potential (GWP) reached 100%, while the aquatic oxygen-demand indicator (WPO₂ dem.) reached approximately 40% (Figure 9).
Specific Energy Intensity (RSEI) reached 78%, Energy Intensity (RIE) reached 20%, and the Renewability–Exergy Index (RIEx) reached 57%. Mass Intensity (MI) recorded approximately 95%, whereas the Renewability–Material Index (RIM) and Fractional Water Consumption (FWC) reached 100%. The economic indicator Turnover Ratio (TR) also obtained a normalized score of 100% (Figure 9).
3.18 Optimal Technology and Capacity
Investment costs and economic indicators were compared across the evaluated production configurations using Figure 8 and Table 9. The 120-batch configuration with 60% GP–40% SH was selected because it achieved the highest net present value (NPV) of USD 141,014.59, internal rate of return (IRR) of 45.80%, and profit margin of 0.30. This configuration presented a discounted payback period (DPP) of 1.36 years and required a total investment of USD 140,133.25.
The GREENSCOPE assessment showed favorable scores for several environmental, material-efficiency, and economic indicators, although the energy indicators presented lower normalized values (Figure 9). Based on the combined technical, economic, and sustainability results, the 120-batch configuration with 60% GP–40% SH was selected as the preferred alternative among the evaluated scenarios.
4. Discussion
The constant flow of 116.09 kg at the outlet of evaporator 3 indicates that changes in the GP–SH production ratio did not modify the upstream mass balance. Product differentiation began after the third evaporation stage through the allocation of the concentrated stream to cooling and hydrolysis or to concentration and crystallization. This arrangement supports the integration of milling, filtration, heating, and evaporation within a common processing line. The calculated behavior agreed with the technological sequence reported by [16].
The additional iterations recorded in SH were associated with the simultaneous evaluation of three response variables. A simulated condition was rejected when viscosity, flavor, or crystal presence failed to reach the established sigma level. The combined dependence of these responses on pH and °Brix reduced the number of acceptable operating combinations. The difference from [7] may be associated with the multipurpose simulation structure, where shared operations and two final product routes were evaluated within the same computational procedure.
The absence of additional iterations in the 100% GP configurations indicates greater stability of the ICUMSA response within the programmed ranges. The ICUMSA values were consistent with the acceptance interval reported by [19], while the pH and °Brix conditions were close to those described by [22]. However, the value of 94.23 °Brix obtained during crystallization exceeded the predefined upper limit by 0.23 °Brix. This deviation requires verification before defining the final operating interval, because excessive concentration may modify crystallization behavior and the physical characteristics of GP.
The highest unit environmental indicators were recorded when GP or SH represented the minority product in the multipurpose configuration. This behavior was associated with the allocation of shared material and energy requirements to a smaller product mass. Bagasses were the main solid residues, while water vapor originated during juice concentration. [32] reported that panela processing can also generate effluents with high BOD, COD, and suspended solids. [33] estimated wastewater generation near 1,000 L/t of product in sugar processing. These studies support the need to include liquid-effluent treatment, although BOD, COD, and wastewater volume were not directly quantified in the present simulation.
The simulated quality responses were consistent with the operating conditions reported by [30] for GP and [12] for SH. This agreement indicates that the proposed modifications can be incorporated through better control of pH, °Brix, and temperature while retaining the existing unit operations. Their application may support process standardization and reduce variability in artisanal production.
The constant areas calculated for the shared equipment were consistent with the values reported by [12], supporting the mass-flow and thermal assumptions applied to the common processing stages. The increase in concentrator and crystallizer areas was associated with the larger material flow assigned to the GP route. Deviations from the correlations proposed by [34] may be related to their application at capacities below the industrial scale. Larger heat-transfer areas also increase acquisition costs because equipment-cost correlations depend on size and processing capacity.
The higher total investment associated with 100% GP was related to the concentrator and crystallizer required in its production route. The 100% SH configuration presented the second-highest investment because the complete mass flow of 116.09 kg per batch was processed through its specific operations. Multipurpose configurations reduced investment through the shared use of milling, filtration, heating, and evaporation equipment. The cost variations in Table 8 were associated with the production proportion assigned to each product and the allocation of fixed and operating expenses. Equipment-cost estimation followed the capacity-scaling procedure reported by [34].
The positive NPV values indicate that all simulated configurations recovered the initial investment and generated economic returns under the assumptions applied. The 120-batch configuration with 60% GP–40% SH presented the best combined performance because it reached the highest NPV, IRR, and profit margin. The estimated NPV values were comparable with those reported by [12]. The variation among configurations indicates that profitability depended on batch size, product proportion, production costs, and expected revenues rather than following the increasing pattern observed in equipment size and investment cost.
5. Conclusions
The integration of process simulation and GREENSCOPE enabled the technical, economic, environmental, energy, and material-efficiency assessment of the multipurpose process. Simulation reduced uncertainty in the quality responses of GP and SH through iterative adjustment of operating conditions until the established sigma-level criterion was achieved. GREENSCOPE complemented the process evaluation using normalized sustainability indicators rather than production stages.
Among the evaluated alternatives, the 120-batch configuration with 60% GP–40% SH presented the best economic performance, with an NPV of USD 141,014.59, an IRR of 45.80%, a DPP of 1.36 years, a profit margin of 0.30, and an investment cost of USD 140,133.25. This configuration reached a sigma level of 3.8. SH presented a pH range of 3.76–4.22 and soluble solids of 76.5–78 °Brix, while GP reached pH values of 5.70–6.98 and soluble solids of 92.4–94.23 °Brix.
The GREENSCOPE assessment showed favorable normalized performance for HHirritation, HHchronic toxicity, SHacute tox, GWP, RIM, FWC, and TR. The values of 100% represented the best reference condition and did not indicate maximum toxicity or environmental damage. The lower scores obtained for energy intensity, renewable exergy, and aquatic oxygen demand identified energy use and liquid-effluent management as the main areas requiring technological improvement.
6. Patents
This section is not mandatory but may be added if there are patents resulting from the work reported in this manuscript.
Supplementary Materials
The following supporting information can be downloaded at Preprints.org, Table S1: Description of the steps of the proposed procedure for multipurpose process design.
Author Contributions
For research articles with several authors, a short paragraph specifying their individual contributions must be provided. The following statements should be used “Conceptualization, A.P.M.; methodology, R.D.V.-P. and E.G.Y.; software, R.D.V.-P. and A.P.M.; validation, R.D.V.-P. and E.G.Y.; formal analysis, R.D.V.-P.; investigation, R.A.-N.; resources, E.G.Y.; data curation, R.A.-N.; writing—original draft preparation, R.D.V.-P. and E.G.Y.; writing—review and editing, A.P.M.; visualization, R.D.V.-P. and R.A.-N.; supervision, A.P.M.; project administration, R.A.-N.; funding acquisition, R.A.-N.
Funding
The APC was funded by Universidad Estatal Amazónica”.
Data Availability Statement
All data is shown in the manuscript
Acknowledgments
The authors would like to thank Gerardo J. Ruiz-Mercado at the U.S. Environmental Protection Agency for his suggestions and guidance in preparing the article.
Conflicts of Interest
The authors declare no conflicts of interest.
Abbreviations
The following abbreviations are used in this manuscript:
| Symbol | Definition | Unit |
| ColFin | Final color | IU |
| pHEvap4 | pH in evaporator 4 | – |
| TiempDCEvap4 | Residence time in concentrator/evaporator 4 | s |
| TfEvap4 | Final temperature in evaporator 4 | °C |
| TfEvap3 | Final temperature in evaporator 3 | °C |
| pHCrystGP | pH in the GP crystallizer | – |
| tAgCrystGP | Agitation time in the GP crystallizer | s |
| TfCrystGP | Final temperature in the GP crystallizer | °C |
| V | Predicted viscosity response | – |
| S | Predicted flavor response | – |
| C | Predicted crystal-presence response | – |
| JCSEvap3 | Sugarcane juice leaving evaporator 3 | kg |
| JCEEvap4 | Sugarcane juice entering evaporator 4 | kg |
| JCSCryst | GP stream leaving the crystallizer | kg |
| ConsMPPG | Raw material consumption for GP | kg sugarcane/kg GP |
| ConsJCPG | Sugarcane juice consumption for GP | kg juice/kg GP |
| ConsEnergPG | Energy consumption for GP | J/kg GP |
| VRSPG | Solid waste discharge from GP production | kg bagasse and bagacillo/kg GP |
| ResGPG | Gaseous residue generation from GP production | kg water vapor/kg GP |
| ConsMPMC | Raw material consumption for SH | kg sugarcane/kg SH |
| ConsJCMC | Sugarcane juice consumption for SH | kg juice/kg SH |
| ConsEnergMC | Energy consumption for SH | J/kg SH |
| VRSMC | Solid waste discharge from SH production | kg bagasse and bagacillo/kg SH |
| ResGMC | Gaseous residue generation from SH production | kg water vapor/kg SH |
| DPMO | Defects per million opportunities | defects/10⁶ opportunities |
References
- Rauch, J. Multiproduct Plants. 244 Pages. 2006. Available online: https://www.wiley.com/en-us/Multiproduct+Plants-p-9783527605064.
- Burbano, F. J.; Orejuela, J. P.; Chud, V. L. Definición del tamaño de lote de producción considerando la trazabilidad. Rev. U.D.C.A Actual. Divulg. Científica 2018, vol. 21, 467–477. [Google Scholar] [CrossRef]
- Pugno, M. Economic growth and people's well-being in advanced countries; 2022; pp. 7–27. [Google Scholar] [CrossRef]
- Hernandez, R. J.; Goñi, J. Responsible Design for Sustainable Innovation: Towards an Extended Design Process. Processes 2020, vol. 8(12), 1574. Available online: https://www.mdpi.com/2227-9717/8/12/1574.
- Arora, J. S. Chapter 1 - Introduction to Design Optimization. In Introduction to Optimum Design (Fourth Edition); Arora, J. S., Ed.; Academic Press, 2017; pp. 3–18. [Google Scholar] [CrossRef]
- Pérez-Martínez, A.; Cervantes-Mendieta, E.; Julián-Ricardo, M.; González-Suárez, E.; Gómez-Atanay, A.; Oquendo-Ferrer, H.; Galindo-Llanes, P.; Ramos-Sánchez, L. Procedimiento para enfrentar tareas de diseño de procesos de la industria azucarera y sus derivados. Rev. Mex. De Ing. Quím. 2012, vol. 11(2), 333–349. Available online: http://www.scielo.org.mx/scielo.php?pid=S1665-27382012000200012&script=sci_abstract.
- Cerda-Mejía, V.; Pérez-Martínez, A.; Guardado-Yordi, E.; Cerda-Mejia, G.; Diéguez-Santana, K.; Benítez-Cortés, I.; González-Suárez, E. Simulation Strategy to Reduce Quality Uncertainty in the Sugar Cane Honey Process Design. Ing. E Investig. 2021, vol. 41(N.1), 1–11. [Google Scholar] [CrossRef]
- Sengupta, D.; Abraham, J. P.; Ceja, M.; Gonzalez, M. A.; Ingwersen, W. W.; Ruiz-Mercado, G. J.; Smith, R. L. Industrial process system assessment: bridging process engineering and life cycle assessment through multiscale modeling. J. Clean. Prod. 2015, vol. 90, 142–152. [Google Scholar] [CrossRef]
- Vyhmeister, E.; Ruiz-Mercado, G. J.; Torres, A. I.; Posada, J. A. Optimization of multi-pathway production chains and multi-criteria decision-making through sustainability evaluation: a biojet fuel production case study. Clean. Technol. Environ. Policy 2018, vol. 20(7), 1697–1719. [Google Scholar] [CrossRef] [PubMed]
- Smith, R. L.; Tan, E. C. D.; Ruiz-Mercado, G. J. Applying Environmental Release Inventories and Indicators to the Evaluation of Chemical Manufacturing Processes in Early Stage Development. ACS Sustain. Chem. Eng. 2019, vol. 7(12), 10937–10950. [Google Scholar] [CrossRef] [PubMed]
- Virginia, M.; Guerra, M.; Soto, N. Efecto de la variedad, lavado de la caña y temperatura de punteo sobre la calidad de la panela granulada. INTERCIENCIA 2008, vol. Vol, 33(8), 598–603. Available online: http://ve.scielo.org/scielo.php?pid=S0378-18442008000800010&script=sci_arttext&tlng=en.
- Cerda, V.; González, E.; Millán, H.; Ramos, J.; Pérez, A. Estudio de viabilidad de la producción de miel de caña, diseño de procesos, aceptabilidad y análisis económico. Tecnol. Quím. 2020, vol. Vol. 40(No. 3), 517–533. Available online: http://scielo.sld.cu/scielo.php?script=sci_arttext&pid=S2224-61852020000300517.
- Peña-Arenas, I. G.; López-Castro, L. F. Algoritmo genético para solucionar el problema de dimensionamiento y programación de lotes con costos de alistamiento dependientes de la. Ing. Y Desarro. 2016, vol. 34(1), 64–87. [Google Scholar] [CrossRef]
- Ruiz-Mercado, G. J.; Gonzalez, M. A.; Smith, R. L. Expanding GREENSCOPE beyond the gate: a green chemistry and life cycle perspective. Clean. Technol. Environ. Policy 2014, vol. 16(4), 703–717. [Google Scholar] [CrossRef]
- Pérez-Martínez, A.; Benítez-Cortés, I.; Oquendo-Ferrer, H.; Julián-Ricardo, M. C.; Galindo-Llanes, P. Integración del diseño del sistema de control automático al diseño total de una planta para obtención de alimento animal a partir de residuos de la industria azucarera. ICIDCA. Sobre Los Deriv. De La Caña De Azúcar 2013, vol. 47(Núm. 2), 42–51. Available online: http://www.redalyc.org/articulo.oa?id=223128548007.
- Cerda-Mejía, V.; Quezada-Moreno, W. F.; Pérez-Martínez, A.; Oquendo-Ferrer, H.; Torres-Cárdenas, V.; Cerda-Mejía, L.; González-Suarez, E. Influence of the variability of the operational parameters in obtaining cane syrup in sensorial attributes. MOL2NET 2016, 1–8. [Google Scholar] [CrossRef]
- Rodríguez-Entrena, M.; Salazar-Ordoñez, M.; Cordón Pedregosa, M. R.; Cardenas, J. Analysing granulated brown sugar – panela – market in Western Honduras. Br. Food J. 2016, vol. 118, 495–512. [Google Scholar] [CrossRef]
- Panela granulada. Requisitos. INEN 2332; Instituto Ecuatoriano de Normalizacion. 2002; vol. Primera Edición 1-8.
- Saska, M. Method for producing white sugar. U. S. 2000, vol. 6(096,136(08/733,515 )), 1–6. Available online: https://patentimages.storage.googleapis.com/00/14/4a/d3319dd1794cc7/US6096136.pdf.
- INEN 261. Melazas. Requisitos. In Norma Técnica Ecuatoriana Voluntaria; 1977; pp. 1–5.
- Quezada, W.; González, E.; Quezada, T.; Mera, M. Cane Honey: Process, Quality and Harmlessness. Int. J. Eng. Res. 2016, vol. 5, 589–593. Available online: http://www.i-scholar.in/index.php/IJER/article/view/159495.
- Cerda-Mejía, V. R.; Pérez-Martínez, A.; González-Suárez, E. El diseño de procesos bajo condiciones de incertidumbre: estrategia para el desarrollo socio-económico en la agroindustria ecuatoriana. Univ. Y Soc. 2019, vol. 11(5), 131–139. Available online: http://rus.ucf.edu.cu/index.php/rus.
- Quezada-Moreno, W. F.; Quezada-Torres, W. D.; Gallardo-Aguilar, I. Plantas mucilaginosas en la clarificación del jugo de la caña de azúcar. Cent. Azúcar 2016, vol. Vol 43, 1–11. Available online: http://scielo.sld.cu/pdf/caz/v43n2/caz01216.pdf.
- Albernas-Carvajal, Y.; González-Cortés, M.; González-Suárez, E.; CorsanoII, G.; Verelst, H. Procedimiento para la síntesis y diseño óptimo de plantas discontinuas (Parte I). Tecnol. Quím. 2012, vol. Vol.32(No.3), 204–212. Available online: http://scielo.sld.cu/scielo.php?script=sci_arttext&pid=S2224-61852012000300005.
- Lagos-Burbano, E.; Castro-Rincón, E. Sugar cane and by-products of the sugar agro-industry in ruminant feeding: A review. Agron. Mesoam. 2019, vol. 30(3), 917–934. [Google Scholar] [CrossRef]
- FAO. Cosecha, poscosecha y producción de panela. Buenas Prácticas Agrícolas (BPA) y Buenas Prácticas de Manufactura (BPM) En. La Prod. De Caña Y Panela 2014, vol. 6, 113–127. Available online: https://www.fao.org/3/a1525s/a1525s05.pdf.
- GADPP’z. Producción de Caña de Azúcar por Parroquia. Mapa de Producción de Caña de Azúcar por Parroquia de la Provincia de Pastaza. 2020. Available online: https://pastaza.gob.ec/download/produccion-de-cana-de-azucar-por-parroquia/.
- Keller, P. Six Sigma Demystified . In nd Edition; McGraw-Hill, 2011; Vol. 2. [Google Scholar]
- Quezada-Moreno, W.; Gallardo- Aguilar, I.; Quezada-Torres, W. Temperatura y concentración del jugo de caña según pisos climáticos en Ecuador. ICIDCA. Sobre Los Deriv. De La Caña De Azúcar 2015, vol. 49(1), 17–21. Available online: https://www.redalyc.org/articulo.oa?id=223136961003.
- Cerda, V.; Yordi, E.; Cerda Mejía, G.; Vinocunga-Pillajo, R. D.; Perez, A.; González, E. Procedure for the determination of operation and design parameters considering the quality of non-centrifugal cane sugar. Entre Cienc. E Ing. 2022, vol. 16, 43–50. [Google Scholar] [CrossRef]
- Popovic, T.; Kraslawski, A.; Avramenko, Y. Applicability of Sustainability Indicators to Wastewater Treatment Processes. In Computer Aided Chemical Engineering; Kraslawski, A., Turunen, I., Eds.; Elsevier, 2013; Vol. 32, pp. 931–936. [Google Scholar] [CrossRef]
- Ranjan, P.; Singh, S.; Muteen, A.; Biswas, M. K.; Vidyarthi, A. K. Environmental reforms in sugar industries of India: An appraisal. Environ. Chall. 2021, vol. 4, 100159. [Google Scholar] [CrossRef]
- Vaithiyanathan, T.; Sundaramoorthy, P. Analysis of sugar mill effluent and its influence on germination and growth of African marigold (Tagetes erecta L.). Appl. Water Sci. 2017, vol. 7(8), 4715–4723. [Google Scholar] [CrossRef]
- Peters, M. S.; Timmerhaus, K.; West, R. Plant Design and Economics for Chemical Engineers,. Fifth. In New York: McGraw Hill; 2003. [Google Scholar]
Figure 1.
Procedure for the design, modeling, and simulation of sustainable multipurpose processes. Adapted from [6,14].
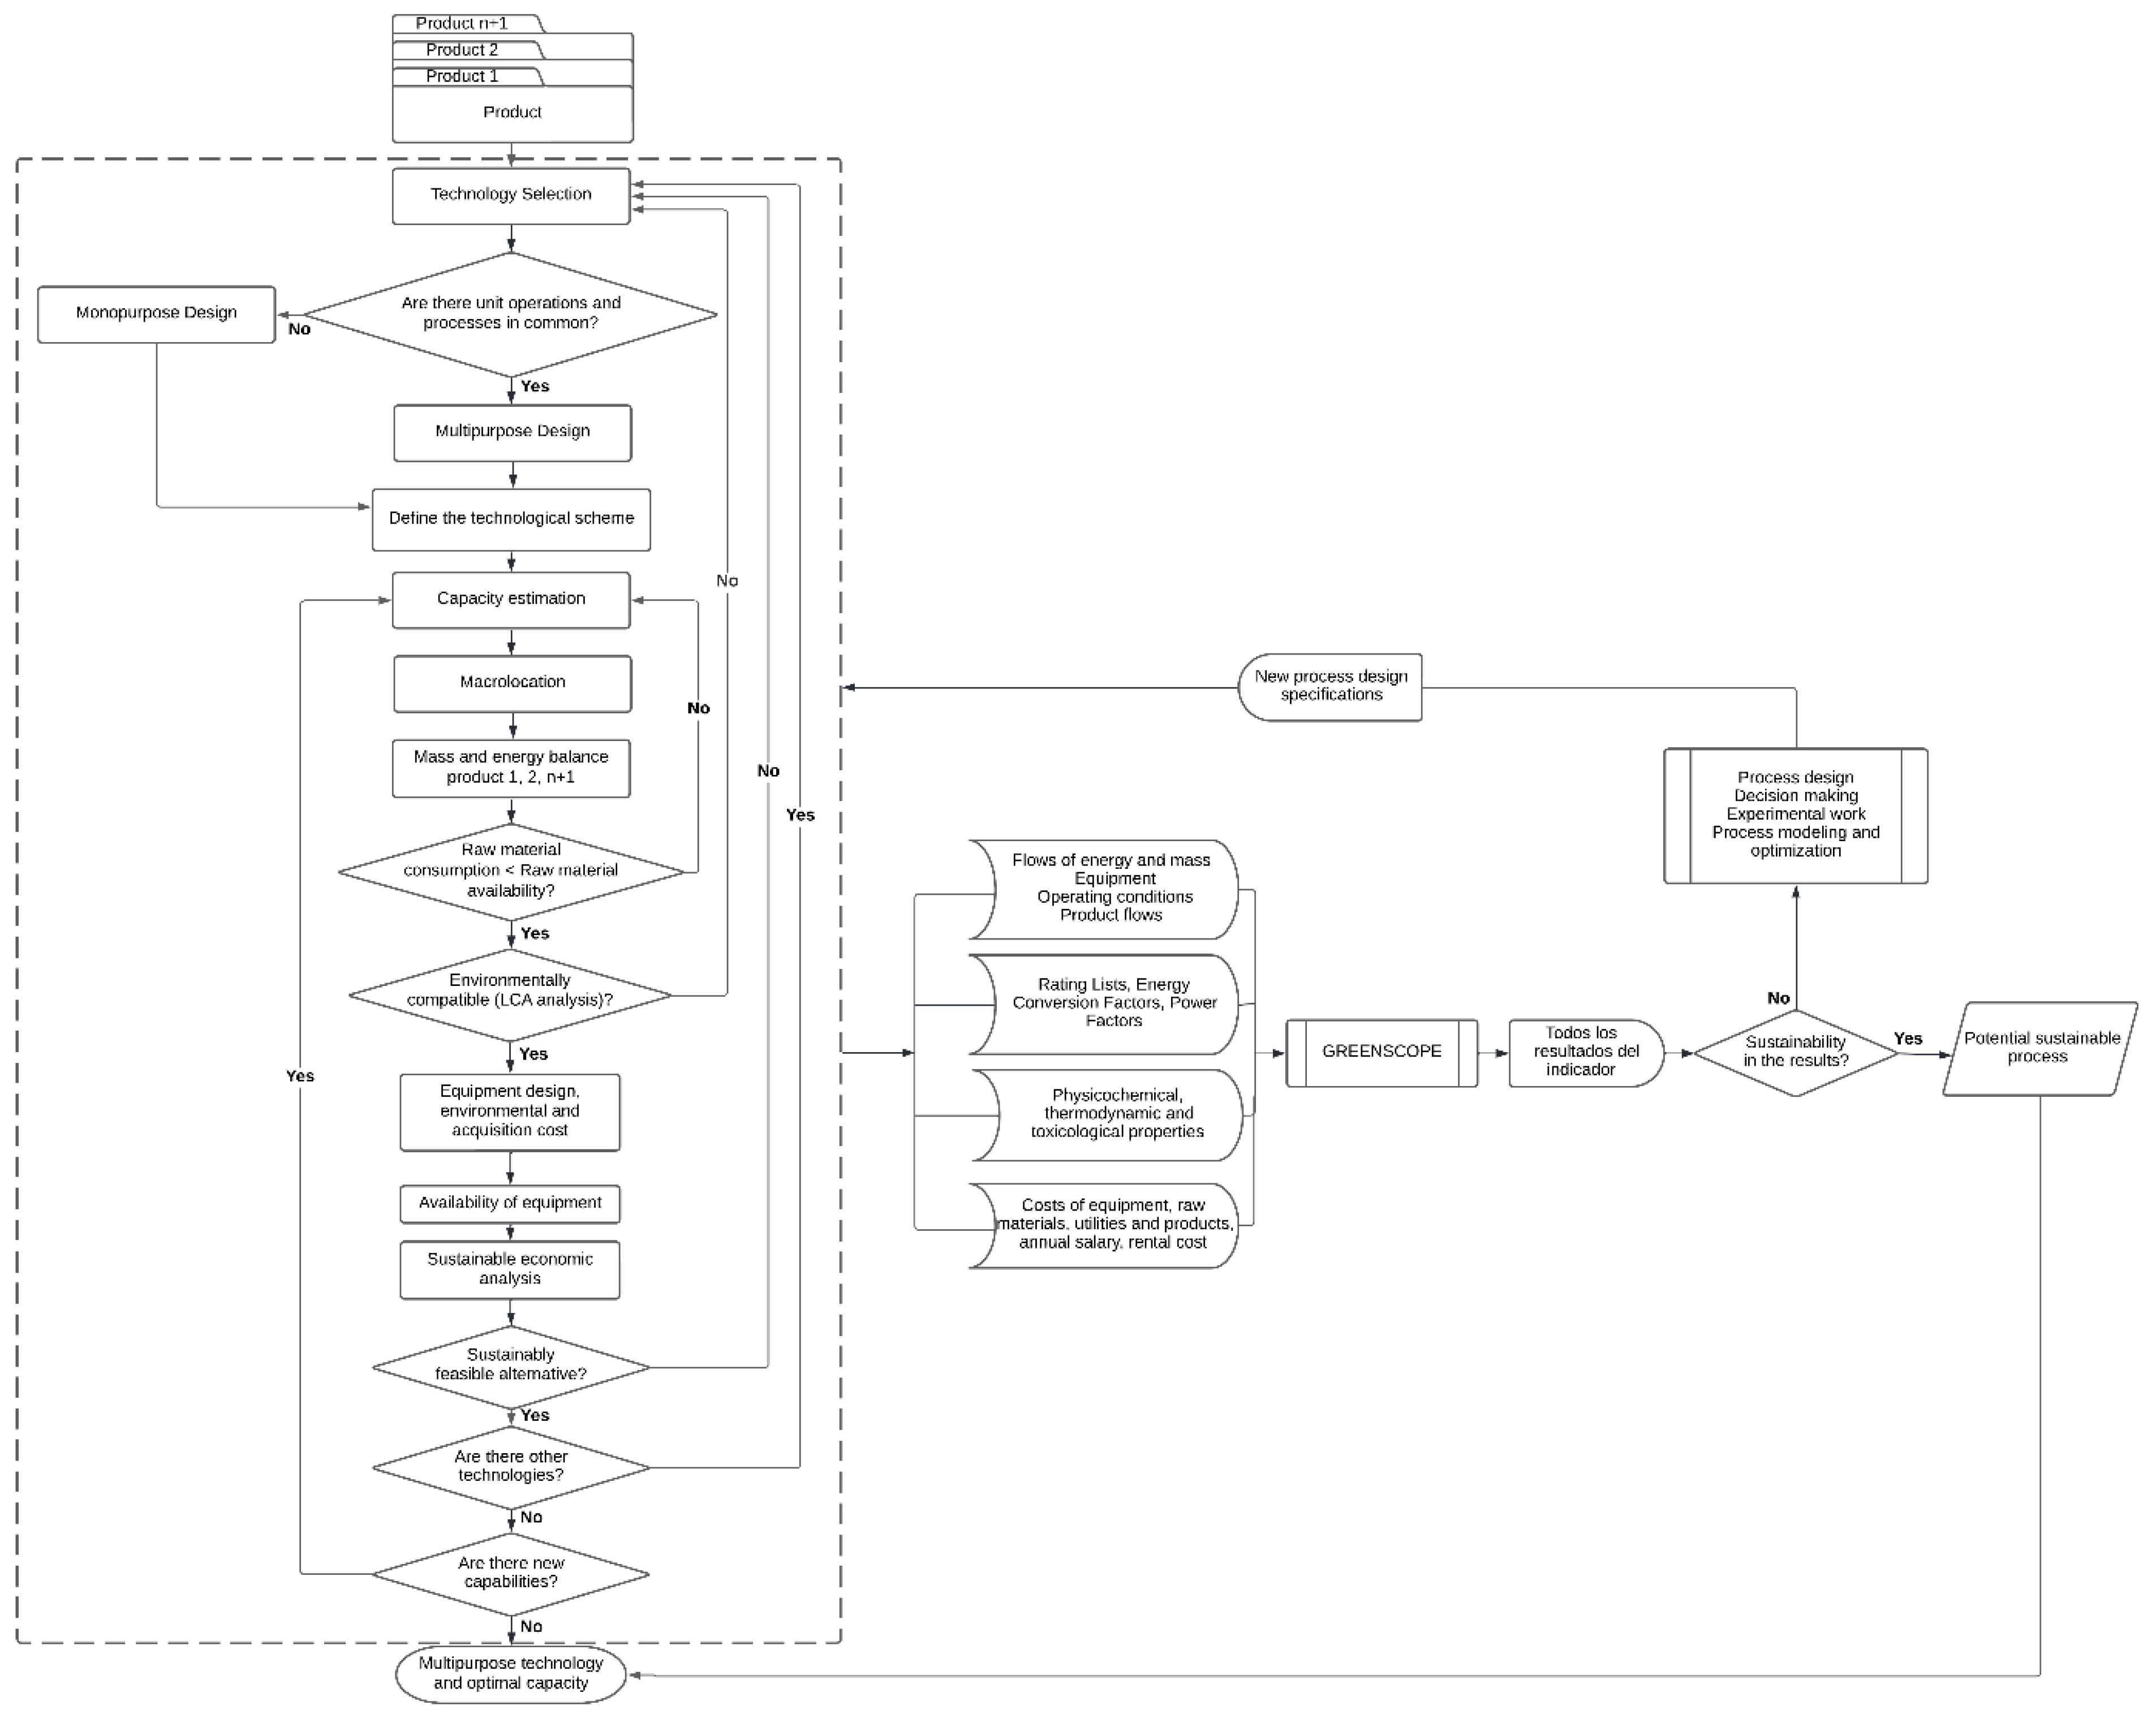
Figure 2.
Diagram of the SH production process (A) and diagram of the GP production process (B). Adapted from [7,22].
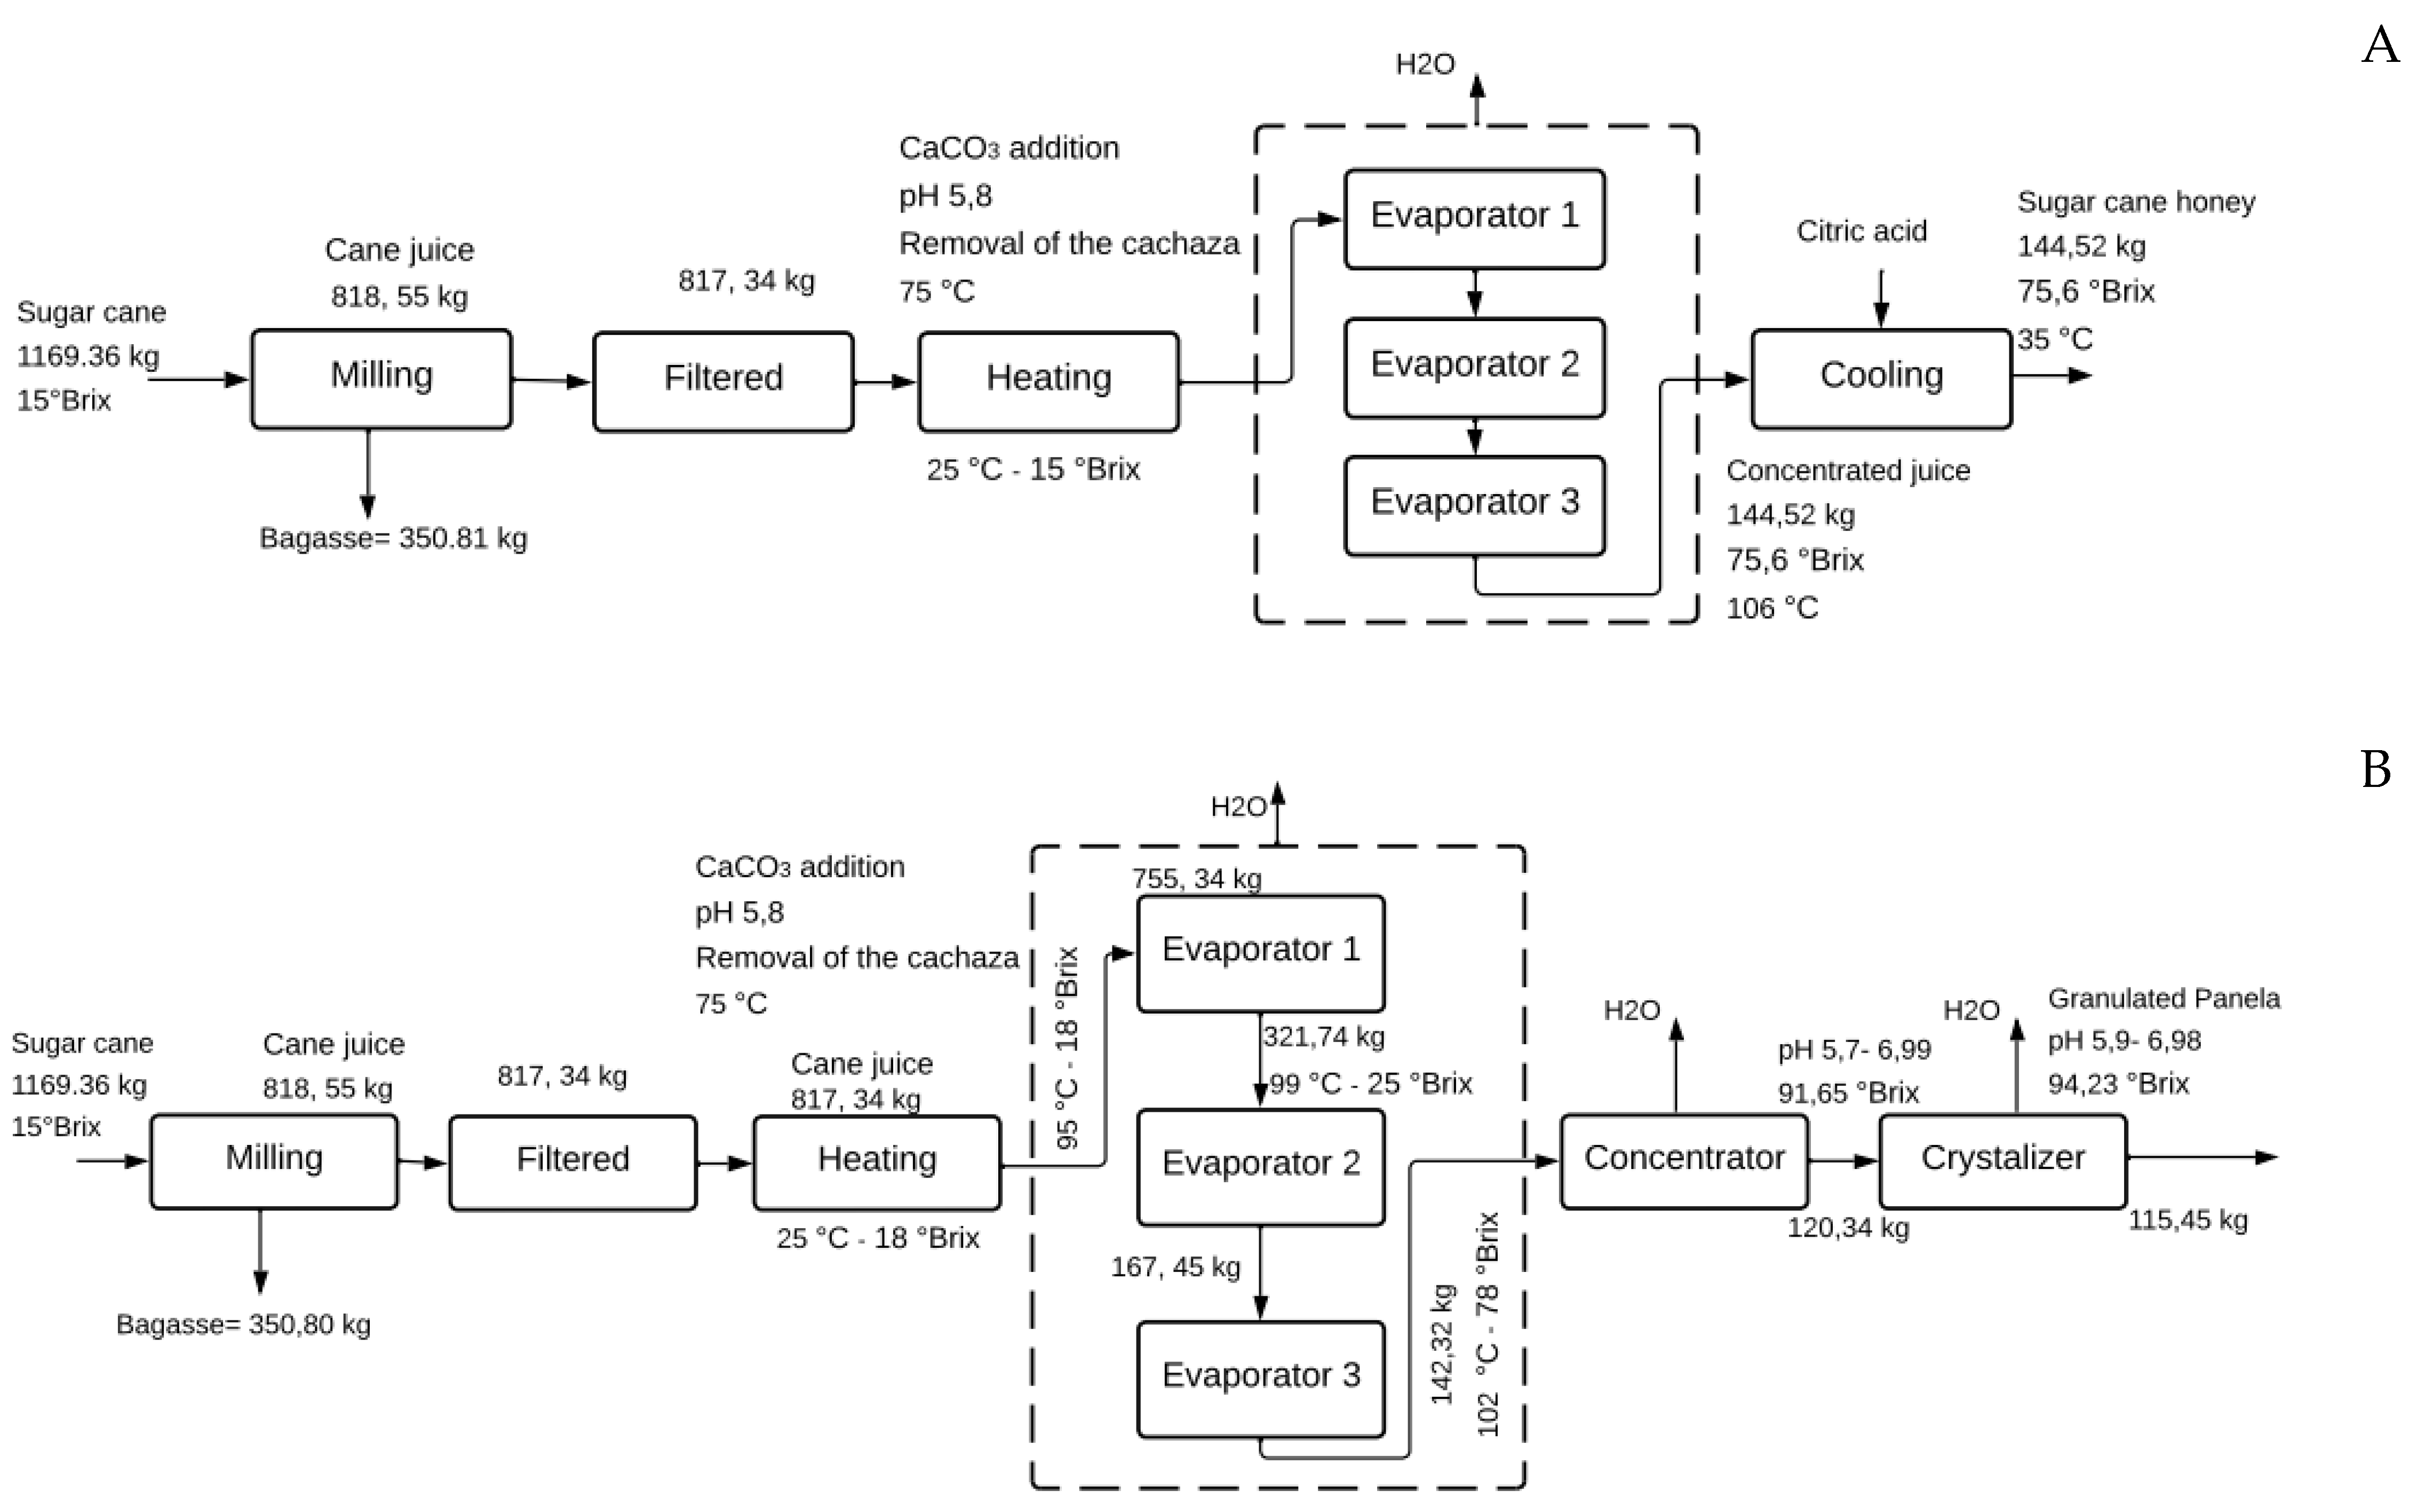
Figure 3.
Differences and similarities between GP and SH production.
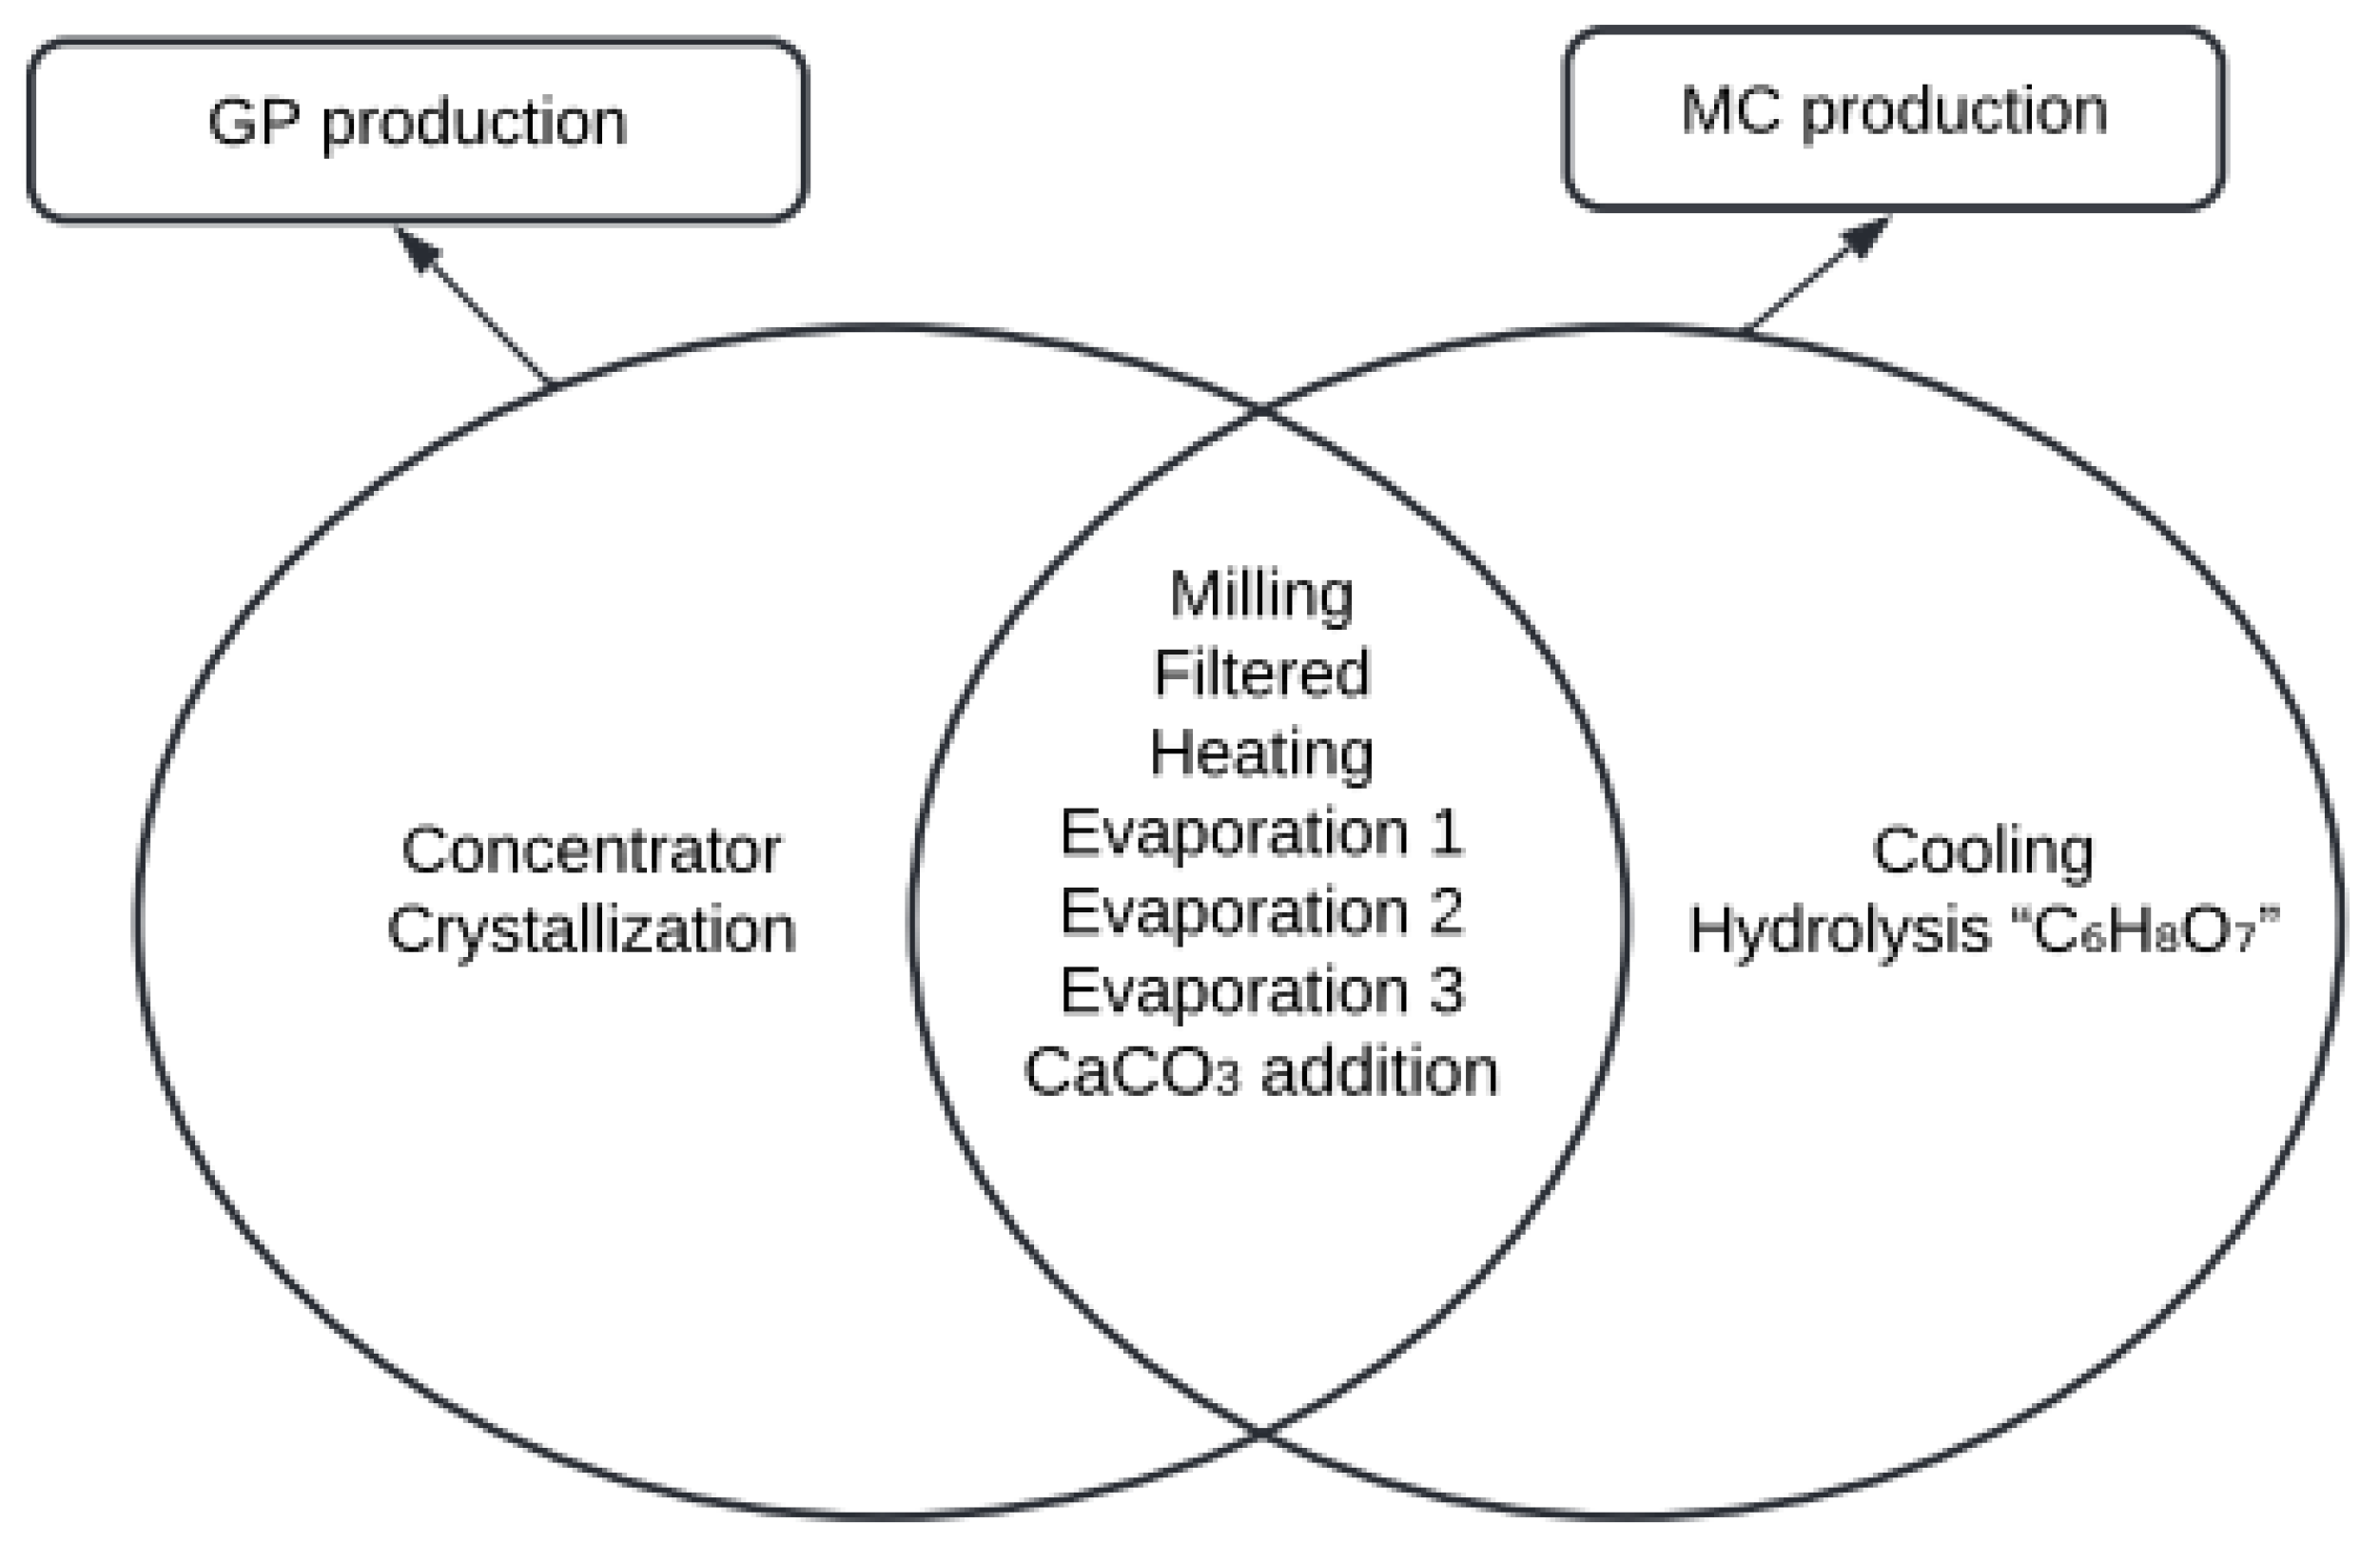
Figure 4.
Diagram of the multipurpose process.
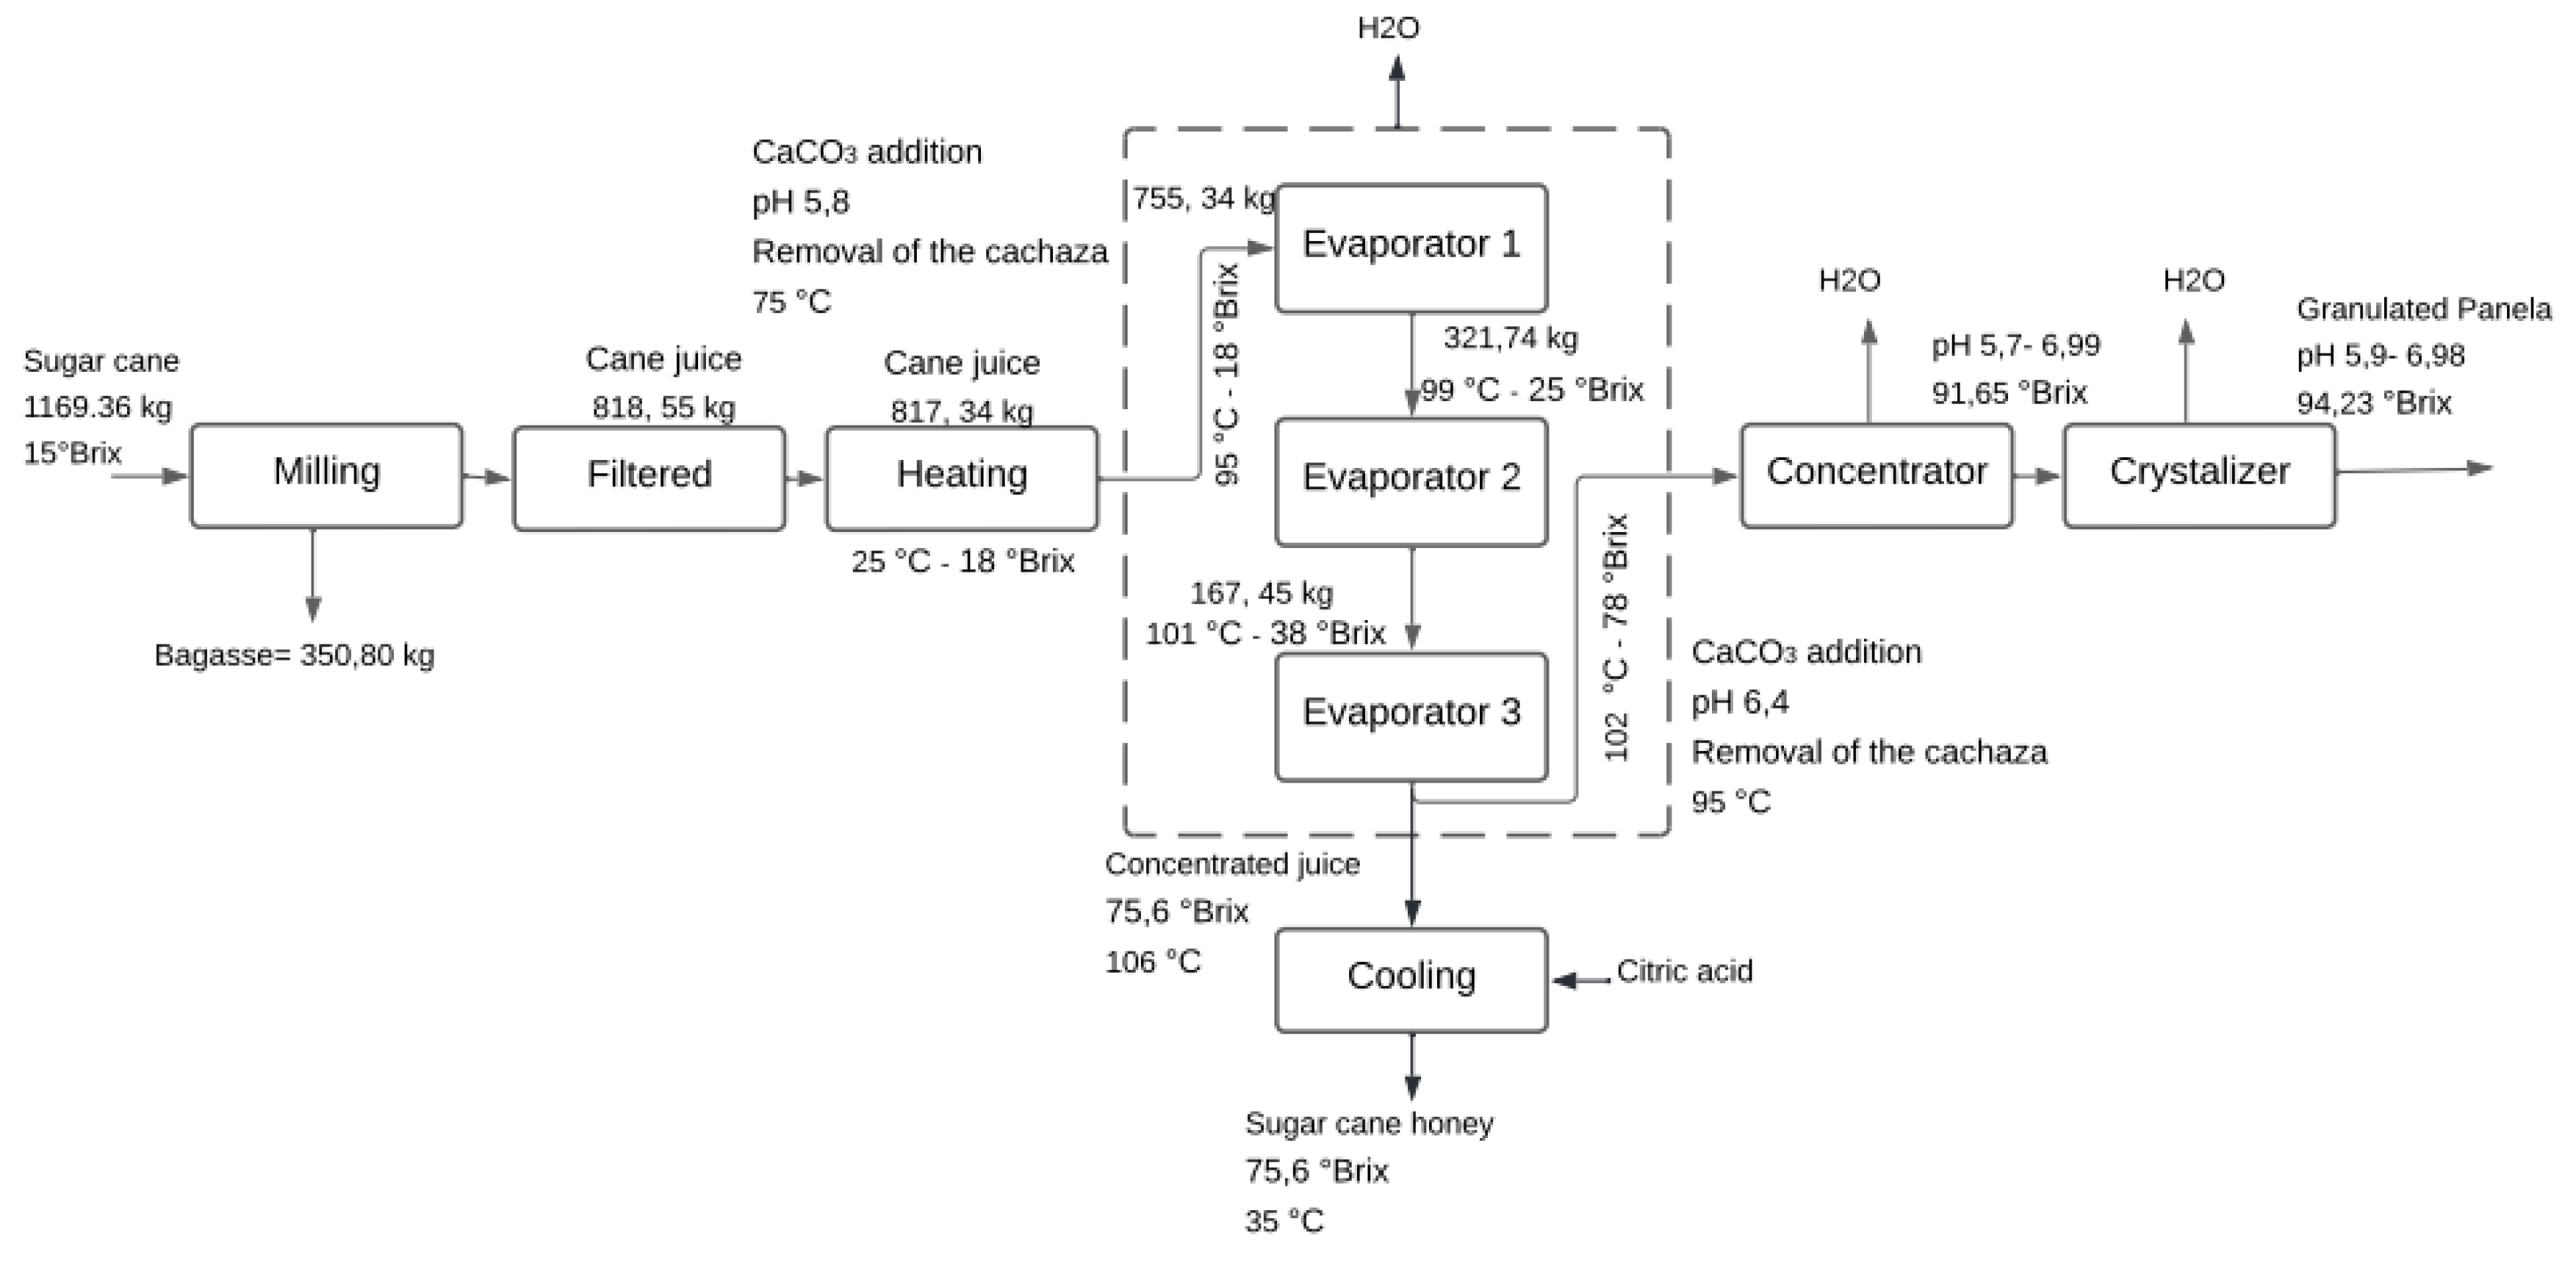
Figure 5.
Crystal presence, flavor, and viscosity in multipurpose production for 10, 120, and 1560 batches.
Figure 5.
Crystal presence, flavor, and viscosity in multipurpose production for 10, 120, and 1560 batches.
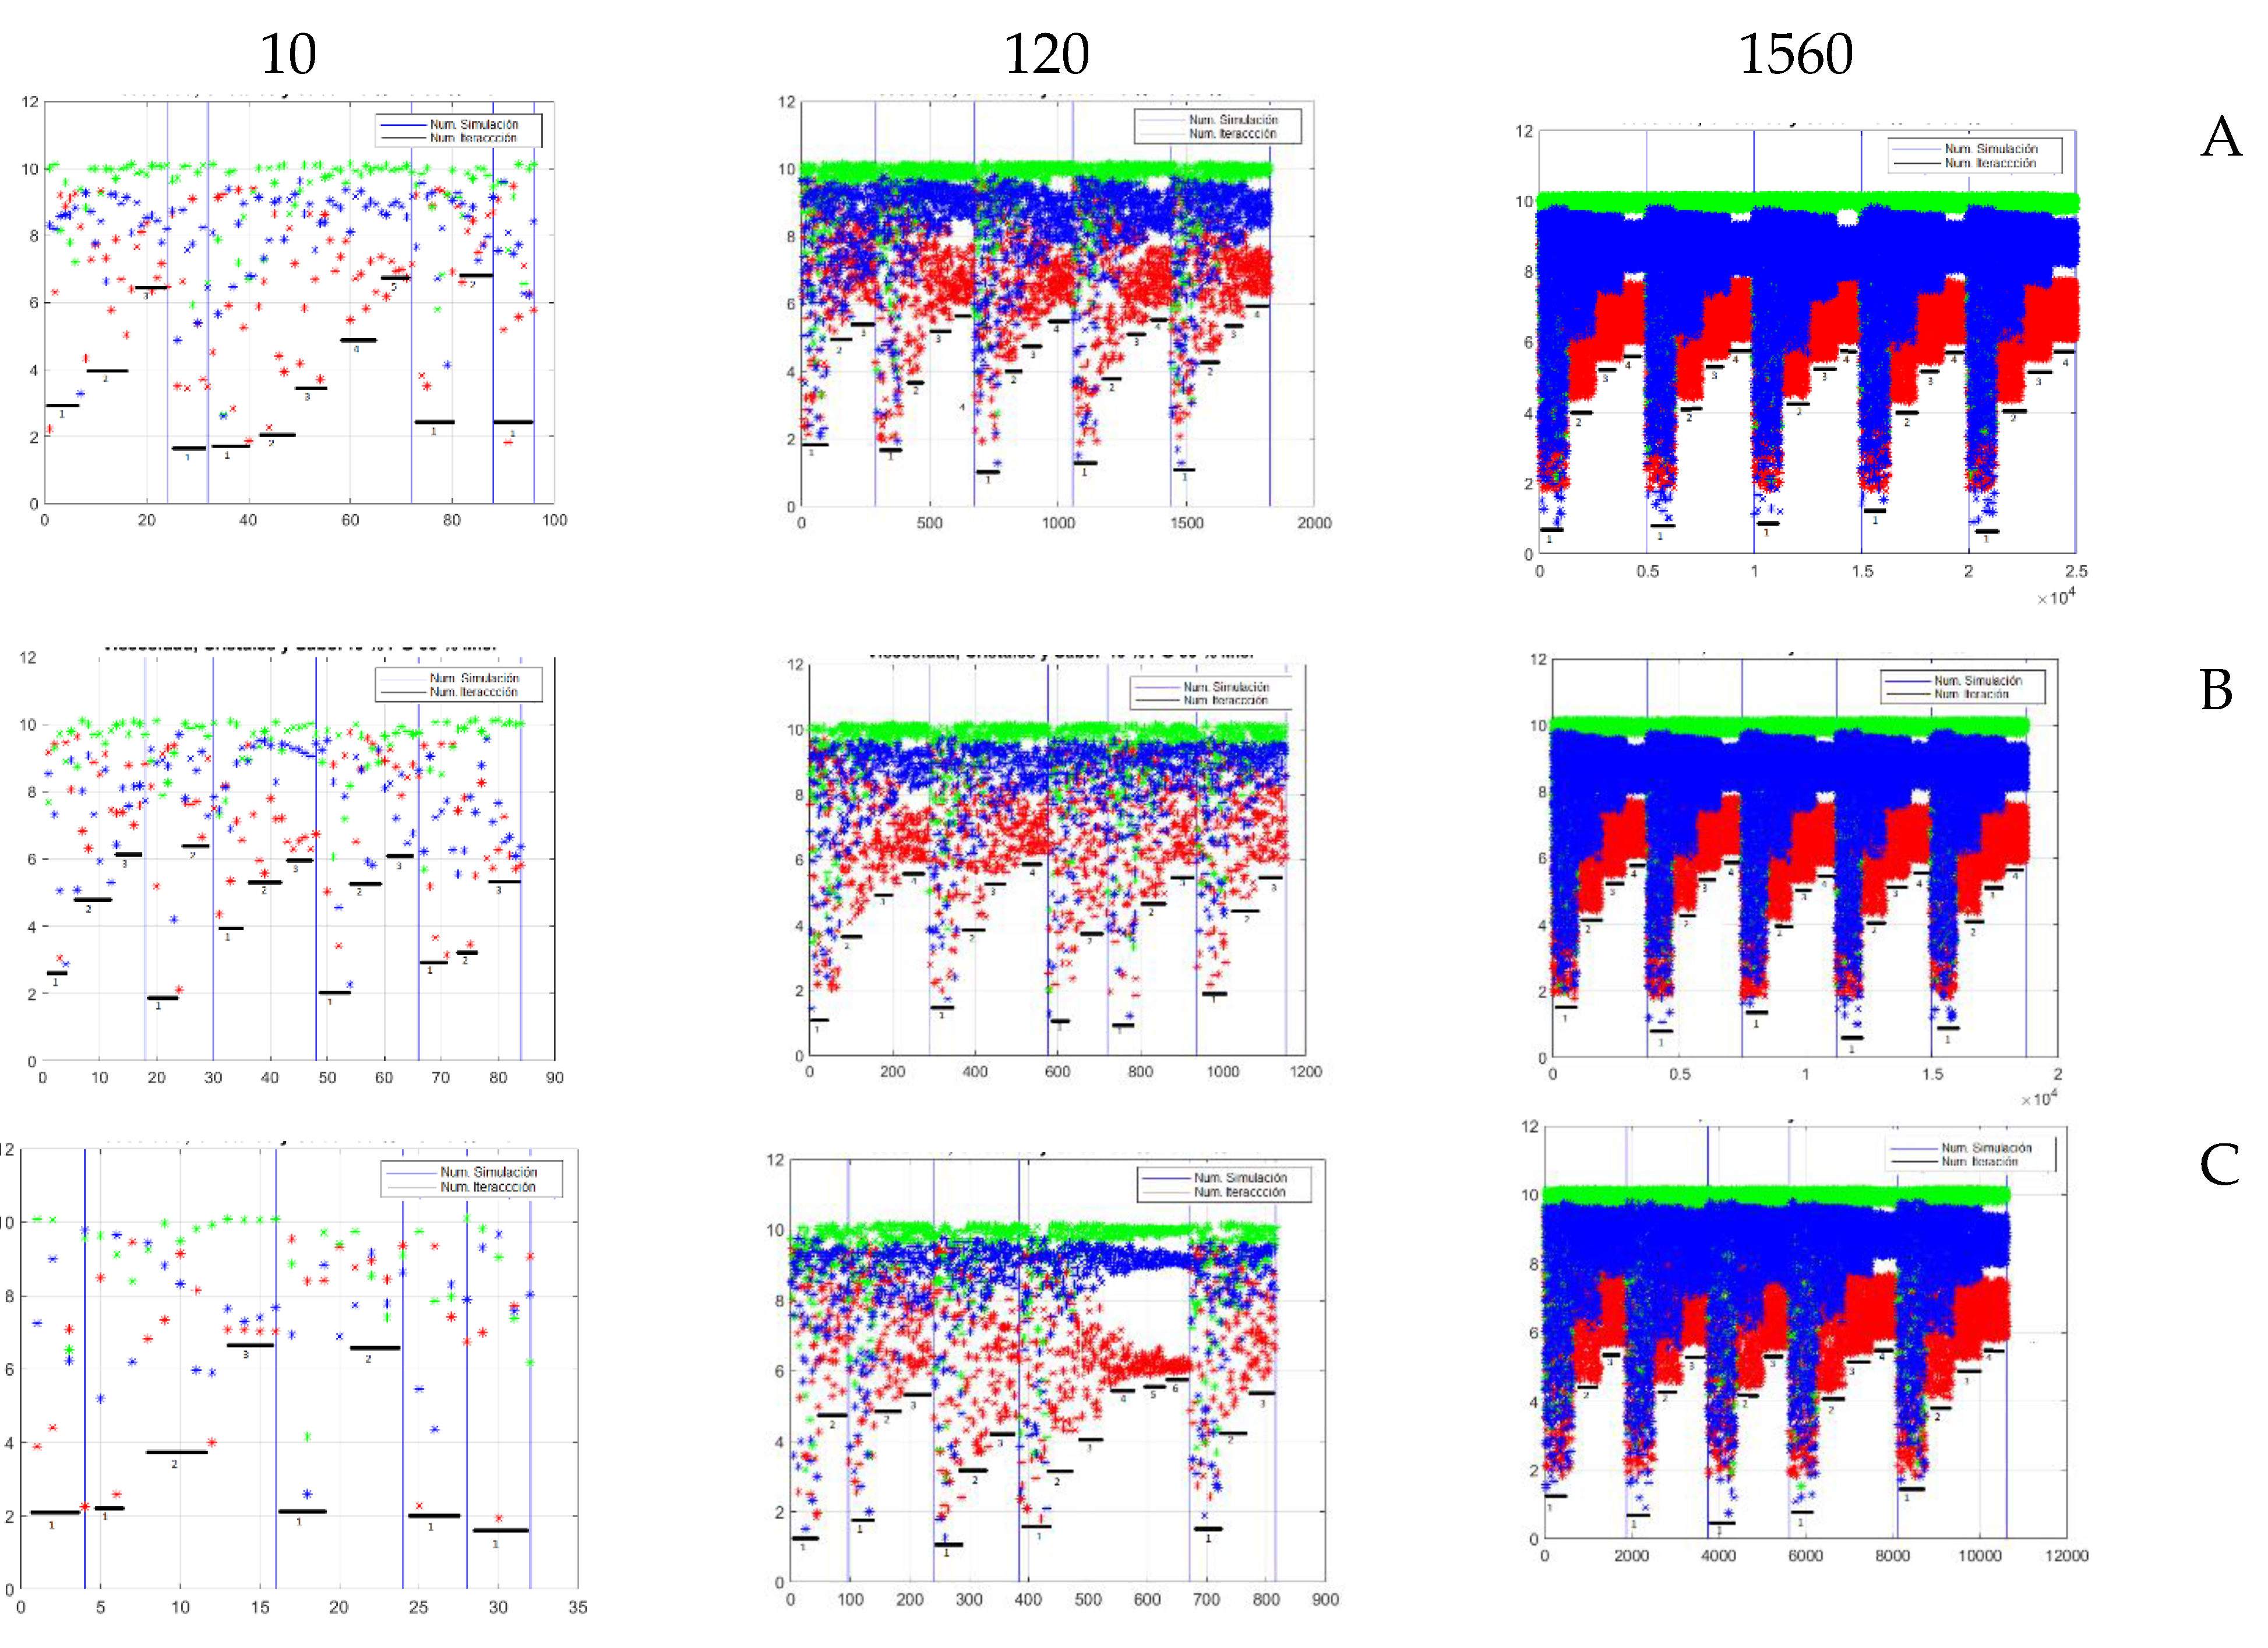
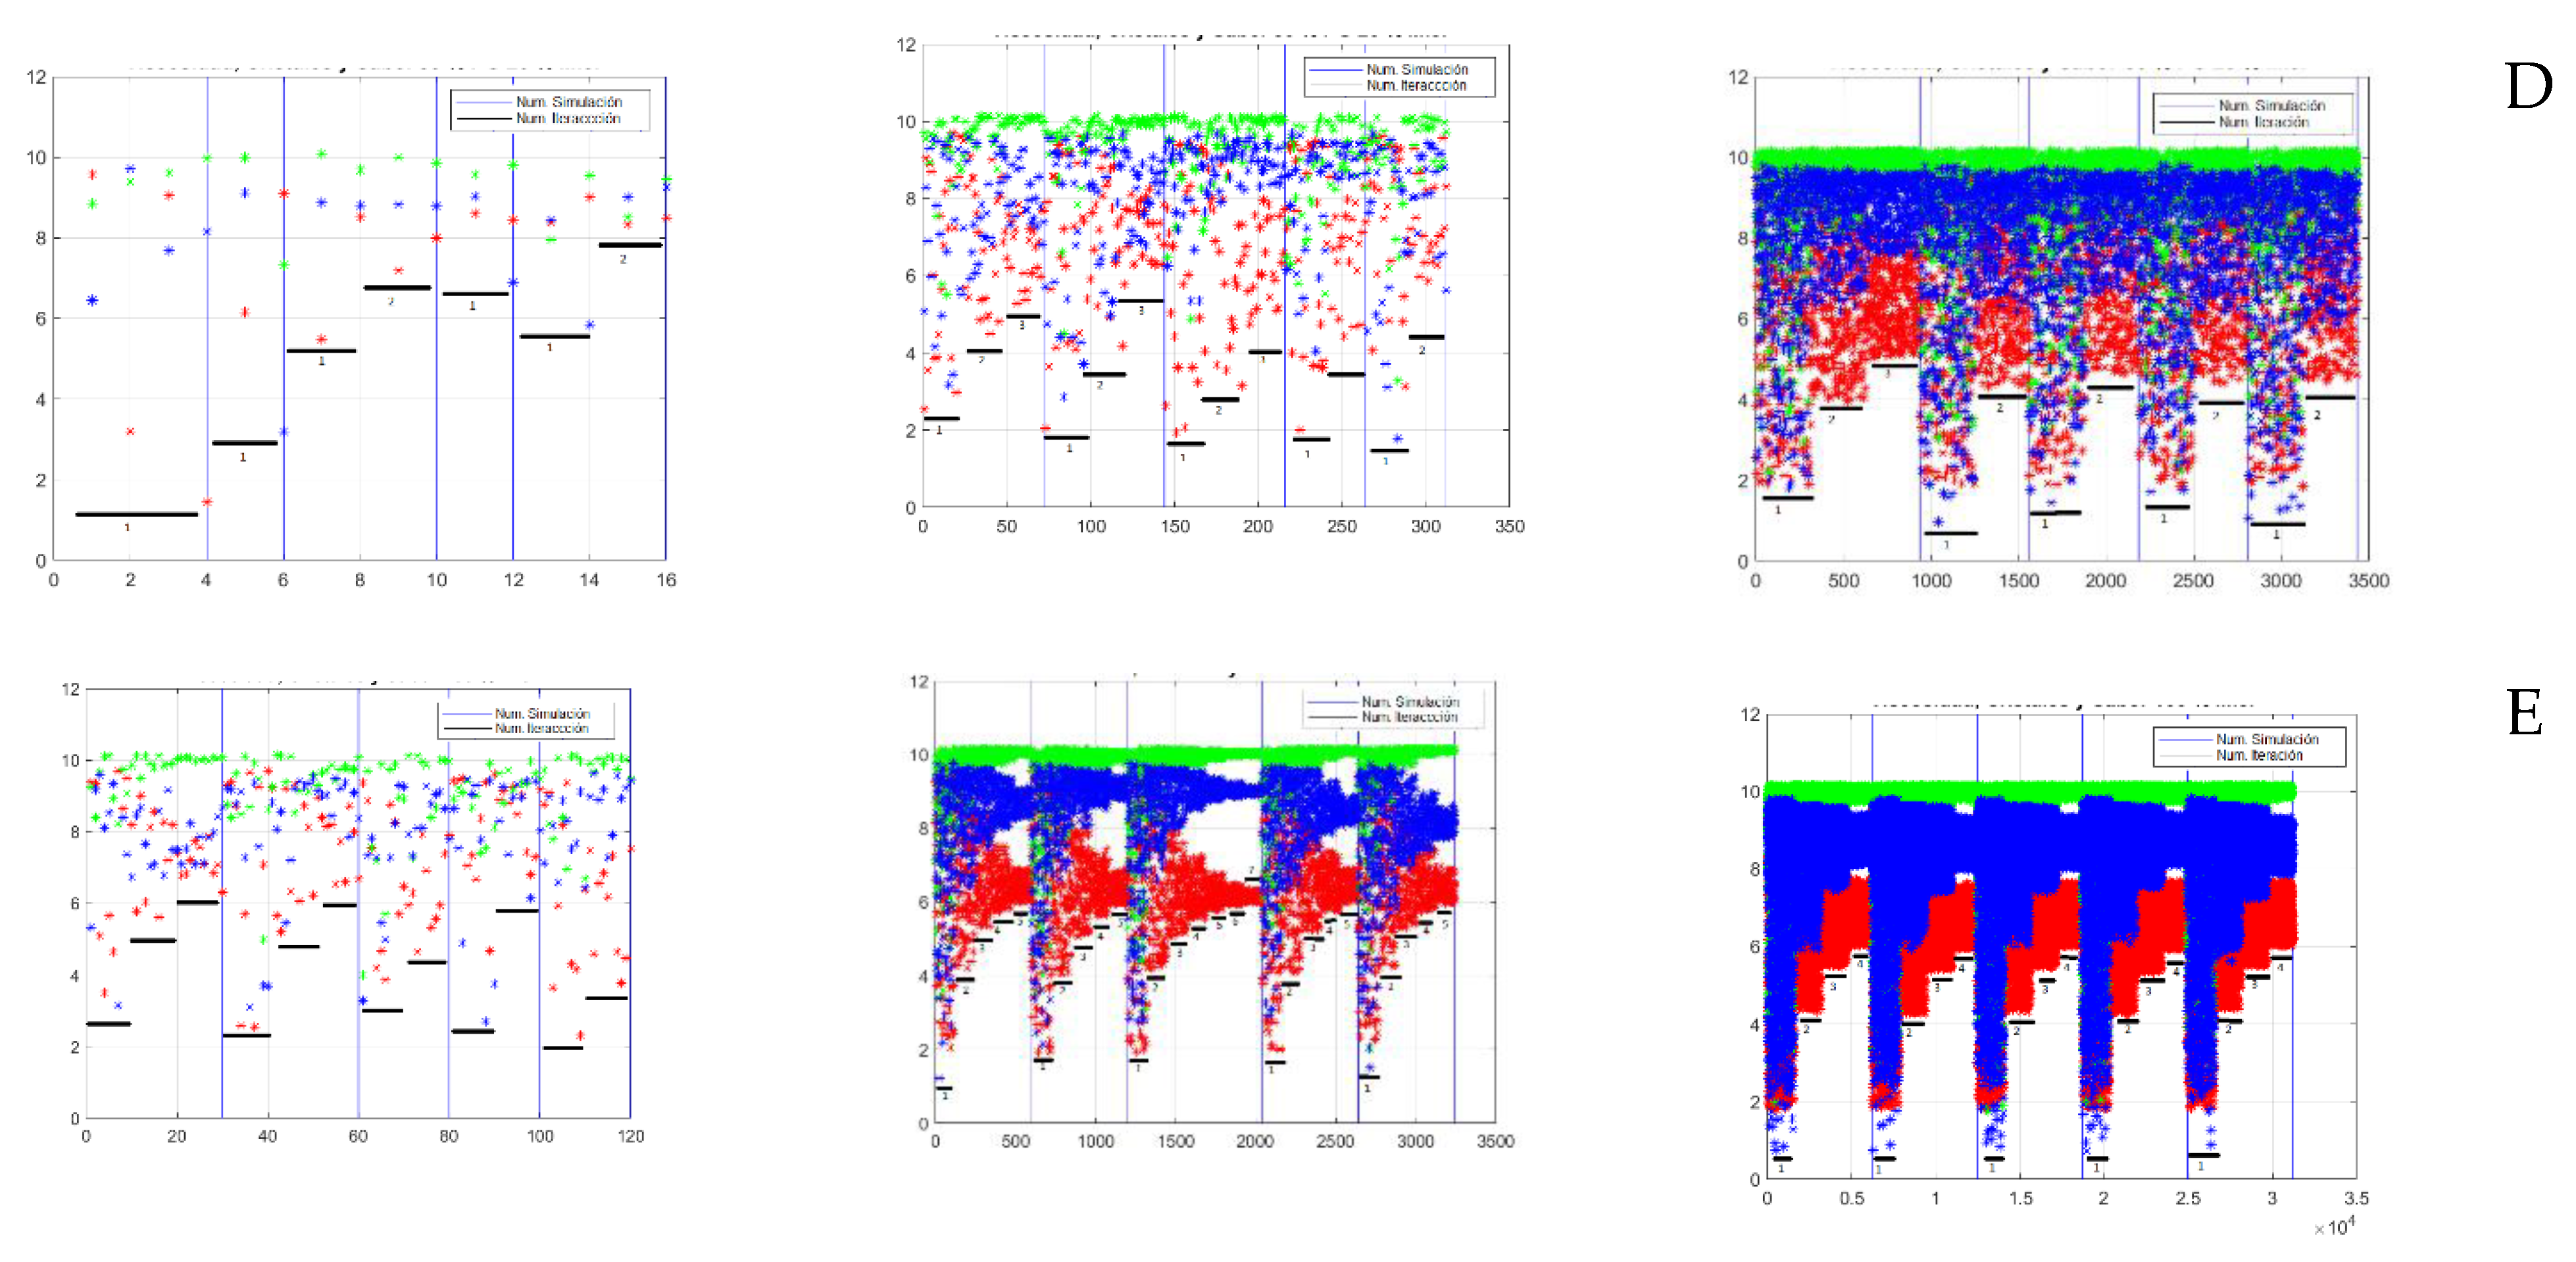
Figure 6.
ICUMSA values in multipurpose production for 10, 120, and 1560 batches.
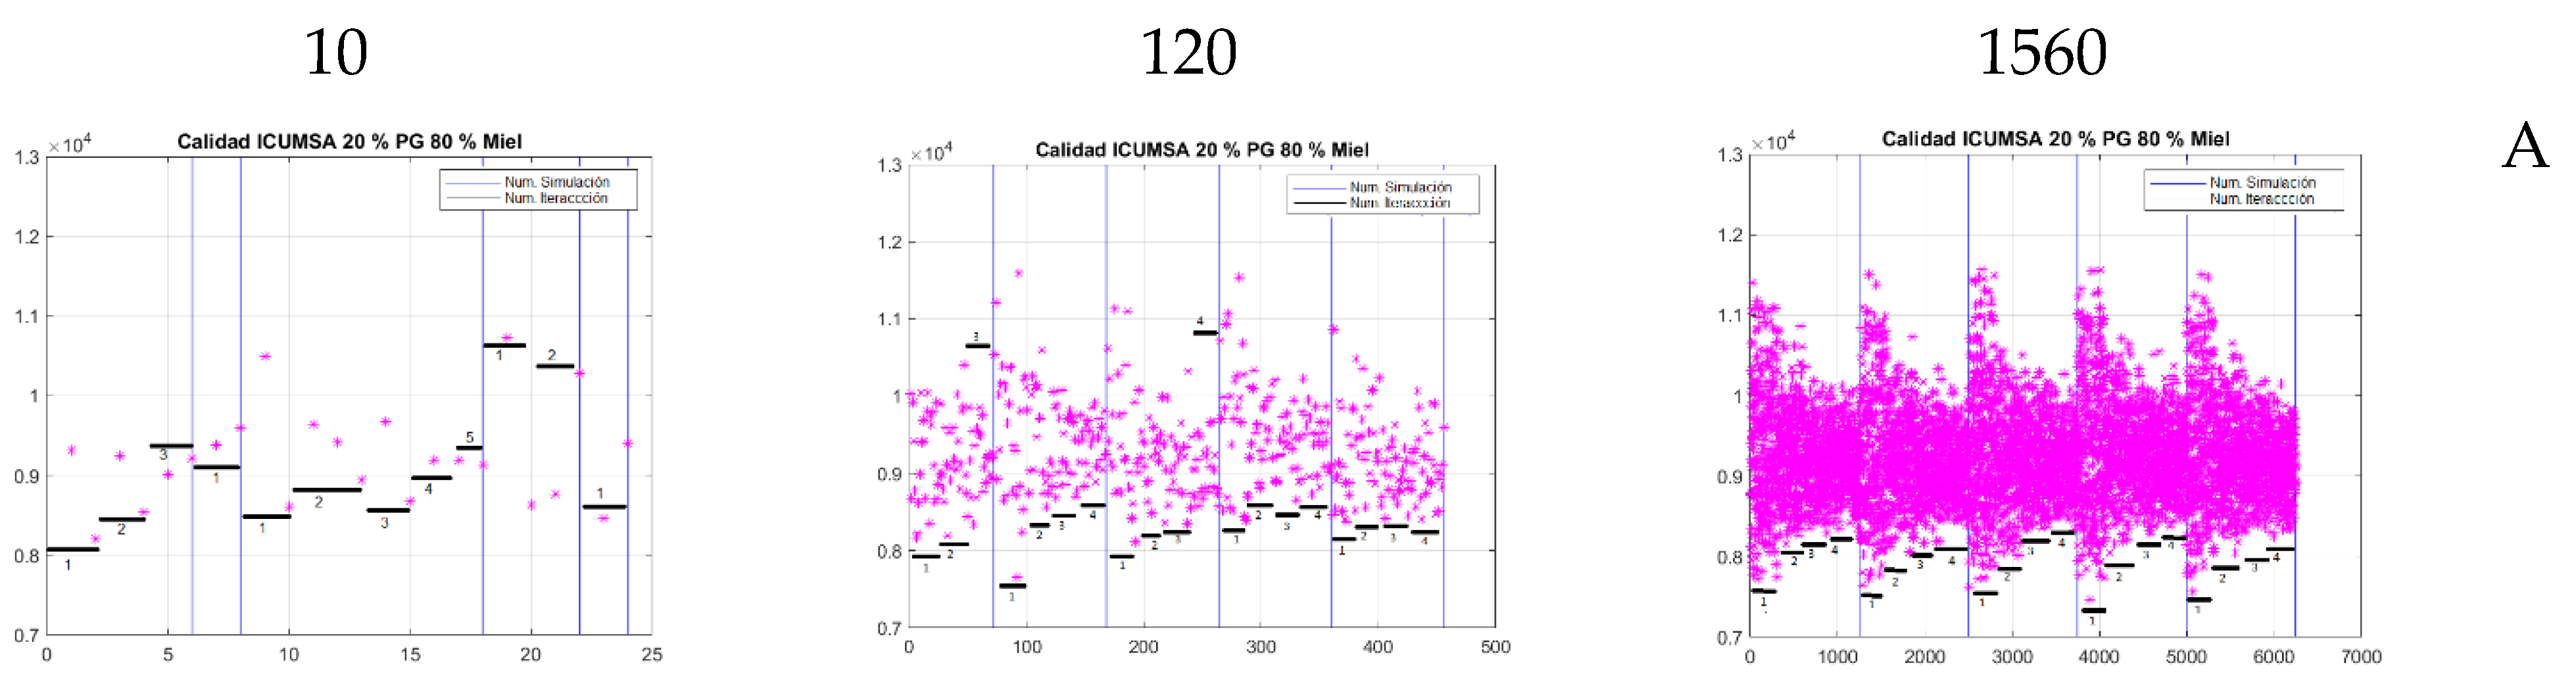
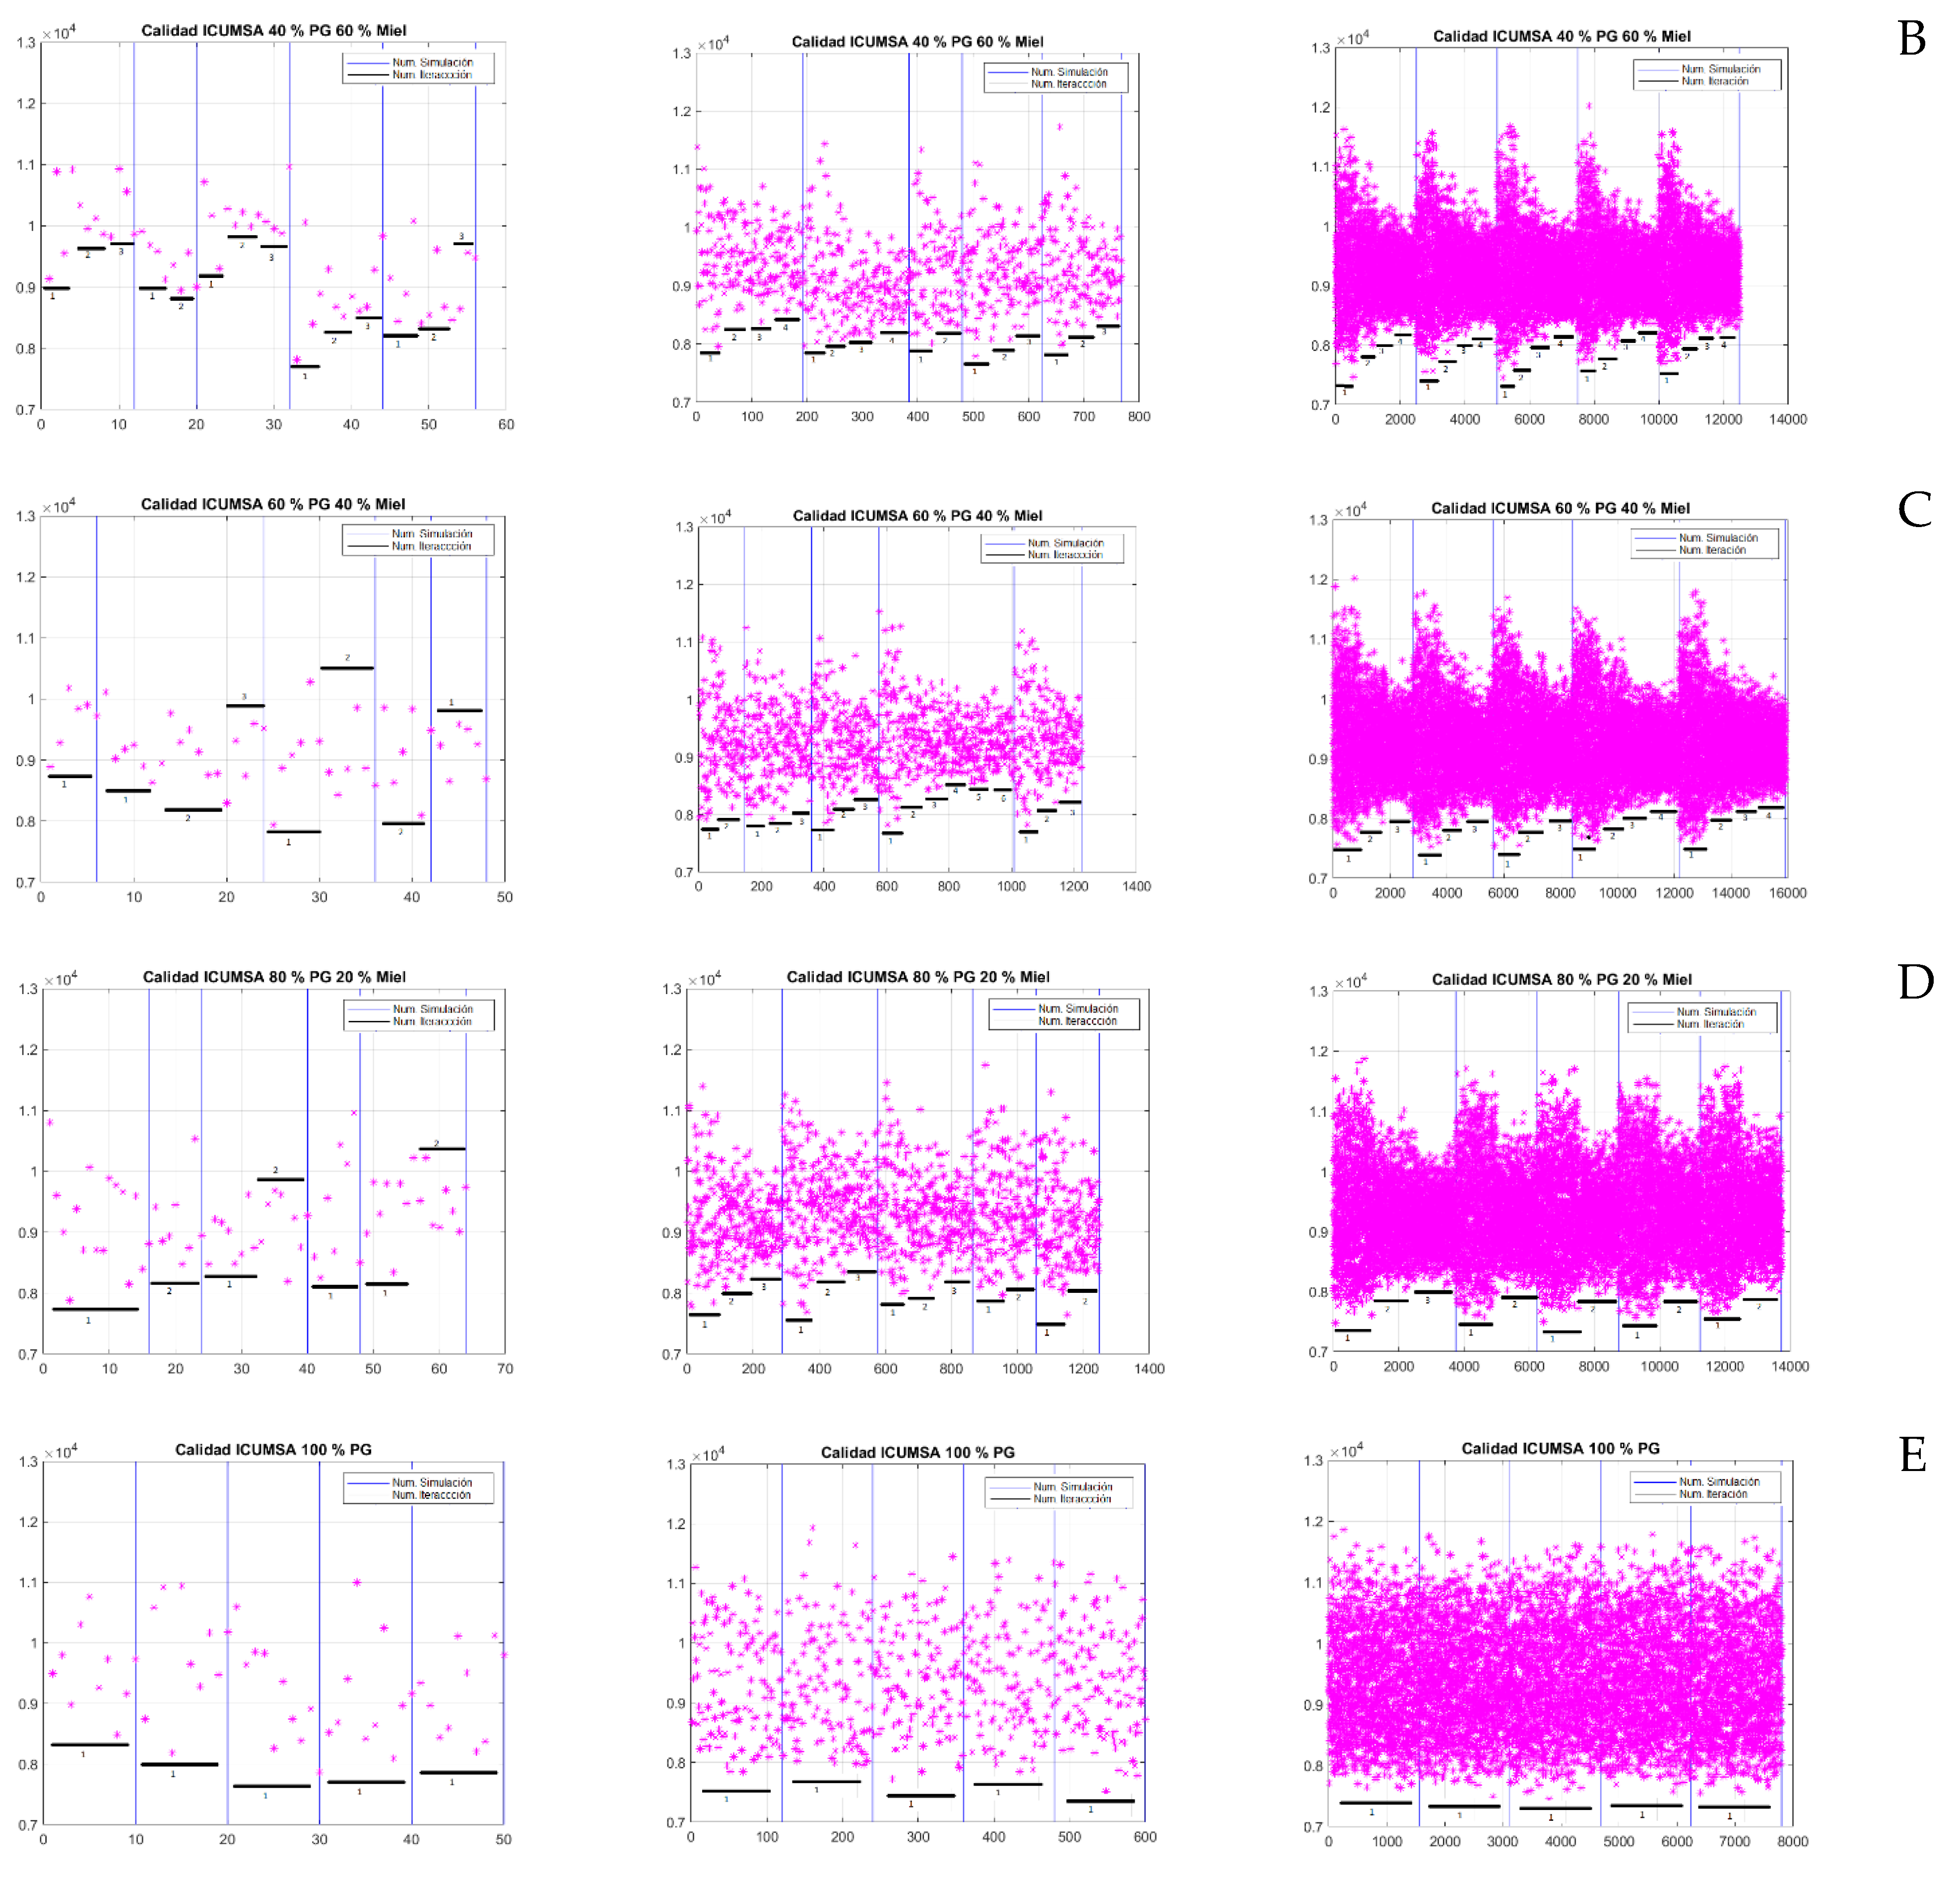
Figure 7.
Gantt diagram of multipurpose production.
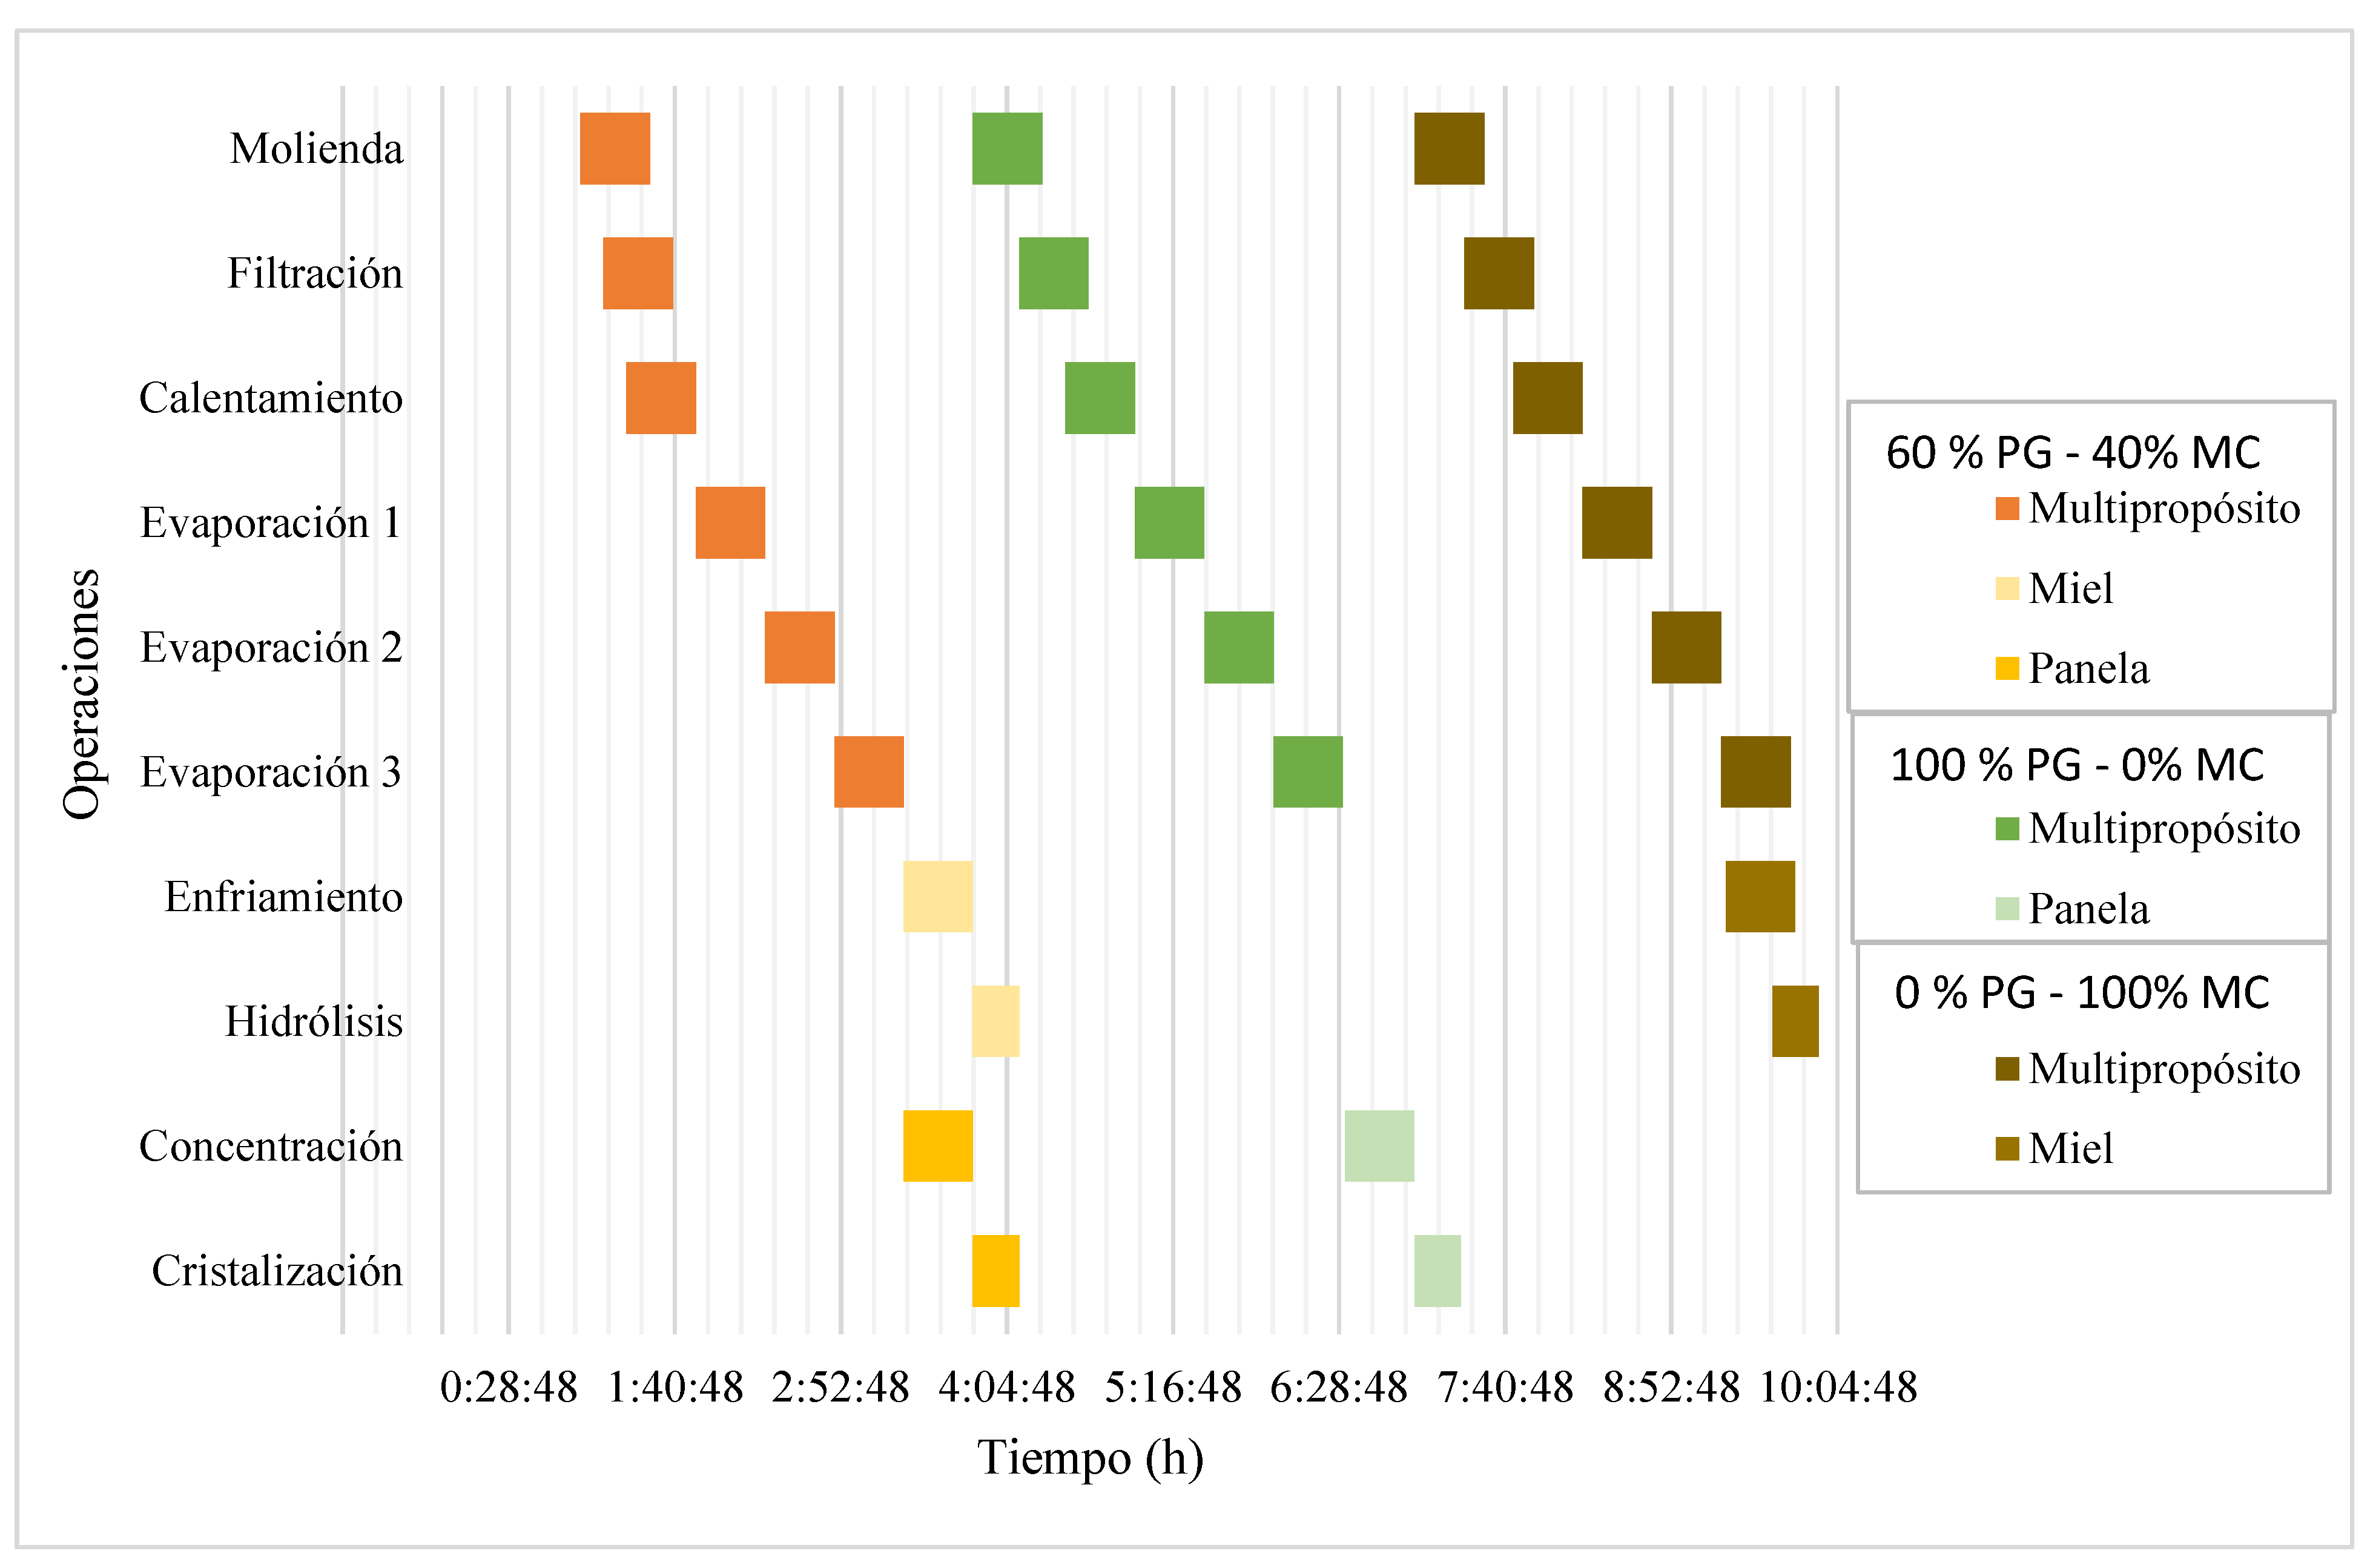
Figure 8.
Total investment cost of the multipurpose design by production configuration.
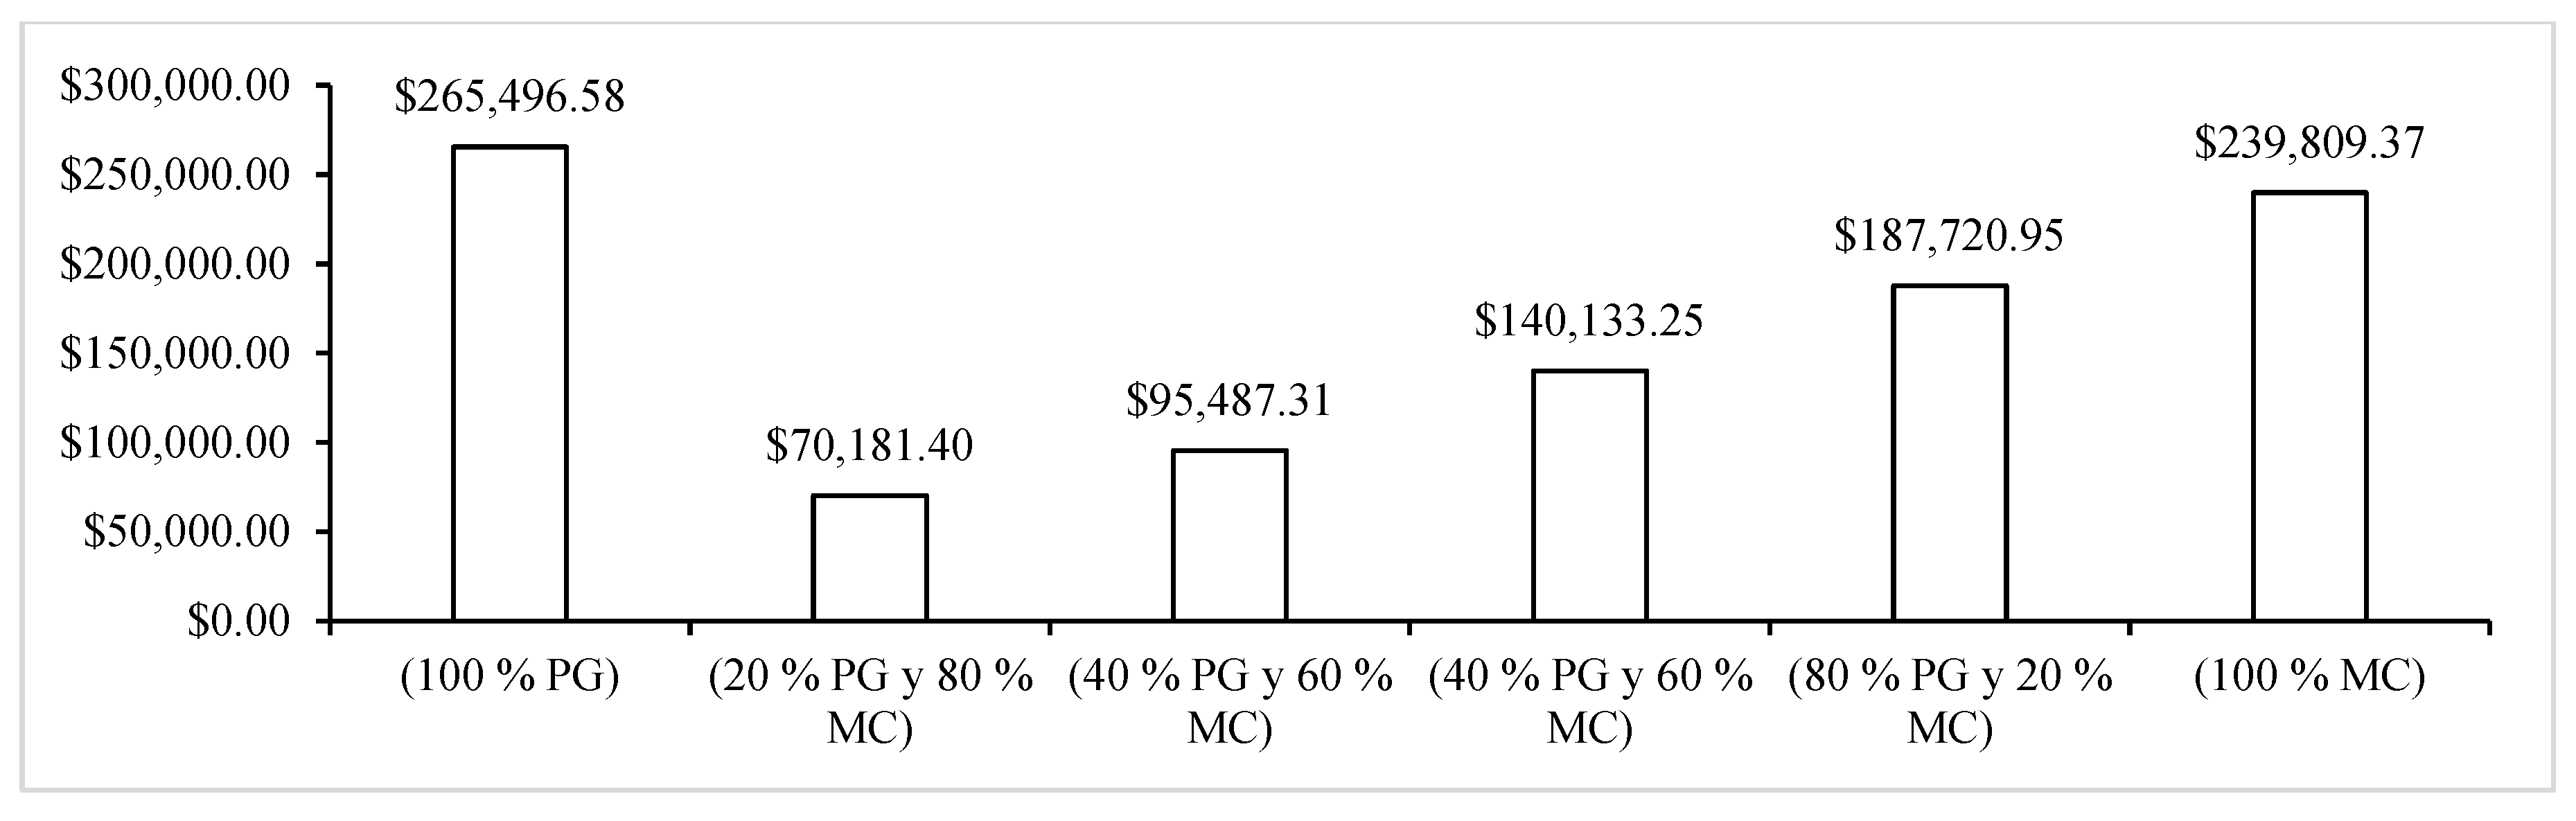
Figure 9.
GREENSCOPE sustainability indicators for the 120-batch configuration with 60% GP–40% SH.
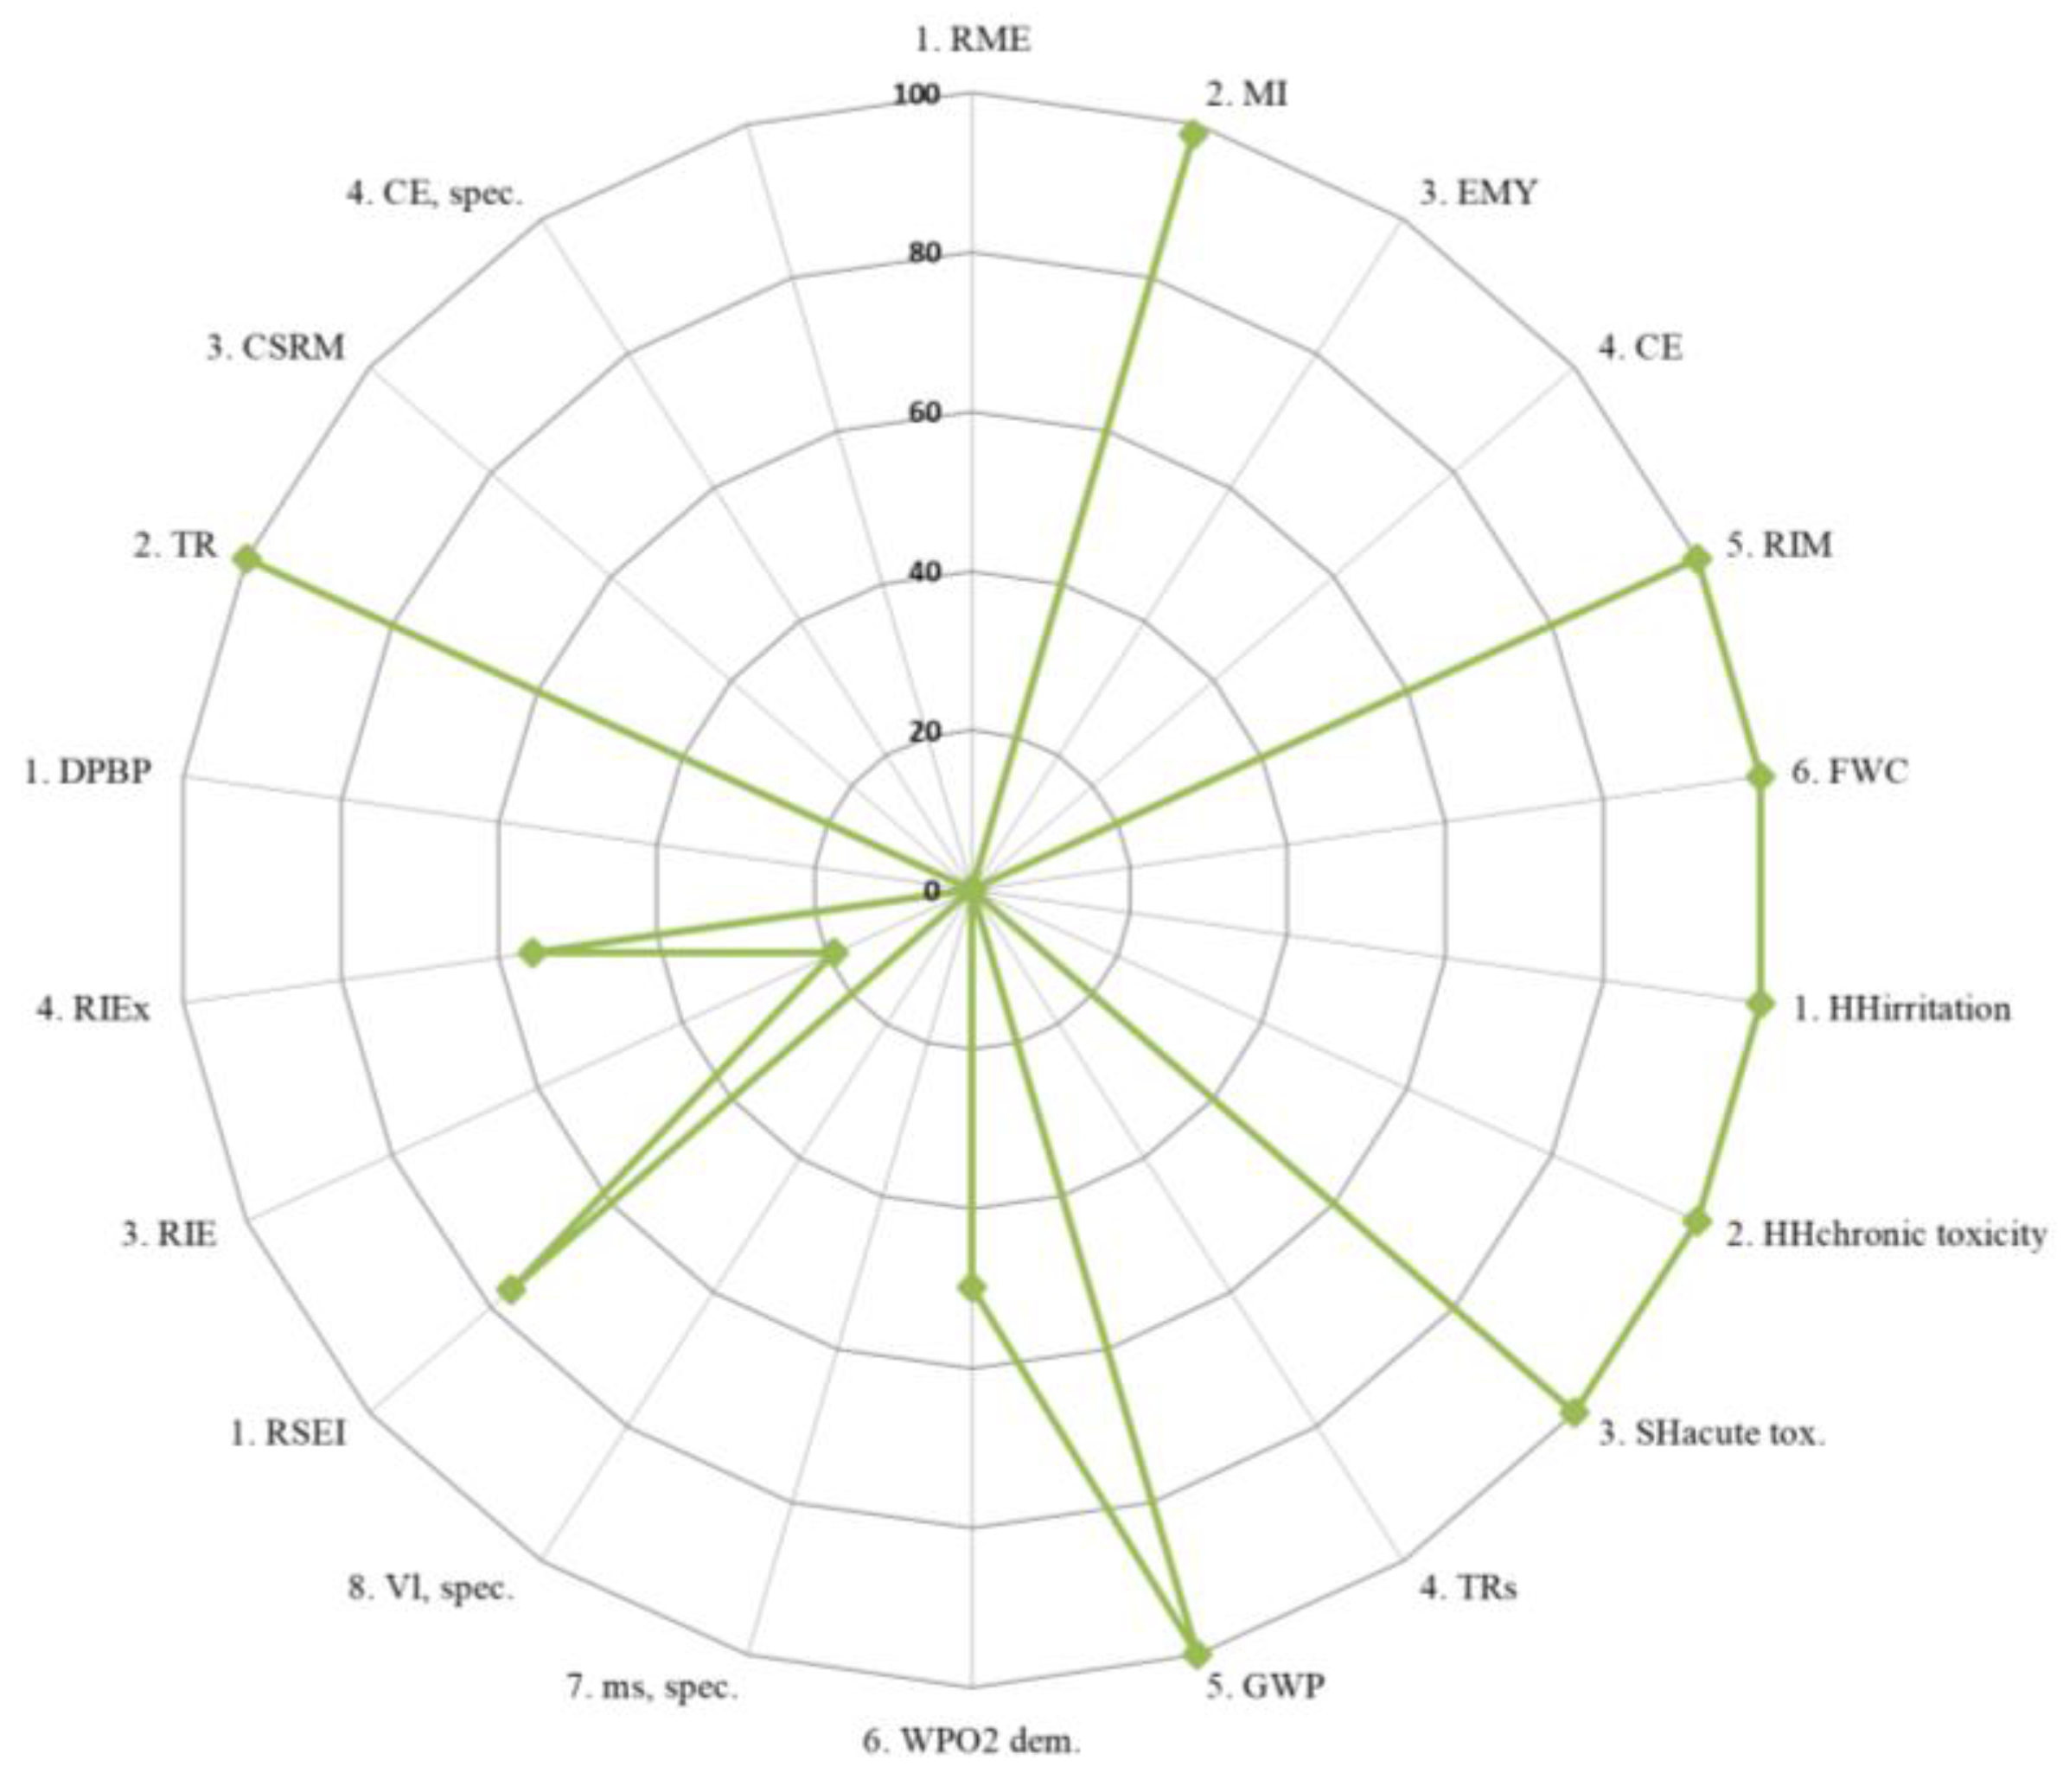

Table 1.
Simulated multipurpose production
| Production | Batch | No. Simulations |
| 100 % de GP y 0 % SH | 10, 120 y 1560 | 5 |
| 80 % de GP y 20 % SH | 10, 120 y 1560 | 5 |
| 60 % de GP y 40 % SH | 10, 120 y 1560 | 5 |
| 40 % de GP y 60 % SH | 10, 120 y 1560 | 5 |
| 20 % de GP y 80 % SH | 10, 120 y 1560 | 5 |
| 0 % de GP y 100 % SH | 10, 120 y 1560 | 5 |
Table 3.
Sugarcane production by parish in the province of Pastaza.
| Parish | Production (ha) | Estimated sugarcane (t) |
| Fátima | 80.35 | 6,186.95–8,035 |
| Teniendo Hugo Ortiz | 93 | 7,161–9,300 |
| Veracruz | 48.75 | 3,753.75–4,875 |
| Madre Tierra | 49.75 | 3,830.75–4,975 |
| Diez de Agosto | 119 | 9,163–11,900 |
| Tarqui | 198.75 | 15,303.75–19,875 |
| El Triunfo | 24 | 1,848–2,400 |
| Simón Bolívar | 43.83 | 3,374.91–4,383 |
| Pomona | 11.1 | 854.7–1,110 |
Table 4.
Mass balance results for the multipurpose design.
| VARIABLE | 100% GP 0% SH | 20% GP 80% SH | 40% GP 60% SH | 60% GP 40% SH | 80% GP 20% SH | 0% GP 100% SH |
| JCSEvap3 | 116.09 | 116.09 | 116.09 | 116.09 | 116.09 | 116.09 |
| SH | 0 | 92.87 | 69.65 | 46.43 | 23.21 | 116.09 |
| JCEEvap4 | 116.09 | 23.21 | 46.43 | 69.65 | 92.87 | 0 |
| JCSCryst | 101.29 | 20.38 | 40.72 | 61.17 | 81.31 | 0 |
Table 5.
Environmental indicators of the multipurpose design.
| 100% GP 0% SH | 20% GP 80% SH | 40% GP 60% SH | 60% GP 40% SH | 80% GP 20% SH | 0% GP 100% SH | |
| ConsMPPG | 11.41 | 56.70 | 28.39 | 18.90 | 14.21 | 0 |
| ConsJCPG | 7.45 | 37.01 | 18.53 | 12.34 | 9.28 | 0 |
| ConsEnergPG | 2,994.76 | 14,226.51 | 7,200.08 | 4,840.67 | 3,684.11 | 0 |
| VRSPG | 3.96 | 19.68 | 9.85 | 6.56 | 4.93 | 0 |
| ResGPG | 6.40 | 31.41 | 15.77 | 10.53 | 7.95 | 0 |
| ConsMPMC | 0 | 12.45 | 16.59 | 24.89 | 49.78 | 9.96 |
| ConsJCMC | 0 | 8.13 | 10.83 | 16.25 | 32.50 | 6.50 |
| ConsEnergMC | 0 | 3,090.44 | 4,120.59 | 6,180.89 | 12,361.77 | 2,472.35 |
| VRSMC | 0 | 4.32 | 5.76 | 8.64 | 17.28 | 3.46 |
| ResGMC | 0 | 6.88 | 9.17 | 13.75 | 27.50 | 5.50 |
Table 6.
Heat-transfer areas according to the multipurpose production configuration.
| Equipment | 100% GP 0% SH | 20% GP 80% SH | 40% GP 60% SH | 60% GP 40% SH | 80% GP 20% SH | 0% GP 100% SH |
| Concentrator (m²) | 0.54 | 0.08 | 0.23 | 0.32 | 0.42 | – |
| Crystallizer (m²) | 1.18 | 0.24 | 0.47 | 0.71 | 0.94 | – |
Table 7.
Equipment acquisition cost of the multipurpose design.
|
100 % PG 0 % MC |
20 % PG 80 % MC |
40 % PG 60 % MC |
60 % PG 40 % MC |
80 % PG 20 % MC |
0 % PG 100 % MC |
|
| Equipment Acquisition ($) | 24,300.52 | 7,873.76 | 12,755.28 | 15,595.72 | 19,494.77 | 18,396.8 |
Table 8.
Annual production costs of the multipurpose design.
| Variable ($/year) | 100% GP 0% SH | 20% GP 80% SH | 40% GP 60% SH | 60% GP 40% SH | 80% GP 20% SH | 0% GP 100% SH |
| Total cost of product without depreciation (GP) | 88,940.80 | 36,592.48 | 49,695.91 | 62,772.11 | 75,858.23 | 0.00 |
| Total cost of product without depreciation (SH) | 0.00 | 158,456.49 | 127,144.30 | 95,804.42 | 64,474.81 | 200,834.64 |
| Manufacturing costs (GP) | 77,916.64 | 71,003.27 | 72,744.98 | 74,464.41 | 76,191.94 | 0.00 |
| Manufacturing costs (SH) | 0.00 | 72,217.58 | 73,511.04 | 74,781.34 | 76,060.23 | 80,181.13 |
| Distribution and sales (GP) | 4,447.04 | 1,829.62 | 2,484.80 | 3,138.61 | 3,223.74 | 0.00 |
| Distribution and sales (SH) | 0.00 | 7,922.82 | 6,357.22 | 4,790.22 | 3,792.91 | 10,041.73 |
Table 9.
Economic indicators of the multipurpose design.
| Batches | GP (%) | SH (%) | NPV (USD) | IRR (%) | DPP (years) | Profit margin |
| 10 | 100 | 0 | 86,027.72 | 38.65 | 1.70 | 0.15 |
| 10 | 20 | 80 | 81,605.27 | 35.47 | 1.87 | 0.21 |
| 10 | 40 | 60 | 135,432.36 | 42.47 | 1.10 | 0.27 |
| 10 | 60 | 40 | 38,295.04 | 29.67 | 2.18 | 0.18 |
| 10 | 80 | 20 | 136,566.51 | 41.54 | 1.08 | 0.25 |
| 10 | 0 | 100 | 88,380.09 | 36.66 | 1.80 | 0.15 |
| 120 | 100 | 0 | 85,785.10 | 38.56 | 1.71 | 0.15 |
| 120 | 20 | 80 | 116,053.27 | 40.25 | 1.00 | 0.22 |
| 120 | 40 | 60 | 129,679.39 | 39.33 | 1.00 | 0.26 |
| 120 | 60 | 40 | 141,014.59 | 45.80 | 1.36 | 0.30 |
| 120 | 80 | 20 | 110,657.20 | 38.21 | 1.28 | 0.23 |
| 120 | 0 | 100 | 74,777.58 | 31.99 | 1.94 | 0.13 |
| 1560 | 100 | 0 | 85,736.79 | 38.54 | 1.71 | 0.15 |
| 1560 | 20 | 80 | 114,084.74 | 36.64 | 1.00 | 0.24 |
| 1560 | 40 | 60 | 100,624.91 | 33.25 | 1.00 | 0.21 |
| 1560 | 60 | 40 | 71,131.51 | 22.21 | 2.65 | 0.16 |
| 1560 | 80 | 20 | 98,685.25 | 32.20 | 1.39 | 0.18 |
| 1560 | 0 | 100 | 88,380.09 | 36.66 | 1.80 | 0.17 |
Disclaimer/Publisher’s Note: The statements, opinions and data contained in all publications are solely those of the individual author(s) and contributor(s) and not of MDPI and/or the editor(s). MDPI and/or the editor(s) disclaim responsibility for any injury to people or property resulting from any ideas, methods, instructions or products referred to in the content. |
© 2026 by the authors. Licensee MDPI, Basel, Switzerland. This article is an open access article distributed under the terms and conditions of the Creative Commons Attribution (CC BY) license (http://creativecommons.org/licenses/by/4.0/).
Copyright: This open access article is published under a Creative Commons CC BY 4.0 license, which permit the free download, distribution, and reuse, provided that the author and preprint are cited in any reuse.