

Submitted:
07 August 2026
Posted:
11 August 2026
You are already at the latest version
Abstract
Fall from height (FFH) remain the predominant cause of fatalities and injuries in the construction in construction and industrial safety worldwide. Traditional accident cause analysis approaches often focus on single-factor identification or static statistical analysis, ignoring the hierarchical coupling and correlational relationship of multiple factors. To address this research gap, this study proposes a novel method based on overlay network chain in quotient space to identify overlapping causal factor clusters in FFH accidents. First, a causal factor interaction network is constructed based on the similarity of causes. On this basis, an overlay network chain in quotient space is established to identify overlapping causal factor clusters. The proposed method is validated using real FFH accident data. Results demonstrate that this approach effectively identifies hidden high-risk overlapping clusters that are undetectable by traditional methods. Notably, Cluster C5—comprising PPE non-compliance, inadequate supervision, unverified qualifications, and insufficient training—exhibits the highest occurrence rate (0.072) and structural vulnerability (CVI = 9.5), identifying it as the most critical risk pattern. The identified clusters are highly consistent with practical engineering experience. This study provides a systematic, data-driven tool for FFH accident causation analysis, supporting targeted safety prevention and control strategies.
Keywords:
fall from height
; causal factor clusters
; causal factor interaction network
; accidents causation analysis
; overlay netswork chain in quotient space
1. Introduction
Falls from height accidents are among the most harmful accidents in occupational safety [1,2]. Among various construction safety hazards, fall-from-height (FFH) accidents consistently rank first in terms of occurrence frequency and casualty rate, occupying a dominant proportion of construction fatal and injury accidents [3,4]. Studies suggest that up to 51 % of fall-related incidents occur within this industry [5], affecting all project stages, from site preparation and structural framework to façade installation and interior finishing [6]. According to Hamid et al.[7], construction-related fatalities occur at a rate over three times higher than in alternative sectors, emphasizing the imperative for enhanced and effective safety interventions.
Haslam et al.[8] noted that ineffective safety implementation persists as a ubiquitous challenge within the global construction sector. They identified a multifaceted array of contributing factors, encompassing deficiencies in safety system design, substandard maintenance routines, defective machinery, insufficient supervision, and inadequate workforce training. Furthermore, their statistical analysis revealed that fall-from-height (FFH) incidents, pedestrian slips on access walkways, and impacts from falling objects constitute the most frequent categories of on-site accidents. Wong et al.[9] identified that fall incidents in construction are predominantly driven by deficiencies in safety training, inadequate height-access equipment, unsafe operational behaviors among workers, and a lack of sufficient oversight. Their findings further highlight the severity of this issue, noting that falls account for nearly 50% of all fatal construction accidents recorded in Hong Kong. In Malaysia, Zaini et al.[10] reported that FFHs not only cause human suffering but also lead to significant project delays due to investigations, recruitment, training of replacement workers, and compensation payouts.
Affected by human factors, equipment conditions, environmental conditions, and management defects, FFH accidents present typical characteristics of multi-factor coupling, complex interaction, and nonlinear evolution [11]. A single accident is not caused by an independent factor but by the joint action of multiple interrelated factors [11,12]. Therefore, clarifying the interactive relationship and community structure of FFH accident causal factors is crucial for revealing accident formation mechanisms and formulating targeted prevention measures.
In recent years, domestic and foreign scholars have carried out extensive research on the causal analysis of construction FFH accidents [13]. Common research methods include statistical analysis, random forest [14], fault tree analysis (FTA), event tree analysis (ETA), Bayesian network [15], and traditional complex network clustering algorithms [16,17]. These methods can effectively screen key accident factors and analyze the correlation between single factors and accidents to a certain extent.
Based on an examination of 621 fatal falls, Chi et al.[18] clustered the contributory elements into worker-centric, equipment-centric, and management-centric categories. Worker-related factors encompass excessive strain, irregular control, inadequate operations, and the removal of safety equipment; tool-related factors cover technical malfunctions, unsafe apparatus, and unstable ladders. In the management domain, the study highlighted severe lapses, including unshielded holes, violations of scaffolding regulations, illicit access to high-risk sectors, and occupational exposure to harmful environments. Zermane et al.[19] presented the root causes of fatal accidents due to work at heights: failure to wear personal protective equipment (PPE), the lack of supervision and leadership, and the absence of work standards or the inability to follow them correctly.
Abdelhamid and Everett [20] delineated three fundamental root causes of construction accidents: the pre-task failure to identify potential site hazards, the execution of work in the absence of adequate safety knowledge, and the intentional engagement in unsafe practices despite an awareness of the associated dangers. Their contribution has significantly advanced accident investigation frameworks by incorporating a human error analysis perspective.
According to Khanh et al.[2], among the various determinants of FFH, unstable scaffolding and ladders were ranked as the topmost critical hazard. These risks were subsequently categorized into five distinct domains, namely, hazards tied to structural and site conditions, workforce factors, environmental interactions and worker characteristics, organizational management and safety protocols, as well as worker competency and tool-related issues. However, this study was limited to a qualitative categorization of these factors and lacked a rigorous statistical screening process to identify the primary drivers. More importantly, the latent coupling relationships and synergistic interactions among these distinct risk domains were not systematically examined.
However, existing studies still have obvious limitations in mechanism exploration. Most traditional clustering and community detection methods follow the principle of exclusive attribution, that is, each causal factor can only be divided into a single independent community [21]. This rigid partition cannot reflect the actual situation of construction accidents, where one causal factor often has multiple attribute characteristics and participates in different accident evolution chains simultaneously. The ignorance of overlapping causal community structures leads to incomplete excavation of implicit factor coupling relationships, resulting in insufficient depth of accident mechanism analysis and limited practical guiding value for on-site safety management.
To overcome the above deficiencies, this study introduces quotient space theory into the causal analysis of FFH accidents and proposes an overlapping causal community mining method based on quotient space covering network chain [21,22]. Different from traditional single-attribution analysis methods, this method realizes hierarchical granulation and structural mining of causal factor networks, which can effectively identify overlapping causal factor communities and accurately describe the multi-role and multi-path participation characteristics of accident factors [23]. Compared with conventional models, the proposed method better conforms to the complex and uncertain evolutionary laws of actual construction safety accidents.
The main contributions of this study are summarized as follows: (1) an interactive relationship network of FFH accident causal factors is constructed, which quantitatively visualizes the complex correlation and interaction topology of accident influencing factors. (2) An overlay network chain in quotient space is innovatively applied to mine overlapping causal factor clusters of FFH accidents, breaking through the single-attribution limitation of traditional clustering methods. (3) The effectiveness and superiority of the proposed method are verified based on real FFH accident data, which provides a new perspective for refined causal analysis and targeted risk prevention of construction FFH accidents.
2. Materials and Methods
This section elaborates the overall research framework and detailed implementation procedures adopted to explore the causal mechanisms of FFH accidents. The core research idea is to integrate complex network theory with quotient space theory to achieve overlapping causal factor cluster mining, reveal the multi-association characteristics of accident influencing factors. The detailed methodology is divided into three key parts: construction of the FFH accident causal factor interaction network, establishment of the quotient space overlay network chain model, and empirical verification design.
2.1. Extracting Accident Causal Factors
The accident investigation report contains a large number of actual records related to the accident, and the content is true and valid [24]. The accident investigation report describes in detail the time of the accident, the process of the accident, the overview of the unit in which the accident occurred, the casualties and the basic information of the injured and the property damage, etc., and analyzes the nature of the accident, the causes of the accident, and the division of responsibility for the accident [25]. Therefore, the potential causative factors of FFH accidents can be obtained from accident investigation reports.
According to the Classification and Coding of Dangerous and Hazardous Factors in Production Processes (GB/T 13861-2022), the causes of fall from height accidents can be categorized into four aspects: people-related factors, facility-related factors, environment-related factors and management-related factors, each of which contains many sub-factors [1,15]. All the sub-factors constitute the data set of FFH causal factors. If the causes of a FFH accident include people-related factors, facility-related factors, environmental-related factors, and management-related factors, the causes of the FFH accident can be expressed as vector, a FFH accident has causal factors. The causal factors of FFH accidents can be represented by the accident cause matrix . if factor is included in the causes of accident .
2.2. Constructing Causal Factor Interaction Network
FFH accidents are caused by a combination of many causes, including people-related factors, facility-related factors, environment-related factors and management-related factors [26,27]. According to FFH accident investigation reports, the same FFH accident contains several different types of accident causations, and the same accident causation may occur in different FFH accidents [11,28]. Accidents are not caused by a single cause, they are the result of a combination of causes [1,11]. These causes have potential correlations with each other, and if these clusters of causes with correlations can be found, the occurrence of fall from height accidents can be better prevented [26].
The FFH accidents causal factor interaction network is constructed using complex network theory. In the network, each node represents an independent causal factor, and each edge represents the interaction between two factors [29,30,31]. The Jaccard similarity is used to measure the interaction strength between accident causes, the interaction strength between cause and is defined as follows [32,33]:
where and denote column and column of the accident causation correlation matrix , respectively. is the number of fall from height accidents where cause and occur together. is the number of fall from height accidents that accident causes included cause and . Accident investigation report data have false positives and false negatives because of human influence in the accident investigation report records, so we consider the interaction strength between cause and to be credible only if the interaction strength between cause and is greater than a certain threshold [34,35].
An example is shown to explain the causal factor interaction network. Figure 1(a) shows the schematic diagram of causal factor interaction network, where each node represents a cause and two nodes are connected by an edge if the interaction strength between the two causes is greater than the threshold . If the value of interaction strength is less than , it is considered that there is no interaction between the two factors, and the edge between the corresponding nodes is not established in the network. The causal factor interaction network is represented by an adjacency matrix .
2.3. Constructing of Quotient Space Overlay Network Chain
After the causal factor interaction network is constructed, the quotient space overlay network chain can be applied to mine the causal factor clusters, as shown in Figure 1(b).
2.3.1. Quotient Space Theory
Granular computing is a simulation of global analysis ability of human beings. One of the basic characteristics in human problem solving is the ability to conceptualize the world at different granularities and translate from one abstraction level to the others easily, deal with them hierarchically. Human beings can solve problems in different sizes of granularity spaces. Different levels represent different granularity. Granularity analysis is in fact to analyze the quotient set [36]. Triple structure is used to represent the problem in the quotient space. Domain refers to universe of discourse, is the attribute set of , is the structure of . Define a relation for the universe of discourse , construct corresponding quotient set , quotient attribute set , and quotient structure , and then define the granularity coefficient to study the quotient space The relation can be equivalence relation or compatibility relation. For the causal factor interaction network , domain refers to the cause nodes in causal factor interaction network [37].
2.3.2. Quotient Space Overlay Network Chain
Given a network , the maximum complete subgraph of the network is regarded as a cover according to the compatibility relation [38]. A maximum complete subgraph, also known as a maximum clique, is a vertex subset in an undirected graph such that every two distinct vertices are adjacent, and it contains the largest possible number of vertices among all complete subgraphs of the graph. After the sets of all maximal complete subgraphs is solved. Then, maximal complete subgraphs are used as nodes, if two maximal complete subgraphs have common points, two corresponding nodes are defined to be connected, the new network constructed is called the level quotient space overlay network of , which is denoted as . Figure 2 illustrates the construction of quotient space overlay network chain.
Assuming that is the level quotient space overlay network of , and is the level quotient space overlay network of , therefore, is the level quotient space coverage network of . is called quotient space coverage network chain. In quotient space overlay network, each node represents a maximum complete subgraph. There are repeated points and edges between maximal complete subgraphs. So overlapping causal factor clusters can be found by using quotient space covering network [37].
The causal factor interaction network is usually described as an undirected graph G(V, E). In quotient space overlay network theory, formula 3 is used to measure the similarity of two maximal complete subgraphs mcsi and mscj.
where is the number of the common nodes of mcsi and mscj, is the sum of the nodes of mcsi and mscj. Only when is great than the granularity coefficient gc, two corresponding nodes are defined to be connected in the next generation quotient space overlay network. In ith level quotient space overlay network, if there is no maximal complete subgraph satisfying the similarity condition, the quotient space overlay network chain can be obtained. At this point, each node in represents a causal factor cluster.
3. Results
To verify the scientificity, effectiveness, and practical applicability of the proposed method, real FFH accident data is selected to ensure the authenticity and representativeness of the verification results, and conduct a comprehensive comparison and evaluation of the results.
3.1. Data Preparation
3.1.1. Data Source
To ensure the authenticity and representativeness of the experimental data, this study collects real FFH accident data from 2018 to 2025 from three sources:
(1) Official accident investigation reports released by the Ministry of Housing and Urban-Rural Development of China and the Emergency Management Bureau, which provide detailed information on accident causes, occurrence processes, and casualties.
(2) The safety accident records of the Governments’ other department including on-site investigation records, hidden danger inspection records, and accident handling reports.
(3) Records of safety accidents disclosed by large construction enterprises in China.
A total of 563 accident reports of fall from height accidents were obtained, and after data cleaning, excluding cases with incomplete information, unclear causes, or obvious data errors, 526 valid accident reports were obtained. The cases cover different regions, different construction types, and different accident severity levels, ensuring the comprehensiveness and representativeness of the data [39,40].
3.1.2. Causal Factor Extraction and Coding
Based on the collected FFH accident investigation reports, the BOW (Bag of Words) method combined with manual analysis was used to obtain the accident causal factors of fall from height accidents in construction [41].
Finally, 32 key causal factors are identified according to the Classification and Code of Dangerous and Hazardous Factors in the Production Process (GB/T 13861-2022) and expert consultation, which are divided into 4 categories: 7 factors related to people, 5 factors related to facilities, 3 factors related to the environment, and 17 factors related to management. The specific contents of each factor and its number are shown in Table 1.
The accident cause matrix contains 526 rows and 32 columns, each row represents a FFH accident, and each column represents an accident causation factor. If the accidental cause of a fall from height accident includes the causation factor , the accident cause matrix .
3.2. Experimental
3.2.1. Hardware and Software Environment
To ensure the smooth progress of the experiment, the following hardware and software environments are used:
(1) Hardware: CPU (Inter Core i7-8700, 3.2GHz), RAM (16G), hard disk (1TB), which can meet the requirements of data processing and complex network calculation.
(2) Software: Operating system (Windows 11 professional), programming language (Matlab R2019a), visualization tools (Cytoscape).
3.2.2. Model Parameters Setting
The proposed model has two key parameters: interaction strength threshold and granularity coefficient [37].
(1) Interaction strength threshold
In the causal factor interaction network, two nodes are connected by an edge if the interaction strength between the two causes is greater than the threshold . If the threshold is set too low, plenty of irrelevant contents will be mistakenly recognized as similar, leading to high error rates, redundant data and lower overall accuracy. If it is set too high, many slightly similar targets will be excluded, resulting in serious missing matches, low recall rate and incomplete similarity screening. Similarity coefficients greater than 0.15 are considered to have some relevance, so the threshold is set to 0.15.
(2) Granularity coefficient
In the quotient space overlay network, the similarity of two maximal complete subgraphs is greater than gc, we consider them connected in the next level quotient space overlay network. If the value of gc is too small, the complexity of model will increase. On the contrary, if the value of gc is too large, the accuracy of the model will decrease. It is significance to select the appropriate value of gc. Based on the experience and the available references, the granularity coefficient gc is set to 0.4.
3.2.3. Experimental Procedures
The specific experimental procedures are carried out in accordance with the following steps, ensuring the repeatability and rigor of the experiment:
Step 1: Data processing. Sort out the collected 526 FFH accident reports, extract 32 causal factors, and code them according to Table 1. Clean the data to remove duplicate and invalid information, and establish the accident cause matrix.
Step 2: Construction of causal factor interaction network. Based on the accident cause matrix, quantify the interaction strength between each pair of factors by formula (1). Nodes in the network represent causal factors, two nodes are connected by an edge if the interaction strength between the two causes is greater than the threshold .
Step 3: Construction of the quotient space overlay network chain on the causal factor interaction network according to Section 2.3.2.
Step 4: Mining overlapping causal factor clusters. In the final level of the quotient space overlay network, each node represents a causal factor cluster.
Step 5: Result analysis and verification.
3.3. Experimental Results
3.3.1. Causal Factor Interaction Network
The interaction strength between cause and is calculated using formula (1), the causal factor interaction network is represented by an adjacency matrix , determine the adjacency according to formula (2). After removing the isolated nodes, the final causal factor interaction network contains 28 nodes and 121 edges. The causal factor interaction network is shown in Figure 3.
3.3.2. Causal Factor Clusters
Applying the quotient space overlay network chain model on the causal factor interaction network, seven FFH causal factor clusters are obtained as shown in Table 2.
To visually demonstrate the coupling relationship among factors, the results were visualized. The visualization effect is shown in Figure 4.
As presented in Table 2 and Figure 4, the proposed method successfully mines eight overlapping causal factor clusters (C1–C7). A considerable number of factors appear in multiple clusters, directly verifying the significant overlapping and coupling characteristics of FFH accidents.
Cluster C1 is characterized by unlicensed working (P4), substandard tools (F4), and inadequate fulfillment of management responsibilities (M16). This cluster representing a typical coupling of illegal operation and weak on-site management.
Cluster C2 highlights the joint effect of unsafe equipment (P6) and non-compliant tools (F4), reflecting facility-induced risks.
Cluster C3 connects poor personal health conditions (P7) and severe weather (E2), revealing the combined impact of individual and environmental conditions.
Cluster C4 couples insufficient risk judgment (P2) with irregular contracting (M2), indicating risks caused by qualification and awareness defects.
Cluster C5 is dominated by PPE misuse (P3), inadequate on-site supervision (M6), lack of qualification verification (M7), and insufficient safety training (M10).
Cluster C6 links defective equipment (F5), irregular contracting (M1), and unapproved construction schemes (M12), showing chain failure of equipment and management.
Cluster C7 involves sign marking defects (F1), irregular contracting (M2), missing construction permit (M11), and absent safety agreements (M13), representing procedural management failure.
Overall, the extracted clusters clearly reveal the multi-group, overlapping, and coupled formation mechanism of FFH accidents, which is highly consistent with real accident evolution laws.
4. Discussion
4.1. Distribution of Causal Factors
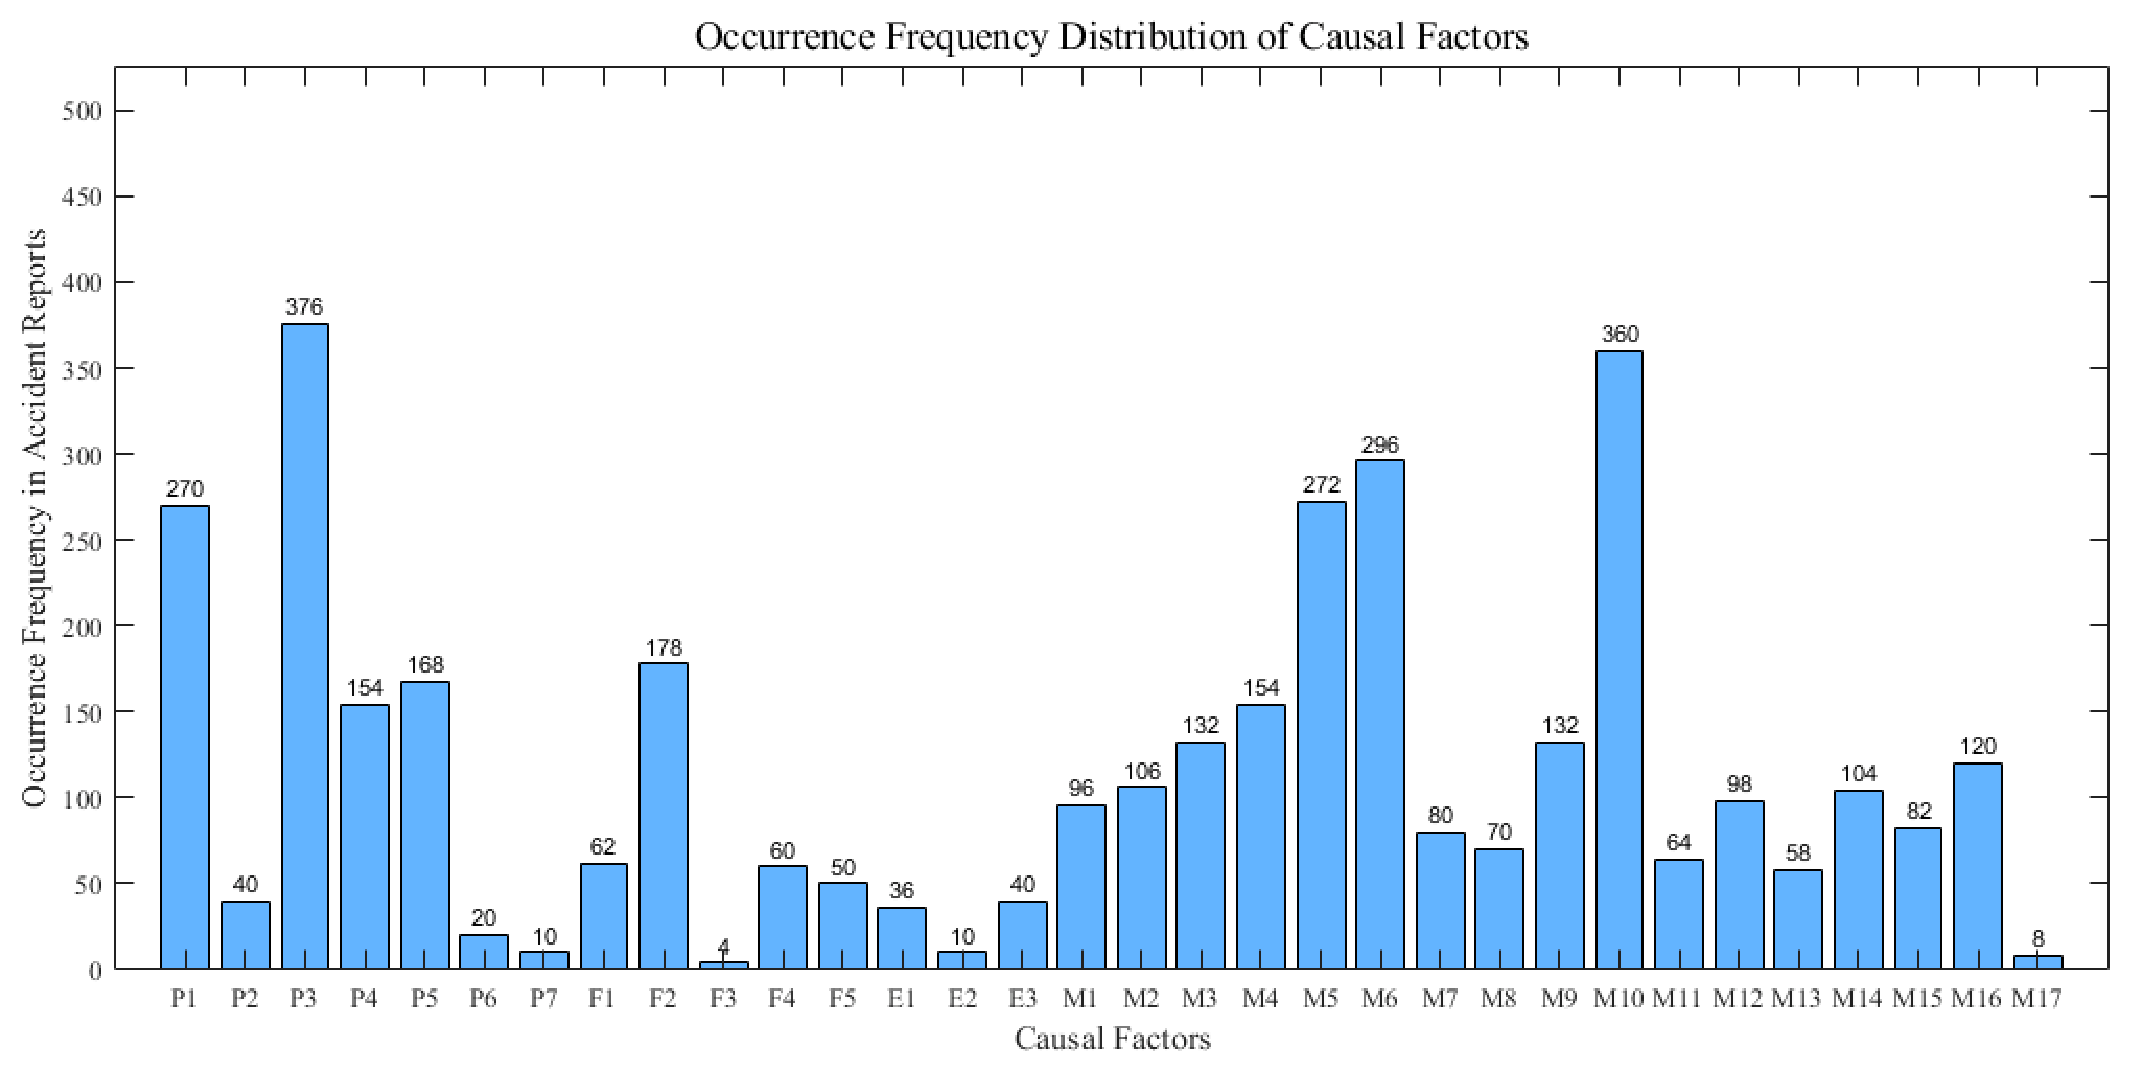
This bar chart visually displays the occurrence frequency of all screened causal factors derived from accident records, serving to identify dominant hazard sources and differentiate contribution degrees of various factor categories.
The frequency distribution of causal factors presents an obvious uneven characteristic. Management-related factors show the highest occurrence frequency in accident reports, followed by human factors and equipment factors. In contrast, environmental factors exhibit relatively low occurrence frequency. P3, M10, and M6 are the key causal factors with the highest frequency.
This degree distribution shows an uneven pattern. Management factors have the highest degrees and dominate the network, followed by human factors, while equipment and environmental factors have relatively low degrees. P3 (Failure to wear correct personal protective equipment (PPE)), M10 (Failure to conduct safety education and training), and M6 (Inadequate on-site safety supervision and management) are the core nodes with the highest degrees.
Figure 5.
Occurrence frequency distribution of causal factors.
4.2. Occurrence Rate of Causal Factor Clusters
The occurrence rate of causal factor clusters was calculated to determine how frequently each identified cluster appeared in the actual accident report, thereby reflecting their practical significance in systemic risk propagation. The occurrence rate of causal factor clusters is formally defined as follows. For a given causal factor cluster , its occurrence rate is calculated as the ratio of the number of accident case in which is observed to the total number of accident cases.
where denotes the frequency of accidents containing causal factor cluster , and is the total number of accident cases analyzed.
Table 3 presents the occurrence rates of the seven identified causal factor clusters, ranked in descending order. As shown, the occurrence rates vary considerably across clusters, ranging from 0.072 for Cluster C5 to 0.008 for Clusters C3 and C7.
Cluster C5 (P3, M6, M7, M10) exhibits the highest occurrence rate (0.072), substantially surpassing all other clusters. This indicates that C5 is the most empirically prevalent factor combination in the accident dataset, suggesting that the causal mechanisms represented by this cluster are activated more frequently than any other identified pattern. This finding is further corroborated by the individual factor frequency distribution: P3 (failure to wear correct PPE), M10 (failure to conduct safety education and training), and M6 (inadequate on-site safety supervision) are among the most frequently occurring single factors in the dataset — and all three are integral components of Cluster C5. The alignment between cluster-level and factor-level evidence reinforces the conclusion that C5 represents the most dominant risk pattern, and that its high prevalence is not an artifact of clustering logic but a reflection of the empirical prominence of its constituent factors.
Clusters C3 (P7, E2) and C7 (F1, M2, M11, M13) show the lowest occurrence rates (0.008 each), indicating that these two factor combinations are comparatively rare in real-world accident scenarios. However, it is important to note that a low occurrence rate does not necessarily equate to low risk; rare clusters may still be associated with severe consequences when they do occur, as their activation may depend on highly specific conditions or represent extreme but high-impact failure modes .
Thus, while occurrence frequency provides a valuable basis for prioritization, it should ideally be complemented by vulnerability assessments to inform more balanced safety decisions.
4.3. Cluster Vulnerability Index of Causal Factor Clusters
While occurrence rates reflect the empirical prevalence of each cluster, they do not capture the structural fragility of these clusters once formed. To address this gap, we introduced the Cluster Vulnerability Index (CVI) to quantify the structural vulnerability of each cluster.
We propose the Cluster Vulnerability Index (CVI) to quantify the structural fragility of causal factor clusters. For a given cluster , the is defined as the ratio of its external edge connections to its internal edge density, formally expressed as:
where is the number of nodes (causal factors) within the cluster , is the number of internal edges connecting factors inside the cluster, and is the number of external edges connecting factors inside the cluster to factors outside it. represents the average number of external connections per node, capturing the intensity of external pull on the cluster. is the internal edge density, reflecting how tightly the cluster is bound internally. Consequently, a higher CVI indicates that external influences outweigh internal cohesion, rendering the cluster structurally vulnerable and more prone to disintegration or state transition under exogenous disturbances.
Table 4 presents the CVI values for the seven causal factor clusters, ranked in descending order of structural vulnerability. The results reveal a substantial variation in vulnerability across clusters, ranging from 9.50 for Cluster C5 to 0.00 for Cluster C3.
Table 4 ranks the seven clusters by their CVI values. Cluster C5 exhibits the highest vulnerability (9.50), consistent with its dominant occurrence rate, while Cluster C3 shows zero vulnerability (0.00), reflecting its complete isolation from external connections. Cluster C5 exhibits the highest CVI (9.50), indicating that it is not only the most frequently occurring cluster (as shown in Table 3) but also the most structurally vulnerable. This dual predominance—highest occurrence rate and highest vulnerability—reinforces the critical importance of Cluster C5 as the primary target for safety interventions. Its structural fragility, characterized by a high ratio of external to internal connections, suggests that C5 is highly susceptible to external disturbances, which may facilitate its activation or transformation in accident scenarios.
A noteworthy finding is the divergence between occurrence frequency and structural vulnerability. Cluster C6 ranks second in CVI (7.67) despite its low occurrence rate (0.015), whereas Cluster C2 ranks third in occurrence frequency but exhibits near-minimal CVI (1.00). This indicates that frequency and vulnerability capture distinct risk dimensions: a cluster may be structurally fragile but rarely activated, or frequently activated but structurally robust.
The combined perspective suggests that intervention strategies should prioritize C5 and C4 (high frequency and high vulnerability), while C6, C1, and C7 warrant further severity assessment despite their lower frequencies. Clusters C2 and C3, with low vulnerability, represent comparatively lower structural concerns.
4.4. Four-Quadrant Risk Analysis of Causal Factor Clusters
The preceding two subsections examined the seven clusters from two distinct perspectives: empirical prevalence (occurrence rate) and structural fragility (CVI). However, neither dimension alone provides a sufficient basis for risk prioritization — a cluster that is frequently observed may be structurally robust, while a rarely observed cluster may be highly vulnerable to external perturbations. To address this gap, this subsection integrates both dimensions into a four-quadrant risk classification framework, enabling a more balanced and actionable assessment of intervention priorities. The resulting classification is illustrated in Figure 6.
The resulting classification is presented in Figure 6, where the seven causal factor clusters are mapped onto a two-dimensional matrix defined by CVI (x-axis) and occurrence rate (y-axis). The origin is set at (6.0, 0.025), with the horizontal axis representing increasing structural vulnerability and the vertical axis representing increasing empirical prevalence.
The four quadrants are defined as follows: Q1 (red) — high vulnerability and high occurrence; Q2 (orange) — low vulnerability and high occurrence; Q3 (green) — low vulnerability and low occurrence; and Q4 (blue) — high vulnerability and low occurrence. As shown in Figure 6, the seven clusters are distributed as follows: Q1 contains two clusters (C4, C5), Q2 contains one cluster (C2), Q3 contains two clusters (C3, C7), and Q4 contains two clusters (C1, C6). This relatively balanced distribution across the four quadrants suggests that FFH accidents involve a diverse range of causal patterns that require differentiated intervention strategies.
From a safety management perspective, the four quadrants correspond to distinct causal roles within the FFH accident network. Q1 (root causes) — high vulnerability and high occurrence — represents the most critical factor combinations that consistently drive accident occurrence and exhibit structural fragility. Q2 (triggering factors) — high occurrence but low vulnerability — represents frequently observed but structurally stable configurations that serve as immediate accident triggers. Q3 (minor factors) — low occurrence and low vulnerability — represents peripheral factor combinations with limited influence on the accident network. Q4 (latent root causes) — low occurrence but high vulnerability — represents hidden systemic vulnerabilities that lie dormant but become fragile once activated.
Q1 (Root Causes): Clusters C4 and C5. Clusters C4 and C5 exhibit both high empirical prevalence and high structural vulnerability, making them the primary drivers of FFH accidents. Cluster C5 (CVI = 8.5, Rate = 0.070) comprises P3 (PPE non-compliance), M6 (inadequate supervision), M7 (unverified qualifications), and M10 (insufficient training) — a systemic pattern spanning individual behavior and organizational oversight. Cluster C4 (CVI = 7.0, Rate = 0.040) links P2 (inadequate risk judgment) with M2 (irregular contracting), reflecting a persistent vulnerability in contractor management. As root causes, these clusters demand immediate, multi-layered, systemic interventions addressing both behavioral and organizational dimensions.
Q2 (Triggering Factors): Cluster C2. Cluster C2 (CVI = 2.5, Rate = 0.028) comprises P6 (unsafe equipment) and F4 (substandard tools) — a straightforward equipment-related failure mode. Its low CVI indicates structural stability, meaning it serves as a proximal trigger that directly precipitates FFH accidents without embedding deeper systemic fragilities. The appropriate strategy is routine monitoring and targeted prevention through equipment maintenance and inspection protocols.
Q3 ( Minor Factors) : Clusters C3 and C7. Cluster C3 (CVI = 1.5, Rate = 0.010) consists of P7 (self-health reasons) and E2 (severe weather) — external factors with limited interaction with organizational safety systems and thus deprioritized. Cluster C7 (CVI = 4.5, Rate = 0.008), while also low-frequency, involves F1 (sign marking defects), M2 (irregular contracting), M11 (no construction permit), and M13 (no safety agreement) — four procedural violations whose complexity suggests caution despite its low occurrence. Routine observation with periodic review is recommended for C7.
Q4 (Latent Root Causes): Clusters C1 and C6. Clusters C1 and C6 are rarely observed but highly fragile. Cluster C6 (CVI = 7.5, Rate = 0.015) combines F5 (defective equipment), M2 (irregular contracting), and M12 (unapproved construction program). Cluster C1 (CVI = 6.5, Rate = 0.018) combines P4 (unlicensed work), F4 (substandard tools), and M16 (managerial neglect). These clusters represent dormant systemic vulnerabilities that may remain hidden until specific conditions allow them to coalesce. The appropriate strategy is proactive identification and mitigation through regular safety audits targeting equipment certification, contracting procedures, and management oversight, supplemented by scenario-based risk simulations to assess potential escalation pathways.
Cross-quadrant insights reveal that management factors (M-type) are present in all high-vulnerability clusters (Q1 and Q4), suggesting that management system reforms should be the cornerstone of FFH accident prevention. The balanced distribution of clusters across quadrants further indicates that FFH accidents stem from heterogeneous causal patterns requiring differentiated strategies rather than uniform safety programs.
In summary, the four-quadrant framework provides a structured, evidence-based approach to prioritizing safety interventions in FFH accidents. By distinguishing between root causes, triggering factors, minor factors, and latent root causes, it offers a practical taxonomy that enables safety managers to allocate resources efficiently.
4.5. Practical Implications for Falls from Height Safety Management
The quadrant-based causal taxonomy offers several practical implications for safety management in FFH accident prevention.
First, the classification of Q1 clusters (C4, C5) as root causes suggests that safety managers should allocate disproportionate resources to addressing the synergy between individual-level behaviors and organizational-level failures. This includes strengthening PPE enforcement, enhancing on-site supervision, implementing rigorous qualification verification, conducting mandatory safety training, and tightening contractor qualification screening. These interventions should be implemented in an integrated manner, as root causes are inherently systemic and addressing individual factors in isolation will not disrupt the core failure pathways.
Second, the identification of Q4 clusters (C1, C6) as latent root causes highlights the importance of proactive identification of hidden vulnerabilities. Safety management systems should incorporate regular audits targeting the constituent factors of Q4 clusters — particularly equipment certification, contracting procedures, construction program approvals, and management oversight. Leading indicators should be developed to detect early warning signs of Q4 cluster activation, enabling intervention before the full constellation of latent factors coalesces. The low frequency of Q4 clusters should not be interpreted as a sign of safety, but rather as a reminder that rare events can have severe consequences when they occur.
Third, the classification of Q2 cluster (C2) as a triggering factor suggests that equipment-only failure modes may be effectively managed through established maintenance and inspection protocols. Routine equipment safety programs are likely adequate for preventing this type of cluster, and they do not require the systemic reforms needed for Q1 and Q4 clusters.
Fourth, the Q3 clusters (C3 and C7) remind safety managers that low frequency and low vulnerability do not automatically justify complete deprioritization. While C3 can be safely deprioritized due to its external nature (health and weather), C7's multi-layered procedural failure composition suggests that it may represent an extreme but potentially severe accident scenario. Safety managers should periodically review C7-related incidents to ensure that its rarity is not masking a hidden high-impact risk.
Fifth, the overarching finding that management factors (M-type) are present in all high-vulnerability clusters (Q1 and Q4) suggests that management system reforms should be the cornerstone of FFH accident prevention. Strengthening management oversight, clarifying safety responsibilities, and ensuring procedural compliance are likely to yield broader reductions in both frequency and vulnerability than interventions targeting individual behaviors or equipment factors alone.
5. Conclusions
This study investigated the causal mechanisms of falls from height accidents by constructing a causal factor interaction network and applying the quotient space overlay network chain approach. Through this methodology, seven distinct causal factor clusters were identified. Cluster C5 exhibited both the highest occurrence rate (0.072) and structural vulnerability (CVI = 9.5), identifying it as the most critical risk pattern. The proposed Cluster Vulnerability Index provides a complementary metric to occurrence frequency for assessing cluster fragility.
The four-quadrant framework distinguishes root causes, triggering factors, minor factors, and latent root causes. Management-related factors drive structural vulnerability across all high-risk clusters, indicating that management system reforms should be the cornerstone of prevention efforts. This framework offers a practical tool for safety resource allocation adaptable to other construction contexts.
Limitations include reliance on a single dataset; future research should incorporate consequence severity and examine temporal cluster evolution.
Author Contributions
J.Z. and P.X.W.Z. conceptualized the study; X.Y.D. collected and analyzed the FFH accident data; J.Z. designed the model and wrote the original draft. S.X. and P.X.W.Z. read and revised the paper critically. All authors have read and agreed to the published version of the manuscript.
Funding
This work was financially supported by the National Natural Science Foundation of China (72371036), China Postdoctoral Science Foundation (2021M700532), Natural Science Basic Research Program of Shaanxi (2022JQ-657).
Conflicts of Interest
The authors declare no conflicts of interest.
Abbreviations
The following abbreviations are used in this manuscript:
| FFH | Fall from height |
| CVI | Cluster vulnerability index |
References
- long Peng, J.; Liu, X.; Peng, C.; Shao, Y. Comprehensive factor analysis and risk quantification study of fall from height accidents. Heliyon 2023, 9. [Google Scholar] [CrossRef] [PubMed]
- Khanh, H.D. Factors contributing to fall accidents in Vietnamese building projects: a cluster-based approach. Saf. Sci. 2026, 194, 107058. [Google Scholar] [CrossRef]
- Oliveira, S.S.; de Albuquerque Soares, W.; Vasconcelos, B.M. Fatal fall-from-height accidents: Statistical treatment using the Human Factors Analysis and Classification System–HFACS. J. Saf. Res. 2023, 86, 118–126. [Google Scholar] [CrossRef] [PubMed]
- Pereira, F.; González García, M.d.l.N.; Poças Martins, J. BIM for safety: Applying real-time monitoring technologies to prevent falls from height in construction. Appl. Sci. 2025, 15, 2218. [Google Scholar] [CrossRef]
- Anantharaman, V.; DipEM, H.Y.; Natarajan Krishnamurthy, B. Characteristics of injuries resulting from falls from height in the construction industry. Singap. Med. J. 2022, 1, 19. [Google Scholar]
- Huang, X.; Hinze, J. Analysis of construction worker fall accidents. J. Constr. Eng. Manag. 2003, 129, 262–271. [Google Scholar] [CrossRef]
- Hamid, A.R.A.; Majid, M.Z.A. Causes of accidents at construction sites. Malays. J. Civ. Eng. 2008, 20, 242–259. [Google Scholar]
- Haslam, R.A.; Hide, S.A.; Gibb, A.G.; Gyi, D.E.; Pavitt, T.; Atkinson, S.; Duff, A.R. Contributing factors in construction accidents. Appl. Ergon. 2005, 36, 401–415. [Google Scholar] [CrossRef] [PubMed]
- Wong, L.; Wang, Y.; Law, T.; Lo, C.T. Association of root causes in fatal fall-from-height construction accidents in Hong Kong. J. Constr. Eng. Manag. 2016, 142, 04016018. [Google Scholar] [CrossRef]
- Zaini, N.Z.M.; Salleh, M.A.M.; Hasmori, M.F.; Abas, N.H. Effect of accident due to fall from height at construction sites in Malaysia. In Proceedings of the IOP Conference Series. Earth and Environmental Science, 2020. [Google Scholar]
- Niu, H.; Yang, X.; Zhang, J.; Guo, S. Risk coupling analysis of causal factors in construction fall-from-height accidents. Eng. Constr. Archit. Manag. 2025, 32, 6045–6067. [Google Scholar] [CrossRef]
- Zheng, Y.; Guo, J.; Chen, J.; Wang, X. Mechanism Analysis of Fall Accidents Based on Rheological-Catastrophic Theory. In Proceedings of the Proceedings of the 2025 International Conference on Engineering Management and Safety Engineering (EMSE 2025), 2025; p. 133. [Google Scholar]
- Li, J.; Wang, T. Data-driven Bayesian networks for risk scenario mapping of Falls from height accidents. PLoS ONE 2025, 20, e0334611. [Google Scholar] [CrossRef] [PubMed]
- Zermane, A.; Tohir, M.Z.M.; Zermane, H.; Baharudin, M.R.; Yusoff, H.M. Predicting fatal fall from heights accidents using random forest classification machine learning model. Saf. Sci. 2023, 159, 106023. [Google Scholar] [CrossRef]
- Xia, Q.; Yu, M.; Tan, Y.; Cheng, G.; Zhang, Y.; Wang, H.; Tian, L. A Novel Framework for Roof Accident Causation Analysis Based on Causation Matrix and Bayesian Network Modeling Methods. Appl. Sci. 2025, 15, 11521. [Google Scholar] [CrossRef]
- Kumi, L.; Jeong, J.; Jeong, J.; Son, J.; Mun, H. Network-based safety risk analysis and interactive dashboard for root cause identification in construction accident management. Reliab. Eng. Syst. Saf. 2025, 256, 110814. [Google Scholar] [CrossRef]
- Liu, S.; Yan, W.; Ma, J.; Liu, G.; Zhang, R. Modularity-Driven Keyword Co-Occurrence Network for Mining Statistical Associations in Construction Safety Accidents. Buildings 2026, 16, 1461. [Google Scholar] [CrossRef]
- Chi, C.-F.; Chang, T.-C.; Ting, H.-I. Accident patterns and prevention measures for fatal occupational falls in the construction industry. Appl. Ergon. 2005, 36, 391–400. [Google Scholar] [CrossRef] [PubMed]
- Zermane, A.; Tohir, M.Z.M.; Baharudin, M.R.; Yusoff, H.M. Risk assessment of fatal accidents due to work at heights activities using fault tree analysis: Case study in Malaysia. Saf. Sci. 2022, 151, 105724. [Google Scholar] [CrossRef]
- Abdelhamid, T.S.; Everett, J.G. Identifying root causes of construction accidents. J. Constr. Eng. Manag. 2000, 126, 52–60. [Google Scholar] [CrossRef]
- REN, C.; LI, X.; XIE, F. Key factors coupling in hazardous materials road transport accidents integrating higher-order network and functional resonance analysis method. J. Highw. Transp. Res. Dev. 2025, 42, 24–36. [Google Scholar]
- Zhang, L.; Zhang, B. Quotient space based problem solving: a theoretical foundation of granular computing; Newnes, 2014. [Google Scholar]
- Zhao, J.; Lei, X. Mining overlapping protein complexes in PPI network based on granular computation in quotient space. In Proceedings of the International Conference on Intelligent Computing, 2018; pp. 691–696. [Google Scholar]
- Mao, Y.; Ming, Z.; Yu, X.; Li, J. Construction Accident Narrative Classification and Risk Theme Mining Using Pretrained Language Models. Reliab. Eng. Syst. Saf. 2026, 112992. [Google Scholar] [CrossRef]
- Luo, X.; Zhang, L.; Guo, B.H.; Ma, Y.; Du, Q.; Bai, L. A domain-adaptive multilevel framework for learning accident narratives to support proactive construction safety management. Saf. Sci. 2026, 202, 107295. [Google Scholar] [CrossRef]
- Guo, H.; Mo, Y.; Guo, F.; Kang, R.; Tang, K.; Ma, Q. Association analysis of causative factors of fall from height accidents. J. Saf. Sci. Resil. 2025, 6, 100221. [Google Scholar] [CrossRef]
- Yoon, Y. A Study on Causes of Fatal Accidents in the Construction Industry Using 4M-based Frequency Ratio Analysis. J. Converg. Cult. Technol. 2025, 11, 787–796. [Google Scholar]
- Qi, H.; Zhou, Z.; Irizarry, J.; Lin, D.; Zhang, H.; Li, N.; Cui, J. Automatic identification of causal factors from fall-related accident investigation reports using machine learning and ensemble learning approaches. J. Manag. Eng. 2024, 40, 04023050. [Google Scholar] [CrossRef]
- Huang, S.; Jin, C.; Chen, T.; Wang, Z.; Wang, J. Analysis of major road traffic accident causes using a combined method of association rule and complex network. J. Adv. Transp. 2025, 2025, 8714444. [Google Scholar] [CrossRef]
- Wang, W.; Lai, X.; Sun, Y. Explore human-factor impacts on the occurrence of general aviation accidents. Reliab. Eng. Syst. Saf. 2025, 111900. [Google Scholar] [CrossRef]
- Yang, L.; Liu, J.; Liu, Z.; Zhou, Q.; Liu, Y.; Wang, Y.; Wu, W. From text to network: A framework for identifying causal factors and risk propagation paths in maritime accidents. Reliab. Eng. Syst. Saf. 2026, 112282. [Google Scholar] [CrossRef]
- Huo, X.; Du, S.; Jiao, L. Critical causal path analysis of subway construction safety accidents based on text mining. ASCE-ASME J. Risk Uncertain. Eng. Syst. Part A Civ. Eng. 2025, 11, 04024075. [Google Scholar] [CrossRef]
- Zhao, C.; Mi, C.; Zhou, Z.; Fang, J. Key cause chains selection of electric personal accidents based on combinatorial association analysis model. China Saf. Sci. J. (CSSJ) 2022, 32, 99–106. [Google Scholar]
- Hasan, Z.F.; Nawaf, H.N. Community Detection Based on the LO-WT Algorithm. Eng. Technol. Appl. Sci. Res. 2025, 15, 26540–26548. [Google Scholar] [CrossRef]
- Zhao, J.; Lei, X.; Wu, F.-X. Predicting protein complexes in weighted dynamic PPI networks based on ICSC. Complexity 2017, 2017, 4120506. [Google Scholar] [CrossRef]
- Zhang, L.; Zhang, B. Quotient space based multi-granular computing. In Proceedings of the 2005 IEEE International Conference on Granular Computing, 2005; p. 98 Vol. 91. [Google Scholar]
- Zhao, J.; Lei, X. Detecting overlapping protein complexes in weighted PPI network based on overlay network chain in quotient space. BMC Bioinform. 2019, 20, 682. [Google Scholar] [CrossRef] [PubMed]
- Zhang, L.; He, F.-g.; Zhang, Y.-p.; Zhao, S. A new algorithm for optimal path finding in complex networks based on the quotient space. Fundam. Informaticae 2009, 93, 459–469. [Google Scholar] [CrossRef]
- Li, Z.; Zhang, Y. High-Altitude Fall Accidents in Construction: A Text Mining Analysis of Causal Factors and COVID-19 Impact. Modelling 2025, 6, 124. [Google Scholar] [CrossRef]
- Zhang, J.; Jiang, S. Identification of unsafe behaviors and coupling relationship based on enhanced text preprocessing and association analysis. Eng. Constr. Archit. Manag. 2026, 33, 7526–7550. [Google Scholar] [CrossRef]
- Benderouach, K.; Bennis, I.; Mansouri, K.; Siadat, A. Predicting industrial accident causes from text descriptions: a Machine Learning-Based approach. In Proceedings of the 2025 11th International Conference on Optimization and Applications (ICOA), 2025; pp. 1–5. [Google Scholar]
Figure 1.
Schematic diagram of causal factor interaction network and causal factor clusters.
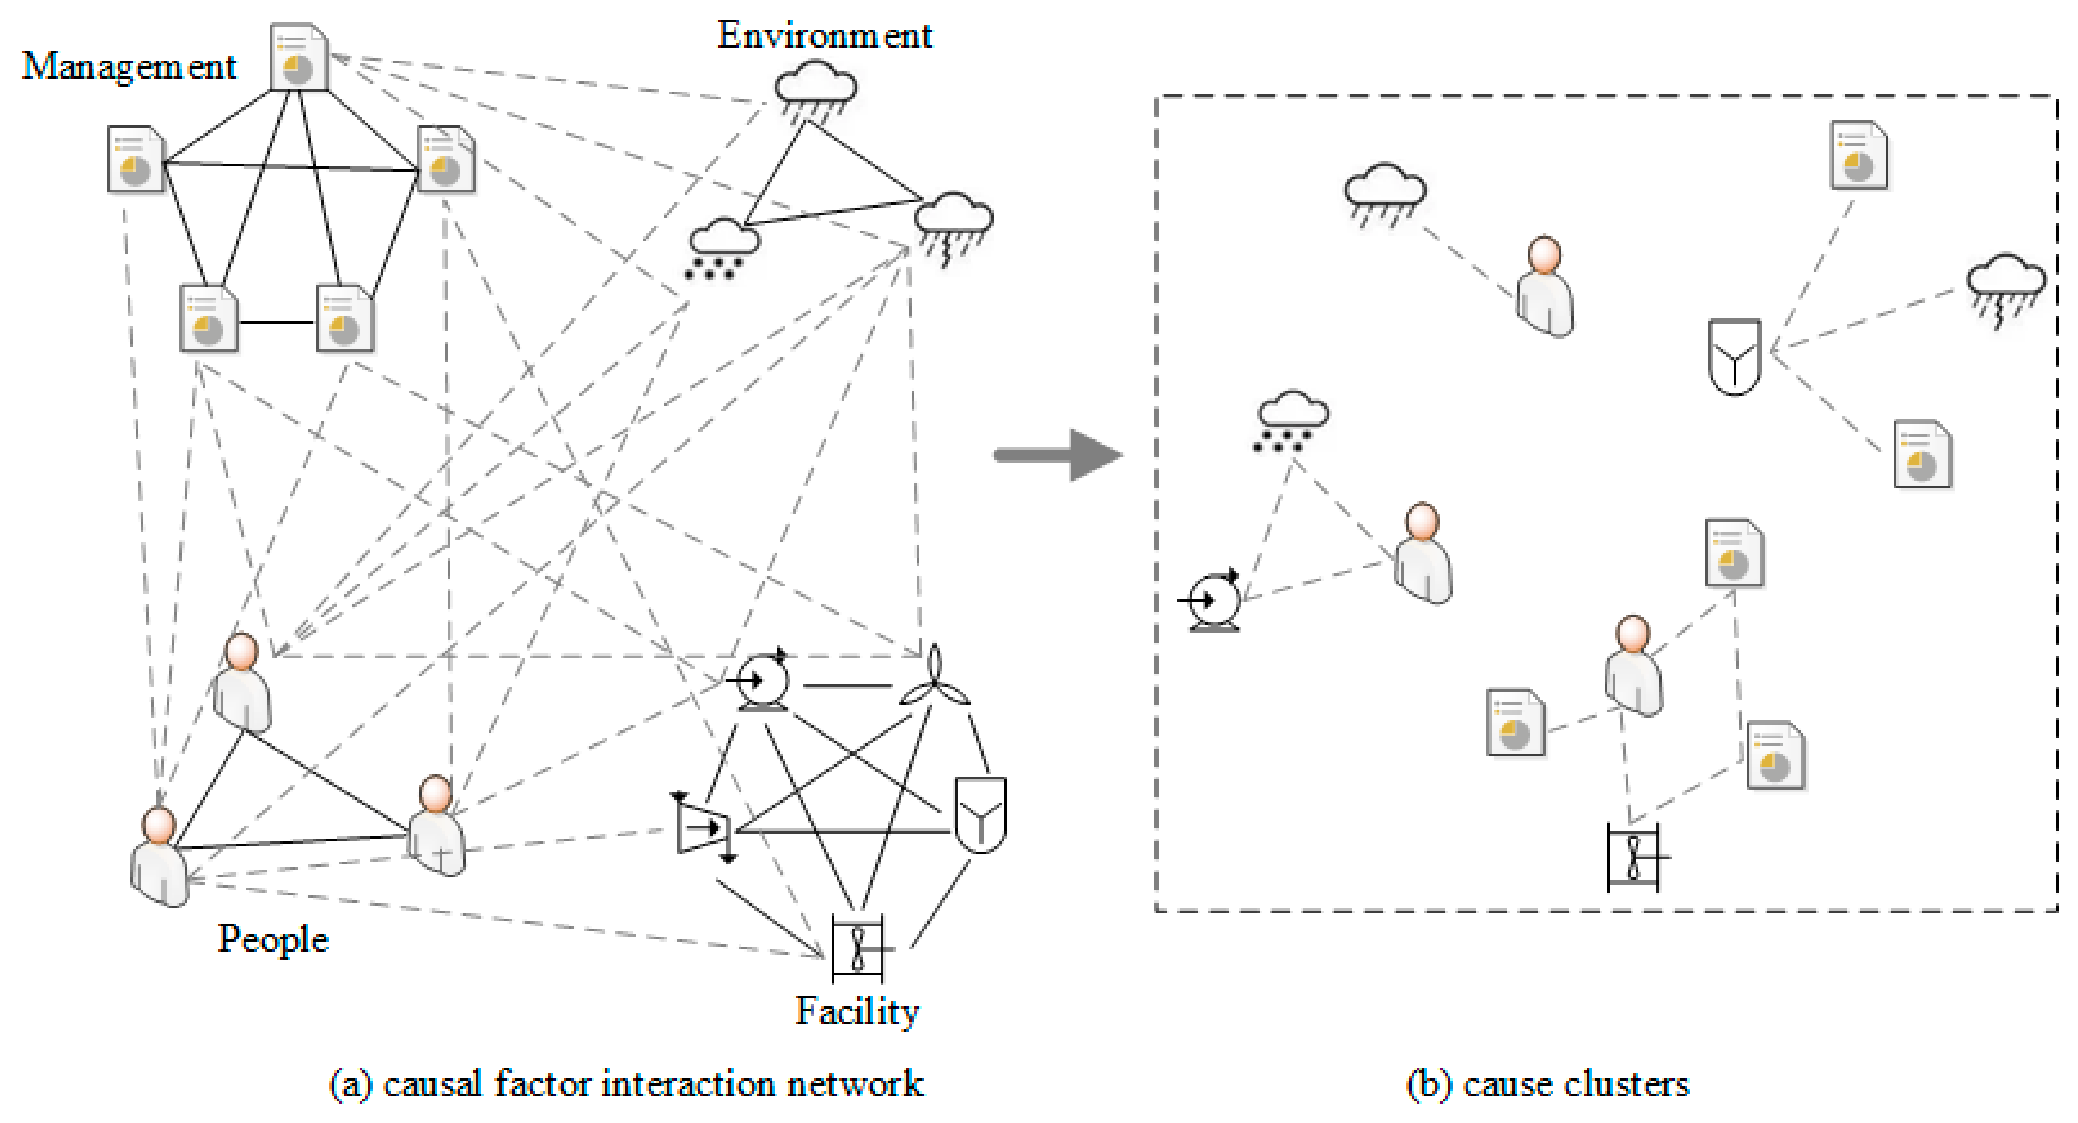
Figure 2.
Construction of quotient space overlay network chain.
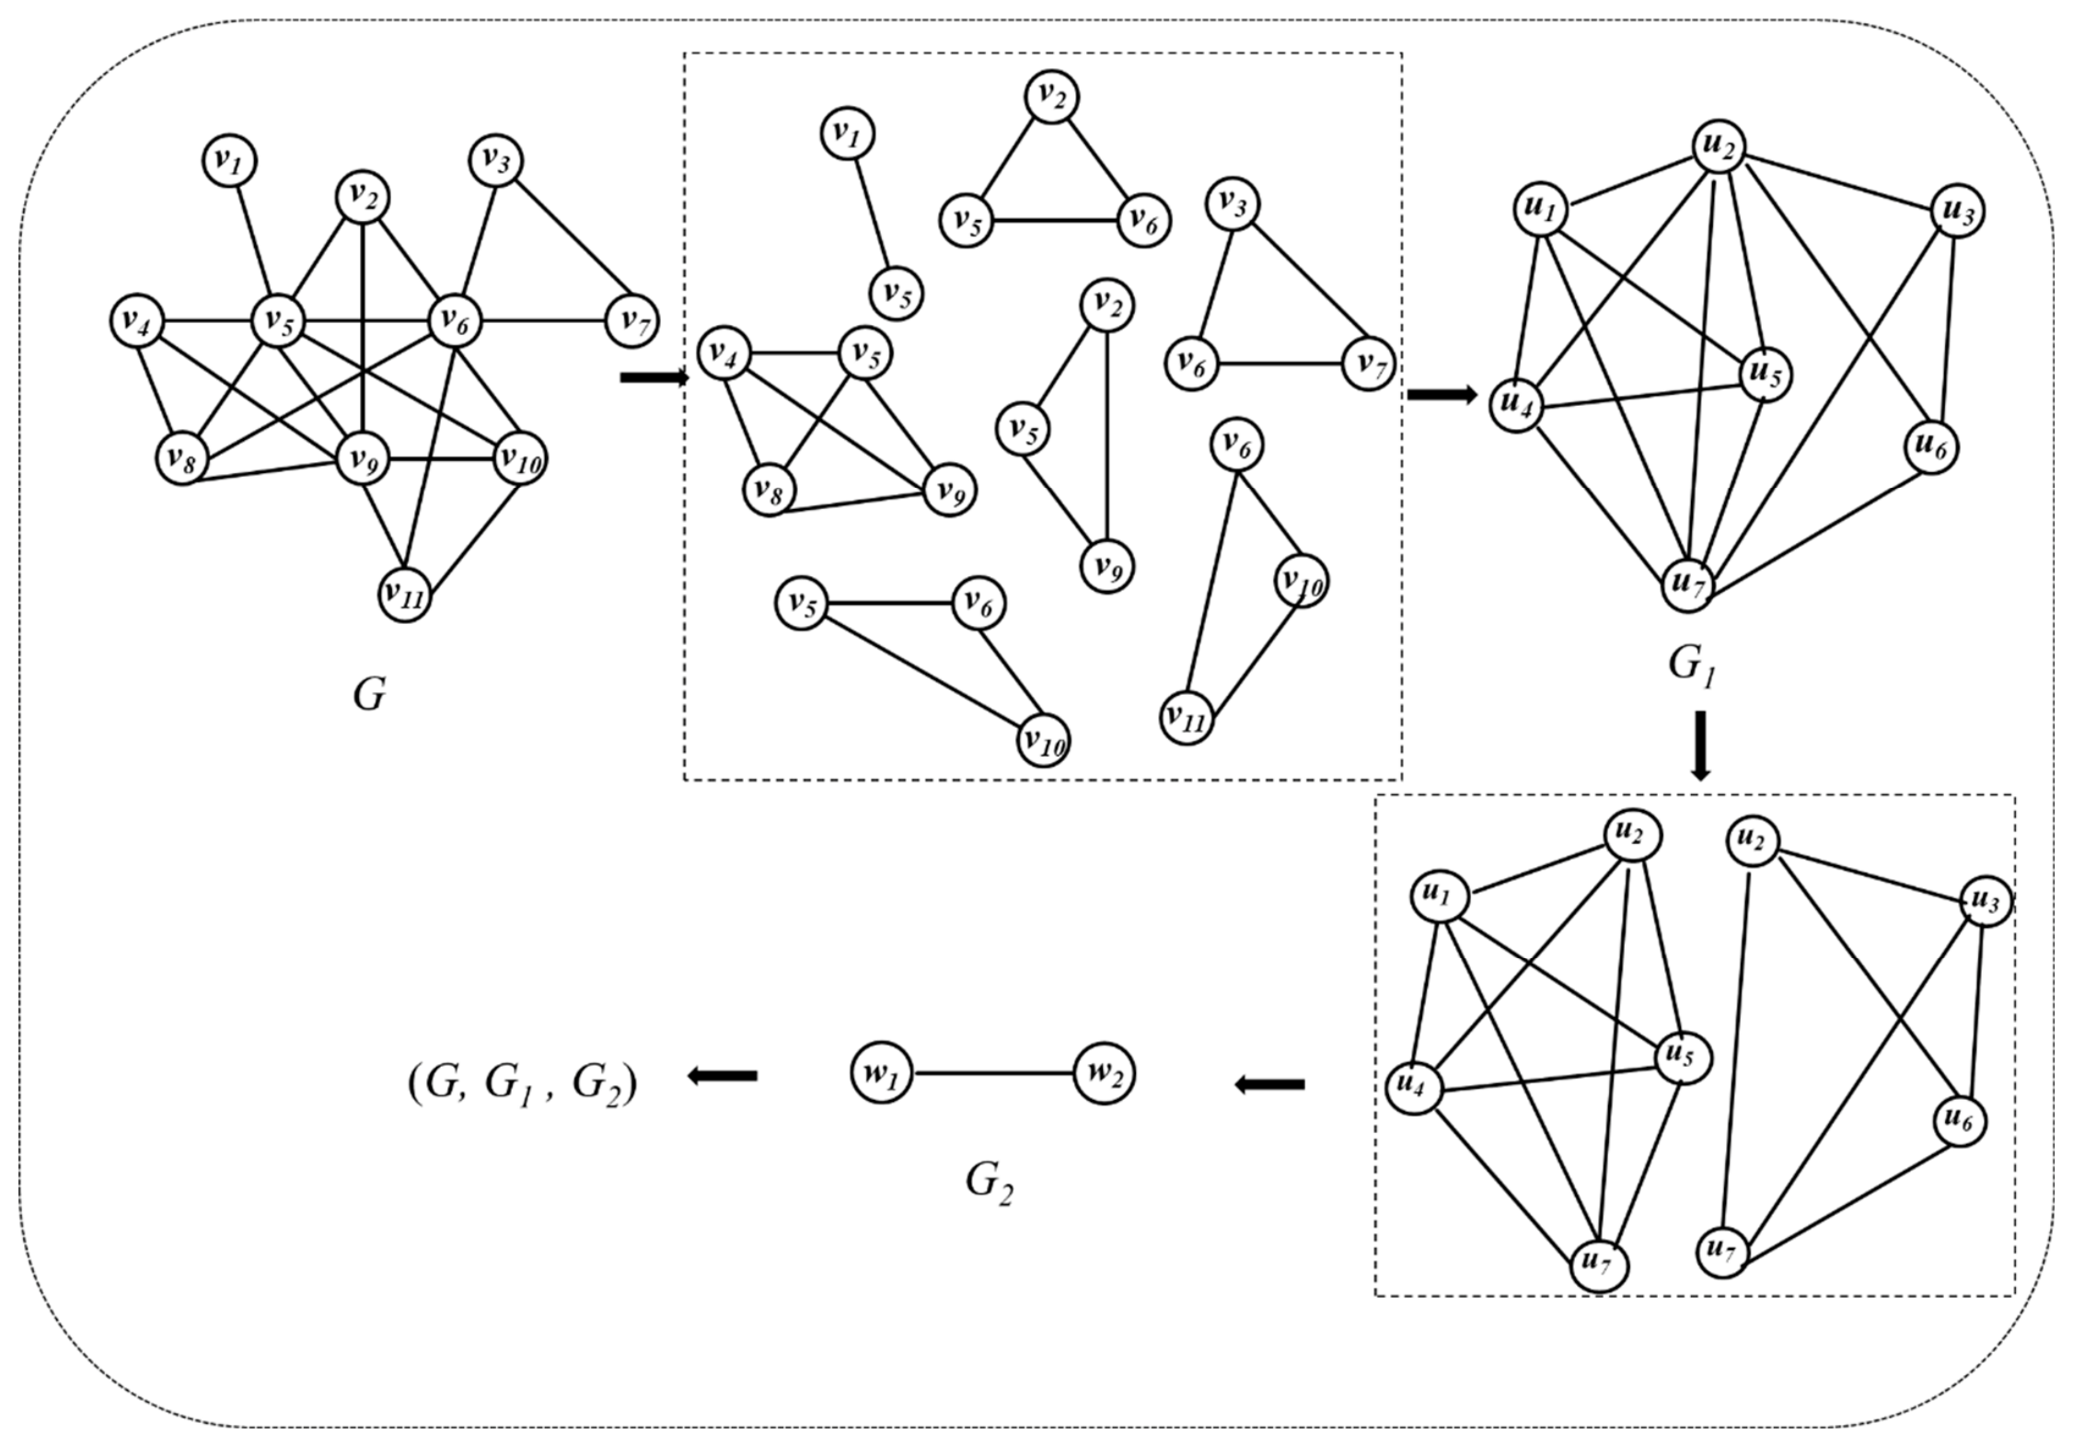
Figure 3.
Causal factor interaction network.
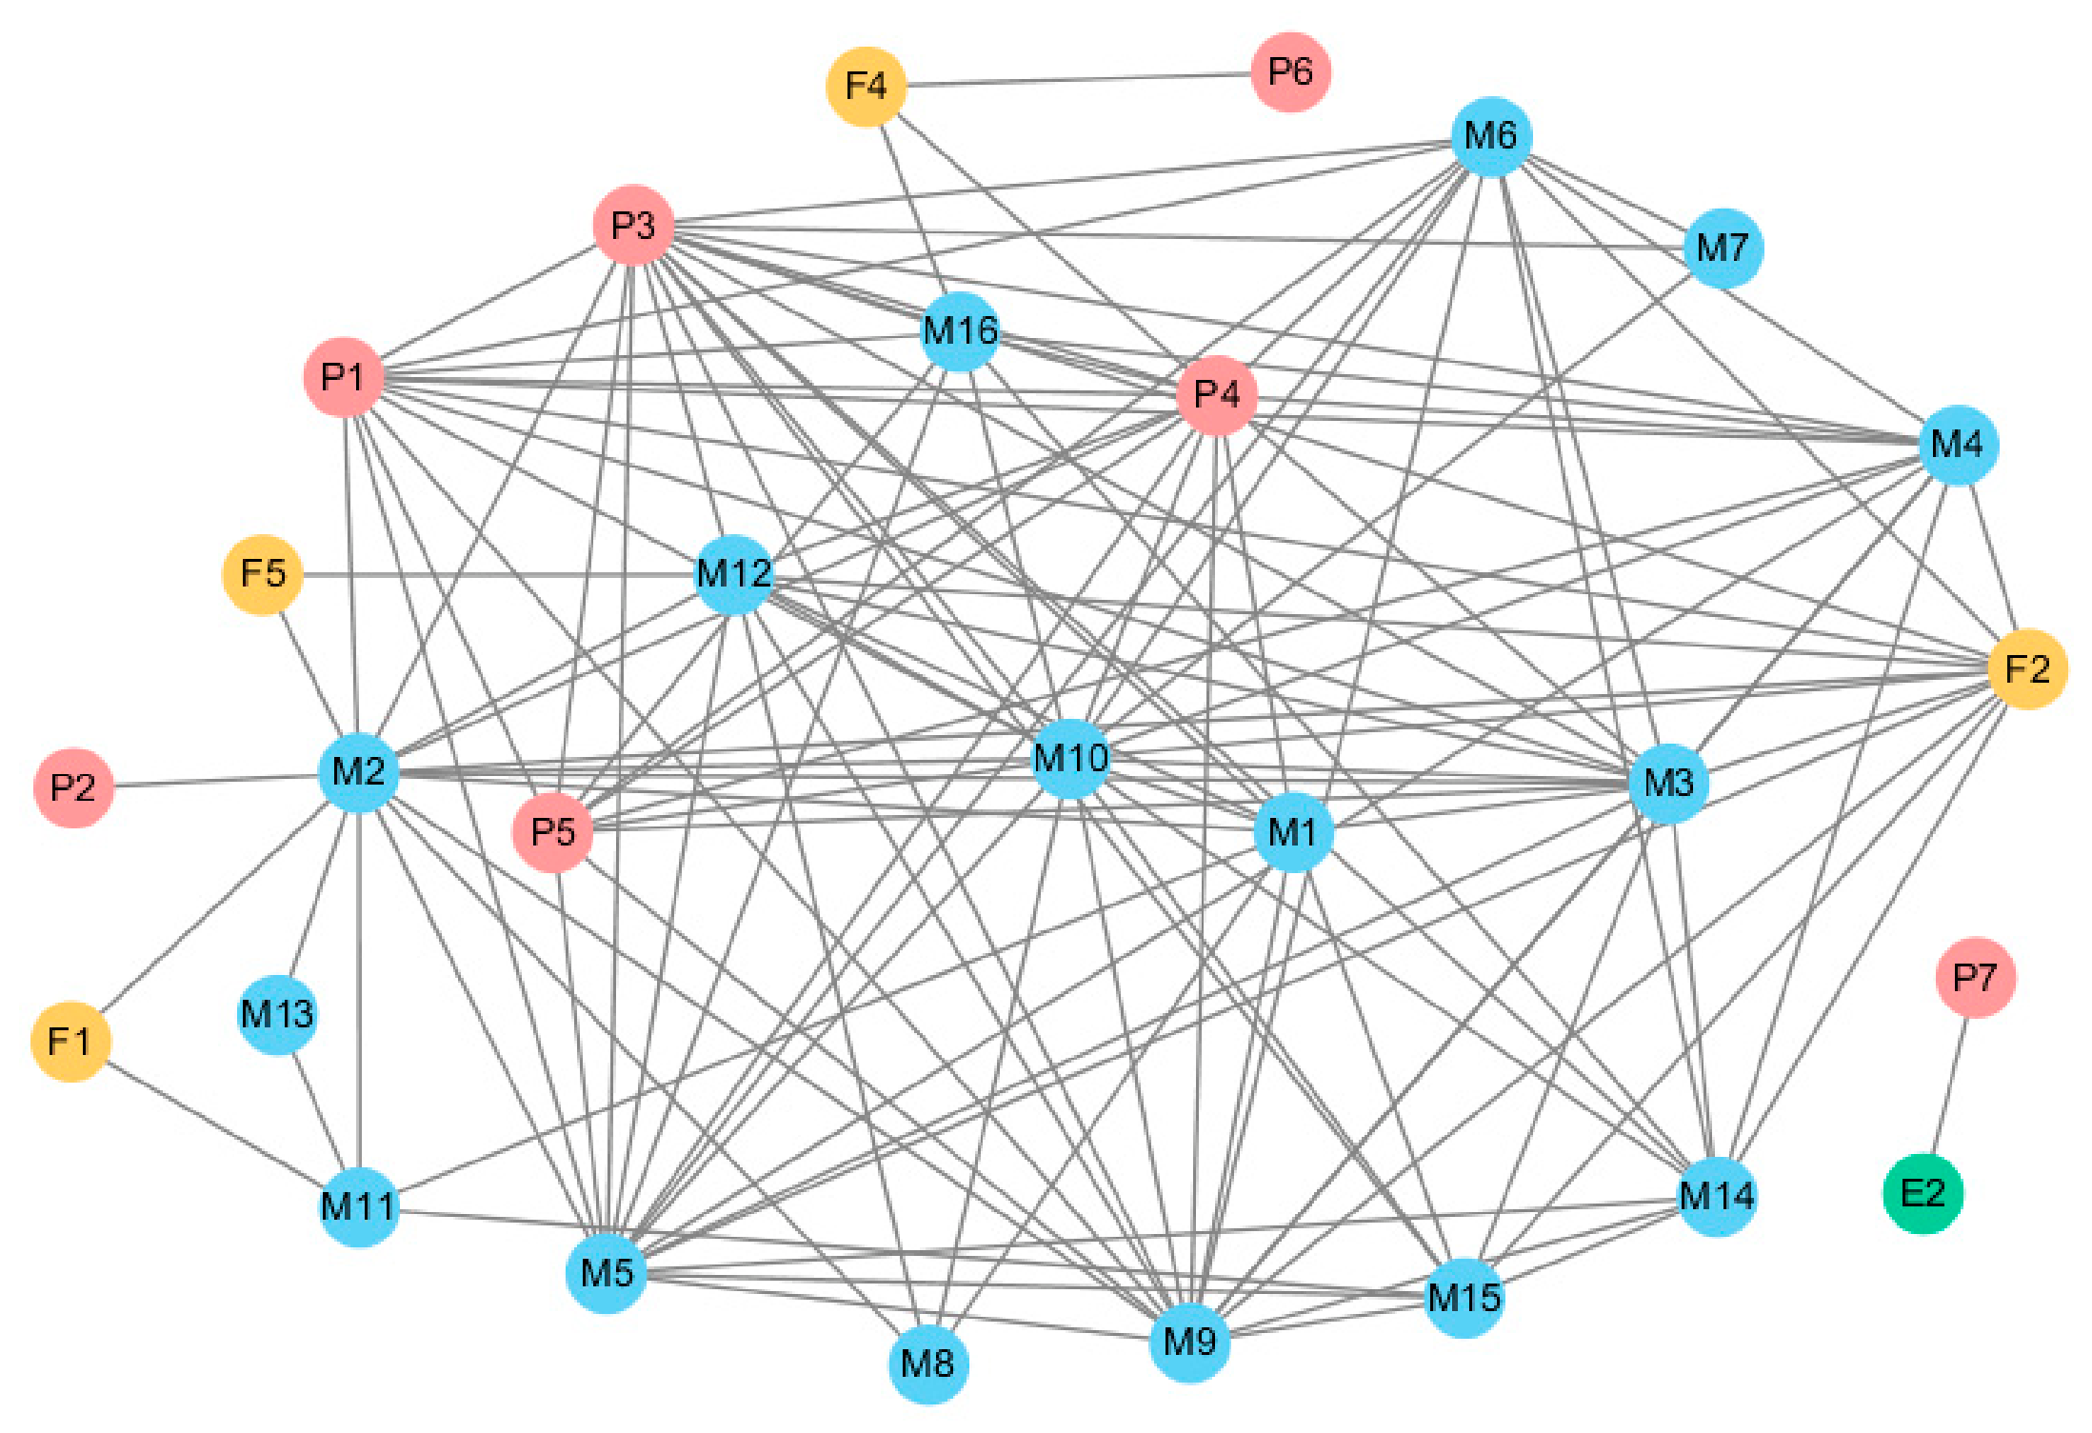
Figure 4.
Accidents causal factor clusters.
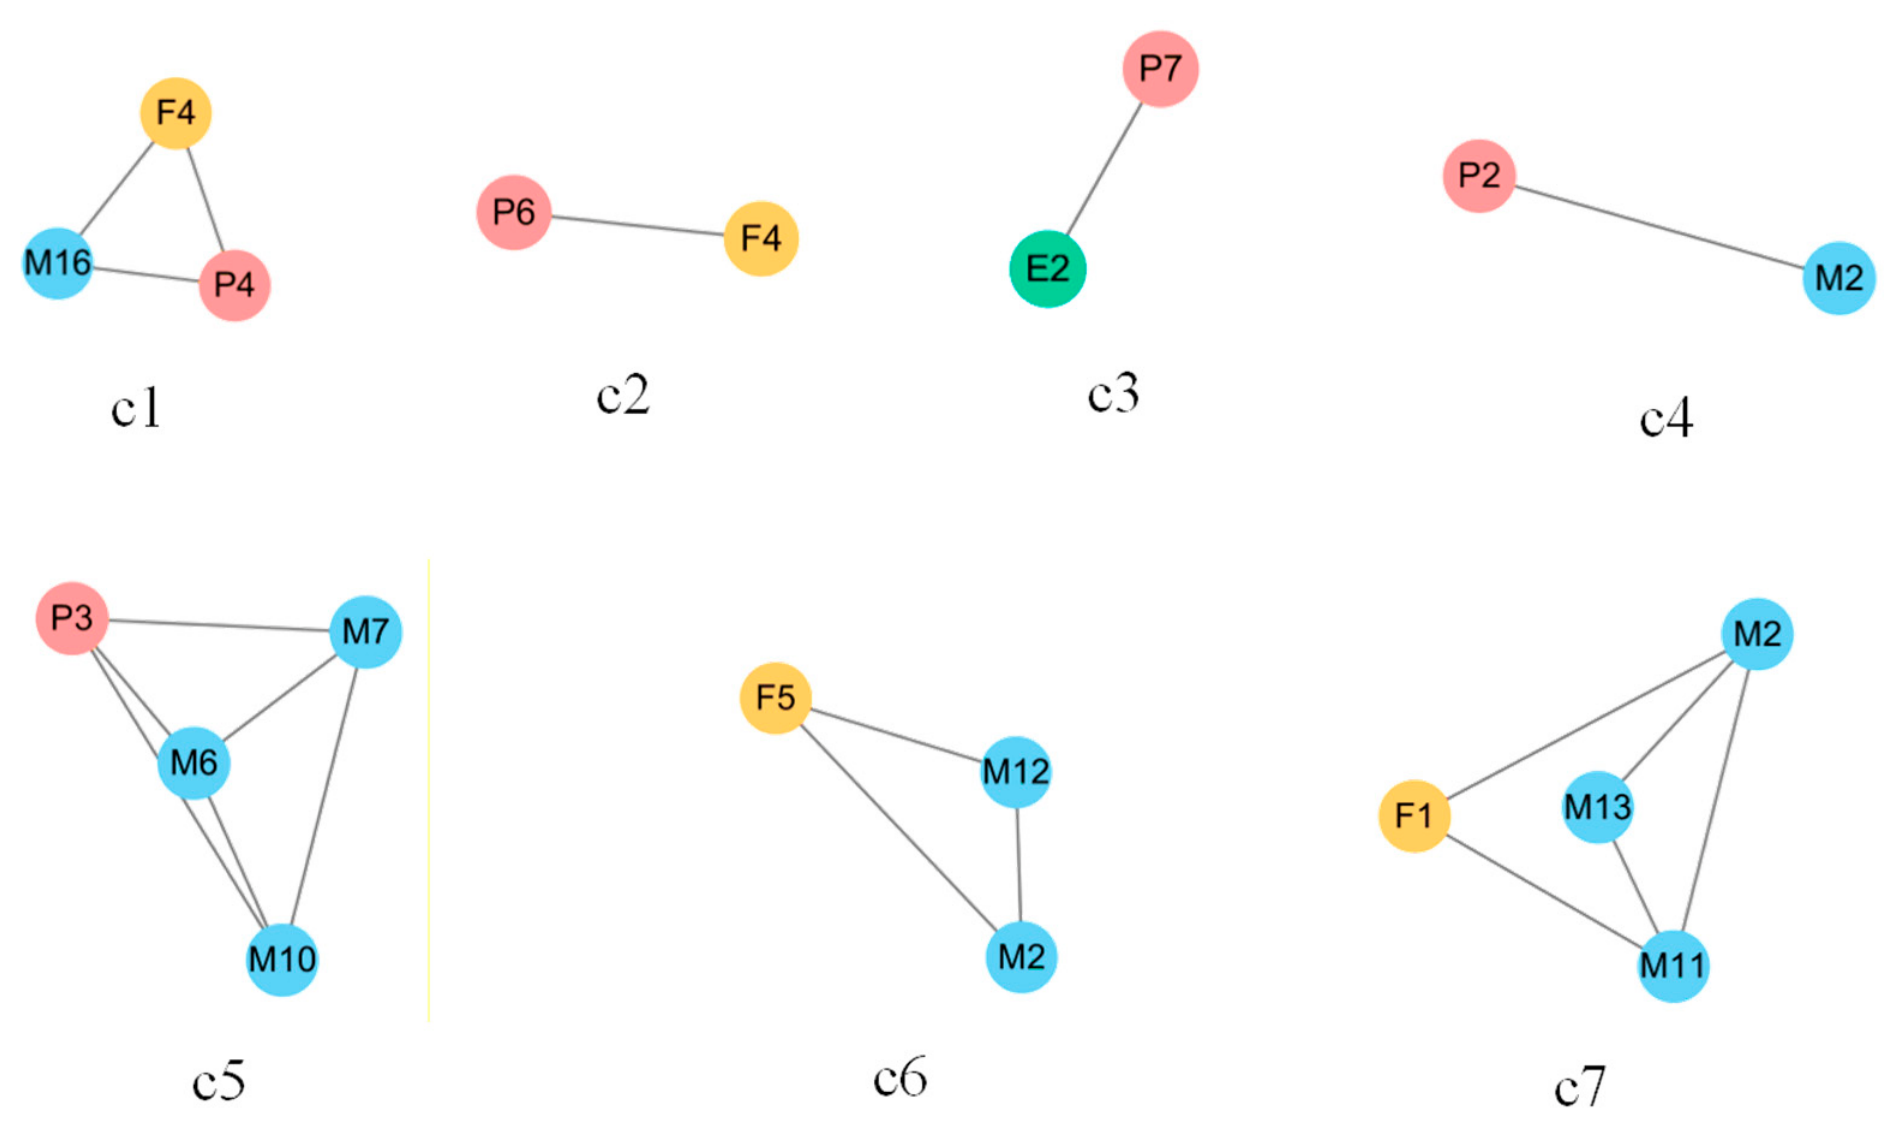
Figure 6.
Four-quadrant risk analysis of causal factor clusters for falls from height accidents based on vulnerability index (x-axis) and occurrence rate (y-axis). The origin is set at (6.0, 0.025) for balanced distribution. Quadrants: Q1 (red): high vulnerability & high occurrence; Q2 (orange): low vulnerability & high occurrence; Q3 (green): low vulnerability & low occurrence; Q4 (blue): high vulnerability & low occurrence. Point distribution: Q1=2 (C4, C5), Q2=1 (C2), Q3=2 (C3, C7), Q4=2 (C1, C6).
Figure 6.
Four-quadrant risk analysis of causal factor clusters for falls from height accidents based on vulnerability index (x-axis) and occurrence rate (y-axis). The origin is set at (6.0, 0.025) for balanced distribution. Quadrants: Q1 (red): high vulnerability & high occurrence; Q2 (orange): low vulnerability & high occurrence; Q3 (green): low vulnerability & low occurrence; Q4 (blue): high vulnerability & low occurrence. Point distribution: Q1=2 (C4, C5), Q2=1 (C2), Q3=2 (C3, C7), Q4=2 (C1, C6).
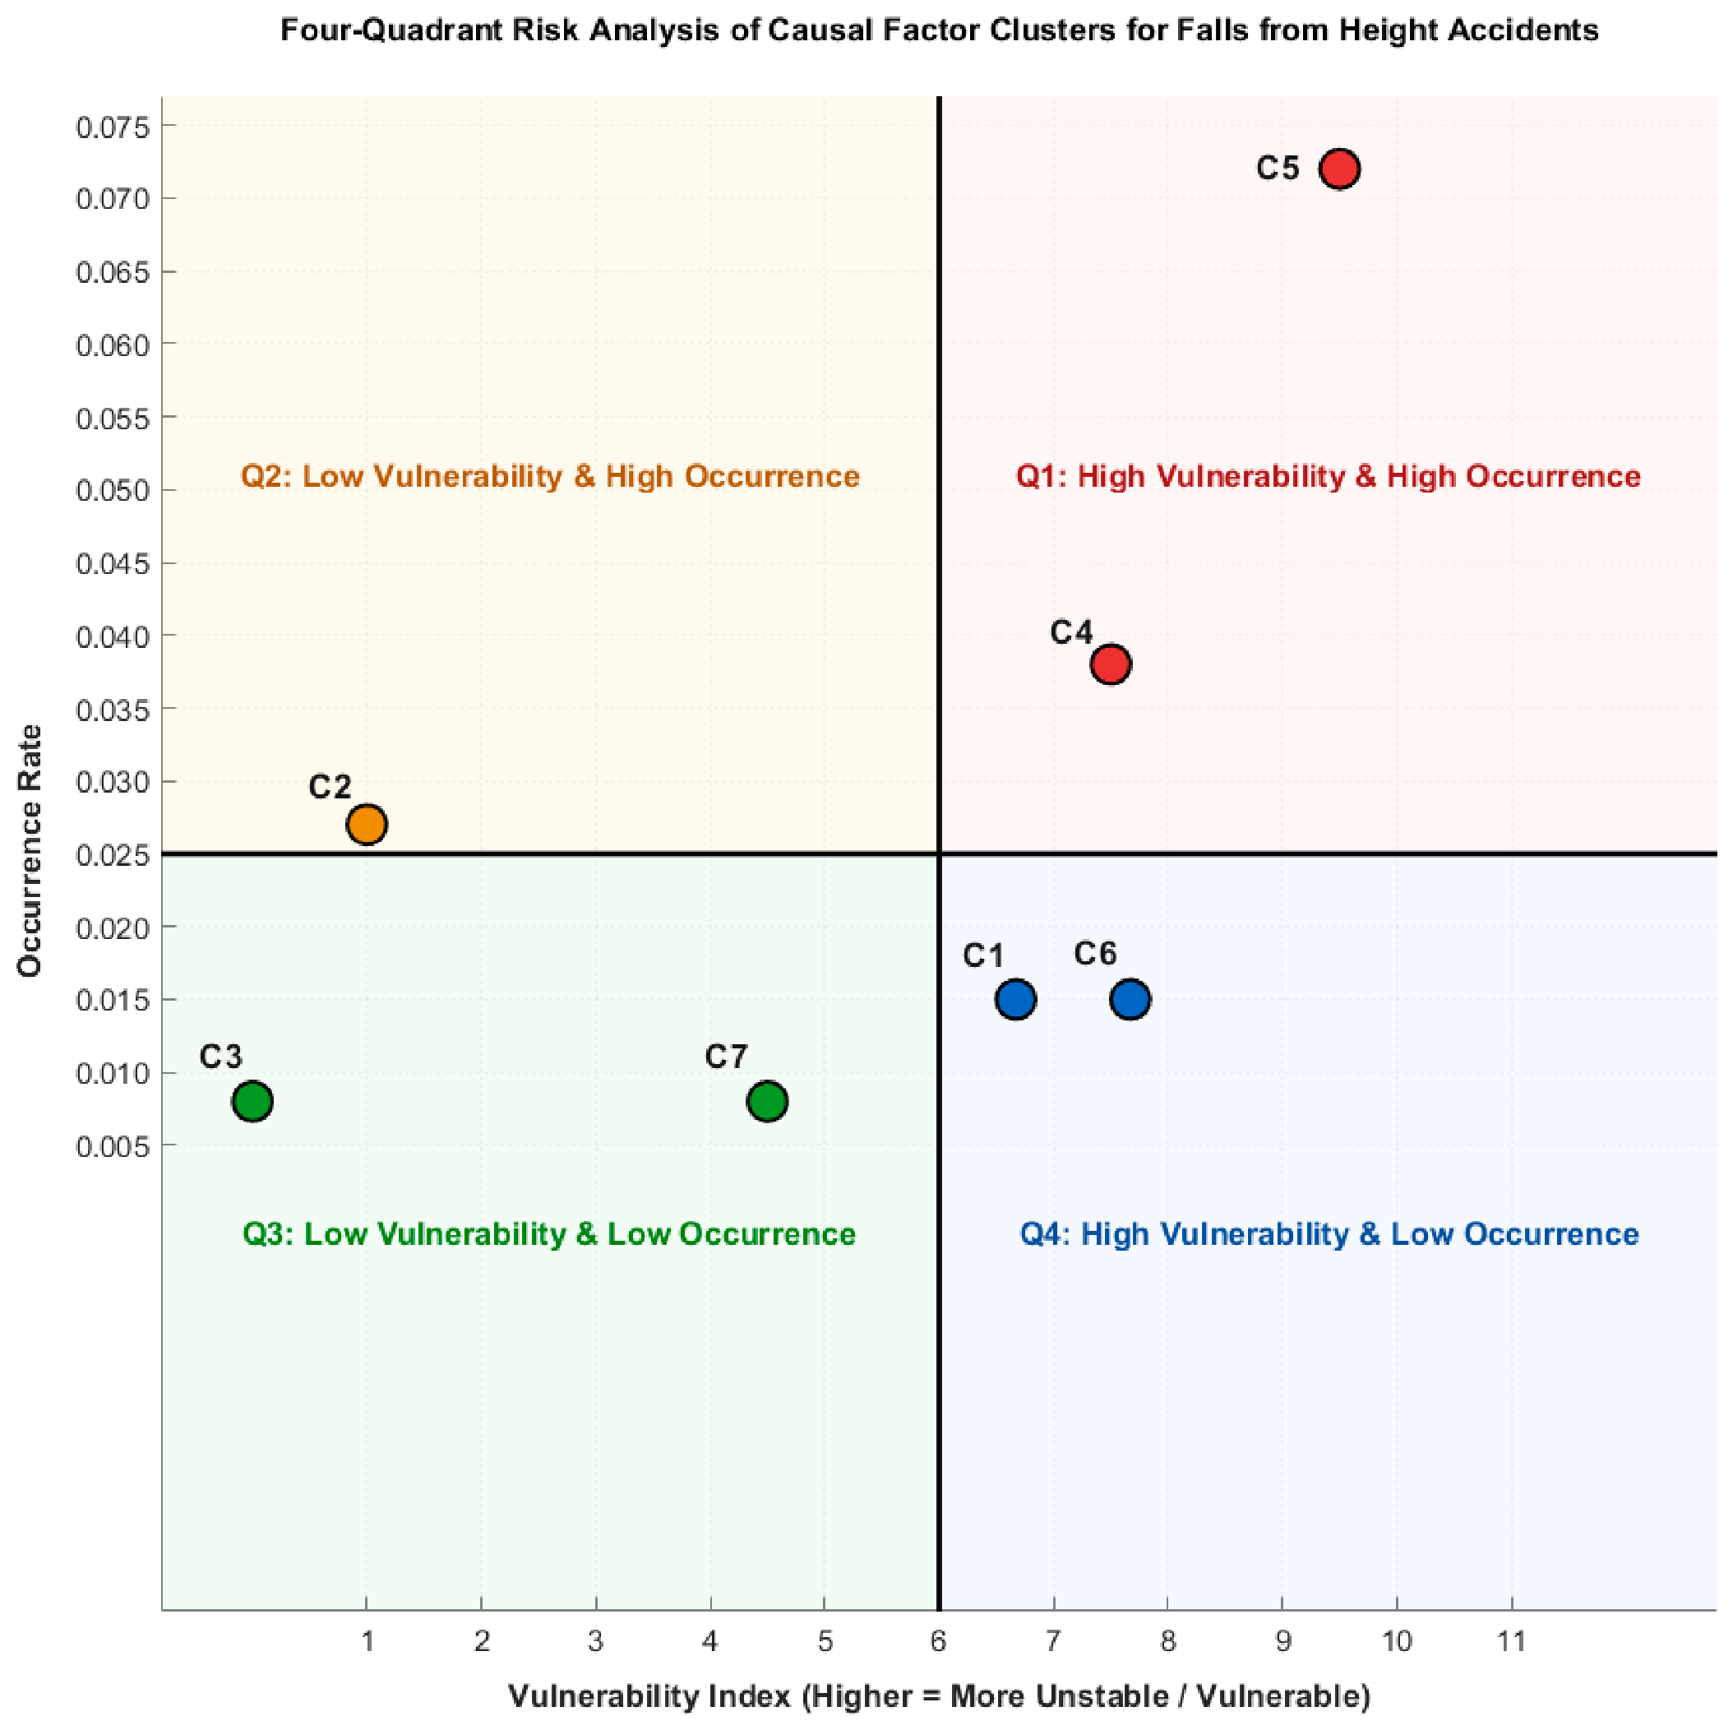

Table 1.
The data set of FFH causation factors.
| Category | Causal factor description | Code |
|---|---|---|
| People | Low safety awareness Inadequate risk judgment Failure to wear correct personal protective equipment (PPE) Working without license Risky operation Using unsafe equipment Self-health reasons |
P1 P2 P3 P4 P5 P6 P7 |
| Facility | Sign marking defects Inadequate protective devices Inadequate or lack of regular on-time equipment maintenance Tools do not meet the requirements Defective equipment and tool |
F1 F2 F3 F4 F5 |
| Environment | Poor internal working environment Severe weather Poor external working environment |
E1 E2 E3 |
| Management | Company does not have contracting qualification Irregular contracting and insufficient qualification Inadequate safety management structure and personnel allocation Inadequate implementation of safe production responsibility system Safety management system is not in place Inadequate on-site safety supervision and management Failure to verify workers’ qualifications Failure to provide personal protective equipment (PPE) Failure to carry out technical briefing Failure to conduct safety education and training Failure to obtain a construction permit Incomplete or unapproved construction program Failure to sign safety management agreement Supervision staff are not in place Insufficient supervision by government departments Failure of management staff to fulfill safety management responsibilities Unauthorized command |
M1 M2 M3 M4 M5 M6 M7 M8 M9 M10 M11 M12 M13 M14 M15 M16 M17 |
Table 2.
Causal factor clusters.
| Causal factor cluster | Factors | Factor No. |
|---|---|---|
| C1 | Working without license Tools do not meet the requirements Failure of management staff to fulfill safety management responsibilities |
P4 F4 M16 |
| C2 | Using unsafe equipment Tools do not meet the requirements |
P6 F4 |
| C3 | Self-health reasons Severe weather |
P7 E2 |
| C4 | Inadequate risk judgment Irregular contracting and insufficient qualification |
P2 M2 |
| C5 | Failure to wear correct personal protective equipment (PPE) Inadequate on-site safety supervision and management Failure to verify workers’ qualifications Failure to conduct safety education and training |
P3 M6 M7 M10 |
| C6 | Defective equipment and tool Irregular contracting and insufficient qualification Incomplete or unapproved construction program |
F5 M2 M12 |
| C7 | Sign marking defects Irregular contracting and insufficient qualification Failure to obtain a construction permit Failure to sign safety management agreement |
F1 M2 M11 M13 |
Table 3.
Occurrence rates of causal factor clusters ranked in descending order (=526).
| Rank | Causal Factor Cluster | Occurrence frequency () | Occurrence rate () |
|---|---|---|---|
| 1 | C5 | 38 | 0.072 |
| 2 | C4 | 20 | 0.038 |
| 3 | C2 | 14 | 0.027 |
| 4 | C1 | 8 | 0.015 |
| 5 | C6 | 8 | 0.015 |
| 6 | C3 | 4 | 0.008 |
| 7 | C7 | 4 | 0.008 |
Table 4.
Cluster Vulnerability Index (CVI) values for the identified causal factor clusters, ranked in descending order.
Table 4.
Cluster Vulnerability Index (CVI) values for the identified causal factor clusters, ranked in descending order.
| Rank | Causal Factor Cluster | CVI () |
|---|---|---|
| 1 | C5 | 9.5 |
| 2 | C6 | 7.67 |
| 3 | C4 | 7.5 |
| 4 | C1 | 6.67 |
| 5 | C7 | 4.5 |
| 6 | C2 | 1.0 |
| 7 | C3 | 0 |
Disclaimer/Publisher’s Note: The statements, opinions and data contained in all publications are solely those of the individual author(s) and contributor(s) and not of MDPI and/or the editor(s). MDPI and/or the editor(s) disclaim responsibility for any injury to people or property resulting from any ideas, methods, instructions or products referred to in the content. |
© 2026 by the authors. Licensee MDPI, Basel, Switzerland. This article is an open access article distributed under the terms and conditions of the Creative Commons Attribution (CC BY) license (http://creativecommons.org/licenses/by/4.0/).
Copyright: This open access article is published under a Creative Commons CC BY 4.0 license, which permit the free download, distribution, and reuse, provided that the author and preprint are cited in any reuse.