

Submitted:
10 August 2026
Posted:
11 August 2026
You are already at the latest version
Abstract
Red blood cell (RBC) aggregation is an important hemorheological property that influences blood viscosity, microcirculation, and stored-blood quality. However, conventional measurements commonly require repeated flow cessation or flow-rate modulation, limiting continuous monitoring and providing little information on spatial heterogeneity. This study presents a microfluidic platform for spatiotemporal mapping of RBC aggregation during continuous blood flow. Multiple high-resistance side chambers connected to a main channel create low shear rate regions for aggregation while maintaining high shear in the main channel for RBC disaggregation. Flow rates and shear rates are evaluated using a hydraulic circuit model, numerical simulation, and micro-PIV measurements. An aggregation index (AI) map is introduced to quantify spatial and temporal changes in the side chambers. AI remains high and stable at flow rates of 0.5 ~ 1 mL/h. RBC aggregation increases significantly at concentrations of 15 mg/mL or higher. The proposed index shows an approximately 30% stronger response than a conventional aggregation index. Moreover, AI decreases progressively during four weeks of RBC storage. These findings demonstrate continuous and multiple-location detection of RBC aggregation and support the use of this platform for assessing hemorheological alterations and storage-induced RBC deterioration.
Keywords:
spatiotemporal RBC aggregation map
; multiple bifurcation channels
; continuous micro-blood flow
; storage lesion
1. Introduction
Red blood cell (RBC) aggregation is a major determinant of blood viscosity under low-shear conditions, and pathologically enhanced aggregation can increase microvascular flow resistance and compromise tissue perfusion [1,2,3]. Under stasis or extremely low shear rates, RBCs reversibly form rouleaux and larger three-dimensional aggregates. RBC aggregation is governed by the combined effects of plasma macromolecules (fibrinogen, immunoglobulins), intrinsic cellular properties (surface charge, membrane–cytoskeletal organization, deformability, and morphology), and cellular age [1,4,5,6]. RBC aggregation measurements can be markedly affected by hematocrit (Hct), plasma viscosity, shear rate, temperature, and storage duration [7,8,9,10]. Excessive RBC aggregation increases blood viscosity under low-shear conditions and alters RBC partitioning at vascular bifurcations, potentially increasing flow resistance and causing heterogeneous microvascular perfusion and tissue oxygen delivery [1,3,11,12]. Abnormal RBC aggregation has been reported in diabetes [13,14], sepsis [15], obesity, cardiovascular disease [16,17], and sickle cell disease [18], highlighting its association with systemic inflammation and impaired microcirculation [19]. Therefore, RBC aggregation measurement provides a potential biomarker for evaluating systemic inflammation, microcirculatory dysfunction, disease progression, and therapeutic effectiveness [1,20,21,22].
Conventional methods typically apply high shear to disperse existing RBC aggregates and then stop or slow the rotating system to allow reaggregation. Aggregation is subsequently quantified from time-dependent changes in light transmission or backscatter[7,23]. A major limitation of conventional rotational aggregometers is their use of closed-chamber Couette flow, which does not reproduce the pressure-driven transport and spatially varying shear conditions of microvascular blood flow [24,25].
Microfluidic chips have emerged as useful platforms for RBC aggregation analysis because they require small sample volumes and permit precise control of microvascular-like, pressure-driven flow [26,27,28,29,30]. Some systems measured RBC aggregation using laser backscatter after vibration-induced dispersion, while others used pulsatile microchannel flow to determine the critical shear stress for aggregation [31,32]. Direct microscopic imaging and image-processing techniques have been used to quantify RBC aggregate size and spatial distribution under controlled microchannel flow conditions [11,33,34]. Furthermore, speckle-based analysis has sensitively detected increased RBC aggregation in diabetic blood [35], whereas bifurcating microchannels have characterized spatial differences in aggregate size, transport, and partitioning that conventional bulk aggregometers cannot resolve [11]. Microfluidic platforms have enabled the combined measurement of RBC aggregation with blood viscosity, pressure, or erythrocyte sedimentation rate. In parallel, low-cost miniaturized systems have demonstrated the potential for portable RBC aggregation testing [27,30,36,37]. However, many existing devices still apply high shear to break up RBC aggregates and then stop, slow, or periodically change the flow to allow them to form again. More recently, our group proposed a continuous-flow method for measuring RBC aggregation by allowing blood to flow from a high-shear main channel into high-resistance bifurcation channels. The increased flow resistance reduces the flow rate and shear rate within these channels, allowing RBC aggregates to form without interrupting blood flow[38]. However, the previous method measured RBC aggregation only at a single location and could not capture its spatial and temporal heterogeneity. Therefore, simultaneous multi-site measurement of the spatiotemporal aggregation index is required.
In this study, to address the limitations of the previous method, the present method enables simultaneous spatiotemporal mapping of non-uniform RBC aggregation without interrupting blood flow. The proposed microfluidic device consists of a single inlet, a single outlet, a main channel, and three bifurcation channels, each equipped with an enlarged side chamber. Blood is continuously supplied at a constant flow rate using a syringe pump. The high shear rate in the main channel fully disaggregates RBCs, whereas the enlarged side chambers reduce the local shear rate to below 100 s-1, allowing heterogeneous RBC aggregation to occur. Local aggregation indices are calculated by comparing the image intensity of each region in the side chambers with the mean intensity of the non-aggregated RBCs in the main channel.
Compared with conventional methods, the proposed method has several advantages. It measures RBC aggregation continuously without stopping the blood flow or changing the flow rate. It also shows how RBC aggregation differs across the side chambers and changes over time. RBC aggregation can be measured simultaneously in three side chambers, which improves measurement efficiency and reliability. In addition, the image intensity in the main channel, where RBCs are fully disaggregated, is used as a reference to measure local aggregation. The simple single-inlet and single-outlet design requires only a syringe pump operating at a constant flow rate.
2. Materials and Methods
2.1. Experimental Setup for Spatiotemporal Mapping of RBC Aggregation
As shown in Figure 1A, the experimental setup consisted of a microfluidic chip, a syringe pump, and an image acquisition system. The microfluidic channel was composed of a single inlet, a single outlet, a main channel (MC, width = 1 mm, length = 14.48 mm), and three bifurcation channels (BCs), each containing an enlarged side chamber (SC1, SC2, or SC3). Each bifurcation channel consisted of three segments connected in series: a front narrow channel (width = 0.1 mm, length = 5.23 mm), a side chamber (width = 1 mm, length = 3 mm), and a rear narrow channel (width = 0.1 mm). The rear-channel lengths were 8.915, 8.865, and 7.61 mm for BC1, BC2, and BC3, respectively. The spacing between adjacent bifurcation channels was fixed at 1.6 mm. All channels had a uniform depth of 0.05 mm.
A silicon master mold was fabricated from a four-inch silicon wafer. The microchannel pattern was defined using conventional photolithography. The patterned wafer was then etched by deep reactive ion etching (DRIE) to form the mold features [39,40,41]. For PDMS replica molding, the Sylgard 184 base and curing agent (Dow Corning, Midland, MI, USA) were mixed at a mass ratio of 10:1. The uncured mixture was degassed under vacuum for 1 h and then cured at 65 °C for 2 h. After curing, the PDMS replica was carefully removed from the silicon master and cut to the desired dimensions. An inlet port was formed with a punch with an outer diameter of 2 mm, while a larger-sized outlet port was punched to encompass the downstream ends of the main and bifurcation channels. The PDMS layer and glass substrate were activated by oxygen plasma using a plasma treatment system (CUTE-MPR, Femto Science Co., Ltd., Hwaseong, Republic of Korea) and then brought into contact to form an irreversible bond. To strengthen the PDMS–glass bond, the assembled microfluidic chip was heated at 120 °C for 10 min.
One end of a polyethylene tube (inner diameter = 0.25 mm; length = 300 mm) was connected to a syringe needle attached to a 1 mL disposable syringe, while the other end of the tubing was inserted into the inlet port of the microfluidic device.
To reduce nonspecific protein adsorption, the microchannels were treated with a 0.2% bovine serum albumin (BSA) solution for 10 min. Before introducing the blood sample, the channels were rinsed with 1× phosphate-buffered saline (PBS) to remove the remaining BSA solution. Test blood (0.2 ~ 0.3 mL) was loaded into a disposable syringe, which was mounted on a syringe pump (neMESYS, CETONI GmbH, Korbussen, Germany). The test blood was infused at a constant flow rate of Qsp.
The microfluidic chip was placed on an inverted microscope (IX81, Olympus, Tokyo, Japan) fitted with a 4× objective lens (NA = 0.1). Blood-flow images were recorded at 5000 frames per second (fps) using a high-speed camera (FASTCAM MINI, Photron, Tokyo, Japan). Image recording was initiated at 0.5 s intervals by a function generator. All experiments were conducted at room temperature (25 °C).
2.2. Quantification of Blood Imaging Intensity in the Side Chambers
As shown in Figure 1B, the initial image of each side chamber, I (x, y, t = 0), was used as the background reference. Each subsequent image, I (x, y, t) for t > 0, was subtracted from the corresponding reference image to obtain a difference image: J (x, y, t) = I (x, y, t = 0) - I (x, y, t > 0). The difference images were analyzed using MATLAB R2025b (MathWorks, Natick, MA, USA). A fixed local region of interest (ROI, 0.02 × 0.02 mm2) within each side chamber was defined to calculate the mean image intensity. The three lower panels showed image intensity distributions measured in the three side chambers (sc1, sc2, and sc3). The test blood was prepared by suspending normal RBCs into a dextran solution (30 mg/mL).
2.3. Spatiotemporal Mapping of RBC Aggregation Index
In this study, spatiotemporal maps of the RBC aggregation index were generated by comparing the image intensity of fully disaggregated RBCs in the main channel with that of aggregated RBCs in each side chamber. Herein, to demonstrate the operating principle of the proposed method, control and test blood samples (Hct = 50%) were prepared by suspending normal RBCs into 1× PBS and dextran solution (40 mg/mL), respectively. Each blood was infused into a microfluidic channel at a constant flow rate of Qsp = 1 mL/h.
As shown in C-i, blood flow images illustrated differences in RBC aggregation between control blood and test blood. For the control blood (left-side panel), the image intensity remained relatively uniform throughout all microfluidic channels, indicating negligible RBC aggregation. Several arrows (‘→’) indicated the direction of blood flow. In contrast, for the test blood (right-side panel), RBC aggregation occurred in each side chamber, resulting in a substantial decrease in image intensity. However, no noticeable RBC aggregation was observed in the main channel.
To construct a spatiotemporal RBC aggregation map, AI = AI (x, y, t), a region of interest (ROI, 2 mm2) was selected in the main channel as the reference region. The mean image intensity within this ROI was calculated as Jmc (t) and used as the reference intensity, representing RBCs under high-shear, disaggregated conditions. The local image intensity at each position in the side chambers was denoted by Jsc (x, y, t). Because RBC aggregation in the side chambers reduced the local image intensity relative to the main-channel reference, the normalized intensity difference was used to quantify RBC aggregation. Accordingly, the spatiotemporal aggregation index was defined as
A larger AI (x, y, t) value therefore indicates a greater degree of local RBC aggregation. As shown in Figure 1C-ii, the AI exhibited a nonuniform spatial distribution within each side chamber at a given time and gradually increased along the direction of blood flow.
Next, a representative value was defined to characterize the spatially distributed AI within each side chamber. As shown in Figure 1C-iii, the left panel presented the bright-field image and its corresponding AI map. The spatially averaged AI, ⟨AI⟩, was calculated within a specific ROI (0.21 mm²) positioned along the flow direction. The right panel showed ⟨AI⟩ as a function of downstream distance (δ). The ⟨AI⟩ value gradually increased with respect to δ and reached its maximum at δ = 1.68 mm. This maximum value was therefore selected as the representative aggregation index for each side chamber and denoted as AIm. As shown in Figure 1C-iv, the time-dependent AIm was determined for each side chamber (sc1, sc2, and sc3). Measurements were repeated five times using the test blood (Sn = 5), and each data point represented the mean of the five independent experiments. Because the proposed method enables RBC aggregation to be measured without interrupting blood flow, AIm could be continuously monitored as a function of time.
2.4. Blood Sample Preparation
Concentrated RBCs were purchased from the Gwangju–Chonnam Blood Bank (Gwangju, Republic of Korea) and stored under refrigerated conditions until use. Following a previously established washing protocol [42], normal RBCs were isolated through repeated removal of the supernatant and buffy coat. Test blood was then prepared by suspending normal RBCs into a specific medium (1× PBS, dextran solution).
First, test blood with enhanced RBC aggregation was prepared by suspending normal RBCs into dextran solutions (Cdex = 5 ~ 40 mg/mL). The dextran solutions were prepared by dissolving dextran powder derived from Leuconostoc spp. (molecular weight: 450–650 kDa, Sigma-Aldrich, St. Louis, MO, USA) into 1× PBS. The hematocrit of each test blood was adjusted to 50%.
Second, to investigate the effect of storage duration on RBC aggregation, concentrated RBCs obtained from the blood bank were stored under refrigerated conditions for 0, 1, 2, 3, and 4 weeks. At each storage interval, test blood was prepared by resuspending the stored RBCs into dextran solutions with Cdex ranging from 15 to 40 mg/mL. The hematocrit of all samples was adjusted to 50%.
2.5. Statistical Analysis
Statistical analyses were performed using Minitab 22.4 (Minitab LLC, State College, PA, USA) and Microsoft Excel 365 (Microsoft Corporation, Redmond, WA, USA). Assuming normally distributed data, the results are reported as the mean () ± standard deviation (σ), with n indicating the number of data points. Two-sided 95% confidence intervals were estimated as . Differences among multiple groups were evaluated by one-way ANOVA. Statistical significance was accepted at p < 0.05. Linear regression was performed in Microsoft Excel, and the coefficient of determination (R2) and p were used to evaluate the goodness of fit and statistical significance, respectively.
3. Results and Discussion
3.1. Estimation of Flow Rates and Shear Rates in the Main Channel and Side Chambers
Previous studies have demonstrated that RBC aggregation is promoted under low-shear conditions and progressively decreases as the shear rate increases [1,43,44,45]. Accordingly, shear rates below approximately 100 s−1 were considered suitable for inducing RBC aggregation in the present microfluidic device [25,38,46,47]. Because the test blood was supplied at a constant flow rate, Qsp, the supplied flow rate strongly affected the shear-rate distributions throughout the microfluidic channels. Therefore, the shear-rate distributions were quantitatively evaluated using three complementary approaches: a discrete fluidic-circuit model, a full-scale finite-element simulation (i.e., computational fluid dynamics [CFD]), and experimental micro-particle image velocimetry (micro-PIV). For convenience, a 30% glycerin solution as Newtonian fluid was selected as test fluid. Based on values reported in a previous study[48], its dynamic viscosity and density were assumed to be μ = 2.5 cP and ρ = 1080 kg/m3, respectively.
First, as shown in Figure 2A, a discrete fluidic-circuit model was constructed to estimate the flow rates and shear rates throughout the proposed microfluidic system at a prescribed syringe-pump flow rate, Qsp. The left-side panel illustrated the experimental setup, consisting of a syringe pump, a connecting tubing, and a microfluidic chip. The main channel was divided by three bifurcation points into four segments, denoted as mc1, mc2, mc3, and mc4. The three bifurcation channels and corresponding side chambers were designated as bc1 ~ bc3 and sc1 ~ sc3, respectively. The pressures at junctions a, b, and c were denoted as Pa, Pb, and Pc, respectively. The syringe pump delivered the test blood at a constant flow rate, Qsp, through tubing connecting the syringe needle to the inlet of the microfluidic chip. The right panel illustrated the equivalent fluidic-circuit model of the proposed microfluidic system. The model comprised a constant flow-rate source, Qsp, and the hydraulic resistances of the tubing (Rt), main-channel segments (Rmc1 ~ Rmc4), and bifurcation channels (Rbc1 ~ Rbc3). The ground symbol (▼) represented the reference pressure, corresponding to zero value of gauge pressure. The flow rates through the main-channel segments and side chambers were denoted by Qmc1 ~ Qmc4 and Qsc1 ~ Qsc3, respectively. By applying the conservation of mass to the steady flow at junctions (a, b, and c), where the total inflow equals the total outflow at each junction, the following three equations were obtained:
Simultaneous solution of the three governing equations yielded the junction pressures (Pa, Pb, and Pc). The resulting analytical expressions were given by
The dimensionless coefficients α and β appearing in Eqns. (5) ~ (7) were defined as
Using the analytically determined junction pressures, the flow rates through the main-channel segments (Qmc1 ~ Qmc4) and side chambers (Qsc1 ~ Qsc3) were calculated using Hagen-Poiseuille equation (i.e., pressure drop = fluidic resistance × flow rate)[49]. As shown in Figure 2B, flow rates and shear rates in the microfluidic channels were calculated as a function of infused flow rate (Qsp). Based on fluid property and channel
dimensions, the hydraulic resistances of the four main channel segments were calculated as Rmc1 = 0.54, Rmc2 = 0.15, Rmc3 = 0.15, and Rmc4 = 0.54 TPa×s/m3. Similarly, the hydraulic resistances of the three bifurcation channels were determined to be Rbc1 = 13.87, Rbc2 = 13.82, and Rbc3 = 12.61 TPa×s/m3. As shown in Figure 2B-i, the flow rates through the four main channel segments (Qmc1 ~ Qmc4) were determined as functions of the imposed flow rate, Qsp, which ranged from 1 to 10 mL/h. Similarly, Figure 2B-ii presented the flow rates through the three side chambers (Qsc1 ~ Qsc3) as functions of Qsp. As expected, the flow rate in each upstream channel was higher than that in the corresponding downstream channel. Furthermore, the flow rate in the main channel was approximately 20 times higher than that in each side chamber. Figure 2B-iii showed the shear rates, , in the main channel and side chambers as functions of Qsp. At each Qsp, the mean shear rate in the main channel was calculated from the values obtained for its four segments (mc1 ~ mc4), whereas that in the side chambers was calculated from the values for sc1 ~ sc3. Accordingly, each data point was presented as the mean ± standard deviation, where the standard deviation reflected the variations among the respective channel sections. The results confirmed that RBC aggregation was effectively suppressed in the main channel at Qsp > 1 mL/h, where the shear rate remained above 100 s−1. However, the shear rate in the side chambers remained below 100 s−1 when Qsp < 3 mL/h. The light-green shaded region indicated the flow-rate range considered suitable for inducing RBC aggregation in the side chambers.
Second, a commercial computational fluid dynamics software (COMSOL Multiphysics, version 6.2, Burlington, MA, USA) was used to estimate the flow rates and shear rates in the microfluidic channels. The left panel showed the meshes generated for the microfluidic channels. A full-scale three-dimensional model of the channels was constructed using the three-dimensional laminar flow interface and discretized into 256,580 hexahedral elements. A constant flow rate was prescribed at the inlet, while zero-pressure conditions (P = 0) were imposed at the four outlets. The steady-state flow was solved using a fully coupled nonlinear solver. At each nonlinear step, the resulting linear system was solved with GMRES and a smoothed-aggregation algebraic multigrid preconditioner. PARDISO was used at the coarsest level. A nonlinear tolerance of 10-3 and automatic damping were used to improve convergence. The model had approximately 1.2×10⁶ degrees of freedom, converged in four nonlinear iterations, and required about 131 s of computation time. As shown in the middle panel, at Qsp =1 mL/h, the flow velocity at the channel midplane was substantially lower in the side chambers than in the main channel. The flow rate in each channel was estimated by multiplying its mean velocity by its cross-sectional area (Q = <V> × A, <V>: average velocity, and A = 0.05 mm2). The right panel showed the wall shear-rate distributions at the bottom surface of the microfluidic channels at Qsp = 1 mL/h. The shear rate was substantially lower in the side chambers than in the main channel. As shown in Figure 3B, the shear-rate distribution in the side chambers was examined over Qsp = 1 ~ 3 mL/h. Herein, the flow rates through the four main channel segments and three side chambers were denoted by Qmc1 ~ Qmc4 and Qsc1 ~ Qsc3, respectively. Throughout this flow rate range, the shear rate in the wide region of each side chamber remained below 100 s−1, whereas it exceeded 100 s−1 in the narrow channels located before and after the chamber. These results indicated that RBC aggregation could be expected to occur primarily in the wide regions of the side chambers when Qsp ≤ 3 mL/h. As shown in Figure 3C, the flow and shear rates in the main channel and side chambers were evaluated as functions of the supplied flow rate (Qsp). The left and middle panels show the flow rates in the main-channel segments (Qmc1 ~ Qmc4 ) and side chambers (Qsc1 ~ Qsc3), respectively. The flow rate was higher in the upstream main channel segments than in the downstream segments. Overall, the flow rates in the main channel were approximately 31.5 times those in the side chambers. The right panel shows the shear rates in the main channel and side chambers as functions of the supplied flow rate (Qsp). At Qsp = 1 mL/h, the shear rate in the main channel exceeded 100 s−1, which was sufficient to fully disaggregate the RBCs. In contrast, the shear rate in the side chambers remained below 100 s−1 when Qsp < 4 mL/h, allowing RBC aggregation to occur. The light-green region indicates the suitable range of Qsp for inducing RBC aggregation in the side chambers.
Third, the predictions from the discrete circuit model and CFD simulation were experimentally validated using the micro-PIV technique[50,51,52,53]. Herein, a 30% glycerol solution containing 3% RBCs as flow tracers was infused at a constant flow rate, Qsp. As shown in Figure 4A, micro-PIV technique was used to determine the flow rates in the main channel and side chambers as functions of Qsp. Specific ROIs were selected in four main channel segments (mc1 ~ mc4) and three side chambers (sc1 ~ sc3). Time-resolved micro-PIV analysis [53] was then performed to obtain the velocity fields within each ROI using 77×77 μm2 interrogation windows with 50% overlap. The mean velocity measured within each ROI was denoted as Vmc1 ~ Vmc4 for the main-channel segments and Vsc1 ~ Vsc3 for the side chambers. The right panel showed the time-dependent velocities in the main channel segments (Vmc1 ~ Vmc4) and side chambers (Vsc1 ~ Vsc3) at Qsp = 1 mL/h. The upstream segments exhibited higher velocities than the downstream segments.
Figure 4B showed the flow rate through the first main channel segment (Qmc1) as a function of the imposed flow rate (Qsp). The uncorrected flow rate was calculated from the mean velocity as Qm1 = Vmc1 × A, where A was the cross-sectional area of the main channel. As shown in the inset, Qm1 was approximately 10% higher than the imposed flow rate at Qsp = 1 mL/h. Because Qsp was prescribed, the measured flow rate was corrected using Qmc1 = Qsp/<Qm1> ×Qm1, where ⟨Qm1⟩ denoted the time-averaged uncorrected flow rate. After correction, the steady-state value of Qmc1 agreed with Qsp. The same correction factor (Qsp/⟨Qm1⟩) was applied to the flow rates measured in the remaining main channel segments and side chambers: Qmci = Qsp/<Qm1> ×Qmi and Qscj = Qsp/<Qm1>×Qsj, where i = 1 ~ 4 and j = 1 ~ 3. Qsj denoted the uncorrected flow rate in side chamber. From the results, the corrected Qmc1 increased linearly with respect to Qsp, following Qmc1 = 1.0123 Qsp (R2 = 0.9999). As shown in C, the flow rates in the main-channel segments and side chambers were evaluated as functions of the imposed flow rate, Qsp. The left panel presented Qmc1, Qmc2, Qmc3, and Qmc4, whereas the middle panel showed Qsc1, Qsc2, and Qsc3. The flow rate in every channel segment increased linearly with Qsp. Overall, the flow rates in the main channel segments were approximately 27-fold higher than those in the side chambers. The right panel showed the shear rates in the main-channel segments and side chambers as functions of the imposed flow rate (Qsp). At Qsp = 1 mL/h, the shear rates in the main channel exceeded 100 s−1. In contrast, the shear rates in the side chambers remained below 100 s−1 for Qsp < 3 mL/h. The purple dashed line indicates the upper shear-rate threshold for RBC aggregation.
Finally, the shear rates estimated using three independent methods, including fluidic-circuit analysis, computational fluid dynamics (CFD), and micro-PIV measurements, were compared over the investigated range of imposed flow rates (Qsp). As shown in Figure 5A, the shear rates in the main channel obtained using the three methods closely agreed and exhibited nearly identical linear increases with respect to Qsp.
The left panel of Figure 5B compares the shear rates in the side chambers. Although all three methods showed similar flow-rate dependent trends, the CFD predictions were consistently lower than the values obtained from the fluidic circuit analysis and micro-PIV measurements. The correlations between the methods are presented in the right panel of Figure 5B. Linear regression demonstrated excellent agreement between the fluidic-circuit predictions and micro-PIV measurements (Y = 1.0607 X, R2 = 0.9977, and p < 0.001). In contrast, CFD results systematically underestimated the shear rate by approximately 30% relative to micro-PIV measurements, despite maintaining a strong linear correlation (Y = 0.7001 X, R2 = 0.9977, and p < 0.001). These results validated the fluidic circuit analysis as a simple and reliable tool for estimating shear rates throughout the microfluidic network and selecting an appropriate Qsp to establish the shear conditions required for RBC aggregation.
3.2. Impact of Supplied Flow Rate on Spatiotemporal AI Map
Because RBC aggregation is strongly affected by shear rate, the effect of flow rate on the RBC aggregation index (AI) was quantitatively evaluated. To promote RBC aggregation, the test blood (Hct = 50%) was prepared by suspending normal RBCs into a dextran solution (30 mg/mL). Based on the shear rate estimates shown in Figure 5, the test blood was infused at flow rates ranging from 0.5 to 5 mL/h.
As shown in Figure 6A-i, microscopic images were captured at Qsp = 0.5, 1, 3, and 5 mL/h. The image intensity decreased markedly as infused flow rate increased from 0.5 mL/h to 5 mL/h. Using the definition of AI, as shown in Figure 6A-ii, spatial maps of AI were generated at different Qsp values. At low flow rates of Qsp = 0.5 and 1 mL/h, the test blood exhibited higher AI values. Moreover, the AI gradually increased along the flow direction up to the entrance of the downstream bifurcation channel. Figure 6A-iii presented the velocity distributions within a side chamber in the transverse (x) and streamwise (y) directions. The left panel showed the velocity profile across the channel width, measured using an ROI of 0.8 mm2. The right panel showed the velocity variation along the flow direction using an ROI of 0.1 mm2. The results indicated that the velocity remained nearly uniform throughout the side chamber. As shown in Figure 6A-iv, a representative aggregation index (AIm) was determined from the spatial AI distribution along the flow direction. The left panel presents the variation in the spatially averaged aggregation index: ⟨AI⟩ with the downstream position (δ) at Qsp = 0.5 mL/h. The analysis was performed using a fixed ROI of 0.21 mm2. The <AI> value reached its maximum at δ = 1.68 mm. As shown in the right panel, the <AI> reached its maximum value at approximately 0.5 mm downstream of the bifurcation entrance. The value of <AI> at δ = 1.68 mm was then defined as AIm.
The time-dependent AIm was evaluated at different imposed flow rates (Qsp). Figure 6B-i showed the temporal variations in AIm for the three side chambers at Qsp = 0.5, 3, and 5 mL/h. In each side chamber, AIm remained nearly constant over time and exhibited its highest value at the lowest flow rate. To quantify the effect of Qsp, AIm was averaged over time and denoted as <AIm>. Figure 6B-ii presented ⟨AIm⟩ for each side chamber (sc1, sc2, and sc3) at Qsp = 0.5, 1, 3, and 5 mL/h. The <AIm> values remained nearly unchanged between 0.5 and 1 mL/h but decreased markedly when Qsp exceeded 1 mL/h. Figure 6B-iii showed the relationship between <AIm> and shear rate, based on 6 ~ 9 repeated measurements (Sn = 6 ~ 9). The results demonstrated that <AIm> decreased substantially with increasing shear rate.
From the experimental investigation, the spatiotemporal AI maps showed high and stable RBC aggregation at low flow rates (Qsp = 0.5 ~ 1 mL/h). Above 1 mL/h, AI decreased markedly because of the increased shear rate. Based on these experiments, for consistent measurement of spatiotemporal AI maps, an infusion flow rate was set to Qsp = 1 mL/h for stable, spatially resolved RBC aggregation measurements.
3.3. Contribution of Blood Medium to Spatiotempral AI Map
Dextran is widely used as a model macromolecular suspending medium to induce RBC aggregation in vitro [54,55,56,57,58]. Because RBC aggregation depends on both the concentration and molecular weight of dextran, samples with different aggregation levels can be prepared by varying the dextran concentration [59]. Based on previous microfluidic studies [30,42,60,61], test blood (Hct = 50%) was prepared by suspending normal RBCs in dextran solutions (Cdex = 5 ~ 40 mg/mL). The test blood was infused at Qsp = 1 mL/h, which provided sufficiently low shear rates to induce RBC aggregation in the side chambers.
The effect of dextran concentration (Cdex) on AIm was quantitatively evaluated. Figure 7A-i showed the spatial AI distributions in the side chambers at Cdex = 5, 20, and 40 mg/mL. At Cdex = 5 mg/mL, AI remained close to zero, indicating negligible RBC aggregation. At Cdex = 20 and 40 mg/mL, AI increased markedly and gradually rose along the flow direction. The AIm value was extracted from each spatial AI map at every measurement time. Figure 7A-ii presented the temporal variations in AIm for the three side chambers (sc1, sc2, and sc3) at Cdex = 20 and 40 mg/mL. Higher concentrations of dextran solution produced substantially greater AIm values, which remained stable over time. The time-averaged value, denoted as <AIm>, was then calculated for each concentration of dextran solution. Figure 7A-iii showed <AIm> at Cdex = 5, 10, 20, 30, and 40 mg/mL. Herein, 8 ~ 15 repetitive measurements for each concentration were carried out (Sn = 8 ~ 15). The <AIm> values remained close to zero at 5 ~ 10 mg/mL. However, they increased significantly at Cdex ≥ 15 mg/mL (p < 0.001). The increase in <AIm> above Cdex = 15 mg/mL agreed with previous findings showing that dextran-induced RBC aggregation or sedimentation becomes pronounced at intermediate dextran concentrations [54,59,62,63].
The previously reported method[38] was used as a reference for comparison with the spatiotemporal AI method proposed in this study. Although the previous method enabled RBC aggregation to be measured under continuous blood flow, it quantified aggregation using the mean image intensity over the entire side chamber rather than its spatial distribution. The mean intensity in the main channel was used as the reference value. Accordingly, the conventional aggregation index (AIp) was calculated as AIp = (Imc - Isc)/Imc, where Imc and Isc represented the mean image intensities of the main channel and side chamber, respectively.
As shown in Figure 7B-i, the temporal variations in AIp were measured in each side chamber at Cdex = 20 and 40 mg/mL. The AIp values showed trends similar to those of AIm. The time-averaged AIp, denoted as <AIp>, was then calculated for each dextran concentration. Figure 7B-ii showed that <AIp> increased markedly at Cdex ≥ 15 mg/mL. To compare the two indices, <AIm> was plotted against <AIp> at the corresponding dextran concentrations. Linear regression yielded <AIm> = 1.2957<AIp> with R2 = 0.98 and p < 0.05. Thus, the two indices were strongly correlated, while <AIm> was approximately 30% higher than <AIp>, indicating a stronger response to dextran-induced RBC aggregation. The strong linear correlation between <AIm> and <AIp> confirmed that both indices reliably represented dextran-induced RBC aggregation. This finding was consistent with previous studies using microscopic image intensity to quantify RBC aggregation in microfluidic channels [27,64]. However, <AIm> showed an approximately 30% greater response because it was measured in a specific region where aggregation was most pronounced, whereas <AIp> was calculated by averaging the intensity over the entire side chamber. Whole-chamber averaging may weaken localized intensity changes caused by RBC aggregation. Therefore, the proposed spatiotemporal method provides improved measurement sensitivity while revealing spatial variations in RBC aggregation that cannot be identified using a single chamber-averaged index.
From the experimental results, RBC aggregation was negligible at Cdex = 5 ~ 10 mg/mL but increased markedly above 15 mg/mL. The proposed AIm showed a 30% stronger response than the conventional AIp, allowing more sensitive detection of aggregation.
3.4. Impact of Storage Duration on Spatiotemporal AI Map
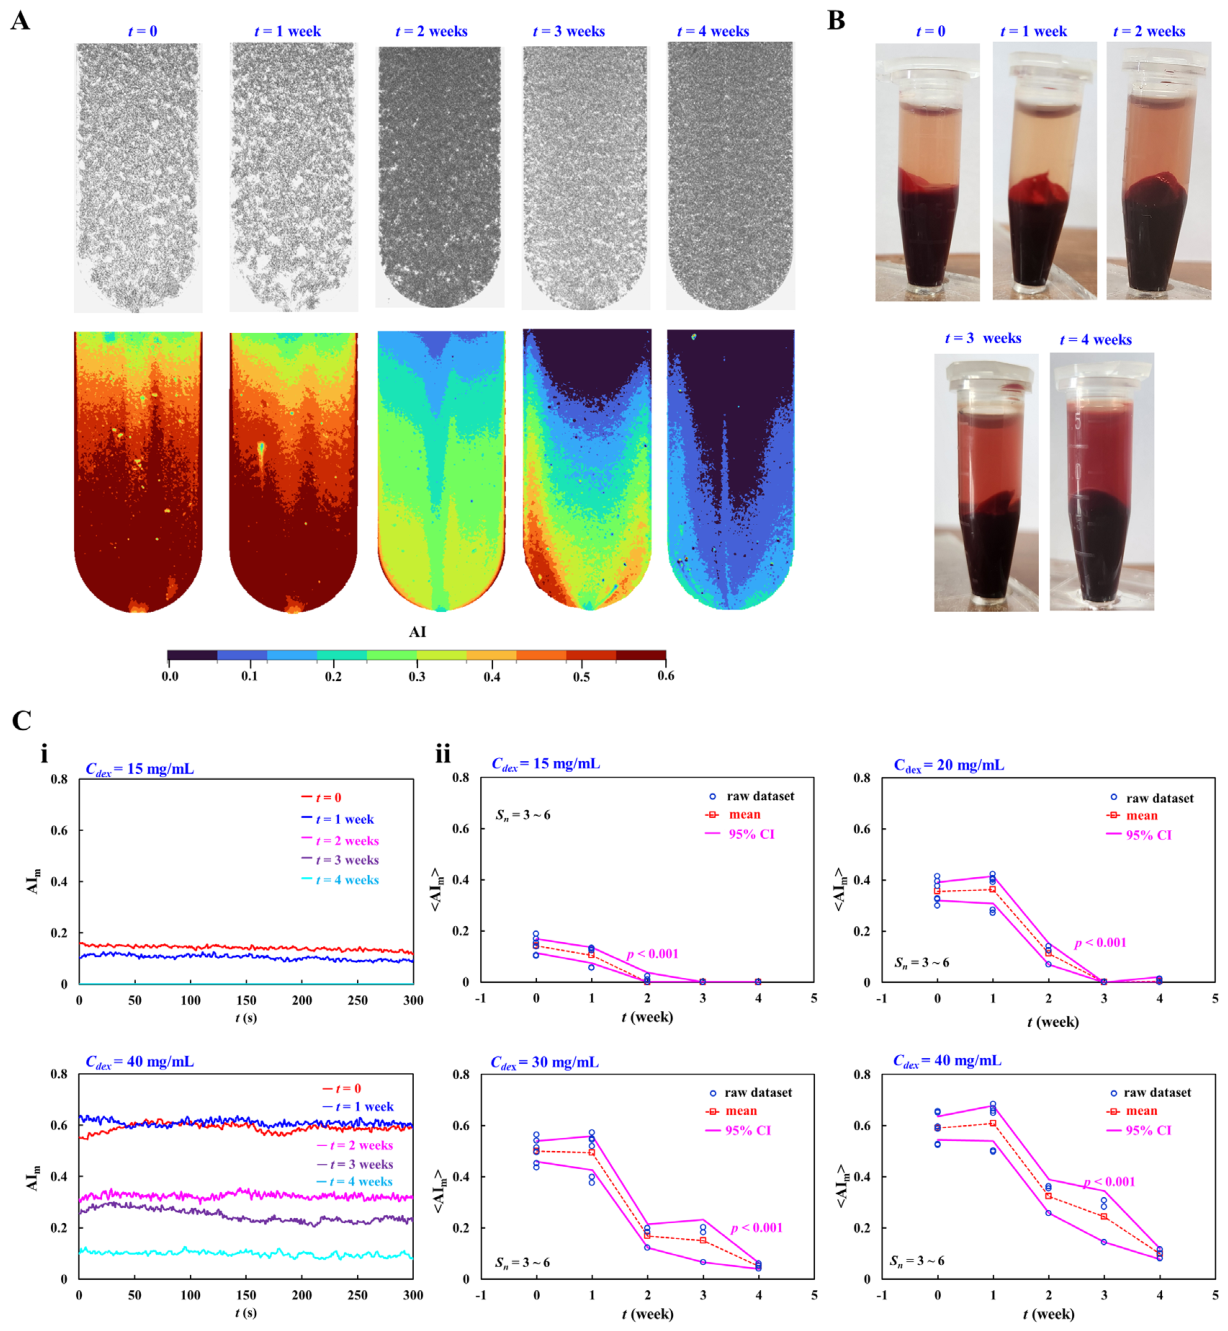
As a final demonstration, the proposed method was used to evaluate the effect of RBC storage duration on spatiotemporal AI maps. Previous studies have reported storage-dependent changes in RBC aggregability, including reduced aggregation under certain storage and measurement conditions [65,66,67,68,69,70]. To examine whether the proposed method could detect these changes, test blood (Hct = 50%) was prepared by suspending stored RBCs in dextran solutions with Cdex = 15 ~ 40 mg/mL.
As shown in Figure 8A, microscopic images and spatial AI distributions were obtained at different storage times. Test blood (Hct = 50%) was prepared by suspending normal RBCs in a dextran solution (40 mg/mL). The upper panel presents representative microscopic images acquired after 0, 1, 2, 3, and 4 weeks of storage, while the lower panel shows the corresponding spatial AI distributions. The AI decreased markedly with increasing storage time, indicating a progressive reduction in RBC aggregation. To assess potential RBC damage, the color of the suspending medium was examined after centrifugation. As shown in Figure 8B, no noticeable color change was observed during the first week. However, after two weeks of storage, the suspending medium became progressively redder, consistent with storage-induced hemolysis and the accumulation of extracellular hemoglobin released from damaged RBCs [71,72,73].
As shown in Figure 8C-i, the temporal variations in AIm were measured over 0 ~ 4 weeks of storage at Cdex = 15 and 40 mg/mL. At Cdex = 15 mg/mL, the AIm showed little change during the first week. However, at Cdex = 40 mg/mL, the effect of storage time was more clearly observed. The time-averaged value, denoted as <AIm>, was then calculated for each storage time. Figure 8C-ii presented the variation in <AIm> over 0 ~ 4 weeks at dextran concentrations ranging from 15 to 40 mg/mL. Repeated measurements were performed at each storage time (Sn = 3 ~ 6). The <AIm> values were substantially higher at higher dextran concentrations but decreased markedly with increasing storage time (p < 0.001). The marked decrease in <AIm> with storage time indicated a progressive loss of RBC aggregability, consistent with previous studies using conventional and microfluidic aggregation measurements [65,66,67,69]. Because the dextran concentration was fixed within each experimental series, this decrease was mainly associated with storage-induced cellular changes rather than changes in the suspending medium. Prolonged storage caused ATP depletion, membrane damage, hemolysis, and morphological transformation of RBCs from discocytes into echinocytes or spherocytes, which could reduce their ability to form stable rouleaux [74]. The higher <AIm> observed at Cdex = 40 mg/mL provided a wider measurement range, allowing storage-dependent changes to be detected more clearly than at Cdex = 15 mg/mL.
From the demonstration results, RBC aggregation decreased markedly with increasing storage duration, indicating a progressive loss of RBC aggregability. The proposed method successfully detected these storage-induced changes, particularly at the higher dextran concentration. As a limitation of the present study, RBC aggregation was evaluated using dextran-based model blood under controlled conditions. The experiments were performed using a limited number of samples and a fixed channel geometry. In future studies, the results obtained by the present method will be validated using whole blood and clinical samples. In addition, more samples will be required to confirm reproducibility and applicability.
4. Conclusions
This study proposed a microfluidic method for the spatiotemporal measurement of RBC aggregation under continuous blood flow. Multiple high-resistance side chambers produced low shear-rate conditions for RBC aggregation, while the main channel maintained a sufficiently high shear-rate to disperse RBCs. Analytical calculations, numerical simulations, and micro-PIV measurements confirmed the flow rates and shear rates in the microfluidic channels. The spatiotemporal AI maps showed that RBC aggregation remained high and stable at Qsp = 0.5 ~ 1 mL/h. However, it decreased markedly at higher flow rates. The proposed method was further demonstrated using different dextran concentrations and RBC storage durations. RBC aggregation increased markedly at Cdex ≥ 15 mg/mL, and the proposed AIm showed an approximately 30% greater response than the conventional AIp. In addition, AIm decreased progressively over four weeks of storage, indicating a storage-dependent loss of RBC aggregability. These findings demonstrated that the proposed method could sensitively visualize and quantify the spatial and temporal variations in RBC aggregation without interrupting blood flow. Therefore, this method could provide a useful platform for continuous monitoring of RBC aggregation and storage-related changes in blood quality.
Author Contributions
Conceptualization, Y.J.K.; Data curation, M.K. and Y.J.K.; Validation, M.K. and Y.J.K.; Formal analysis, M.K. and Y.J.K.; Methodology, M.K. and Y.J.K.; Software, M.K. and Y.J.K.; Investigation, Y.J.K.; Writing—original draft preparation, M.K. and Y.J.K.; Writing—review and editing, M.K. and Y.J.K.; Project administration, Y.J.K.; Funding acquisition, Y.J.K. All authors have read and agreed to the published version of the manuscript.
Funding
This study was supported by a research fund from Chosun University in 2026 (CHOSUN-2026).
Institutional Review Board Statement
This study was performed in accordance with the Declaration of Helsinki and was approved by the Ethics Committee of Chosun University (reference code: 2-1041055-AB-N-01-2026-23).
Informed Consent Statement
Not applicable.
Data Availability Statement
The original contributions presented in this study are included in the article. Further inquiries can be directed to the corresponding author.
Conflicts of Interest
The authors declare no conflicts of interest.
Acknowledgments
During the preparation of this manuscript, the authors used ChatGPT (Version 5.5) for the purposes of generating text. The authors have reviewed and edited the output and takes full responsibility for the content of this publication.
References
- Baskurt, O.K.; Meiselman, H.J. Erythrocyte aggregation: basic aspects and clinical importance. Clin. Hemorheol. Microcirc. 2013, 53, 23-37.
- Nader, E.; Skinner, S.; Romana, M.; Fort, R.; Lemonne, N.; Guillot, N.; Gauthier, A.; Antoine-Jonville, S.; Renoux, C.; Hardy-Dessources, M.D.; Stauffer, E.; Joly, P.; Bertrand, Y.; Connes, P. Blood rheology: key parameters, impact on blood flow, role in sickle cell disease and effects of exercise. Front Physiol 2019, 10, 1329.
- Yalcin, O.; Uyuklu, M.; Armstrong, J.K.; Meiselman, H.J.; Baskurt, O.K. Graded alterations of RBC aggregation influence in vivo blood flow resistance. Am. J. Physiol. Heart Circ. Physiol. 2004, 287, H2644-50.
- Lazari, D.; Freitas Leal, J.K.; Brock, R.; Bosman, G. The relationship between aggregation and deformability of red blood cells in health and disease. Front Physiol. 2020, 11, 288.
- Ben-Ami, R.; Barshtein, G.; Mardi, T.; Deutch, V.; Elkayam, O.; Yedgar, S.; Berliner, S. A synergistic effect of albumin and fibrinogen on immunoglobulin-induced red blood cell aggregation. Am J. Physiol. Heart Circ. Physiol. 2003, 285, H2663–H2669.
- Neu, B.; Sowemimo-Coker, S.O.; Meiselman, H.J. Cell-cell affinity of senescent human erythrocytes. Biophys. J. 2003, 85, 75-84.
- Baskurt, O.K.; Boynard, M.; Cokelet, G.C.; Connes, P.; Cooke, B.M.; Forconi, S.; Liao, F.; Hardeman, M.R.; Jung, F.; Meiselman, H.J.; Nash, G.; Nemeth, N.; Neu, B.; Sandhagen, B.; Shin, S.; Thurston, G.; Wautier, J.L.; International Expert Panel for Standardization of Hemorheological, M. New guidelines for hemorheological laboratory techniques. Clin. Hemorheol. Microcirc. 2009, 42, 75-97.
- Higuchi, M.; Watanabe, N. A rapid and accurate method for estimating the erythrocyte sedimentation rate using a hematocrit-corrected optical aggregation index. PLoS One 2022, 17, e0270977.
- Uyuklu, M.; Cengiz, M.; Ulker, P.; Hever, T.; Tripette, J.; Connes, P.; Nemeth, N.; Meiselman, H.J.; Baskurt, O.K. Effects of storage duration and temperature of human blood on red cell deformability and aggregation. Clin. Hemorheol. Microcirc. 2009, 41, 269-278.
- Maeda, N.; Seike, M.; Shiga, T. Effect of temperature on the velocity of erythrocyte aggregation Biochimica et Biophysica Acta 1987, 904, 319-329.
- Kaliviotis, E.; Sherwood, J.M.; Balabani, S. Partitioning of red blood cell aggregates in bifurcating microscale flows. Sci. Rep. 2017, 7, 44563.
- Ye, T.; Peng, L.; Li, G. Red blood cell distribution in a microvascular network with successive bifurcations. Biomech. Model Mechanobiol. 2019, 18, 1821-1835.
- Deng, Y.; Papageorgiou, D.P.; Li, X.; Perakakis, N.; Mantzoros, C.S.; Dao, M.; Karniadakis, G.E. Quantifying fibrinogen-dependent aggregation of red blood cells in type 2 diabetes mellitus. Biophys. J. 2020, 119, 900-912.
- Cho, Y.I.; Mooney, M.P.; Cho, D.J. Hemorheological disorders in diabetes mellitus. J. diabetes Sci. Technol. 2008, 2, 1130-1138.
- Piagnerelli, M.; Boudjeltia, K.Z.; Vanhaeverbeek, M.; Vincent, J.L. Red blood cell rheology in sepsis. Intensive Care Med. 2003, 29, 1052-1061.
- Subendran, S.; Wang, Y.C.; Lu, Y.H.; Chen, C.Y. The evaluation of zebrafish cardiovascular and behavioral functions through microfluidics. Sci Rep 2021, 11, 13801.
- Peters, S.A.; Woodward, M.; Rumley, A.; Tunstall-Pedoe, H.D.; Lowe, G.D. Plasma and blood viscosity in the prediction of cardiovascular disease and mortality in the Scottish Heart Health Extended Cohort Study. Eur. J. Prev. Cardiol. 2017, 24, 161-167.
- Williams, D.C.; Higgins, J.M.; Wood, D.K. Quantifying the unique mechanical properties of irreversibly sickled cells in sickle cell disease. Blood Vessel Thromb Hemost 2025, 2, 100077.
- Moutzouri, A.G.; Athanassiou, G.A.; Dimitropoulou, D.; Skoutelis, A.T.; Gogos, C.A. Severe sepsis and diabetes mellitus have additive effects on red blood cell deformability. J. Infect. 2008, 57, 147-151.
- Ami, R.B.; Barshtein, G.; Zeltser, D.; Goldberg, Y.; Shapira, I.; Roth, A.; Keren, G.; Miller, H.; Prochorov, V.; Eldor, A.; Berliner, S.; Yedgar, S. Parameters of red blood cell aggregation as correlates of the inflammatory state. Am. J. Physiol. Heart Circ. Physiol. 2001, 280, H1982–H1988.
- Ko, E.; Youn, J.M.; Park, H.S.; Song, M.; Koh, K.H.; Lim, C.H. Early red blood cell abnormalities as a clinical variable in sepsis diagnosis. Clin. Hemorheol Microcirc. 2018, 70, 355-363.
- Alexandrova-Watanabe, A.; Abadjieva, E.; Gartcheva, L.; Langari, A.; Ivanova, M.; Guenova, M.; Tiankov, T.; Strijkova, V.; Krumova, S.; Todinova, S. The impact of targeted therapies on red blood cell aggregation in patients with chronic lymphocytic leukemia evaluated using software image flow analysis. Micromachines (Basel) 2025, 16, 95.
- Baskurt, O.K.; Uyuklu, M.; Hardeman, M.R.; Meiselman, H.J. Photometric measurements of red blood cell aggregation: light transmission versus light reflectance. J. Biomed. Opt. 2009, 14, 054044.
- Secomb, T.W. Blood Flow in the Microcirculation. Ann. Rev. Fluid Mech. 2017, 49, 443-461.
- Lee, C.A.; Paeng, D.G. Numerical simulation of spatiotemporal red blood cell aggregation under sinusoidal pulsatile flow. Sci Rep 2021, 11, 9977.
- Mehri, R.; Mavriplis, C.; Fenech, M. Design of a microfluidic system for red blood cell aggregation investigation. J. Biomech. Eng. 2014, 136, 064501.
- Kang, Y.J. Microfluidic-based technique for measuring RBC aggregation and blood viscosity in a continuous and simultaneous fashion. Micromachines (Basel) 2018, 9, 467.
- Shin, S.; Jang, J.-H.; Park, M.-S.; Ku, Y. Optical detection of red blood cell aggregation in a disposable microfluidic channel. J. Mech. Sci. Technol. 2005, 19, 887-893.
- Isiksacan, Z.; Hastar, N.; Erel, O.; Elbuken, C. An optofluidic point-of-care device for quantitative investigation of erythrocyte aggregation during coagulation. Sens. Actuator A-Phys. 2018, 281, 24-30.
- Namgung, B.; Lee, T.; Tan, J.K.S.; Poh, D.K.H.; Park, S.; Chng, K.Z.; Agrawal, R.; Park, S.Y.; Leo, H.L.; Kim, S. Vibration motor-integrated low-cost, miniaturized system for rapid quantification of red blood cell aggregation. Lab Chip 2020, 20, 3930-3937.
- Shin, S.; Park, M.-S.; Ku, Y.; Jang, J.-H. Simultaneous measurement of red blood cell aggregation and viscosity: light transmission slit rheometer J. Mech. Sci. Technol. 2005, 19, 209-215.
- Nam, J.H.; Xue, S.; Lim, H.; Shin, S. Study of erythrocyte aggregation at pulsatile flow conditions with backscattering analysis. Clin Hemorheol Microcirc 2012, 50, 257-266.
- Mehri, R.; Mavriplis, C.; Fenech, M. Red blood cell aggregates and their effect on non-Newtonian blood viscosity at low hematocrit in a two-fluid low shear rate microfluidic system. PLoS One 2018, 13, e0199911.
- Mehri, R.; Niazi, E.; Mavriplis, C.; Fenech, M. An automated method for dynamic red blood cell aggregate detection in microfluidic flow. Physiol. Meas. 2018, 39, 01NT02.
- Yeom, E.; Lee, S.J. Microfluidic-based speckle analysis for sensitive measurement of erythrocyte aggregation: A comparison of four methods for detection of elevated erythrocyte aggregation in diabetic rat blood. Biomicrofluidics 2015, 9, 024110.
- Kang, Y.J. Microfluidic-based measurement of RBC aggregation and the ESR using a driving syringe system. Analytical Methods 2018, 10, 1805-1816.
- Kang, Y.J. Simultaneous measurement of blood pressure and RBC aggregation by monitoring on-off blood flows supplied from a disposable air-compressed pump. Analyst 2019, 144, 3556-3566.
- Kang, Y.J. Assessment of continuous flow-dependent red cell aggregation using a microfluidic chip. Applied Sciences 2025, 15, 11481.
- Folch, A.; Ayon, A.; Hurtado; Schmidt, M.A.; Toner, M. Molding of deep polydimethylsiloxane microstructures for microfluidics and biological applications. J. Biomech. Eng. 1999, 121, 28-34.
- Giang, U.B.; Lee, D.; King, M.R.; DeLouise, L.A. Microfabrication of cavities in polydimethylsiloxane using DRIE silicon molds. Lab Chip 2007, 7, 1660-1662.
- Duffy, D.C.; McDonald, J.C.; Schueller, O.J.A.; Whitesides, G.M. Rapid prototyping of microfluidic systems in poly(dimethylsiloxane). Anal. Chem. 1998, 70, 4974-4984.
- Kim, G.; Jeong, S.; Kang, Y.J. Ultrasound standing wave-based cell-to-liquid separation for measuring viscosity and aggregation of blood sample. Sensors (Basel) 2020, 20, 2284.
- Schmid-Schonbein, H.; Gaehtgens, P.; Hirsch, H. On the shear rate dependence of red cell aggregation in vitro. J. Clin. Invest. 1968, 47, 1447-1454.
- Charansonney, O.L.; Morel, P.; Dufaux, J.; Vicaut, E. Description and validation of a new, simple, easy-to handle, point-of-care technique for measuring erythrocyte aggregation kinetics. Sci Rep 2022, 12, 14798.
- Lee, C.A.; Farooqi, H.M.U.; Paeng, D.G. Axial shear rate: A hemorheological factor for erythrocyte aggregation under Womersley flow in an elastic vessel based on numerical simulation. Comput Biol Med 2023, 157, 106767.
- Brust, M.; Aouane, O.; Thiebaud, M.; Flormann, D.; Verdier, C.; Kaestner, L.; Laschke, M.W.; Selmi, H.; Benyoussef, A.; Podgorski, T.; Coupier, G.; Misbah, C.; Wagner, C. The plasma protein fibrinogen stabilizes clusters of red blood cells in microcapillary flows. Sci. Rep. 2014, 4, 4348.
- Gholivand, A.; Korculanin, O.; Dahlhoff, K.; Babaki, M.; Dickscheid, T.; Lettinga, M.P. Effect of in-plane and out-of-plane bifurcated microfluidic channels on the flow of aggregating red blood cells. Lab Chip 2024, 24, 2317-2326.
- Cheng, N.-S. Formula for the viscosity of a glycerol−water mixture. Industrial & Engineering Chemistry Research 2008, 47, 3285-3288.
- Oh, K.W.; Lee, K.; Ahn, B.; Furlani, E.P. Design of pressure-driven microfluidic networks using electric circuit analogy. Lab Chip 2012, 12, 515-45.
- Kloosterman, A.; Poelma, C.; Westerweel, J. Flow rate estimation in large depth-of-field micro-PIV. Exp. Fluids 2010, 50, 1587-1599.
- Wereley, S.T.; Meinhart, C.D. Recent advances in micro-particle image velocimetry. Ann. Rev. Fluid Mech. 2010, 42, 557-576.
- Cairone, F.; Ortiz, D.; Cabrales, P.J.; Intaglietta, M.; Bucolo, M. Emergent behaviors in RBCs flows in micro-channels using digital particle image velocimetry. Microvasc Res 2018, 116, 77-86.
- Thielicke, W.; Stamhuis, E.J. PIVlab – towards user-friendly, affordable and accurate digital particle image velocimetry in MATLAB. Journal of Open Research Software 2014, 2, e30.
- Neu, B.; Wenby, R.; Meiselman, H.J. Effects of dextran molecular weight on red blood cell aggregation. Biophys. J. 2008, 95, 3059-3065.
- Flormann, D.; Schirra, K.; Podgorski, T.; Wagner, C. On the rheology of red blood cell suspensions with different amounts of dextran: separating the effect of aggregation and increase in viscosity of the suspending phase. Rheologica Acta 2015, 55, 477-483.
- Grigorev, G.V.; Lebedev, A.V.; Wang, X.; Qian, X.; Maksimov, G.V.; Lin, L. Advances in microfluidics for single red blood cell analysis. Biosensors (Basel) 2023, 13, 117.
- Kim, H.; Zhbanov, A.; Yang, S. Microfluidic systems for blood and blood cell characterization. Biosensors (Basel) 2022, 13, 13.
- Baskurt, O.K.; Uyuklu, M.; Meiselman, H.J. Time course of electrical impedance during red blood cell aggregation in a glass tube: comparison with light transmittance. IEEE Trans Biomed Eng 2010, 57, 969-78.
- Bosek, M.; Ziomkowska, B.; Pyskir, J.; Wybranowski, T.; Pyskir, M.; Cyrankiewicz, M.; Napiorkowska, M.; Durmowicz, M.; Kruszewski, S. Relationship between red blood cell aggregation and dextran molecular mass. Sci. Rep. 2022, 12, 19751.
- Kang, Y.J. Blood rheometer based on microflow manipulation of continuous blood flows using push-and-back mechanism. Anal. Methods 2021, 13, 4871-4883.
- Shin, S.; Yang, Y.; Suh, J.S. Measurement of erythrocyte aggregation in a microchip stirring system by light transmission. Clin Hemorheol Microcirc 2009, 41, 197-207.
- Kang, Y.J. Red blood cell sedimentation index using shear stress of blood flow in microfluidic channel. Biosensors (Basel) 2022, 12, 547.
- Zhao, L.; Kaewprayoon, W.; Zhou, H.; Georgieva, R.; Baumler, H. RBC aggregation in dextran solutions can be measured by flow cytometry. Clin. Hemorheol. Microcirc. 2017, 65, 93-101.
- Kang, Y.J. Microfluidic-based measurement method of red blood cell aggregation under hematocrit variations. Sensors (Basel) 2017, 17, 2037.
- Lim, H.-J.; Nam, J.-H.; Lee, B.-K.; Suh, J.-S.; Shin, S. Alteration of red blood cell aggregation during blood storage. Korea-Aust. Rheol. J. 2011, 23, 67-70.
- Reinhart, W.H.; Schulzki, T. Metabolic depletion decreases the aggregability of erythrocytes. Clin. Hemorheol. Microcirc. 2011, 49, 451-461.
- Henkelman, S.; Dijkstra-Tiekstra, M.J.; De Wildt-Eggen, J.; Graaff, R.; Rakhorst, G.; Van Oeveren, W. Is red blood cell rheology preserved during routine blood bank storage? Transfusion 2010, 50, 941-948.
- Isiksacan, Z.; D’Alessandro, A.; Wolf, S.M.; McKenna, D.H.; Tessier, S.N.; Kucukal, E.; Gokaltun, A.A.; William, N.; Sandlin, R.D.; Bischof, J.; Mohandas, N.; Busch, M.P.; Elbuken, C.; Gurkan, U.A.; Toner, M.; Acker, J.P.; Yarmush, M.L.; Usta, O.B. Assessment of stored red blood cells through lab-on-a-chip technologies for precision transfusion medicine. Proc Natl Acad Sci U S A 2023, 120, e2115616120.
- Kang, Y.J. Microfluidic-based effective monitoring of bloods by measuring RBC aggregation and blood viscosity under stepwise varying shear rates. Korea-Aust. Rheol. J. 2020, 32, 15-27.
- Freitas Leal, J.; Vermeer, H.; Lazari, D.; van Garsse, L.; Brock, R.; Adjobo-Hermans, M.; Bosman, G. The impact of circulation in a heart-lung machine on function and survival characteristics of red blood cells. Artif. Organs 2020, 44, 892-899.
- Oh, J.Y.; Marques, M.B.; Xu, X.; Li, J.; Genschmer, K.; Gaggar, A.; Jansen, J.O.; Holcomb, J.B.; Pittet, J.F.; Patel, R.P. Damage to red blood cells during whole blood storage. J. Trauma Acute Care Surg. 2020, 89, 344-350.
- Vijayan, V.; Greite, R.; Schott, S.; Doricic, J.; Madyaningrana, K.; Pradhan, P.; Martens, J.; Blasczyk, R.; Janciauskiene, S.; Immenschuh, S. Determination of free heme in stored red blood cells with an apo-horseradish peroxidase-based assay. Biol. Chem. 2022, 403, 1091-1098.
- Tzounakas, V.L.; Anastasiadi, A.T.; Lekka, M.E.; Papageorgiou, E.G.; Stamoulis, K.; Papassideri, I.S.; Kriebardis, A.G.; Antonelou, M.H. Deciphering the relationship between free and vesicular hemoglobin in stored red blood cell units. Front. Physiol. 2022, 13, 840995.
- Tran, L.N.T.; Gonzalez-Fernandez, C.; Gomez-Pastora, J. Impact of different red blood cell storage solutions and conditions on cell function and viability: A systematic review. Biomolecules 2024, 14, 813.
Figure 1.
A proposed method for assessing time-lapse RBC aggregation index (AI) map in microfluidic channels. (A) Experimental setup including a microfluidic chip, a syringe pump, and image acquisition system. The microfluidic channel was composed of a single inlet, a single outlet, a main channel (mc), and three bifurcation channels, each with an enlarged side chamber (sc1, sc2, and sc3). The syringe pump was set to constant flow rate (Qsp). The image acquisition system was composed of an inverted microscope (4×, NA = 0.1), a high-speed camera (5000 fps), and an external trigger (pulse period: 0.5 s). (B) Quantification of blood imaging intensity inside each side chamber. A compensated image intensity (J) was calculated by subtracting a captured blood image (I [x, y, t > 0]) from background grayscale image (I [x, y, t = 0]). The lower panels exhibited image intensity distributions in three side chambers. (C) Calculation of AI and representative index (AIm). (i) Calculation of spatiotemporal AI map. The left panel showed a microscopic image of control blood. Arrow (‘→’) indicated the direction of blood flow. The right panel represented a microscopic image of test blood. (ii) A spatial distribution of AI in each side chamber. (iii) Determination of representative value of spatially distributed AI. The left panel showed a bright-field image and its corresponding AI map, respectively. The maximum value of <AI> was then regarded as a representative value of AI (AIm). (iv) Time-lapse AIm with respect to each side chamber (sc1, sc2, and sc3).
Figure 1.
A proposed method for assessing time-lapse RBC aggregation index (AI) map in microfluidic channels. (A) Experimental setup including a microfluidic chip, a syringe pump, and image acquisition system. The microfluidic channel was composed of a single inlet, a single outlet, a main channel (mc), and three bifurcation channels, each with an enlarged side chamber (sc1, sc2, and sc3). The syringe pump was set to constant flow rate (Qsp). The image acquisition system was composed of an inverted microscope (4×, NA = 0.1), a high-speed camera (5000 fps), and an external trigger (pulse period: 0.5 s). (B) Quantification of blood imaging intensity inside each side chamber. A compensated image intensity (J) was calculated by subtracting a captured blood image (I [x, y, t > 0]) from background grayscale image (I [x, y, t = 0]). The lower panels exhibited image intensity distributions in three side chambers. (C) Calculation of AI and representative index (AIm). (i) Calculation of spatiotemporal AI map. The left panel showed a microscopic image of control blood. Arrow (‘→’) indicated the direction of blood flow. The right panel represented a microscopic image of test blood. (ii) A spatial distribution of AI in each side chamber. (iii) Determination of representative value of spatially distributed AI. The left panel showed a bright-field image and its corresponding AI map, respectively. The maximum value of <AI> was then regarded as a representative value of AI (AIm). (iv) Time-lapse AIm with respect to each side chamber (sc1, sc2, and sc3).
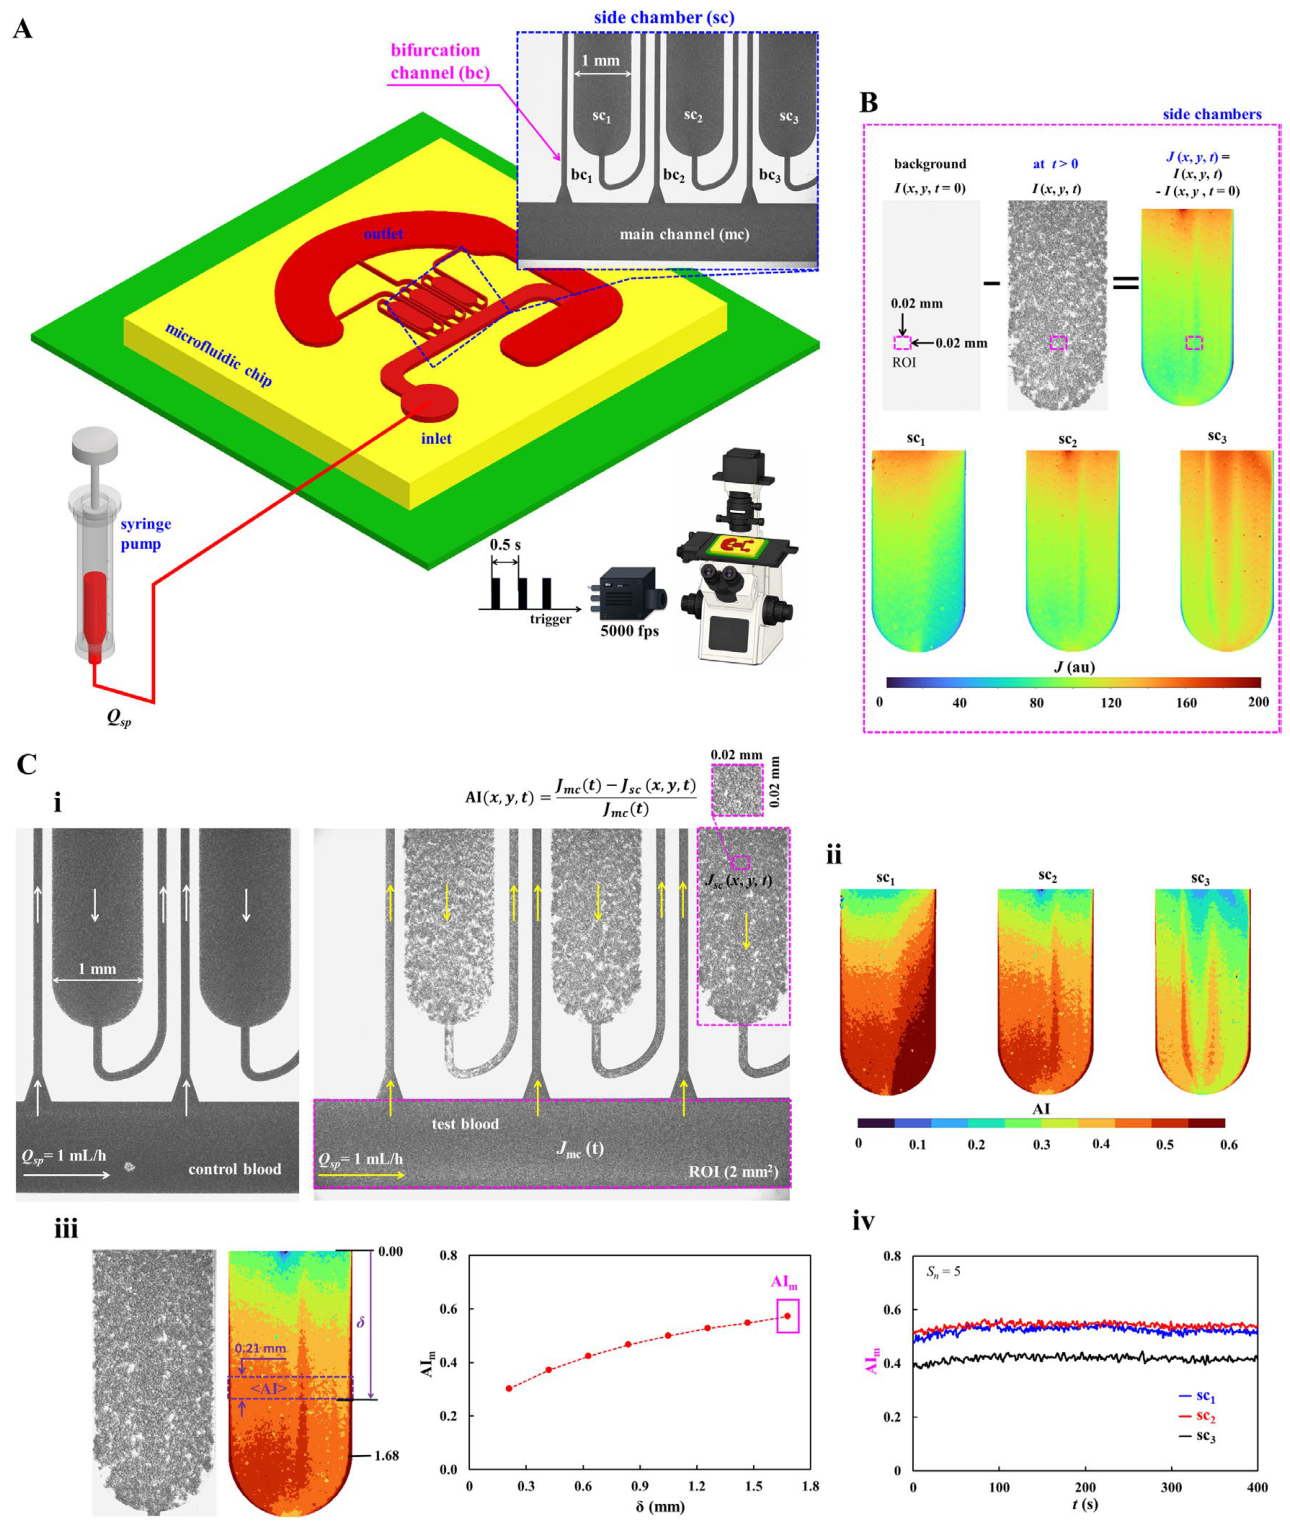
Figure 2.
Determination of shear rate () using a discrete circuit model. (A) A fluidic circuit model for determining flow rate and shear rate in the microfluidic channels. The left-side panel showed a schematic diagram of microfluidic system, such as, a syringe pump, tubing, and a microfluidic chip. The main channel was divided into four segments (mc1, mc2, mc3, and mc4). Three bifurcations were denoted as bc1, bc2, and bc3. The side chambers were denoted as sc1, sc2, and sc3. The pressures at each junction (a, b, c) were denoted as Pa, Pb, and Pc. The right panel represented fluidic-circuit model of the proposed microfluidic system. The fluidic-circuit model consisted of flow-rate source (Qsp), and several hydraulic resistances. A symbol, ▼, indicated zero value of gauge pressure (i.e., GND). Flow rate of each channel was denoted as Qmc1 ~ Qmc4 (main channel) and Qsc1 ~ Qsc3 (side chamber). (B) Estimation of flow rates and shear rates as a function of Qsp. (i) Variations of Qmc1, Qmc2, Qmc3, and Qmc4 as a function of Qsp. (ii) Variations of Qsc1, Qsc2, and Qsc3 as a function of Qsp. (iii) Variations of in main channel and side chamber with respect to Qsp. The light-green box indicated the allowable range of infused flow rate for inducing RBC aggregation in side chambers.
Figure 2.
Determination of shear rate () using a discrete circuit model. (A) A fluidic circuit model for determining flow rate and shear rate in the microfluidic channels. The left-side panel showed a schematic diagram of microfluidic system, such as, a syringe pump, tubing, and a microfluidic chip. The main channel was divided into four segments (mc1, mc2, mc3, and mc4). Three bifurcations were denoted as bc1, bc2, and bc3. The side chambers were denoted as sc1, sc2, and sc3. The pressures at each junction (a, b, c) were denoted as Pa, Pb, and Pc. The right panel represented fluidic-circuit model of the proposed microfluidic system. The fluidic-circuit model consisted of flow-rate source (Qsp), and several hydraulic resistances. A symbol, ▼, indicated zero value of gauge pressure (i.e., GND). Flow rate of each channel was denoted as Qmc1 ~ Qmc4 (main channel) and Qsc1 ~ Qsc3 (side chamber). (B) Estimation of flow rates and shear rates as a function of Qsp. (i) Variations of Qmc1, Qmc2, Qmc3, and Qmc4 as a function of Qsp. (ii) Variations of Qsc1, Qsc2, and Qsc3 as a function of Qsp. (iii) Variations of in main channel and side chamber with respect to Qsp. The light-green box indicated the allowable range of infused flow rate for inducing RBC aggregation in side chambers.
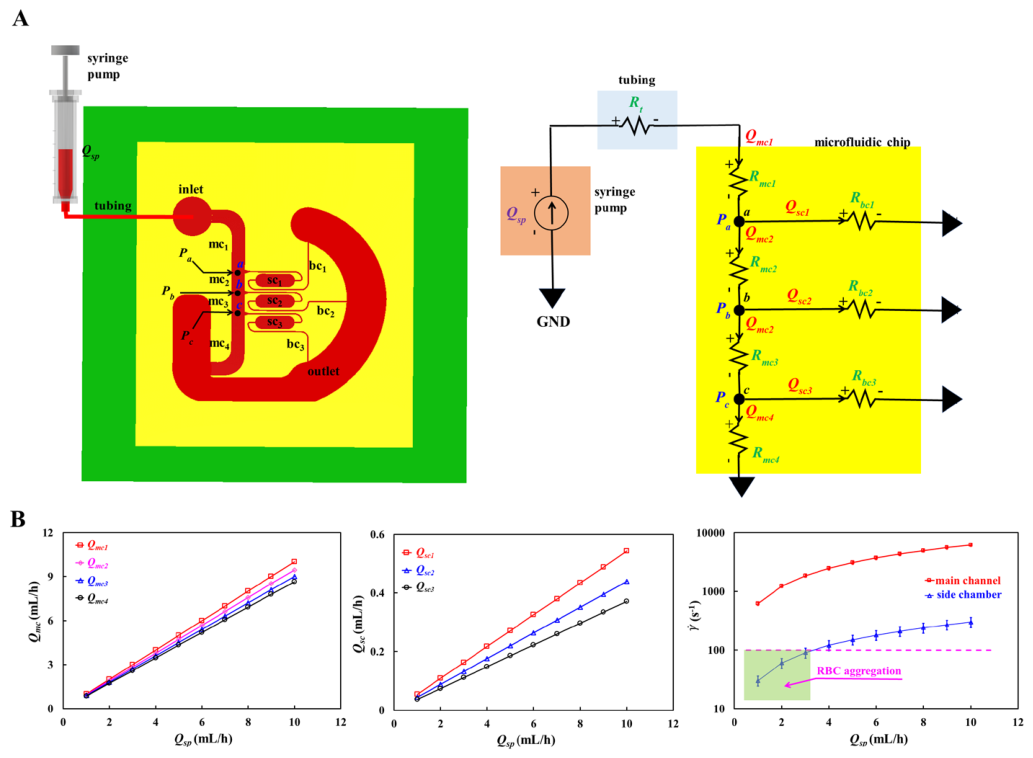
Figure 3.
Estimation of shear rate () using full-scale computational fluid dynamics simulation of the proposed microfluidic chip. (A) Distributions of velocity and shear rate obtained using commercial software (COMSOL Multiphysics). The left panel showed the meshes generated for the microfluidic channels. The middle panel showed velocity distributions at the channel midplane, where Qsp = 1 mL/h. The right panel represented shear rate distributions at the bottom wall at Qsp = 1 mL/h. (B) Distributions of shear rate as a function of Qsp = 1, 3, and 5 mL/h. (C) Estimation of flow rate and shear rate as a function of Qsp. The left-side panel showed variations of flow rate in the main channel (Qmc1 ~ Qmc4) as a function of Qsp. The middle panel showed variations of flow rates in side chambers (Qsc1 ~ Qsc3) as a function of Qsp. The right-side panel exhibited variations of shear rates in the main channel and side chambers as a function of infused flow rate.
Figure 3.
Estimation of shear rate () using full-scale computational fluid dynamics simulation of the proposed microfluidic chip. (A) Distributions of velocity and shear rate obtained using commercial software (COMSOL Multiphysics). The left panel showed the meshes generated for the microfluidic channels. The middle panel showed velocity distributions at the channel midplane, where Qsp = 1 mL/h. The right panel represented shear rate distributions at the bottom wall at Qsp = 1 mL/h. (B) Distributions of shear rate as a function of Qsp = 1, 3, and 5 mL/h. (C) Estimation of flow rate and shear rate as a function of Qsp. The left-side panel showed variations of flow rate in the main channel (Qmc1 ~ Qmc4) as a function of Qsp. The middle panel showed variations of flow rates in side chambers (Qsc1 ~ Qsc3) as a function of Qsp. The right-side panel exhibited variations of shear rates in the main channel and side chambers as a function of infused flow rate.
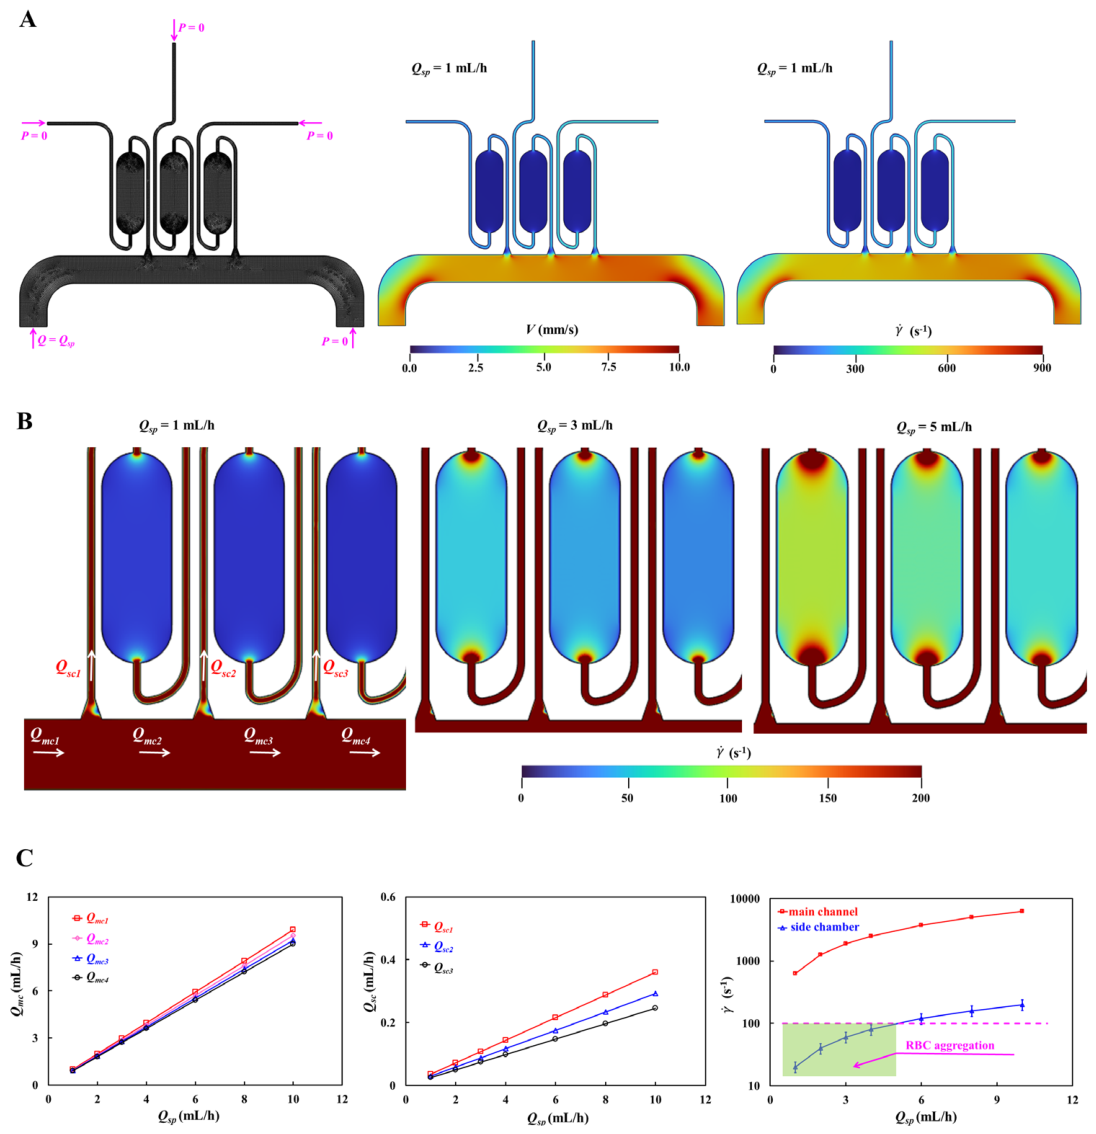
Figure 4.
Experimental quantification of flow rate and shear rate in microfluidic channels using micro-PIV technique. Herein, using a syringe pump, a 30% glycerin solution containing 3% RBCs (i.e., fluid tracers) was supplied into a microfluidic chip at a constant flow rate of Qsp. (A) Determination of flow rate in main channel and side chamber as a function of Qsp. The left panel showed velocity fields in main channel (mc1 ~ mc4) and side chamber (sc1 ~ sc3) at Qsp = 1 mL/h. The middle panel exhibited time-lapse flow rates in main channel (i.e., mc1 ~ mc4) and side chamber (sc1 ~ sc3) at Qsp =1 mL/h. Right panel showed variation of Qmc1 (the first segment in the main channel) as a function of Qsp. Inset showed time-lapse Qmc1 (corrected flow rate) and Qm1 (uncorrected flow rate). The corrected flow rate (Qmc1) was obtained as Qmc1 = Qsp/<Qm1>×Qm1. Herein, the <Qm1> denoted the mean of the uncorrected flow rate. (B) Variations of Qmc1 as a function of Qsp. Herein, the Qmc1 was corrected as Qmc1 = Qsp/<Qm1>×Qm1, where <Qm1> denoted average flow rate of Qm1 over plateau intervals. (C) Variations of shear rate () in main channel and side chamber as a function of Qsp. The left-side panel showed variations of flow rate in the main channel (Qmc1, Qmc2, Qmc3, and Qmc4) with respect to Qsp. The middle panel exhibited variations of flow rate in the side chamber (Qsc1, Qsc2, and Qsc3) with respect to Qsp. The right-side panel represented variations of shear rate in the main channel and side chamber as a function of Qsp. The purple dashed line denoted upper threshold of shear rate for inducing RBC aggregation.
Figure 4.
Experimental quantification of flow rate and shear rate in microfluidic channels using micro-PIV technique. Herein, using a syringe pump, a 30% glycerin solution containing 3% RBCs (i.e., fluid tracers) was supplied into a microfluidic chip at a constant flow rate of Qsp. (A) Determination of flow rate in main channel and side chamber as a function of Qsp. The left panel showed velocity fields in main channel (mc1 ~ mc4) and side chamber (sc1 ~ sc3) at Qsp = 1 mL/h. The middle panel exhibited time-lapse flow rates in main channel (i.e., mc1 ~ mc4) and side chamber (sc1 ~ sc3) at Qsp =1 mL/h. Right panel showed variation of Qmc1 (the first segment in the main channel) as a function of Qsp. Inset showed time-lapse Qmc1 (corrected flow rate) and Qm1 (uncorrected flow rate). The corrected flow rate (Qmc1) was obtained as Qmc1 = Qsp/<Qm1>×Qm1. Herein, the <Qm1> denoted the mean of the uncorrected flow rate. (B) Variations of Qmc1 as a function of Qsp. Herein, the Qmc1 was corrected as Qmc1 = Qsp/<Qm1>×Qm1, where <Qm1> denoted average flow rate of Qm1 over plateau intervals. (C) Variations of shear rate () in main channel and side chamber as a function of Qsp. The left-side panel showed variations of flow rate in the main channel (Qmc1, Qmc2, Qmc3, and Qmc4) with respect to Qsp. The middle panel exhibited variations of flow rate in the side chamber (Qsc1, Qsc2, and Qsc3) with respect to Qsp. The right-side panel represented variations of shear rate in the main channel and side chamber as a function of Qsp. The purple dashed line denoted upper threshold of shear rate for inducing RBC aggregation.
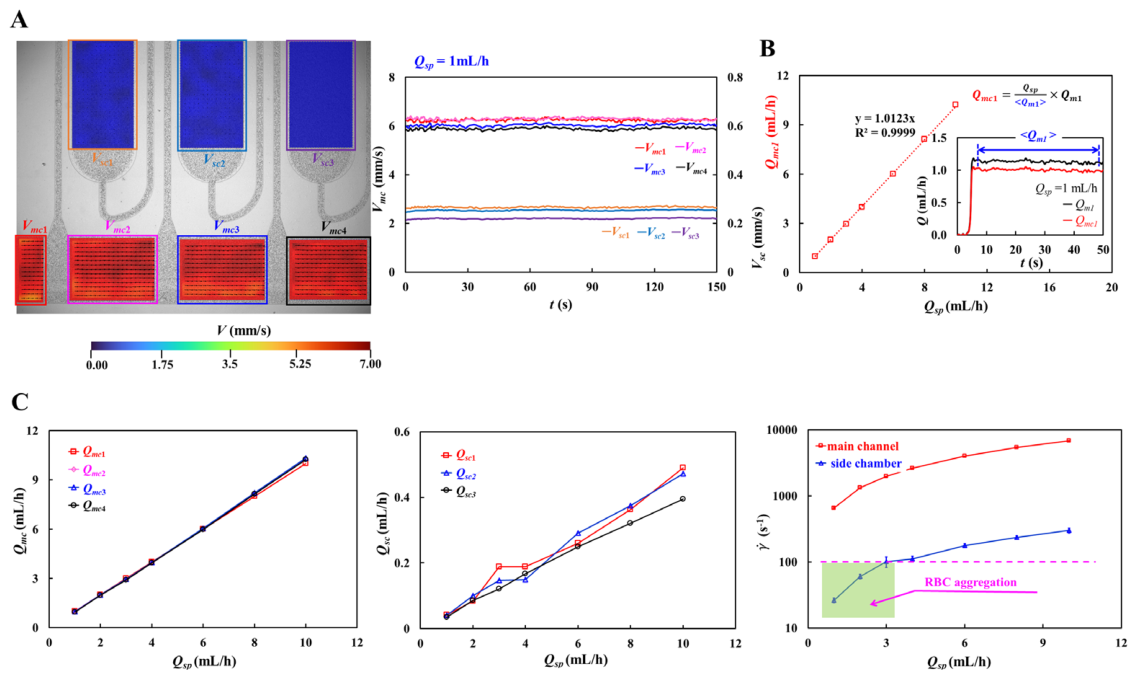
Figure 5.
Quantitative comparison of shear rates obtained using three methods (i.e., circuit analysis, CFD, and experiment). (A) Variations of shear rate in the main channel obtained by three methods as a function of Qsp. (B) Variations of shear rate in the side chamber obtained by three methods as a function of Qsp. According to linear analysis, shear rates estimated by circuit analysis and CFD were linearly proportional to the experimental values. .
Figure 5.
Quantitative comparison of shear rates obtained using three methods (i.e., circuit analysis, CFD, and experiment). (A) Variations of shear rate in the main channel obtained by three methods as a function of Qsp. (B) Variations of shear rate in the side chamber obtained by three methods as a function of Qsp. According to linear analysis, shear rates estimated by circuit analysis and CFD were linearly proportional to the experimental values. .
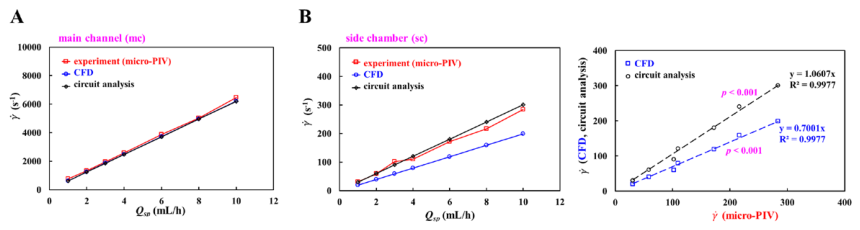
Figure 6.
Impact of supplied flow rate on spatiotemporal AI map. Herein, test blood (Hct = 50%) was prepared by mixing normal RBCs into a dextran solution (30 mg/mL). The blood flow rate was set to Qsp = 0.5 ~ 5 mL/h. (A) Determination of a proposed index (AIm) with respect to downstream distance. (i) Microscopic images as a function of Qsp = 0.5, 1, 3, and 5 mL/h. (ii) Spatial AI maps with respect to Qsp. (iii) Velocity distributions in side chambers. The left panel showed variations of V along a channel width direction (x). The right panel exhibited variations of V along a flow movement direction (y). (iv) Determination of representative index (AIm). The left panel showed variations of <AIm> along the flow direction. The right panel indicated the location of AIm, where <AI> reached its maximum value. (B) Effect of shear rates on AIm. (i) Time-lapse AIm in each side chamber as a function of Qsp = 0.5, 3, and 5 mL/h. (ii) Variations of AIm in each side chamber (sc1, sc2, and sc3) with respect to Qsp = 0.5, 1, 3, and 5 mL/h. (iii) Variations of AIm as a function of .
Figure 6.
Impact of supplied flow rate on spatiotemporal AI map. Herein, test blood (Hct = 50%) was prepared by mixing normal RBCs into a dextran solution (30 mg/mL). The blood flow rate was set to Qsp = 0.5 ~ 5 mL/h. (A) Determination of a proposed index (AIm) with respect to downstream distance. (i) Microscopic images as a function of Qsp = 0.5, 1, 3, and 5 mL/h. (ii) Spatial AI maps with respect to Qsp. (iii) Velocity distributions in side chambers. The left panel showed variations of V along a channel width direction (x). The right panel exhibited variations of V along a flow movement direction (y). (iv) Determination of representative index (AIm). The left panel showed variations of <AIm> along the flow direction. The right panel indicated the location of AIm, where <AI> reached its maximum value. (B) Effect of shear rates on AIm. (i) Time-lapse AIm in each side chamber as a function of Qsp = 0.5, 3, and 5 mL/h. (ii) Variations of AIm in each side chamber (sc1, sc2, and sc3) with respect to Qsp = 0.5, 1, 3, and 5 mL/h. (iii) Variations of AIm as a function of .
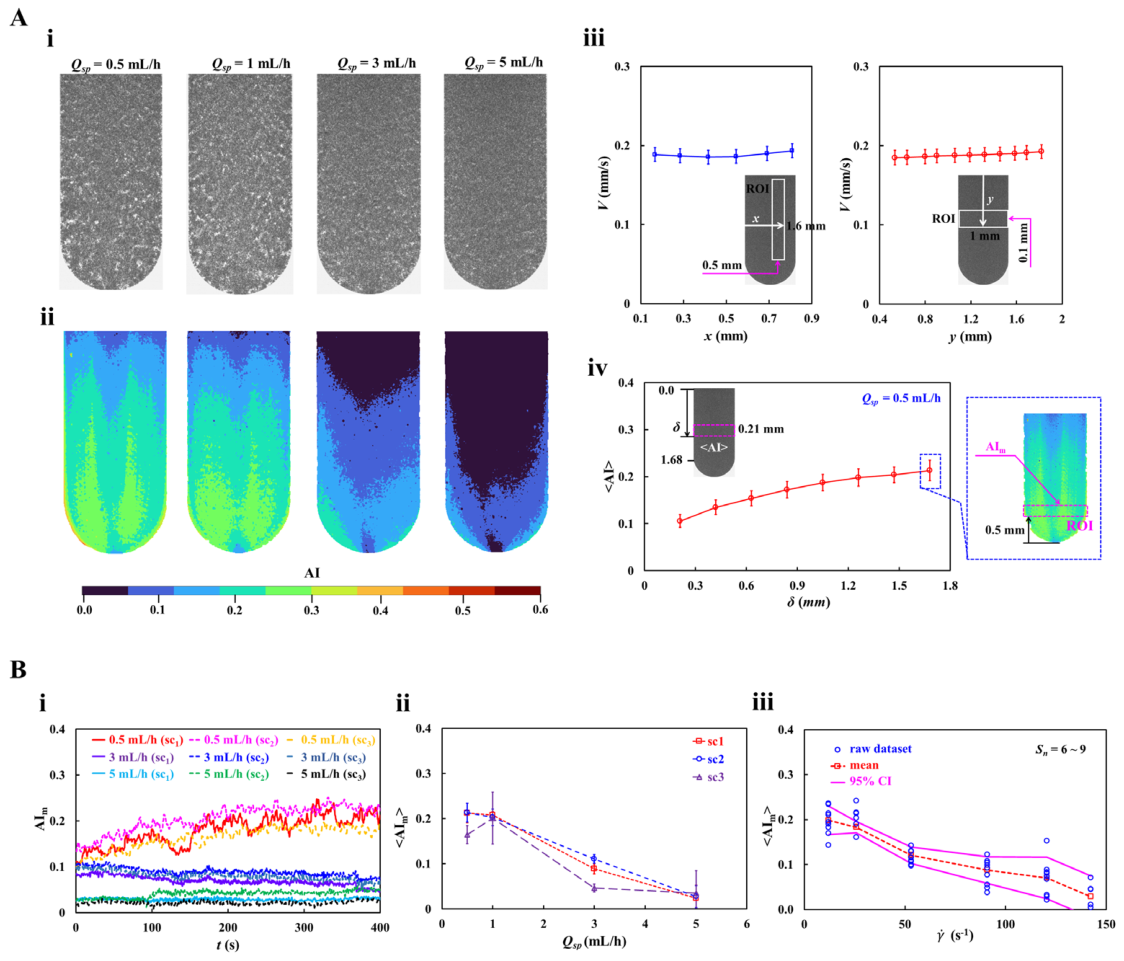
Figure 7.
Contribution of dextran solution to spatiotemporal AI maps. Herein, test blood (Hct = 50%) was prepared by mixing normal RBCs into varying dextran solution (Cdex = 5 ~ 40 mg/mL). The flow rate of test blood was fixed at Qsp = 1 mL/h. (A) Contribution of dextran solution to AIm. (i) Spatial AI map with respect to Cdex = 5, 20, and 40 mg/mL. (ii) Time-lapse AIm in each side chamber (sc1, sc2, and sc3) with respect to Cdex = 20 and 40 mg/mL. (iii) Variations of <AIm> with respect to Cdex = 5, 10, 20, 30, and 40 mg/mL. (B) Variations of previous AI (AIp) as a function of Cdex. (i) Time-lapse AIp in each side chamber with respect to Cdex = 20, and 40 mg/mL. (ii) Variations of <AIp> with respect to Cdex. (C) Quantitative comparison between proposed method (<AIm>) and previous method (<AIP>).
Figure 7.
Contribution of dextran solution to spatiotemporal AI maps. Herein, test blood (Hct = 50%) was prepared by mixing normal RBCs into varying dextran solution (Cdex = 5 ~ 40 mg/mL). The flow rate of test blood was fixed at Qsp = 1 mL/h. (A) Contribution of dextran solution to AIm. (i) Spatial AI map with respect to Cdex = 5, 20, and 40 mg/mL. (ii) Time-lapse AIm in each side chamber (sc1, sc2, and sc3) with respect to Cdex = 20 and 40 mg/mL. (iii) Variations of <AIm> with respect to Cdex = 5, 10, 20, 30, and 40 mg/mL. (B) Variations of previous AI (AIp) as a function of Cdex. (i) Time-lapse AIp in each side chamber with respect to Cdex = 20, and 40 mg/mL. (ii) Variations of <AIp> with respect to Cdex. (C) Quantitative comparison between proposed method (<AIm>) and previous method (<AIP>).
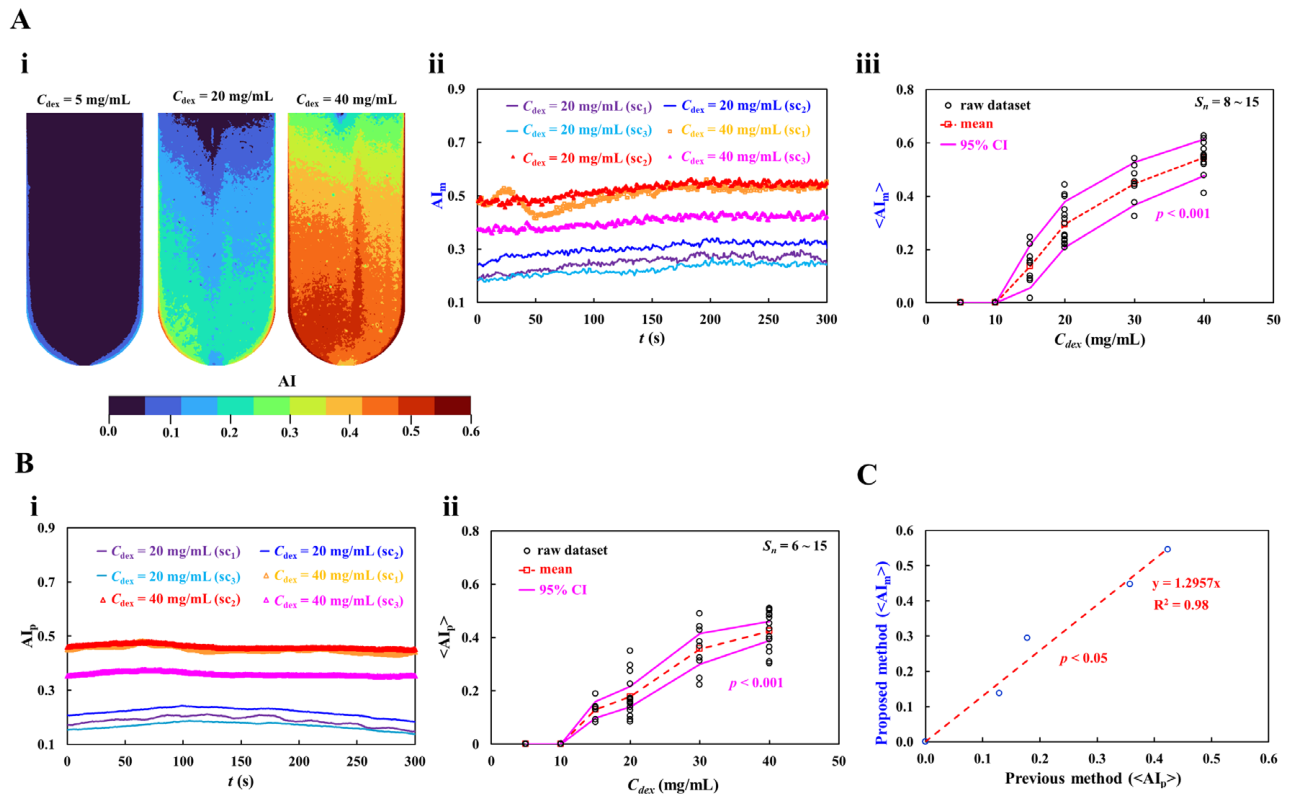
Figure 8.
Impact of storage duration on spatiotemporal AI maps. (A) Spatial heterogeneity of AI over storage duration (t = 0, 1, 2, 3, and 4 weeks). The upper panel showed microscopic images for test blood after 0, 1, 2, 3, and 4 weeks of storage. The lower panel exhibited spatial mapping of AI with respect to storage duration. (B) Snapshots of tubes filled with test blood after centrifugation as a function of storage duration. (C) Contribution of storage time and dextran solution to <AIm>. (i) Time-lapse AIm of test blood with respect to storage time and dextran solution (Cdex = 15 and 40 mg/mL). (ii) Variations of <AIm> with respect to storage time and dextran concentration (Cdex = 15, 20, 30, and 40 mg/mL).
Figure 8.
Impact of storage duration on spatiotemporal AI maps. (A) Spatial heterogeneity of AI over storage duration (t = 0, 1, 2, 3, and 4 weeks). The upper panel showed microscopic images for test blood after 0, 1, 2, 3, and 4 weeks of storage. The lower panel exhibited spatial mapping of AI with respect to storage duration. (B) Snapshots of tubes filled with test blood after centrifugation as a function of storage duration. (C) Contribution of storage time and dextran solution to <AIm>. (i) Time-lapse AIm of test blood with respect to storage time and dextran solution (Cdex = 15 and 40 mg/mL). (ii) Variations of <AIm> with respect to storage time and dextran concentration (Cdex = 15, 20, 30, and 40 mg/mL).
Disclaimer/Publisher’s Note: The statements, opinions and data contained in all publications are solely those of the individual author(s) and contributor(s) and not of MDPI and/or the editor(s). MDPI and/or the editor(s) disclaim responsibility for any injury to people or property resulting from any ideas, methods, instructions or products referred to in the content. |
© 2026 by the authors. Licensee MDPI, Basel, Switzerland. This article is an open access article distributed under the terms and conditions of the Creative Commons Attribution (CC BY) license (http://creativecommons.org/licenses/by/4.0/).
Copyright: This open access article is published under a Creative Commons CC BY 4.0 license, which permit the free download, distribution, and reuse, provided that the author and preprint are cited in any reuse.