

Submitted:
07 August 2026
Posted:
11 August 2026
You are already at the latest version
Abstract
Sacred forests play an important role in biodiversity conservation and climate change mitigation, yet their carbon storage characteristics remain poorly understood. This study quantified aboveground biomass (AGB) and aboveground carbon (AGC) stocks and examined their relationships with soil carbon–nutrient characteristics across edge-to-core spatial zones in Kaya Kauma Sacred Forest, a UNESCO-recognized sacred forest on the Kenyan coast. Forest inventories from ten permanent plots (385 trees representing 42 indigenous species) were used to estimate AGB and AGC, while soil samples collected at four depths (0–10, 10–20, 20–50, and 50–100 cm) were analyzed for total organic carbon (TOC), total nitrogen (TN), soil organic matter (SOM), soil inorganic carbon (SIC), and calcium carbonate (CaCO₃). Mean AGB and AGC were 204.2 ± 38.2 Mg ha⁻¹ and 96.0 ± 18.0 Mg C ha⁻¹, respectively, with no significant differences among forest zones (Kruskal–Wallis, H = 2.373, p = 0.305). Soil TOC, TN, and SOM declined with increasing depth, while deadwood exhibited the highest C:N ratios and regeneration material contained the highest nitrogen concentrations. No significant relationships were observed between AGC and soil variables (all p > 0.05). These findings provide baseline information on aboveground carbon stocks and soil carbon–nutrient characteristics in Kaya Kauma Sacred Forest, highlighting the importance of conserving sacred forests for biodiversity conservation and climate change mitigation.
Keywords:
aboveground biomass
; aboveground carbon
; sacred forests
; carbon sequestration
; soil organic carbon
; Kenya
1. Introduction
Forests constitute one of the most important terrestrial carbon sinks, storing substantial quantities of carbon within living biomass, dead organic matter, and soil pools. Through photosynthesis, forest ecosystems absorb atmospheric carbon dioxide and transfer it into vegetation and soil organic matter, thereby contributing significantly to climate-change mitigation and the regulation of global biogeochemical cycles (Nunes et al., 2020). Tropical forests are particularly important because they account for a disproportionately large share of global terrestrial carbon storage while simultaneously supporting exceptionally high levels of biodiversity. Consequently, understanding the factors that influence forest carbon storage has become a major priority in ecological research, climate policy, and conservation planning. The growing concern over climate change has intensified interest in forest-based carbon sequestration strategies. International initiatives such as Reducing Emissions from Deforestation and Forest Degradation (REDD+), the Paris Climate Agreement, and the United Nations Sustainable Development Goals recognize the importance of maintaining and enhancing forest carbon stocks as part of broader climate-change mitigation efforts (Miah, 2020). Effective implementation of these initiatives requires reliable information on carbon distribution, ecosystem functioning, and the environmental factors that influence carbon storage across different forest ecosystems.
While extensive research has been conducted in tropical rainforests and protected forest reserves, comparatively little attention has been paid to sacred forests, particularly those found along the East African coast. Sacred forests are culturally protected landscapes that have historically been conserved through traditional beliefs, customary regulations, and indigenous management practices (Kandari et al., 2014). In Kenya, the Kaya forests represent some of the most important examples of such ecosystems. These forests are recognized as UNESCO World Heritage Sites due to their exceptional cultural significance and ecological value. Beyond their cultural importance, Kaya forests serve as biodiversity refugia, protect ecosystem services, regulate local microclimates, and potentially contribute substantially to carbon sequestration (Habel et al., 2023). Kaya Kauma Forest is one of the remaining sacred forests within the coastal forest mosaic of Kenya. Like many tropical forests worldwide, it faces increasing pressure from human activities occurring both within and around its boundaries (Mkuzi et al., 2026). Forest disturbance can alter vegetation structure, species composition, nutrient cycling processes, and ecosystem functioning, potentially influencing the capacity of forests to store and retain carbon. Disturbance effects may vary spatially, often creating gradients from heavily influenced forest edges to relatively intact interior areas (Harper et al., 2015; Sharma & Kumar, 2025). Understanding how carbon stocks and nutrient concentrations vary across such gradients is important for evaluating forest resilience and informing conservation interventions.
Aboveground biomass represents one of the most widely used indicators of forest carbon storage because it directly reflects the accumulation of carbon within woody vegetation. Variations in AGB are influenced by multiple ecological factors, including tree size distributions, species composition, stand structure, disturbance history, and environmental conditions (Lee et al., 2024). Large, mature trees frequently contribute disproportionately to ecosystem carbon stocks, emphasizing the importance of preserving structurally complex forest stands. Assessing aboveground carbon distribution therefore provides valuable insights into ecosystem functioning and standing aboveground carbon stocks (Zhang et al., 2023). Soil properties also play a fundamental role in ecosystem productivity and carbon–nutrient concentrations. The availability and vertical distribution of soil organic matter, total organic carbon, and nutrient availability play a fundamental role in regulating vegetation growth, root distribution, biological activity, decomposition processes, and nutrient cycling, thereby influencing overall ecosystem resilience (Pries et al., 2018). Understanding these patterns is particularly important in tropical forests where nutrient cycling is rapid and strongly influences ecosystem functioning.
In addition to living vegetation and soils, ecosystem carbon–nutrient concentrations are influenced by litter, deadwood, and regenerating vegetation. These components represent important pathways through which carbon and nutrients are transferred within forest ecosystems. Litter decomposition contributes to nutrient recycling and soil organic matter formation, while deadwood serves as a longer-term carbon reservoir due to its relatively slow decomposition rates. Regeneration materials (woody plants of less than 1.5m height) provide insights into future forest development and the capacity of ecosystems to sustain carbon storage over time (Krishna & Mohan, 2017; Löf et al., 2019). Despite the recognized ecological significance of Kaya forests, quantitative information regarding carbon storage patterns and soil nutrient concentrations remains limited. Existing studies have primarily focused on biodiversity conservation, ethnobotanical values, and forest management (Fungomeli & Habel, 2026), leaving important knowledge gaps concerning ecosystem carbon resilience and climate-regulation functions. Addressing these gaps is essential for strengthening the scientific basis of conservation planning and for demonstrating the broader environmental significance of sacred forest ecosystems.
The present study, therefore, aimed to quantify aboveground biomass and carbon stocks, characterize soil carbon–nutrient concentrations, and examine ecosystem nutrient patterns across edge-to-core spatial zones in Kaya Kauma Forest. Specifically, the study sought to: (i) quantify the distribution of aboveground biomass and carbon stocks across forest zones; (ii) evaluate spatial variation in soil carbon and nutrient properties along soil depth gradients; (iii) assess carbon and nutrient characteristics of litter, deadwood, and regeneration materials; and (iv) investigate relationships between forest carbon stocks and soil properties. By integrating vegetation and soil measurements, the study provides a comprehensive assessment of carbon storage patterns and ecosystem resilience within one of Kenya’s culturally and ecologically important forest landscapes.
2. Materials and Methods
2.1. Study Area and Sampling Design
This study was conducted in Kaya Kauma Forest, a sacred Mijikenda forest located in Kilifi County along the Kenyan coast (Figure 1). The forest forms part of the East African Coastal Forest biodiversity hotspot and is recognized as a UNESCO World Heritage Site because of its exceptional ecological and cultural significance. Despite its protected status, the forest experiences varying levels of human influence, including selective tree harvesting, fuelwood collection, agricultural encroachment, and edge-related degradation, which may influence forest structure and carbon storage (Fungomeli et al., 2025).
To examine spatial variation in forest carbon and nutrient characteristics, the forest was stratified into three edge-to-core spatial zones based on their relative position from the forest boundary. The Edge zone comprised plots A–D established approximately 10 m from the forest boundary, adjacent to surrounding agricultural land. The Intermediate zone comprised plots E–F located within the transitional forest interior, while the Core zone comprised plots G–J located in the interior sections of the forest, furthest from the forest boundary. The use of these spatial zones provided a framework for evaluating changes from the forest edge toward the interior and should not be interpreted as direct quantitative measures of disturbance intensity.
A stratified purposive sampling approach was used to establish permanent sampling plots within each spatial zone. Plot locations were selected to provide representative coverage of the forest while avoiding inaccessible areas and minimizing spatial overlap between sampling units. A total of ten permanent plots measuring 20 × 20 m (400 m²) were established, comprising four plots in the Edge zone, two plots in the Intermediate zone, and four plots in the Core zone. The three zones were separated by approximately 200 m to reduce spatial autocorrelation and improve representation of the forest. Only two plots were established in the Intermediate zone because steep slopes and difficult terrain prevented the safe establishment of additional permanent plots. This limitation is acknowledged when interpreting comparisons among forest zones.
Within each permanent plot, nested sampling units were established for vegetation measurements, litter collection, deadwood assessment, regeneration sampling, and soil sampling (Figure 2). The permanent 20 × 20 m plot constituted the experimental unit for all vegetation, biomass, carbon, soil, and statistical analyses, while the nested subplots were used solely for sampling the respective ecosystem components.
2.2. Aboveground Biomass and Carbon Assessment
A total of 385 individual trees representing 42 indigenous forest species were inventoried across the ten permanent sampling plots distributed among the edge, intermediate, and core forest zones of Kaya Kauma Forest. All trees with a diameter at breast height (DBH) of at least 5 cm occurring within the 20 × 20 m plots were identified to species level and measured following standard tropical forest inventory procedures (Chave et al., 2014). Diameter measurements were taken at 1.3 m above ground level using a diameter tape, while tree height was measured using a clinometer (Model: Suunto PM-5/360 PC). Species-specific wood density values were obtained from the Global Wood Density Database and supplementary published sources where necessary (Fischer et al., 2026). For data processing and biomass estimation, each inventoried tree was represented as a separate record in the analytical dataset, ensuring that the Chave et al. (2014) allometric equation was applied at the individual-tree level prior to aggregation of biomass estimates to species, plot, and forest-zone summaries. Aboveground biomass (AGB) was estimated using the pantropical allometric equation developed by Chave et al. (2014), which incorporates tree diameter, total height, and wood density to estimate individual-tree biomass:
AGB=0.0673×(ρD2 H)0.976,
where AGB is aboveground biomass (kg), ρ is wood density (g cm⁻³), D is diameter at breast height (cm), and H is total tree height (m). Individual-tree biomass estimates were aggregated at the plot level and subsequently standardized to a hectare basis (Mg ha⁻¹). Aboveground carbon (AGC) stocks were calculated using the Intergovernmental Panel on Climate Change (IPCC) default carbon fraction of 0.47:
AGC (Mg C ha⁻¹) = AGB (Mg ha⁻¹) × 0.47.
where AGC represents aboveground carbon stock expressed as Mg C ha⁻¹. The analytical workflow used for biomass and carbon estimation is summarized in Figure 3.
2.3. Soil Carbon–Nutrient Assessment
Soil samples were collected from five sampling points within each 20 × 20 m permanent plot, comprising the four plot corners and the plot centre. At each sampling point, soil was collected from four depth intervals (0–10, 10–20, 20–50, and 50–100 cm) to characterize vertical variation in soil carbon and nutrient concentrations. Each soil sample was processed and analysed individually; samples from different sampling points were not physically composited before laboratory analysis. For statistical analyses, the five analytical measurements corresponding to the same plot and soil depth were subsequently averaged to obtain a single representative plot-level value for each depth. Consequently, the 20 × 20 m sampling plot, rather than the individual soil sample, was treated as the experimental unit in all inferential statistical analyses.
Following collection, soil samples were air-dried, passed through a 2-mm sieve to remove roots and coarse materials, and finely ground to obtain a homogeneous powder suitable for laboratory analysis. All laboratory analyses were conducted at the Soil Science Laboratory of the Hungarian University of Agriculture and Life Sciences (MATE), Hungary.
Calcium carbonate (CaCO₃) content was determined separately for each soil sample using a volumetric calcimeter method with a modified Scheibler apparatus, based on the volume of carbon dioxide (CO₂) released following acid addition. Soil inorganic carbon (SIC) concentration was subsequently calculated from the measured CaCO₃ content using the carbon mass fraction of calcium carbonate:
Total carbon (TC), total nitrogen (TN), and total sulfur (TS) concentrations were determined simultaneously by high-temperature dry combustion using a vario MAX cube CNS analyser (Elementar Analysensysteme GmbH, Germany). Approximately 0.5 g of finely ground soil was analysed following calibration of the instrument according to the manufacturer's recommended procedures using certified calibration standards. Total organic carbon (TOC) concentration was calculated by subtracting soil inorganic carbon from total carbon:
which is equivalent to:
Soil organic matter (SOM) was not measured directly but was estimated from TOC using the Van Bemmelen conversion factor:
Carbon-to-nitrogen (C:N) ratios were subsequently calculated from the measured carbon and nitrogen concentrations on a mass basis to provide an indicator of soil organic matter stoichiometry. Since soil bulk density and coarse-fragment volume were not measured, soil organic carbon stocks (Mg C ha⁻¹) could not be calculated reliably. Consequently, all soil results presented in this study represent concentration-based measurements (%) rather than carbon stock estimates, and interpretations are therefore restricted to soil carbon and nutrient concentrations rather than total soil carbon storage.
2.4. Litter, Regeneration Material, and Deadwood Analyses
Litter, regeneration material, and deadwood samples were collected from their respective nested sampling units within each 20 × 20 m permanent plot and transported to the Soil Science Laboratory of the Hungarian University of Agriculture and Life Sciences (MATE) for elemental analysis. Upon arrival at the laboratory, samples were air-dried, cleaned of extraneous materials where necessary, finely ground to obtain a homogeneous powder, and prepared for carbon and nitrogen determination. Carbon (C%) and nitrogen (N%) concentrations were determined by dry combustion using a vario MAX cube CNS analyser (Elementar Analysensysteme GmbH, Germany), following the same analytical procedures used for soil analyses. The instrument was calibrated according to the manufacturer's recommendations before analysis to ensure measurement accuracy and consistency. Carbon-to-nitrogen (C:N) ratios were subsequently calculated from the measured carbon and nitrogen concentrations to characterize the elemental composition of each ecosystem component.
Litter represents the primary pathway through which organic matter and nutrients enter the soil system, regeneration material reflects carbon allocation within developing vegetation, and deadwood constitutes an intermediate component linking living biomass and soil organic matter through decomposition processes (Yan et al., 2018; Wijas et al., 2024). Because only carbon and nitrogen concentrations were determined for these components, interpretations are limited to their elemental composition and nutrient status rather than estimates of carbon stocks or sequestration. The ecosystem compartments analysed and their ecological significance are summarized in Table 1.
2.5. Statistical Analyses
All statistical analyses were conducted using R version 4.5.2 (R Core Team, 2025). Aboveground biomass (AGB) and aboveground carbon (AGC) estimates were summarized by ecological zone using descriptive statistics, including means, standard deviations, and standard errors. Soil physicochemical variables were summarized by ecological zone and soil depth to characterize horizontal and vertical variation in carbon and nutrient concentrations. Carbon and nitrogen concentrations of litter, regeneration material, and deadwood were similarly summarized across the three ecological zones. Differences among ecological zones were evaluated using the Kruskal–Wallis test because of the relatively small sample size and the non-normal distribution of several response variables (Strimbu et al., 2009). Variables evaluated included AGB, AGC, total organic carbon (TOC), soil organic matter (SOM), and total nitrogen (TN). The 20 × 20 m permanent sampling plot constituted the experimental unit for all inferential statistical analyses. For soil variables, measurements obtained from the five sampling points within each plot were averaged to generate a representative value for each soil depth before statistical analysis. Vertical soil-depth patterns are therefore presented as descriptive observations, as no inferential analysis of soil depth or zone × depth interactions was undertaken.
To examine relationships between aboveground carbon stocks and soil properties, the four depth-specific plot means (0–10, 10–20, 20–50, and 50–100 cm) were subsequently averaged to generate a single representative soil value for each sampling plot. These plot-level mean concentrations were then used in simple linear regression analyses to ensure consistency between the aboveground vegetation dataset and the corresponding soil measurements. Soil organic matter (SOM) was derived directly from TOC using the Van Bemmelen conversion factor (1.724). Separate exploratory regression models were therefore fitted for TOC, SOM, total nitrogen (TN), and calcium carbonate (CaCO₃), recognizing that TOC and SOM are not statistically independent. Aboveground carbon stock (AGC) was treated as the response variable in each model. Model performance was evaluated using the coefficient of determination (R²) and the associated p-value, with statistical significance assessed at α = 0.05. Given that only ten independent sampling plots were available, the regression analyses are presented as exploratory and should be interpreted cautiously. A summary of all statistical analyses conducted in this study is presented in Table 2.
3. Results
3.1. Aboveground Biomass and Carbon Stocks
A total of 385 individual trees representing 42 indigenous forest species were inventoried across ten permanent sampling plots distributed within the edge, intermediate, and core zones of Kaya Kauma Sacred Forest. Only two plots were established in the intermediate zone because of the steep terrain and limited accessibility of this transitional habitat. Plot-level aboveground biomass (AGB) and aboveground carbon (AGC) varied considerably among sampling locations (Figure 4a and Figure 4b), reflecting spatial heterogeneity in forest structure and species composition.
Mean AGB ranged from 163.9 ± 36.8 Mg ha⁻¹ in the intermediate zone to 222.5 ± 34.3 Mg ha⁻¹ in the edge zone, while the core zone recorded a mean AGB of 206.1 ± 34.8 Mg ha⁻¹ (Table 3). Corresponding mean AGC values were 77.0 ± 17.3 Mg C ha⁻¹, 104.6 ± 16.1 Mg C ha⁻¹, and 96.9 ± 16.4 Mg C ha⁻¹ for the intermediate, edge, and core zones, respectively. Although the edge zone recorded the highest mean biomass and carbon stocks, Kruskal–Wallis tests revealed no statistically significant differences among forest zones for either AGB (H = 2.373, df = 2, p = 0.305) or AGC (H = 2.373, df = 2, p = 0.305). These findings indicate that no statistically significant differences in aboveground biomass or aboveground carbon stocks were detected among the three spatial zones under the present sampling design. The lower mean biomass and carbon stocks observed in the intermediate zone should be interpreted cautiously because this zone was represented by only two independent plots, resulting in greater uncertainty around the estimated means.
3.2. Species Contributions to Forest Carbon Storage
Tree species differed markedly in their contributions to total aboveground carbon storage. A relatively small number of large-stature canopy species accounted for a substantial proportion of the forest's total AGC. The ten highest carbon-storing species collectively represented a large share of the total aboveground carbon stock (Table 4). Species with larger stem diameters and greater aboveground biomass contributed disproportionately to total carbon accumulation, highlighting the importance of mature canopy trees in maintaining ecosystem carbon stocks. These findings indicate that a relatively small number of mature canopy species contributed a substantial proportion of the measured aboveground carbon stock. Forest structure and species composition may contribute to this pattern, although these factors were not formally evaluated in the present study.
3.3. Soil Carbon and Nutrient Characteristics Along Vertical Profiles
Descriptively, soil carbon and nutrient concentrations generally decreased with increasing soil depth across all forest zones (Table 5; Figure 5). Total organic carbon (TOC), total nitrogen (TN), and soil organic matter (SOM) concentrations were highest in the surface soils and generally declined with increasing depth. In the edge zone, mean TOC decreased from 2.08% in the 0–10 cm layer to 0.45% in the 50–100 cm layer. Similar patterns were observed in the intermediate zone, where TOC declined from 2.14% to 0.25%, and in the core zone, where values decreased from 2.07% to 0.62% across the same depth intervals (Table 5). Soil organic matter followed a similar trend, although appreciable SOM concentrations were maintained within the 20–50 cm depth interval across all zones, averaging 1.97%, 1.99%, and 2.27% in the edge, intermediate, and core zones, respectively. Soil inorganic carbon (SIC) and calcium carbonate (CaCO₃) generally occurred at low concentrations in the intermediate and core zones but increased with depth in the edge zone. The soil C:N ratio ranged from 7.91 to 17.11, with the highest values observed in the deepest soils of the edge zone (Table 5).
Kruskal–Wallis tests detected no statistically significant differences among forest zones for TOC (H = 2.260, p = 0.322), SOM (H = 2.260, p = 0.322), or total nitrogen (H = 0.218, p = 0.897). The core zone generally exhibited slightly higher TOC and SOM concentrations in the deeper soil layers than the edge and intermediate zones; however, these differences were not statistically significant among forest zones. Carbon and nitrogen concentrations also varied among the forest detrital components (Table 6). Among these components, deadwood had the highest observed C:N ratios (39.05–50.57), whereas regeneration material exhibited the highest nitrogen concentrations (1.97–2.53%). Litter nitrogen was the only variable that differed significantly among forest zones (H = 6.873, p = 0.032), with the highest concentration recorded in the core zone (1.55%). No significant zonal differences were observed for carbon concentration or C:N ratio in deadwood, litter, or regeneration material (all p > 0.05).
3.4. Carbon and Nutrient Concentrations of Litter, Deadwood, and Regeneration Components
Carbon and nitrogen concentrations differed among ecosystem components, reflecting differences in elemental composition among ecosystem components (Pellegrini et al., 2020) (Figure 6; Table 6). Deadwood exhibited the highest mean carbon concentrations, ranging from 35.20% in the intermediate zone to 41.71% in the core zone, while litter carbon concentrations ranged from 30.84% to 38.83% across forest zones. Regeneration material contained intermediate carbon concentrations, varying between 35.98% and 40.64%. Nitrogen concentrations displayed the opposite pattern, with regeneration material recording the highest nitrogen concentrations (1.97–2.53%) and deadwood the lowest (0.87–0.93%). Consequently, deadwood exhibited substantially higher C:N ratios (39.05–50.57) than litter (24.34–28.39) and regeneration material (17.00–18.39), indicating marked differences in tissue stoichiometry among ecosystem components.
Kruskal–Wallis tests revealed that litter total nitrogen was the only variable that differed significantly among forest zones (H = 6.873, p = 0.032), with the highest concentration recorded in the core zone (1.55%). No significant zonal differences were observed for carbon concentration or C:N ratio in deadwood, litter, or regeneration material, nor for nitrogen concentrations in deadwood and regeneration material (all p > 0.05) (Table 6).
3.5. Relationships Between Aboveground Carbon Stocks and Soil Carbon–Nutrient Variables
Linear regression analyses were performed to examine the relationships between aboveground carbon stocks (AGC) and selected soil carbon–nutrient variables, including total organic carbon (TOC), total nitrogen (TN), soil organic matter (SOM), and calcium carbonate (CaCO₃) concentrations (Figure 7). For each sampling plot, soil measurements from the four sampling depths (0–10, 10–20, 20–50, and 50–100 cm) were averaged to obtain representative plot-level values for regression analysis.
The regression analyses revealed weak and statistically non-significant relationships between AGC and all measured soil variables. Aboveground carbon showed no significant relationship with TOC (R² = 0.005, p = 0.844) (Figure 7A), TN (R² < 0.001, p = 0.951) (Figure 7B), or SOM (R² = 0.005, p = 0.844) (Figure 7C). Although the relationship between AGC and CaCO₃ explained a slightly greater proportion of the variation (R² = 0.159), it also remained statistically non-significant (p = 0.253) (Figure 7D). Overall, the scatterplots indicated weak and statistically non-significant linear relationships between aboveground carbon stocks and the measured soil carbon–nutrient variables across the sampled plots.
4. Discussion
4.1. Distribution of Aboveground Biomass and Carbon Stocks Across Edge-to-Core Spatial Zones
The present study quantified aboveground biomass (AGB) and aboveground carbon (AGC) stocks across the edge, intermediate, and core spatial zones of Kaya Kauma Sacred Forest. Although the edge zone recorded the highest mean AGB (222.5 ± 34.3 Mg ha⁻¹) and AGC (104.6 ± 16.1 Mg C ha⁻¹), followed by the core and intermediate zones, Kruskal–Wallis tests detected no statistically significant differences among the three spatial zones. These findings indicate that no statistically significant differences in aboveground biomass or carbon stocks were detected under the present sampling design. Given the relatively small number of independent sampling plots, particularly in the intermediate zone (n = 2), these results should be interpreted cautiously.
The biomass values observed in Kaya Kauma are comparable to those reported for other tropical and coastal forests, where mature stands frequently maintain substantial aboveground carbon stocks despite variation in species composition and stand structure (Pan et al., 2013; Melito et al., 2018; Frire & de Mendonça, 2025). Differences in aboveground biomass among tropical forests are commonly associated with variation in tree size distributions, species composition, stand age, disturbance history, and local environmental conditions (Ali, 2019). Although these variables were not formally evaluated in the present study, they may partly explain the numerical variation observed among sampling plots.
Species-level analyses further showed that a relatively small number of canopy tree species, including Julbernardia magnistipulata, Olea capensis, Brachystegia spiciformis, Combretum illairii, Cynometra webberi, and Terminalia spinosa, contributed a substantial proportion of the measured aboveground carbon stock. Similar patterns have been reported in tropical forests worldwide, where a limited number of large canopy-forming species account for a disproportionate share of ecosystem biomass because of their large stem dimensions and longevity (Pan et al., 2013; Li et al., 2026). These findings highlight the importance of conserving mature canopy trees that contribute substantially to standing aboveground carbon stocks.
4.2. Vertical Patterns of Soil Carbon and Nutrient Concentrations
Descriptively, soil carbon and nutrient concentrations generally declined with increasing soil depth across the three spatial zones. Total organic carbon (TOC), total nitrogen (TN), and soil organic matter (SOM) concentrations were consistently highest in the surface horizons and decreased towards deeper soil layers. This pattern is characteristic of forest soils, where surface horizons receive continuous inputs of leaf litter, fine roots, woody debris, and microbial residues, resulting in the accumulation of organic matter and associated nutrients (Lal, 2018; Nair et al., 2022).
Although lower concentrations were generally observed with increasing depth, appreciable SOM concentrations were maintained within the 20–50 cm depth interval across all zones. This observation indicates that measurable organic matter remained present below the surface horizons throughout the forest. Soil inorganic carbon (SIC) and calcium carbonate (CaCO₃) concentrations remained relatively low in the intermediate and core zones but tended to increase with depth in the edge zone.
Kruskal–Wallis tests detected no statistically significant differences among forest zones for TOC (H = 2.260, p = 0.322), SOM (H = 2.260, p = 0.322), or total nitrogen (H = 0.218, p = 0.897). These findings indicate that no statistically significant zonal differences in soil carbon and nutrient concentrations were detected under the present sampling design. Because inferential analyses of soil depth and zone × depth interactions were not undertaken, the observed vertical patterns should be regarded as descriptive observations rather than statistically tested depth effects. Similar depth-related declines in soil organic carbon and nitrogen concentrations have been reported in tropical forest ecosystems, reflecting the concentration of organic inputs within the biologically active surface horizons (Yang et al., 2022; Li et al., 2023).
4.3. Carbon and Nitrogen Characteristics of Litter, Deadwood, and Regeneration Material
Carbon and nitrogen concentrations differed among litter, deadwood, and regeneration material, reflecting differences in the elemental composition of these ecosystem components (Pellegrini et al., 2020). Deadwood exhibited the highest observed C:N ratios, whereas regeneration material contained the highest nitrogen concentrations. Litter displayed intermediate C:N ratios and lower nitrogen concentrations than regeneration material.
Only litter nitrogen concentration differed significantly among forest zones, with the highest value recorded in the core zone. Carbon concentrations and C:N ratios did not differ significantly among zones for litter, deadwood, or regeneration material. These findings indicate that the elemental composition of these ecosystem components was broadly comparable across the sampled spatial zones.
Differences in C:N ratios among ecosystem components are consistent with variation in tissue chemistry reported for tropical forests (Giweta, 2020; Ostrowska & Porębska, 2015). Woody tissues generally contain proportionally greater amounts of structural compounds than actively growing plant tissues, whereas regeneration material commonly contains higher nitrogen concentrations associated with metabolically active tissues (Pellegrini et al., 2020). Although C:N ratios are widely used as indicators of substrate quality and potential decomposition characteristics (Wijas et al., 2024), the present study did not quantify biomass, decomposition rates, carbon residence times, or the sizes of these ecosystem carbon pools. Consequently, these results should be interpreted as differences in elemental composition and stoichiometric characteristics rather than direct evidence of carbon turnover or carbon storage within these ecosystem components.
4.4. Relationships between Aboveground Carbon Stocks and Soil Carbon–Nutrient Variables
Exploratory regression analyses detected no statistically significant linear relationships between aboveground carbon stocks and the measured soil carbon–nutrient variables. Although the fitted models explained a proportion of the observed variation in AGC, none of the individual soil variables (TOC, SOM, total nitrogen, or CaCO₃) significantly predicted aboveground carbon stocks at the plot level.
Several ecological factors may contribute to the absence of statistically significant relationships. Aboveground carbon stocks in mature forests are frequently influenced by multiple interacting factors, including stand structure, species composition, tree age, and historical site conditions (Rodríguez-Soalleiro et al., 2018; Yuan et al., 2018). However, these variables were not formally evaluated in the present study and therefore should be regarded as possible explanations rather than demonstrated drivers of the observed patterns. Similarly, nutrient uptake and recycling processes may influence the relationship between vegetation and soil properties in mature tropical forests (Zhao & Riaz, 2024), although these processes were not directly measured in this study.
The regression analyses were based on ten independent sampling plots and should therefore be regarded as exploratory. Consequently, the absence of statistically significant relationships should not be interpreted as evidence that soil properties are unimportant for aboveground carbon stocks. Rather, the results indicate that no statistically significant linear relationships between plot-level aboveground carbon stocks and the measured soil carbon–nutrient concentrations were detected under the present sampling design. Future studies incorporating larger sample sizes, additional vegetation structural variables, and repeated measurements would provide a more comprehensive understanding of the factors associated with variation in aboveground carbon stocks (Jackson et al., 2017).
5. Conclusions
This study provides a baseline assessment of aboveground biomass, aboveground carbon stocks, and soil carbon–nutrient concentrations across the edge, intermediate, and core spatial zones of Kaya Kauma Sacred Forest. Although the edge zone recorded the highest mean aboveground biomass and carbon stocks, no statistically significant differences were detected among the three spatial zones under the present sampling design. Soil carbon and nutrient concentrations generally decreased with increasing depth, while no significant differences in TOC, SOM, or total nitrogen concentrations were detected among forest zones. Differences in carbon and nitrogen concentrations and C:N ratios were observed among litter, deadwood, and regeneration material, with litter nitrogen being the only variable that differed significantly among the spatial zones. Exploratory regression analyses detected no statistically significant linear relationships between aboveground carbon stocks and the measured soil carbon–nutrient concentrations. Although forest structure, species composition, and stand history may contribute to variation in aboveground carbon stocks, these factors were not evaluated in the present study and therefore remain potential explanations rather than demonstrated drivers. The findings provide baseline information on aboveground carbon stocks and soil carbon–nutrient characteristics in Kaya Kauma Sacred Forest that can support future conservation and forest management initiatives. Conservation efforts should continue to protect mature canopy trees, support natural regeneration, and minimize anthropogenic disturbances that may alter forest structure. Future studies should quantify belowground carbon stocks through the inclusion of soil bulk density measurements, incorporate larger sample sizes, and establish long-term monitoring across multiple Kaya forests to improve understanding of spatial and temporal variation in forest carbon and soil nutrient characteristics.
Declaration of generative AI: During the preparation of this manuscript, the authors used AI-assisted tools for editing and refining the R script. All outputs were reviewed and verified by the authors, who take full responsibility for the final content.
Funding
The authors acknowledge the financial support of the Stipendium Hungaricum Scholarship, Number 22_473819. This work was supported by the Doctoral School of Environmental Sciences (Gödöllő), Hungarian University of Agriculture and Life Sciences, MATE, and the Flagship Research Groups Program 2024 and the Research Excellence Program 2025 of the Hungarian University of Agriculture and Life Sciences.
Acknowledgments
The authors gratefully acknowledge Mr. Lawrence Tunje Chiro of Coastal Forest Conservation Unit (CFCU), Nation Museums of Kenya, for his invaluable local knowledge, logistical support, and assistance during fieldwork in Kaya Kauma Sacred Forest. His contribution to the planning and implementation of field activities was highly appreciated and contributed significantly to the successful completion of this research.
Conflicts of interest
The authors declare the following financial interests/personal relationships which may be considered as potential competing interests: Hamisi Tsama, Mkuzi reports financial support, administrative support, article publishing charges, equipment, drugs, or supplies, and travel were provided by Stipendium Hungaricum Scholarship. Hamisi Tsama Mkuzi reports a relationship with Stipendium Hungaricum Scholarship that includes: funding grants and non-financial support. If there are other authors, they declare that they have no known competing financial interests or personal relationships that could have appeared to influence the work reported in this paper.
Abbreviations
The following abbreviations are used in this manuscript:
| AGB | Aboveground Biomass |
| AGC | Aboveground Carbon |
| C | Carbon |
| C:N | Carbon-to-Nitrogen Ratio |
| CaCO₃ | Calcium Carbonate |
| CC BY | Creative Commons Attribution |
| CNS | Carbon, Nitrogen and Sulfur Analyzer |
| DBH | Diameter at Breast Height |
| IPCC | Intergovernmental Panel on Climate Change |
| Mg | Megagram |
| N | Nitrogen |
| REDD+ | Reducing Emissions from Deforestation and Forest Degradation |
| R² | Coefficient of Determination |
| SIC | Soil Inorganic Carbon |
| SD | Standard Deviation |
| SE | Standard Error |
| SOM | Soil Organic Matter |
| TC | Total Carbon |
| TN | Total Nitrogen |
| TOC | Total Organic Carbon |
| UNESCO | United Nations Educational, Scientific and Cultural Organization |
References
- Chave, J.; Réjou-Méchain, M.; Búrquez, A.; Chidumayo, E.; Colgan, M. S.; Delitti, W. B.; Vieilledent, G. Improved allometric models to estimate the aboveground biomass of tropical trees. Global change biology 2014, 20(10), 3177–3190. [Google Scholar] [CrossRef]
- Fischer, F. J.; Chave, J.; Zanne, A.; Jucker, T.; Fajardo, A.; Fayolle, A.; Zieminska, K. Global Wood Density Database 2026, v. 2((GWDD v. 2). [CrossRef]
- Frire, G. F.; de Mindonça, F. Role of Community-Managed Forests in Enhancing Carbon Sequestration and Rural Climate Resilience. National Journal of Forest Sustainability and Climate Change 2025, 54–61. [Google Scholar]
- Fungomeli, M.; Mensuro, G.; Kioko, E. Land use and land cover changes in the Mijikenda Kaya sacred forests of Coastal Kenya: impacts on culture and conservation of UNESCO World Heritage Sites. 2025. [Google Scholar] [CrossRef] [PubMed]
- Fungomeli, M.; Habel, J. C. Informal conservation institutions and biodiversity protection: Insights from sacred Kaya forests in Coastal Kenya. SSRN 2026. [Google Scholar] [CrossRef]
- Giweta, M. Role of litter production and its decomposition, and factors affecting the processes in a tropical forest ecosystem: a review. Journal of Ecology and Environment 2020, 44(1), 11. [Google Scholar] [CrossRef]
- Harper, K. A.; Macdonald, S. E.; Mayerhofer, M. S.; Biswas, S. R.; Esseen, P. A.; Hylander, K.; Bergeron, Y. Edge influence on vegetation at natural and anthropogenic edges of boreal forests in C anada and F ennoscandia. Journal of Ecology 2015, 103(3), 550–562. [Google Scholar] [CrossRef]
- Jackson, R. B.; Lajtha, K.; Crow, S. E.; Hugelius, G.; Kramer, M. G.; Piñeiro, G. The ecology of soil carbon: pools, vulnerabilities, and biotic and abiotic controls. Annual review of ecology, evolution, and systematics 2017, 48, 419–445. [Google Scholar] [CrossRef]
- Kandari, L. S.; Bisht, V. K.; Bhardwaj, M.; Thakur, A. K. Conservation and management of sacred groves, myths and beliefs of tribal communities: a case study from north-India. Environmental Systems Research 2014, 3(1), 16. [Google Scholar] [CrossRef]
- Krishna, M. P.; Mohan, M. Litter decomposition in forest ecosystems: a review. Energy, Ecology and Environment 2017, 2(4), 236–249. [Google Scholar] [CrossRef]
- Lal, R. Digging deeper: A holistic perspective of factors affecting soil organic carbon sequestration in agroecosystems. Global change biology 2018, 24(8), 3285–3301. [Google Scholar] [CrossRef] [PubMed]
- Lee, Y. J.; Park, G. E.; Lee, H. I.; Lee, C. B. Stand age-driven tree size variation and stand type regulate aboveground biomass in alpine-subalpine forests, South Korea. Science of The Total Environment 2024, 915, 170063. [Google Scholar] [CrossRef] [PubMed]
- Li, Q.; Wang, L.; Fu, Y.; Lin, D.; Hou, M.; Li, X.; Wang, Z. Transformation of soil organic matter subjected to environmental disturbance and preservation of organic matter bound to soil minerals: a review. Journal of Soils and Sediments 2023, 23(3), 1485–1500. [Google Scholar]
- Li, J.; Dong, L.; Fan, M.; Shangguan, Z. Long-term vegetation restoration promotes lignin phenol preservation and microbial anabolism in forest plantations: Implications for soil organic carbon dynamics. Science of The Total Environment 2024, 928, 172635. [Google Scholar] [CrossRef] [PubMed]
- Li, Y.; Zhang, M.; An, Y.; Wang, L.; Xing, X.; Tong, S.; Song, K. Integrated controls of soil and vegetation dynamics on soil organic and inorganic carbon covariation in grazed alpine wetlands. Plant and Soil 2025, 517(1), 917–935. [Google Scholar] [CrossRef]
- Li, Z.; Fang, W.; Cai, Q.; Ma, S.; Zhao, Z.; Li, Q.; Zhang, Z. Context-dependent forest carbon storage: A shift in dominance from structural complexity to large-sized trees across disturbance gradients. Forest Ecology and Management 2026, 600, 123309. [Google Scholar] [CrossRef]
- Löf, M.; Madsen, P.; Metslaid, M.; Witzell, J.; Jacobs, D. F. Restoring forests: regeneration and ecosystem function for the future. New Forests 2019, 50(2), 139–151. [Google Scholar] [CrossRef]
- Melito, M.; Metzger, J. P.; de Oliveira, A. A. Landscape-level effects on aboveground biomass of tropical forests: A conceptual framework. Global change biology 2018, 24(2), 597–607. [Google Scholar] [CrossRef] [PubMed]
- Miah, M. D. Reducing emissions from deforestation and forest degradation (REDD+). In Life on land; Springer International Publishing: Cham, 2020; pp. 797–807. [Google Scholar]
- Mkuzi, H. T.; Fuchs, M.; Ocansey, C. M.; Gulyás, M.; Sebők, A.; Takács, A.; Boros, N. Regeneration Dynamics and Diversity Patterns Across Disturbance Gradients in Kaya Kauma Forest, Coastal Kenya. Trees, Forests and People 2026, 101262. [Google Scholar]
- Nair, P. R.; Kumar, B. M.; Nair, V. D. Soil organic matter (SOM) and nutrient cycling. In An introduction to agroforestry: Four decades of scientific developments; Springer International Publishing: Cham, 2022; pp. 383–411. [Google Scholar]
- Nunes, L. J.; Meireles, C. I.; Pinto Gomes, C. J.; Almeida Ribeiro, N. M. Forest contribution to climate change mitigation: Management oriented to carbon capture and storage. Climate 2020, 8(2), 21. [Google Scholar] [CrossRef]
- Ostrowska, A.; Porębska, G. Assessment of the C/N ratio as an indicator of the decomposability of organic matter in forest soils. Ecological Indicators 2015, 49, 104–109. [Google Scholar] [CrossRef]
- Pan, Y.; Birdsey, R. A.; Phillips, O. L.; Jackson, R. B. The structure, distribution, and biomass of the world's forests. Annual review of ecology, evolution, and systematics 2013, 44(1), 593–622. [Google Scholar] [CrossRef]
- Pellegrini, A. F.; Hobbie, S. E.; Reich, P. B.; Jumpponen, A.; Brookshire, E. J.; Caprio, A. C.; Jackson, R. B. Repeated fire shifts carbon and nitrogen cycling by changing plant inputs and soil decomposition across ecosystems. Ecological Monographs 2020, 90(4), e01409. [Google Scholar] [CrossRef]
- Pries, C. E. H.; Sulman, B. N.; West, C.; O'Neill, C.; Poppleton, E.; Porras, R. C.; Torn, M. S. Root litter decomposition slows with soil depth. Soil Biology and Biochemistry 2018, 125, 103–114. [Google Scholar] [CrossRef]
- Rodríguez-Soalleiro, R.; Eimil-Fraga, C.; Gómez-García, E.; García-Villabrille, J. D.; Rojo-Alboreca, A.; Muñoz, F.; Pérez-Cruzado, C. Exploring the factors affecting carbon and nutrient concentrations in tree biomass components in natural forests, forest plantations and short rotation forestry. Forest Ecosystems 2018, 5(1), 35. [Google Scholar] [CrossRef]
- Sharma, S. K.; Kumar, K. Forest Fire Effects on Structure, Composition, and Functioning of Ecosystem. In Forest Fire and Climate Change: Insights into Science; Springer Nature Switzerland: Cham, 2025; pp. 79–99. [Google Scholar]
- Strimbu, B.; Hickey, G.; Strimbu, V.; Innes, J. On the use of statistical tests with non-normally distributed data in landscape change detection. Forest Science 2009, 55(1), 72–83. [Google Scholar] [CrossRef]
- Wijas, B. J.; Allison, S. D.; Austin, A. T.; Cornwell, W. K.; Cornelissen, J. H. C.; Eggleton, P.; Zanne, A. E. The role of deadwood in the carbon cycle: Implications for models, forest management, and future climates. Annual Review of Ecology, Evolution, and Systematics 2024, 55(1), 133–155. [Google Scholar] [CrossRef]
- Yan, J.; Wang, L.; Hu, Y.; Tsang, Y. F.; Zhang, Y.; Wu, J.; Sun, Y. Plant litter composition selects different soil microbial structures and in turn drives different litter decomposition pattern and soil carbon sequestration capability. Geoderma 2018, 319, 194–203. [Google Scholar] [CrossRef]
- Yang, K.; Zhu, J.; Zhang, W.; Zhang, Q.; Lu, D.; Zhang, Y.; Wang, G. G. Litter decomposition and nutrient release from monospecific and mixed litters: Comparisons of litter quality, fauna and decomposition site effects. Journal of Ecology 2022, 110(7), 1673–1686. [Google Scholar] [CrossRef]
- Yuan, Z.; Wang, S.; Ali, A.; Gazol, A.; Ruiz-Benito, P.; Wang, X.; Loreau, M. Aboveground carbon storage is driven by functional trait composition and stand structural attributes rather than biodiversity in temperate mixed forests recovering from disturbances. Annals of Forest Science 2018, 75(3), 67. [Google Scholar] [CrossRef]
- Zhang, D.; Zhao, Y.; Wu, J. Assessment of carbon balance attribution and carbon storage potential in China's terrestrial ecosystem. Resources, Conservation and Recycling 2023, 189, 106748. [Google Scholar] [CrossRef]
- Zhao, S.; Riaz, M. Plant–soil interactions and nutrient cycling dynamics in tropical rainforests. In Environment, climate, plant and vegetation growth; Springer Nature Switzerland: Cham, 2024; pp. 229–264. [Google Scholar]
Figure 1.
Location of Kaya Kauma Forest and spatial distribution of sampling plots.
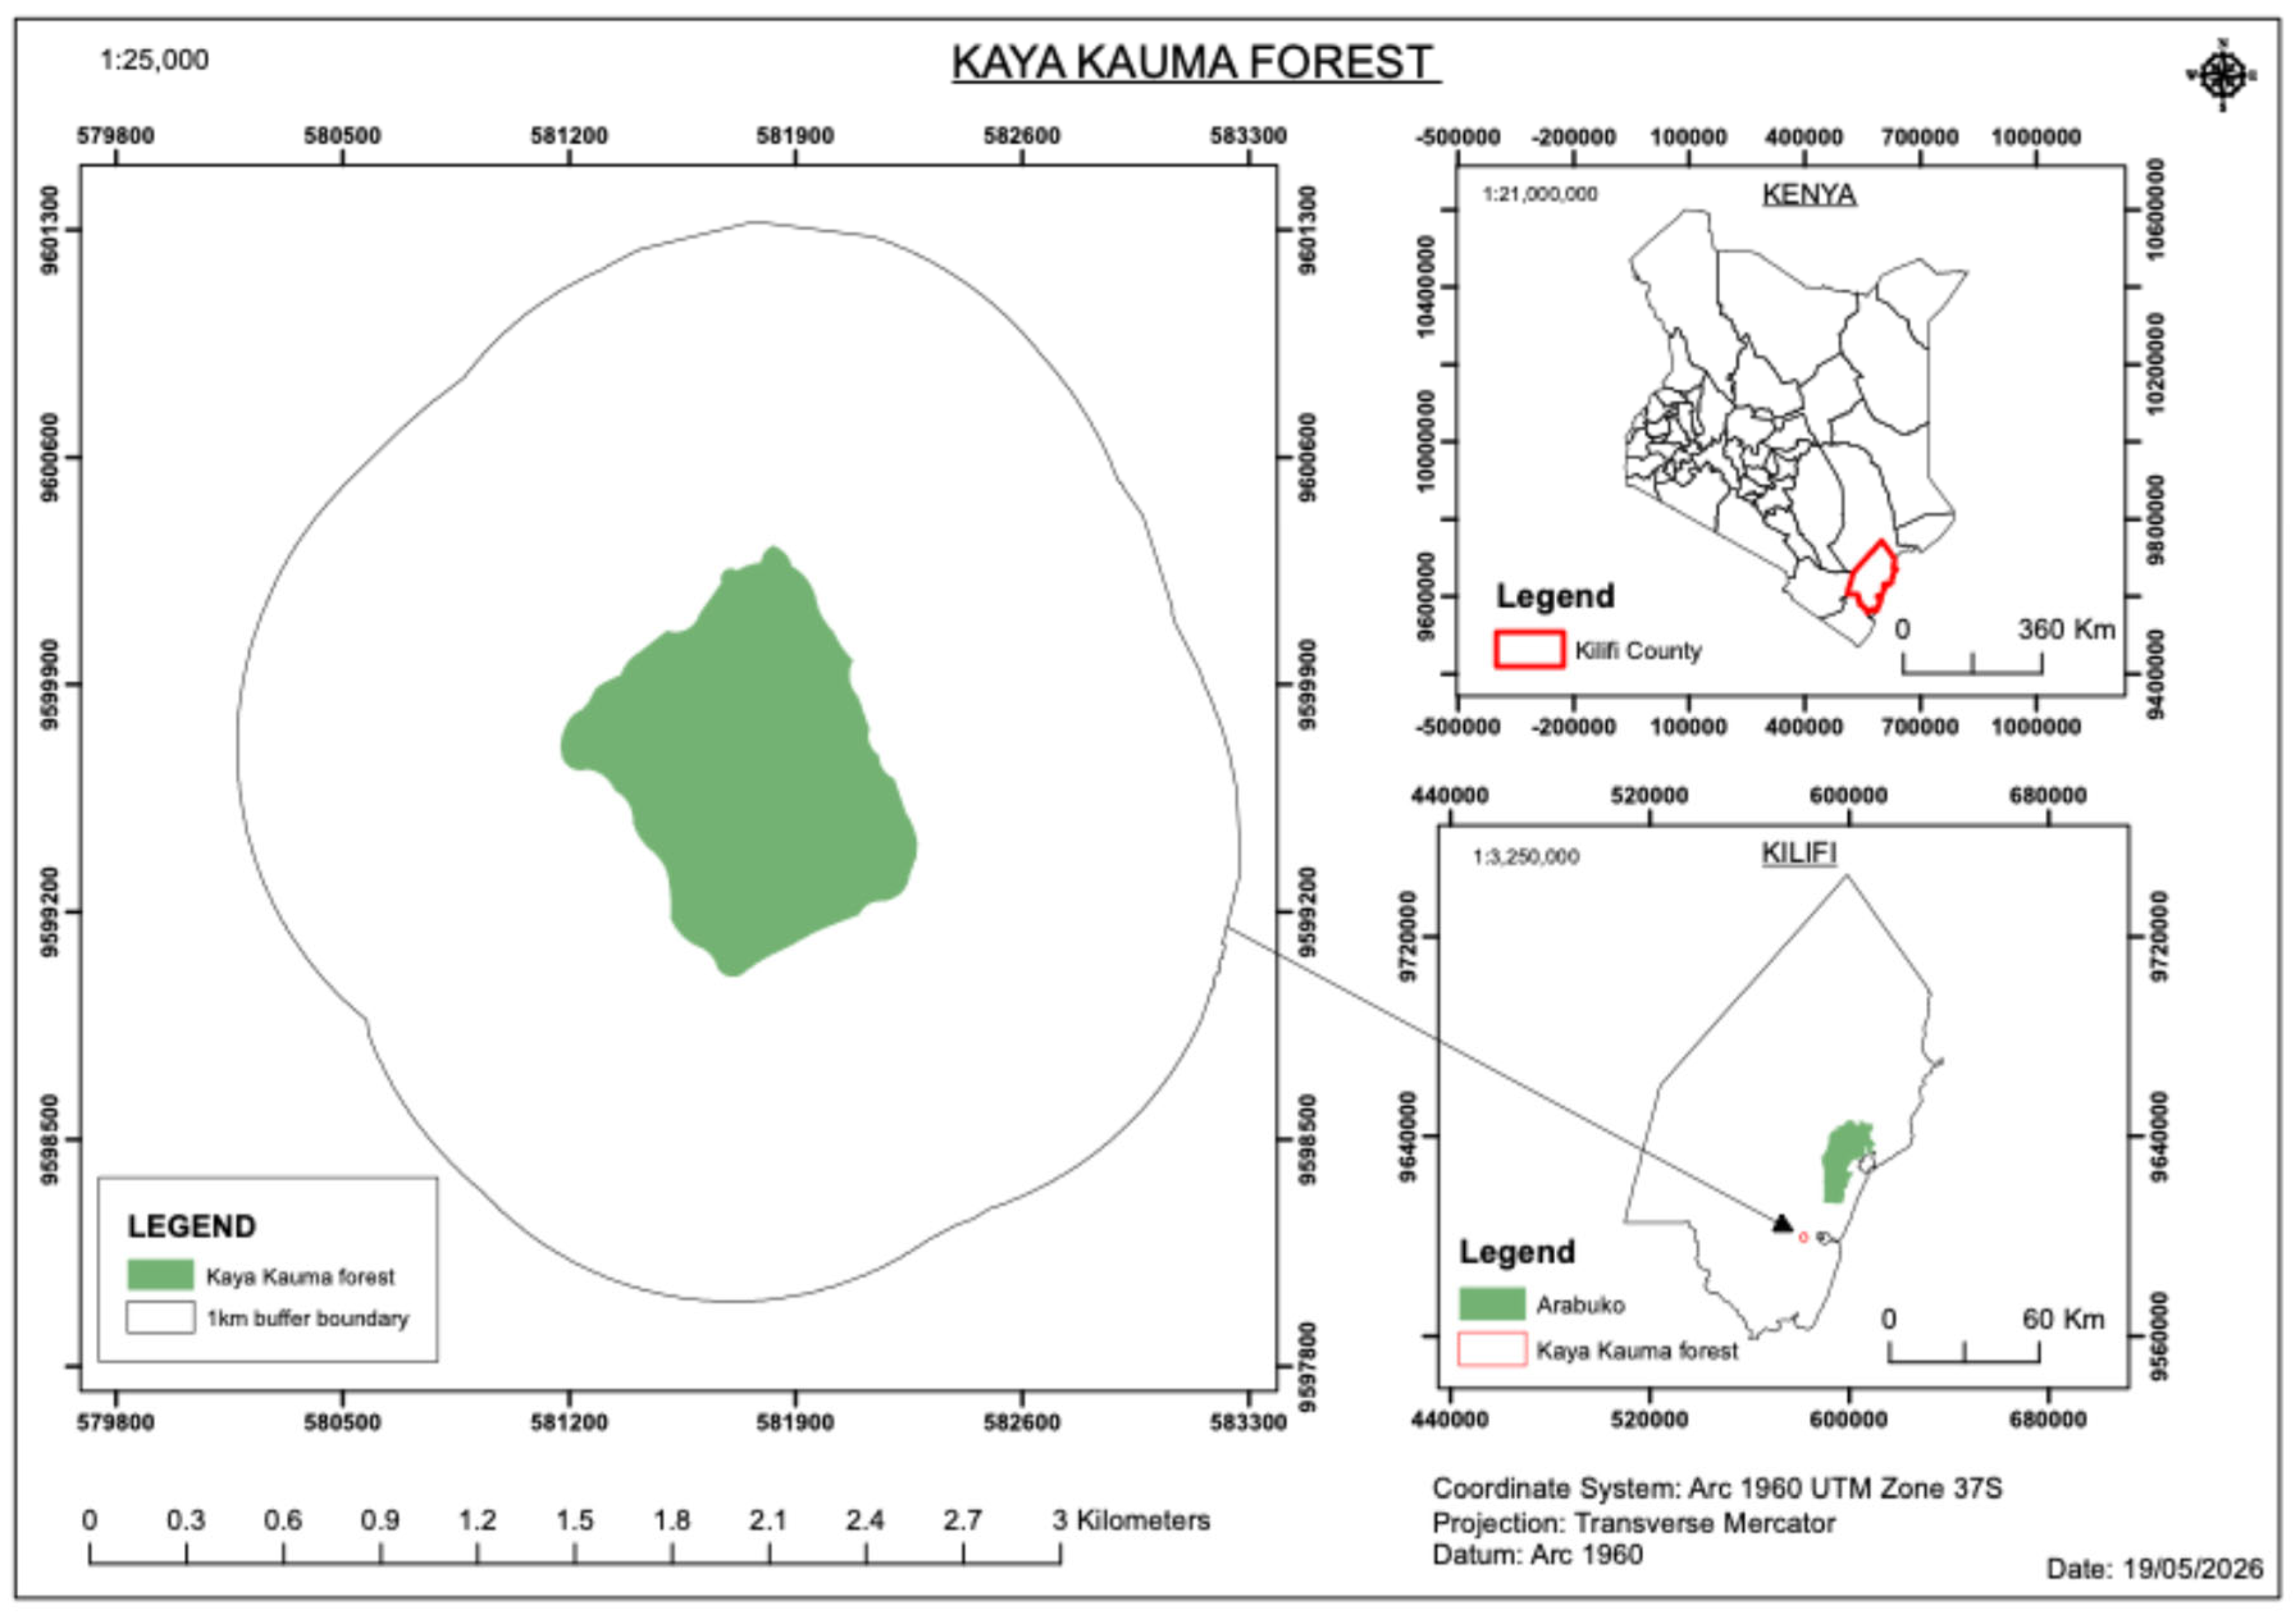
Figure 2.
Nested sampling design showing the arrangement of vegetation, litter, deadwood, regeneration, and soil sampling units.
Figure 2.
Nested sampling design showing the arrangement of vegetation, litter, deadwood, regeneration, and soil sampling units.
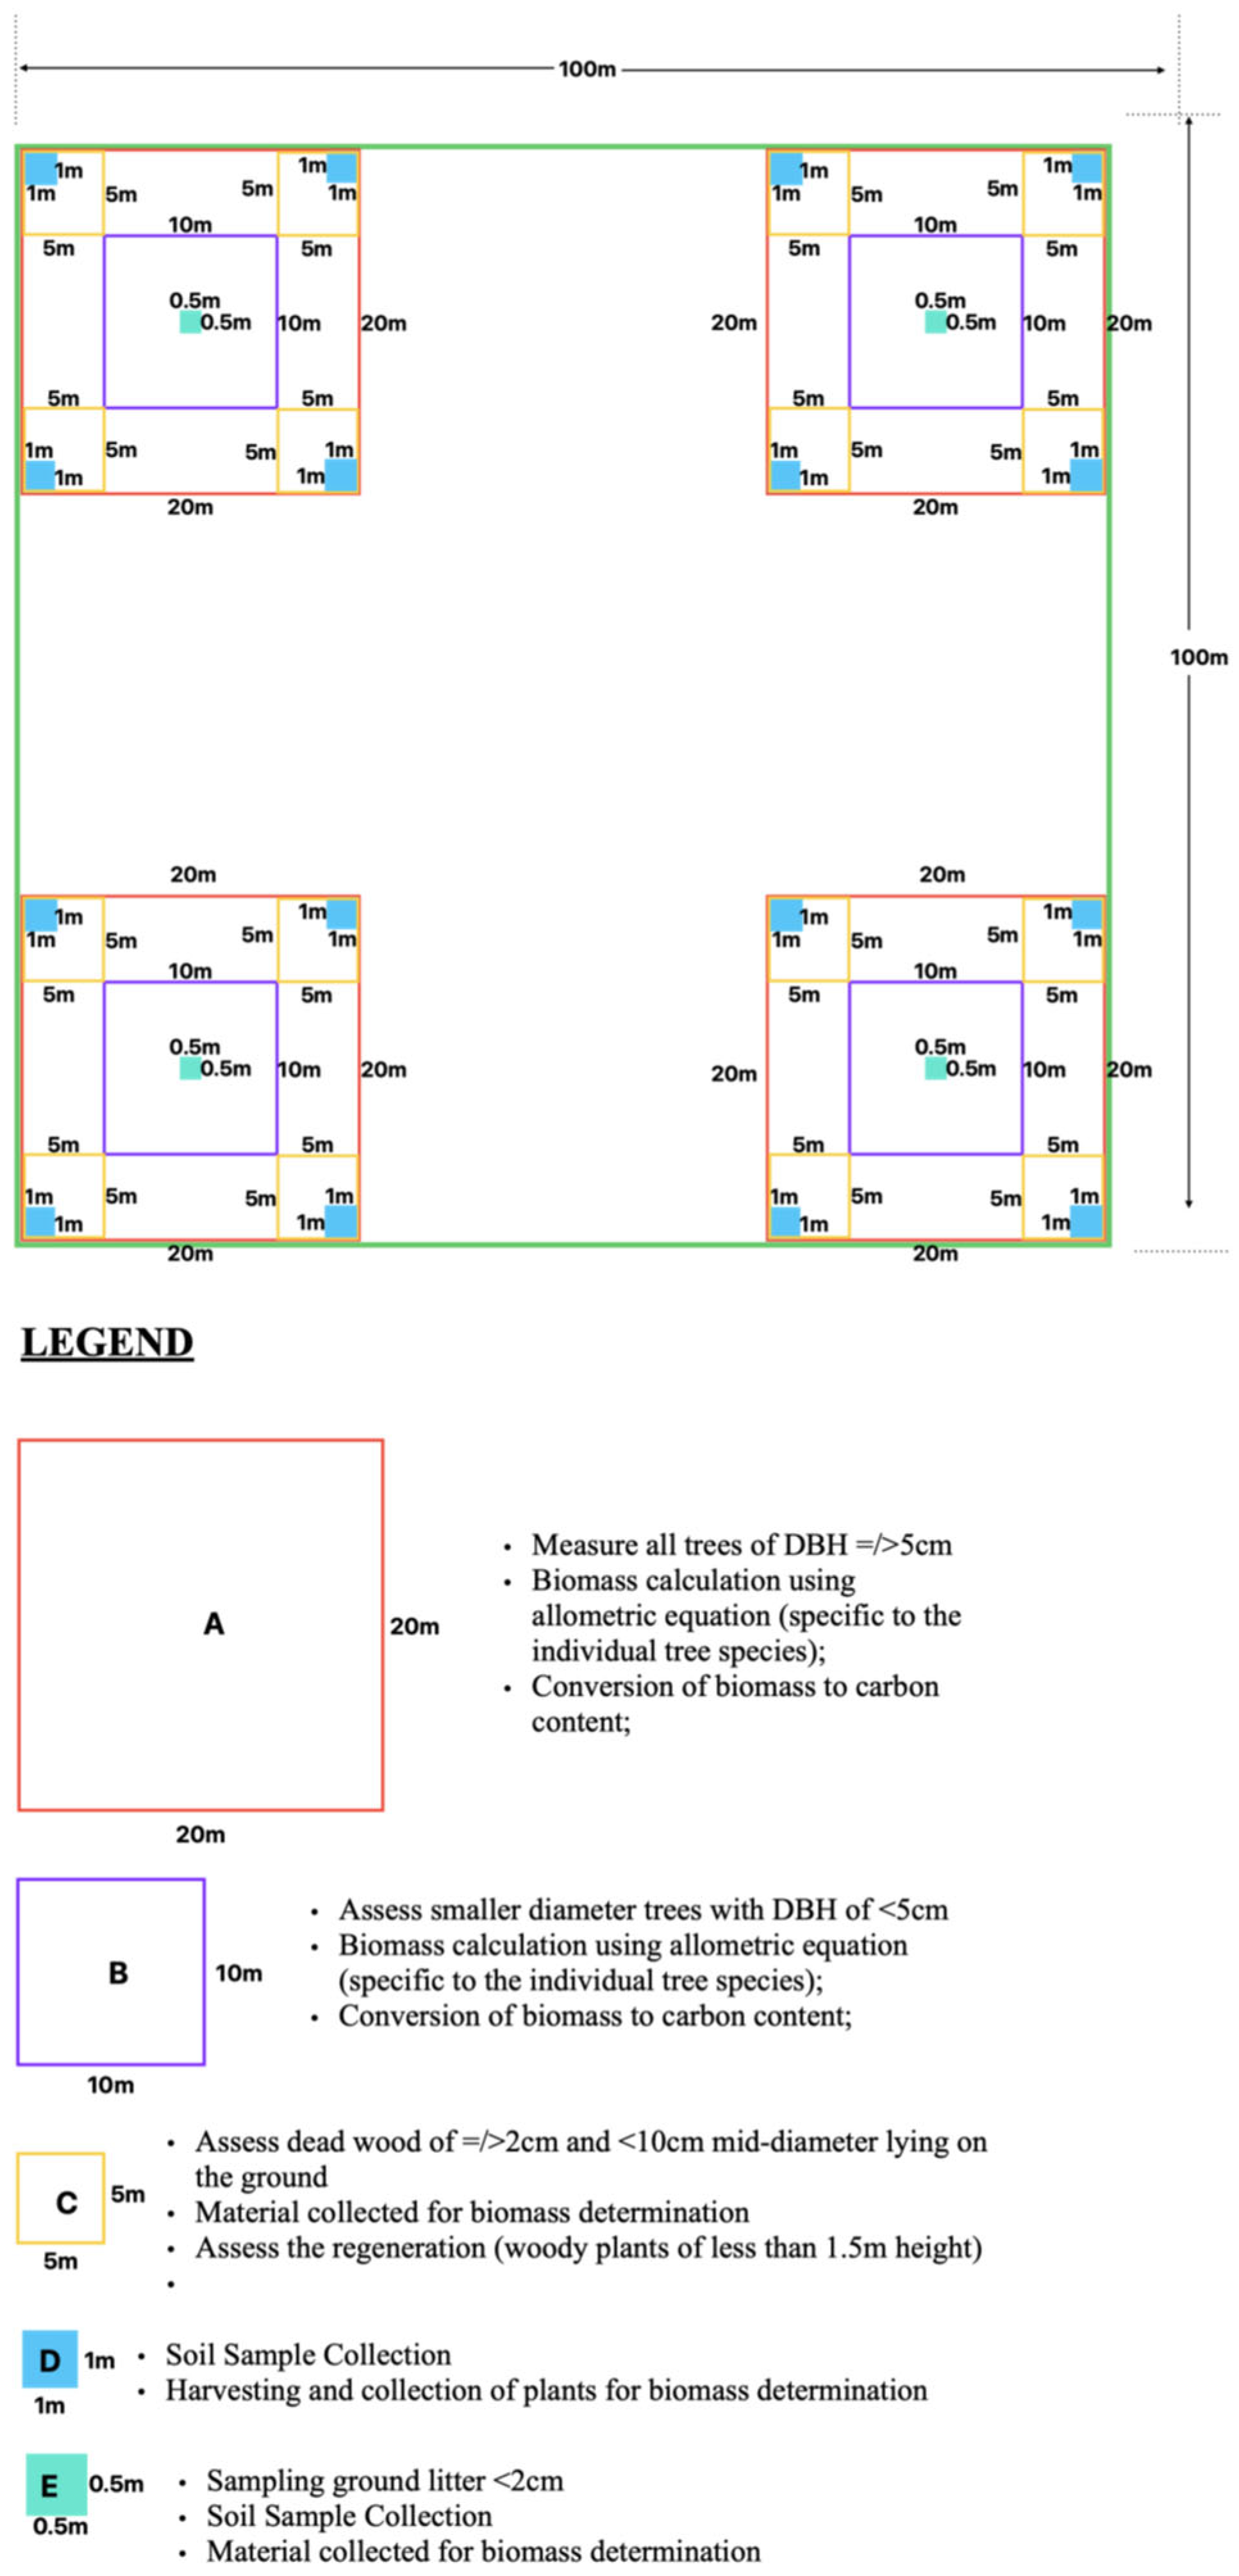
Figure 3.
Workflow illustrating field measurements, biomass estimation, carbon conversion, laboratory analyses, and statistical analyses.
Figure 3.
Workflow illustrating field measurements, biomass estimation, carbon conversion, laboratory analyses, and statistical analyses.
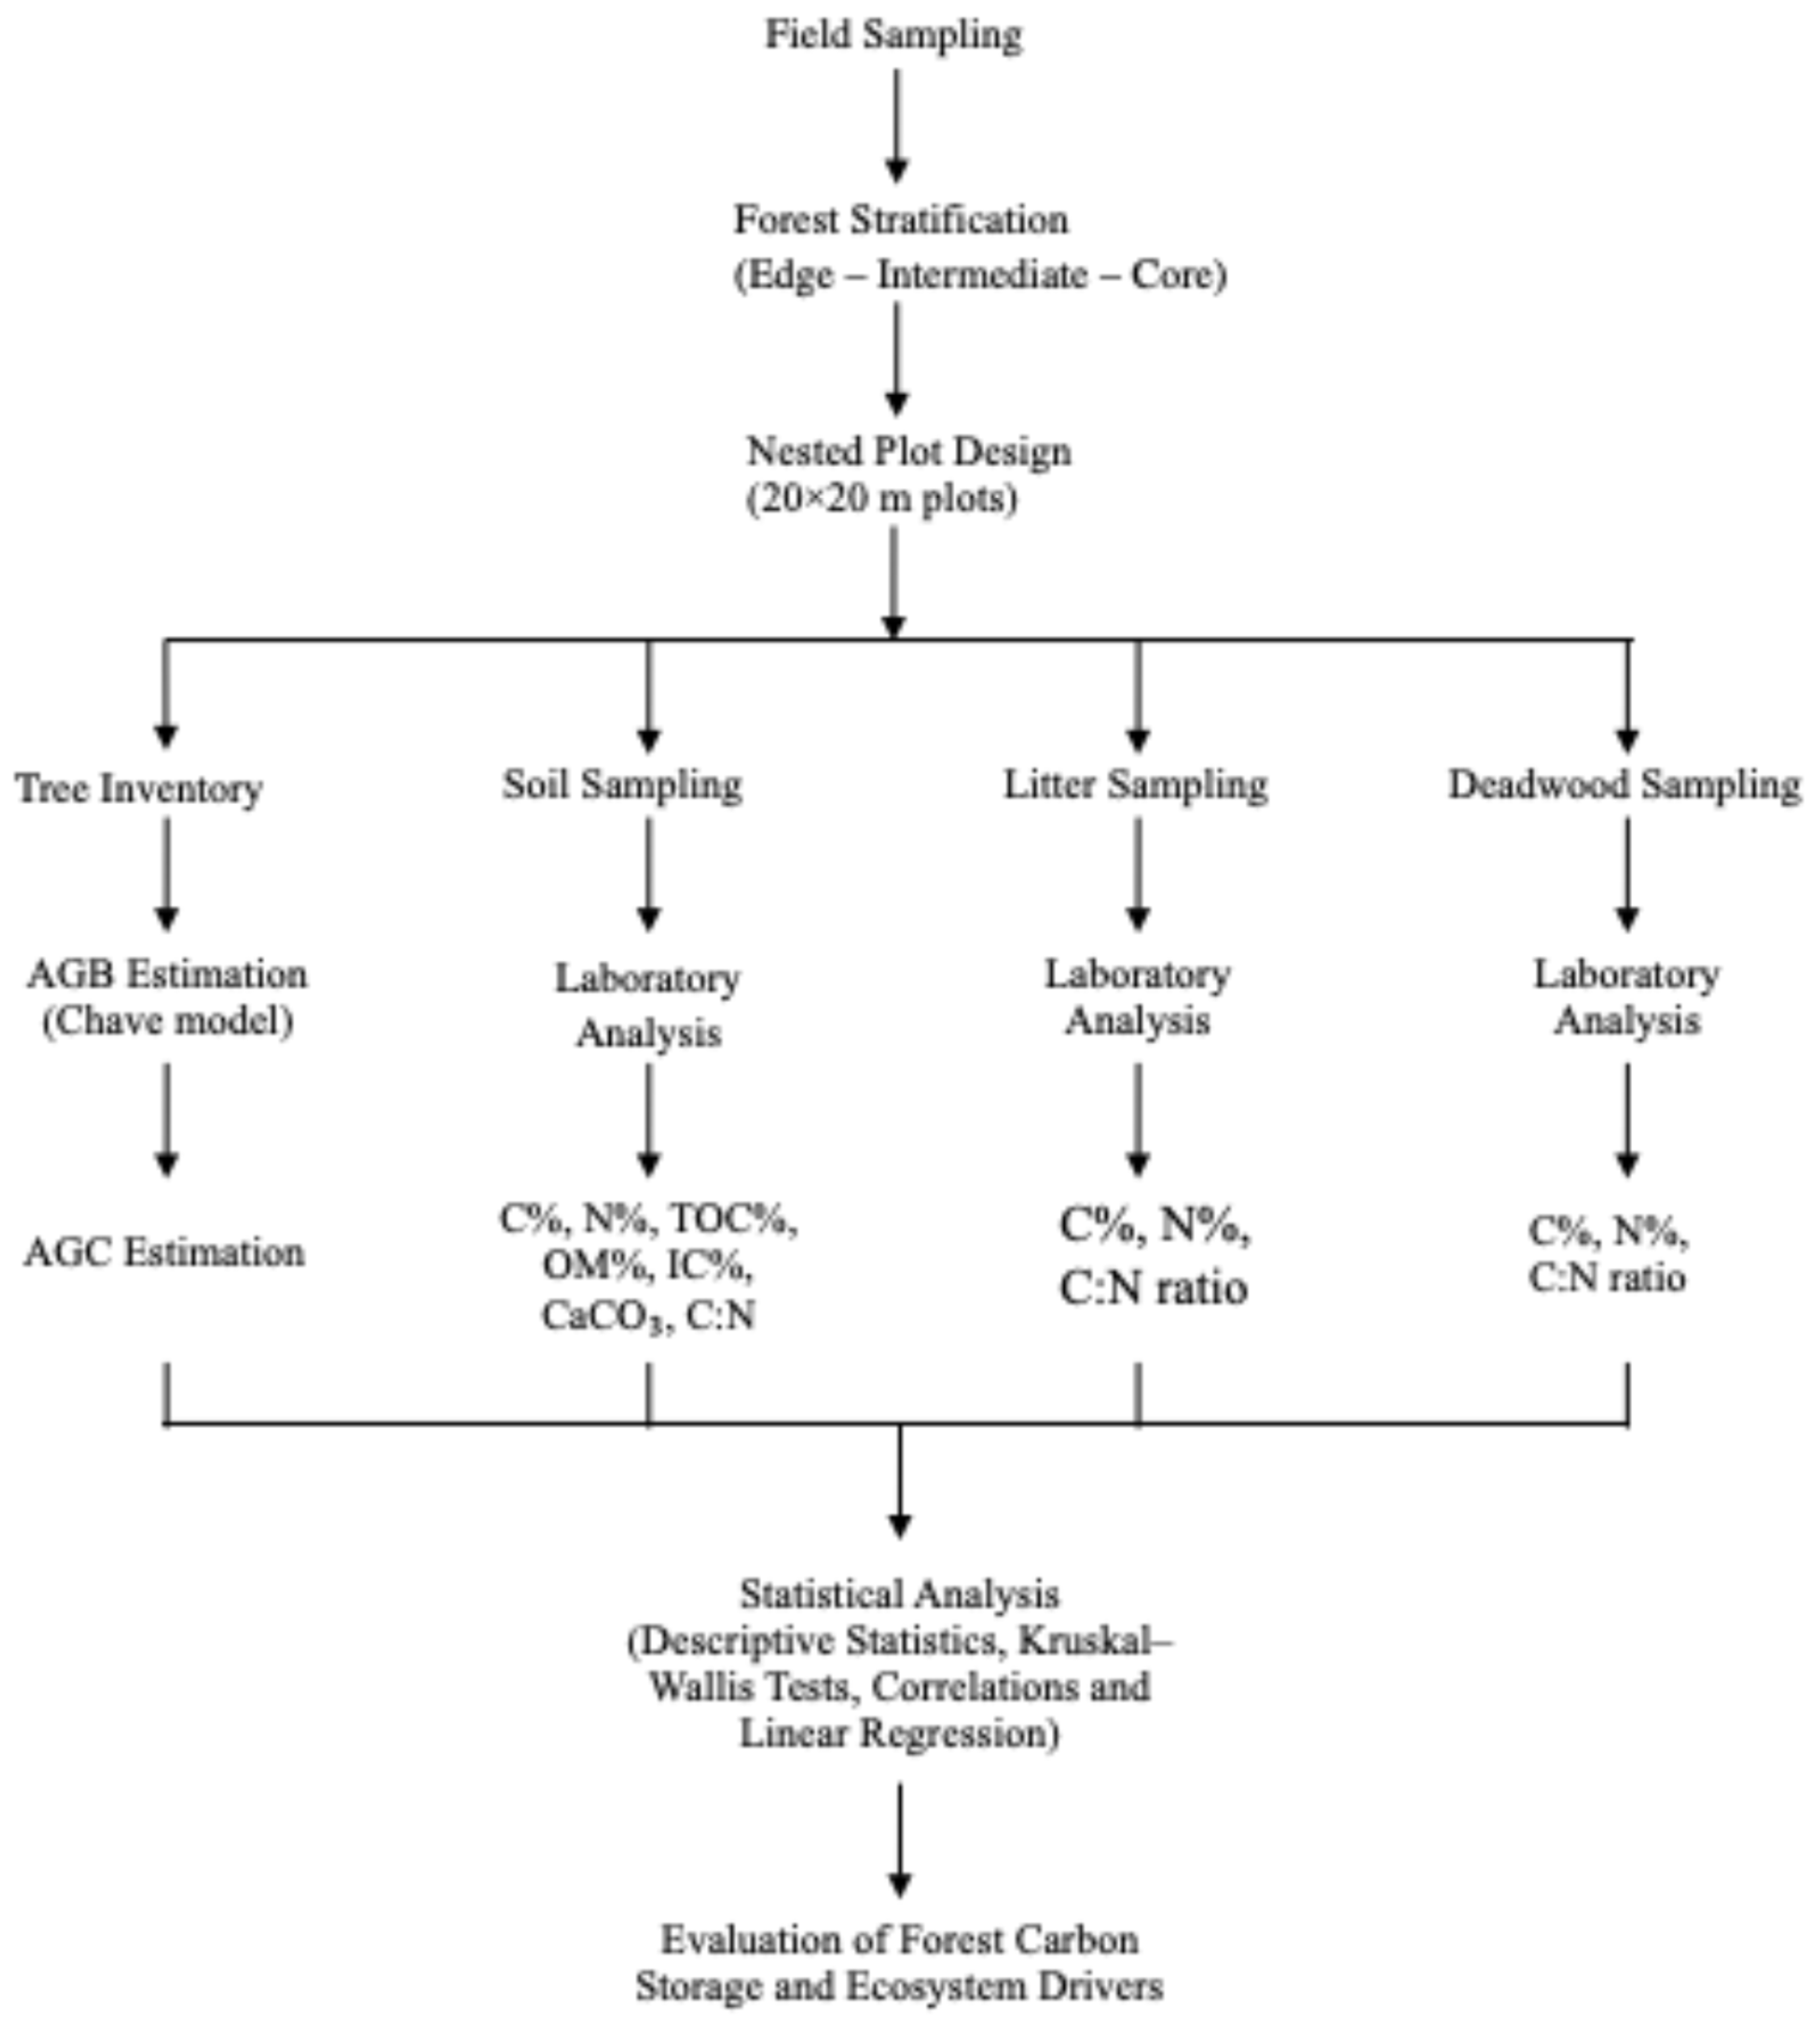
Figure 4.
Plot-level aboveground biomass (AGB) and aboveground carbon (AGC) across the ten permanent sampling plots in Kaya Kauma Sacred Forest. (A) Plot-level AGB (Mg ha⁻¹) and (B) corresponding AGC (Mg C ha⁻¹), estimated from individual-tree measurements using the pantropical allometric equation of Chave et al. (2014) and standardized to a per-hectare basis. Bar colours denote the edge, intermediate, and core forest zones.
Figure 4.
Plot-level aboveground biomass (AGB) and aboveground carbon (AGC) across the ten permanent sampling plots in Kaya Kauma Sacred Forest. (A) Plot-level AGB (Mg ha⁻¹) and (B) corresponding AGC (Mg C ha⁻¹), estimated from individual-tree measurements using the pantropical allometric equation of Chave et al. (2014) and standardized to a per-hectare basis. Bar colours denote the edge, intermediate, and core forest zones.
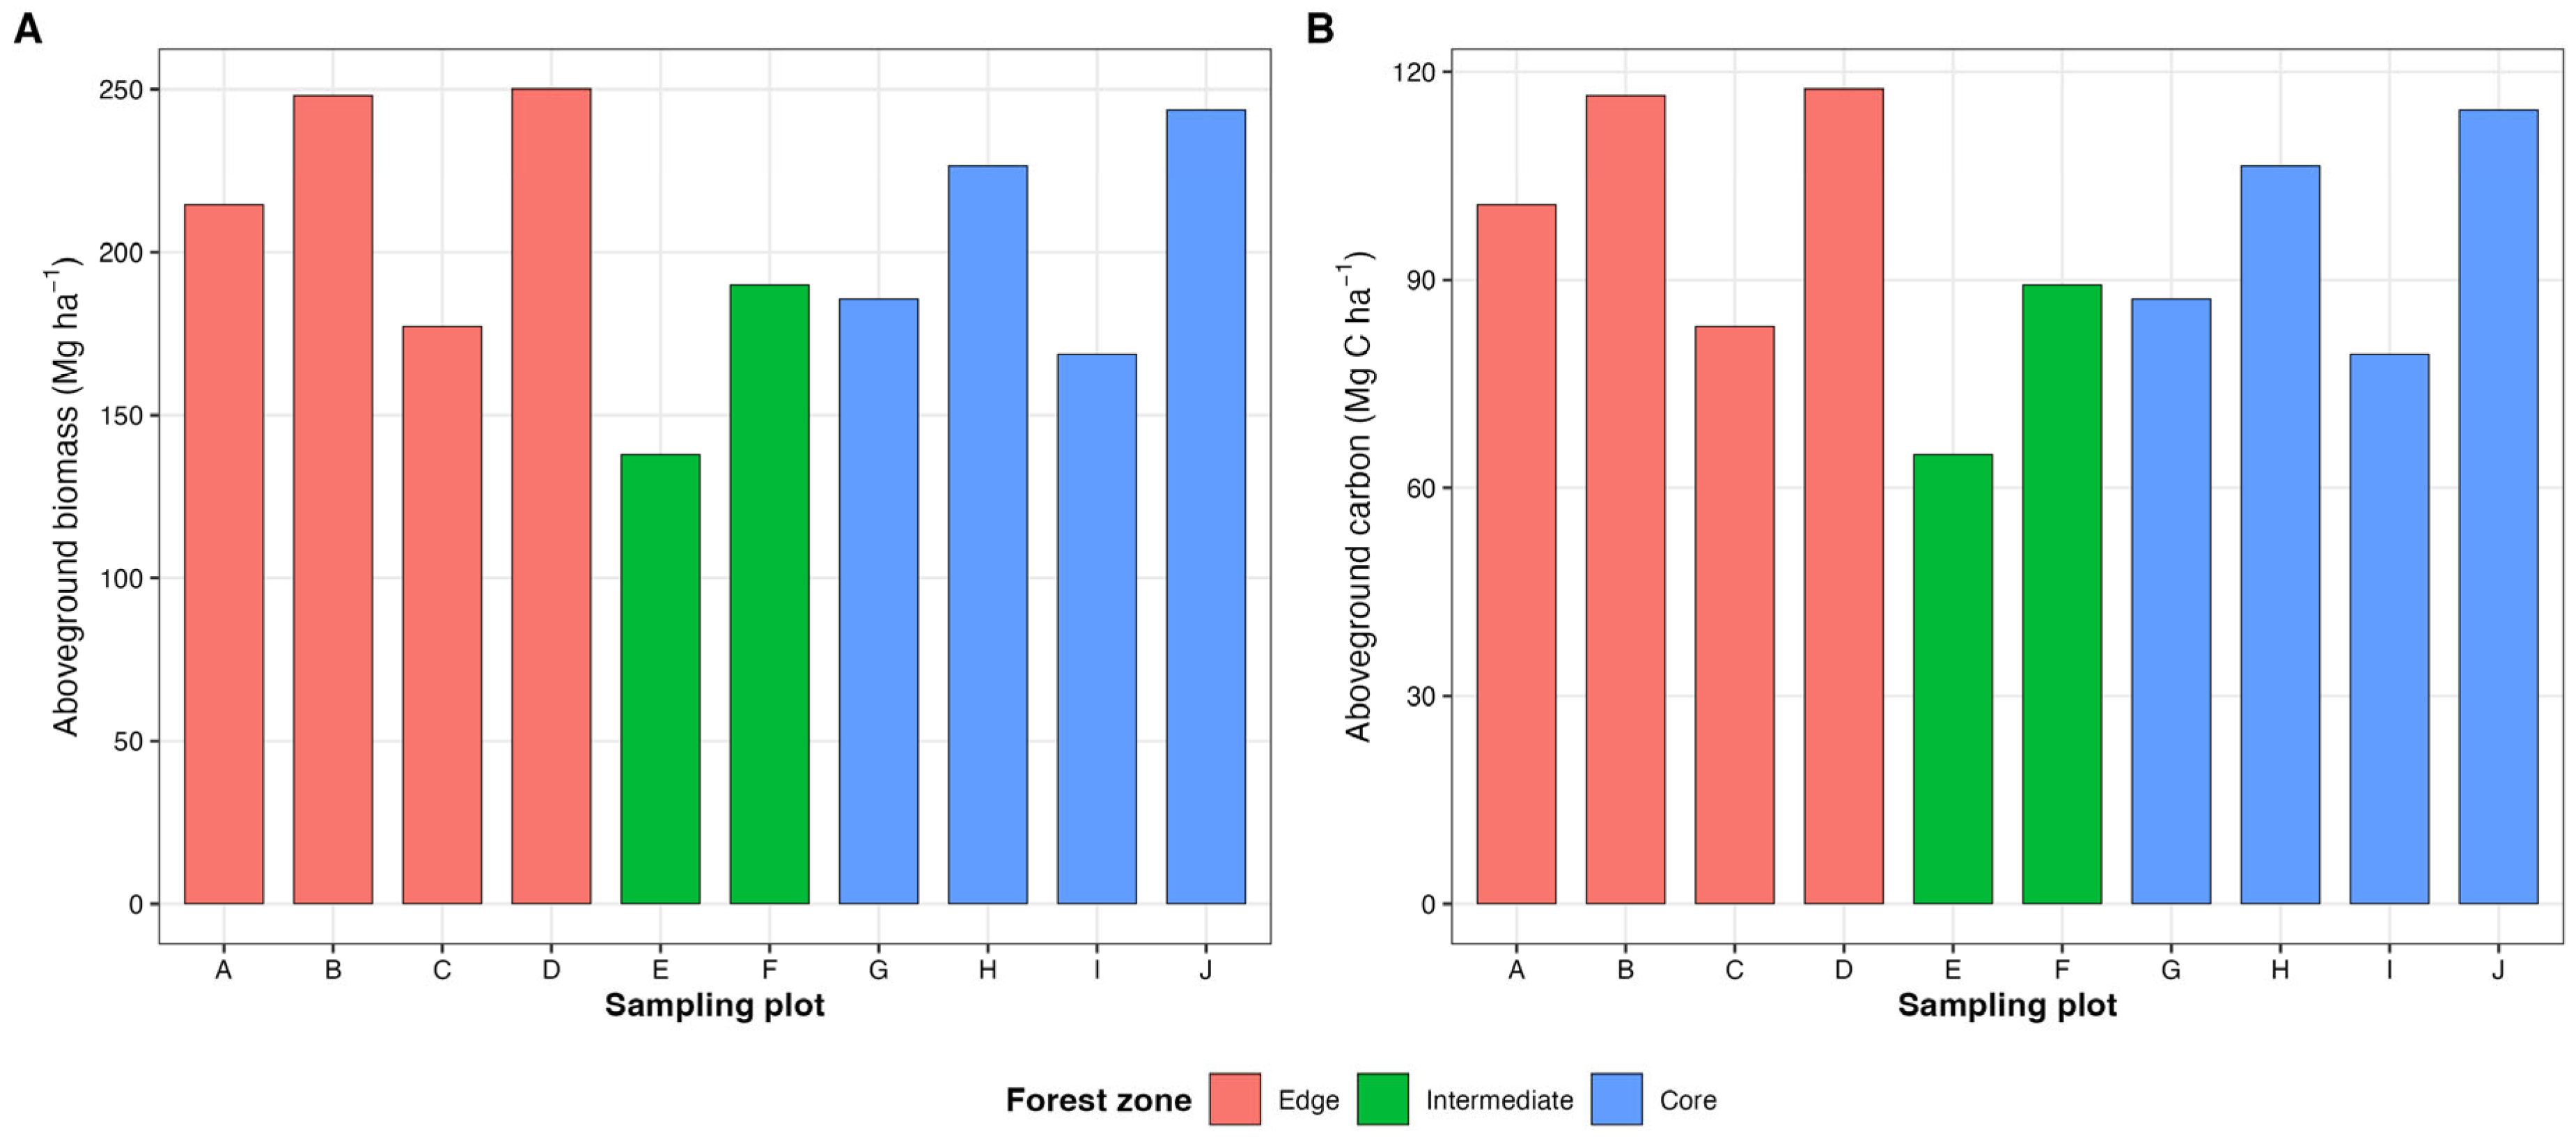
Figure 5.
Soil Total Organic Carbon (TOC) and Total Nitrogen (TN) Depth Profiles.
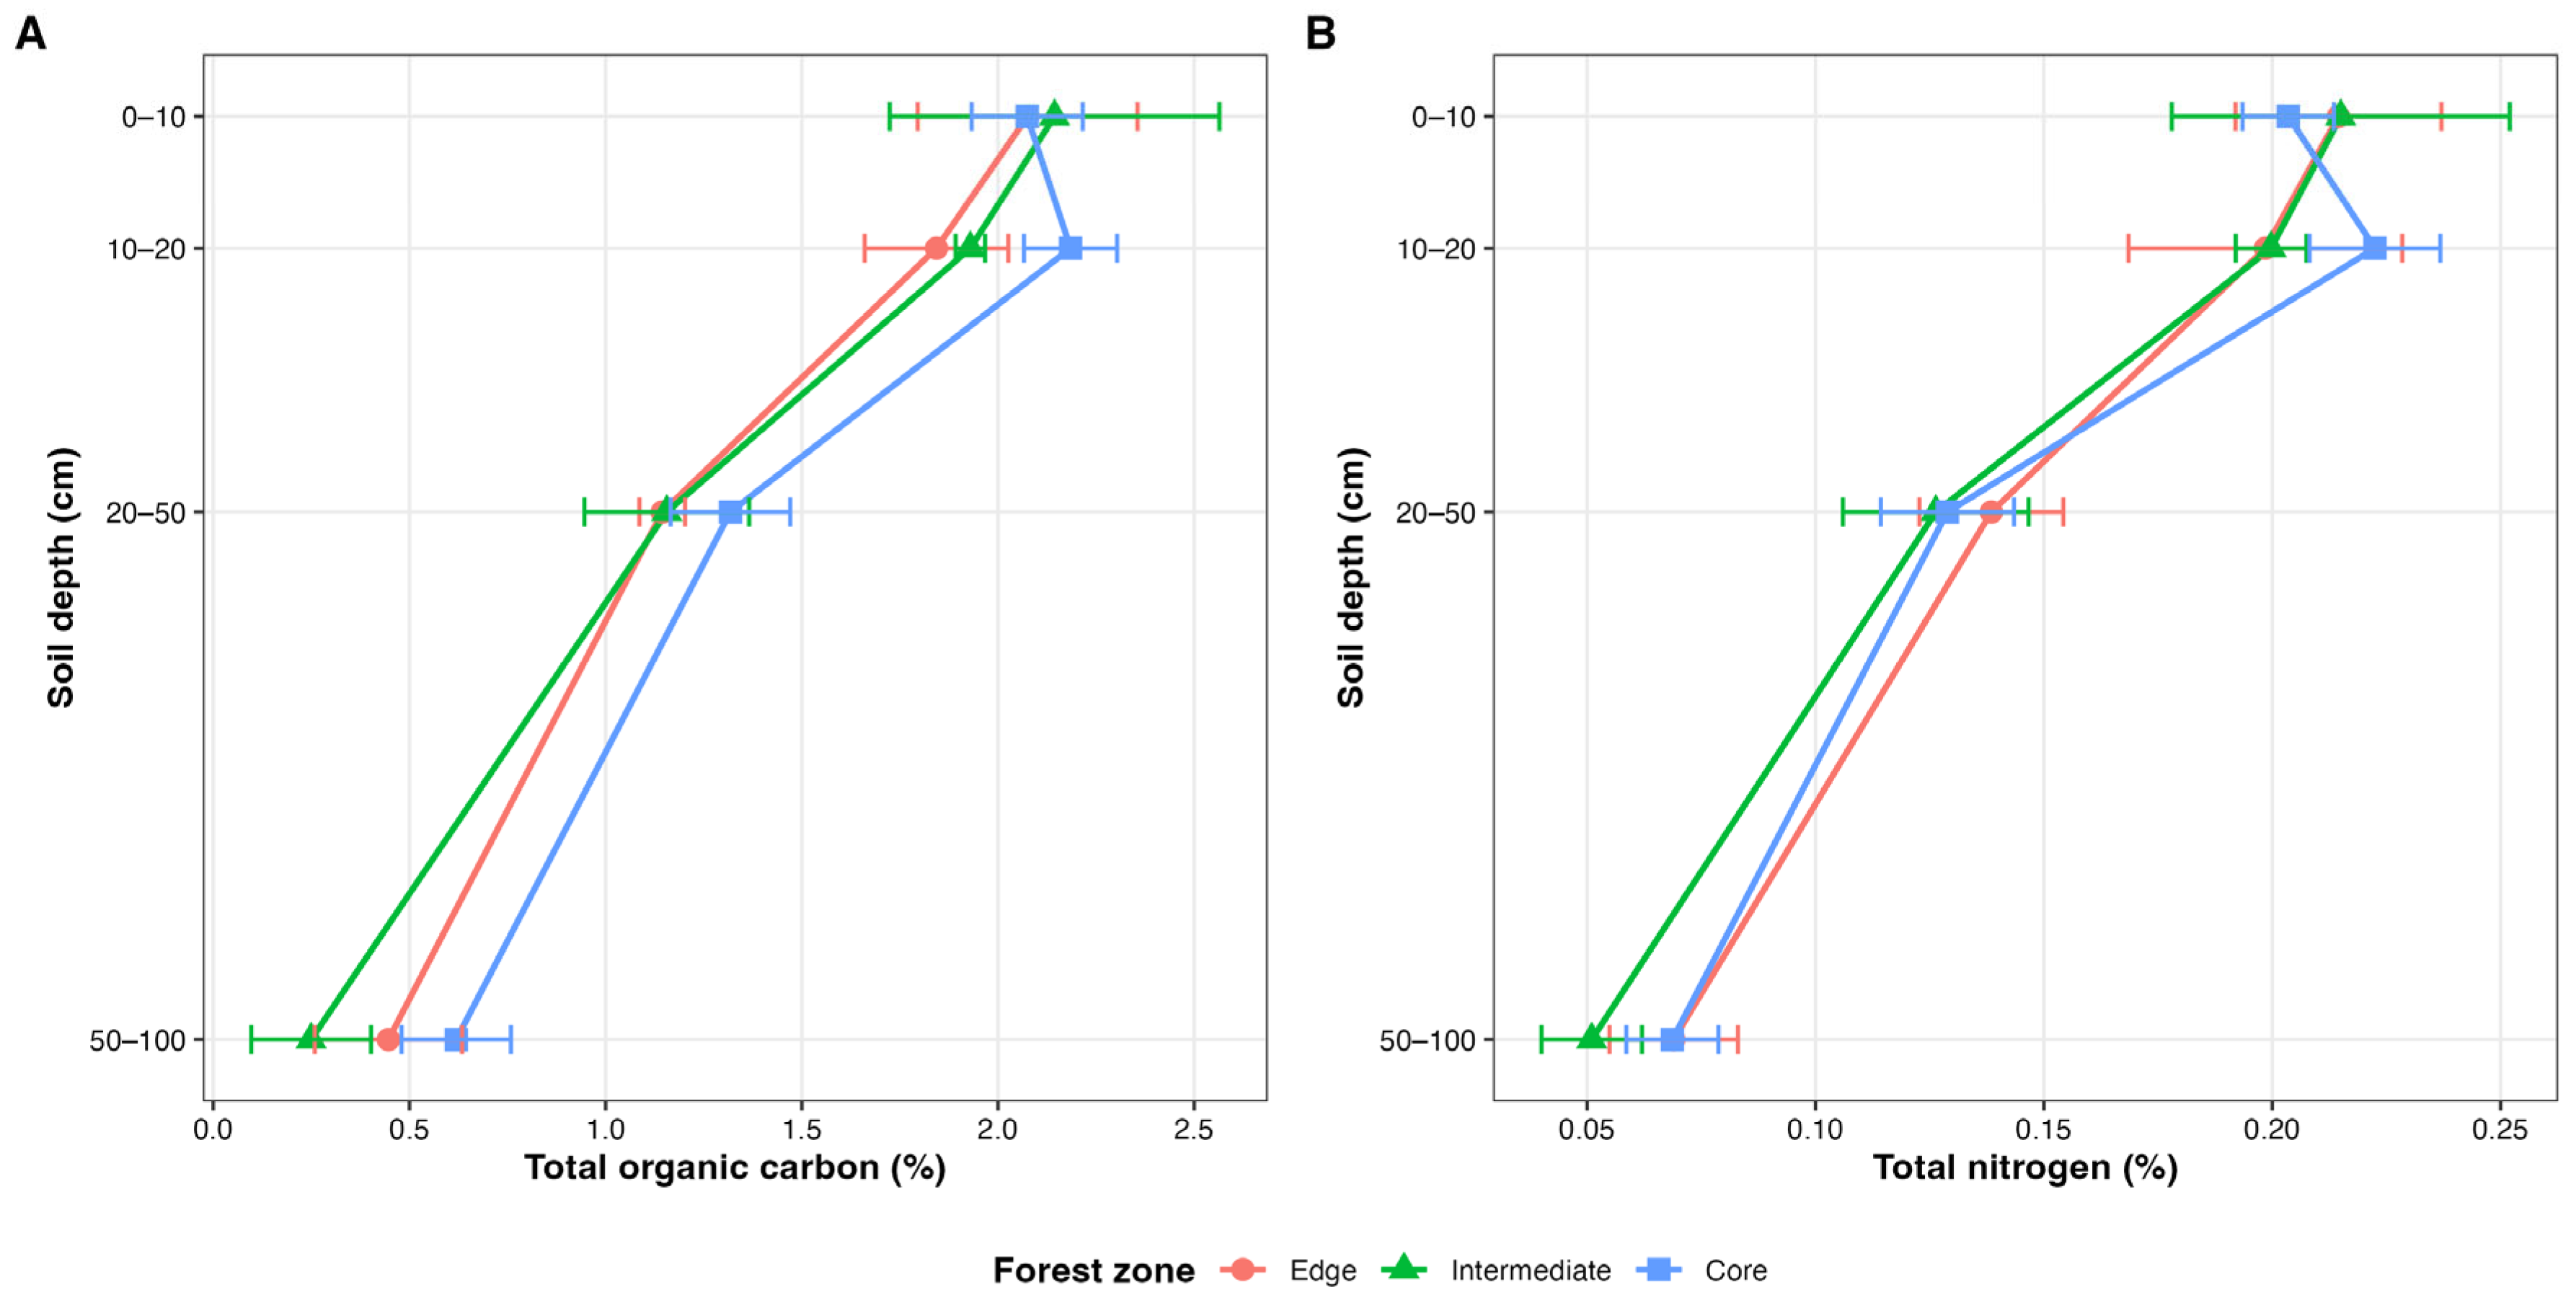
Figure 6.
Carbon, Nitrogen and C:N Ratio Concentrations Across Ecosystem Components.
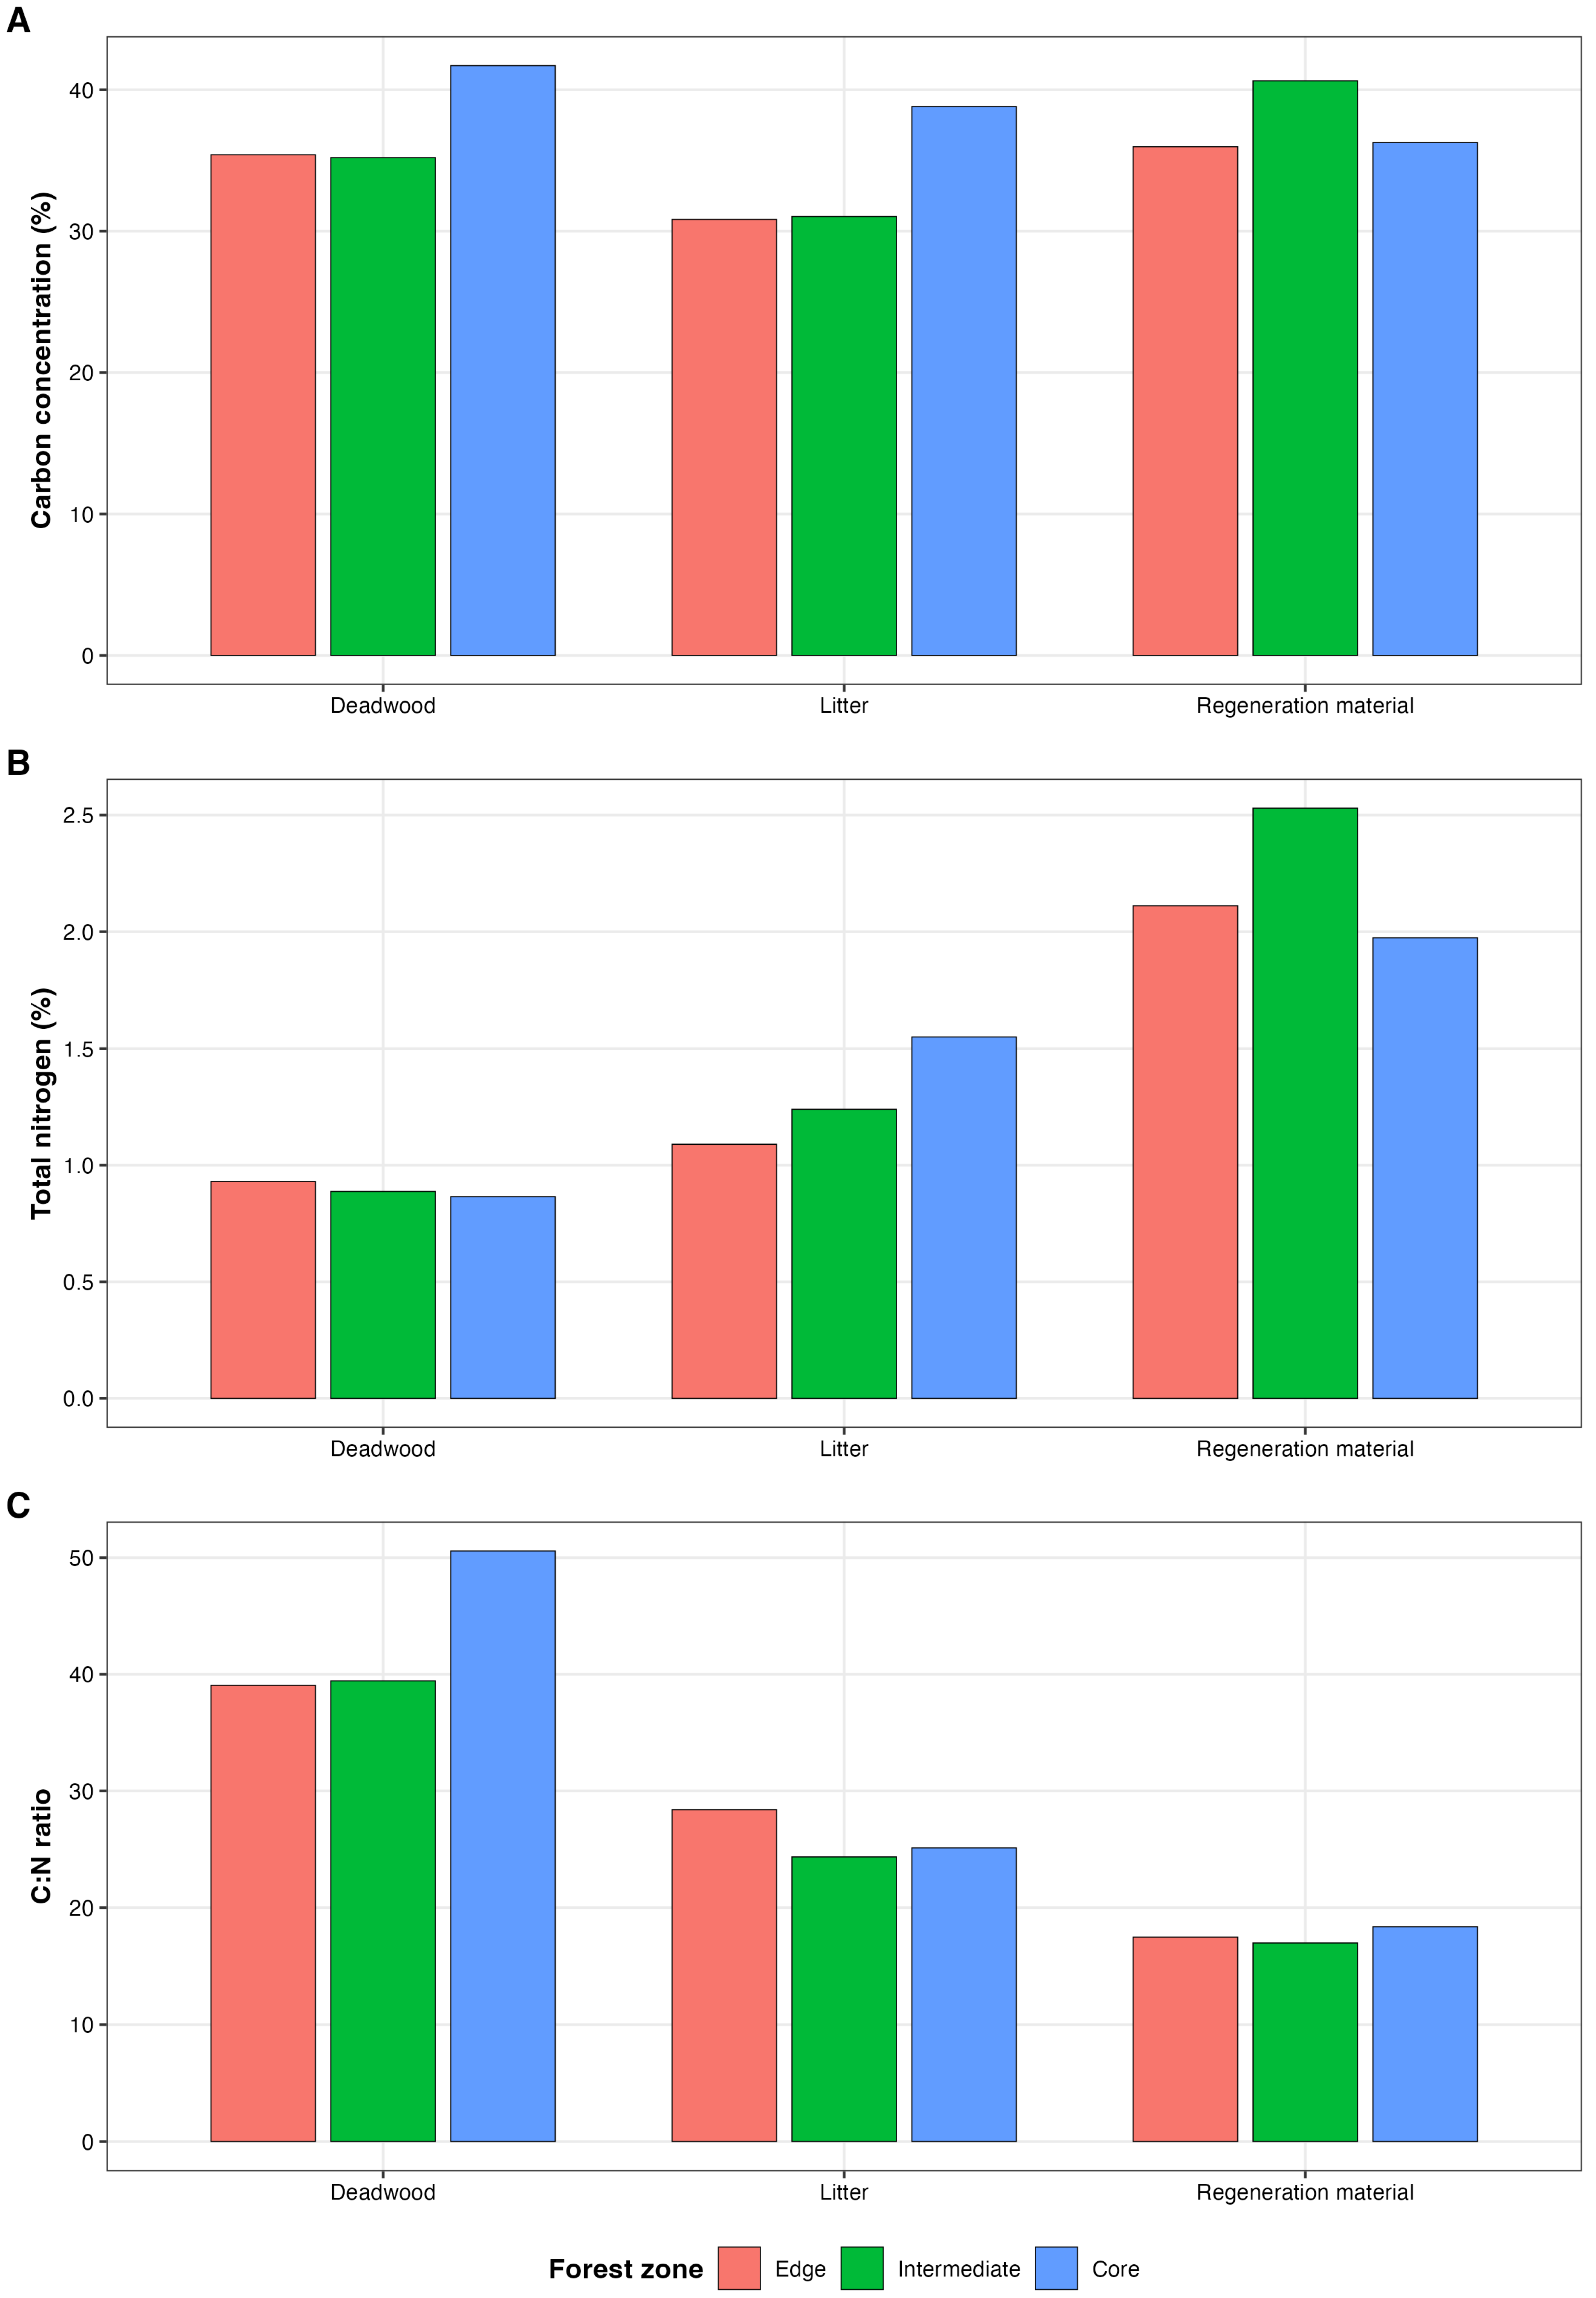
Figure 7.
Relationships between aboveground carbon stocks (AGC) and soil carbon–nutrient variables in Kaya Kauma Sacred Forest. Panels show relationships between AGC and (A) total organic carbon (TOC), (B) total nitrogen (TN), (C) soil organic matter (SOM), and (D) calcium carbonate (CaCO₃). Solid lines represent fitted linear regression models. Model R² and p-values are displayed within each panel.
Figure 7.
Relationships between aboveground carbon stocks (AGC) and soil carbon–nutrient variables in Kaya Kauma Sacred Forest. Panels show relationships between AGC and (A) total organic carbon (TOC), (B) total nitrogen (TN), (C) soil organic matter (SOM), and (D) calcium carbonate (CaCO₃). Solid lines represent fitted linear regression models. Model R² and p-values are displayed within each panel.
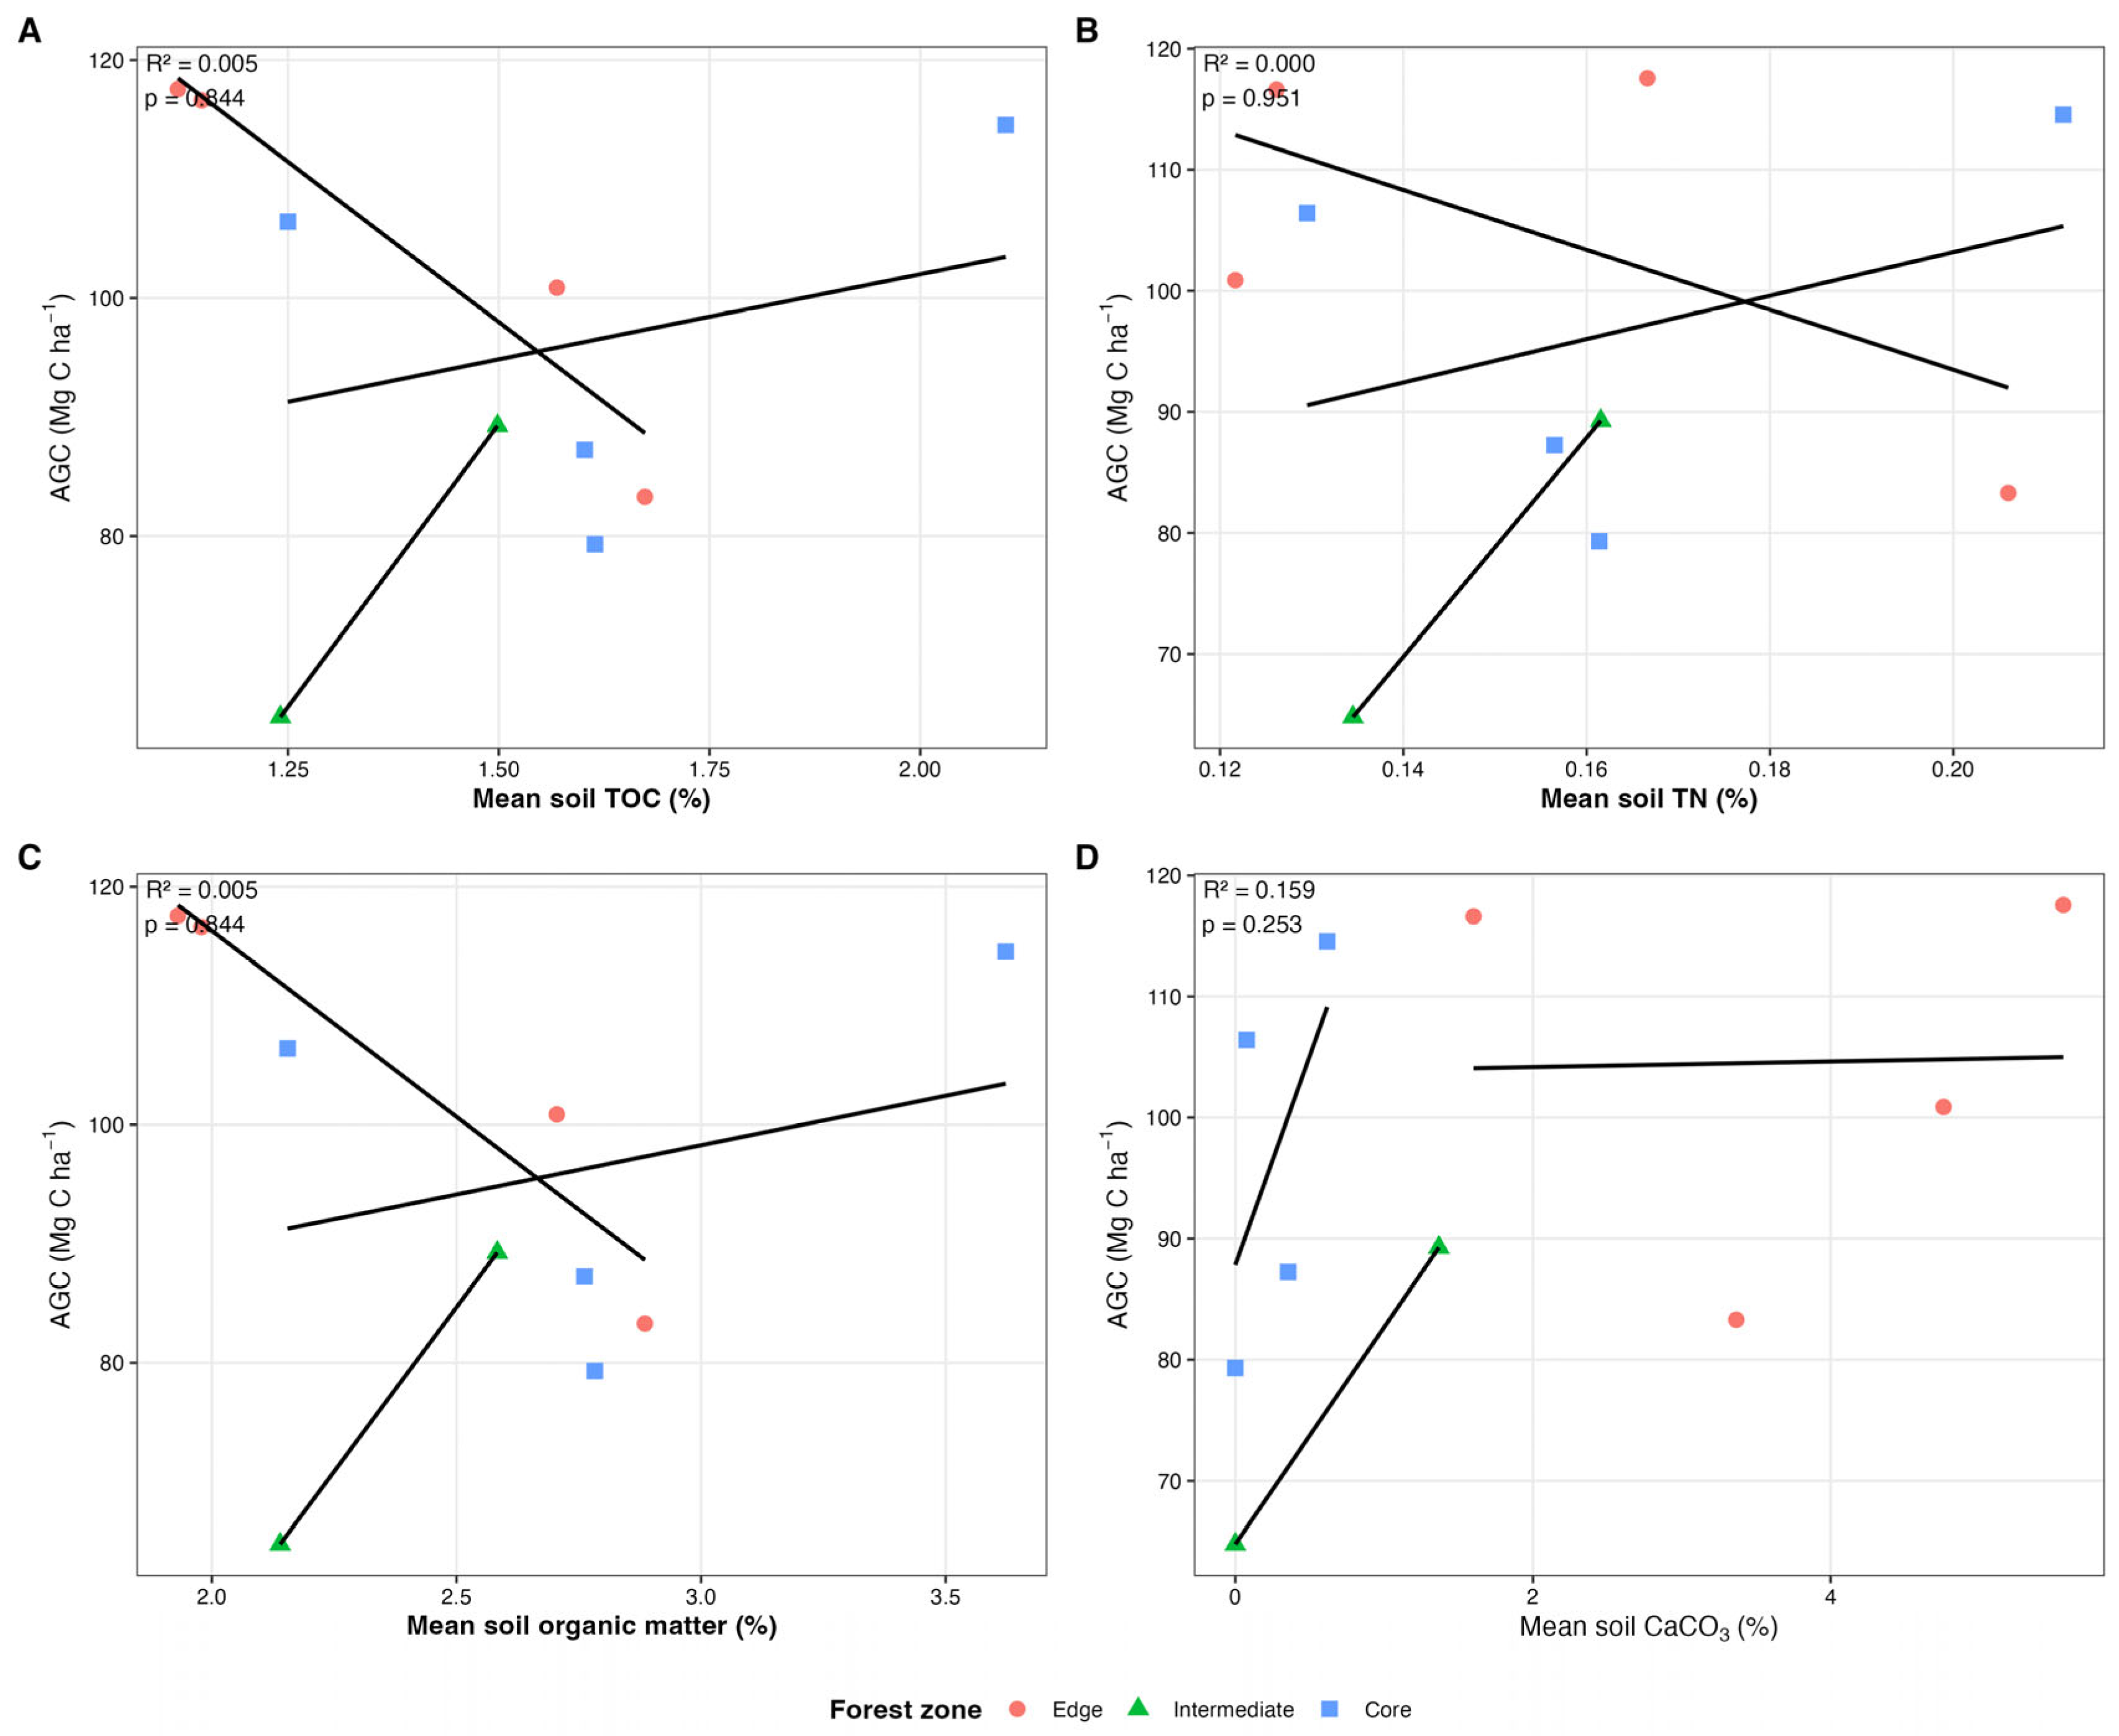

Table 1.
Ecosystem components, variables measured, units, and ecological relevance.
| Ecosystem Component | Variable(s) Measured | Unit | Ecological Relevance |
| Aboveground vegetation | Tree abundance | Count | Stand structure and forest productivity |
| Aboveground biomass (AGB) | Mg ha⁻¹ | Quantification of living biomass accumulation | |
| Aboveground carbon (AGC) | Mg C ha⁻¹ | Carbon stored in living aboveground biomass | |
| Soil | Total carbon (C) | % | Indicator of soil carbon concentration |
| Total organic carbon (TOC) | % | Soil organic carbon concentration and nutrient cycling | |
| Soil organic matter (SOM) | % | Indicator of soil organic matter status | |
| Total nitrogen (TN) | % | Nutrient availability and ecosystem productivity | |
| Soil inorganic carbon (SIC) | % | Mineral-associated carbon fraction | |
| Calcium carbonate (CaCO₃) | % | Soil mineral composition and carbon chemistry | |
| Carbon-to-nitrogen ratio (C:N) | Ratio | Organic matter quality and decomposition concentrations | |
| Litter | Carbon concentration | % | Surface carbon inputs to soil |
| Nitrogen concentration | % | Nutrient return through decomposition | |
| Carbon-to-nitrogen ratio | Ratio | Litter decomposition potential | |
| Regeneration material | Carbon concentration | % | Carbon concentration in regenerating vegetation |
| Nitrogen concentration | % | Nutrient status of regenerating plants | |
| Carbon-to-nitrogen ratio | Ratio | Growth and nutrient-use efficiency | |
| Deadwood | Carbon concentration | % | Carbon concentration in coarse woody debris |
| Nitrogen concentration | % | Decomposition and nutrient release | |
| Carbon-to-nitrogen ratio | Ratio | Persistence and turnover of deadwood carbon |
Table 2.
Statistical analyses, response variables, objectives, and ecological interpretation.
| Analysis | Variables | Purpose |
| Descriptive statistics | AGB, AGC, soil variables, litter, regeneration material, deadwood | Summarize ecosystem carbon and nutrient characteristics |
| Kruskal–Wallis test | AGB, AGC, TOC, SOM, TN | Evaluate differences among ecological zones |
| Soil depth-profile analysis | Soil variables across 0–10, 10–20, 20–50 and 50–100 cm | Characterize vertical variation in soil carbon and nutrient concentrations |
| Simple linear regression | AGC vs TOC, SOM, TN and CaCO₃ | Assess relationships between aboveground carbon stock and individual soil properties |
| Species contribution analysis | Species-level AGC contribution | Identify dominant tree species contributing to aboveground carbon stocks |
Table 3.
Aboveground Biomass (AGB) and Aboveground Carbon Stocks (AGC) by Forest Zone.
| AGB (Mg ha-1) | AGC (Mg C ha-1) | |||||
| Zone | n_Plots | n_trees | Mean ± SD | SE | Mean ± SD | SE |
| Edge | 4 | 155 | 222.5 ± 34.3 | 17.1 | 104.6 ± 16.1 | 8.1 |
| Intermediate | 2 | 77 | 163.9 ± 36.8 | 26 | 77.0 ± 17.3 | 12.2 |
| Core | 4 | 153 | 206.1 ± 34.8 | 17.4 | 96.9 ± 16.4 | 8.2 |
| Overall | 10 | 385 | 204.2 ± 38.2 | 12.1 | 96.0 ± 18.0 | 5.7 |
Table 4.
Top Ten Carbon-Storing Tree Species in Kaya Kauma Forest.
| Rank | Species | Trees Count | Frequency (%) | Sampled AGB (Mg) | AGB contribution (Mg ha-1) | Sampled AGC (Mg C) | AGC contribution (Mg C ha-1) | Relative AGC contribution (%) | Cumulative AGC contribution (%) |
| 1 | Terminalia spinosa | 15 | 70 | 5.323 | 13.31 | 2.502 | 6.25 | 6.52 | 6.52 |
| 2 | Manilkara sulcata | 12 | 80 | 4.801 | 12 | 2.256 | 5.64 | 5.88 | 12.39 |
| 3 | Erythrina abyssinica | 16 | 90 | 4.648 | 11.62 | 2.185 | 5.46 | 5.69 | 18.08 |
| 4 | Xanthocercis zambesiaca | 18 | 90 | 4.243 | 10.61 | 1.994 | 4.99 | 5.19 | 23.28 |
| 5 | Mimusops obtusifolia | 10 | 60 | 3.983 | 9.96 | 1.872 | 4.68 | 4.88 | 28.15 |
| 6 | Combretum illairii | 15 | 70 | 3.913 | 9.78 | 1.839 | 4.6 | 4.79 | 32.94 |
| 7 | Manilkara sansibarensis | 8 | 60 | 3.62 | 9.05 | 1.701 | 4.25 | 4.43 | 37.37 |
| 8 | Zanthoxylum holtzianum | 7 | 60 | 3.226 | 8.07 | 1.516 | 3.79 | 3.95 | 41.32 |
| 9 | Balanites maughamii | 11 | 70 | 3.01 | 7.53 | 1.415 | 3.54 | 3.68 | 45.01 |
| 10 | Diospyros cornii | 13 | 80 | 2.895 | 7.24 | 1.361 | 3.4 | 3.54 | 48.55 |
Table 5.
Plot-level mean soil carbon and nutrient concentrations by edge-to-core spatial zone and soil depth.
Table 5.
Plot-level mean soil carbon and nutrient concentrations by edge-to-core spatial zone and soil depth.
| Forest zone | Soil depth (cm) | n | Total C (%) | TN (%) | TOC (%) | SOM (%) | SIC (%) | CaCO3 (%) | C:N ratio |
| Edge | 0-10 | 4 | 2.42 ± 0.50 | 0.214 ± 0.05 | 2.08 ± 0.56 | 3.58 ± 0.97 | 0.34 ± 0.19 | 2.86 ± 1.56 | 11.41 ± 2.23 |
| Edge | 10-20 | 4 | 2.25 ± 0.42 | 0.198 ± 0.06 | 1.84 ± 0.37 | 3.18 ± 0.63 | 0.41 ± 0.17 | 3.40 ± 1.41 | 11.77 ± 2.21 |
| Edge | 20-50 | 4 | 1.56 ± 0.23 | 0.138 ± 0.03 | 1.14 ± 0.12 | 1.97 ± 0.20 | 0.44 ± 0.26 | 3.69 ± 2.13 | 11.86 ± 3.42 |
| Edge | 50-100 | 4 | 0.96 ± 0.60 | 0.069 ± 0.03 | 0.45 ± 0.38 | 0.77 ± 0.65 | 0.64 ± 0.33 | 5.34 ± 2.72 | 17.11 ± 14.14 |
| Intermediate | 0-10 | 2 | 2.15 ± 0.61 | 0.215 ± 0.05 | 2.14 ± 0.59 | 3.70 ± 1.02 | 0.01 ± 0.01 | 0.08 ± 0.12 | 10.05 ± 0.38 |
| Intermediate | 10-20 | 2 | 2.03 ± 0.19 | 0.200 ± 0.01 | 1.93 ± 0.05 | 3.33 ± 0.09 | 0.10 ± 0.14 | 0.80 ± 1.14 | 10.16 ± 0.54 |
| Intermediate | 20-50 | 2 | 1.24 ± 0.41 | 0.126 ± 0.03 | 1.16 ± 0.30 | 1.99 ± 0.51 | 0.08 ± 0.11 | 0.67 ± 0.95 | 9.55 ± 1.10 |
| Intermediate | 50-100 | 2 | 0.39 ± 0.02 | 0.051 ± 0.02 | 0.25 ± 0.22 | 0.43 ± 0.37 | 0.14 ± 0.20 | 1.18 ± 1.67 | 7.91 ± 2.25 |
| Core | 0-10 | 4 | 2.08 ± 0.28 | 0.204 ± 0.02 | 2.07 ± 0.28 | 3.58 ± 0.49 | 0.01 ± 0.01 | 0.05 ± 0.06 | 10.55 ± 1.44 |
| Core | 10-20 | 4 | 2.20 ± 0.24 | 0.222 ± 0.03 | 2.18 ± 0.24 | 3.77 ± 0.41 | 0.02 ± 0.03 | 0.16 ± 0.26 | 9.93 ± 0.66 |
| Core | 20-50 | 4 | 1.36 ± 0.37 | 0.129 ± 0.03 | 1.32 ± 0.30 | 2.27 ± 0.53 | 0.04 ± 0.07 | 0.31 ± 0.58 | 10.60 ± 0.82 |
| Core | 50-100 | 3 | 0.68 ± 0.21 | 0.069 ± 0.02 | 0.62 ± 0.24 | 1.07 ± 0.42 | 0.06 ± 0.10 | 0.49 ± 0.80 | 9.68 ± 0.69 |
*** n = number of independent sampling plots contributing to each forest zone × soil depth combination. Note: Values are presented as mean ± standard deviation of plot-level means. Soil samples collected from the five sampling points within each 20 × 20 m permanent plot were analysed individually and were not physically composited before laboratory analysis. For statistical analyses, the five analytical measurements corresponding to the same plot and soil depth were averaged to obtain one representative plot-level value. The permanent sampling plot constituted the experimental unit (Edge = 4 plots, Intermediate = 2 plots, Core = 4 plots). Total organic carbon (TOC) was calculated as TC − SIC, where SIC = 0.12 × CaCO₃. Soil organic matter (SOM) was estimated from TOC using the Van Bemmelen conversion factor (SOM = TOC × 1.724). Soil carbon variables are reported as concentrations (%) rather than stocks because soil bulk density and coarse-fragment volume were not measured.
Table 6.
Ecosystem Component Characteristics and Statistical Comparisons.
| Component | Characteristic | Edge | Intermediate | Core | Kruskal-Wallis H | df | p-value | Significance |
| Deadwood | Carbon concentration (%) | 35.41 | 35.20 | 41.71 | 4.009 | 2 | 0.135 | ns |
| Deadwood | Total nitrogen (%) | 0.930 | 0.887 | 0.865 | 0.409 | 2 | 0.815 | ns |
| Deadwood | C:N ratio | 39.05 | 39.44 | 50.57 | 2.918 | 2 | 0.232 | ns |
| Litter | Carbon concentration (%) | 30.84 | 31.04 | 38.83 | 3.491 | 2 | 0.175 | ns |
| Litter | Total nitrogen (%) | 1.090 | 1.240 | 1.550 | 6.873 | 2 | 0.032 | * |
| Litter | C:N ratio | 28.39 | 24.34 | 25.12 | 0.736 | 2 | 0.692 | ns |
| Regeneration material | Carbon concentration (%) | 35.98 | 40.64 | 36.27 | 0.955 | 2 | 0.62 | ns |
| Regeneration material | Total nitrogen (%) | 2.111 | 2.530 | 1.974 | 2.673 | 2 | 0.263 | ns |
| Regeneration material | C:N ratio | 17.50 | 17.00 | 18.39 | 3.818 | 2 | 0.148 | ns |
Disclaimer/Publisher’s Note: The statements, opinions and data contained in all publications are solely those of the individual author(s) and contributor(s) and not of MDPI and/or the editor(s). MDPI and/or the editor(s) disclaim responsibility for any injury to people or property resulting from any ideas, methods, instructions or products referred to in the content. |
© 2026 by the authors. Licensee MDPI, Basel, Switzerland. This article is an open access article distributed under the terms and conditions of the Creative Commons Attribution (CC BY) license (http://creativecommons.org/licenses/by/4.0/).
Copyright: This open access article is published under a Creative Commons CC BY 4.0 license, which permit the free download, distribution, and reuse, provided that the author and preprint are cited in any reuse.