

Submitted:
10 August 2026
Posted:
11 August 2026
You are already at the latest version
Abstract
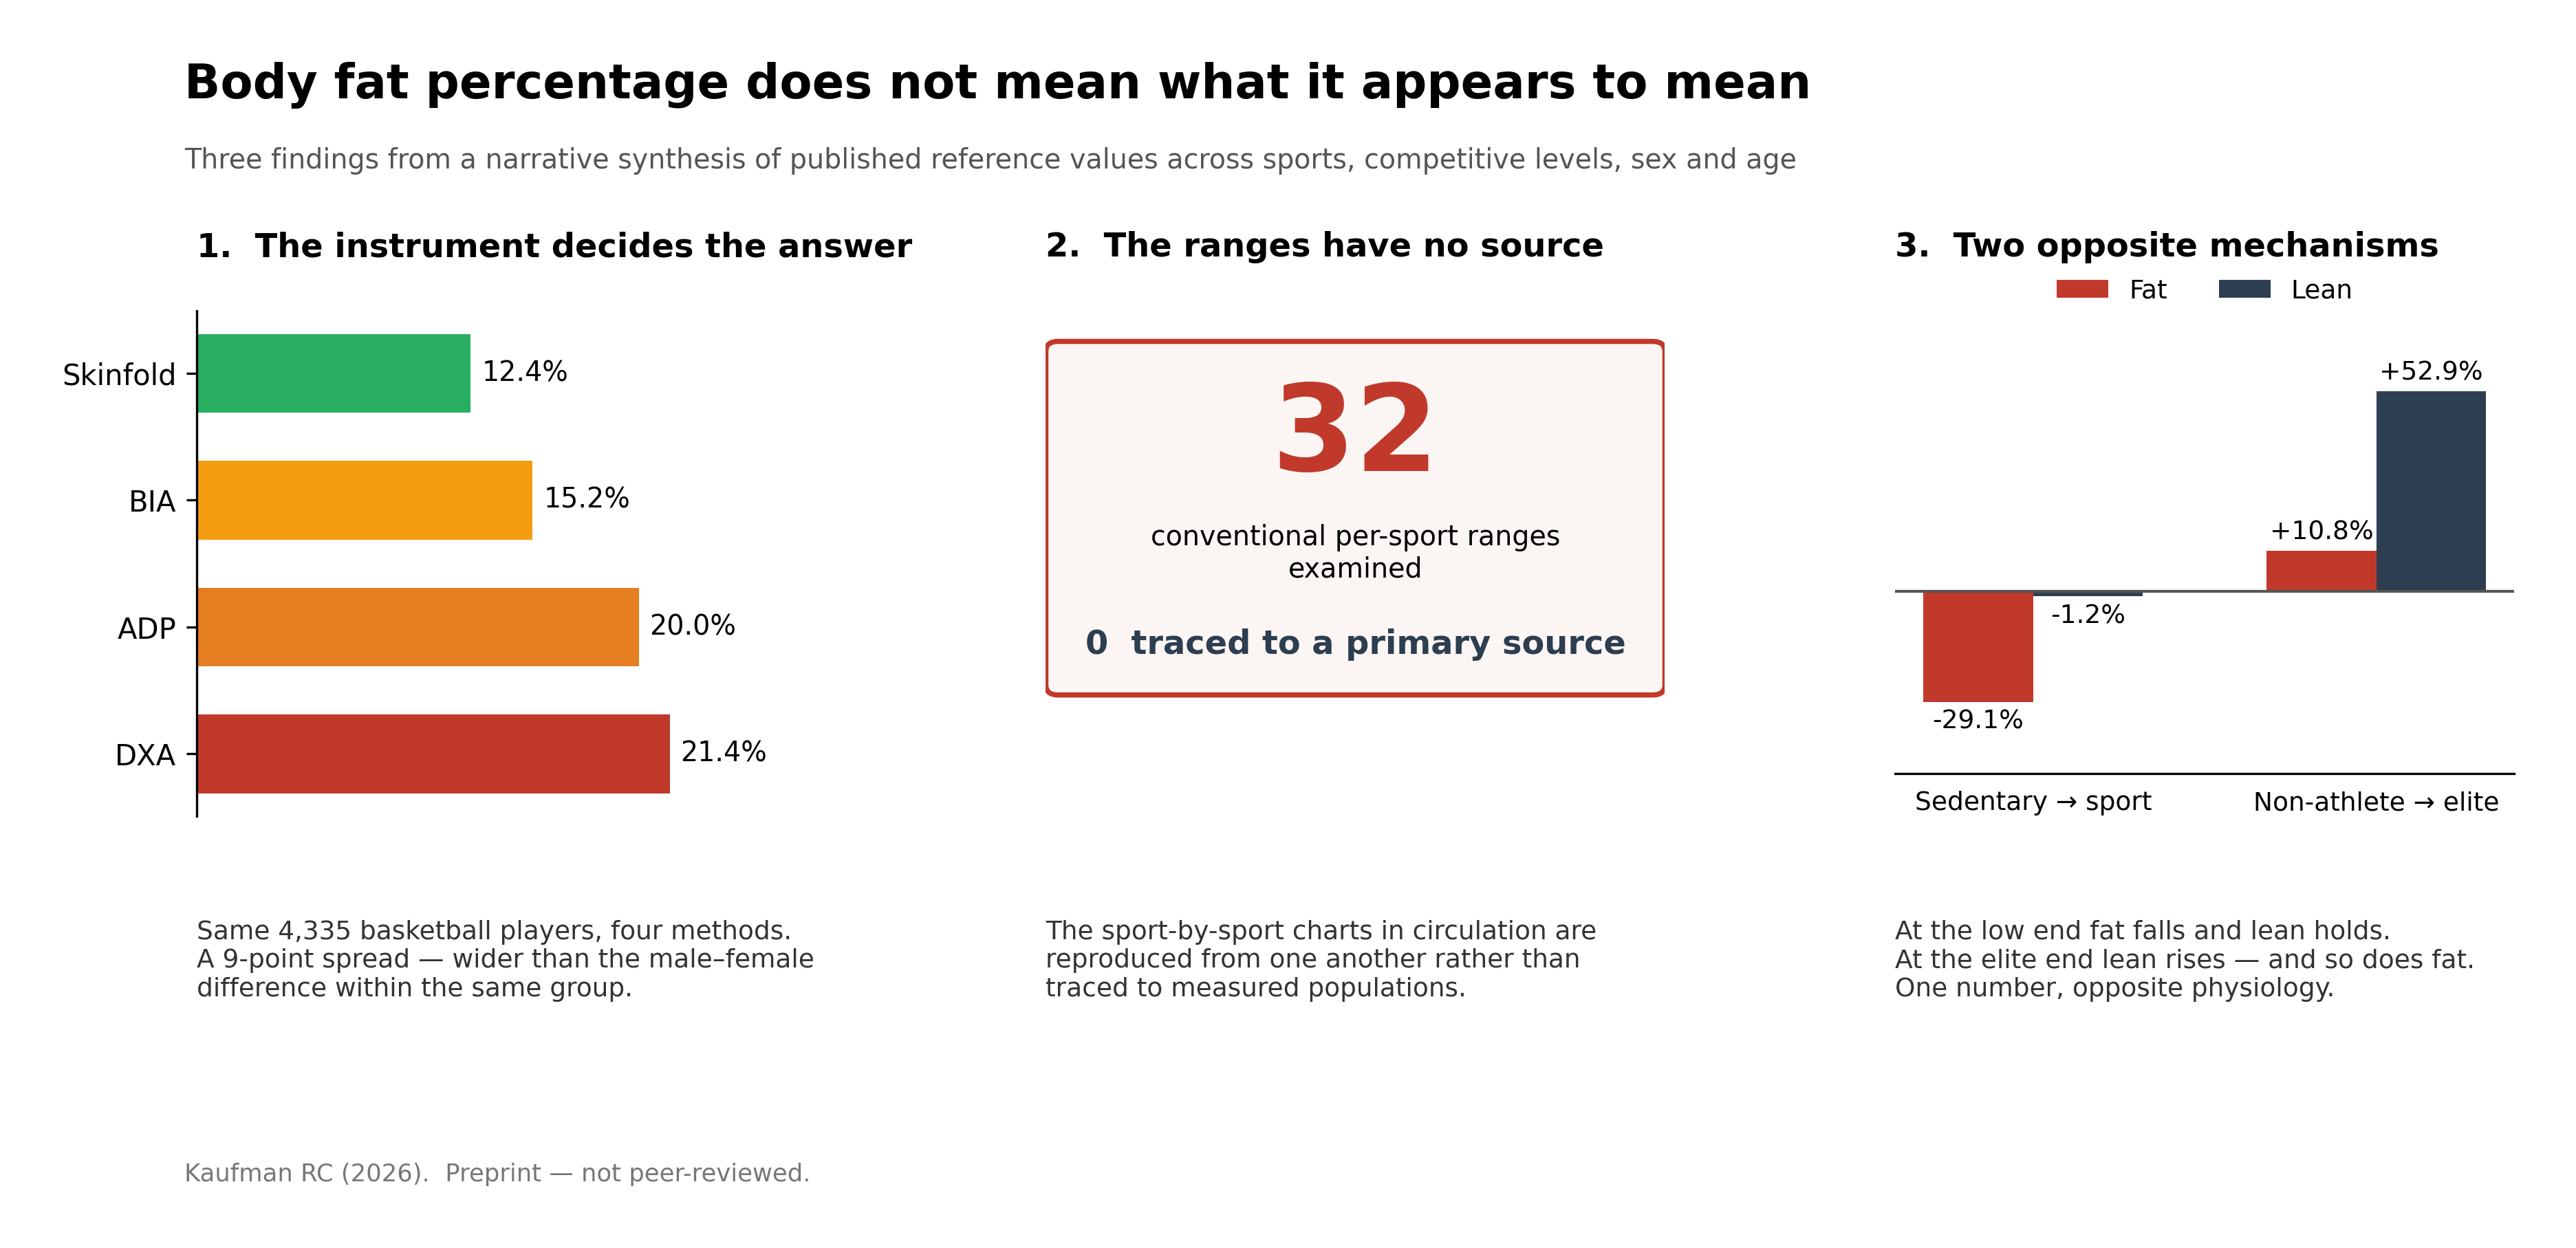
Background. Body fat percentage is considered in sports science as a stable, comparable, and interpretable measure. Athletes are compared to sport-specific reference ranges, values from different instruments are directly compared, and differences between sports are attributed to contact demands. None of these assumptions have been systematically tested, and the reference tables most widely used have not been verified against the primary literature they are thought to be based on. Objectives. To assess whether body fat percentage supports the comparisons typically made with it. Specifically: whether values obtained by different measurement methods are comparable; whether the conventional sport-specific reference ranges originate from primary sources; whether a single percentage has a consistent physiological meaning across the competitive spectrum; and whether contact classification accounts for differences in body composition between sports. Methods. A narrative review was conducted. Sources were identified through PubMed, publisher databases, and references from recent reviews. Each data point was categorized as Tier 1 (traceable to a primary peer-reviewed source with details on sample size, measurement method, and dispersion) or Tier 2 (common practitioner ranges without primary source attribution). Sports were organized using the American Academy of Pediatrics contact taxonomy, which served as the main stratification criterion and was evaluated against alternative classifications. Competitive level was determined using the Participant Classification Framework. Results. Tier 1 data included 5,144 athletes and 228 controls with reported sample sizes, along with 232 data points from a review of 90 studies [1]. Elite male athletes had a mean body fat of 14.1 ± 5.4% (range: 8.7–19.5%), and elite females averaged 21.8 ± 4.1% (17.7–25.9%). Contact level did not align with body type clustering; instead, body mass demand—which is a new classification introduced here—accounted for 68.6% of differences between sports, compared to 17.4% for contact level (permutation p = 0.0017). Measurement method influenced variance more than sex: in basketball, values ranged from 12.4% (skinfold) to 21.4% (DXA), a 9-point difference that exceeds the 7.6-point difference between males and females within the same sport. Combat sports (boxing, taekwondo) clustered at 9.8 ± 2.2%, the leanest group, similar to endurance sports. Collision team sports without weight classes (American football, rugby) averaged 15.9 ± 2.6%. Within collision team sports, positional differences exceeded differences between sports: NFL rosters averaged 17.9 ± 6.9%, with defensive backs around 12% and linemen over 25%. Of 32 ranges examined, none were identified within the search described in Section 2.2 as tracing to primary sources. Decomposition of the gradient at each end of the competitive range revealed two opposing mechanisms: below Tier 2, fat mass index decreased by 29.1% while fat-free mass index was unchanged (−1.2%); between Tier 0–1 and Tier 4–5, lean mass was 52.9% greater while fat mass was 10.8% greater in absolute terms. Coefficient of variation was approximately half as large in sports with low mass demand (20.1%) compared to capped (38.8%) or high (38.7%) mass demand sports. Conclusions. Body fat percentage combines two physiologically opposite processes and thus provides no clear information about which process is dominant: below Tier 2, a decreasing percentage indicates fat loss with stable lean mass, while at Tier 4–5, a lower percentage reflects lean mass gain against increasing fat mass. This offers a mechanistic explanation for why lean mass more reliably indicates training status than adiposity. It also suggests that fat mass index and fat-free mass index should be reported alongside, or instead of, body fat percentage. Contact level is not related to body composition. One possible explanation, proposed here as a hypothesis, is body mass demand—what the sport's mechanics and rules require in total mass—leading to low, high, or capped categories. Methodologically, body composition should not be used as a proxy or covariate for head-impact exposure in neurotrauma risk models, as these are independent factors. Standard sport-specific ranges generally align with Tier 1 data but should be viewed as heuristic rather than definitive values. Two additional analyses (by competitive tier and age) and an applied reference are included. All data are cross-sectional and only show associations. Data for female non-athletes and female sub-elite athletes could not be sourced.
Keywords:
body fat percentage
; fat mass index
; fat-free mass index
; body composition
; athlete monitoring
; reference values
; measurement methods
; dual-energy X-ray absorptiometry
; bioelectrical impedance
; skinfold thickness
; body mass demand
; sport classification
; contact sports
; collision sports
; combat sports
; American football
; soccer
; competitive level
; masters athletes
; female athletes
; relative energy deficiency in sport
; evidence provenance
; narrative review
1. Introduction
Body fat percentage is one of the most frequently measured variables in applied sport science, and its use rests on three assumptions that are rarely examined together. The first is that the number is comparable: that a value obtained from one athlete can be set against a value obtained from another, or against a published range. The second is that the reference ranges themselves are sourced: that the sport-specific charts in circulation derive from measured populations. The third is that the number is interpretable: that a lower percentage means the same thing wherever it is observed. This synthesis examines each assumption against the published literature. None of the three is supported.
Body composition holds a distinct place in sports science. It is one of the most frequently measured variables in practice but is often mentioned loosely. Practitioners often compare athletes to sport-specific ranges, yet the origins of these ranges are rarely questioned. Many are presented as standard values across textbooks, commercial services, and guidance materials without clear connections to primary data sources.
The idea that contact and collision sports favor a particular body composition seems plausible. Athletes involved in force absorption and delivery are believed to carry more mass, and the higher adiposity seen in American football linemen is well documented. However, whether this applies broadly to contact sports has not been formally tested using a contact taxonomy.
This issue is more than just descriptive. As models for head-impact dose and neurotrauma burden become more advanced, they increasingly include anthropometric factors. If body composition correlates with contact exposure, it could be a valuable variable. If not, including it could create confounding without benefit. Determining this relationship is therefore a crucial step, not just a minor detail.
This review explores three questions: what does peer-reviewed research actually reveal about body composition in athletes across sports? Can typical practitioner ranges be traced back to original research? And does contact classification predict body composition?
1.1. Purpose and Contribution
The three assumptions fail in three specific and separately demonstrable ways, and the sections below are organized around them. Measurement modality pushes a pooled sport mean further than sex does, and the direction of that bias reverses between populations, so values obtained by different methods are not comparable and cannot be reconciled with a correction factor. None of the 32 conventional per-sport ranges examined were found to trace back to a primary study reporting those boundaries. Additionally, the quantity itself conflates two opposing processes: below Tier 2, a falling percentage reflects fat loss against stable lean mass, while at Tier 4–5, a lower percentage reflects lean mass gain against rising fat mass. Therefore, a single number summarizes opposite physiology depending on where in the competitive range it is observed.
A fourth finding arises from the same examination. The assumption that contact exposure explains body composition differences between sports is not supported: contact category accounts for 17.4% of the variance between sports, and a classification based instead on what a sport’s mechanics require of total mass accounts for 68.6%. The paper outlines the boundaries of each of these claims below.
The problem. While sport-specific body fat reference ranges are commonly used, their primary sources haven’t been verified. Additionally, the assumption that contact exposure predicts body composition hasn’t been tested against a formal contact taxonomy.
What this paper does. It examines the origins of these traditional ranges, assesses contact classification with verified data, proposes body mass demand as an alternative classification, and compares the differences between the two.
What it does not claim. This study is cross-sectional and only identifies associations; it does not imply causation regarding training, sport participation, or competitive progress. It also does not report on health, injury, or mortality outcomes.
What would refute it. The body mass demand framework becomes invalid if the contact category still significantly explains fat mass index after controlling for body mass demand in single-modality measurements. Appendix A provides details of this study and its rejection criteria.
Status of the claims. This is a narrative synthesis of published values. It does not generate any new primary data. The classification proposed in Section 2.7 is presented as a hypothesis, not as an established finding, and the comparison supporting it is a descriptive re-analysis of published summary statistics. When the text reports that a source was not identified, this reflects the outcome of the search described in Section 2.2 and does not claim that such a source does not exist.
A note on method. The source-traceability assessment outlined in Section 3.10 is presented as a portable method rather than a feature of this paper. It involves tracing every numerical value in circulation back to its primary source and then reporting the identified and unidentified fractions separately. This approach applies in any field where reference values circulate more quickly than their citations can be verified.
2. Methods
2.1. A Structured Synthesis, Not a Systematic Review
This is a structured narrative synthesis with an embedded source traceability assessment. It is not a systematic review, was not registered with PROSPERO, and does not claim comprehensive coverage of the primary literature. The design was selected because the main research question centers on the traceability and interpretation of existing reference values rather than combining a new effect size.
2.2. Where the Evidence Was Drawn From
The research question, evidence-tiering framework, source-traceability assessment, body mass demand classification, decomposition analysis, and all conclusions are the intellectual work of the author. A large language model was used as an assistive tool for literature retrieval, manuscript drafting, and figure code generation. It was not used to generate content in place of the author’s own analysis. Every numerical value reported was traced to and checked against its cited source by the author.
2.3. Every Value Graded by Source Traceability
Every numerical value considered for inclusion was assigned to one of two tiers.
Tier 1. Traceable to a specific primary peer-reviewed source that reports the sample size, measurement method, and a measure of dispersion. Tier 1 values include the data used in the analysis and are the only values recommended for citation.
Tier 2. Conventional practitioner ranges that are widely circulated often lack primary source documentation of their exact boundaries. Tier 2 values are included for completeness and comparison and are clearly marked throughout. They are not used to support any inferential claims in this synthesis.
This tiering system itself is an important methodological contribution. A reference range whose origin cannot be verified is not necessarily incorrect, but it cannot carry evidentiary weight, and this distinction is not usually made in most practitioner-facing materials.
2.4. Sports Classified by Intended Contact, Not Injury Risk
Sports are categorized based on the taxonomy created by the American Academy of Pediatrics Council on Sports Medicine and Fitness [10]. In collision sports, athletes intentionally hit or collide with each other or with inanimate objects, including the ground, with considerable force; common examples include boxing, ice hockey, American football, lacrosse, and rodeo. In contact sports, athletes regularly make contact with each other or inanimate objects, usually with less force; typical examples are basketball and soccer.Limited-contact sports involve infrequent or accidental contact, while non-contact sports are characterized by rare and unanticipated contact.
Two caveats affect this taxonomy and how it is interpreted. The clinical report that established this framework was retired in July 2018 and has not been replaced by an equivalent classification [10]; however, it remains the most widely used model in sports medicine literature. The Academy also noted at the time of publication that the categorization does not perfectly reflect injury risk, and that limited-contact and non-contact sports may pose similar or even higher risks through different mechanisms. Therefore, the taxonomy here is used to classify intended mechanical contact, not as a measure of injury risk.
A third caveat relates to the internal structure of the taxonomy. The difference between collision and contact sports is a matter of degree, not kind: both involve intentional contact, varying only in force magnitude. The Academy has not set a specific threshold for when one becomes the other. For example, a soccer player contesting an aerial ball and an ice hockey player delivering a body check are both engaging in deliberate contact. Since this analysis tests the taxonomy rather than assuming it, the boundary between collision and contact sports is treated as a modeling choice, and its effect on outcomes is examined in Section 3.10.
Another issue concerns the category labels rather than the boundary itself. The term collision suggests body-to-body impact, as seen in American football, rugby union, and ice hockey. However, it does not accurately describe striking disciplines like boxing, where a gloved hand strikes a target without actual body collision at speed. The Academy’s criterion—purposeful contact delivered with great force—does include boxing, but the term used to define that criterion does not fully reflect the mechanism involved. Consequently, this category groups a striker with an interior lineman, despite their distinct impact mechanisms and anatomical sites. The taxonomy is applied here as published, but this mismatch between label and mechanism influences the interpretation of the primary results and will be discussed in Section 6.4.
2.5. What “Elite Professional” Means Here
The word “elite” has been described by the authors of the standard classification framework [19] as perhaps the most overused and poorly defined term in the sport-science and sports-medicine literature. A synthesis that reports reference values for elite athletes without defining the term inherits that ambiguity and passes it on to the reader. This synthesis therefore adopts the Participant Classification Framework of McKay and colleagues, a six-tier taxonomy that classifies participants based on training volume and performance metrics rather than self-description. Tier 0 is Sedentary; Tier 1 Recreationally Active; Tier 2 Trained or Developmental; Tier 3 Highly Trained or National Level; Tier 4 Elite or International Level; and Tier 5 World Class. The framework is explicitly designed for retrospective use during systematic reviews and meta-analyses, which is how it is employed here.
Operational definition. For the primary analysis, an elite professional athlete refers to Tier 4 or Tier 5 [19]: an athlete competing at the international level, in a top national division or professional league, on a national team, or holding a world-class ranking, with sport as their main occupation. Sub-elite refers to Tier 2 to Tier 3. Non-athlete indicates Tier 0 to Tier 1. If a source does not specify the competitive level in terms that allow tier classification, the sample is marked as unclassifiable and excluded from tier-based analysis rather than inferred.
2.6. Analysis Hierarchy and Pre-Specification
This synthesis reports analyses of two kinds, and the distinction is substantive rather than presentational, because it governs how much weight each result can bear.
Pre-specified. The examination of source traceability and the contact classification test against the verified data (Section 3) were specified before extraction, along with the search strategy, evidence tiering, and contact taxonomy.
Not pre-specified. The tier gradient and the decomposition of body fat percentage into its compartments (Section 4) became possible only after extraction revealed that several sources reported tier-stratified subgroups and compartment masses. The decomposition reported in Section 4.1 was not anticipated by the design.
Not pre-specified. The examination of age (Section 5) is reported principally to characterize a gap in the evidence base rather than to estimate an effect.
2.7. An Alternative Classification, Derived Inductively
Body composition data were first categorized by contact type. When this categorization did not result in clear groupings, an alternative classification was developed inductively based on the morphotype clustering described in the Tier 1 source material. The term introduced here for this alternative is body mass demand. It is presented in this paper and is not derived from existing literature.
Definition. Body mass demand refers to what the rules and mechanics of a sport require from an athlete’s overall weight—whether performance improves as mass decreases, gets better as mass increases, or is limited by a regulatory cap.
The definition yields three categories directly.
Low mass demand. The athlete moves their own body weight against gravity or over distance, so every kilogram of non-contractile tissue has a direct energy cost. Performance improves as mass decreases.
High mass demand. Body weight is applied to an opponent or object, providing momentum or leverage, with no effective limit. Performance improves as mass increases.
Capped mass demand. Both conditions work together—the athlete must move mass and exert force—and the rules address the conflict by setting a class limit. Mass is treated as a limited resource. [25,26]
Assignment rule. A sport is defined by asking whether adding a kilogram of non-contractile mass would improve or impair performance, and whether the rules set a limit. The classification is based solely on the sport’s competitive rules, without considering any measured body composition value, ensuring that the classification stays independent of the outcome it aims to predict.
The term is used in its common sense to refer to what a sport requires from total body mass. It relates to mass as an input to performance, not the division of that mass into fat and lean components, which is the outcome measured throughout this synthesis.
The two classifications were then compared directly for the variance explained, as reported in Section 3.10.
2.8. Analysis Parameters
Six classification parameters are used in this synthesis. Two of them—contact category and body mass demand—are competing classifications of sport and are tested directly against each other in Section 3.10. The remaining four are stratification variables applied throughout. Table 1 lists each parameter, its levels, the basis on which sports or samples were assigned, and the sections and tables where it is analyzed.
3. Results
3.1. The Contact Taxonomy Applied to Included Sports
Table 2 presents the contact classification of the disciplines represented in the synthesis.
Evidence hand-off. This taxonomy is used as the main stratification variable. Section 3.3 examines whether body composition follows it.
3.2. Reported Values for Both Sexes
The primary Tier 1 source is a comprehensive review that synthesizes 90 studies and 232 data points across 61 sports, published from 1995 to 2024 [1]. It includes athletes aged 12 to 45 years, with a mean age of 24.0 ± 5.4 years. The pooled body fat percentage for elite male athletes is 14.1 ± 5.4%, with an elite zone defined as within ±1 standard deviation, ranging from 8.7% to 19.5%. For elite female athletes, the pooled value is 21.8 ± 4.1%, with an elite zone between 17.7% and 25.9%. Values broken down by measurement method are shown in Table 3.
The difference between indirect methods (dual-energy X-ray absorptiometry, air-displacement plethysmography, hydrostatic weighing) and doubly indirect methods (bioelectrical impedance analysis, ultrasound, anthropometry) is significant: the central estimates are similar, but the variability is much wider for doubly indirect measurements, causing the ±2 SD interval for male athletes to expand from 6.4–20.8% to 3.3–24.1%.
3.3. Morphotype Clusters Do Not Correspond to Contact Categories
The Tier 1 source classifies athletes by morphotype using the Hattori chart [3], which differentiates fat mass index from fat-free mass index instead of combining them into a single [13] ratio. Three morphotypes make up most male elite athletes. Their composition is shown in Table 4, along with the contact classification of the involved sports.
The main finding of this review is displayed in the right-hand column of Table 4. The leanest morphotype includes boxing and taekwondo—both collision sports according to the AAP taxonomy—along with marathon running and gymnastics. The intermediate solid cluster consists of American football, rugby, and water polo. The adipose solid cluster includes sumo, American football linemen, and heavyweight powerlifting, which is non-contact. No morphotype falls into a contact category, and the leanest cluster spans all four categories at once.
Evidence hand-off. The failure of the morphotype to align with the contact category is the key finding that drives Section 4.1 and Section 4.2. It is not a result of aggregation; Section 3.4 confirms that the aggregation issue works in the opposite direction.
3.4. Within Collision Sports, Position Matters More than Sport
Collision team sports exhibit greater variation within the sport than between different sports, making the sport-level average an inadequate summary. In a dual-energy X-ray absorptiometry [2] study of 346 National Football League players, the total body fat was 17.90 ± 6.92%, compared to 22.93 ± 8.96% in 228 age-matched controls. The difference was not statistically significant (p = 0.053), a nuance often overlooked when this comparison is cited. Conversely, total lean mass was significantly different: 84.55 ± 8.75 kg versus 55.3 ± 11.79 kg (p < 0.0001).
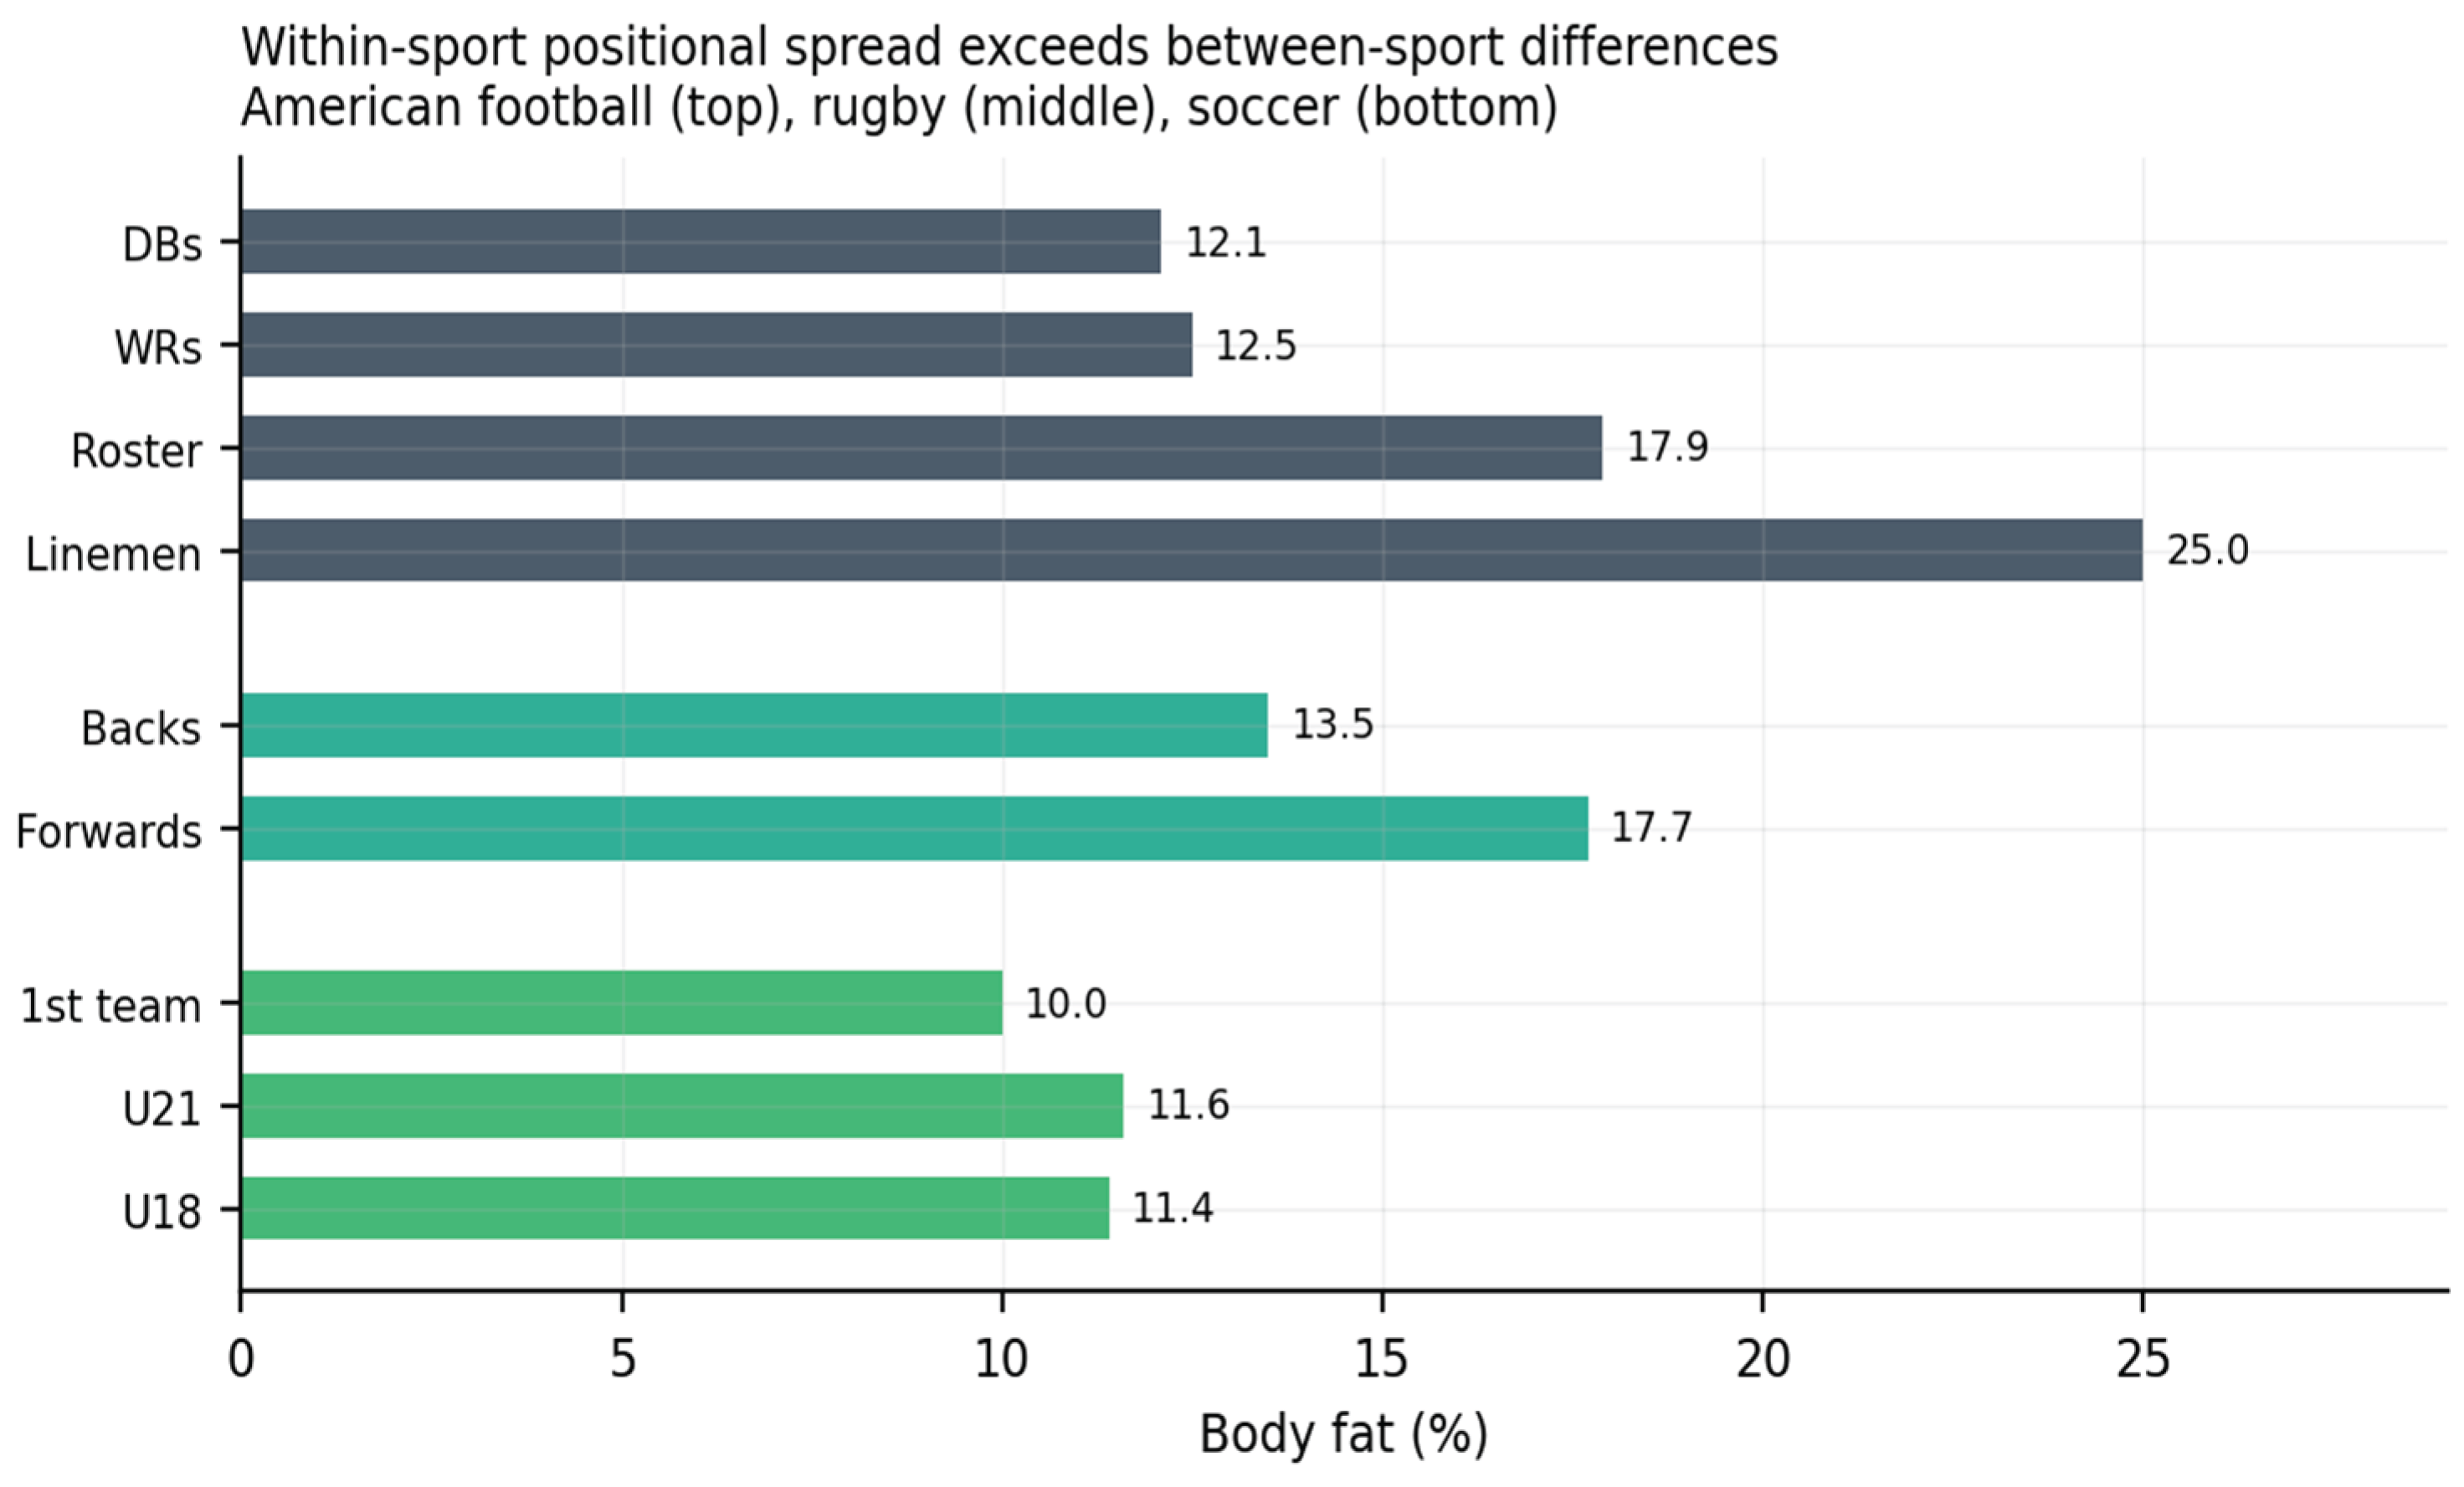
Position-specific data clarifies this point. In a separate group of 411 players assessed by the same method [4], defensive backs averaged 12.1% and wide receivers 12.5%, with the leanest individual at 7.1%, while offensive linemen often exceed 25%. Therefore, a single sport contains two of the three morphotypes listed in Table 4 simultaneously. Any analysis that treats American football as a single body composition category is essentially describing an artifact of aggregation.
Evidence hand-off. Positional heterogeneity within a single collision sport includes two of the three morphotypes. Any sport-level averages presented in the following tables should be understood with this in mind.
3.5. Per-Sport Values with Reported Sample Sizes, and Missing Medians
Table 5 presents all sport values in this synthesis that can be traced to a primary source reporting its own sample size. This represents the complete Tier 1 corpus. Sports not listed in the table are missing because no qualifying source was found, not because they were excluded.
Two points about the table are worth noting. First, medians are mostly missing. Among the sources reviewed, only one provided percentile data; the others only report means and standard deviations. When a median is not listed, it is marked NR rather than estimated because calculating a median from a mean and standard deviation requires assuming a distribution that the data do not support. Second, sample sizes vary greatly, from nine judokas to 4,335 basketball players, which affects the reliability of the respective means.

Table 6.
Tier 1 comparator values outside the six-sport set.
| Sport or group | Sex | n | Mean % | SD / CI | Method | Source |
|---|---|---|---|---|---|---|
| Basketball | M | 4335 | 13.1 | 95% CI 12.4–13.8 | Mixed | Sansone et al. 2022 [14] |
| Basketball | F | 4335 | 20.7 | 95% CI 19.9–21.5 | Mixed | Sansone et al. 2022 [14] |
| Wrestling (Greco-Roman) | M | 29 | 15.7 | ± 4.1 | MFBIA | Baranauskas et al. 2023 [15] |
| Judo | M | 9 | 16.1 | ± 7.4 | MFBIA | Baranauskas et al. 2023 [15] |
| Non-athlete controls | M | 228 | 22.93 | ± 8.96 | DXA | Dengel et al. 2023 [2] |
| All elite, pooled | M | 232‡ | 14.1 | ± 5.4 | Mixed | Martinez-Mireles et al. 2026 [1] |
| All elite, pooled | F | 232‡ | 21.8 | ± 4.1 | Mixed | Martinez-Mireles et al. 2026 [1] |
‡ = 232 study-level data points across 90 studies and 61 sports, not individual subjects. Only one source in the entire Tier 1 corpus—Baranauskas et al.—reports percentile structure, providing a single median range of 14.8–18.8% for pooled combat athletes; that pooled value is included here for completeness only and is not used in the six-sport analysis.
3.6. How Many Athletes the Evidence Represents
Table 7 summarizes the evidence base. The distinction between individuals and study-level data points remains because merging them would misrepresent the strength of the scoping review evidence, where each data point is a group mean from a separate study.
3.7. Head-Impact Burden Rank Against Body Composition
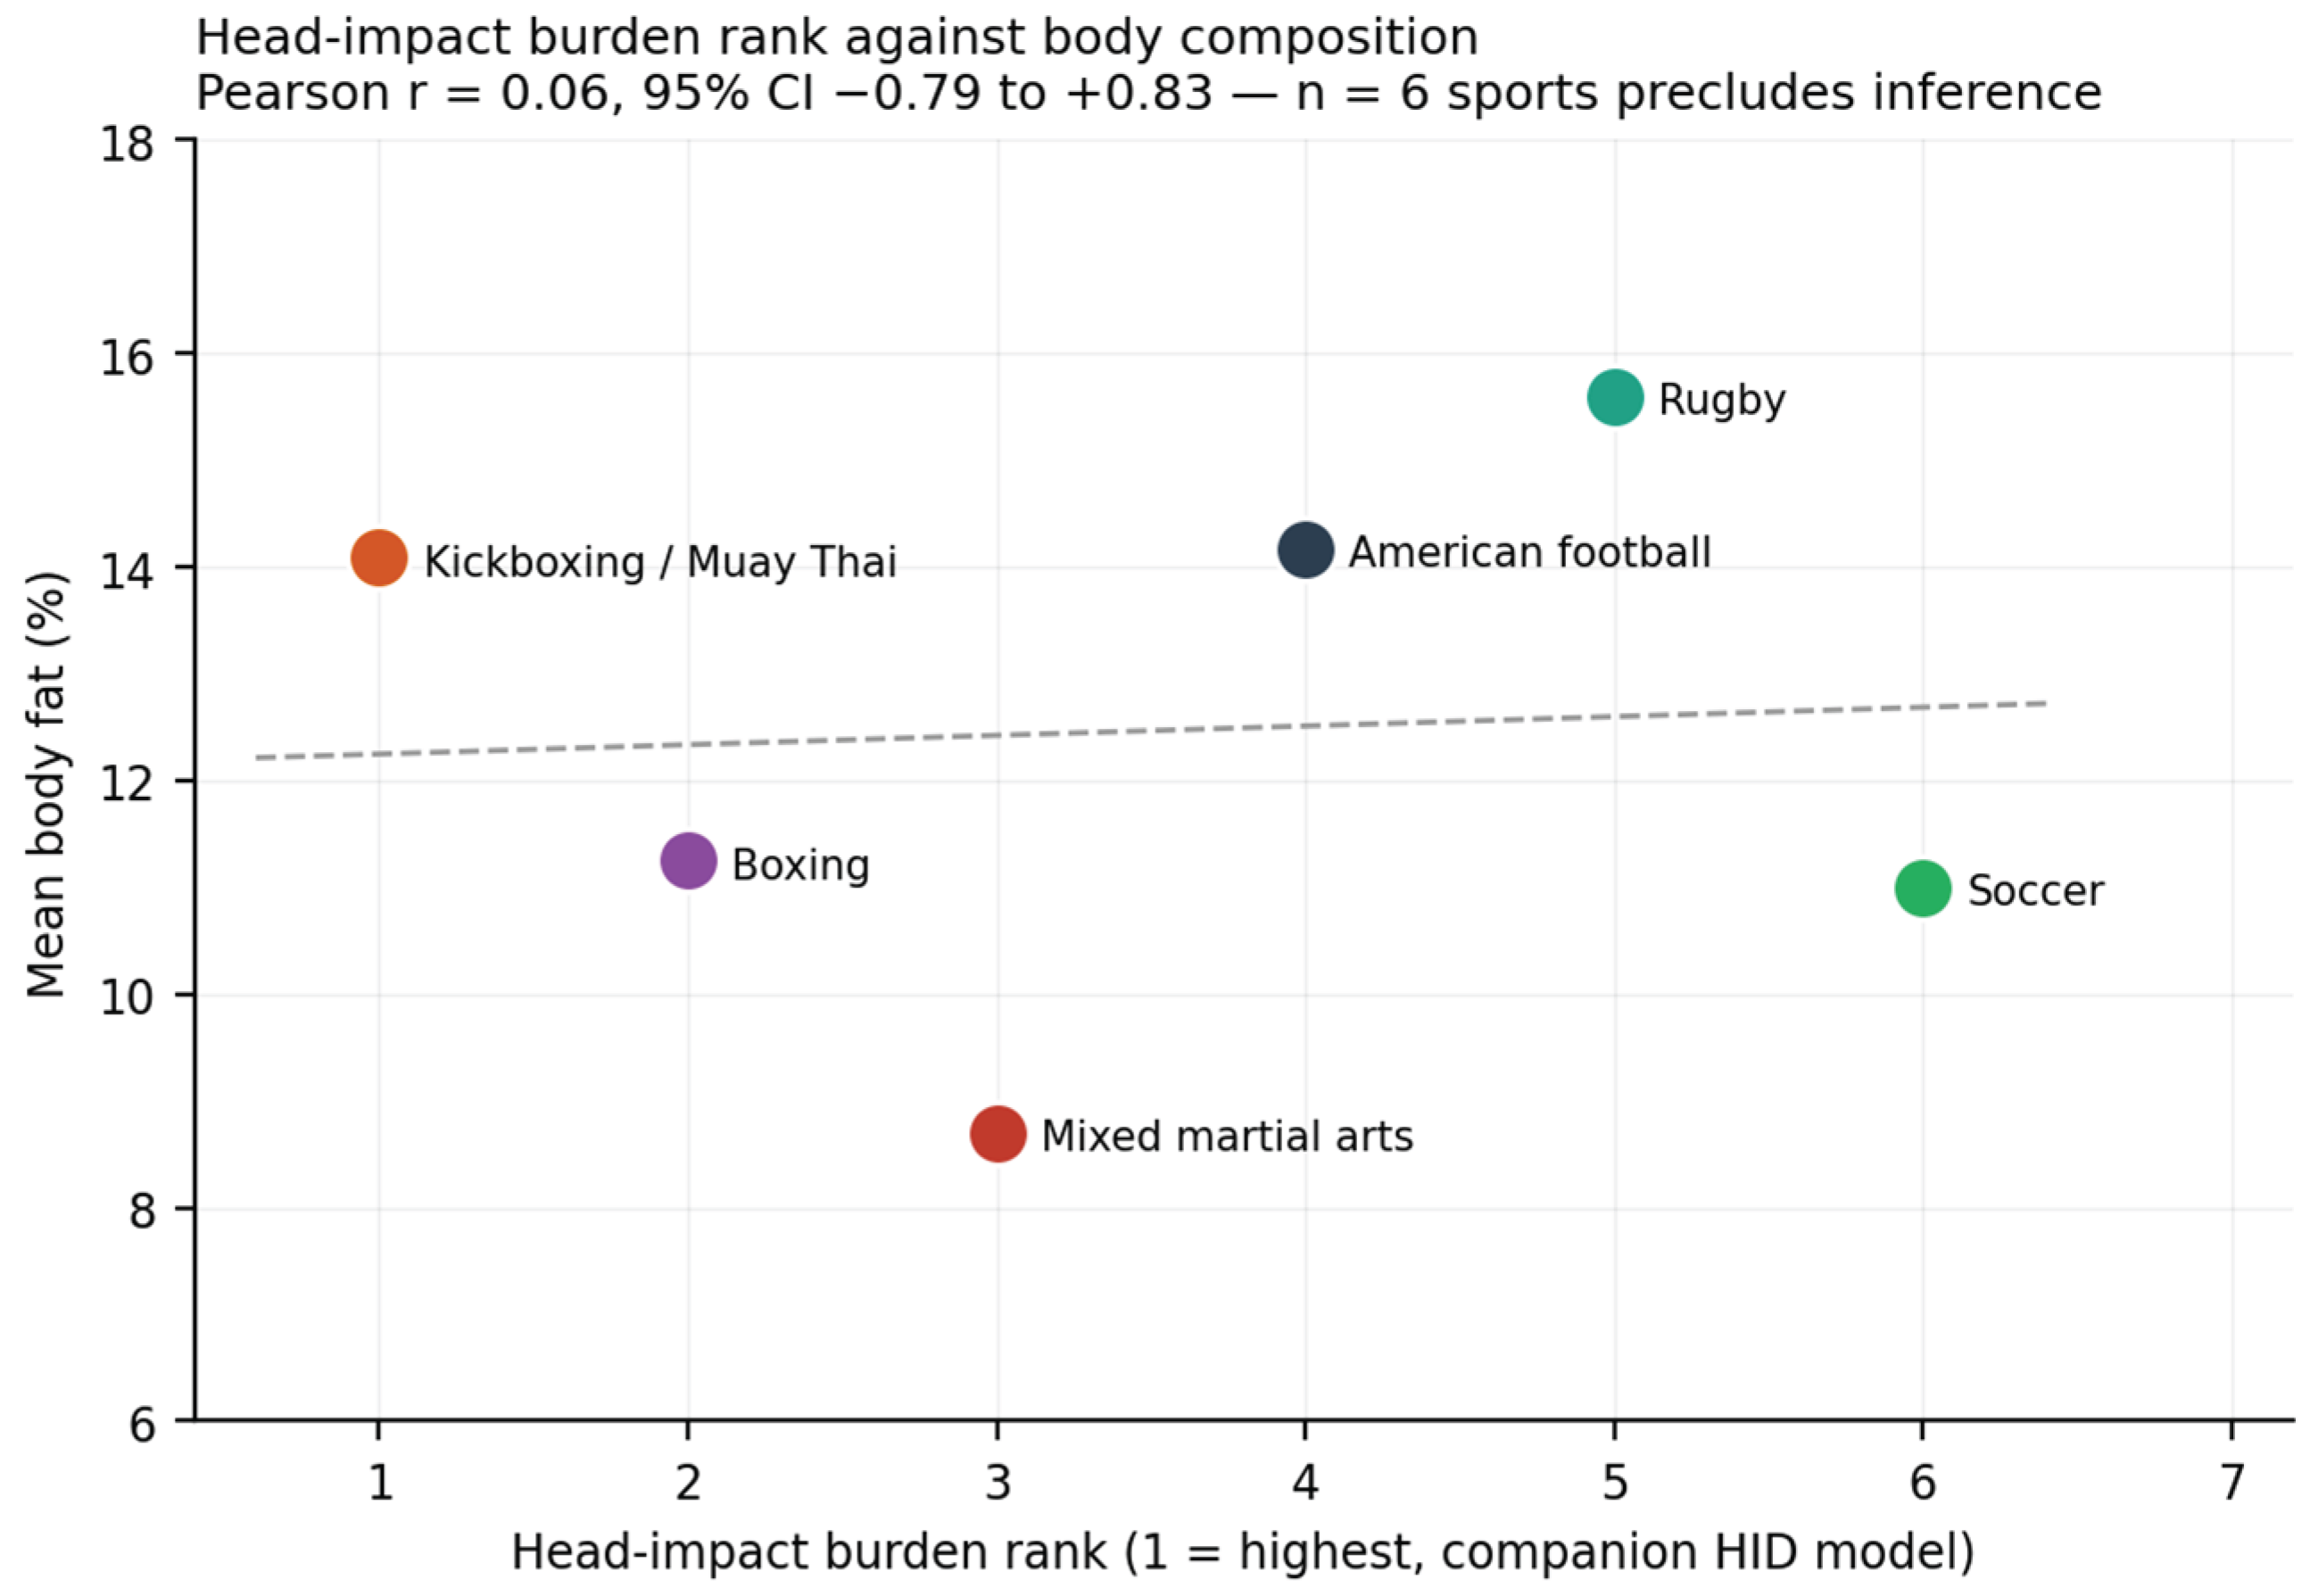
Because the six sports in Table 5 are the same six examined in the companion Normalized Head-Impact Dose model [23], the two datasets can be compared directly. Ranking the sports by modeled cumulative head-impact burden and plotting that rank against average body fat yields a Pearson correlation of r = 0.06. The 95% confidence interval for that estimate, with six observations, ranges from −0.79 to +0.83—essentially the entire possible range. The correct statement is not that no association exists but that six sports are too few to detect one in either direction. The comparison is included because the sport sets are identical and the plot is useful to examine, not because it serves as a formal test.
The descriptive pattern is still worth noting. Kickboxing and Muay Thai have the highest estimated head-impact burden among the six sports, with 14.09% body fat. Soccer has the lowest burden, at 10.0% in its professional first-team squad. American football, ranked fourth out of six for burden, shows the highest overall adiposity at 17.90%. The two rankings do not match, but with only six sports, this is a sample observation rather than evidence of a relationship. The argument in Section 6.5 relies on the morphotype analysis in Section 3.3, which doesn’t depend on this correlation.
Figure 1.
Body fat percentage across six contact sports in the Normalized Head-Impact Dose model. Each point represents a separate Tier 1 value; the black bar shows the sport mean. Sports are displayed individually, with no pooling of combat sports, to align with the companion model.
Figure 1.
Body fat percentage across six contact sports in the Normalized Head-Impact Dose model. Each point represents a separate Tier 1 value; the black bar shows the sport mean. Sports are displayed individually, with no pooling of combat sports, to align with the companion model.
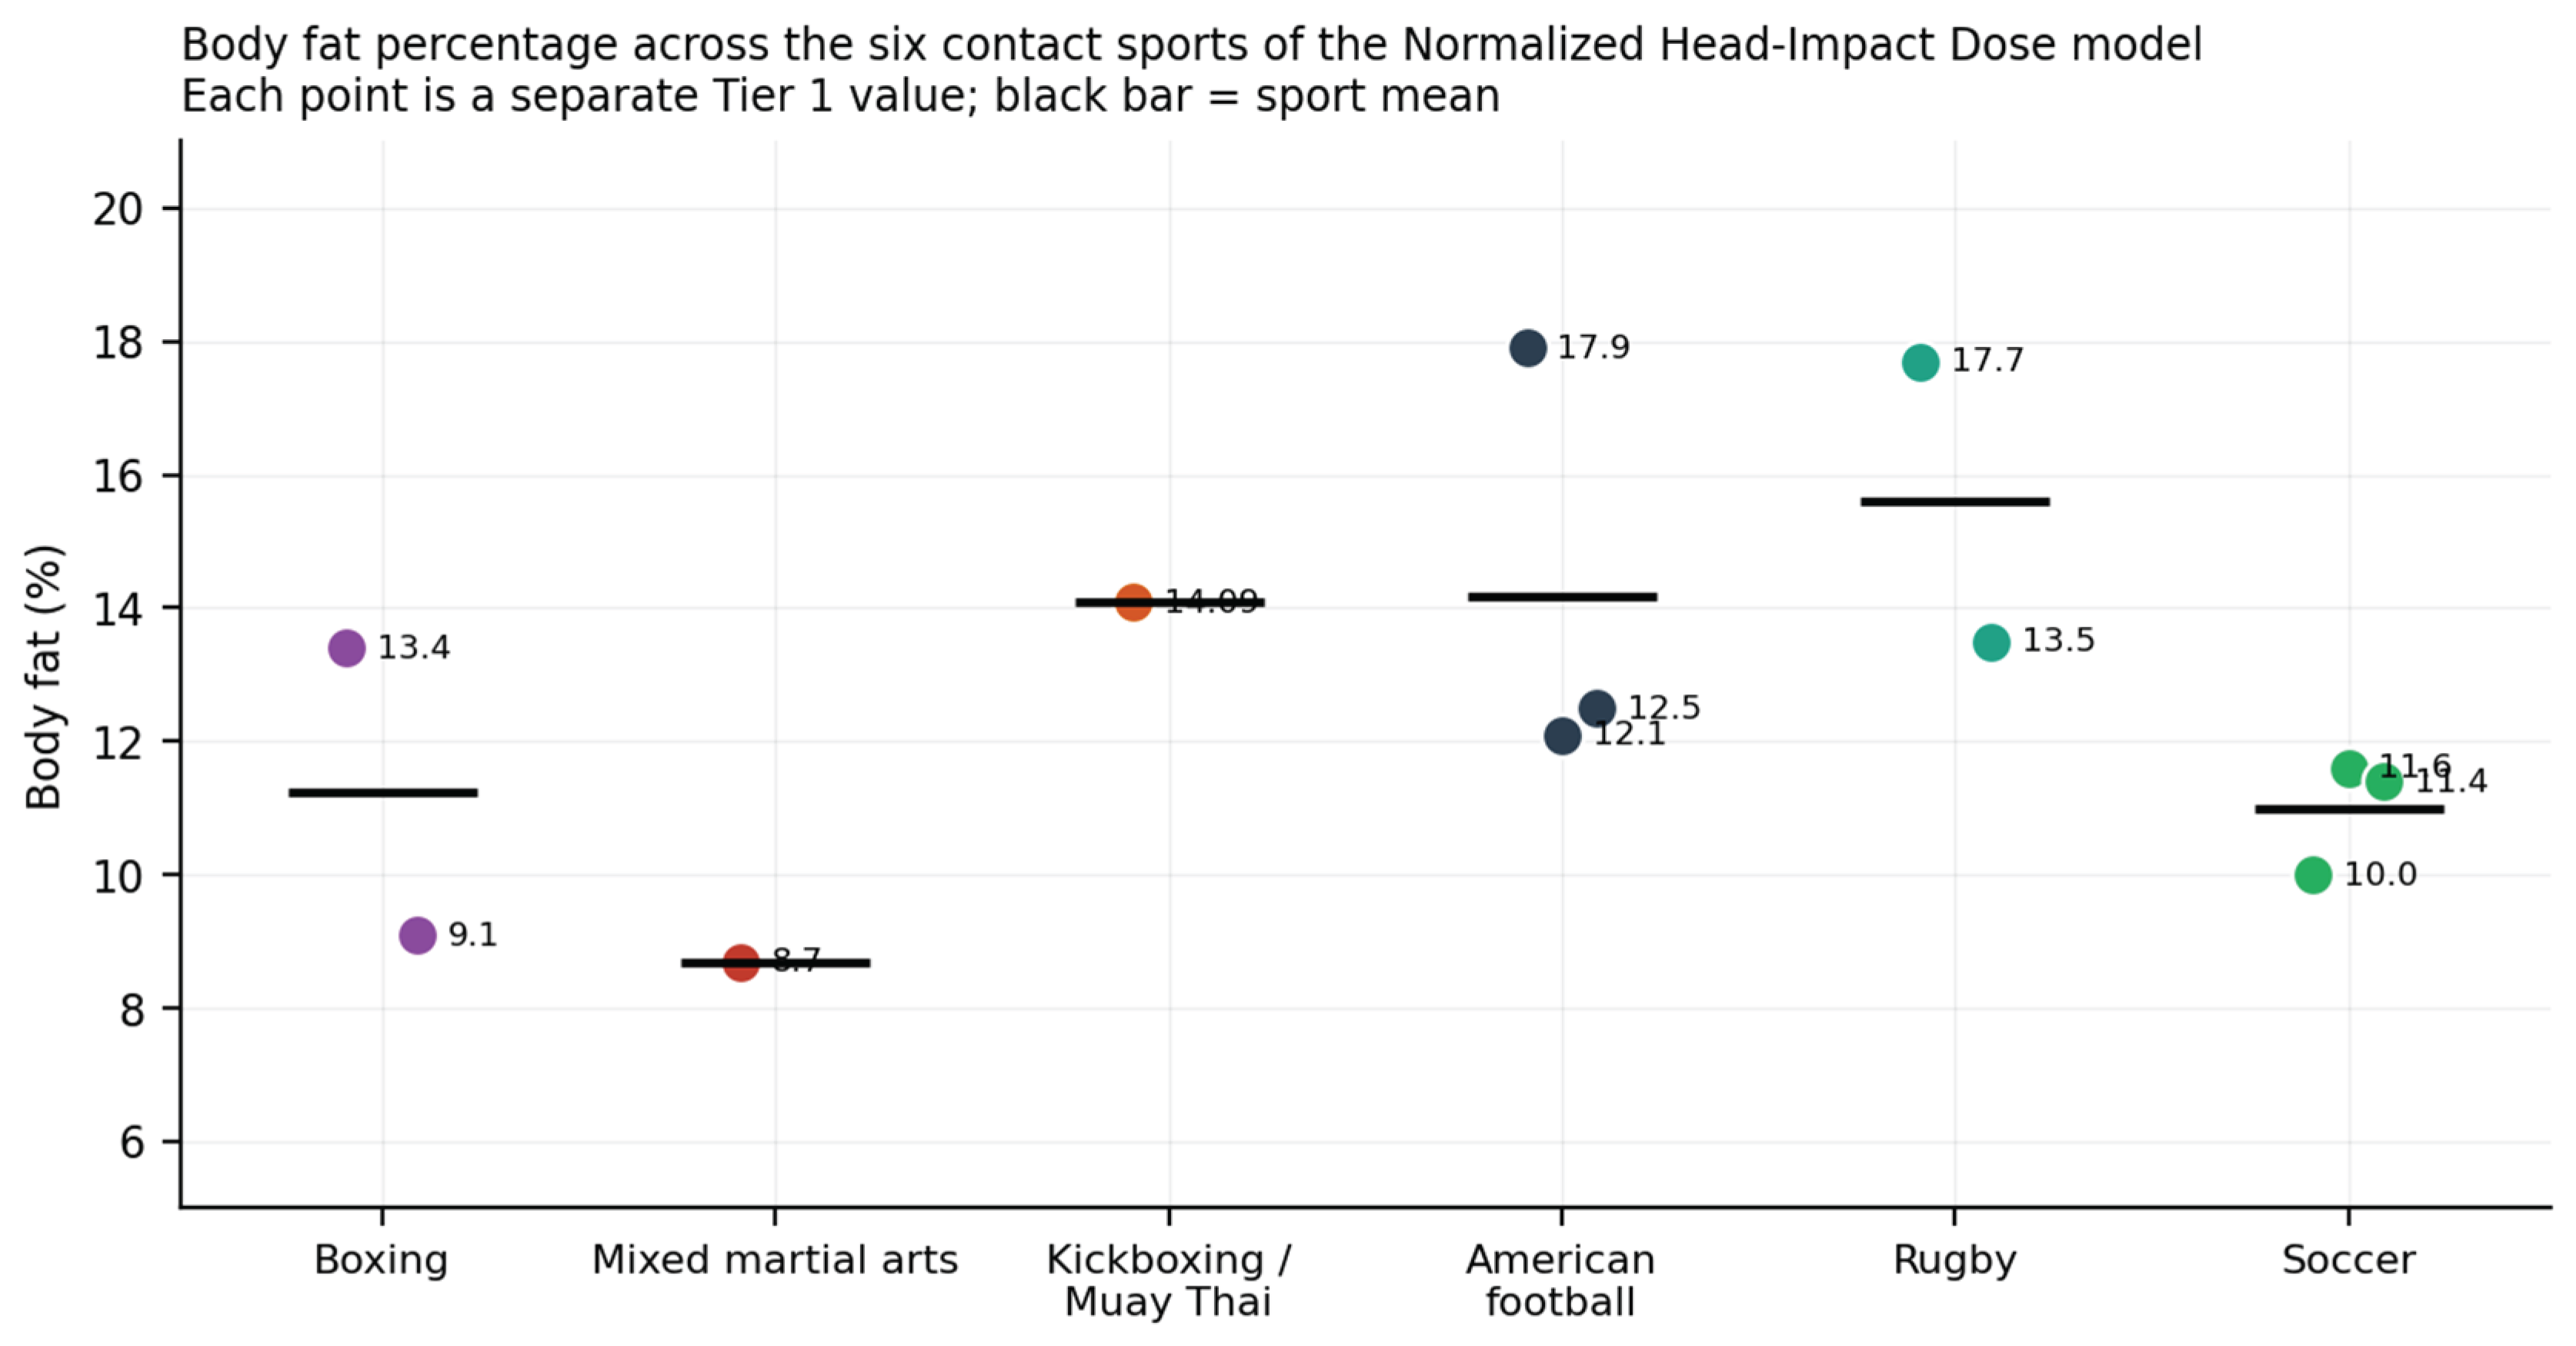
Figure 2.
Modelled head-impact burden rank plotted against mean body fat percentage for the six sports. Pearson r = 0.06 (95% CI −0.79 to +0.83; n = 6 sports, which precludes inference). Burden ranks are derived from the companion Normalized Head-Impact Dose model; body fat values are the Tier 1 sport means from Table 5.
Figure 2.
Modelled head-impact burden rank plotted against mean body fat percentage for the six sports. Pearson r = 0.06 (95% CI −0.79 to +0.83; n = 6 sports, which precludes inference). Burden ranks are derived from the companion Normalized Head-Impact Dose model; body fat values are the Tier 1 sport means from Table 5.
3.8. The Instrument Moves the Answer More than the Athlete
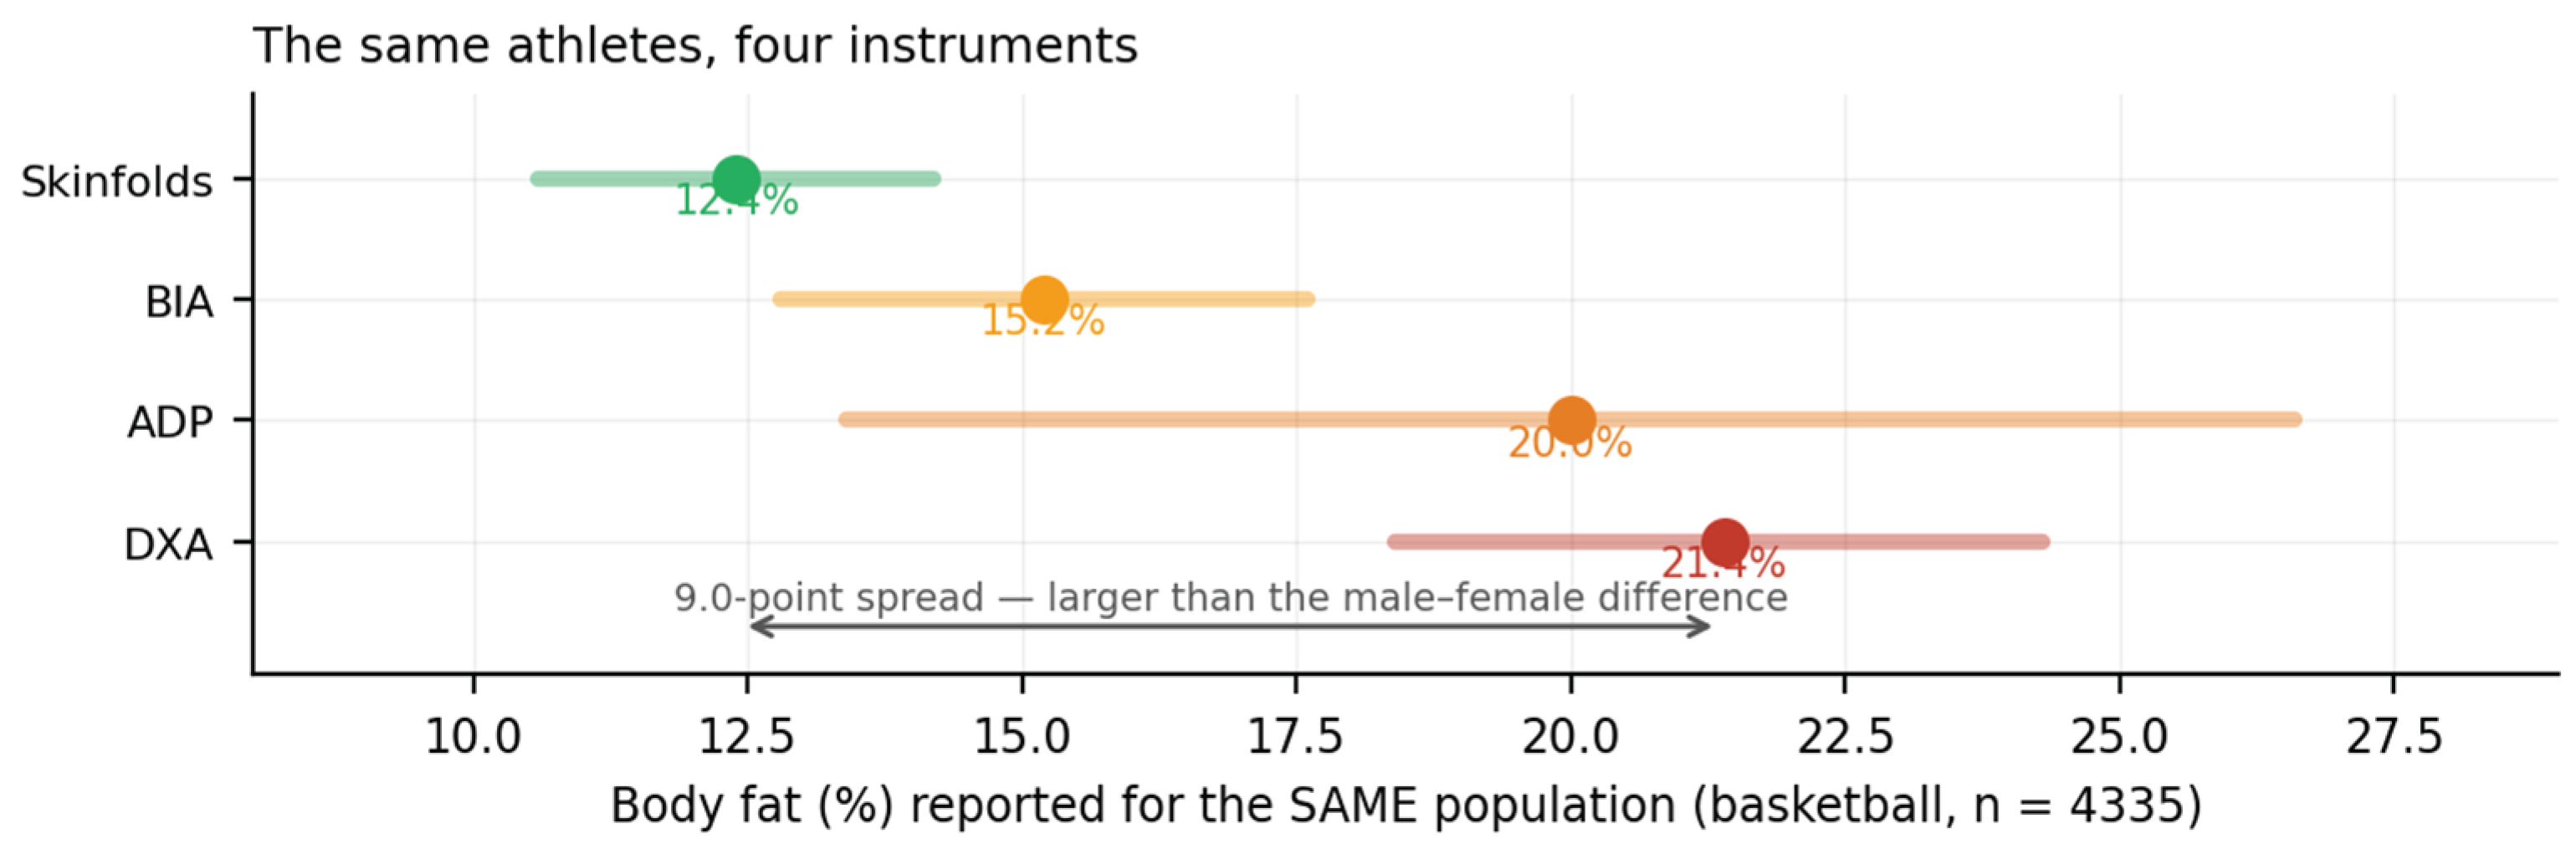
The most notable quantitative finding in this synthesis was unexpected given its design. In basketball alone, a sport with a combined sample of 4,335 players [14], the choice of measurement method caused the average to vary across a wider range than the difference between men and women in the same group. Values were 12.4% by skinfold, 15.2% by bioelectrical impedance, 20.0% by air-displacement plethysmography, and 21.4% by DXA—representing a 9.0-point variation, compared to a 7.6-point difference between males and females.
The same pattern appears in combat sports, where two separate groups allow for direct comparison within the same sport across different methods [5,15]. DXA-based measurements were 9.1% for boxing, 13.1% for wrestling, and 14.5% for judo; similarly, multi-frequency bioimpedance measurements in a comparable population were 13.4%, 15.7%, and 16.1%, respectively. Interestingly, the direction of the difference is opposite to what is observed in basketball, where DXA yields the highest rather than the lowest value. Therefore, modality bias is not a fixed correction factor and cannot simply be corrected with a constant.
Reported method error is also generally larger and less consistent than often assumed. Hydrostatic weighing is said to overestimate body fat by 2.9% [1], and bioelectrical impedance [6,16] by 2.7%, compared to reference methods, while anthropometric equations [8,9] vary from 6% to 29% in men depending on the equation used. Differences of 6.2% between measurement methods within the same sport, and of 0.9% between pencil-beam [7] and fan-beam DXA machines, have also been documented.
Figure 3.
Effects of measurement modality. (A) Pooled basketball values by modality with 95% confidence intervals; the shaded band shows the range of modalities. (B) Same-sport comparison across two independent cohorts and two modalities in combat sports. Sources: Sansone et al. 2022; Reale et al. 2020 [5]; Baranauskas et al. 2023.
Figure 3.
Effects of measurement modality. (A) Pooled basketball values by modality with 95% confidence intervals; the shaded band shows the range of modalities. (B) Same-sport comparison across two independent cohorts and two modalities in combat sports. Sources: Sansone et al. 2022; Reale et al. 2020 [5]; Baranauskas et al. 2023.
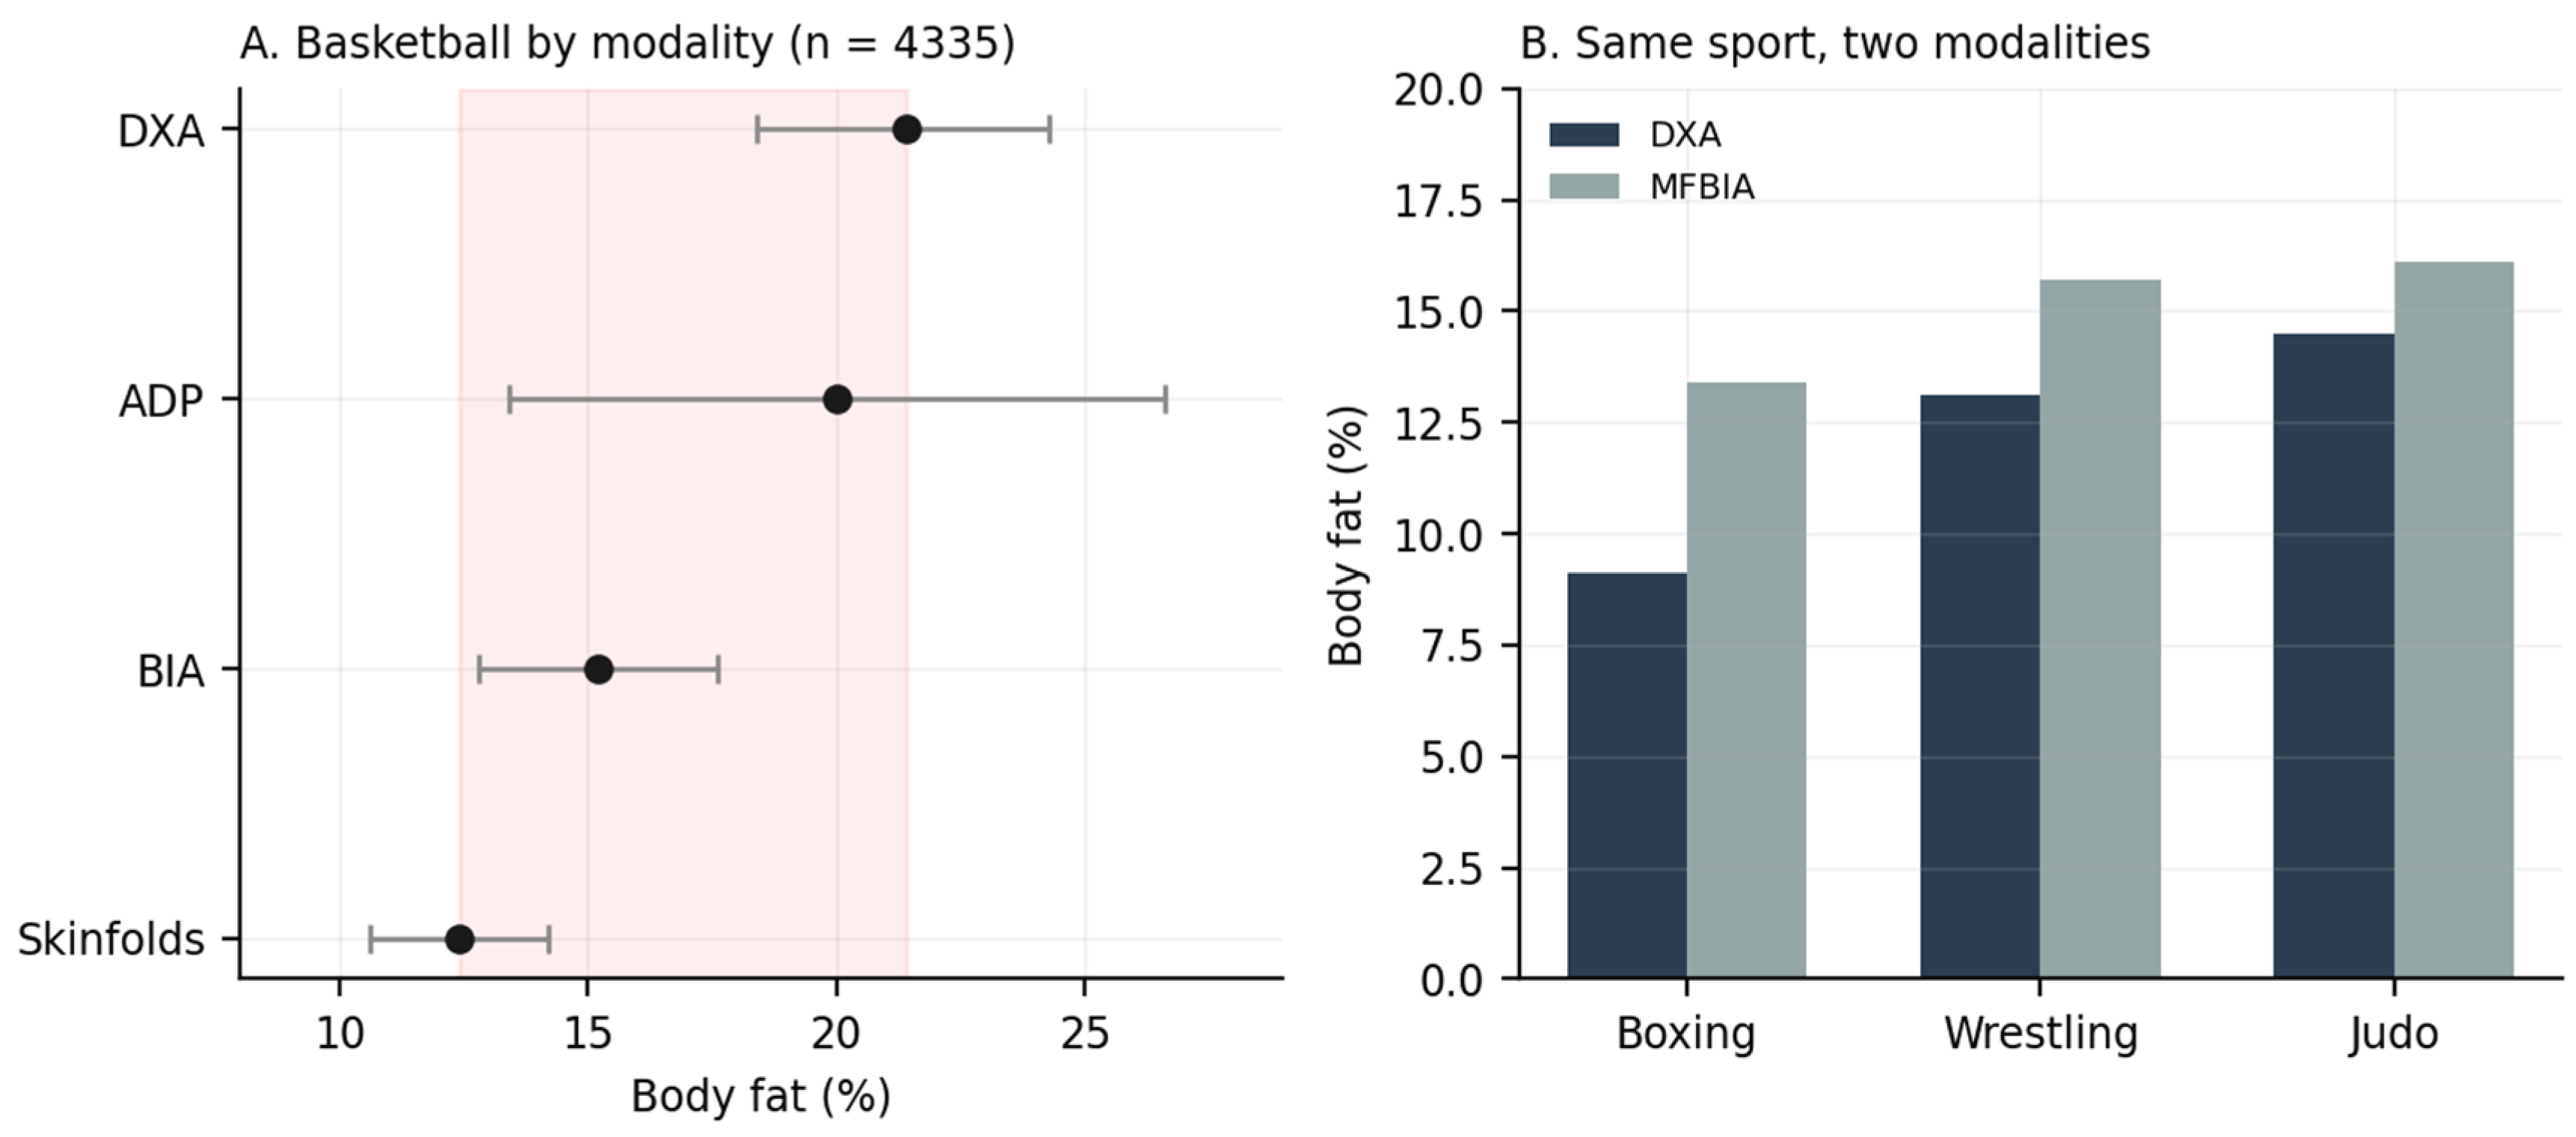
Figure 4.
Within-sport positional variation among the three team sports in the six-sport set. In American football, the gap between defensive backs and linemen exceeds the difference between any two of the six sports, which is why sport-level averages are shown here alongside, and never instead of, positional data.
Figure 4.
Within-sport positional variation among the three team sports in the six-sport set. In American football, the gap between defensive backs and linemen exceeds the difference between any two of the six sports, which is why sport-level averages are shown here alongside, and never instead of, positional data.
Evidence hand-off. Modality is identified here as a more important source of variation than either sport or sex. This supports the recommendation in Section 6.3 that modality should be a required attribute of any published reference value.
3.9. No Conventional Range Could Be Traced to a Primary Source
Table 10 summarizes the results of the source-traceability assessment. Of the 32 conventional per-sport ranges reviewed, none were identified within the search described in Section 2.2 as tracing back to a primary source reporting those specific boundaries. These ranges are usually cited with attribution to recent literature, but examining the cited works shows they do not include per-sport body fat tables. The referenced scoping reviews report pooled averages and morphotype groups, not sport-specific ranges.
3.10. Variance Explained by Each Classification
The two classifications can be compared directly because both apply to the same seventeen sports with identical morphotype values. Each sport was assigned its cluster mean, and the proportion of variance between sports explained by each classification was calculated.
Table 11.
Between-sport variance explained by contact category and by body mass demand.
| Classification | Groups | η² | Group means (%) |
|---|---|---|---|
| AAP contact category | 4 | 0.174 | Limited 9.80, non-contact 12.82, contact 12.85, collision 17.59 |
| Body mass demand | 3 | 0.686 | Low 9.80, capped 11.83, high 21.90 |
n = 17 sports [1,10]. Body mass demand accounts for 68.6% of the variance among sports in this dataset, compared to 17.4% for the contact category, resulting in an η² difference of 0.513. A permutation test with 20,000 random relabelings of category assignment yielded p = 0.0017, indicating that the advantage is not merely an artifact of the number of groups.
Because the collision–contact boundary varies by degree (Section 2.4), the comparison was redone using two broader definitions of contact to determine if the result depends on where that boundary is set. Merging collision and contact into one intentional-contact category lowered the explained variance from 0.174 to 0.128. Making the taxonomy binary—simply indicating presence or absence of contact—reduced it further, to 0.031. Therefore, contact classification performs worse as it becomes more inclusive, and the benefit of body mass demand increases from 0.513 to 0.558 under the combined scheme (permutation p = 0.0018).
Table 12.
Sensitivity of variance explained to how contact is operationalised.
| Classification scheme | Groups | η² | Group means (%) |
|---|---|---|---|
| AAP taxonomy as published | 4 | 0.174 | Limited 9.80, non-contact 12.82, contact 12.85, collision 17.59 |
| Collision and contact merged | 3 | 0.128 | Limited 9.80, non-contact 12.82, contact 16.53 |
| Binary: any contact vs none | 2 | 0.031 | No contact 12.82, contact 15.31 |
| Body mass demand | 3 | 0.686 | Low 9.80, capped 11.83, high 21.90 |
n = 17 sports overall. The result doesn’t depend on where the collision–contact boundary is drawn: contact classification explains less variance the more broadly it’s defined, and body mass demand outperforms it in every operationalization tested.
Two constraints on interpretation must be recognized. The analysis unit is the sport, not the athlete: each of the seventeen sports has its designated cluster mean, resulting in zero within-cluster variance by design, and traditional F tests are therefore unsuitable for athlete-level inference. Instead, a permutation test is presented, as it addresses a question the data can actually answer—whether this specific category assignment outperforms a random assignment of the same group sizes. It does. Second, the classification based on body mass demand was derived from analyzing the same cluster structure being tested here, making this a measure of descriptive fit rather than independent validation. Appendix A details the pre-planned confirmatory study.
Attribution of source data. The morphotype cluster structure analysed here is reported by Martinez-Mireles and colleagues [1]. Those authors do not propose the body mass demand classification, do not perform this comparison, and bear no responsibility for it. The classification is proposed in the present work, and the comparison reported here is a descriptive re-analysis of published summary statistics rather than a validation of either classification against independent data.
Evidence hand-off. The assembled corpus aligns with four key observations: morphotype does not correlate with contact category, body mass demand explains four times more of the between-sport variance than contact classification, positional variance is greater than between-sport variance, and modality variance exceeds both sport and sex effects. The traditional ranges are based on no reported sample at all. Section 4 then breaks down the reported percentage into its fat and lean components, which proves to be the most significant result in the synthesis.
4. The Decomposition of Body Fat Percentage and the Competitive-Tier Gradient
Section 3 presents values for Tier 4–5 athletes as a single percentage. It then breaks down that percentage into the components it summarizes and compares those values to the tiers below. The breakdown in Section 4.1 was unplanned and exploratory, as mentioned in Section 2.6.
4.1. Decomposition of Body Fat Percentage Into Fat and Lean Components
Body fat percentage is a ratio that can change because its numerator, denominator, or both change. Section 4.3 to 4.5 discuss the ratio. Since the activity-gradient source provides body mass index alongside body fat percentage, and the cross-tier source offers absolute fat and lean masses, this ratio can be broken down at both ends of the range. The two ends behave differently.
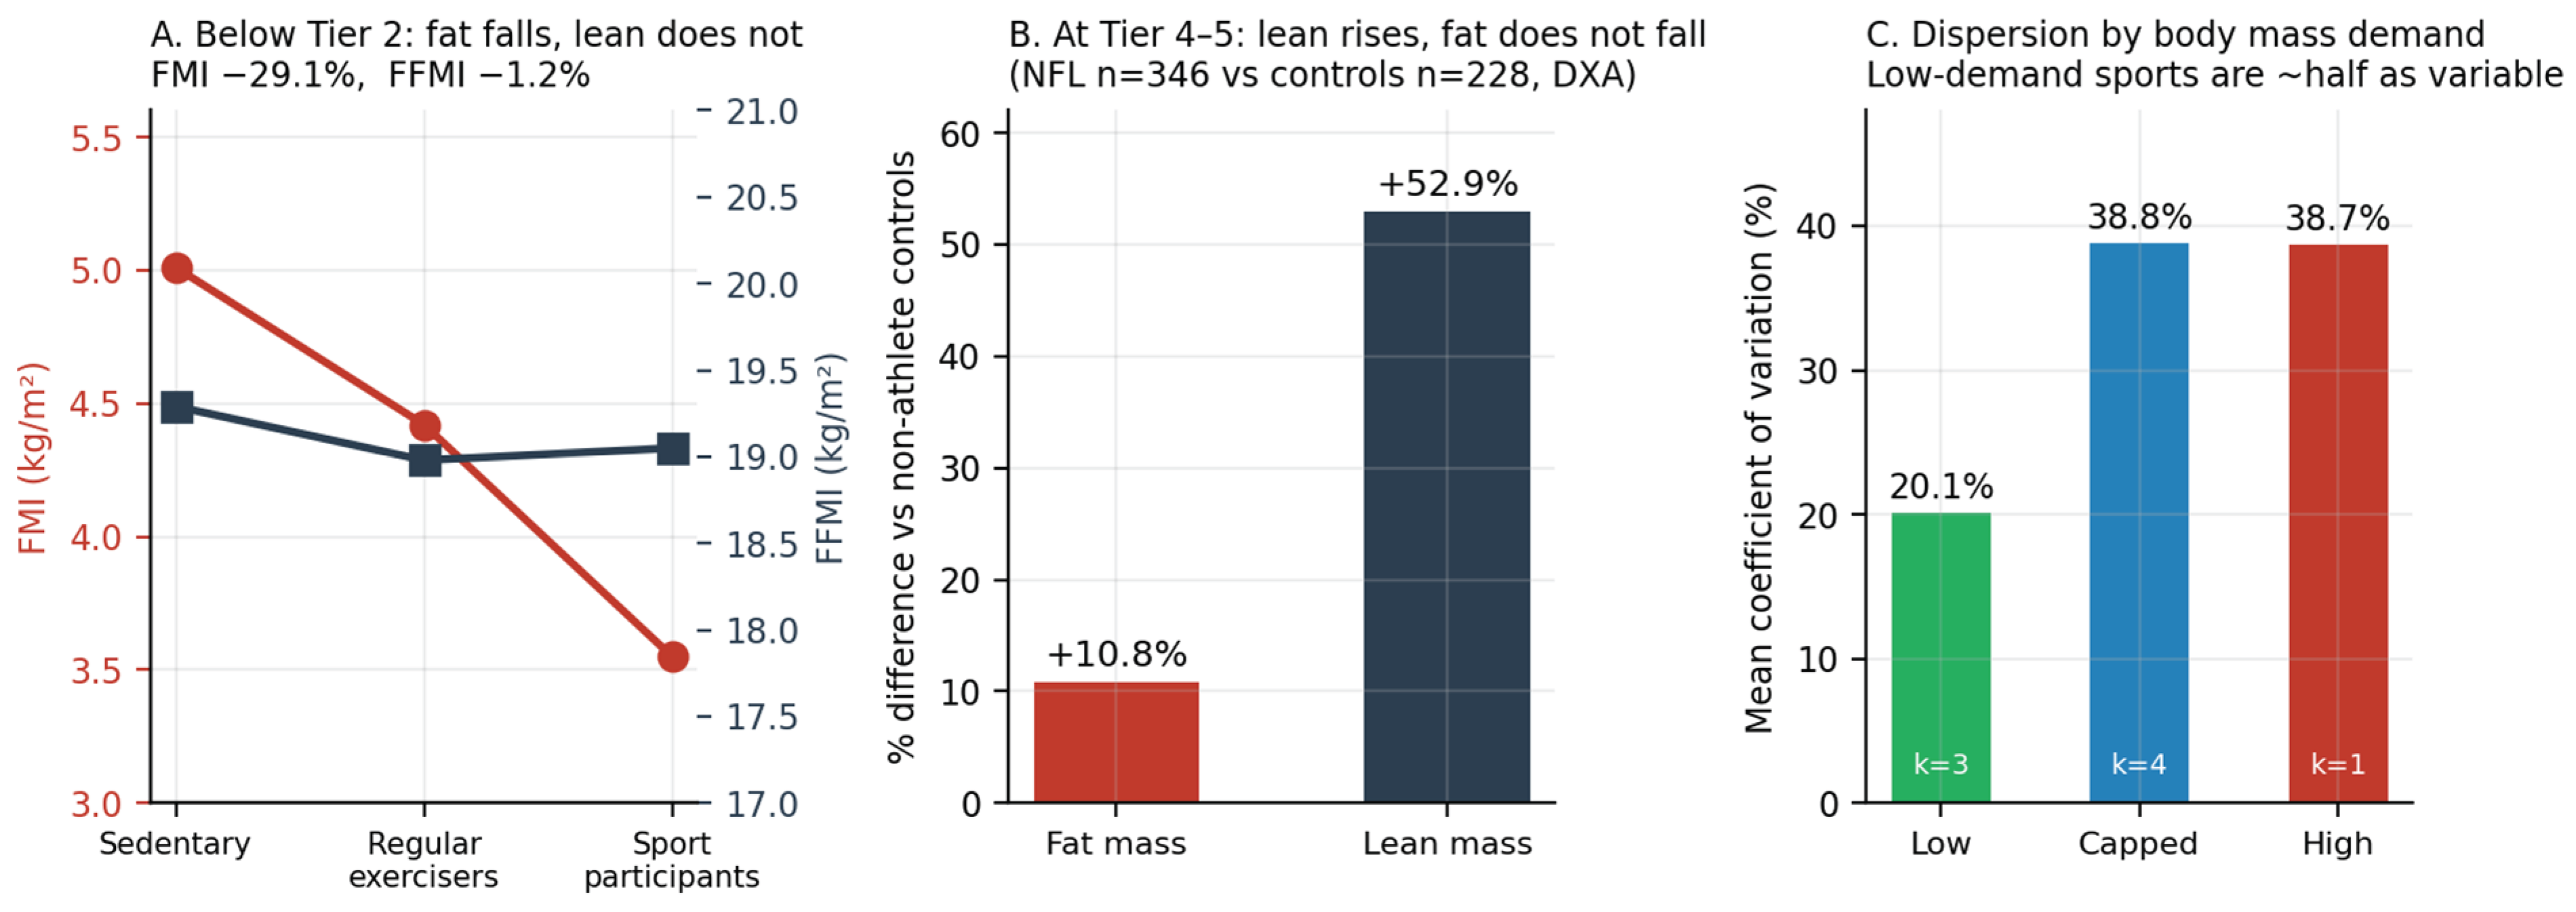
Below Tier 2, changes are almost entirely in the fat compartment. Fat mass index drops from 5.01 to 3.55 kg/m² across the three activity levels, a 29.1% decrease. Fat-free mass index remains largely the same at 19.29, 18.98, and 19.05 kg/m², with a difference of 1.2% and no clear trend. The proportional change between compartments is roughly 24 to 1 in favor of fat.
At Tier 4–5, the pattern reverses. Comparing elite professional players with age-matched controls measured with the same instrument, lean mass is 52.9% higher (84.55 vs. 55.30 kg), while fat mass is actually 10.8% higher in absolute terms (19.76 vs. 17.84 kg). The lower body fat percentage in the athlete group results from lean gain, not fat loss. Fat mass increased; the denominator grew faster.
Table 18.
Decomposition of the body composition gradient at each end of the competitive range.
| Range | Comparison | Fat compartment | Lean compartment |
|---|---|---|---|
| Below Tier 2 | Sedentary → sport participants | FMI 5.01 → 3.55 kg/m² (−29.1%) | FFMI 19.29 → 19.05 kg/m² (−1.2%) |
| Tier 0–1 → Tier 4–5 | Controls → elite professional | Fat mass 17.84 → 19.76 kg (+10.8%) | Lean mass 55.30 → 84.55 kg (+52.9%) |
The consequence for the interpretation of body fat percentage is direct and, so far as could be determined, has not previously been stated. A single percentage value conflates two physiologically opposite processes. A falling percentage below Tier 2 indicates fat loss against stable lean mass. A lower percentage at Tier 4–5 indicates lean accretion against rising fat mass. The same direction of change in the reported variable corresponds to different underlying physiology depending on where in the range it occurs, and the variable itself carries no information about which is operating.
This provides a mechanistic account of an observation reported throughout this synthesis and by the authors of two of the source studies: that lean mass discriminates training status more reliably than body fat percentage. It is not that adiposity is merely a noisier marker. It is that the percentage is a composite of two compartments that move independently, and in opposite directions, at different points along the range.
Evidence hand-off. The gradient decomposes into two distinct mechanisms rather than one continuum. Section 4.2 examines whether body mass demand predicts the dispersion of values as well as their central tendency.
4.2. Dispersion of Values by Body Mass Demand Category
A classification that accounts for differences in mean values may or may not account for differences in spread. Because dispersion is reported for most Tier 1 entries, the coefficient of variation was computed for each and grouped by body mass demand category.
Low mass demand entries returned a mean coefficient of variation of 20.1% (k = 3). Capped mass demand entries returned 38.8% (k = 4) and the single high mass demand entry 38.7%. Sports in which mass is penalised are therefore approximately half as internally variable as sports in which mass is rewarded or rationed. This is consistent with the mechanism proposed in Section 2.7: where every kilogram carries a locomotor cost, the tolerated range narrows, whereas a regulatory ceiling permits wide variation beneath it and an unbounded premium permits wide variation above.
This is reported as a prediction of the framework rather than as an established result. The group sizes are small (k = 3, 4 and 1), the entries are drawn from different modalities, and no inferential test is performed. It is stated because a classification that anticipates second moments as well as first moments is more readily falsified than one that anticipates only means, and because the prediction is specific: low mass demand sports should show narrower dispersion than capped or high mass demand sports under controlled measurement. Appendix A can test it.
Table 19.
Coefficient of variation by body mass demand category.
| Body mass demand | Entries (k) | Mean CV | Range of CV |
|---|---|---|---|
| Low | 3 | 20.1% | 16.0–22.8% |
| Capped | 4 | 38.8% | 26.1–47.8% |
| High | 1 | 38.7% | — |
Figure 10.
Decomposition and dispersion. (A) Fat mass index and fat-free mass index across the three activity strata below Tier 2; fat falls while lean is unchanged. (B) Percentage difference in fat and lean mass between elite professional players and age-matched controls; lean rises while fat mass does not fall. (C) Mean coefficient of variation by body mass demand category. Panels A and B are computed from values reported in Table 12 and Table 13; panel C from dispersion reported in Table 5, Table 6 and Table 12.
Figure 10.
Decomposition and dispersion. (A) Fat mass index and fat-free mass index across the three activity strata below Tier 2; fat falls while lean is unchanged. (B) Percentage difference in fat and lean mass between elite professional players and age-matched controls; lean rises while fat mass does not fall. (C) Mean coefficient of variation by body mass demand category. Panels A and B are computed from values reported in Table 12 and Table 13; panel C from dispersion reported in Table 5, Table 6 and Table 12.
4.3. The Within-Sport Tier Gradient, with Sport Held Constant
The strongest available evidence comes from a single sport with a large pooled sample [14], because holding sport constant removes the body mass demand confound identified in Section 6.4. In 4,335 basketball players, pooled body fat was 13.2% (95% CI 11.3–15.1) for international-level players, 15.6% (14.0–17.1) for national-level, and 15.0% (13.3–16.6) for regional-level, with 1,518, 2,142, and 652 players in each group respectively. International players differed significantly from both national (p < 0.001) and regional (p = 0.02) players, and these differences remained even after adjusting for sex and measurement method.
Two aspects of this result merit more attention than they typically receive. First, the trend is not strictly monotonic: national-level players carried slightly more body fat than regional-level players, so the pattern shows a step down at the top rather than a smooth decline. Second, and more importantly, the source authors report that sensitivity analysis indicated the effect of competitive level was not robust—removing a single study changed its statistical significance. Therefore, the tier effect on body fat is real but small and fragile, unlike the sex and modality effects in the same dataset, which the same sensitivity analysis confirmed as stable.
4.4. The Cross-Tier Comparison, Measured on One Instrument
The strongest defensible tier contrast comes from a single study that measured both groups using the same instrument [2]. Tier 4–5 American football players averaged 17.90 ± 6.92% compared to 22.93 ± 8.96% in 228 age-matched Tier 0–1 controls, a difference of 5.0 percentage points. As noted in Section 3.4, that difference had p = 0.053 and did not reach traditional significance despite the sample sizes.
The lean-mass comparison in the same study behaved very differently: 84.55 ± 8.75 kg versus 55.3 ± 11.79 kg, p < 0.0001. The tier signal is strong in lean mass and ambiguous in body fat. This clearly shows that body fat percentage is a weaker variable than lean mass for distinguishing training status, and it supports the conclusions of the authors of the basketball meta-analysis, who independently arrived at the same conclusion and suggested that lean compartment mass may be more sensitive than body fat for differentiating competitive levels.
Figure 5.
The competitive-tier gradient. (A) Inside-sport gradient in basketball with 95% confidence intervals and sample sizes for each stratum; note the non-monotonic step and the source authors’ own caution that this effect was not robust to removing single studies. (B) Contrast across tiers measured on one instrument within a single study; error bars indicate standard deviations.
Figure 5.
The competitive-tier gradient. (A) Inside-sport gradient in basketball with 95% confidence intervals and sample sizes for each stratum; note the non-monotonic step and the source authors’ own caution that this effect was not robust to removing single studies. (B) Contrast across tiers measured on one instrument within a single study; error bars indicate standard deviations.
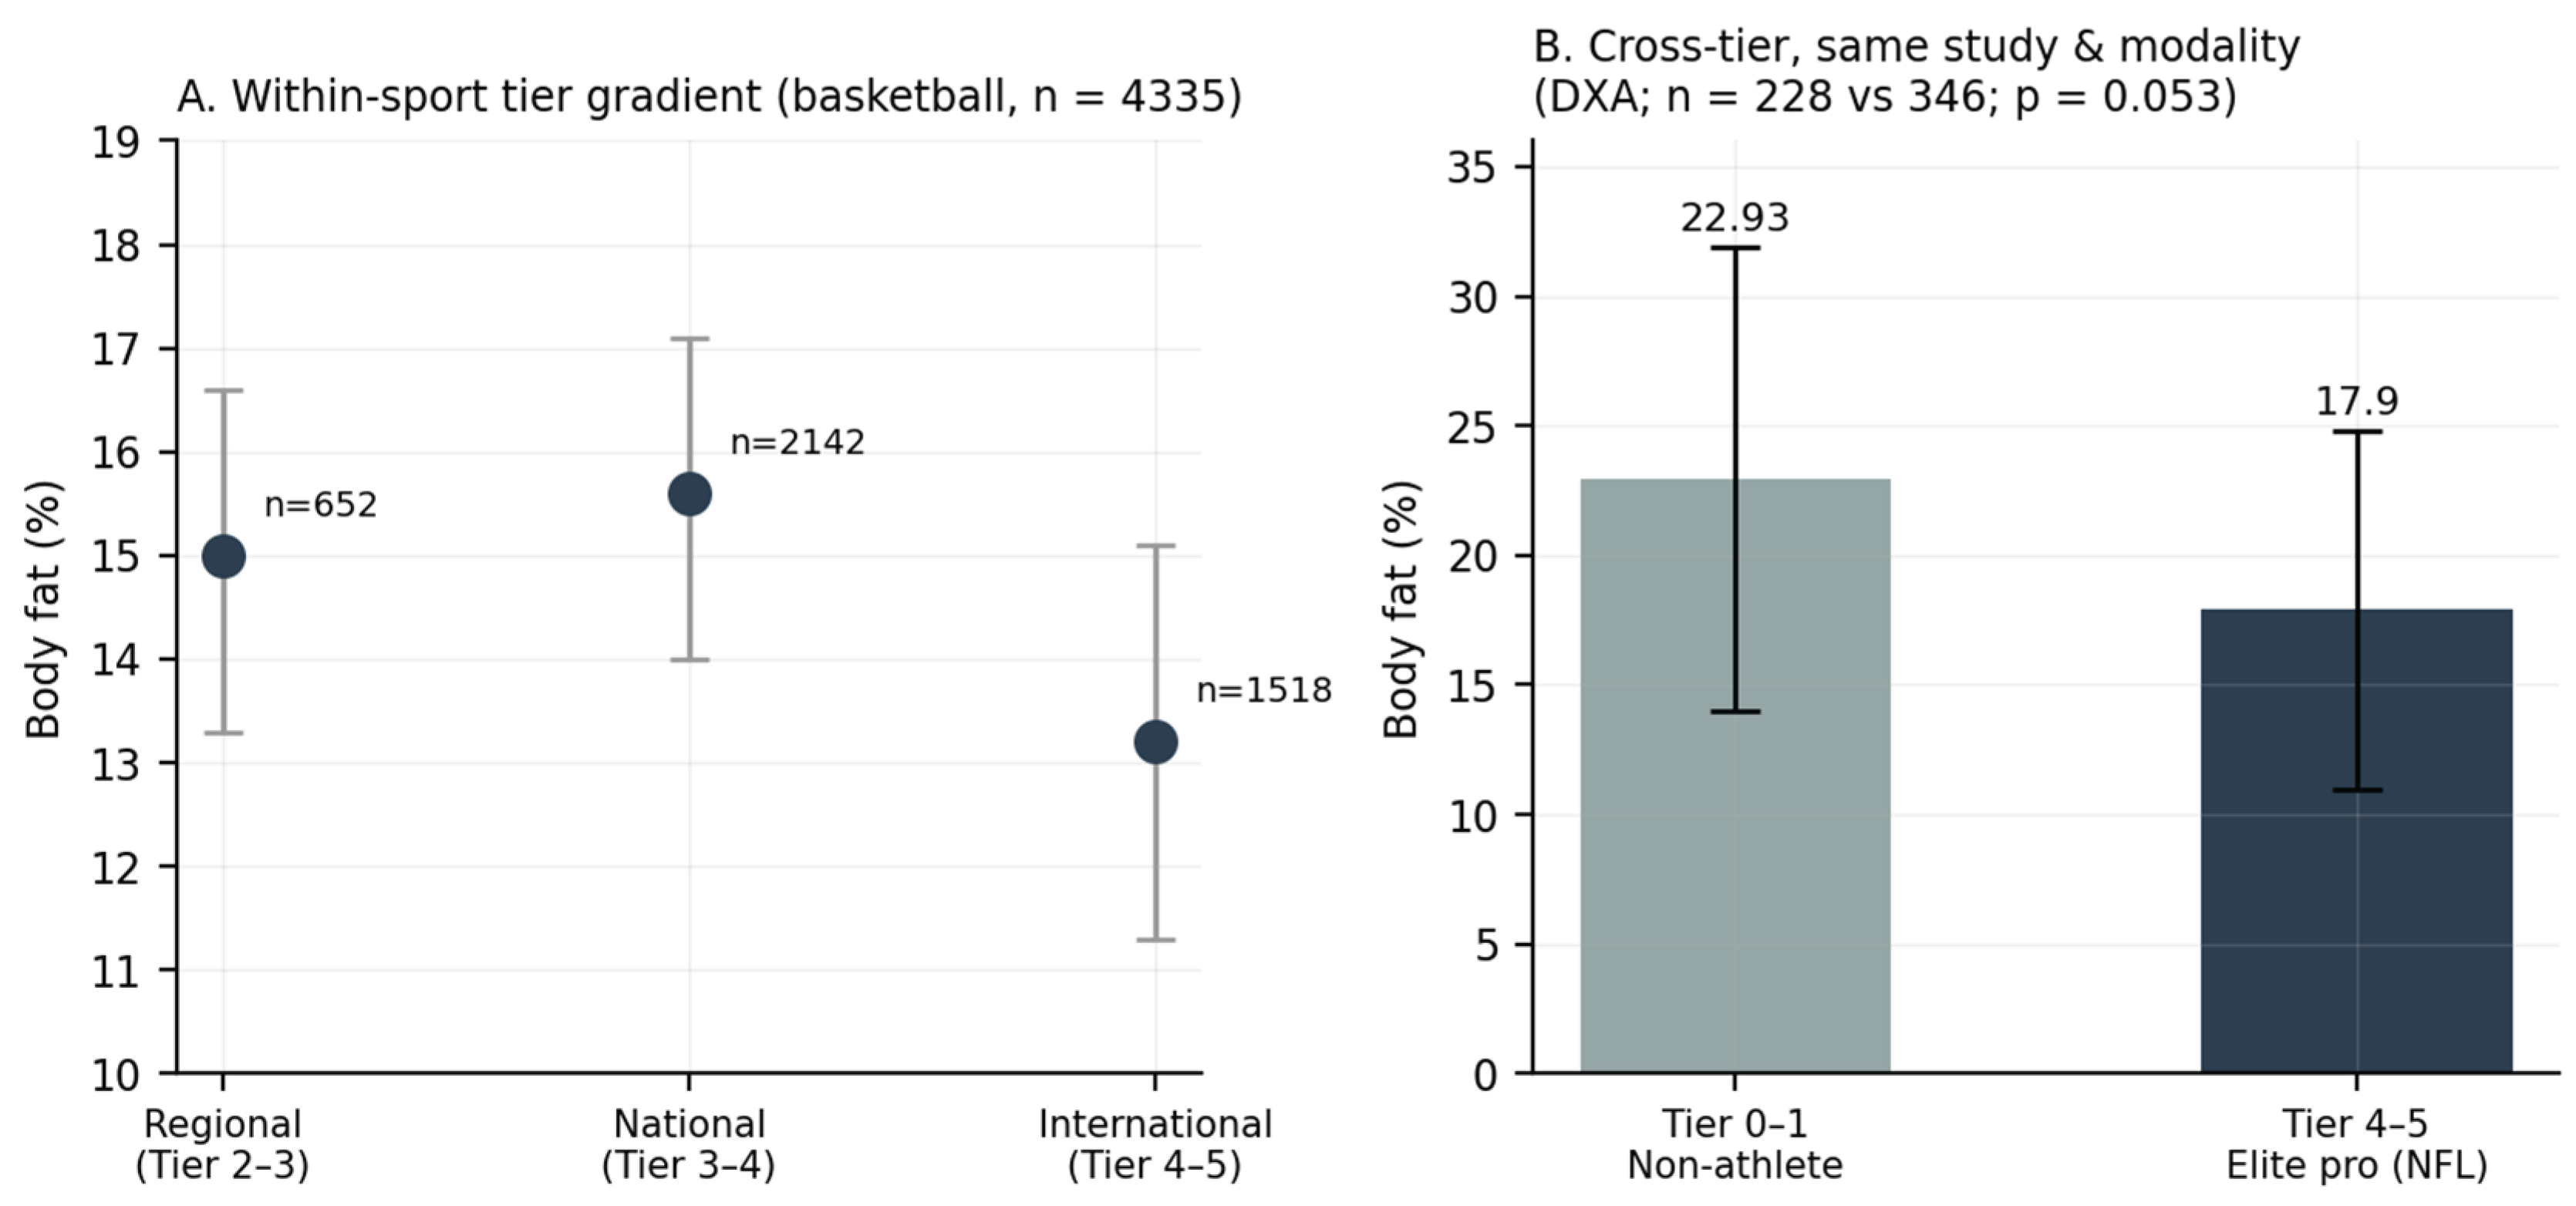
Table 13.
Body fat percentage by Participant Classification Framework tier.
| Tier | Description | n | Mean % | Dispersion | Source and caveat |
|---|---|---|---|---|---|
| 0–1 | Sedentary / recreationally active (male controls) | 228 | 22.93 | ± 8.96 | Dengel et al. 2023 [2]; age-matched to NFL cohort, DXA |
| 2–3 | Regional-level basketball | 652 | 15.0 | 95% CI 13.3–16.6 | Sansone et al. 2022 [14]; effect not robust to single-study removal |
| 3–4 | National-level basketball | 2142 | 15.6 | 95% CI 14.0–17.1 | Sansone et al. 2022 [14]; as above |
| 4–5 | International-level basketball | 1518 | 13.2 | 95% CI 11.3–15.1 | Sansone et al. 2022 [14]; p < 0.001 vs national |
| 4–5 | Elite professional, American football | 346 | 17.90 | ± 6.92 | Dengel et al. 2023 [2]; p = 0.053 vs controls |
| 4–5 | Elite, pooled across 61 sports (male) | 232* | 14.1 | ± 5.4 | Martinez-Mireles et al. 2026 [1] |
| 4–5 | Elite, pooled across 61 sports (female) | 232* | 21.8 | ± 4.1 | Martinez-Mireles et al. 2026 [1] |
Tier assignment follows McKay et al. [19]. * = study-level data points, not individual subjects. Rows are not directly comparable across studies due to modality differences documented in Section 3.8; the within-sport rows (Sansone) are the only strictly like-for-like tier comparison in the table.
4.5. The Activity Gradient Below Tier 2
The comparisons across tiers generally start at Tier 2 or depend on cross-study comparisons where methods vary. One source in the dataset measured all three lower activity levels within a single population using the same operator and method, making it the only internally consistent activity gradient available and the only comparison in this review free of the modality confound discussed in Section 3.8.
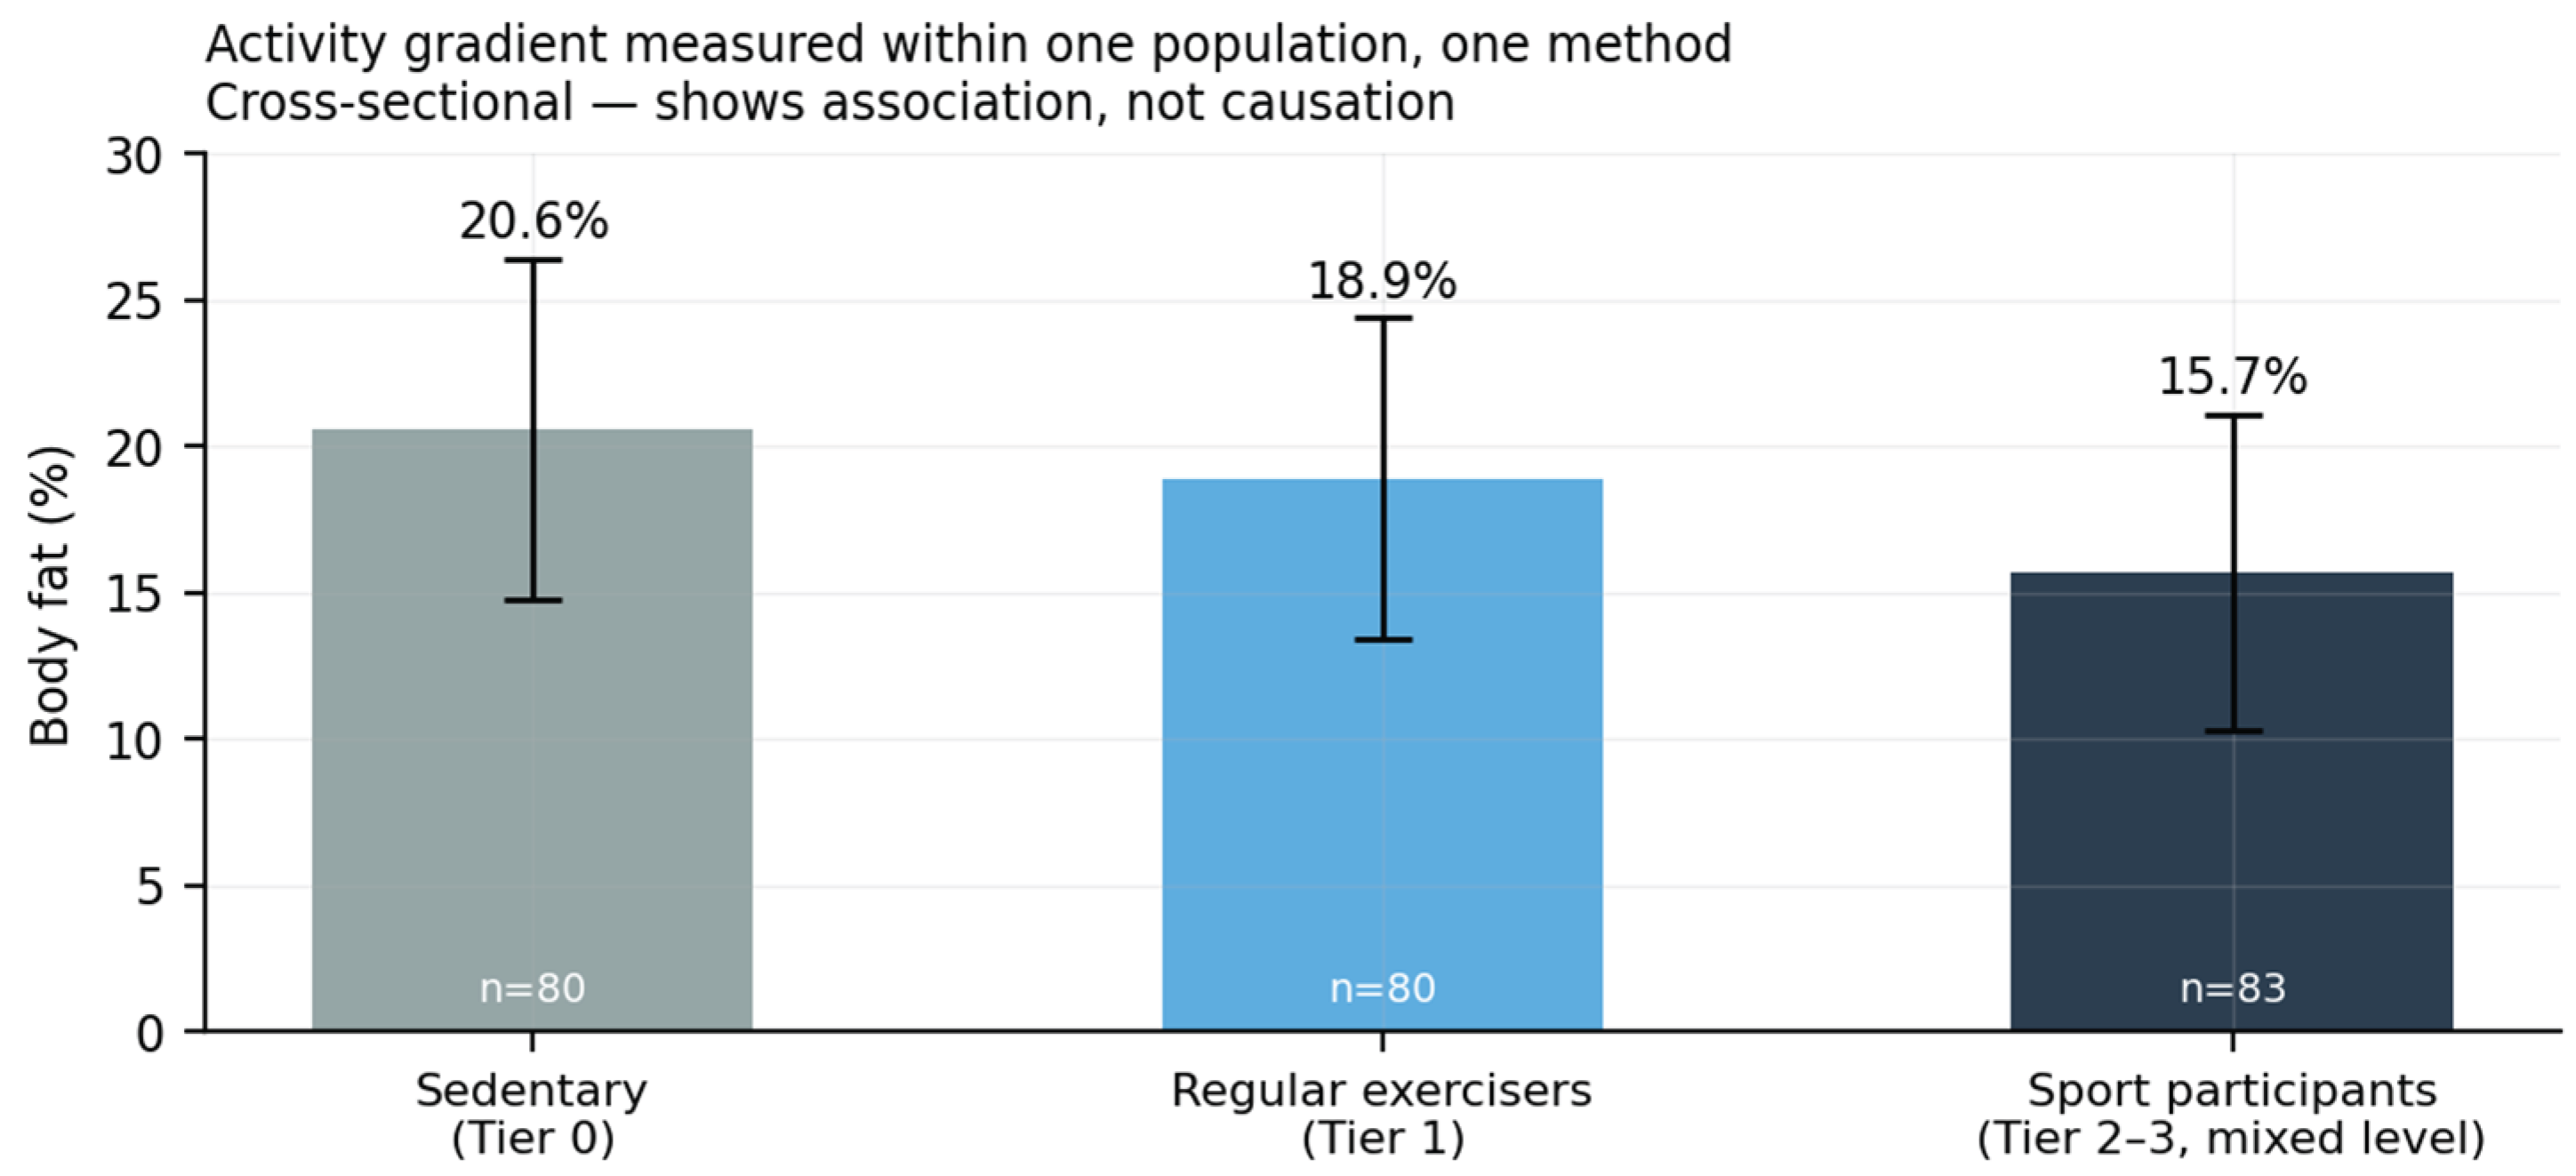
In 243 men aged 18 to 44 [24], body fat was 20.6 ± 5.8% in sedentary participants, 18.9 ± 5.5% in those exercising at least 30 minutes on three or more days weekly, and 15.7 ± 5.4% in those involved in sport at various competitive levels. The differences between these groups span 4.9 percentage points from start to finish. The same study also reported combined overweight and obesity prevalence based on body mass index as 47.5%, 29.9%, and 21.7% across the three groups.
This source was excluded from the main analysis in Section 3 for three reasons: it is a single-site study, its values are based on four-site skinfold estimates, and its sport group combines different competitive levels, which do not allow tier assignment under the framework in Section 2.5. These limitations persist, and its data are not comparable with any DXA-based data elsewhere in this paper. It is included here because the internal consistency of its three groups is unique among the sources in this dataset.
Table 14.
Activity gradient measured within a single population by a single method.
| Stratum | n | Mean % | SD | Definition and tier assignment |
|---|---|---|---|---|
| Sedentary | 80 | 20.6 | ± 5.8 | Inactive; Tier 0 |
| Regular exercisers | 80 | 18.9 | ± 5.5 | ≥30 min, ≥3 days weekly, non-competitive; Tier 1 |
| Sport participants | 83 | 15.7 | ± 5.4 | Various sports and levels; not tier-assignable, approximately Tier 2–3 |
Single-site cohort of men aged 18–44 with four-site skinfold measurements. The three rows are internally comparable to each other and not comparable to any other values in this paper. Body mass index in these groups was 24.3 ± 4.6, 23.4 ± 3.5, and 22.6 ± 2.9 kg/m², respectively.
Figure 6.
Activity gradient within a single population measured by a single method (four-site skinfold; n = 243 men aged 18–44). Error bars represent standard deviations. This is a cross-sectional comparison of three groups measured once, not a study of change over time; see Section 6.7.
Figure 6.
Activity gradient within a single population measured by a single method (four-site skinfold; n = 243 men aged 18–44). Error bars represent standard deviations. This is a cross-sectional comparison of three groups measured once, not a study of change over time; see Section 6.7.
Evidence hand-off. The tier gradient in body fat is real, small, non-monotonic, and fragile, while the tier gradient in lean mass is large and stable. Section 5 examines whether the dataset’s age structure allows for distinguishing the effects of tier and age.
5. Age and the Limits of the Reference Literature
Age was examined as a potential modifier of the reference values in Section 3. The analysis is exploratory, and its main finding is negative: the published literature does not allow age and competitive tier to be distinguished.
5.1. Age and Tier Are Confounded Throughout the Corpus
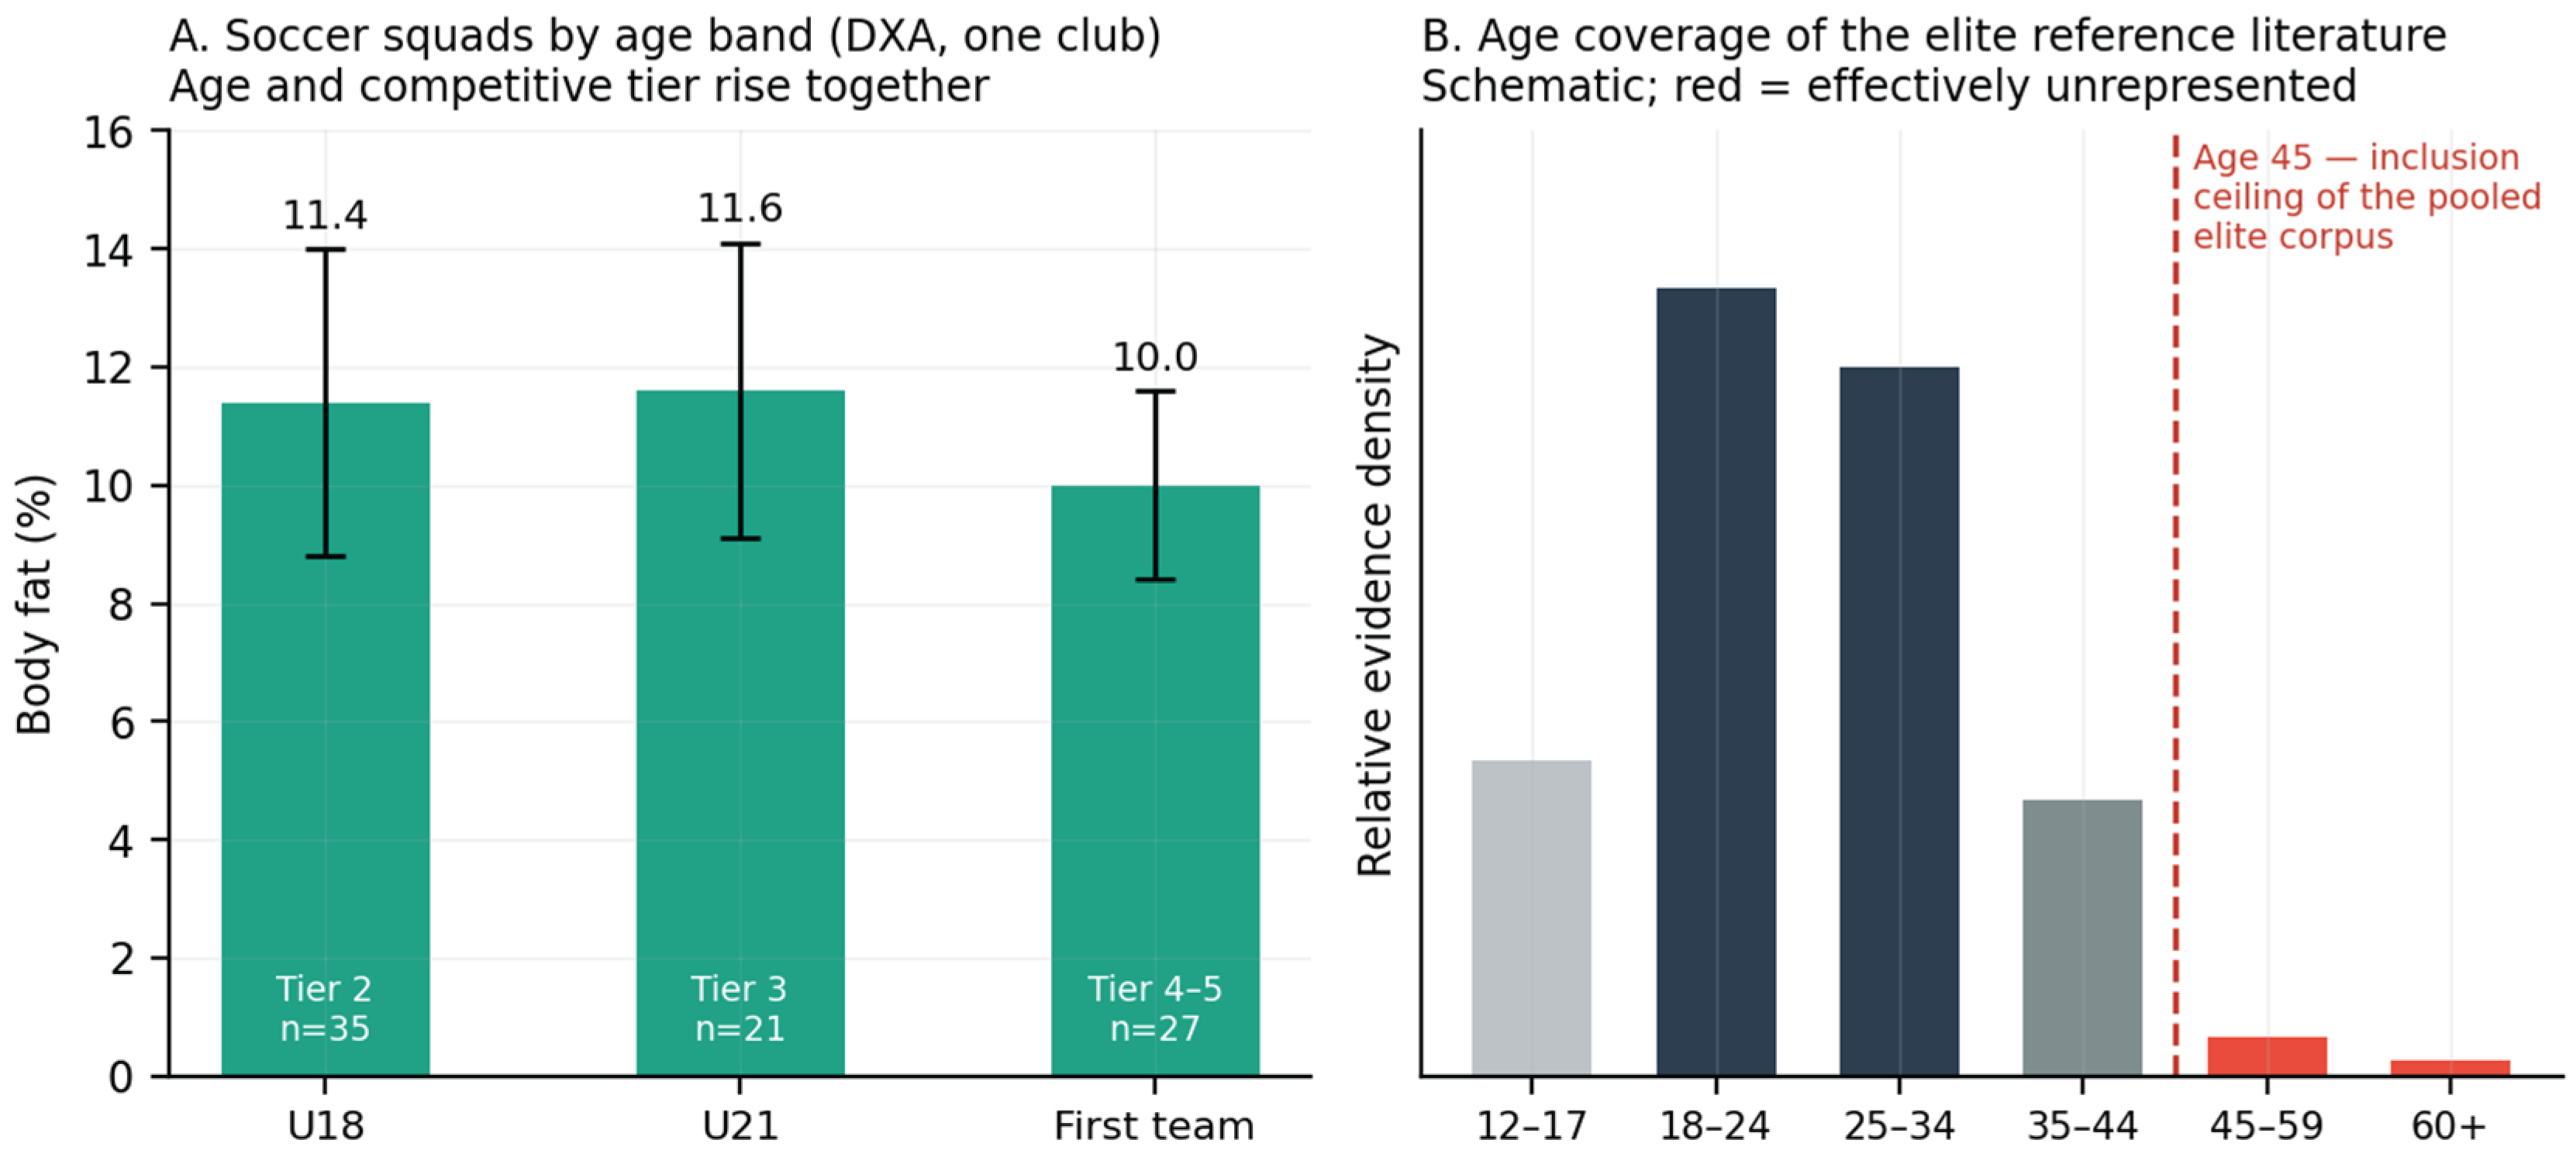
The clearest example comes from a single professional soccer team evaluated with one method [17]. First-team players averaged 10.0 ± 1.6%, under-21 players 11.6 ± 2.5%, and under-18 players 11.4 ± 2.6%, with 27, 21, and 35 players respectively. The first team is both the oldest and the highest-level squad. The design does not allow the 1.6-point difference to be attributed to age rather than to selection, training history, or professional status.
The same confound affects the pooled data. Study-level average ages in the basketball meta-analysis ranged from 19.0 to 28.9 years, and competitive level varies with age across those samples. No source in this synthesis reports body composition broken down by age within a fixed competitive tier, which is the design needed to separate the two.
5.2. The Elite Literature Has an Age Ceiling at 45
The pooled elite data set limited inclusion to athletes aged 12 to 45 years, with a mean age of 24.0 ± 5.4 [1]. The reference values reported in Section 3 therefore describe a population whose central tendency is in the mid-twenties, and they provide no information about masters athletes. This is not a minor gap. Population reference data sharply decline past 70, to the point that some widely used tools reuse the 65–69 age group for all subsequent groups because no separate data exist. Between the elite literature’s ceiling at 45 and the population literature’s effective ceiling in the late sixties lies a substantial and growing population of competitive masters athletes for whom no adequate reference values are available in either body of work.
5.3. What the Masters Literature Does Establish
Research on masters athletes, using both longitudinal and cross-sectional methods [12], identifies a key point for understanding body fat percentage in older adults. In a group of 40 recreational athletes aged 40 to 81, who trained four to five times weekly, mid-thigh muscle area and lean mass did not decrease with age, and peak torque showed no significant differences across the 60-, 70-, and 80-year groups. However, body fat percentage still increased with age in the same group.
These two findings have a methodological implication similar to Section 4.2: when lean mass remains stable but fat percentage rises, it is because the ratio is changing—not because the athlete has lost training status. Therefore, body fat percentage is a poor indicator to monitor in older athletes, and it should be reported alongside fat-free mass index or appendicular lean mass. Additionally, a low body fat percentage in an older athlete is only meaningful if lean mass is known, since the ratio can decrease due to loss of both the numerator and denominator.
Figure 7.
Age in the reference literature. (A) Groups of players from a single professional soccer club by age range, showing that age and competitive level increase together and cannot be separated in this design. (B) Schematic illustration of age coverage in the elite reference literature; the dashed line marks the age-45 cutoff for inclusion in the pooled elite database, beyond which elite reference values do not go.
Figure 7.
Age in the reference literature. (A) Groups of players from a single professional soccer club by age range, showing that age and competitive level increase together and cannot be separated in this design. (B) Schematic illustration of age coverage in the elite reference literature; the dashed line marks the age-45 cutoff for inclusion in the pooled elite database, beyond which elite reference values do not go.
Evidence hand-off. Age cannot be separated from the competitive tier in the existing literature, and elite reference values do not exceed 45 years. Both limitations are discussed in Section 8.
6. Discussion. Doi:10.3390/nu13041075
6.1. What These Findings Amount To
I started this work with a practical question about where a trained body should be positioned, and I expected to answer it by consulting the reference ranges already used in the field. The key discovery that shapes everything else is that these ranges cannot be relied upon to answer the question, and the variable they are expressed in couldn’t have answered it even if they had been accurate.
Three separate findings lead to the same conclusion: values obtained by different instruments are not comparable, and the disagreement between instruments does not follow a consistent pattern [1,17,24], so no correction can reconcile them. Additionally, the reference ranges themselves could not be linked to measured populations within this research [12,13]. Moreover, the quantity reported combines two physiologically opposite processes, so the same number can mean different things depending on where it falls within the range. Each of these issues would be a problem on its own, but together they describe a measurement practice that has outpaced the evidence supporting it.
I want to clarify the strength of this statement. None of this proves that the circulating values are incorrect. Most of them are close to verified data and continue to serve as practical heuristics. What the evidence really shows is that they are used with more confidence than their origins justify and interpreted with more precision than the underlying variable allows. This distinction matters because the solution isn’t to discard the measurement but to report the conditions under which it holds meaning.
6.2. The Most Immediately Useful Result Is the Decomposition
Of everything reported here, the finding I consider most useful for practitioners is the one that emerged last and was not part of the original design. Body fat percentage is a ratio, and its numerator and denominator move independently and in opposite directions at opposite ends of the competitive range [2,26]. Below Tier 2, the fat compartment does the work while lean mass remains unchanged. At Tier 4–5, the lean compartment does the work, and fat mass is not lower but higher in absolute terms.
The practical consequence is immediate and requires no new tools. An athlete whose body fat percentage is dropping may be losing fat, gaining lean mass, or losing both while the ratio stays the same. The percentage cannot distinguish these, and they require opposite responses. Reporting fat mass index and fat-free mass index alongside the percentage solves the ambiguity at no extra cost, because every device that produces a whole-body percentage already measures the compartment masses these indices are based on. The data is collected but often ignored when reporting.
This also addresses, in my view, a question posed by the source literature without an answer: why lean mass separates trained from untrained groups much more clearly than adiposity [2,24]. The common explanation considers body fat percentage as a noisier signal of the same underlying change. The decomposition shows it is not noise. Instead, it is two signals combined into one number, moving in opposite directions, making the sum uninformative about either.
6.3. What Athletes and Practitioners Can Do with This Now
Several of these findings are actionable without waiting for further research, and I would put them in this order.
Match the instrument before making any comparison. A value obtained by skinfold cannot be placed against a reference range derived by DXA, and the error introduced is larger than the difference between men and women in the same population [24]. Where the modality behind a published range is not stated, that range cannot support an individual comparison at all. For monitoring an individual over time, a single instrument used consistently is reliable; the problem is cross-sectional benchmarking, not longitudinal tracking.
Track lean mass, not the ratio. [2,24] This holds across every comparison in the synthesis and it is the single most consequential change available to a practitioner. Where lean mass is rising and the percentage is stable, that is progress, not stagnation. Where the percentage is falling and lean mass is falling with it, the ratio conceals a loss.
Compare within competitive tier and within sex, and treat published elite values as descriptions of populations rather than as targets for individuals. Athletes compete successfully outside every range reported here, and the lower bound of a range describes where some measured athletes fell, not a safe floor to approach.
For female athletes the margin is narrower than the numbers suggest. Expressed as reserve above the essential-fat floor [27,28], female elite athletes operate at roughly half the proportional headroom of their male counterparts. A percentage that appears comfortably above a male reference point may be much closer to a physiological limit than it looks.
6.4. Implications for How Sports Are Grouped and Compared
The contact taxonomy did not survive examination, and I do not think the problem is one of calibration. Defining contact more inclusively made the classification perform worse rather than better, and the collision category in this corpus spans the entire observed range of body composition values [10]. A category containing both the leanest and the fattest sports carries no information about the variable it is being used to explain.
What appears to separate sports is not whether athletes collide but what the mechanics and rules of the event require of total mass [25,26]. I offer body mass demand as a hypothesis rather than a finding, and I have specified in Appendix A the study that would reject it. What gives me some confidence in it is that it predicts dispersion as well as central tendency: sports in which mass is penalised are approximately half as internally variable as sports in which mass is rewarded or rationed. A framework that anticipates second moments is easier to falsify than one that anticipates only means, and I would rather have it tested than believed.
6.5. Implications for Neurotrauma and Exposure Research
This has direct implications for a question I have explored separately. Increasingly, head-impact exposure models include anthropometric covariates, and body composition is a natural candidate. However, the results here suggest otherwise. Contact exposure and body composition are independent variables: a boxer and a distance runner can have the same body type while experiencing vastly different cumulative head impacts. Incorporating adiposity as a proxy for exposure introduces confounding without providing explanatory value. When an anthropometric covariate is necessary, fat-free mass is the most appropriate choice [2].
A second, larger issue underlies every classification discussed here, including my own. Taxonomies are built from rulebooks and describe what contact a sport permits. However, elite competition also involves systematic, unsanctioned contact that is predictable, tactical, and ongoing. For example, association football is classified based on its official rules, rather than the holding, elbowing, and aerial challenges characteristic of high-level play. Ice hockey formally penalizes fighting but still allows it procedurally [10]. While this is less relevant for body composition, since mass is influenced by scoring mechanics and locomotor demands rather than off-the-ball conduct, it matters greatly for exposure modeling. Any estimate based on rulebooks should be understood as a minimum.
6.6. Where I Think the Research Should Go Next
Four priorities follow from this work, and I would rank them in this order.
The first is a single cohort measured across the full competitive range on one instrument, reporting compartment masses rather than percentages. The decomposition reported here is inferred from two sources at opposite ends of the range, measured in different populations by different methods. The direction is unambiguous but the inversion has not been observed within one study, and it should be.
The second is reference values for the populations that currently have none. Two of the six tier-by-sex cells required for a complete reference structure could not be populated from any source located: female non-athletes and female sub-elite athletes [11]. Ice hockey, the canonical collision sport, has no qualifying entry in this corpus at all [10]. Filling these gaps would be a more useful contribution than any further analysis of the male elite data, which is comparatively well served.
The third is impact measurement that does not depend on rules. Instrumented mouthguards and accelerometry [29,30,31] capture what is delivered rather than what is sanctioned, and would establish how far codified contact and actual contact diverge by sport and by position. That divergence is currently unmeasured and is the largest unknown in exposure modelling.
The fourth is the confirmatory test of body mass demand specified in Appendix A: a single-modality, multi-sport, athlete-level design with fat-free mass index as the primary outcome and a stated rejection criterion. I would rather see the framework tested and discarded than adopted on the strength of a descriptive re-analysis.
6.7. The Boundary of These Claims
Everything reported here is cross-sectional. Groups were measured once and compared; no source followed individuals as they moved between activity levels or competitive tiers. The gradients describe differences between groups, not changes achievable by an individual, and nothing here supports a causal claim about the effect of training or sport participation on body composition. Establishing that would require longitudinal or controlled evidence this synthesis does not contain and did not seek.
The classification I propose was derived from inspection of the same cluster structure against which it is tested, which makes the comparison a measure of descriptive fit rather than independent validation. The unit of analysis is the sport rather than the athlete. Both constraints are stated where the analysis is reported, and both are addressed by the design in Appendix A.
7. Practical Application: Locating an Individual Against the Reference Data
The previous sections establish reference values but do not make them immediately usable. A reader who is not an elite professional athlete—such as a former competitor now older, a recreational athlete considering competition, or someone starting a sport from a sedentary baseline—cannot easily determine which row of which table applies to them. This section consolidates the values already reported into a single reference framework and outlines the procedure for locating an individual within it.
No new data are introduced. Every value in this section is taken directly from Tables 5, 6, 13, or 14, with its source, sample size, and measurement method unchanged. Nothing here alters, softens, or supersedes the analysis that precedes it, and the causal limitation described in Section 6.7 applies to every comparison a reader may make using it.
7.1. Three Questions Determine Which Reference Value Applies
Locating an individual requires three pieces of information in a specific order. Answering them out of order leads to incorrect comparisons.
Question 1: Which measurement method produced your number? This is the first point because it is the biggest source of variation. As shown in Section 3.8, measuring the same population four different ways gave values from 12.4% to 21.4%—a range larger than the difference between men and women. A value obtained by skinfold cannot be compared with a DXA reference range. If the method is unknown, then no comparison is valid.
Question 2: Which classification tier are you in? Use the Participant Classification Framework from Section 2.5 [19]. Tier 0–1 includes those who are sedentary or recreationally active; Tier 2–3 encompasses trained, developmental, or national level athletes; and Tier 4–5 consists of elite professional or international athletes. Tier is based on current training volume and competitive standing, not past achievements. A former elite athlete now training recreationally should be classified as Tier 1 and compared against Tier 1 references.
Question 3: What is your sex, and if over 45, what is your lean mass? Sex determines which category applies. Age does not have its own reference values—Section 5 states that none exist above 45 years for athletes—so beyond that age, body fat percentage should only be interpreted alongside a lean mass measurement, for the reason given in Section 5.3.
Table 15.
Consolidated reference values by classification tier and sex.
| Tier | Description | n | Mean % | Band | Source and modality |
|---|---|---|---|---|---|
| 0–1 (M) | Sedentary / recreationally active | 228 | 22.9 | ± 9.0 | Dengel et al. 2023 [2]; DXA; age-matched controls |
| 0–1 (F) | Sedentary / recreationally active | — | No data | — | No qualifying source located in this synthesis |
| 2–3 (M) | Trained / developmental / national | 2794 | 15.0–15.6 | 95% CI 13.3–17.1 | Sansone et al. 2022 [14]; mixed modality; basketball |
| 2–3 (M) | Trained / developmental (soccer, DXA only) | 56 | 11.4–11.6 | ± 2.5 | Milsom et al. 2015 [17]; DXA; U18 and U21 squads |
| 2–3 (F) | Trained / developmental / national | — | No data | — | Not separately reported by tier and sex |
| 4–5 (M) | Elite professional / international | 232* | 14.1 | ± 5.4 | Martinez-Mireles et al. 2026 [1]; mixed modality; 61 sports |
| 4–5 (F) | Elite professional / international | 232* | 21.8 | ± 4.1 | Martinez-Mireles et al. 2026 [1]; mixed modality; 61 sports |
| 4–5 (M) | Elite professional, single sport | 1518 | 13.2 | 95% CI 11.3–15.1 | Sansone et al. 2022 [14]; mixed modality; basketball |
| 4–5 (F) | Elite professional, single sport | 868 | 20.7 | 95% CI 19.9–21.5 | Sansone et al. 2022 [14]; mixed modality; basketball |
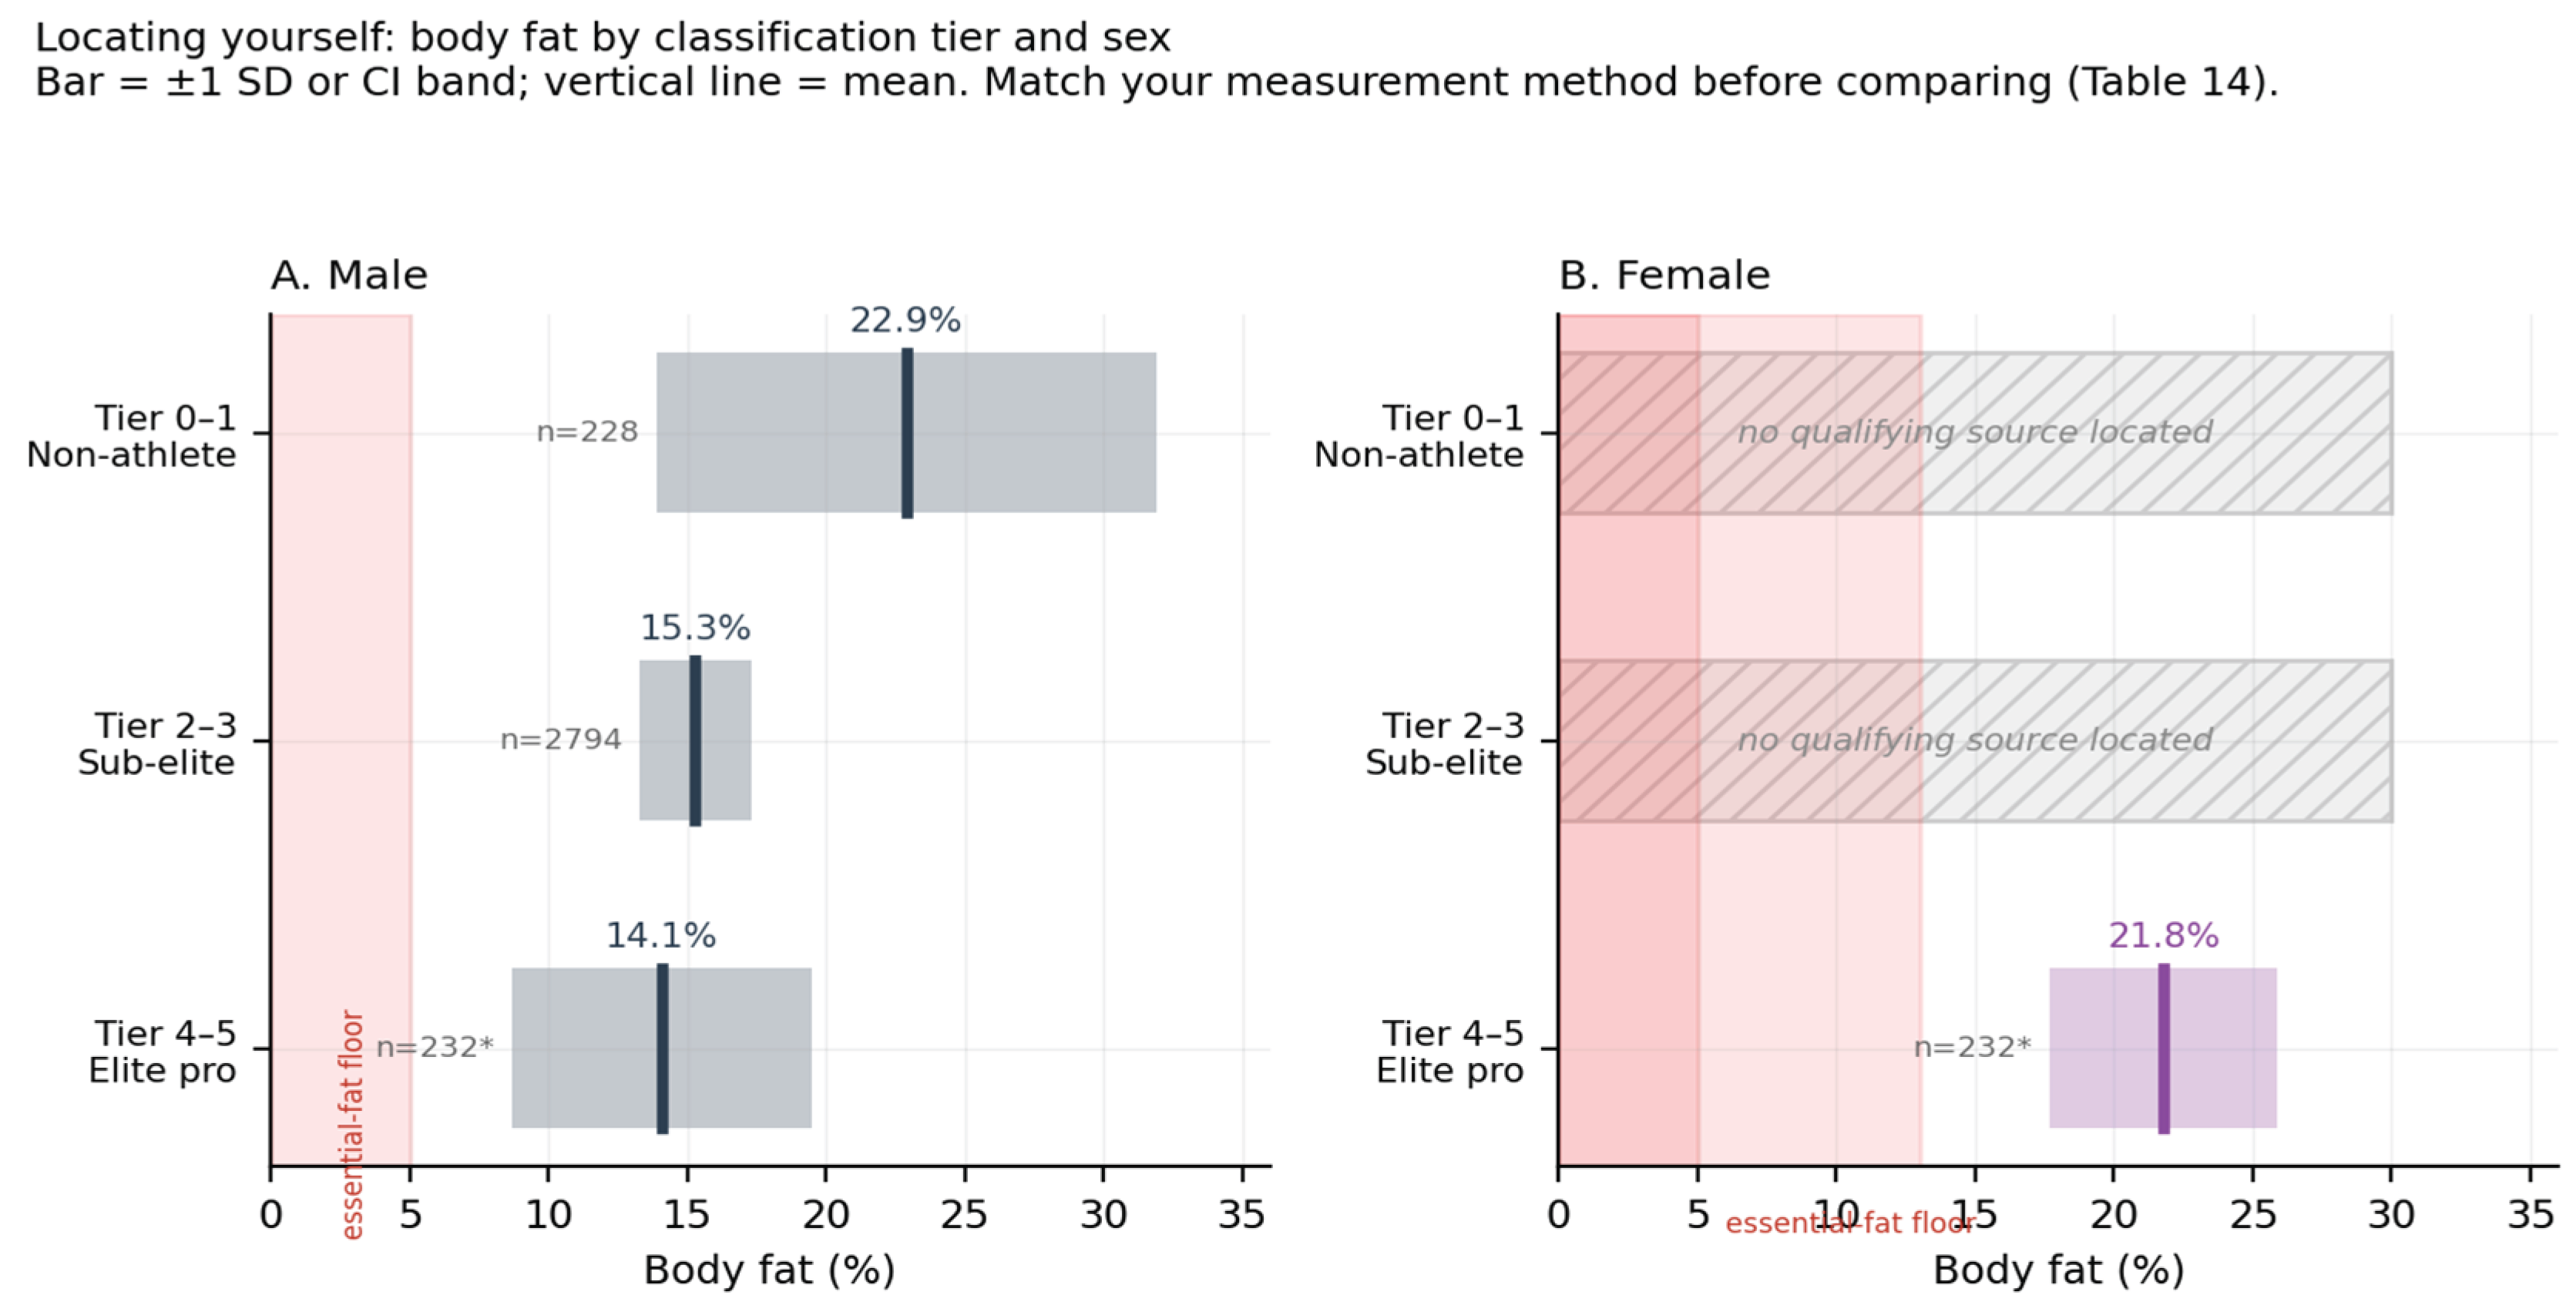
* = study-level data points, not individual subjects. The two rows marked “no data” are reported as gaps rather than omissions because their absence is itself a finding: no source located in this synthesis reports body composition for female non-athletes or female sub-elite athletes in terms permitting tier assignment. Values in this table are reproduced from Table 5, Table 6, Table 13 and Table 14; no value is new.
Figure 8.
Reference bands by classification tier and sex. The vertical line is the mean; the shaded bar is ±1 SD or the reported confidence interval. Hatched bars mark tiers for which no qualifying source was located. The red zone marks the essential-fat floor below which physiological function is impaired—approximately 3–5% in men and 12–14% in women—and is shown as a hazard boundary, not a target.
Figure 8.
Reference bands by classification tier and sex. The vertical line is the mean; the shaded bar is ±1 SD or the reported confidence interval. Hatched bars mark tiers for which no qualifying source was located. The red zone marks the essential-fat floor below which physiological function is impaired—approximately 3–5% in men and 12–14% in women—and is shown as a hazard boundary, not a target.
7.2. Matching the Measurement Method Before Comparing
Since modality is the main source of variation, a reader’s value from one instrument cannot be directly compared to a reference from another. Table 16 shows the measured values for a single population tested in four different ways, making it the only within-population modality comparison in the dataset.
Figure 9.
The same athletes measured by four instruments. Points are pooled means, bars are 95% confidence intervals. The 9.0-point spread between the lowest and highest method exceeds the 7.6-point male–female difference in the same cohort.
Figure 9.
The same athletes measured by four instruments. Points are pooled means, bars are 95% confidence intervals. The 9.0-point spread between the lowest and highest method exceeds the 7.6-point male–female difference in the same cohort.
7.3. Moving Between Tiers: What the Data Support
A person starting a sport from a sedentary baseline or returning after a break might reasonably wonder what changes to expect. The available evidence offers a limited answer.
The tier gradient in body fat is real but modest. In the clearest comparison between Tier 0–1 and Tier 4–5, the difference was 5.0 percentage points, and this difference did not reach typical levels of statistical significance. Within a single sport, the difference between regional and international competitors was less than three points and was not consistent when any one study was removed. Therefore, body fat percentage is a weak indicator of training progress. In contrast, the gradient in lean mass was large and clear: 84.55 kg versus 55.3 kg in the same comparison, with a p-value less than 0.0001.
The characteristic that truly reflects the transition from non-athlete to elite athlete is lean mass, not fat. Someone tracking their own progress should expect lean mass to increase first and by a larger amount, and should interpret a stable body fat percentage combined with rising lean mass as progress rather than stagnation.
7.4. What These Reference Values Cannot Be Used For
The data in this synthesis do not support four uses, which are listed explicitly because reference tables suggest them.
They are not targets. The values describe populations, not individual prescriptions. Athletes compete at a world-class level outside every band reported here.
They are not age-adjusted. The elite group excludes athletes over 45, and age could not be distinguished from competitive level in the literature (Section 5). No value from Table 15 should be applied to a master’s athlete without a concurrent lean mass measurement.
They are not diagnostic. These are population reference values, not clinical thresholds. Body fat percentage alone does not determine health status in either direction.
They are not floors to approach. The lower bound of a reported range describes where some measured athletes fall, not a safe minimum [27]. Essential fat is about 3–5% o [18]f body mass in men and 12–14% in women, and maintaining those values is linked to relative energy deficiency in sport, decreased bone mineral density, and hormonal disruption, as outlined in Section 6.3. The proportional distance to that lower limit is much smaller for women than the numerical difference between the sexes suggests.
7.5. For the Reader Who Is Not an Athlete
A reader at Tier 0 or Tier 1 receives the least support from the athlete literature. Table 17 summarizes the reference points already set for that reader.
Evidence hand-off. The applied section restates the values established in Sections 3 to 5 in a form accessible to individual readers. It introduces no new evidence and makes no claims about the effects of changing activity levels.
8. Limitations
The limitations of this work fall into two categories, kept separate here because they carry different significance and have different solutions. The first category includes aspects of the published evidence base that no review of this literature could avoid. The second category concerns aspects of this study’s design and execution, which are fixable and are identified as such.
8.1. Constraints Imposed by the Evidence Base
Female data are significantly more sparse than male data throughout. The primary Tier 1 source provided 18 indirect-method data points for women compared to 43 for men, and its authors explicitly call for further research on elite female athletes. Two of the six tier-by-sex cells necessary for a complete reference structure could not be populated from any sourced data. These are not omissions in this synthesis; they represent gaps in the literature and are reported as findings in Table 15 and Table 17 rather than being ignored.
Ice hockey is missing from the Tier 1 dataset [10] despite being the first canonical example the Academy cites for a collision sport. No source with sufficient sample size, proper modality, and reported dispersion for body composition in elite ice hockey players was found. The same is true for several disciplines listed in Table 2 but lacking verified data.
Medians could only be reported for one sport because the literature mainly reports means and standard deviations, not percentile distributions. Body fat distributions in collision sports are clearly skewed by positional subgroups, and a mean without a median masks that skew. This limits the analysis and cannot be corrected without new primary data.
No source reports body composition broken down by age within a fixed competitive tier, which is the necessary design to separate the two. The [1]pooled elite data set excludes athletes over 45. Therefore, masters athletes have no adequate reference values in either the athlete or the general population literature, and this synthesis cannot provide them.
Every source identified is cross-sectional. No study tracks individuals as they shift between activity levels or competitive tiers, so no causal claims about training or sport participation can be made, though the gradients are interpreted.
Measurement methods vary across sources and cannot be harmonized retrospectively because the bias direction of different modalities is not consistent between populations (Section 3.8). Data from different instruments are therefore not strictly comparable and are marked accordingly throughout.
8.2. Limitations of This Study’s Design and Execution
These are distinguished from the previous ones because they are remediable. They reflect the resources available to a single author and are not properties of the field.
This is a structured narrative synthesis, not a systematic review. No protocol was registered. Full electronic search strings are not reproduced, no counts of records screened and excluded are reported, and no PRISMA flow diagram is presented. Screening and data charting were performed by the sole author without dual independent review. These four departures are itemized as partial in Supplement 1 (items 1, 8, 9, and 14). They limit the reproducibility of the search rather than the accuracy of the extracted values, each of which is individually traceable through the released dataset (S1), but the distinction does not excuse them.
Risk of bias in included studies was not formally evaluated using a validated instrument. The two-tier provenance framework serves a related but narrower purpose: it determines whether a value can be traced to a primary source, not whether that source is methodologically sound.
The unit of analysis in Section 3.10 is the sport rather than the athlete. Seventeen sports have assigned cluster means, so within-cluster variance is zero by design, and conventional F tests are not interpretable for athlete-level inference. This is due to using published cluster structures instead of individual records, which would be resolved by the athlete-level design described in Appendix A. The body mass demand classification was derived from examining the same cluster structure against which it is tested.
Tier assignment was based on competitive rules without referring to measured values, avoiding circularity in the strong sense. However, the comparison still measures descriptive fit rather than providing independent validation. The framework should be viewed as a hypothesis generated by this synthesis rather than a confirmed result.
One Tier 1 value—the DXA figures attributed to Reale and colleagues for boxing, wrestling, and judo—is reported without its sample size, as it was retrieved through a secondary citation rather than from the primary report. It is marked NR in Table 5 and should be verified before relying on the value.
Tier assignment was performed retrospectively from source descriptions rather than from training-volume and performance data, which is a permitted but less robust application of the classification framework. When a source describes its sample only as elite or professional without further detail, tier assignment involves residual uncertainty.
9. Conclusions
Body fat percentage conflates two physiologically opposite processes. Below Tier 2, the difference between activity strata is fat loss against stable lean mass: fat mass index falls 29.1% while fat-free mass index is unchanged. Between Tier 0–1 and Tier 4–5, the difference is lean accretion against rising fat mass: lean mass is 52.9% greater while fat mass is 10.8% greater in absolute terms. The same direction of change in the reported percentage corresponds to opposite underlying physiology depending on where in the range the comparison falls, and the percentage carries no information about which applies.
This provides a mechanistic account of why lean mass discriminates training status more reliably than adiposity across every comparison in this synthesis, and it yields a specific recommendation: fat mass index and fat-free mass index should be reported alongside body fat percentage, or in place of it, wherever a comparison spans competitive levels. Both indices are computable from the compartment masses that whole-body measurement already produces.
Body mass demand, proposed here, accounts not only for differences in mean body composition between sports but for differences in dispersion: sports in which mass is penalised are approximately half as internally variable as sports in which mass is rewarded or rationed. That prediction is offered as a falsifiable extension of the framework rather than an established result, and Appendix A specifies the study that would test it.
Contact classification does not predict body composition in athletes. The leanest male morphotype spans all four categories of the standard contact taxonomy, including collision-sport strikers and non-contact endurance athletes. The apparent link between collision exposure and increased adiposity is driven by a single positional subgroup and does not apply universally.
A candidate explanatory factor, proposed here as a hypothesis, is body mass demand: whether a sport’s mechanics and rules require less mass, more mass, or a limited amount. This explains 68.6% of the variance between sports, compared to 17.4% for contact category, a result that remains significant at p = 0.0017 after permutation testing. However, it is not a complete explanation—31.4% of the variance remains unexplained, and the classification has only been tested for descriptive fit against the cluster structure from which it was derived. Appendix A outlines the pre-specified confirmatory study and the criteria for rejecting the framework.
A second result was not expected by the design and may have a greater impact than the first. Measurement modality pushes a pooled sport mean further than sex does: within a single sport measured in four ways, values ranged from 12.4% to 21.4%, a difference larger than the male–female gap in the same group. The direction of this bias switches between populations, so no fixed correction can be made. Any reference value published without its source modality is uncertain by roughly the size of the effect it claims to describe, and modality should be considered a required attribute of a reported value rather than just a methodological note.
None of the 32 traditional per-sport reference ranges studied could be traced back to a primary source listing those boundaries, nor are they supported by any reported sample. They remain useful guidelines and align with verified data, but they should not be cited as sourced values. The provenance check used here is offered as a portable approach for any field where reference values circulate faster than their citations can be verified.
For neurotrauma exposure modeling, the implication is that body composition should not be used as a proxy or covariate for impact exposure. When an anthropometric covariate is necessary, fat-free mass is the more justifiable choice, as it distinguished elite players from controls with p < 0.0001, whereas body fat percentage only reached p = 0.053.
The two exploratory secondary analyses add context rather than conclusions. The competitive-tier gradient in body fat is real but small, non-monotonic, and fragile, while the corresponding gradient in lean mass is large and robust—reinforcing the conclusion that lean mass, not adiposity, is the key variable across every comparison in this synthesis. Age could not be separated from competitive tier anywhere in the available literature, and elite reference values do not extend beyond 45 years, leaving masters athletes without adequate reference data in either the athlete or the population literature.
Two constraints limit all of the above. Every comparison reported here is cross-sectional and only shows association; nothing in this summary allows for a causal claim about the impact of training or sport participation on body composition. Additionally, two of the six tier-by-sex categories needed for a complete reference structure—female non-athletes and female sub-elite athletes—could not be filled from any sources found, so many readers cannot see their own data in the reference set. This gap is presented as a finding rather than a missed opportunity, and filling it would be more helpful than any further analysis of the male data.
Taken together, these results describe a measurement practice built on a variable that cannot support it. Body fat percentage is compared across instruments that do not agree and whose disagreement does not run in a consistent direction; it is benchmarked against reference ranges for which primary sources were not located; and it is interpreted as though a single value carried a single meaning, when it summarises two opposing processes. None of this makes the measurement worthless. It makes it conditional, and the conditions are not currently reported. The remedy requires no new technology: report the compartment masses that whole-body measurement already yields, state the modality as a mandatory attribute of any value, hold comparisons within competitive tier, and group sports by what their mechanics require of mass rather than by whether athletes collide.
Author’s Note on Interpretation
The following is the author’s personal position. It is not a finding of this study, is not supported by the data presented here, and is separated from the analysis for that reason. Readers should evaluate it as opinion.
I hold the view that participation in sport and structured physical activity is worth pursuing, and that the reader who is currently sedentary and considering taking up a sport should do so. That view is informed by decades of practice in multiple styles martial arts and by the broader public-health literature on physical activity. It is not established by anything in this paper.
The distinction is important, and I want to state it clearly. This synthesis compares groups measured at a single point in time. It shows that people at different activity levels differ in body composition. It does not demonstrate that activity caused the difference, and it contains no evidence regarding the health outcomes of sport participation—such as cardiovascular, metabolic, musculoskeletal, cognitive, or psychological effects—which are the main reasons the case for physical activity is made, and which are covered in literature this paper does not review.
A reader starting a sport should therefore not rely on Table 15 or Table 17 as predictions for changes in their body composition. These tables show where measured groups stood. They serve as a map of the terrain, not a guide for progress, and the reasons to begin a sport are mainly not the reasons outlined in this paper.
Supplementary
The following supporting information can be downloaded at the website of this paper posted on Preprints.org, Appendix A pre-specified confirmatory protocol; Supplement 1 PRISMA-ScR checklist; Supplement 2 conventional Tier 2 reference ranges; S1 complete Tier 1 dataset (tier1_dataset.csv); S2 figure generation code.
Author Contributions
RCK is the sole author. RCK conceived the study, designed the evidence-tiering framework and source-traceability assessment, conducted the search and data extraction, developed the body mass demand classification, produced the figures, and wrote and revised the manuscript. RCK is responsible for the integrity of the work and the accuracy of the analysis. Use of a large language model as a research, drafting, and editing aid is disclosed below; all content was directed and verified by the author. If additional contributors join future iterations, their contributions will be specified in accordance with International Committee of Medical Journal Editors (ICMJE) authorship criteria, with ORCID identifiers reported for all contributing authors.
Funding
This study was self-funded by Richard Clark Kaufman, PhD. No external grant funding or industry sponsorship was received.
Data Availability Statement
This study did not generate or analyze any new human-subject data; all inputs are sourced from the published literature cited here. The full Tier 1 dataset supporting Tables 5 to 7, 11, and 12, and Figures 1 to 9—containing per-row sample sizes, measurement modalities, and source attributions—is provided as an open supplementary file (S1, tier1_dataset.csv), along with the figure generation code (S2). This data is shared under the preprint’s CC-BY license, ensuring all information supporting the conclusions is included within the article and its supplementary materials. All tables presenting values from prior studies are reconstructions compiled by the author from data already published elsewhere; the source of each value is cited in the corresponding table. No figure, table, or extract has been reproduced from another publication.
Ethics Approval Statement
This study is a structured review based solely on published, publicly available literature. It involved no human or animal subjects, no primary data collection, and no identifiable participant information; therefore, institutional review board approval was not necessary. The work was carried out in accordance with the principles of the Declaration of Helsinki as they apply to the use of published data.
Conflicts of Interest
Richard Clark Kaufman, PhD, is the Founder and Chief Executive Officer and Chief Scientific Officer of NutraGLP Biosciences, an entity that develops protocols and formulations addressing metabolic health, cognitive performance, weight loss, aging disorders, and contact-sport neuroprotection. This synthesis evaluates no commercial product, names no proprietary formulation, and makes no therapeutic claim. It concerns body composition reference data and the provenance of published reference ranges. Nevertheless, the author has financial interests that may benefit indirectly from increased scientific attention to contact-sport athlete populations, and the author has separately published a computational model of cumulative head-impact burden in contact sports to which Section 4.5 of this work refers. The analysis was conducted in good faith using published external data, and the reader is encouraged to interpret the findings in the context of this disclosure.
AI-Use Disclosure
In accordance with preprint-platform policy and the COPE position statement on AI, the author discloses that a large language model was used as an assistive tool for literature retrieval, source verification, and figure code generation. The research question, analytical framework, classification proposed, decomposition analysis, and all conclusions are the intellectual work of the author, who takes full responsibility for the final text. Every numerical value reported was traced to and checked against its primary source by the author.
Regulatory Positioning
This study does not evaluate any commercial product and is not intended to support or imply drug-level claims, nor to classify any product as a pharmaceutical agent. It is a scientific and analytical synthesis provided solely for scientific, informational, and research purposes. It does not constitute medical advice, diagnosis, or treatment recommendations. Body composition reference values are reported as published; they are not diagnostic thresholds and should not be used for individual clinical decision-making. Results and risks may vary between individuals.
Reporting guideline
PRISMA-ScR, adapted for a structured narrative synthesis; four items reported as partial (Supplement 1).
Appendix A. Pre-Specified Protocol for Confirmatory Testing of the Body Mass Demand Framework
The body mass demand framework outlined in Section 6.4 is inductively derived from existing cluster structures and is presented in Section 8 as a hypothesis formed from this synthesis, not as a conclusion proven by it. This appendix specifies the study designed to test it, ensuring the framework is falsifiable and that any subsequent confirmatory work follows a pre-established analysis plan prior to data collection.
A.1 Objective
To determine whether body mass demand—the classification of a sport as low, high, or capped mass demand—predicts athlete body composition better than contact classification, and to estimate the size of the difference.
A.2 Design
Cross-sectional multi-sport cohort with a single measurement method. A single DXA device, or a few cross-calibrated devices of the same make and beam type, is needed throughout; Section 3.8 shows that differences between methods could otherwise be larger than the effect being tested. At least eight sports are included, covering all three body mass demand categories and all four contact categories, with the two classifications intentionally crossed to prevent them from being collinear.
A.3 Participants and Sample
Tier 4–5 athletes, as defined in Section 2.5, are assigned tiers prospectively based on training volume and competitive standing rather than retrospectively from description. Both sexes are recruited, with female enrollment targets set to at least match males, given the imbalance in the corpus documented in Section 3.2 and Section 8. Minimum of 40 athletes per sport. Playing position is recorded for all team-sport participants, since Section 3.4 establishes that positional variance can exceed between-sport variance.
A.4 Measurements
Whole-body DXA conducted under a standardized protocol with controlled hydration and fasting status, providing measurements of fat mass, fat-free mass, bone mineral content, and regional distribution. Fat mass index and fat-free mass index were calculated for each participant. Data recorded included height, body mass, age, training hours per week, and years of sport participation. Body fat percentage serves as a secondary outcome; fat-free mass index is the primary outcome, based on the reasoning in Section 4.2 and Section 6.3.
A.5 Pre-Specified Hypotheses
H1.
The body mass demand category explains more variation in fat mass index between sports than the contact category does.
H2.
Contact category does not significantly affect fat mass index once body mass demand category is accounted for in the model.
H3.
Within capped mass demand sports, striking disciplines have a lower fat mass index than grappling disciplines competing in equivalent classes.
H4.
Fat-free mass index more strongly distinguishes the competitive tier than body fat percentage, consistent with the pattern in Section 4.2 under controlled measurement.
A.6 Analysis
Mixed-effects models with sport as a random effect and body mass demand category, contact category, sex, and position as fixed effects. Variance explained is compared between nested models using a likelihood ratio test. The falsification criterion, stated in advance, is that the framework is not supported if contact category retains significant explanatory power for fat mass index after adjusting for body mass demand, or if the categories do not separate at p < 0.05 with an effect size exceeding the measurement error of the instrument.
A.7 Reporting
The analysis plan should be registered before data collection begins. Results should be reported item by item against this appendix, including any deviations. A null result must be fully reported; the framework in Section 6.4 is designed to be falsifiable, and its rejection would be a valid outcome of the study.
References
- Martinez-Mireles X, Ramírez E, Lagunes-Carrasco JO, López-García R, García S, Bouzas C, Salas-García R, Tur JA. Defining elite zones: a scoping review of body physique and body fat in elite athletes. J Funct Morphol Kinesiol. 2026;11(1):13. [CrossRef]
- Dengel DR, Raymond-Pope CJ, Bosch TA, et al. Positional differences in muscle-to-bone ratio in National Football League players. Int J Sports Med. 2023. PMID: 37160263.
- Hattori K, Tatsumi N, Tanaka S. Assessment of body composition by using a new chart method. Am J Hum Biol. 1997;9(5):573–578.
- Dengel DR, Bosch TA, Burruss TP, Fielding KA, Engel BE, Weir NL, Weston TD. Body composition and bone mineral density of National Football League players. J Strength Cond Res. 2014;28(12):3313–3319. PMID: 24149760.
- Reale R, Burke LM, Cox GR, Slater G. Body composition of elite Olympic combat sport athletes. Eur J Sport Sci. 2020;20(2):147–156.
- Kasper AM, Langan-Evans C, Hudson JF, et al. Come back skinfolds, all is forgiven: a narrative review of the efficacy of common body composition methods in applied sports practice. Nutrients. 2021;13(4):1075. [CrossRef]
- Bilsborough JC, Greenway K, Opar D, Livingstone S, Cordy J, Coutts AJ. The accuracy and precision of DXA for assessing body composition in team sport athletes. J Sports Sci. 2014;32(19):1821–1828.
- Jackson AS, Pollock ML. Generalized equations for predicting body density of men. Br J Nutr. 1978;40(3):497–504.
- Durnin JV, Womersley J. Body fat assessed from total body density and its estimation from skinfold thickness: measurements on 481 men and women aged from 16 to 72 years. Br J Nutr. 1974;32(1):77–97.
- Rice SG; American Academy of Pediatrics Council on Sports Medicine and Fitness. Medical conditions affecting sports participation. Pediatrics. 2008;121(4):841–848. https://doi.org/10.1542/peds.2008-0080. [Clinical report retired July 2018.]. [CrossRef]
- Kelly TL, Wilson KE, Heymsfield SB. Dual energy X-ray absorptiometry body composition reference values from NHANES. PLoS One. 2009;4(9):e7038. [CrossRef]
- Wroblewski AP, Amati F, Smiley MA, Goodpaster B, Wright V. Chronic exercise preserves lean muscle mass in masters athletes. Phys Sportsmed. 2011;39(3):172–178. [CrossRef]
- Martínez-Mireles X, Nava-González EJ, López-Cabanillas Lomelí M, et al. The shape of success: a scoping review of somatotype in modern elite athletes across various sports. Sports. 2025;13(2):38. [CrossRef]
- Sansone P, Makivic B, Csapo R, Hume P, Martínez-Rodríguez A, Bauer P. Body fat of basketball players: a systematic review and meta-analysis. Sports Med Open. 2022;8(1):26. [CrossRef]
- Baranauskas M, Kupčiūnaitė I, Stukas R. Establishing benchmark percentiles for the classification of body fat percentage of professional male athletes competing in combat sports through bioimpedanciometry. Appl Sci. 2023;13(17):9885. [CrossRef]
- Nana A, Slater GJ, Stewart AD, Burke LM. Methodology review: using dual-energy X-ray absorptiometry (DXA) for the assessment of body composition in athletes and active people. Int J Sport Nutr Exerc Metab. 2015;25(2):198–215.
- Milsom J, Naughton R, O’Boyle A, et al. Body composition assessment of English Premier League soccer players: a comparative DXA analysis of first team, U21 and U18 squads. J Sports Sci. 2015;33(17):1799–1806. [CrossRef]
- Sundgot-Borgen J, Meyer NL, Lohman TG, et al. How to minimise the health risks to athletes who compete in weight-sensitive sports. Br J Sports Med. 2013;47(16):1012–1022. [CrossRef]
- McKay [19] AKA, Stellingwerff T, Smith ES, Martin DT, Mujika I, Goosey-Tolfrey VL, Sheppard J, Burke LM. Defining training and performance caliber: a participant classification framework. Int J Sports Physiol Perform. 2022;17(2):317–331. [CrossRef]
- Schwingel PA, Porto LGG, Silva RF, et al. Enhancing performance: unveiling the physiological impact of submaximal and supramaximal tests on mixed martial arts athletes in the −61 kg and −66 kg weight divisions. Front Physiol. 2023;14:1257639.
- Ambroży T, Rydzik Ł, Obmiński Z, et al. Evaluation of the body composition and selected physiological variables of the skin surface depending on technical and tactical skills of kickboxing athletes in K1 style. Int J Environ Res Public Health. 2021;18(21):11342. [CrossRef]
- Zemski AJ, Hind K, Keating SE, Broad EM, Marsh DJ, Slater GJ. Increases in DXA-derived visceral fat across one season in professional rugby union players. J Clin Densitom. 2021;24(3):412–420.
- Kaufman RC. Quantifying lifetime brain-injury burden across six contact sports: a normalized head-impact dose model integrating exposure frequency, rotational acceleration, and cumulative vulnerability. Research Square. 2026. [CrossRef]
- Wan Nudri WD, Ismail MN, Zawiah H. Body mass index and body fat status of men involved in sports, exercise, and sedentary activities. Malays J Med Sci. 2009;16(2):21–26. PMID: 22589654.
- Franchini E, Brito CJ, Artioli GG. Weight loss in combat sports: physiological, psychological and performance effects. J Int Soc Sports Nutr. 2012;9(1):52. [CrossRef]
- Mauricio CA, Merino P, Merlo R, et al. Rapid weight loss of up to five percent of the body mass in less than 7 days does not affect physical performance in official Olympic combat athletes with weight classes: a systematic review with meta-analysis. Front Physiol. 2022;13:830229. [CrossRef]
- Mountjoy M, Ackerman KE, Bailey DM, et al. 2023 International Olympic Committee’s (IOC) consensus statement on Relative Energy Deficiency in Sport (REDs). Br J Sports Med. 2023;57(17):1073–1097. [CrossRef]
- Mountjoy M, Sundgot-Borgen J, Burke L, et al. IOC consensus statement on relative energy deficiency in sport (RED-S): 2018 update. Br J Sports Med. 2018;52(11):687–697. [CrossRef]
- O’Connor KL, Rowson S, Duma SM, Broglio SP. Head-impact-measurement devices: a systematic review. J Athl Train. 2017;52(3):206–227. [CrossRef]
- Field B, Waddington G, McKune A, Goecke R, Gardner AJ. Validation of an instrumented mouthguard in rugby union—a pilot study comparing impact sensor technology to video analysis. Front Sports Act Living. 2023;5:1230202. [CrossRef]
- King D, Hume PA, Brughelli M, Gissane C. Instrumented mouthguard acceleration analyses for head impacts in amateur rugby union players over a season of matches. Am J Sports Med. 2015;43(3):614–624. [CrossRef]
Table 1.
Analysis parameters, assignment basis, and where each is analysed.
| Parameter | Levels | Assignment basis | Analysed in |
|---|---|---|---|
| Contact category | Collision; contact; limited contact; non-contact | AAP taxonomy (reference 21); intended mechanical contact | Tables 2, 4, 8, 9, 11, 12; Sections 3.1, 3.3, 3.9, 3.10 |
| Body mass demand | Low; high; capped | Competitive rules of the sport (Section 2.7) | Tables 11, 12; Sections 3.11, 6.2; Appendix A |
| Classification tier | Tier 0–1; Tier 2–3; Tier 4–5 | Participant Classification Framework (Section 2.5) | Tables 13, 14, 15; Sections 4, 7 |
| Sex | Male; female | As reported by the source | Tables 3, 9, 15; Sections 3.2, 6.5 |
| Measurement modality | DXA; ADP; hydrostatic; BIA; ultrasound; anthropometry | As reported by the source | Tables 3, 5, 6, 16; Sections 3.8, 6.6, 7.2 |
| Playing position | Sport-specific | As reported by the source | Table 5; Sections 3.4, 6.1 |
Contact category and body mass demand are alternative classifications for the same seventeen sports and are mutually exclusive explanations; Section 3.10 determines which one accounts for more between-sport variance. The remaining four parameters are stratification variables and do not compete with each other.
Table 2.
Contact classification of included sports (American Academy of Pediatrics taxonomy).
| Category | Contact character | Sports represented in this synthesis |
|---|---|---|
| Collision | Purposeful, high force | Boxing, ice hockey, American football, rugby union, rugby league, lacrosse, mixed martial arts, wrestling, judo, taekwondo, karate, sumo |
| Contact | Routine, lower force | Basketball, soccer, water polo, team handball |
| Limited contact | Infrequent or inadvertent | Baseball, softball, volleyball, gymnastics, cycling, downhill skiing, fencing, cricket |
| Non-contact | Rare and unexpected | Distance running, sprinting, swimming, triathlon, rowing, powerlifting, Olympic weightlifting, tennis, bodybuilding |
Classification follows Rice and the AAP Council on Sports Medicine and Fitness (reference 21). Triathlon is classified as non-contact despite the limited-contact nature of its cycling segment.
Table 3.
Tier 1 pooled body fat percentage in elite athletes, by sex and measurement modality.
| Population and modality | Male | Female | Male elite zone (±2 SD) |
|---|---|---|---|
| All elite athletes, pooled | 14.1 ± 5.4 | 21.8 ± 4.1 | — |
| Indirect methods (DXA, ADP, hydrostatic) | 13.6 ± 3.6 | 22.3 ± 2.8 | 6.4–20.8 |
| Doubly indirect (BIA, ultrasound, anthropometry) | 13.7 ± 5.2 | 21.7 ± 4.3 | 3.3–24.1 |
Values are expressed as percentage of body fat, mean ± SD. Data from reference [1]. Female data come from a significantly smaller sample size (18 data points using indirect methods versus 43 for males).
Table 4.
Male morphotype clusters, constituent sports, and contact classification.
| Morphotype | BF% (mean ± SD) | Constituent sports | Contact categories represented |
|---|---|---|---|
| Lean intermediate | 9.8 ± 2.2 | Boxing, taekwondo, volleyball, basketball, rowing, marathon, triathlon, sprinting, gymnastics, sprint swimming | Collision, contact, limited contact, non-contact—all four |
| Intermediate solid | 15.9 ± 2.6 | American football, judo, water polo, rugby | Collision and contact |
| Adipose solid | 27.9 ± 2.1 | Heavyweight powerlifting, American football linemen, sumo | Collision and non-contact |
Table 5.
Tier 1 body fat values for the six contact sports of the Normalized Head-Impact Dose model.
Table 5.
Tier 1 body fat values for the six contact sports of the Normalized Head-Impact Dose model.
| Sport | Sex | n | Mean % | SD / range | Median | Method | Source |
|---|---|---|---|---|---|---|---|
| Boxing | M | 14 | 13.4 | ± 6.4 | NR | MFBIA | Baranauskas et al. 2023 [15] |
| Boxing | M | NR | 9.1 | NR | NR | DXA | Reale et al. 2020 [5] |
| Mixed martial arts | M | 20 | 8.7* | 7.85–9.5 by division | NR | Anthropometry | Schwingel et al. 2023 [20] |
| Kickboxing / Muay Thai | M | 24 | 14.09 | range 5.8–27.0 | NR | BIA | Ambroży et al. 2021 [21] |
| American football (whole roster) | M | 346 | 17.90 | ± 6.92 | NR | DXA | Dengel et al. 2023 [2] |
| Am. football—defensive backs | M | 411† | 12.1 | NR | NR | DXA | Bosch et al. 2014 [4] |
| Am. football—wide receivers | M | 411† | 12.5 | NR | NR | DXA | Bosch et al. 2014 [4] |
| Rugby union—forwards | M | NR | 17.7 | NR | NR | DXA | Zemski et al. 2020 [22] |
| Rugby union—backs | M | NR | 13.5 | NR | NR | DXA | Zemski et al. 2020 [22] |
| Soccer—first team | M | 27 | 10.0 | ± 1.6 | NR | DXA | Milsom et al. 2015 [17] |
| Soccer—U21 | M | 21 | 11.6 | ± 2.5 | NR | DXA | Milsom et al. 2015 [17] |
| Soccer—U18 | M | 35 | 11.4 | ± 2.6 | NR | DXA | Milsom et al. 2015 [17] |
The six sports are listed individually and arranged to correspond with the companion Normalized Head-Impact Dose model [23], which analyzes the same six disciplines. No pooling is done for combat sports. NR = not reported. * = weighted mean calculated from two equal-sized groups (n = 10 each) reported separately in the source; the component means are shown in the adjacent column. † = derived from a single cohort of 411 players; per-position n is not reported separately.
Table 7.
Aggregate evidentiary base.
| Evidence unit | Count | Comment |
|---|---|---|
| Athletes with individually reported n | 5,144 | Basketball 4,335; NFL 346 + 411; combat 52 |
| Non-athlete controls | 228 | Age-matched, DXA |
| Total individuals with traceable n | 5,372 | — |
| Study-level data points | 232 | Across 90 studies, 61 sports; individual n not recoverable |
| Per-sport values with a reported median | 1 | Combat sports pooled only |
| Tier 2 ranges with any reported n | 0 | All 32 conventional ranges lack n, mean, and distribution |
The last statement is the numerical assertion of the provenance issue: the reference ranges widely used are backed by no reported sample at all.
Table 10.
Source-traceability assessment outcome.
| Value class | Tier | Provenance status |
|---|---|---|
| Pooled elite means and elite zones | 1 | Traceable. Reference 1; 232 study-level data points, 90 studies. |
| Morphotype cluster means | 1 | Traceable. Reference 1, method specified (Hattori chart). |
| NFL whole-roster and control values | 1 | Traceable. Reference 2, n = 346 and 228, DXA, p-values reported. |
| NFL position-stratified values | 1 | Traceable to primary DXA cohort, n = 411 (reference 4). |
| Per-sport ranges, male (16 rows) | 2 | Not identified. Attributed sources inspected contain no per-sport table. |
| Per-sport ranges, female (16 rows) | 2 | Not identified. Attributed sources inspected contain no per-sport table. |
| Masters age-adjustment heuristics | 2 | Not identified. Commercial origin; no validation study located. |
A value for which no primary source was identified is not thereby incorrect; the search was not exhaustive, and absence of identification is not evidence of absence. Tier 2 ranges generally align with Tier 1 data. The classification relates to evidentiary value, not accuracy.
Table 16.
Values reported for one population by four measurement methods.
| Method | Mean % | 95% CI | Practical note |
|---|---|---|---|
| Skinfolds | 12.4 | 10.6–14.2 | Lowest reading of the four. Operator-dependent; results vary with the prediction equation selected. |
| Bioelectrical impedance | 15.2 | 12.8–17.6 | Common in consumer and gym devices. Highly sensitive to hydration status. |
| Air-displacement plethysmography | 20.0 | 13.4–26.6 | Widest confidence interval of the four in this dataset. |
| DXA | 21.4 | 18.4–24.3 | Highest reading of the four here. Also returns lean mass and bone density on the same scan. |
Data from Sansone et al.; basketball, n = 4335 [14]. The direction of modality bias is not constant across populations—in the combat-sport comparison in Section 3.8, DXA returned the lowest rather than the highest values. No fixed correction factor can therefore be applied. Compare like with like, or do not compare. Quantified, the mean signed difference between DXA and bioimpedance is +6.20 percentage points in the basketball pool and −2.83 points in the combat-sport comparison, an 8.6-point reversal in sign and magnitude.
Table 17.
Reference points for the non-athlete reader, consolidated.
| Group | n | Mean % | SD | Source, method, and comparability |
|---|---|---|---|---|
| Sedentary men, 18–44 | 80 | 20.6 | ± 5.8 | Table 14; four-site skinfold. Comparable only with the two rows below. |
| Regular exercisers, 18–44 | 80 | 18.9 | ± 5.5 | Table 14; same cohort and method. |
| Sport participants, mixed level | 83 | 15.7 | ± 5.4 | Table 14; same cohort and method. |
| Non-athlete male controls | 228 | 22.93 | ± 8.96 | Table 13; DXA. Not comparable with the skinfold rows above. |
| Non-athlete women, any age | — | No data | — | No qualifying source located in this synthesis. |
| General population, all ages | — | Not extracted | — | Population DXA reference values spanning ages 8–85 exist (references 22, 39) but lay outside the scope of this athlete-focused synthesis. |
All values are taken from Table 13 and Table 14. The first three rows are comparable among themselves and with nothing else in this paper; the fourth uses a different instrument. No row implies an inference about what would happen to an individual who changed activity levels, for the reason given in Section 6.7.
Disclaimer/Publisher’s Note: The statements, opinions and data contained in all publications are solely those of the individual author(s) and contributor(s) and not of MDPI and/or the editor(s). MDPI and/or the editor(s) disclaim responsibility for any injury to people or property resulting from any ideas, methods, instructions or products referred to in the content. |
© 2026 by the authors. Licensee MDPI, Basel, Switzerland. This article is an open access article distributed under the terms and conditions of the Creative Commons Attribution (CC BY) license (http://creativecommons.org/licenses/by/4.0/).
Copyright: This open access article is published under a Creative Commons CC BY 4.0 license, which permit the free download, distribution, and reuse, provided that the author and preprint are cited in any reuse.