
Submitted:
07 August 2026
Posted:
11 August 2026
You are already at the latest version
Abstract
The 24 solar terms (STs) comprise a traditional Chinese seasonal calendar that has long guided agricultural practices, but its agronomic relevance under climate change remains uncertain. We assessed 24ST applicability in Shanxi Province using daily temperature, precipitation, and sunshine duration records from 23 meteorological stations. Climate trends were analyzed at the ST scale, and the Decision Support System for Agrotechnology Transfer (DSSAT) CERES-Maize model was applied to simulate maize phenology and yield in evaluating phenological shifts and sowing-date effects. Results showed that (1) warming was concentrated during Yushui–Qingming and Xiaoxue–Dahan, with sunshine declines across Mangzhong–Xiaoshu and Bailu–Hanlu. Precipitation trends were weak and spatially variable. (2) The calibrated CERES-Maize model reliably reproduced regional yields and phenology. Simulated V3 growth stage, anthesis, and maturity dates advanced by 1.53, 1.88, and 3.11 days per decade, respectively. V3 was driven by early-spring hydrothermal radiation, while anthesis and maturity was closely associated with Xiazhi/Xiaoshu/Dashu summer heat. (3) Optimal sowing windows were Guyu-H2–H3, Xiaoman-H1–H2, and Xiaoman-H2–H3 for northern, central, and southern Shanxi, respectiely. Optimized sowing shifted V3 towards Xiaoman–Mangzhong, delayed anthesis from early Xiaoshu to late Dashu–Liqiu, and postponed maturity towards Qiufen. These findings provide a scientific basis for continued use of the 24 STs in guiding agricultural practices for maize.
Keywords:
twenty-four solar terms
; optimized sowing date
; DSSAT
; spring maize
; Shanxi province
1. Introduction
The 24 solar terms (STs) comprise a Chinese seasonal calendar system derived from the annual movement of the sun and recurrent sequences for temperature, precipitation, phenology, and agricultural practices [1,2,3]. Each ST corresponds to an approximate 15-day segment of the annual cycle, and each term can be further divided into three hou (5-day sub-ST windows), each lasting approximately 4–6 days. For more than two millennia, this system has translated astronomic time into expectations for field operations, including land preparation, sowing, irrigation, awareness of flowering risks, harvest, and frost avoidance. Farmers acted on these expectations via orally transmitted agricultural proverbs (nongyan) that specified the optimal timing for sowing and other field operations across the region. Developed via long-term observations in the Yellow River agricultural region, the 24ST system has provided a shared temporal reference for coordinating seasonal field operations across the Loess Plateau [1,2]. However, ongoing climate change has altered the climatic conditions corresponding to each ST and is potentially eroding the historical agronomic accuracy of this traditional calendar.
Maize (Zea mays) is a major grain crop in northern China and the Loess Plateau. Its growth and development are jointly regulated by climatic conditions, field management practices, and cultivar characteristics, among other factors. Climate change has altered the seasonal distribution of thermal, water, and radiation resources that determine crop establishment, vegetative growth, flowering, grain filling, and physiological maturity [4,5,6,7]. Warming may accelerate phenological development and shorten reproductive duration, whereas declining sunshine duration and uneven precipitation can offset the potential benefits of an extended thermal season [8,9,10,11]. Among the agronomic management options available, the sowing date is highly adjustable because it determines the meteorological sequence experienced across key developmental stages. By shifting phenology, adjustment of the sowing date can alter maize exposure to water deficits, heat stress, insufficient radiation, and the risk of low temperatures in autumn [12,13,14]. A clearer understanding of key factors, such as meteorological conditions and sowing date, that affect the growth and development of spring maize is therefore essential for the development of strategies that stabilize yield and enhance production resilience.
Research on maize phenology and key influencing factors has expanded rapidly worldwide. Several studies have shown that crop phenology responds heterogeneously to warming, cultivar replacement, management, and agroclimatic gradients [15,16,17,18]. Across areas with statistically significant climate–yield relationships, climate variability accounted for 32%–39% of year-to-year yield variability for maize, rice, wheat, and soybean [19]. During 1981–2010, yield variability decreased significantly in 19%–33% of the global harvested area, but increased in 9%–22% of this area, with the changes attributable to recent climate change [20]. For the four countries supplying 87% of global maize exports, the probability of simultaneous production losses exceeding 10% was projected to rise from virtually zero under the present climate to 7% at 2 °C warming and 86% at 4 °C warming [21]. These risks make the seasonal placement of sensitive crop stages an important adaptation target.
China-wide simulations projected that future climate change would shorten grain filling in maize by 6–15 days and reduce potential yields by 2%–32% under scenarios in which current cultivars were retained. According to projections, delayed sowing could increase potential yields by 2%–25% [22]. Likewise, field experiments in the North China Plain showed that by shifting sowing from April 24 to May 15, the yield could increase by 2,157 kg ha−1 in Zhengdan 958 and by 1,137 kg ha−1 in Ludan 984, mainly because of a higher kernel number [23]. A predictive study found that an appropriate sowing delay could reduce maize exposure to extreme heat during growth on the North China Plain [24]. Sheng et al. investigated associations between maize sowing dates and monthly temperature and precipitation across China, but found that these variables had limited explanatory power for sowing-date variation on the Loess Plateau [25]. Huang et al. identified potential and optimal maize sowing windows across the maize belt in China and projected that these windows would expand under climate warming [26].
Most studies generally analyze agricultural timing using Gregorian dates together with monthly climatic windows or broader seasonal sowing windows. These approaches facilitate quantitative cross-regional comparison but do not preserve the local seasonal language used by farmers for subseasonal field operations in China. Despite advances, quantitative studies linking crop phenology and sowing-date management to the 24 STs remain limited. Therefore, a systematic reassessment is needed to determine whether this traditional calendar can still provide effective guidance for agricultural practices under climate change, and to establish an evidence-based foundation for the contemporary application of this inherited traditional agricultural knowledge.
Studies on crop phenology have generally used four approaches: field experiments; thresholds for the accumulated temperature; statistical or remote-sensing analyses; and process-based crop models. Field experiments provide direct agronomic evidence, but are often limited by site, cultivar, and year constraints. Thresholds for the accumulated temperature are practical, but mainly reflect heat accumulation and cannot fully represent radiation, water conditions, or stage-specific climatic risks. Statistical and remote-sensing analyses can identify regional phenological trends and climate drivers, but they are less able to test alternative sowing scenarios or trace how sowing shifts affect successive crop stages. Process-based crop models require detailed inputs and calibration, but they can mechanistically link daily weather, soil conditions, management practices, cultivar traits, crop development, and yield formation in a reproducible framework.
Process-based crop models that are frequently used include the Decision Support System for Agrotechnology Transfer (DSSAT) CERES-Maize model [27], APSIM (Agricultural Production Systems Simulator) [28], and WOFOST (World of Food Studies) [29]. Because CERES-Maize is a mature and extensively evaluated model with standardized data structures, well-established cultivar parameterization procedures, and a capacity for reproducible multisite and long-term scenario analyses, it has been widely used to investigate maize phenology, management practices, and responses to climate variability and change [27,30,31,32]. In particular, CERES-Maize has been widely applied for optimization of irrigation and sowing dates [33,34] and in climate impact assessments and studies comparing crop models [35,36,37,38]. Recent maize studies have further evaluated adjustments to the sowing date and cultivars across contrasting climatic and soil–water environments [39,40,41,42,43]. Across the research literature, studies applying CERES-Maize have evaluated multi-cultivar sowing-date responses in China [39] and optimized the sowing date for spring maize on the Loess Plateau by considering the temperature and soil water availability before sowing [41]. Together, results for the Loess Plateau [33,41] demonstrate the applicability of CERES-Maize for diagnosing site-specific sowing and water-management responses under the heterogeneous hydrothermal conditions in this semiarid region.
Shanxi Province, where the 24ST calendar originated, represents a suitable test region because of its strong north–south gradients in elevation, temperature, precipitation, sunshine duration, and production systems for spring maize, alongside a long tradition of ST-based agricultural guidance. Therefore, we combined the 24ST calendar with DSSAT CERES-Maize v4.8 to address three questions: (i) how climate variables have been redistributed across STs during 1960–2019; (ii) how maize phenology has shifted and which ST climate windows are most closely associated with these shifts; and (iii) how to establish optimized regional sowing windows at the ST scale to balance yield, stability, heat exposure during the flowering stage, and maturity-boundary compliance (MBC).
2. Materials and Methods
2.1. Study Area
Shanxi Province is located on the eastern Loess Plateau in North China and is characterized by a plateau-basin-mountain landscape, with average elevation of approximately 1,000 m a.s.l. (Figure 1). The province has a temperate continental monsoon climate, with a long-term annual mean temperature of ~10 °C, annual precipitation of ~500 mm, and annual sunshine duration of approximately 2,500 h. Precipitation is mainly concentrated during the summer monsoon season, which results in strong seasonal coupling between the water supply and crop growth. These background conditions create clear differences in thermal accumulation, water availability, and sunshine duration for the production of spring maize.
The province contains northern uplands with relatively limited thermal resources and strong late-season low-temperature constraints, a central basin and Loess-hill environments with intermediate thermal and water conditions, and southern basins and hilly regions with a warm and long growing season. Spring maize is widely planted across these environments and is sensitive to seasonal variations in temperature, precipitation, and sunshine duration. Spring maize typically has a growing season of approximately 120 days, with sowing generally occurring from early April to late May, and harvest from mid-September to late October across regions.
2.2. Data Sources
Data for daily precipitation, sunshine duration, and maximum and minimum temperatures were compiled for 23 meteorological stations from 1960 to 2019 after checking for data continuity, valid units, and impossible values. The 23 stations represent north–south gradients in elevation, thermal resources, precipitation, sunshine duration, and maize-planting environments across the province. The stations were grouped into northern, central, and southern Shanxi according to their administrative location and agro-ecological similarities. Eleven representative stations were then selected for DSSAT simulation according to three criteria: coverage of elevation and climatic gradients; representativeness of surrounding spring-maize production; and completeness of weather, soil, yield, and phenological data. The stations selected were Datong, Lingqiu, Shuozhou, and Wuzhai in northern Shanxi; Jiexiu, Taiyuan, and Xingxian in central Shanxi; and Anze, Xiangyuan, Yangcheng, and Yuncheng in southern Shanxi. Yield data for maize were obtained from agricultural meteorological stations (AMSs) and paired with simulations at the corresponding representative DSSAT stations. Phenological references included the 30 m annual maize phenology dataset for the three-leaf growth stage (V3) and maturity validation [44]; the ChinaCropPhen1km Maize-HE dataset (hereafter denoted as Maize-HE) for canopy-peak timing validation of the anthesis date (ADAT) [45,46]; and station-level heading/anthesis and maturity observations, where available. Remote-sensing phenology metrics were extracted from stable maize-area support around each station and restricted with maize -distribution information [47]. Station roles, selection logic, sowing-rule settings, and validation evidence levels are summarized in Tables S2–S4 and S8.
All meteorological records were screened for impossible values, date continuity, and unit consistency. Sunshine records logged in 0.1-h units were converted to hours. For DSSAT weather-file generation, sunshine duration was converted to daily solar radiation before writing weather data files in WTH format. Coefficients, scripts, and the files generated are supplied in Supplementary Dataset S1. This preprocessing step yielded the station-level daily weather inputs used for both long-term climate diagnosis and DSSAT scenario simulations.
2.3. ST Calendar and Hou Aggregation
The 24 STs divide the tropical year into 24 segments according to the apparent ecliptic longitude of the Sun at 15° intervals. Annual ST start dates were calculated from successive 15° boundaries for the apparent solar longitude, following the standard Chinese astronomical calendar, rather than by imposing fixed Gregorian dates. Each ST was further divided into three hou (5-day sub-ST windows) of approximately 4–6 days. Throughout the manuscript, H1, H2, and H3 refer to the first, second, and third hou of a given ST, respectively. This hou scale was close to a meteorological pentad but preserved the traditional calendar language used in agricultural communication (Figure 2).
For ST aggregation, annually varying ST dates rather than fixed Gregorian dates were used. Daily meteorological variables were assigned to their corresponding ST and hou, and were then summarized by station, region, year, and term. The aggregation logic, calendar implementation, and dataset-role mapping are given in Tables S1 and S10 and Supplementary MethodsSupplementary Methods S6.
2.4. CERES-Maize Setup, Baseline Management, and Cultivar Calibration
CERES-Maize v4.8 was used to simulate the growth, development, and yield of spring maize. Daily WTH files were generated for each DSSAT station using precipitation, maximum temperature, minimum temperature, and converted solar radiation data. Station soil inputs were derived from 250-m gridded particle-size and property data obtained from the Loess Plateau Sub-Center of the National Earth System Science Data Center. The source files, layer names, and extraction records are documented in Supplementary Dataset S1. Established pedotransfer relationships based on texture and organic matter were used to construct soil profiles, convert units from g kg−1 to percentages, and derive hydraulic parameters [48]. The resulting soil profiles and quality control checks are provided in the Supplementary Materials and Supplementary DatasetSupplementary Dataset S1.
The baseline sowing date was generated annually from the daily temperature rather than imposed as a fixed calendar date. For station s and year y, baseline sowing was assigned to the first day d when the cumulative effective thermal time exceeded a station-specific trigger:
where SDATbase is the baseline sowing date, Ss is the station-specific accumulation start date, Tbase,s is the station-specific base threshold, and TTs is the accumulated temperature trigger. The accumulation start date Ss was determined from local spring temperature regimes and station-specific agronomic feasibility, with all station-level values provided in Supplementary Dataset S1. This rule was used as a reproducible climate-responsive baseline. It provided a consistent reference for long-term simulations and scenario contrasts, while actual sowing-date checks were retained for sensitivity assessment.
Cultivar parameters were initialized from the Denghai 679 coefficient set retained in the study database and recalibrated for regional spring maize using 2000–2009 as the calibration period. The initial coefficient file and provenance records are provided in Supplementary Dataset S1. Therefore, the windows recommended are conditional on this cultivar–parameter setting. CERES-Maize requires six cultivar coefficients: P1, P2, P5, G2, G3, and PHINT, as defined in Table 1 [27]. A total of 50,000 generalized likelihood uncertainty estimation (GLUE) samples were generated for P1, P2, P5, G2, and G3 [49]. Candidate parameter sets were evaluated against yield and available phenological constraints, and the final parameter set was selected from the accepted posterior region by balancing yield error, phenological timing, and biological stage order. PHINT was assigned by station group as part of the regional parameterization. The station-group values and source records are documented in Supplementary Dataset S1.
2.5. Model Calibration and Statistical Metrics
The calibration period was 2000–2009, and the independent evaluation period was 2010–2019. After calibration, cultivar coefficients, station-specific soils, and management files were fixed. Evaluation was designed as a multisource evidence hierarchy because complete annual station-level observations for all maize stages were not available and remote-sensing metrics differ from DSSAT physiological stages. Yield data from AMSs were paired directly with simulated yields at the corresponding representative DSSAT station. Yield, V3, ADAT, and MDAT (physiological maturity date) observations were used as validation evidence. The Maize-HE dataset provided a canopy-peak timing reference for ADAT, while station maturity observations and the 30-m remote-sensing maturity product jointly supported MDAT validation. The validation evidence hierarchy and the corresponding numerical results for the performance metrics are detailed in Supplementary Tables S8 and S17, respectively.
For paired simulated (Si) and reference (Oi) values, deviations were defined as follows:
Model performance was evaluated using mean bias error (MBE), mean absolute error (MAE), root mean-square error (RMSE), relative RMSE (RRMSE), coefficient of determination (R2), percentage error (PE), Willmott’s index of agreement (d), hit rates within 10 days (HR10) or 15 days (HR15) for phenological dates, and trend-sign agreement (TSA) for maturity evaluation. The main equations for these metrics are as follows:
2.6. Analysis of Climate Trends and Phenology–Climate Correlation
Long-term changes in ST climate resources and DSSAT-simulated phenology were evaluated within the same Lichun-Dahan ST calendar used for climate aggregation. Climate variables included ST mean temperature, precipitation, and sunshine duration, whereas phenological variables included V3, ADAT, MDAT, and developmental intervals derived from these simulated stage dates. The Mann-Kendall test was used to detect monotonic trends, and the Theil-Sen estimator was used to quantify the magnitude of trends because of its robustness to interannual variability in agroclimatic series. Slopes were reported per decade for climate variables, phenological dates, and stage duration metrics.
Phenology–climate associations were assessed after removing station-specific linear trends from both simulated phenological series and ST climate series. Pearson’s correlation coefficients were calculated between the resulting phenological anomalies and temperature, precipitation, and sunshine-duration anomalies for all 24 STs across pooled station-years. False discovery rate (FDR) correction was applied to the complete test set for stage × climate variable × ST. Selected stage-relevant correlations from this full-calendar analysis are summarized in Table S13.
2.7. Simulation of Sowing Date Scenarios and Screening Framework for Hou Windows
Daily simulations for sowing date scenario were conducted for each DSSAT station and years from 2000 to 2019 using all candidate dates from Qingming to before Mangzhong. This bounded domain represents the management range evaluated in the study for spring maize. It was chosen because Qingming marks the beginning of agronomically plausible sowing for spring maize after cold constraints in early spring, whereas sowing after Mangzhong may leave insufficient time for complete grain filling during the 120–140-day crop season before the risk of low temperatures in Shanxi. Candidate dates after Mangzhong were not used; therefore, the southern recommendation was boundary-limited and represented the best-performing window within the time domain tested (Qingming to pre-Mangzhong). A bounded sowing domain was selected because recommendations for planting dates must be expressed within agronomically feasible crop calendars [50].
For the validation management files, irrigation and nitrogen followed station-specific month-day templates. For daily sowing scenarios, these operations were shifted relative to each candidate sowing date to preserve the post-sowing management sequence and avoid fertilizer or irrigation events occurring before planting in delayed scenarios. The event-lag table and the quality control report for management dates are provided in Table S9 and Supplementary MethodsSupplementary Methods S4.
Daily sowing results were converted into hou-level scenarios. For station s, year y, and sowing hou h, daily simulations for h were averaged as follows:
The independent evaluation decade 2010–2019 was used as the primary period for recommendations to avoid calibration–recommendation circularity. The full 2000–2019 period was retained as a robustness analysis. Regional mean yield, baseline yield, yield gain, and relative yield were calculated as:
Yield stability was evaluated using the station-level interannual coefficient of variation (CV) before regional aggregation, and low-yield risk was defined relative to the baseline low-yield threshold for each station:
Flowering-window exposure was defined as the proportion of station-years in which simulated ADAT occurred in the Xiaoshu–Dashu window. MBC was calculated using region-specific ST boundary markers: before Hanlu in northern Shanxi; before Shuangjiang in central Shanxi; and before Lidong in southern Shanxi. These boundaries corresponded to regionally differentiated late-season low-temperature constraints and were used to screen scenarios that exposed the crop to low-temperature damage before physiological maturity.
Candidate hou windows were selected using constrained Pareto screening rather than the single maximum-yielding date. A window was favored when it was on the operational yield plateau, did not increase yield CV or low-yield risk relative to the temperature-rule baseline, avoided greater flowering-window exposure where possible, and maintained acceptable MBC. The core hou was the best-performing point after applying these constraints; adjacent acceptable hou were merged into operational windows to avoid over-precise single-date recommendations:
When constraints conflicted, MBC was prioritized in northern Shanxi, whereas flowering-window relocation and late-maturity avoidance were prioritized in central and southern Shanxi, respectively. Later high-yield candidates were therefore rejected when they reduced MBC or materially increased flowering or maturity exposure. This procedure resulted in recommendations as agronomically usable ST hou windows rather than overprecise single dates.
3. Results
3.1.1. Intra‐Annual Distribution of ST Climate Resources
Results for the intra‐annual resource distribution revealed pronounced seasonal mismatches
among precipitation, temperature, and sunshine duration (Figure 3). Provincial precipitation was
minimal in the Daxue–Dongzhi winter interval (1.26–1.99 mm per ST) and increased sharply after
Mangzhong, reaching 62.16 mm in Dashu. The Xiazhi–Dashu interval contributed 31.8%–36.3% of
annual ST precipitation across the three regions, whereas the broader Mangzhong–Chushu interval
accounted for 54.0%–64.4%. Temperature peaked in Xiaoshu in all regions, reaching 20.29 °C in
northern, 23.07 °C in central, and 24.36 °C in southern Shanxi. Sunshine duration peaked earlier, in
Xiaoman, with 144.33, 136.72, and 128.96 h in northern, central, and southern Shanxi, respectively.
Thus, the maximum sunshine‐duration window preceded the precipitation maximum by
approximately two to three STs, and the mean temperature difference between northern and
southern Shanxi in Xiaoshu was 4.07 °C. This mismatch between peak sunshine duration and peak
precipitation created a key constraint for maize production, as reproductive growth stages must be
timed to balance sunshine duration, warmth, and water conditions
Across the complete Lichun–Dahan ST cycle, significant warming occurred in Shanxi during
1960–2019, while sunshine duration declined significantly and precipitation showed no significant
provincial trend (Supplementary Table S11). The warming signal was strongest in northern Shanxi
(+0.39 °C decade−1), followed by central (+0.32 °C decade−1) and southern Shanxi (+0.26 °C decade−1).
Precipitation exhibited large interannual variability and north–south divergence, with a slight
increase in northern Shanxi and decreases in central and southern Shanxi; however, these
precipitation trends were not statistically significant. Loss of sunshine duration was spatially
coherent across all three regions. Therefore, the long‐term background for management of spring
maize was not simply a warmer climate, but a combination of warming and declining sunshine
duration with unstable precipitation.
3.1.2. Long‐Term Trends in Annual Climate Resources
The Lichun–Dahan moving‐average trajectories in Figure 4 illustrate the magnitude of the
redistribution of climate resources over time. The provincial 7‐year moving‐average endpoint
increased from 8.42 #xB0;C in 1960 to 9.95 #xB0;C in 2019, which represents a +1.53 #xB0;C shift. The same endpoint
comparison showed almost no net precipitation change at the provincial scale (−0.41 mm), despite
large multiyear variability and a regional split: northern Shanxi gained 76.80 mm, whereas southern
Shanxi lost 76.27 mm. Sunshine duration consistently declined from 2672.14 to 2392.99 h at the
provincial scale (−279.14 h), with regional losses of −273.11, −278.22, and −285.68 h in northern, central, and southern Shanxi, respectively. The dominant historical signal was therefore coupling of warming
and a decline in sunshine duration rather than a simple increase in thermal resources.
3.1.3. ST‐Specific Trend Patterns
The ST trend heat maps were used to separate annual‐scale changes into stage‐relevant windows
(Figure 5). Significant warming was concentrated primarily in spring terms from Yushui to Qingming
and in winter terms from Xiaoxue to Dahan, with additional positive signals around Xiaoman–
Mangzhong in northern and central Shanxi. Precipitation changes were sparse with inconsistent
signs, in alignment the nonsignificant provincial trend. Sunshine duration declined across much of
the crop‐relevant calendar, especially from Mangzhong to Xiaoshu, around Bailu–Hanlu, and in
winter terms.
3.2. DSSAT CERES-Maize Validation and Suitability for Scenario Diagnosis
The accumulated-temperature sowing rule generated agronomically plausible baseline sowing dates and provided a reproducible climate-responsive management input. Using the eight stations with directly valid observed sowing dates, MAE was 7.88 days, RMSE was 9.32 days, and MBE was +7.88 days for the sowing rule. Because the temperature-rule baseline was later than the observed dates by 7.88 days on average, the sensitivity of the selected windows to observed-date and advanced-baseline alternatives was evaluated. The purpose of the baseline was to provide a consistent comparison rule for sowing scenarios; the recommendations were selected primarily from hou-level yield, stability, risk, and maturity-boundary performance.
For the independent evaluation decade, the calibrated model reproduced observed yields with acceptable error after conversion to a DSSAT dry-matter basis: R2 = 0.630, RMSE = 565.60 kg ha−1, RRMSE = 12.11%, MAE = 449.66 kg ha−1, MBE = +149.31 kg ha−1, PE = 3.68%, and Willmott’s d = 0.881. The fitted relationship in Figure 6 has moderate scatter around the 1:1 line; the positive mean bias represented only 3.68% of the reference yield. This agreement supports evaluation of the station-year yield, ranking of sowing scenarios, and identification of regional responses. The error metrics are consistent with previous DSSAT maize studies in northern China [33], and confirm the suitability of the model for station-level validation and comparison of regional scenarios.
For phenology, the strongest external evidence came from V3, as early vegetative timing is less confounded by harvest timing, senescence background, and mixed pixels than maturity. Against the 30 m V3 reference, the metrics for DSSAT-simulated V3 were RMSE = 8.73 days, MAE = 7.54 days, RRMSE = 5.95%, MBE = −6.74 days, and HR10 = 68.18% (Figure 7). The negative MBE (−6.74 days) indicated that the model placed V3 approximately 1 week earlier than the remote-sensing reference. Despite this mean offset, the low relative error, the proportion of simulated-reference pairs within 10 days, and the agreement index indicate acceptable agreement for V3 timing across the available station-year pairs. This agreement supports the use of simulated V3 for comparative analyses of phenological relocation across stations and sowing scenarios.
ADAT was evaluated using canopy-peak timing from the Maize-HE dataset and the station-mean ADAT observations. The MAE for agreement with Maize-HE was 10.1 days. Station-mean ADAT observations from seven stations showed moderate agreement with simulated station means (MBE = +3.29 days, MAE = 3.57 days, RMSE = 4.12 days, RRMSE = 2.04%, R2 = 0.639, and Willmott’s d = 0.763). Together, these results support the suitability of the model for anthesis timing for comparison of regional scenarios. Heat exposure during the anthesis period was evaluated as a model-based risk indicator.
Maturity timing was evaluated against station maturity observations and the 30-m maturity reference. The MAE for station observations was 6.33 days, and the maturity TSA reached 77.78% (Supplementary Table S17). Together, these results support the suitability of the model for maturity timing across the station and remote-sensing evidence available.
3.3. Long-Term Phenological Shifts and Stage-Specific Climate Associations at the ST Scale
All three DSSAT-simulated phenological dates advanced significantly during 1960–2019. Across the 11 simulation stations, V3 advanced by 1.53 days decade−1, ADAT by 1.88 days decade−1, and MDAT by 3.11 days decade−1 (Table 2). The maturity advance was strongest in central Shanxi, where MDAT advanced by 5.59 days decade−1. Analysis of stage duration showed that the ADAT–MDAT interval for grain-filling and maturity shortened significantly at the all-station scale, especially in central Shanxi. These results indicate that climate change affected both the calendar timing of maize stages and the duration of post-flowering development.
The corresponding annual trajectories are shown in Figure 8, and an interpretation of the endpoint shifts is provided in Supplementary ResultsSupplementary Results S1.
Detrended station-scale correlations identified stage-specific climate windows most closely aligned with phenological anomalies across the complete Lichun–Dahan ST calendar (Figure 9). Selected stage-relevant correlations from the full-calendar analysis are summarized in Table S13. V3 anomalies were associated with both early-season resource signals and broader seasonal thermal covariance, with the strongest full-calendar signals including Qingming and Chunfen sunshine, Chunfen precipitation, and Dashu temperature. ADAT and MDAT anomalies were still dominated by mid-season thermal controls, especially the Xiazhi-Xiaoshu-Dashu temperature; Dashu sunshine duration also contributed to maturity timing. Precipitation correlations were generally weaker and less coherent than the temperature and sunshine-duration signals. The full-calendar, stage-based layout therefore keeps the correlation metrics consistent with the Lichun–Dahan time axis used elsewhere in the manuscript, while retaining the distinction between early vegetative and reproductive-to-maturity controls. Physiologically, these associations indicate that early-season sunshine duration and temperature influence leaf appearance and vegetative development, whereas summer thermal conditions more strongly control reproductive timing and maturity.
3.4. ST Sowing-Window Optimization and Phenological Risk Relocation
The daily sowing-scenario dataset contained 13,751 DSSAT outputs for 11 stations from 2000 to 2019. Duplicate station-year-date keys were generated during quality control reruns of selected scenarios. After duplicates were resolved by retaining the later rerun, 13,618 unique simulations remained. Failed or zero-yield outcomes were retained for low-yield risk assessment because they represented agronomically relevant low-yield outcomes. Phenological date summaries were calculated only from records satisfying SDAT < V3 < ADAT < MDAT; records that failed this criterion were retained in the low-yield risk evaluation.
The regional response curves shown in Figure 10 reveal distinct optimum zones rather than one provincial sowing date. In northern Shanxi, yield reached a high plateau near late Guyu–early Lixia. The core Guyu-H3 scenario had a yield of 4,585.1 kg ha−1, and the operational Guyu-H2–H3 window was retained because it preserved the plateau while limiting maturity-boundary decline under later sowing. Central Shanxi had the clearest gain from delay: the core Xiaoman-H2 scenario had a low-yield risk of 0.033 and a mean yield of 5,918.2 kg ha−1, which was 911.8 kg ha−1 above the temperature-rule baseline; Xiaoman-H1–H2 was retained as the operational window. Southern Shanxi benefited from a later Xiaoman window: the core Xiaoman-H3 scenario yielded 5,236.7 kg ha−1 (+324.6 kg ha−1) and had MBC of 0.900; Xiaoman-H2–H3 was retained as the operational window. These comparisons show that the dominant constraint shifted from late-maturity risk in the north to yield-risk and heat/maturity balancing in central and southern Shanxi. The minimal yield gain in northern Shanxi reflects the dominant constraint of late-season low-temperature risk, which limited the scope for further delay of the sowing date.
Robustness diagnostics for the selected windows are summarized in Supplementary ResultsSupplementary Results S2 and Table S15, and the period-specific yield response is shown in Figure 11.
The yield response was produced via phenological relocation of V3, ADAT, and MDAT. Delayed sowing in northern Shanxi moved MDAT towards the Hanlu boundary, which explains why some later high-yield points were rejected. In central Shanxi, the yield and stability improvements under Xiaoman-H1–H2 were accompanied by an ADAT shift towards the Xiaoshu–Dashu exposure window, so screening for flowering risk was necessary. Southern Shanxi retained a wider maturity margin under the Lidong boundary, but late sowing still shifted flowering and maturity into warmer and later-season environments (Figure 12). Thus, the ST framework converted sowing-date optimization from a search for the highest mean yield to a stage placement across risk windows.
Post-hoc metrics for daily heat and low temperatures quantified the residual exposure within the selected windows (Supplementary Table S16). Northern Shanxi remained the least temperature-safe, central Shanxi had a stronger low-temperature buffer, and southern Shanxi had the largest maturity margin but the highest heat exposure around ADAT. These metrics justified retaining both MBC and flowering exposure in the screening procedure. In addition, a post-hoc comparison with traditional proverb–derived sowing benchmarks (Table S20) demonstrated yield and stability advantages of the optimized windows.
3.5. Spatial Distribution of Optimized Sowing Windows and Phenological Relocation
The regional recommendations in Section 3.4 were derived by aggregating station responses for northern, central, and southern Shanxi. To retain within-region heterogeneity, the same constrained hou-level screening procedure was applied independently to the 11 DSSAT simulation stations. Results for station-level selected windows are expressed as midpoint DOY values, interpolated using the Kriging method, and then classified into ST hou categories for spatial interpretation.
The optimized sowing windows showed a clear north-to-south delay across Shanxi Province (Figure 13). Earlier windows were concentrated in northern Shanxi, where limited thermal resources and stronger late-season maturity constraints restricted further delay in the sowing date. Later Xiaoman-centered windows extended through central and southern Shanxi, and indicate greater flexibility for delayed sowing under warmer and longer growing-season conditions. Station-level selection results and response curves are provided in Figures S2–S4 and Table S18.
For phenological mapping, simulated V3, ADAT, and MDAT dates under the current baseline sowing calendar were compared to those under the optimized sowing-window calendar. Station-level mean dates were interpolated as DOY values and then classified into corresponding ST hou categories.
Under the current baseline calendar, V3 was concentrated primarily between Lixia-H2 and Xiaoman-H1, with later occurrences confined to eastern and southeastern Shanxi (Figure 14a). Following optimization, V3 shifted predominantly to Xiaoman-H2–Mangzhong-H1, and locally to Mangzhong-H2 in southern and southeastern Shanxi (Figure 14b). By contrast, relatively earlier V3 classes persisted in northern and north-central Shanxi, and reflect the stronger maturity-safety constraints that limited sowing delays in cooler areas.
ADAT showed a stronger response to sowing-window optimization than V3 did. Under the current baseline calendar, anthesis occurred primarily during Xiaoshu and Dashu, with earlier classes in southwestern Shanxi and later patches in northwestern and southeastern areas (Figure 15a). Under optimized sowing, ADAT shifted predominantly towards late Dashu and Liqiu, with much of central, western, and southern Shanxi entering Liqiu-H1 or Liqiu-H2 categories (Figure 15b). This relocation moved flowering away from the earliest Xiaoshu classes and was consistent with the screening logic for flowering risk used in Section 3.4.
MDAT was also delayed after optimization, but the spatial maturity gradient was retained (Figure 16). Under the current baseline calendar, maturity showed a southwest-to-north transition, with maize in southern and southwestern Shanxi maturing primarily from Liqiu to Bailu, while maturity in northern and northwestern Shanxi extended into Qiufen, and into Hanlu locally (Figure 16a). Under optimized sowing, MDAT shifted broadly towards Qiufen, with later classes concentrated in northern, northwestern, and eastern Shanxi, and earlier maturity maintained in the southwest (Figure 16b). In northern Shanxi, the optimized maturity area was dominated by Qiufen categories, with only localized Hanlu-H1 patches and no broad extension into Hanlu-H2.
Overall, optimization of the sowing window resulted in spatially differentiated relocation for spring maize development. The main effects were a delay in V3, a shift of anthesis from early Xiaoshu towards late Dashu–Liqiu, and delayed maturity, primarily towards Qiufen, with earlier establishment and maturity safety retained in cooler northern areas.
4. Discussion
4.1. Changes in ST Climate Conditions and Spring Maize Phenology
At the interannual scale, the coupled warming–dimming pattern identified in this study agreed with conventional Gregorian-calendar analyses for Shanxi. Between 1958 and 2008, the annual mean, mean maximum, and mean minimum temperature increased by 0.306 °C decade−1, 0.337 °C decade−1, and 0.363 °C decade−1, respectively [51], which overlap with our results (0.26–0.39 °C decade−1). Annual sunshine duration declined by 65.40 h decade−1 from 1959 to 2008 [52], which is comparable to our estimated trend of −69.01 h decade−1 for 1960–2019. Although the slopes for these parameters are not directly equivalent because of differences in observational windows and statistical forms, our longer-term moving-average analysis provides a more robust confirmation of this persistent dimming trend.
At the intra-annual scale, previous monthly and seasonal analyses revealed the highest sunshine duration in May (261.18 h) and June (250.23 h) [52], while mean summer rainfall ranged from 230.87 to 458.38 mm among stations, compared to only 7.42–34.69 mm in winter [53]. The ST analysis resolved these broad seasonal summaries into crop-relevant 14–16-d intervals and revealed how the dominant climate signal changed along the maize growth cycle.
V3 timing was most closely related to Qingming and Chunfen sunshine and Chunfen precipitation, with early-season sunshine duration and moisture supply identified as the main climatic conditions associated with establishment and early leaf development. By contrast, ADAT and MDAT were most strongly related to Xiazhi–Xiaoshu–Dashu temperature, with Dashu sunshine duration further linked to maturity timing, which marks a transition towards the influence of summer temperatures and sunshine duration during reproductive development and grain filling. This stage sequence translates the redistribution of heat, water, and sunshine into biologically meaningful climate windows. By following annually varying astronomical boundaries, the ST framework preserves the seasonal transitions experienced by crops and thus provides a direct and physically meaningful basis for interpreting phenological shifts and informing adjustments for sowing dates.
The faster advance of maturity than anthesis and the shortening of the ADAT–MDAT interval indicate compression of post-flowering development under the simulations. This response is consistent with northern-China estimates that warming advanced maize anthesis by 0.2–5.5 d decade−1 and maturity by 0.6–11.1 d decade−1 [13]. Earlier attainment of the temperature rule that triggers sowing and faster thermal accumulation after sowing provide a model-consistent explanation for the simulated advance. The same northern-China study showed that longer-season cultivars delayed maturity by 4.9–12.2 days decade−1, and thereby partly offset warming-induced phenological compression [13]. In the present study, the ST framework identified region-specific sowing windows that improved the seasonal alignment of V3, anthesis, and maturity with favorable thermal and sunshine-duration conditions while maintaining yield stability and maturity safety across the contrasting agroecological regions in Shanxi.
4.2. Regional Sowing-Window Divergence and Recalibration of Traditional ST Cues
Traditional sowing cues in Shanxi were regionally differentiated. In northern Shanxi, the saying “Sow corn at grain rain” [54] associates sowing of spring maize with Guyu. Farmers in this cooler region also follow the guidance that “corn should not be planted later than the beginning of summer”, which reflects the strong late-season low-temperature constraints that limit sowing delays. In central Shanxi, the proverb “Sow maize at Qingming, cotton at Guyu, and complete millet sowing by Lixia” places maize sowing around Qingming [55]. The common saying “Around Qingming, sow melons and beans” [56,57], although literally referring to those crops, is also widely applied to maize, which further corroborates the Qingming-centered sowing tradition for maize in the area. In southern Shanxi, the phenological proverb “When peach trees flower and apricot petals fall, maize sowing is timely” links the sowing of spring maize to the flowering of fruit trees. This is corroborated by another local saying, “When willow leaves turn green, it is time to plant corn”, which also points to Qingming as the optimal sowing window for spring maize in the warmer southern region [58]. On the basis of these traditional agricultural proverbs, we summarized the traditional sowing windows for spring maize as Guyu-H1–H3 in northern Shanxi, Qingming-H3–Guyu-H1 in central Shanxi, and Qingming-H2–H3 in southern Shanxi.
The temperature-rule baseline generally placed sowing later than these traditional windows, particularly in central and southern Shanxi, which indicates divergence from inherited ST guidance. The operational sowing window recommendations differed clearly among regions: Guyu-H2–H3 for northern Shanxi, Xiaoman-H1–H2 for central Shanxi, and Xiaoman-H2–H3 for southern Shanxi. Relative to the climate-responsive baseline, the core hou selected for the operational sowing window for northern, central, and southern Shanxi increased mean yield by 13.2, 911.8, and 324.6 kg ha−1. The gain in northern Shanxi was modest (13.2 kg ha−1), but comparison of all results with the traditional cues (Table S20) reveals yield and stability advantages for the optimized windows that support their use as climate-responsive updates to regional ST sowing guidance.
The regional differentiation of these recommendations was broadly consistent with agronomic evidence from neighboring maize-growing areas, particularly the greater feasibility of delayed sowing under warmer conditions in the growing season. Fenhe Basin simulations identified May 15–25 as a favorable sowing period [33]. Loess Plateau analyses showed that suitability depended jointly on the pre-sowing temperature and soil water [41]. North China Plain experiments revealed yield increases of 2,157 and 1,137 kg ha−1 from April 24 to May 15 for Zhengdan 958 and Ludan 984, respectively [23]. However, the response in this study was not attributable to calendar delay alone. Constrained screening jointly considered yield, stability, low-yield risk, flowering exposure, and maturity safety, and the windows selected relocated V3 towards Xiaoman–Mangzhong, anthesis towards late Dashu–Liqiu, and maturity primarily towards Qiufen. This stage assignment was consistent with the high sensitivity of maize to extreme weather during flowering [12], including short-term extreme heat around flowering [18]. It also explained the regional divergence: northern Shanxi had limited scope for further sowing delays because maturity safety was already a binding constraint, whereas central and southern Shanxi could exploit later sowing windows while maintaining acceptable risks of delayed flowering and physiological maturity.
4.3. Multisource and Decade-Scale Validation for DSSAT-Based Scenario Analysis
DSSAT CERES-Maize is suitable for this type of analysis because it links daily weather, soil conditions, management operations, cultivar coefficients, phenological development, and yield formation within a process-based framework [27]. Previous DSSAT applications in northern China and the Loess Plateau have demonstrated the value of this model for analysis of irrigation, sowing dates, and regional maize simulations, but model evaluation has often depended primarily on limited agricultural/meteorological observations, sometimes with short or discontinuous records [33,59]. A methodological contribution of this study is the use of a continuous independent evaluation decade from 2010 to 2019, together with a multisource evidence hierarchy, to evaluate whether DSSAT outputs are suitable for comparison of regional scenarios.
The validation design matched each evidence source to the crop process it could most reliably constrain. Yield data observed at AMSs were used for direct station-level evaluation after conversion to the DSSAT dry-matter basis. The 30-m maize V3 dataset provided strong evidence for early vegetative timing and station-mean ADAT observations. The 30-m maize phenology dataset provided evidence for V3 timing. Maize-HE and station-mean ADAT observations jointly supported the evaluation of reproductive timing, whereas station maturity observations and the 30-m maturity reference provided evidence for MDAT timing [44,45,46,47]. Multiple performance metrics were used, including MBE, MAE, RMSE, RRMSE, R2, PE, Willmott’s d, phenological hit rates, and maturity TSA. These metrics were used to evaluate absolute errors, bias direction, relative errors, temporal agreement, and the ability to preserve regional and interannual ordering.
This strategy provided a decade-scale, multisource validation framework that combines observations at AMSs with remote-sensing phenology data as a reference. Its primary strength lies in reducing dependence on any single short-term observational dataset while allowing comprehensive evaluations of crop yield and successive phenological stages. In regional crop-model studies, for which complete annual observations across all phenological stages are rarely available, this approach provides a robust and reliable basis for ranking of sowing windows and identifying relocation opportunities to avoid phenological risk.
4.4. Limitations and Future Directions
Three limitations should be considered when interpreting the sowing window recommendations. First, DSSAT simulations were conducted for 11 representative AMSs. Although these stations captured the main north–south gradients in thermal resources, precipitation, sunshine duration, elevation, and production environments for spring maize across Shanxi, the station network is too sparse to support county- or field-level recommendations in a province characterized by complex basin, plateau, and mountainous terrains. Second, the optimization relied on a representative set of cultivar parameters calibrated for Denghai 679. While this design ensured consistency across sites and scenarios, it did not account for cultivar differences in maturity class, thermal-time requirement, grain-filling duration, or stress tolerance. Therefore, the optimal hou windows may not be directly applicable to early-, medium-, and late-maturing cultivars. Third, this study focused on historical and recent climate conditions and did not simulate future climate scenarios. Accordingly, the sowing windows recommended should be interpreted as current climate-adaptive guidance within the sowing period evaluated (Qingming to pre-Mangzhong) rather than as projections under future changes in temperature, solar radiation, or precipitation.
Future research should address these limitations by enhancing spatial resolution, expanding cultivar representation, and incorporating climate-change scenarios. Additional weather stations, gridded climate and soil datasets, elevation correction, and maize-area weighting should be incorporated to support more refined county- and field-scale recommendations. Multiple representative cultivars should be calibrated and compared to determine if ST hou recommendations should be differentiated according to cultivar maturity groups. Future simulations should also combine Coupled Model Intercomparison Project (CMIP)-based climate scenarios with cultivar replacement, irrigation adjustment, and optimization of the sowing date to test if the present Guyu- and Xiaoman-centered windows remain stable under future climate risks. Multisite field experiments across the suggested hou windows would further strengthen the translation from model-supported recommendations to operational agronomic guidance.
5. Conclusions
We developed a 24ST framework to diagnose climate-driven phenological shifts and optimize sowing windows for spring maize in Shanxi Province. Long-term observations from 23 meteorological stations showed that the agronomic significance of individual STs evolved over time. Across the province, temperatures increased significantly, sunshine duration declined consistently, and precipitation remained highly variable without a significant trend. At the ST scale, sunshine duration peaked around Xiaoman, temperature around Xiaoshu, and precipitation around Dashu; these results indicate seasonal redistribution of climatic resources throughout the crop growth cycle. The DSSAT CERES-Maize model successfully reproduced regional yield patterns and the timing of key phenological stages; the results demonstrate the suitability of this model for diagnosing phenological shifts and evaluating sowing-date scenarios. Simulations showed that the V3 stage, ADAT, and MDAT all advanced between 1960 and 2019, with the greatest compression of the post-flowering period occurring in central Shanxi. Under a sowing domain from Qingming to pre-Mangzhong, constrained hou-level screening identified distinct regional sowing windows: Guyu-H2–H3 for northern Shanxi, Xiaoman-H1–H2 for central Shanxi, and Xiaoman-H2–H3 for southern Shanxi. These windows achieved a balance among yield gain, yield stability, lower low-yield risk, flowering-window exposure, and compliance with maturity constraints. Spatial mapping revealed a north-to-south delay in the optimal sowing window, accompanied by corresponding shifts in the timing of V3, anthesis, and maturity.
Overall, the results demonstrate the potential for translating traditional ST knowledge into a quantitative, risk-adjusted, and region-specific decision framework for climate-adaptive production of spring maize. Future research should expand meteorological station density, include a wide range of cultivar maturity classes, and assess the robustness of the proposed sowing windows under future climate scenarios via multisite field experiments.
Supplementary Materials
The following supporting information is supplied with the manuscript: Supplementary Methods S1–S7; Supplementary Results S1–S4; Tables S1; Figures S1; and Supplementary Dataset S1. The data-only Supplementary Dataset S1 contains the released 11-station WTH inputs; SOL profiles; management-summary and cultivar files; station-specific baseline-sowing parameters and archived baseline dates; selected GLUE diagnostics and posterior summaries; yield and phenology validation tables; regional and station-level hou summaries; post-hoc heat/frost and management-date outputs and README records. The Supplementary Dataset S1 is deposited in Figshare and can be accessed at https://doi.org/10.6084/m9.figshare.33155015.
Author Contributions
Conceptualization, W.Z. and L.X.; methodology, W.Z., Y.C. and F.L.; software, W.Z.; validation, W.Z., Y.C. and M.Y.; formal analysis, W.Z.; investigation, W.Z., Y.C. and M.Y.; resources, F.L., L.L. and L.X.; data curation, W.Z. and Y.C.; writing—original draft preparation, W.Z.; writing—review and editing, Y.C., M.Y., F.L., L.L. and L.X.; visualization, W.Z. and M.Y.; supervision, F.L., L.L. and L.X.; project administration, L.X.; funding acquisition, F.L., L.L. and L.X. All authors have read and agreed to the published version of the manuscript.
Funding
This research was funded by the National Natural Science Foundation of China, grant number 42301047 and 52509035; the Fundamental Research Program of Shanxi Province, grant number 202303021211107; the Natural Science Basic Research Program of Shaanxi, grant number 2025JC-YBQN-714; the China Postdoctoral Science Foundation, grant number 2024M762627.
Data Availability Statement
The data-only Supplementary Dataset S1 is provided as a separate supplementary file with this submission. The full deposited data and reproducibility materials, including derived station-level inputs, DSSAT configuration files, compact simulation outputs, quality-control tables, curated analysis scripts, README files, and the full DSSAT simulation archive, are openly available on Figshare at https://doi.org/10.6084/m9.figshare.33155015. Third-party raw meteorological, soil, remote-sensing, and statistical source files are not available for cases in which the provider terms restrict redistribution; these data should be obtained from the original providers. The redistribution status and processing notes for all the data are documented in Supplementary Dataset S1.
Conflicts of Interest
The authors declare no conflicts of interest.
Acknowledgments
The authors gratefully acknowledge the providers of the meteorological, soil, crop-distribution, and remote-sensing phenology datasets used in this study.
References
- Qian, C.; Yan, Z.; Fu, C. Climatic changes in the Twenty-four Solar Terms during 1960–2008. Chin. Sci. Bull. 2012, 57, 276–286. [Google Scholar]
- Li, J.; Lu, Z.; Xu, C.; Zhang, W. Analysis of geographical origin of solar terms based on the STTMD method. Sci. Rep. 2024, 14, 22708. [Google Scholar] [PubMed]
- UNESCO. The Twenty-Four Solar Terms, knowledge in China of time and practices developed through observation of the Sun’s annual motion. Available online: https://ich.unesco.org/en/RL/the-twenty-four-solar-terms-knowledge-in-china-of-time-and-practices-developed-through-observation-of-the-suns-annual-motion-00647 (accessed on 6 June 2026).
- IPCC. Climate Change 2023: Synthesis Report. Contribution of Working Groups I, II and III to the Sixth Assessment Report of the Intergovernmental Panel on Climate Change; Lee, H., Romero, J., Eds.; IPCC: Geneva, Switzerland, 2023. [Google Scholar]
- Lobell, D.B.; Schlenker, W.; Costa-Roberts, J. Climate trends and global crop production since 1980. Science 2011, 333, 616–620. [Google Scholar] [CrossRef] [PubMed]
- Hatfield, J.L.; Boote, K.J.; Kimball, B.A.; Ziska, L.H.; Izaurralde, R.C.; Ort, D.; Thomson, A.M.; Wolfe, D. Climate impacts on agriculture: implications for crop production. Agron. J. 2011, 103, 351–370. [Google Scholar] [CrossRef]
- Challinor, A.J.; Watson, J.; Lobell, D.B.; Howden, S.M.; Smith, D.R.; Chhetri, N. A meta-analysis of crop yield under climate change and adaptation. Nat. Clim. Chang. 2014, 4, 287–291. [Google Scholar] [CrossRef]
- Zhang, N.; Qu, Y.; Song, Z.; Chen, Y.; Jiang, J. Responses and sensitivities of maize phenology to climate change from 1971 to 2020 in Henan Province, China. PLoS ONE 2022, 17, e0262289. [Google Scholar] [CrossRef] [PubMed]
- Zhao, J.; Guo, J.; Xu, Y.; Mu, J. Effects of climate change on cultivation patterns of spring maize and its climatic suitability in Northeast China. Agric. Ecosyst. Environ. 2015, 202, 178–187. [Google Scholar] [CrossRef]
- Tao, F.; Zhang, S.; Zhang, Z.; Rötter, R.P. Maize growing duration was prolonged across China in the past three decades under the combined effects of temperature, agronomic management, and cultivar shift. Glob. Chang. Biol. 2014, 20, 3686–3699. [Google Scholar] [CrossRef] [PubMed]
- Luo, Y.C.; Zhang, Z.; Zhang, L.L.; Zhang, J.; Tao, F.L. Weakened maize phenological response to climate warming in China over 1981–2018 due to cultivar shifts. Adv. Clim. Chang. Res. 2022, 13, 710–720. [Google Scholar] [CrossRef]
- Eitzinger, J.; Thaler, S.; Schmid, E.; Strauss, F.; Ferrise, R.; Moriondo, M.; Bindi, M.; Palosuo, T.; Rötter, R.; Kersebaum, K.C.; et al. Sensitivities of crop models to extreme weather conditions during flowering period demonstrated for maize and winter wheat in Austria. J. Agric. Sci. 2013, 151, 813–835. [Google Scholar]
- Xiao, D.; Zhao, Y.; Bai, H.; Hu, Y.; Cao, J. Impacts of climate warming and crop management on maize phenology in northern China. J. Arid Land 2019, 11, 892–903. [Google Scholar] [CrossRef]
- Liu, Y.; Qin, Y.; Ge, Q.; Dai, J.; Chen, Q. Responses and sensitivities of maize phenology to climate change from 1981 to 2009 in Henan Province, China. J. Geogr. Sci. 2017, 27, 1072–1084. [Google Scholar] [CrossRef]
- Liu, Y.; Qin, Y.; Ge, Q. Spatiotemporal differentiation of changes in maize phenology in China from 1981 to 2010. J. Geogr. Sci. 2019, 29, 351–362. [Google Scholar] [CrossRef]
- Lobell, D.B.; Field, C.B. Global scale climate-crop yield relationships and the impacts of recent warming. Environ. Res. Lett. 2007, 2, 014002. [Google Scholar] [CrossRef]
- Porter, J.R.; Semenov, M.A. Crop responses to climatic variation. Philos. Trans. R. Soc. B Biol. Sci. 2005, 360, 2021–2035. [Google Scholar] [CrossRef] [PubMed]
- Luo, N.; Mueller, N.; Zhang, Y.; Feng, P.; Huang, S.; Liu, D.L.; Yu, Y.; Wang, X.; Wang, P.; Meng, Q. Short-term extreme heat at flowering amplifies the impacts of climate change on maize production. Environ. Res. Lett. 2023, 18, 084021. [Google Scholar] [CrossRef]
- Ray, D.K.; Gerber, J.S.; MacDonald, G.K.; West, P.C. Climate variation explains a third of global crop yield variability. Nat. Commun. 2015, 6, 5989. [Google Scholar] [CrossRef] [PubMed]
- Iizumi, T.; Ramankutty, N. Changes in yield variability of major crops for 1981–2010 explained by climate change. Environ. Res. Lett. 2016, 11, 034003. [Google Scholar] [CrossRef]
- Tigchelaar, M.; Battisti, D.S.; Naylor, R.L.; Ray, D.K. Future warming increases probability of globally synchronized maize production shocks. Proc. Natl. Acad. Sci. USA 2018, 115, 6644–6649. [Google Scholar] [CrossRef] [PubMed]
- Lv, Z.; Li, F.; Lu, G. Adjusting sowing date and cultivar shift improve maize adaption to climate change in China. Mitig. Adapt. Strateg. Glob. Chang. 2020, 25, 87–106. [Google Scholar]
- Liu, M.; Tao, H.B.; Wang, P.; Yi, Z.X.; Lu, L.Q.; Wang, Y. Effect of sowing date on growth and yield of spring-maize. Chin. J. Eco-Agric. 2009, 17, 18–23. [Google Scholar] [CrossRef]
- Xiao, D.; Bai, H.; Liu, D.L.; Tang, J.; Wang, B.; Shen, Y.; Cao, J.; Feng, P. Projecting future changes in extreme climate for maize production in the North China Plain and the role of adjusting the sowing date. Mitig. Adapt. Strateg. Glob. Chang. 2022, 27, 21. [Google Scholar] [CrossRef]
- Sheng, M.; Zhu, A.-X.; Rossiter, D.G.; Liu, J. How Much Are Planting Dates for Maize Affected by the Climate Trend? Lessons for Scenario Analysis Using Land Surface Models. Agronomy 2019, 9, 316. [Google Scholar] [CrossRef]
- Huang, M.; Wang, J.; Wang, B.; Liu, D.L.; Yu, Q.; He, D.; Wang, N.; Pan, X. Optimizing sowing window and cultivar choice can boost China’s maize yield under 1.5 °C and 2 °C global warming. Environ. Res. Lett. 2020, 15, 024015. [Google Scholar] [CrossRef]
- Jones, J.W.; Hoogenboom, G.; Porter, C.H.; Boote, K.J.; Batchelor, W.D.; Hunt, L.A.; Wilkens, P.W.; Singh, U.; Gijsman, A.J.; Ritchie, J.T. The DSSAT cropping system model. Eur. J. Agron. 2003, 18, 235–265. [Google Scholar] [CrossRef]
- Holzworth, D.P.; Huth, N.I.; deVoil, P.G.; Zurcher, E.J.; Herrmann, N.I.; McLean, G.; Chenu, K.; van Oosterom, E.J.; Snow, V.; Murphy, C.; et al. APSIM: evolution towards a new generation of agricultural systems simulation. Environ. Model. Softw. 2014, 62, 327–350. [Google Scholar] [CrossRef]
- de Wit, A.; Boogaard, H.; Fumagalli, D.; Janssen, S.; Knapen, R.; van Kraalingen, D.; Supit, I.; van der Wijngaart, R.; van Diepen, K. 25 years of the WOFOST cropping systems model. Agric. Syst. 2019, 168, 154–167. [Google Scholar] [CrossRef]
- DSSAT Foundation. Minimum Data. Available online: https://dssat.net/data/minimum-data/ (accessed on 6 June 2026).
- van Ittersum, M.K.; Cassman, K.G.; Grassini, P.; Wolf, J.; Tittonell, P.; Hochman, Z. Yield gap analysis with local to global relevance: a review. Field Crops Res. 2013, 143, 4–17. [Google Scholar] [CrossRef]
- Grassini, P.; van Bussel, L.G.J.; Van Wart, J.; Wolf, J.; Claessens, L.; Yang, H.; Boogaard, H.; de Groot, H.; van Ittersum, M.K.; Cassman, K.G. How good is good enough? Data requirements for reliable crop yield simulations and yield-gap analysis. Field Crops Res. 2015, 177, 49–63. [Google Scholar] [CrossRef]
- Rugira, P.; Ma, J.; Zheng, L.; Wu, C.; Liu, E. Application of DSSAT CERES-Maize to identify the optimum irrigation management and sowing dates on improving maize yield in northern China. Agronomy 2021, 11, 674. [Google Scholar] [CrossRef]
- DeJonge, K.C.; Ascough, J.C.; Andales, A.A.; Hansen, N.C.; Garcia, L.A.; Arabi, M. Improving evapotranspiration simulations in the CERES-Maize model under limited irrigation. Agric. Water Manag. 2012, 115, 92–103. [Google Scholar] [CrossRef]
- Bassu, S.; Brisson, N.; Durand, J.L.; Boote, K.; Lizaso, J.; Jones, J.W.; Rosenzweig, C.; Ruane, A.C.; Adam, M.; Baron, C.; et al. How do various maize crop models vary in their responses to climate change factors? Glob. Chang. Biol. 2014, 20, 2301–2320. [Google Scholar] [CrossRef] [PubMed]
- Asseng, S.; Ewert, F.; Rosenzweig, C.; Jones, J.W.; Hatfield, J.L.; Ruane, A.C.; Boote, K.J.; Thorburn, P.J.; Rötter, R.P.; Cammarano, D.; et al. Uncertainty in simulating wheat yields under climate change. Nat. Clim. Chang. 2013, 3, 827–832. [Google Scholar] [CrossRef]
- Rosenzweig, C.; Elliott, J.; Deryng, D.; Ruane, A.C.; Müller, C.; Arneth, A.; Boote, K.J.; Folberth, C.; Glotter, M.; Khabarov, N.; et al. Assessing agricultural risks of climate change in the 21st century in a global gridded crop model intercomparison. Proc. Natl. Acad. Sci. USA 2014, 111, 3268–3273. [Google Scholar] [CrossRef] [PubMed]
- White, J.W.; Hoogenboom, G.; Kimball, B.A.; Wall, G.W. Methodologies for simulating impacts of climate change on crop production. Field Crops Res. 2011, 124, 357–368. [Google Scholar] [CrossRef]
- Li, W.; Liu, W.; Huang, Y.; Xiao, W.; Xu, L.; Pan, K.; Fu, G.; Chen, X.; Li, C. Modeling the effects of sowing dates on maize in different environments in the tropical area of Southwest China using DSSAT. Agronomy 2024, 14, 2819. [Google Scholar] [CrossRef]
- Wu, W.; Yue, W.; Bi, J.; Zhang, L.; Xu, D.; Peng, C.; Chen, X.; Wang, S. Influence of climatic variables on maize grain yield and its components by adjusting the sowing date. Front. Plant Sci. 2024, 15, 1411009. [Google Scholar] [CrossRef] [PubMed]
- Shen, H.; Xu, Y.; Wang, Y.; Cheng, G.; Li, S.; Jiang, K.; Ma, X. Optimization of sowing date for spring maize in China’s Loess Plateau based on presowing temperature and soil water content. J. Sci. Food Agric. 2023, 103, 3157–3167. [Google Scholar] [CrossRef] [PubMed]
- Zhang, C.; Gao, J.; Liu, L.; Wu, S. Simulating the effects of optimizing sowing date and variety shift on maize production at finer scale in Northeast China under future climate. J. Sci. Food Agric. 2024, 104, 3637–3647. [Google Scholar] [CrossRef] [PubMed]
- Zhu, G.; Liu, Z.; Qiao, S.; Zhang, Z.; Huang, Q.; Su, Z.; Yang, X. How could observed sowing dates contribute to maize potential yield under climate change in Northeast China based on APSIM model. Eur. J. Agron. 2022, 136, 126511. [Google Scholar] [CrossRef]
- Niu, Q.; Li, X.; Huang, J.; Huang, H.; Huang, X.; Su, W.; Yuan, W. A 30 m annual maize phenology dataset from 1985 to 2020 in China. Earth Syst. Sci. Data 2022, 14, 2851–2864. [Google Scholar] [CrossRef]
- Luo, Y.; Zhang, Z.; Chen, Y.; Li, Z.; Tao, F. ChinaCropPhen1km: a high-resolution crop phenological dataset for three staple crops in China during 2000–2015 based on leaf area index products. Earth Syst. Sci. Data 2020, 12, 197–214. [Google Scholar] [CrossRef]
- Luo, Y.; Zhang, Z.; Chen, Y.; Li, Z.; Tao, F. ChinaCropPhen1km: a high-resolution crop phenological dataset for three staple crops in China during 2000–2019 based on LAI products. Figshare 2021. [Google Scholar] [CrossRef]
- Peng, Q.; Shen, R.; Li, X.; Ye, T.; Dong, J.; Fu, Y.; Yuan, W. A twenty-year dataset of high-resolution maize distribution in China. Sci. Data 2023, 10, 658. [Google Scholar] [CrossRef] [PubMed]
- Saxton, K.E.; Rawls, W.J. Soil water characteristic estimates by texture and organic matter for hydrologic solutions. Soil Sci. Soc. Am. J. 2006, 70, 1569–1578. [Google Scholar] [CrossRef]
- He, J.; Jones, J.W.; Graham, W.D.; Dukes, M.D. Influence of likelihood function choice for estimating crop model parameters using the generalized likelihood uncertainty estimation method. Agric. Syst. 2010, 103, 256–264. [Google Scholar] [CrossRef]
- Li, J.; Jin, F.; Zhang, D.; Liang, G.; Zhang, X. Effects of Sowing Dates on Growth Stage and Yield of Maize Varieties with Different Maturity Periods. J. Agric. (In Chinese). [CrossRef 2016, 6, 1–7. [Google Scholar]
- Miao, A.; Wu, J.; Jia, L. Spatio-temporal characteristics and trends of air temperature in Shanxi during 1958–2008. Adv. Earth Sci. (In Chinese). [CrossRef 2010, 25, 264–272. [Google Scholar]
- Fan, X.; Hao, Z.; Wang, M. Spatiotemporal characteristics of sunshine duration in Shanxi Province during 1959–2008. Ecol. Environ. Sci. (In Chinese) 2010, 19, 605–609. [Google Scholar]
- Gao, F.; Wang, Y.; Chen, X.; Yang, W. Trend analysis of rainfall time series in Shanxi Province, northern China (1957–2019). Water 2020, 12, 2335. [Google Scholar] [CrossRef]
- Li, J.Y. Jieling: “Tianren Heyi” de Weida Faming—Wo Xie Ershisi Jieqi [Solar Terms: The Great Invention of the Unity of Heaven and Humanity—Writing the Twenty-Four Solar Terms]. China Writers Network. 23 December 2024. Available online: https://www.chinawriter.com.cn/n1/2024/1223/c419926-40387815.html (accessed on 18 July 2026).
- Zhu, K.; Wan, M. Phenology. In Complete Works of Zhu Kezhen; (In Chinese). Shanghai Scientific & Technical Education Publishing House: Shanghai, China, 2004; Volume 4, p. 192. [Google Scholar]
- Qian, J.X.; Li, F.; Xi, Y.X. Characteristics of changes of meteorological factors affecting corn sowing in Shanxi Province. Chin. J. Agrometeorol. (In Chinese) 2007, 28, 246–249. [Google Scholar]
- China Agricultural Museum. Guyu [Grain Rain]. China Agricultural Museum. 7 November 2017. Available online: https://jgs.agri.gov.cn/detail/zh/158.html (accessed on 18 July 2026).
- Li, X.F. Jieqi Buguoqi [Solar Terms Remain Relevant]. People’s Dly. Overseas Ed. 2020, 11. Available online: https://paper.people.com.cn/rmrbhwb/html/2020-11/30/content_2020699.htm (accessed on 12 July 2026).
- Zou, L.; Feng, H. Applicability evaluation of DSSAT-CERES model on production of spring maize in Hill and Gully Area of the Loess Plateau. J. Plant Nutr. Fertil. (In Chinese) 2014, 20, 1413–1420. [Google Scholar]
Figure 1.
Location of Shanxi Province, maize-growing areas, and meteorological stations used in this study.
Figure 1.
Location of Shanxi Province, maize-growing areas, and meteorological stations used in this study.
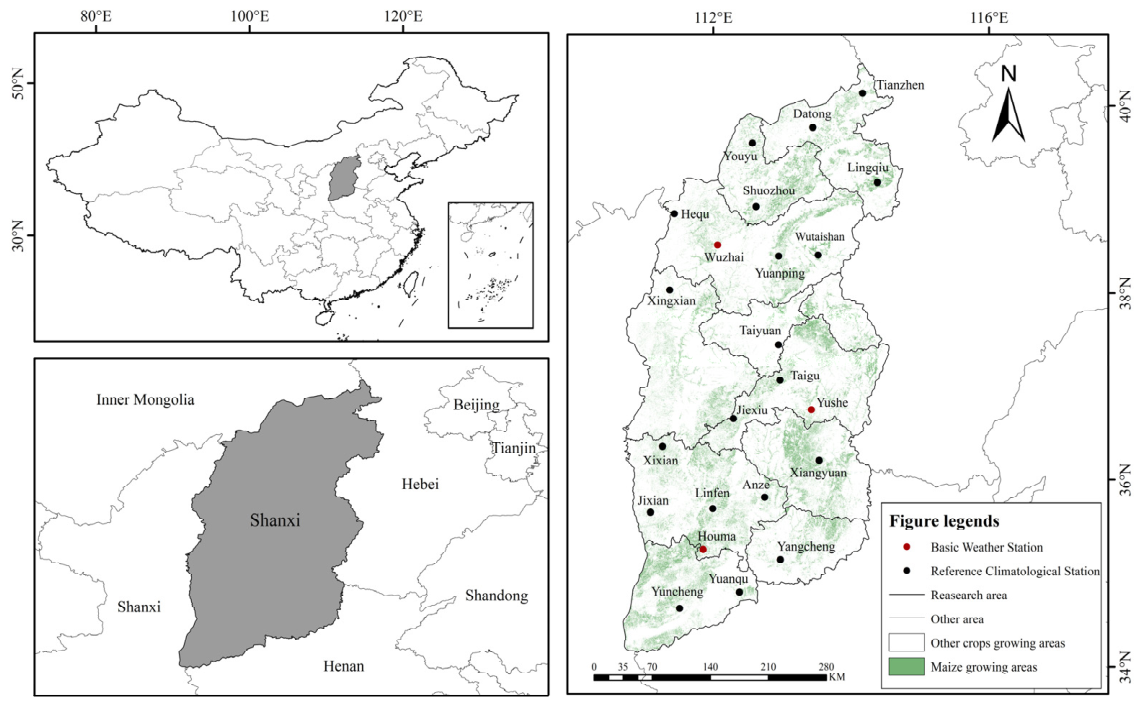
Figure 2.
Schematic representation of the 24 STs and the hou subdivisions used in this study. (a) Division of the tropical year into 24 STs at 15° intervals of apparent solar longitude (λ). (b) Subdivision of each ST into three hou, and the 12-hou sowing domain from Qingming-H1 to Xiaoman-H3 evaluated in the study. d, days.
Figure 2.
Schematic representation of the 24 STs and the hou subdivisions used in this study. (a) Division of the tropical year into 24 STs at 15° intervals of apparent solar longitude (λ). (b) Subdivision of each ST into three hou, and the 12-hou sowing domain from Qingming-H1 to Xiaoman-H3 evaluated in the study. d, days.
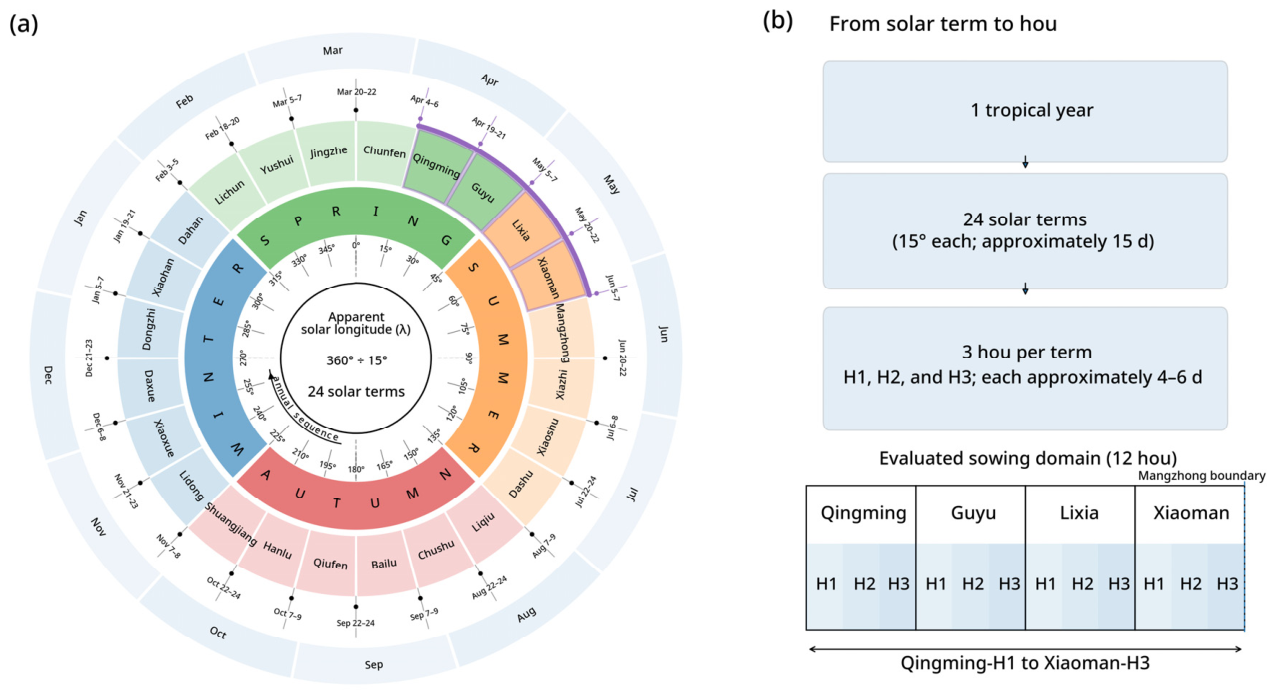
Figure 3.
Intra‐annual distribution of precipitation, temperature, and sunshine duration by ST and agroecological region.
Figure 3.
Intra‐annual distribution of precipitation, temperature, and sunshine duration by ST and agroecological region.
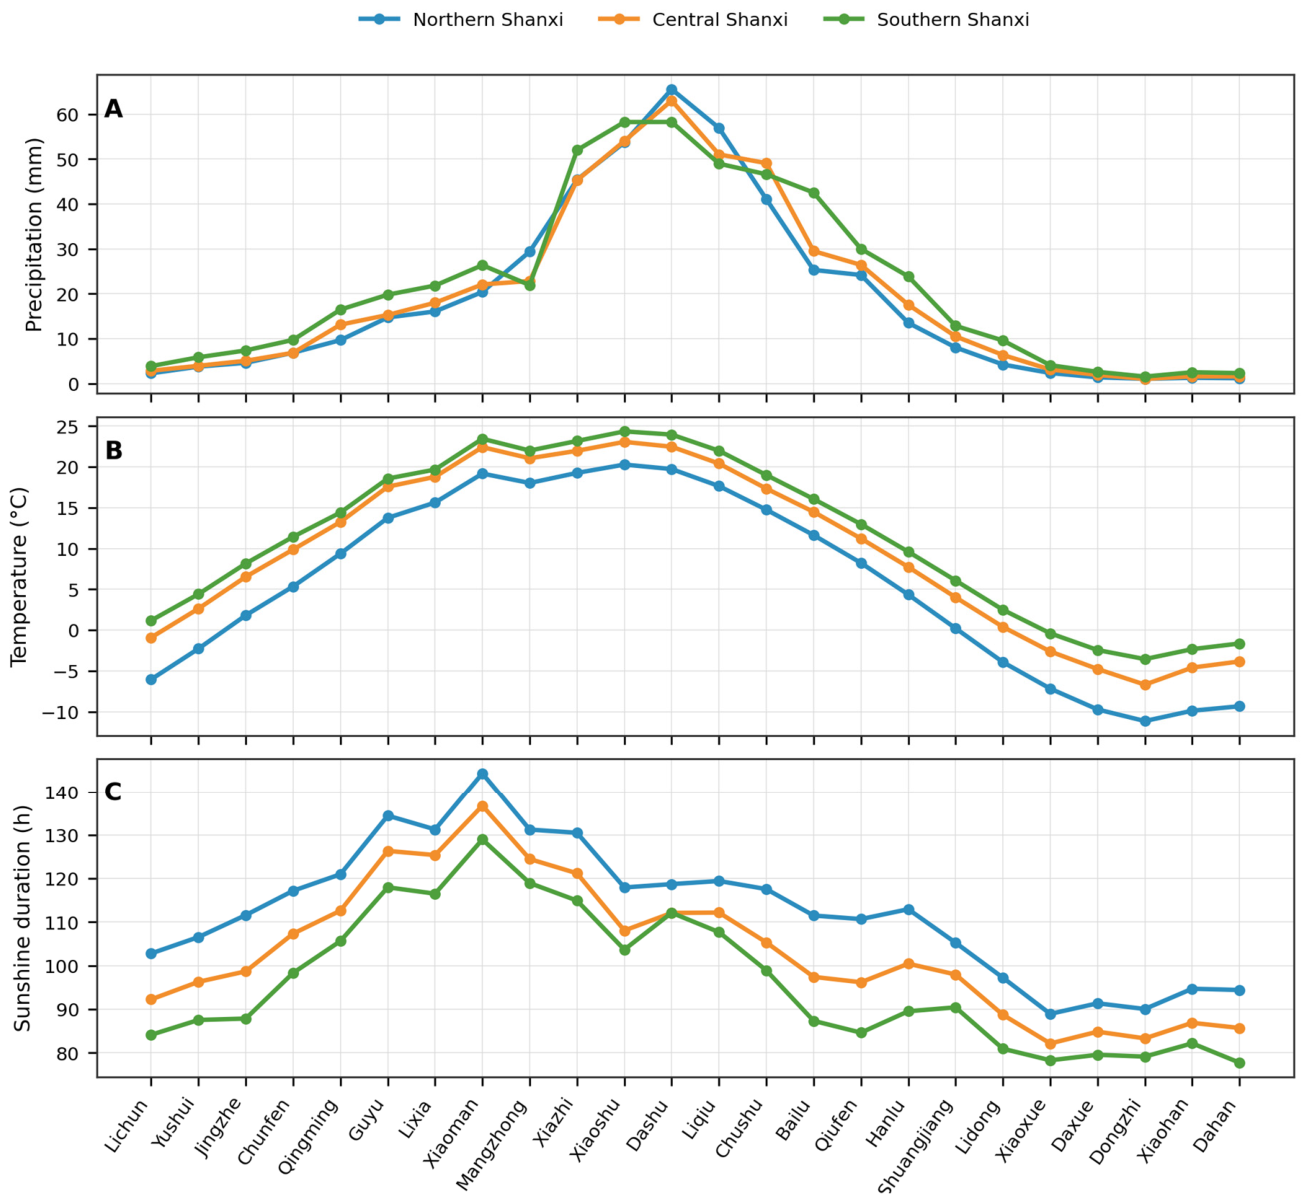
Figure 4.
Lichun–Dahan climate resource trends across northern, central, and southern Shanxi (1960–2019). Thin lines denote annual values and thick lines denote 7‐year moving averages.
Figure 4.
Lichun–Dahan climate resource trends across northern, central, and southern Shanxi (1960–2019). Thin lines denote annual values and thick lines denote 7‐year moving averages.
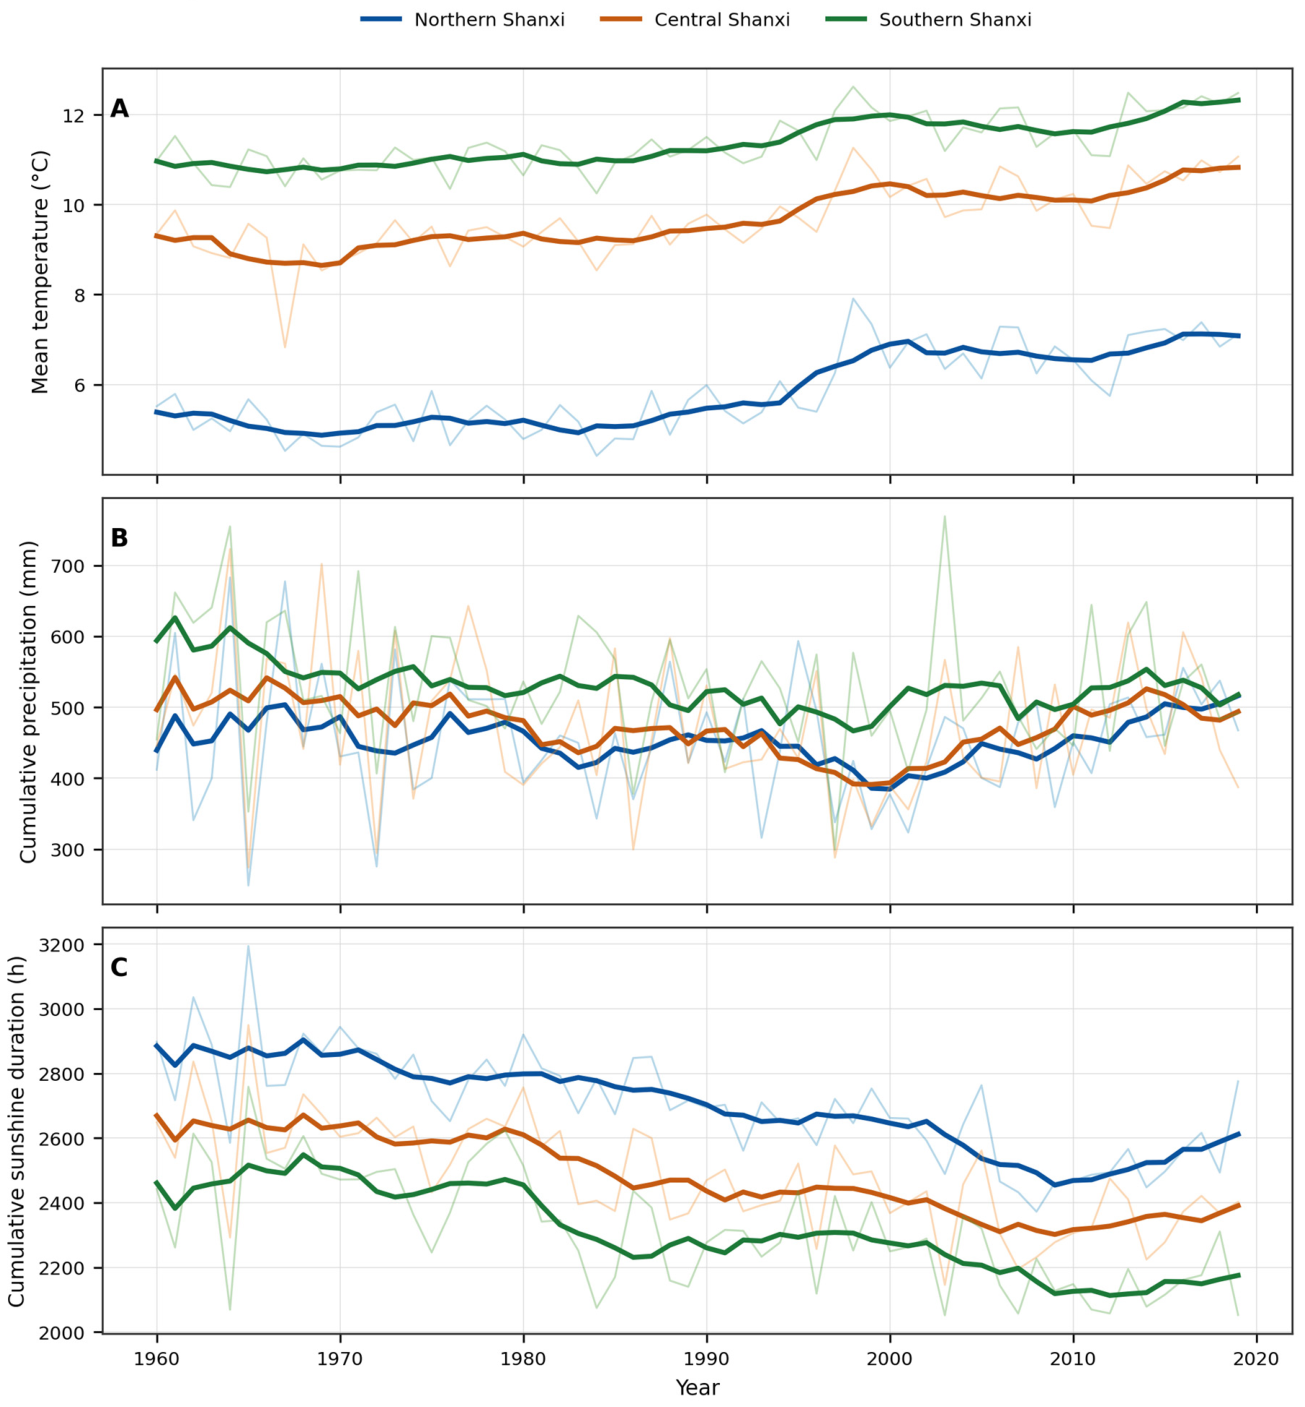
Figure 5.
ST climate resource trends (1960–2019): (a) temperature, (b) precipitation, and (c) sunshine duration. Asterisks indicate Mann–Kendall p < 0.5.
Figure 5.
ST climate resource trends (1960–2019): (a) temperature, (b) precipitation, and (c) sunshine duration. Asterisks indicate Mann–Kendall p < 0.5.
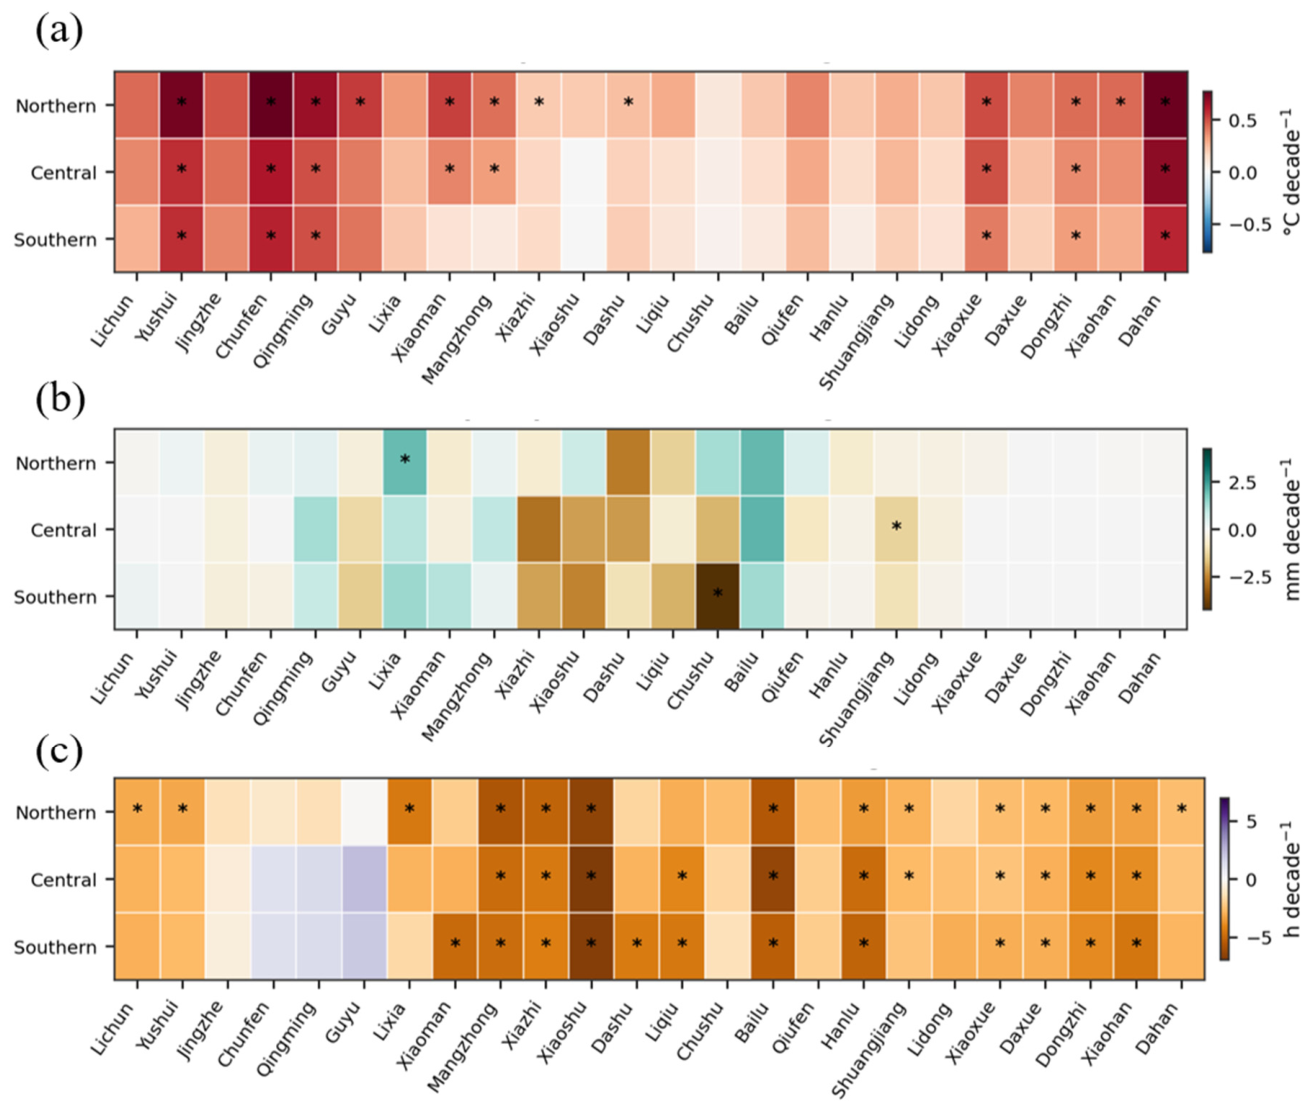
Figure 6.
DSSAT maize yield validation against yield data observed at AMSs after conversion to the DSSAT drymatter basis.
Figure 6.
DSSAT maize yield validation against yield data observed at AMSs after conversion to the DSSAT drymatter basis.
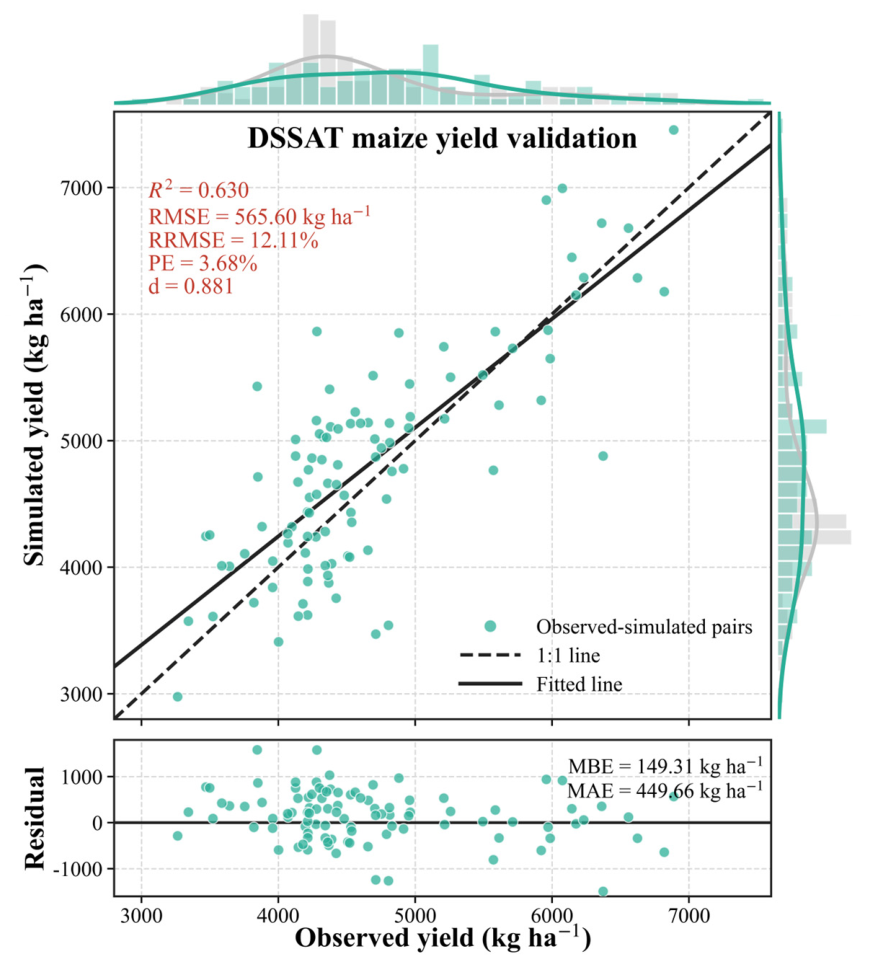
Figure 7.
DSSAT V3 validation against the 30-m V3 reference for spring maize.
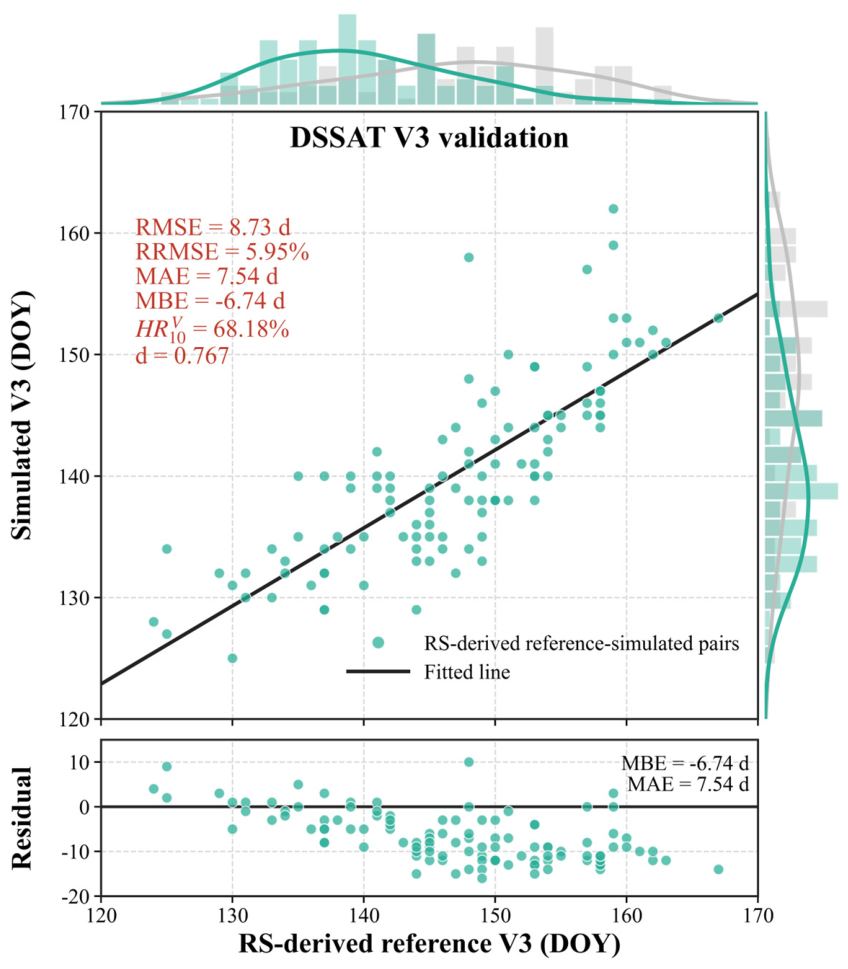
Figure 8.
DSSAT-simulated V3, ADAT, and MDAT dates during 1960–2019. Thin lines are annual means and thick lines are 7-year moving averages.
Figure 8.
DSSAT-simulated V3, ADAT, and MDAT dates during 1960–2019. Thin lines are annual means and thick lines are 7-year moving averages.
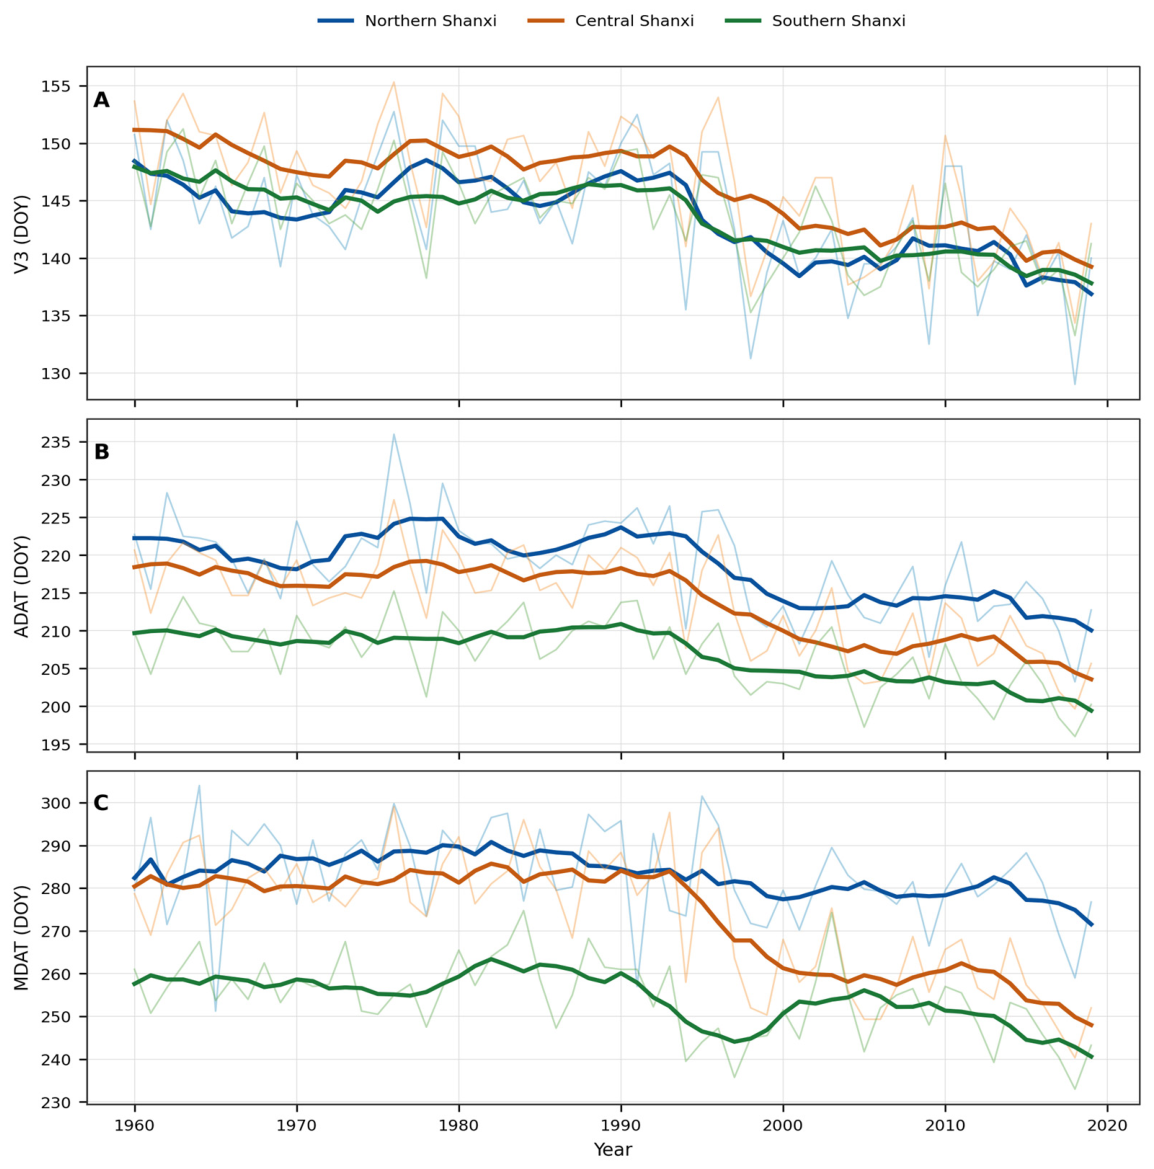
Figure 9.
Stage-specific detrended anomaly correlations between simulated phenological dates and ST climate variables across the complete Lichun–Dahan ST calendar: (a) V3, (b) ADAT, and (c) MDAT. Rows in each panel represent temperature, precipitation, and sunshine duration. Asterisks indicate FDR q < 0.05.
Figure 9.
Stage-specific detrended anomaly correlations between simulated phenological dates and ST climate variables across the complete Lichun–Dahan ST calendar: (a) V3, (b) ADAT, and (c) MDAT. Rows in each panel represent temperature, precipitation, and sunshine duration. Asterisks indicate FDR q < 0.05.
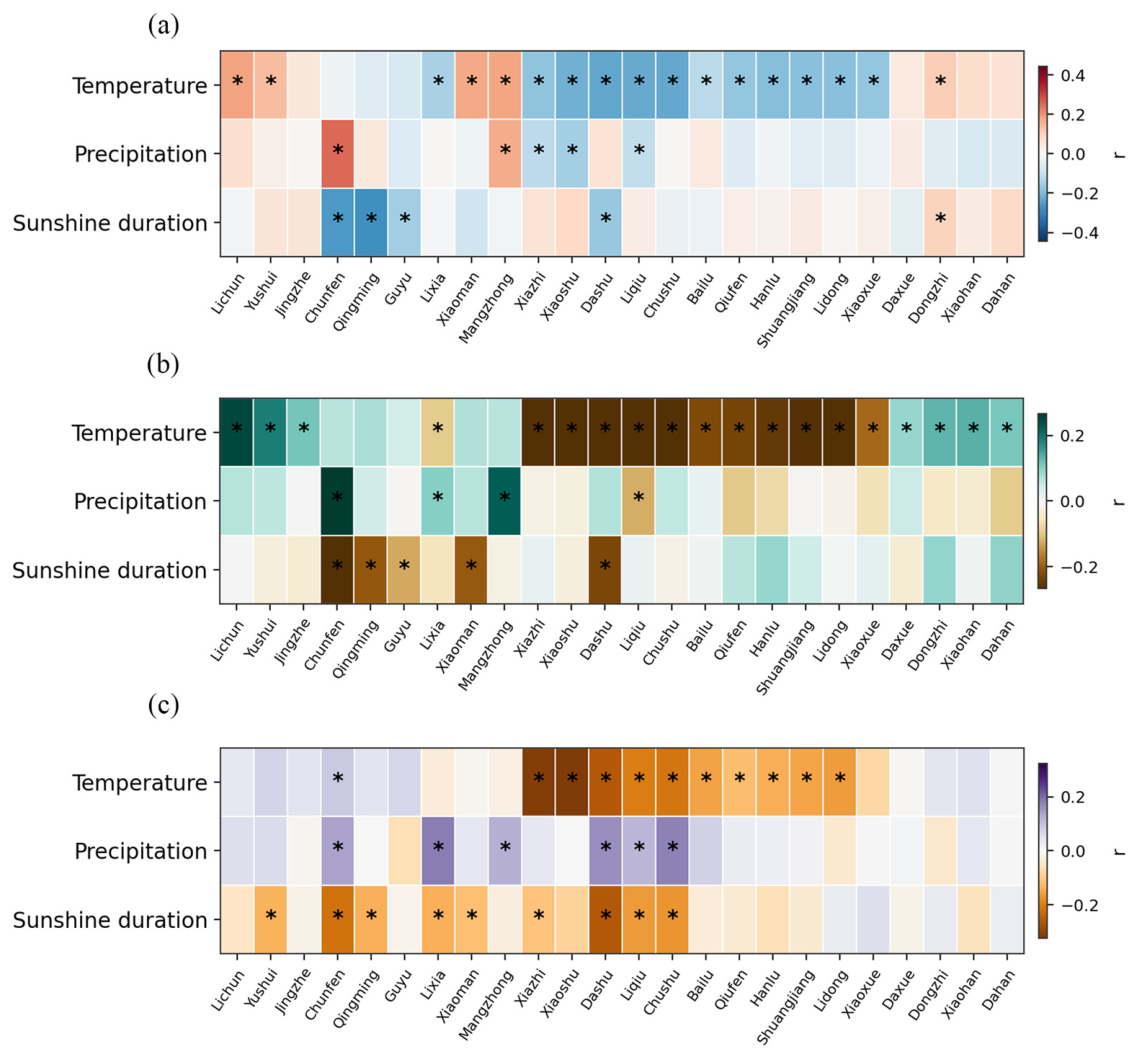
Figure 10.
Yield, stability, low-yield risk, flowering-window exposure, and MBC responses to hou-level sowing dates (2010–2019). Shaded areas denote recommended operational hou windows. Flowering-window exposure and MBC are for diagnostic screening proxies for the ST model. For Figure 10, Figure 11 and Figure 12, QH1 denotes Qingming H1 (the first hou, or five-day period, of Qingming) and is equivalent to QM H1 in the text and Table S10; correspondingly, GH1, LH1, and XH1 denote Guyu H1, Lixia H1, and Xiaoman H1 and are equivalent to GY H1, LX H1, and XM H1, respectively. The same correspondence applies to H2 and H3.
Figure 10.
Yield, stability, low-yield risk, flowering-window exposure, and MBC responses to hou-level sowing dates (2010–2019). Shaded areas denote recommended operational hou windows. Flowering-window exposure and MBC are for diagnostic screening proxies for the ST model. For Figure 10, Figure 11 and Figure 12, QH1 denotes Qingming H1 (the first hou, or five-day period, of Qingming) and is equivalent to QM H1 in the text and Table S10; correspondingly, GH1, LH1, and XH1 denote Guyu H1, Lixia H1, and Xiaoman H1 and are equivalent to GY H1, LX H1, and XM H1, respectively. The same correspondence applies to H2 and H3.
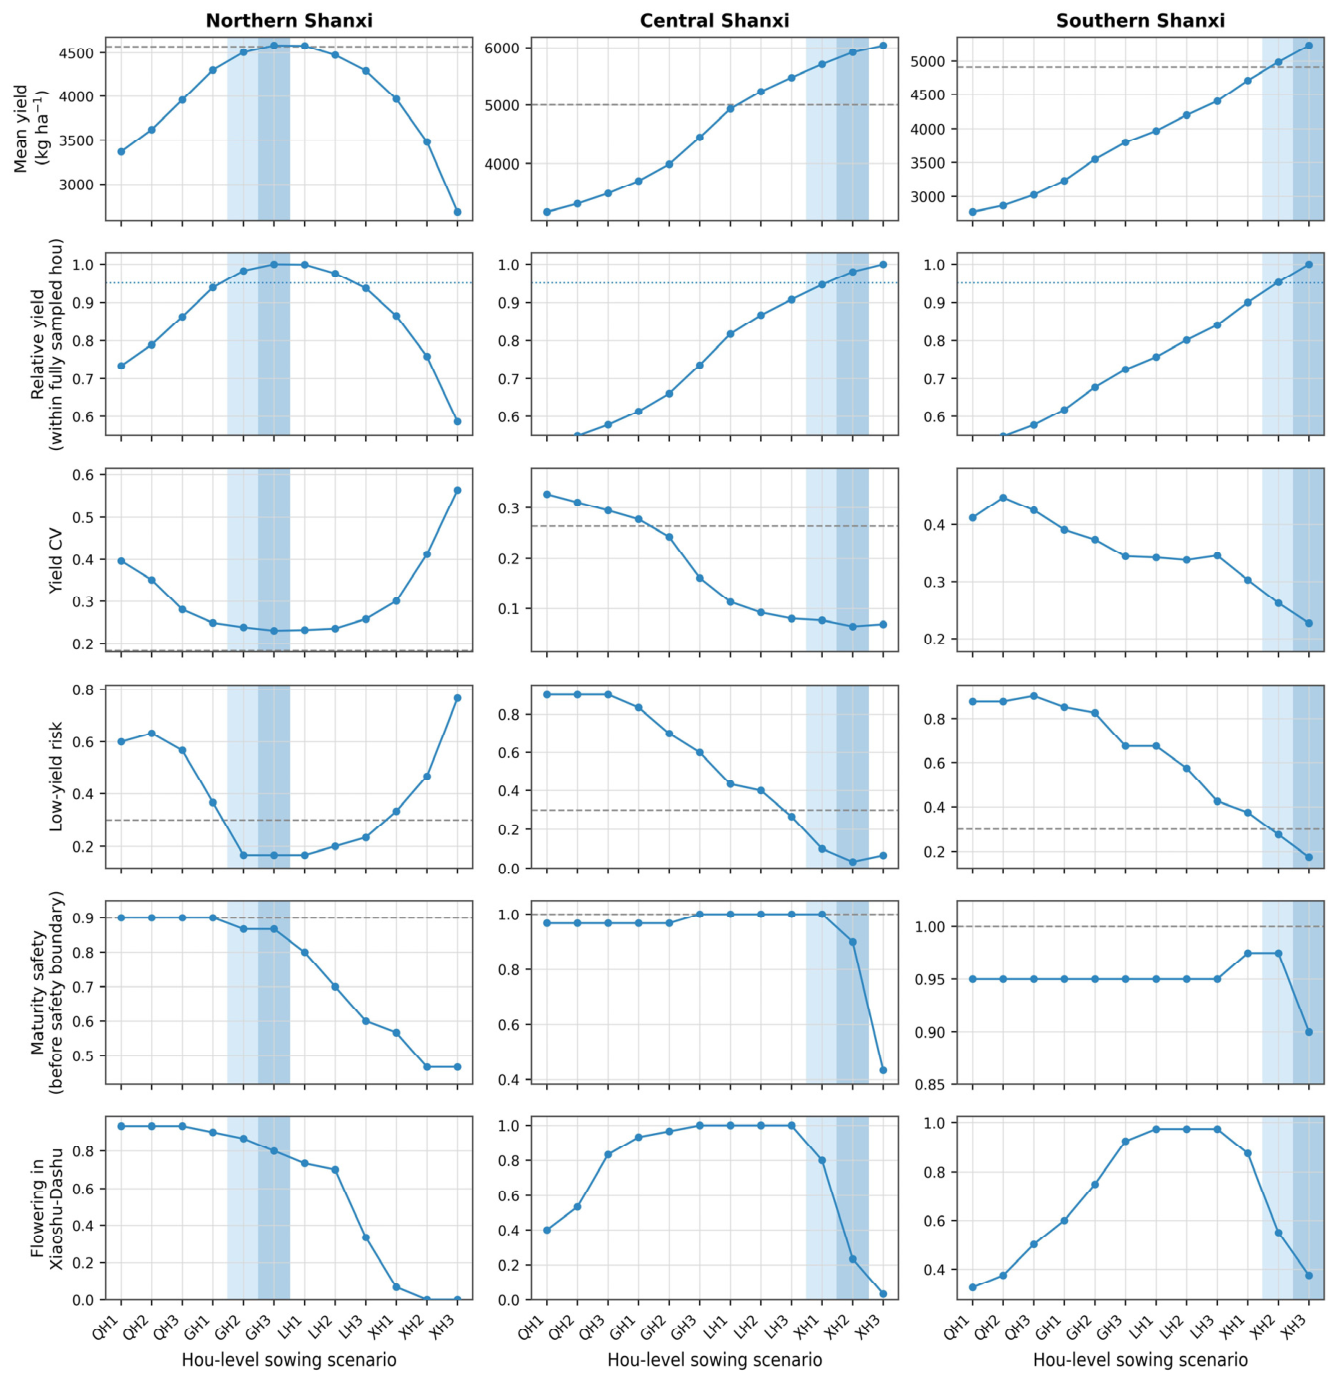
Figure 11.
Yield response to hou-level sowing scenarios during the calibration decade (2000–2009), the independent evaluation decade (2010–2019), and the combined period (2000–2019).
Figure 11.
Yield response to hou-level sowing scenarios during the calibration decade (2000–2009), the independent evaluation decade (2010–2019), and the combined period (2000–2019).
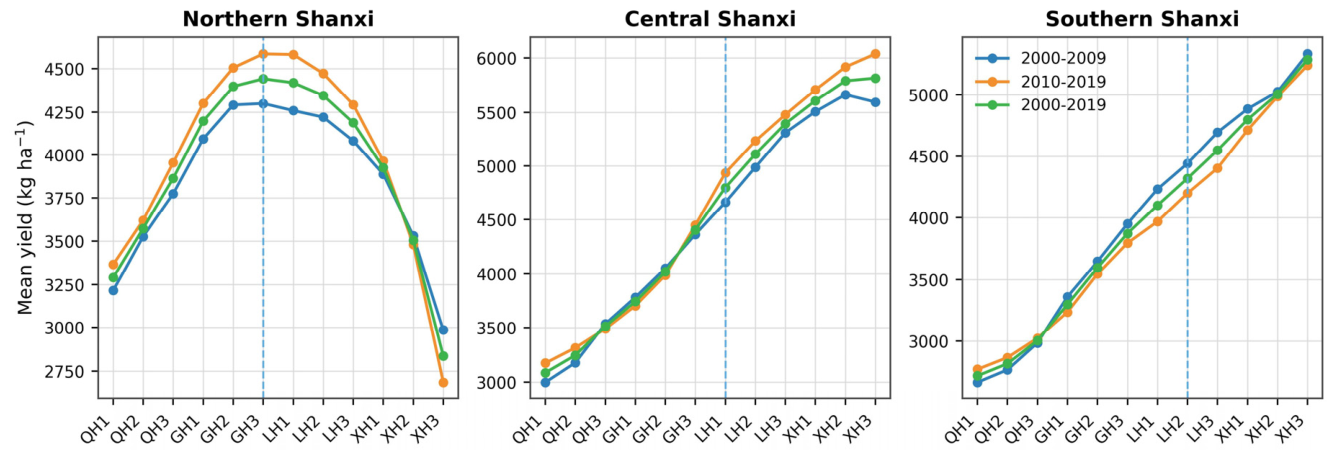
Figure 12.
Hou-level phenological relocation under different sowing scenarios (2010–2019). Lines show simulated V3, ADAT, and MDAT dates; shaded areas indicate recommended operational windows; dotted vertical markers indicate region-specific MBC dates.
Figure 12.
Hou-level phenological relocation under different sowing scenarios (2010–2019). Lines show simulated V3, ADAT, and MDAT dates; shaded areas indicate recommended operational windows; dotted vertical markers indicate region-specific MBC dates.
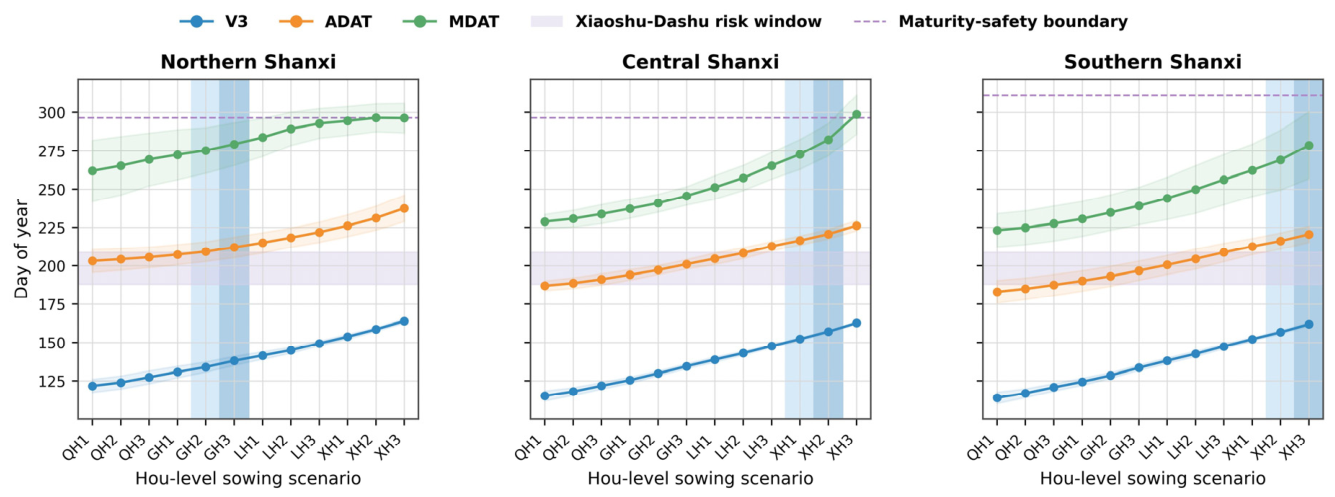
Figure 13.
Geographic information system–based spatial translation of recommended sowing windows for spring maize in Shanxi Province. The legend follows the chronological sequence of ST hou windows from Qingming-H1 (QM H1) to Xiaoman-H3 (XM H3).
Figure 13.
Geographic information system–based spatial translation of recommended sowing windows for spring maize in Shanxi Province. The legend follows the chronological sequence of ST hou windows from Qingming-H1 (QM H1) to Xiaoman-H3 (XM H3).
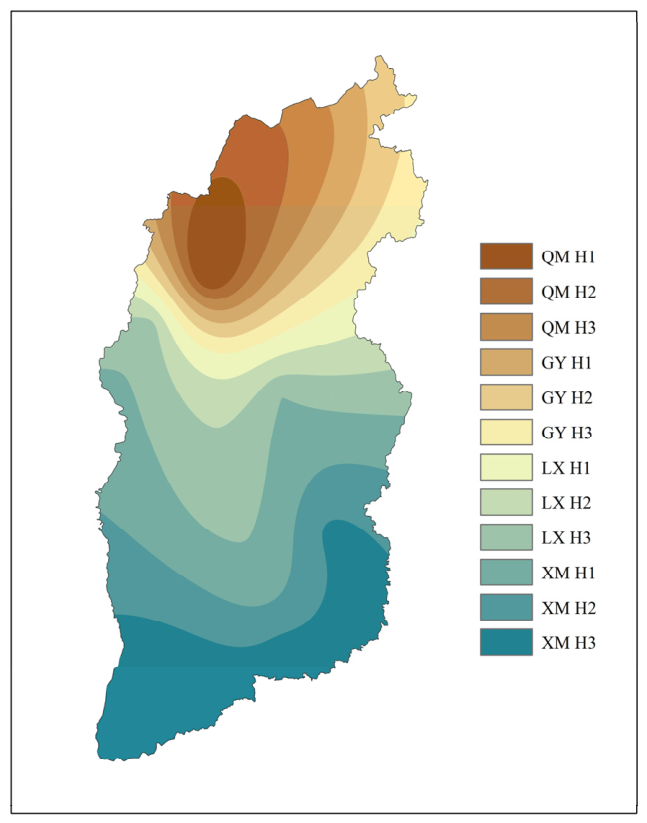
Figure 14.
Spatial distribution of the simulated V3 date for spring maize in Shanxi Province under (a) the current baseline phenological calendar and (b) the optimized sowing-window calendar. LX, Lixia; XM, Xiaoman; MZ, Mangzhong.
Figure 14.
Spatial distribution of the simulated V3 date for spring maize in Shanxi Province under (a) the current baseline phenological calendar and (b) the optimized sowing-window calendar. LX, Lixia; XM, Xiaoman; MZ, Mangzhong.
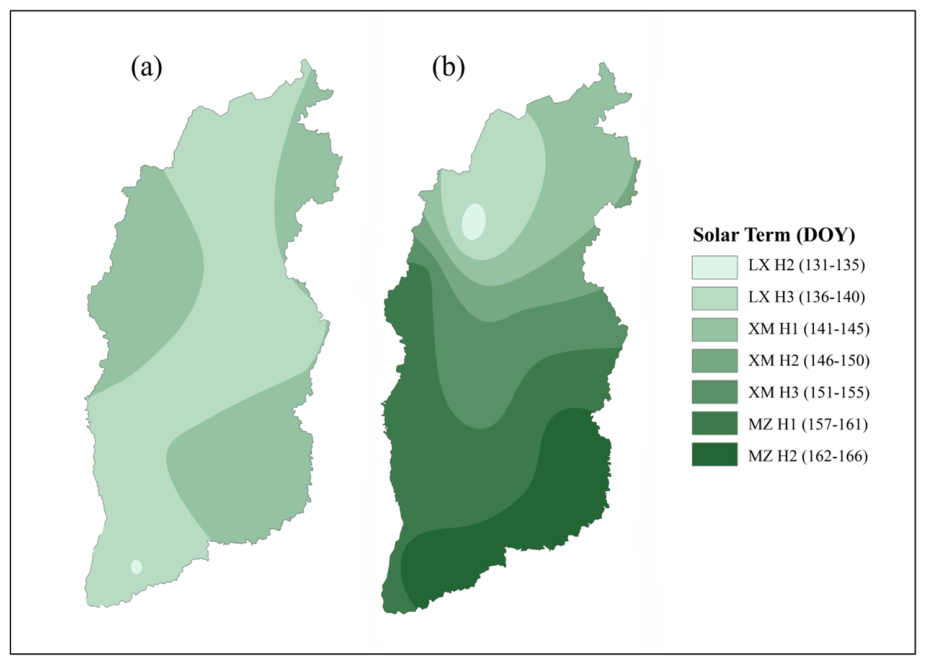
Figure 15.
Spatial distribution of the simulated ADAT for spring maize in Shanxi Province under (a) the current baseline phenological calendar and (b) the optimized sowing-window calendar. XS, Xiaoshu; DS, Dashu; LQ, Liqiu.
Figure 15.
Spatial distribution of the simulated ADAT for spring maize in Shanxi Province under (a) the current baseline phenological calendar and (b) the optimized sowing-window calendar. XS, Xiaoshu; DS, Dashu; LQ, Liqiu.
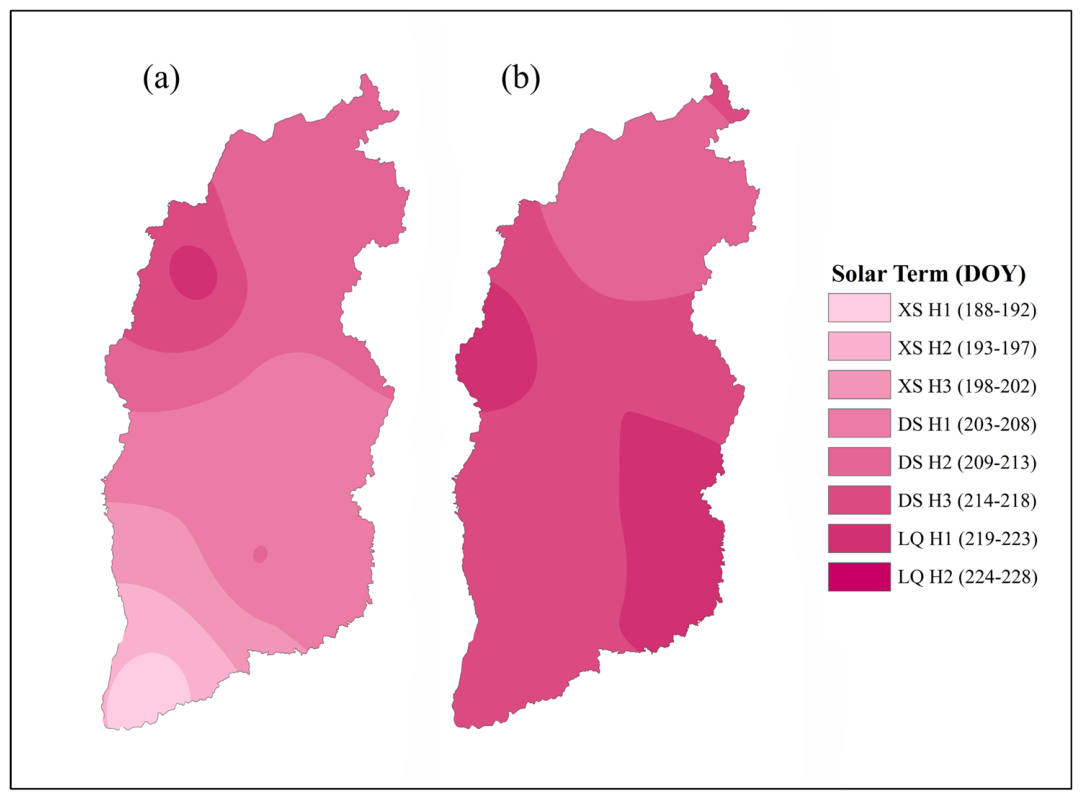
Figure 16.
Spatial distribution of simulated MDAT for spring maize in Shanxi Province under (a) the current baseline phenological calendar and (b) the optimized sowing-window calendar. LQ, Liqiu; CS, Chushu; BL, Bailu; QF, Qiufen; HL, Hanlu.
Figure 16.
Spatial distribution of simulated MDAT for spring maize in Shanxi Province under (a) the current baseline phenological calendar and (b) the optimized sowing-window calendar. LQ, Liqiu; CS, Chushu; BL, Bailu; QF, Qiufen; HL, Hanlu.
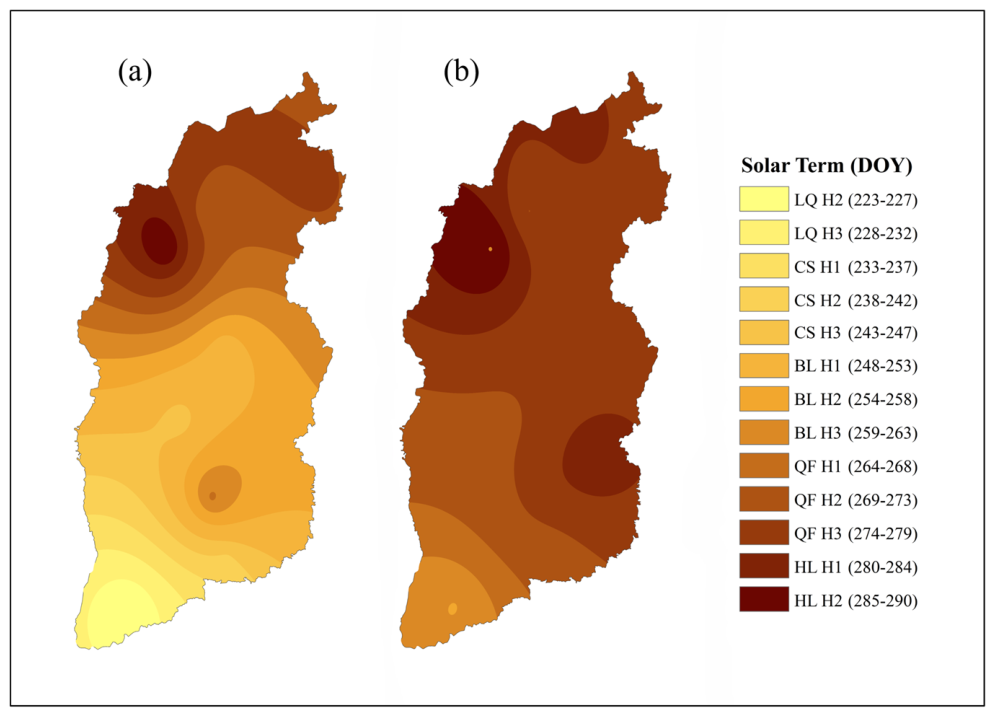

Table 1.
Final CERES-Maize cultivar coefficients used for DSSAT simulations.
| Coefficient | Biological meaning in CERES-Maize | Initial value | Final value | Unit or interpretation |
| P1 | Thermal time from emergence to the end of the juvenile phase | 302.40 | 285.80 | °C days |
| P2 | Photoperiod sensitivity coefficient | 0.6292 | 0.970 | dimensionless day−1 |
| P5 | Thermal time from silking to physiological maturity | 990.00 | 702.20 | °C days |
| G2 | Potential kernel number per plant | 800.0 | 653.10 | kernels plant−1 |
| G3 | Potential kernel growth rate during linear grain filling | 11.00 | 11.37 | mg kernel−1 day−1 |
| PHINT | Thermal time between successive leaf-tip appearances | 50.286 | 38.90 or 50.286 | 50.286 for Jiexiu and Taiyuan; 38.90 for other stations |
Table 2.
Trends in DSSAT-simulated phenological dates during 1960–2019.
| Region | Stage | Mean (days or DOY) | Trend (days decade−1) | p value |
| All stations | V3 date | 144.29 | −1.53 | <0.001 |
| All stations | ADAT date | 212.98 | −1.88 | <0.001 |
| All stations | MDAT date | 269.85 | −3.11 | <0.001 |
| Northern Shanxi | V3 date | 143.50 | −1.37 | <0.001 |
| Northern Shanxi | ADAT date | 218.49 | −1.80 | <0.001 |
| Northern Shanxi | MDAT date | 283.18 | −2.29 | 0.012 |
| Central Shanxi | V3 date | 146.37 | −1.81 | <0.001 |
| Central Shanxi | ADAT date | 213.84 | −2.47 | <0.001 |
| Central Shanxi | MDAT date | 272.86 | −5.59 | <0.001 |
| Southern Shanxi | V3 date | 143.51 | −1.44 | <0.001 |
| Southern Shanxi | ADAT date | 206.82 | −1.61 | <0.001 |
| Southern Shanxi | MDAT date | 254.27 | −2.50 | <0.001 |
DOY, day of the year.
Disclaimer/Publisher’s Note: The statements, opinions and data contained in all publications are solely those of the individual author(s) and contributor(s) and not of MDPI and/or the editor(s). MDPI and/or the editor(s) disclaim responsibility for any injury to people or property resulting from any ideas, methods, instructions or products referred to in the content. |
© 2026 by the authors. Licensee MDPI, Basel, Switzerland. This article is an open access article distributed under the terms and conditions of the Creative Commons Attribution (CC BY) license (http://creativecommons.org/licenses/by/4.0/).
Copyright: This open access article is published under a Creative Commons CC BY 4.0 license, which permit the free download, distribution, and reuse, provided that the author and preprint are cited in any reuse.