

Submitted:
09 August 2026
Posted:
11 August 2026
You are already at the latest version
Abstract
An outstanding issue in molecular biology is understanding the function of elements (e.g. transcripts, CpG sites, and metabolites) detected by high throughput screening platforms. In this study an analysis plan was devised to construct the phenotypic signature of an element by integrating its QTLs with GWAS data. By applying this plan to categories of (un)known transcripts, through a two-step discovery and validation, I provided evidence that the phenotypic signature is a robust metric and it can be used to infer the function of an unknown transcript. In the manuscript, I detailed the analysis plan and the procedure to infer the function of a molecular element. The computed database of phenotypic signatures and the related scripts are publicly available.
Keywords:
phenotypic signature
; function
; GWAS
; QTL
; SNP
; PheWAS
; Mendelian randomization
Introduction
An outstanding issue in molecular biology is understanding the function of elements (e.g. CpG sites, transcripts, proteins, metabolites, …) detected by high throughput screening platforms. For example, a substantial fraction of the human transcriptome constitutes of RNAs that despite decades of investigation, only a relatively small number have been functionally characterized. This is in part due to the high expenses associated with traditional functional characterization methods that require decent amount of laboratory resources. In the past decades, GWAS studies have been able to identify genomic variants underpinning phenomes and various categories of molecular elements. This study proposes an analysis plan based on the concept of phenotypic signature to understand the function of a molecular element. By applying the analysis plan to categories of well and poorly characterized transcripts, I provide evidence that the information available on well-characterized transcripts can be used to understand the function of an unknown transcript with similar phenotypic signature.
Methods
In this study, the phenotypic signature of a molecular element is defined as the nature of its relationship with phenome. From the statistical point of view, it is a vector of z- scores that summarizes the nature of association between the element and phenome.
Phenome is vast and diverse and testing the association of an element with every trait is time-consuming; however, many traits are related; therefore, to generate the phenotypic signature of an element a set of independent traits is required. For this purpose, the list of traits from the UK Biobank were obtained and a pruning step was carried out to find independent traits that the degree of genetic correlation among them is less than 0.2. The precomputed genetic correlation values were obtained from the Neal Lab UKBB (https://ukbb-rg.hail.is/rg_summary_100001.html). The r script that was used to prune out the phenotypes is provided as S1 Text. After pruning, a total of 109 independent traits were identified and used as the reference traits for the PheWAS analysis (S1 Table). Mendelian randomization was used to test the association between a transcript and a trait. For this purpose, GSMR algorithm [1] implemented in the GCTA software was installed in a high-performance computing environment (Linux 5.14.0 x86_64) and the analyses were performed by distributing the computing tasks across the cluster. After obtaining the phenotypic signature of an unknown element. It was searched in the database containing phenotypic signatures of well characterized transcripts to identify its closest matches (Spearman ρ > 0.5). Next, a network was generated to visualize the detected correlations and understand the function of the element.
To demonstrate, the performance of the approach. Known and unknown groups of genes were obtained from the IDG (Illuminating the Druggable Genome) project [2] in which in addition to classifying genes according to their drug targetability. The authors classified genes based on the amount of biological information available on them to Tbio and Tdark groups. Tbio group consists of genes that there are considerable biological information available on them (i.e. known genes); whereas, genes in Tdark group are poorly characterized with regard to their functions (i.e. unknown genes). After obtaining these genes, I obtained their eQTLs for a total of 4,374 transcripts (962 Tdark genes and 3,412 Tbio genes) from the INTERVAL study and applied the analysis plan described above (Figure 1). A second set of eQTLs were obtained from the eQTLGene study to re-investigate the findings from the discovery stage.
The INTERVAL study generated eQTLs from approximately 4,700 healthy blood donors using a single, uniformly processed RNA sequencing workflow on whole-blood samples. The authors provided eQTL data for 17,346 transcripts [3]. eQTLgen study is a meta-analysis of eQTL data from 37 independent cohorts. Gene expressions were measured primarily in whole blood, although several cohorts used peripheral blood mononuclear cells (PBMCs), with transcriptomic profiling performed using a combination of microarray (79.7% of samples) and RNA sequencing platforms [4].
Figure 2.
Phenotypic signature of a transcript was comparable across the discovery and validation panels. Phenotypic signatures were computed by integrating GWAS data from the UK Biobank and eQTLs from the INTERVAL study (discovery panel) and next using eQTLs from the eQTLGen study (validation panel). Overall, correlations between the derived phenotypic signatures (N = 503) from the discovery and validation panels were strong. The histogram was heavily left-skewed. The median of correlation coefficients was 0.78.
Figure 2.
Phenotypic signature of a transcript was comparable across the discovery and validation panels. Phenotypic signatures were computed by integrating GWAS data from the UK Biobank and eQTLs from the INTERVAL study (discovery panel) and next using eQTLs from the eQTLGen study (validation panel). Overall, correlations between the derived phenotypic signatures (N = 503) from the discovery and validation panels were strong. The histogram was heavily left-skewed. The median of correlation coefficients was 0.78.
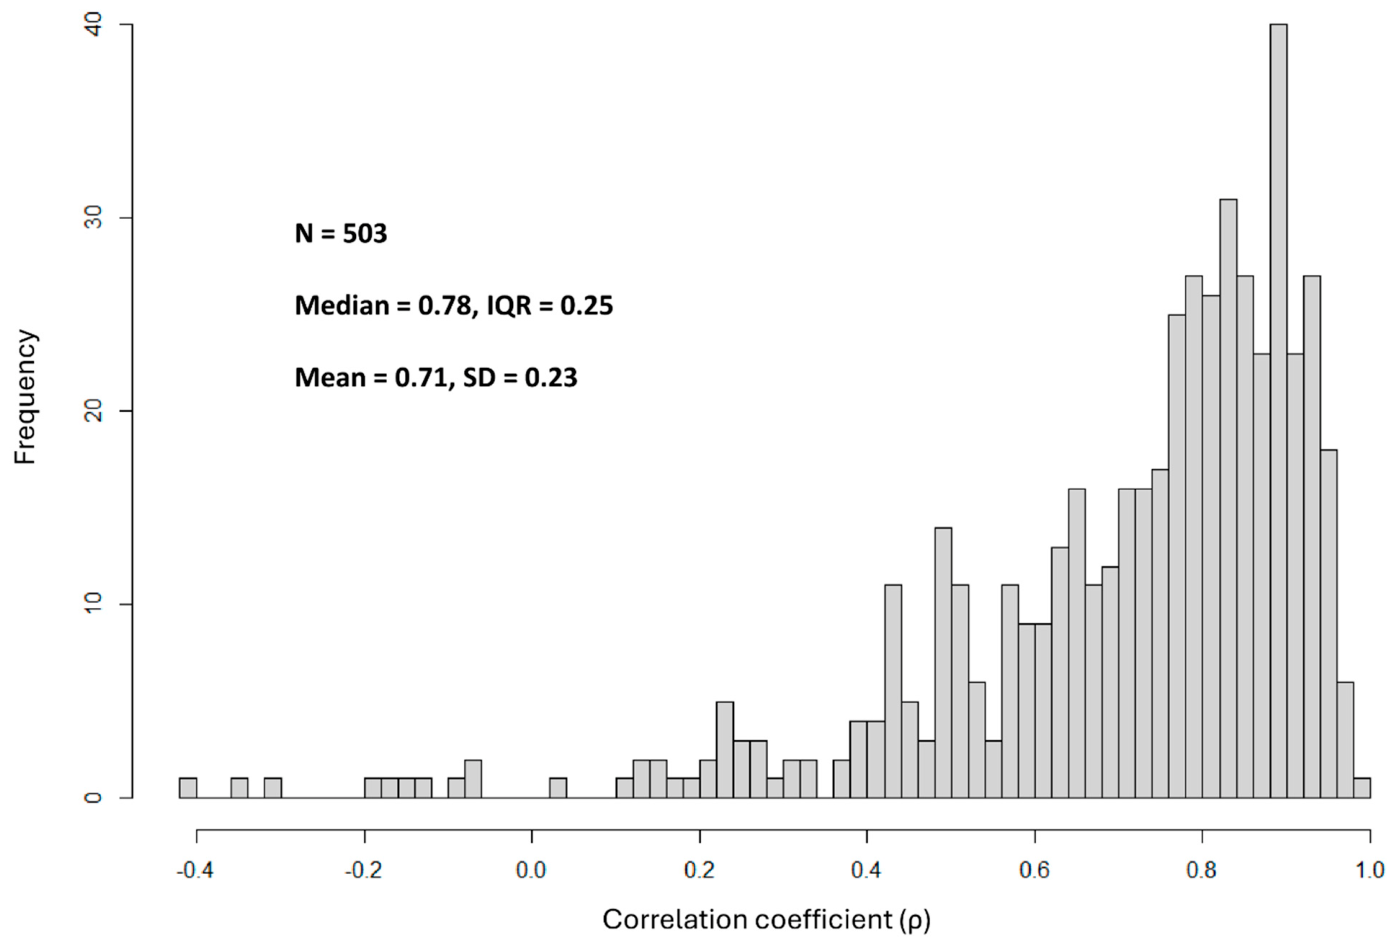
Figure 3.
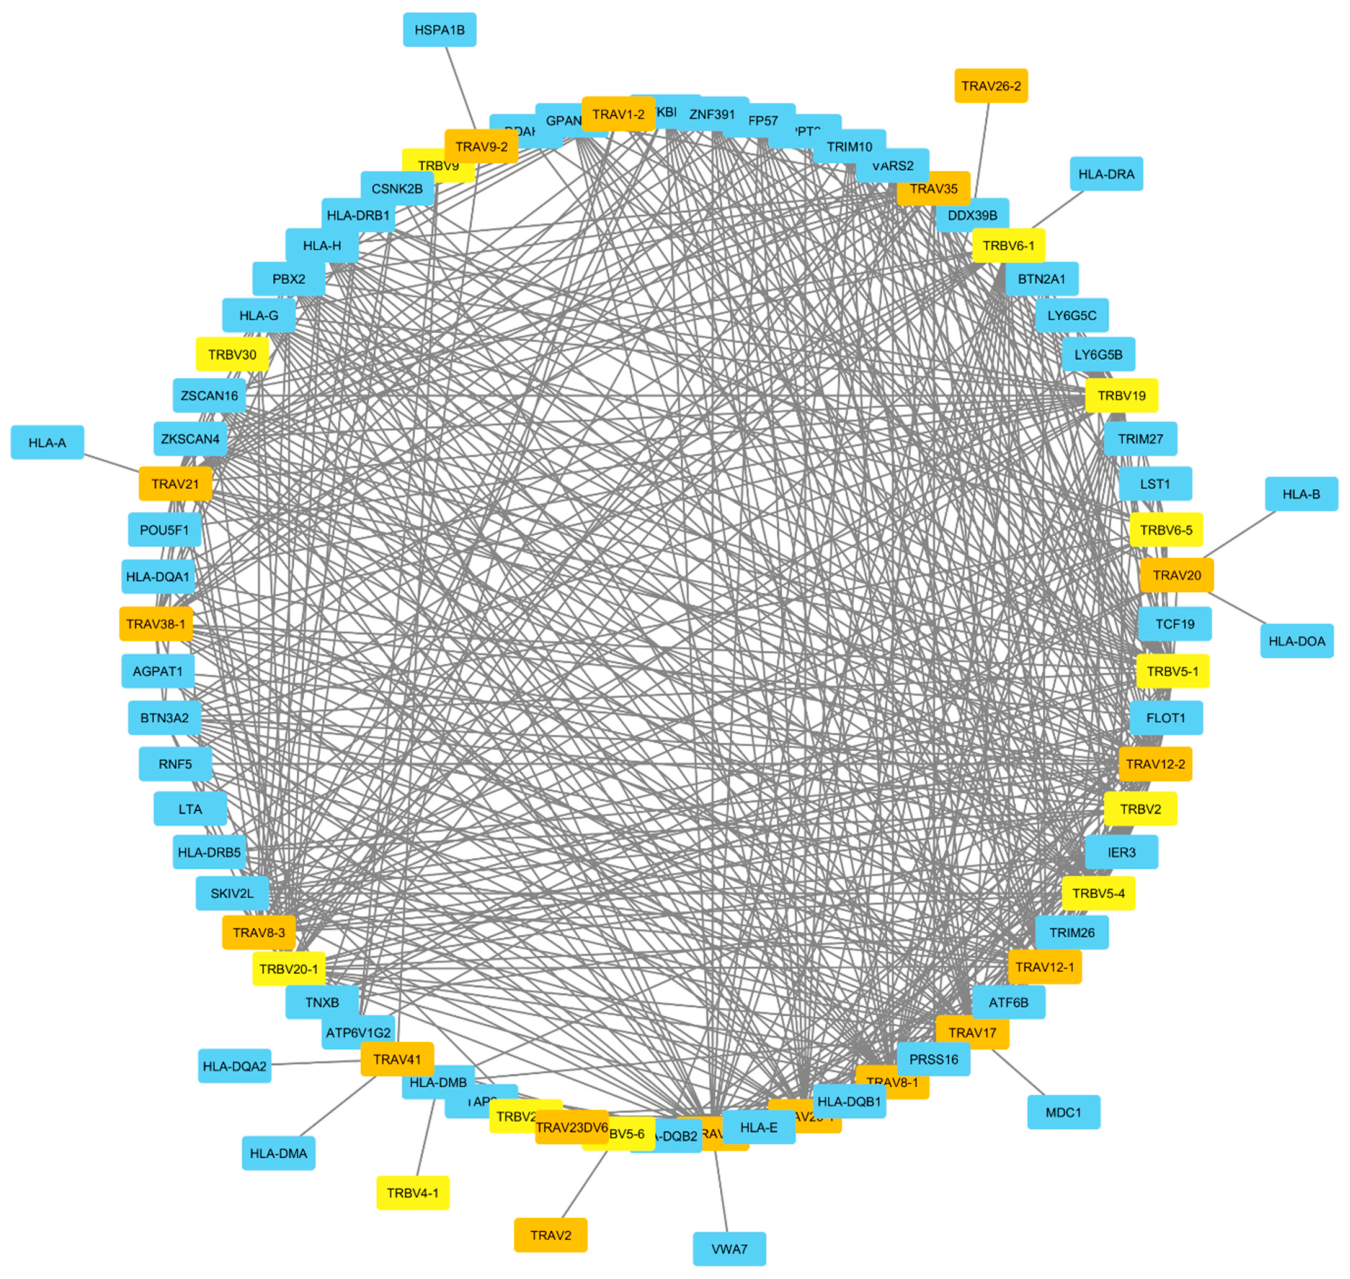
Genes at HLA, 7q34 and 14q11.2 showed similar phenotypic signatures. In agreement with biological knowledge, the phenotypic signatures of genes at HLA, 7q34 and 14q21 were highly correlated. Genes are colored according to their chromosome bands (yellow: 7q34 genes, orange: 14q11.2 genes, light blue: HLA genes). Statistical details are provided in S2 Table. Genes at HLA, 7q34 and 14q11.2 are essential in formation of peptide-HLA complexes and triggering cellular immune response by T lymphocytes.
Figure 3.
Genes at HLA, 7q34 and 14q11.2 showed similar phenotypic signatures. In agreement with biological knowledge, the phenotypic signatures of genes at HLA, 7q34 and 14q21 were highly correlated. Genes are colored according to their chromosome bands (yellow: 7q34 genes, orange: 14q11.2 genes, light blue: HLA genes). Statistical details are provided in S2 Table. Genes at HLA, 7q34 and 14q11.2 are essential in formation of peptide-HLA complexes and triggering cellular immune response by T lymphocytes.
Results
By applying the analysis plan described in Figure 1, the database of phenotypic signatures was initially created based on genes in Tbio category (N=3,411). Next, phenotypic signatures for genes in Tdark category (N=963) were computed and searched in the database to identify their functionally related genes. Overall, the outcome of analysis identified a total of 2,480 transcript pairs (consists of 550 transcripts in Tbio category and 162 transcripts in Tdark category) that were located on different chromosomes and displayed similar phenotypic signatures (Spearman ρ > 0.5). By selecting these transcripts, I used data from the eQTLGen study to re-investigate their relations. 503 transcripts (consists of 391 transcripts in Tbio category and 112 transcripts in Tdark category) had eQTLs in the eQTLGen study. The phenotypic signature of a transcript was highly comparable across the discovery and validation panel. The distribution of correlation coefficients showed a highly left-skewed pattern with a median of 0.78 (IQR=0.25). This indicates phenotypic signature of a transcript is a robust metric that can be used to assess its relationship with other transcripts.
Next, I investigated the association of the identified pairs from the INTERVAL study in the eQTLGen panel. Overall, the degree of concordance between the findings from the discovery and validation panels were high (Table, ρ = 0.78, N = 1,486 transcript pairs). By selecting transcript pairs that show concordant and significant (P < 0.05) direction of effect at validation step (N = 1,022 transcript pairs, S2 Table), I then generated networks to visualize the nature of connection between them.
The blood transcriptome is mainly derived from immune cells. Therefore, from biological point of view, it is expected that a significant number of phenotypic correlations must be detected between genomic regions that their genes are involved in the same immune processes. Genes at HLA, 7q34 and 14q11.2 are essential in formation of peptide–HLA complexes and triggering cellular immune response. By selecting genes in these regions and mapping their connections (ρ > 0.5), I noted genes in these regions form a highly interconnected network indicating the computed statistical interactions strongly align with biological knowledge. Next, I sought to investigate the function of genes in Tdark category by studying their connections with genes in Tbio category. Below I review the notable findings.
The outcome of analyses pointed to a cluster of zinc finger proteins on chromosome 19q13.41 that shared significant phenotypic correlations (ρ > 0.5) with genes OPLAH and TAF7 in both the discovery and the validation panels (Figure 4 and S2 Table). In depth, PheWAS analysis indicated OPLAH, and TAF7 as well as zinc finger proteins influence blood traits (S3 Table). Therefore, these genes could be part of a functional module that regulates hematopoiesis. TAF7 is a TATA-box binding protein associated factor, while OPLAH belongs to the oxoprolinase family and is involved in glutathione catabolism. Therefore, the interactions between zinc finger proteins with TAF7 could regulate the level of OPLAH and this consequently influences the blood cells because OPLAH enzyme protects them against oxidative stress and activation-induced damage while circulating in the vascular system.
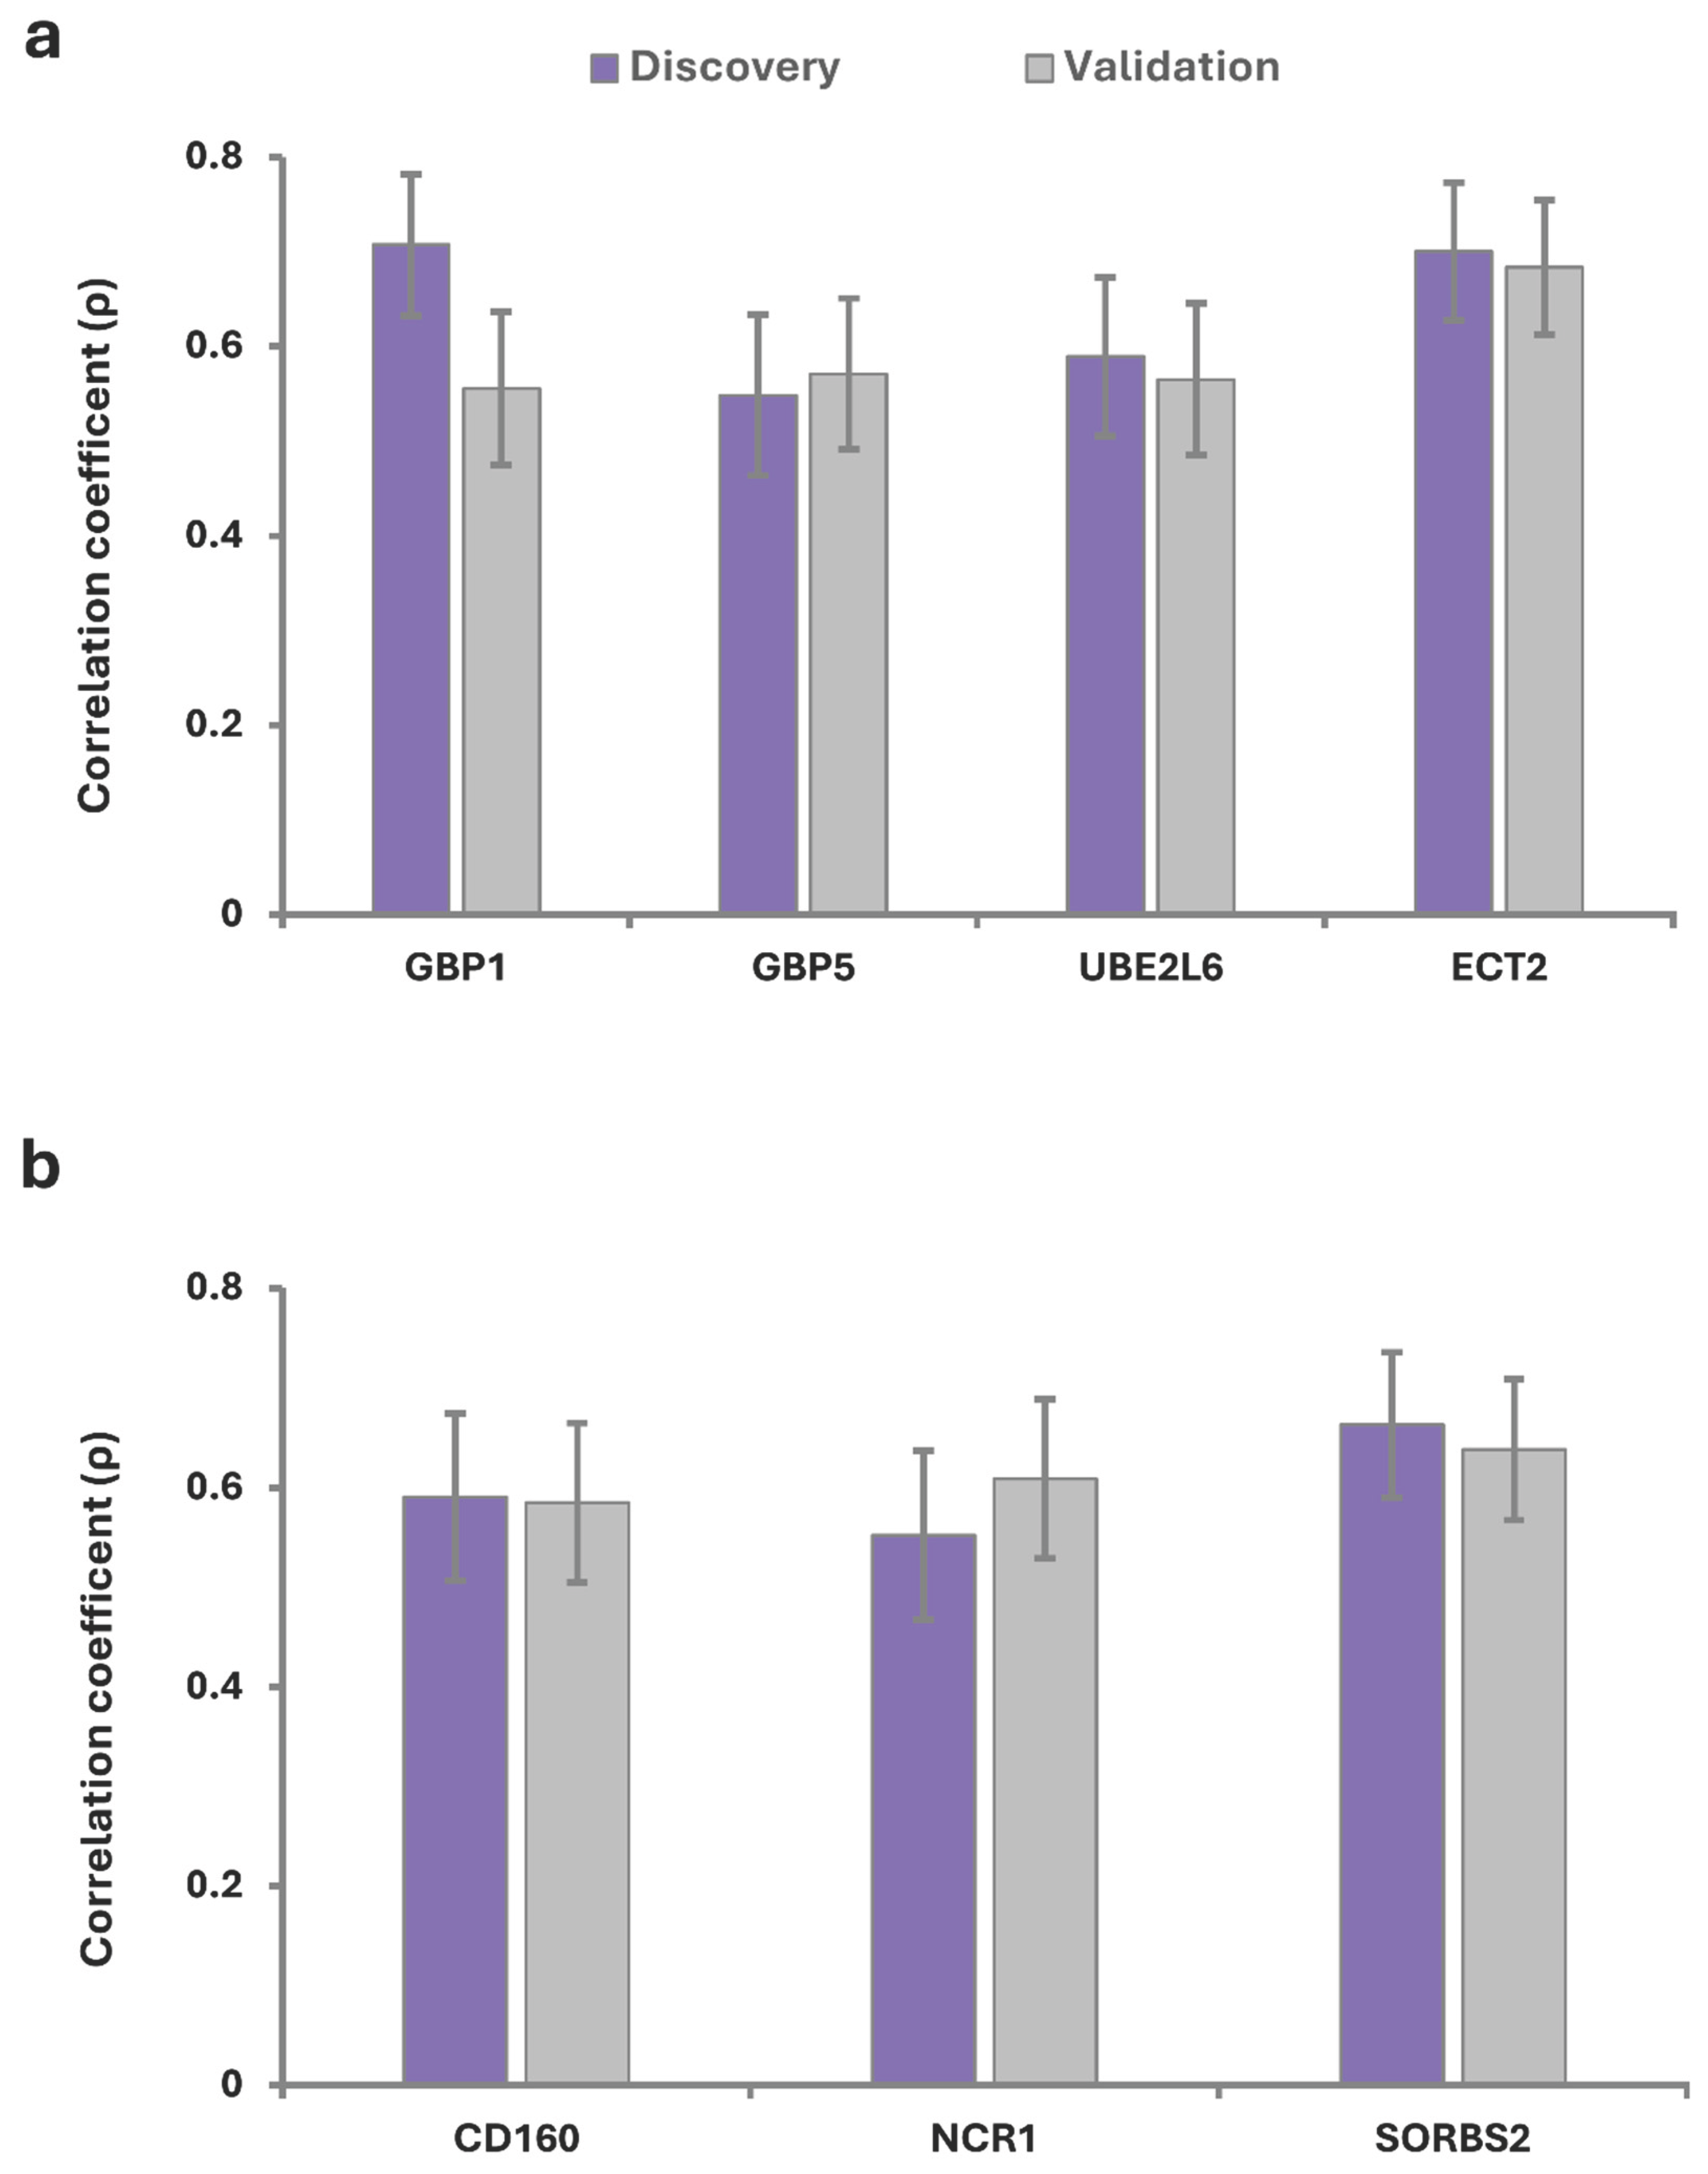
The long coding RNA, MAPKAPK5-AS1 on chromosome 12q24.12 showed significant correlations with genes ECT2, GBP5, UBE2L6, and GBP1 (Figure 5 and S2 Table). The shared functional feature among these genes is their involvement in interferon signaling pathway. GBP1, GBP5, and UBE2L6 are canonical interferon-stimulated genes that cooperate in antimicrobial and antiviral defense, while ECT2 supports these responses by regulating the cytoskeletal dynamics required for immune cell function and pathogen clearance.
GFOD1 is another gene in Tdark category that its function is less known. The outcome of analysis plan indicated it is showing correlated phenotypic signature with genes NCR1, CD160 and SORBS2 at both the discovery and validation panels (Figure 5 and S2 Table). The shared function among these genes is that they are involved in natural killer (NK) cell biology and cytotoxic immunity. NCR1, and CD160 are surface receptors on NK cells whereas, SORBS2 regulates inflammatory pathways.
Discussion
With development of high throughput screening studies, understanding the function of a molecular element is an existing issue. This study proposes the concept of phenotypic signature as a means to investigate the function of an unknown molecular element. By devising an analysis plan around this concept and applying it to categories of well characterized and unknown transcripts, I provided evidence that the knowledge available at well characterized transcripts can be used to infer the function of an unknown transcript.
Laboratory-based approaches to investigate the function of a molecular element are resource intensive and time consuming. The approach presented in this study leverages the publicly available GWAS and QTL data to compare functional elements, and infer function of an uncharacterized element. It has the benefit to accommodate and relate all types of molecular elements because it relies on knowledge available at SNP level to relate them. Furthermore, unlike traditional high throughput approaches such as co-expression and interaction studies, it provides protection against the noise of environmental (non-genetic) factors.
Although genetic approaches such as MR and genetic correlation can directly relate molecular elements and identify their interactions; however, the nature of current QTL data limit their applications because the common practice in QTL studies is to just report GWAS significance SNPs for an element, besides, two elements could contribute to the same process through different routes.
In this study, I computed the phenotypic signature of 4,374 transcripts that are listed in IDG database. It would be valuable if future studies extend the current database by computing and reporting phenotypic signatures of the remaining transcripts in blood. Such collective effort will lower the burden of computational analyses because new studies only need to compute the signature of novel transcripts and use previous data as reference for similarity match. Furthermore, blood is the primary source for collecting biological samples in biobank projects and currently there are blood QTL data from well-powered studies for various molecular elements. Therefore, integrating the phenotypic signature of other elements would provide a framework to connect various layers of omics. A limitation of the approach presented in this study is that it can only be applied to molecular elements that are under the influence of genetic factors. Namely, it is not appropriate for elements that have low heritability.
In conclusion, this study provides evidence that phenotypic signature of a transcript is a robust metric that can be used to infer its function. The database generated for the purpose of this study is publicly available and computing the phenotypic signatures of the remaining blood transcripts and other molecular elements is recommended.
Supplementary Materials
The following supporting information can be downloaded at the website of this paper posted on Preprints.org.
Data Availability Statement
The database and the script to calculate the phenotypic signature of a transcript is available through the following link: https://github.com/mnikpay/Phenotypic-Signature.git.
Acknowledgments
This research work was enabled in part by computational resources and support provided by the Compute Ontario and the Digital Research Alliance of Canada. The author wishes to thank the help provided by ChatGPT and Gemini in the formation of this study and in the preparation of the manuscript.
References
- Zhu, Z.; et al. Causal associations between risk factors and common diseases inferred from GWAS summary data. Nat. Commun. 2018, 9, 224. [Google Scholar] [CrossRef] [PubMed]
- Sheils, T. K.; et al. TCRD and Pharos 2021: mining the human proteome for disease biology. Nucleic Acids Res. 2021, 49, D1334–D1346. [Google Scholar] [PubMed]
- Xu, Y.; et al. An atlas of genetic scores to predict multi-omic traits. Nature 2023, 616, 123–131. [Google Scholar] [CrossRef] [PubMed]
- Võsa, U.; et al. Large-scale cis- and trans-eQTL analyses identify thousands of genetic loci and polygenic scores that regulate blood gene expression. Nat. Genet. 2021, 53, 1300–1310. [Google Scholar] [CrossRef] [PubMed]
Figure 1.
Overview of the analysis plan. To investigate the function of a molecular element (e.g. an unknown transcript). Initially, its phenotypic signature is created by examining its association with the independent traits that represent phenome. The derived signature then is investigated in the database of phenotypic signatures of well-characterized elements to identify its matches (correlation coefficient > 0.5). A network was then generated to visualize the identified connections and infer the function of the unknown element.
Figure 1.
Overview of the analysis plan. To investigate the function of a molecular element (e.g. an unknown transcript). Initially, its phenotypic signature is created by examining its association with the independent traits that represent phenome. The derived signature then is investigated in the database of phenotypic signatures of well-characterized elements to identify its matches (correlation coefficient > 0.5). A network was then generated to visualize the identified connections and infer the function of the unknown element.
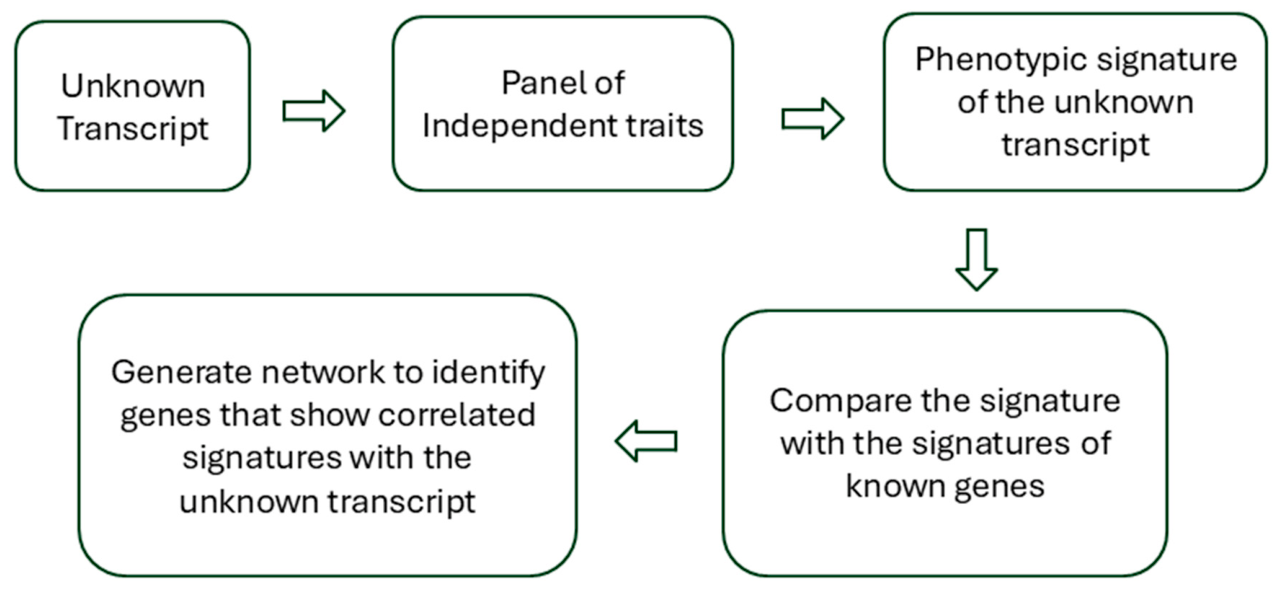
Figure 4.
Functional module made of OPLAH, TAF7 and zinc finger proteins influences blood traits. A cluster of uncharacterized zinc finger proteins was identified on chromosome 19q13.41 that showed similar phenotypic signatures (ρ > 0.5) with genes OPLAH and TAF7 in both the discovery and the validation panels (S2 Table). In depth PheWAS analysis indicated OPLAH, and TAF7 as well as zinc finger proteins influence blood traits.
Figure 4.
Functional module made of OPLAH, TAF7 and zinc finger proteins influences blood traits. A cluster of uncharacterized zinc finger proteins was identified on chromosome 19q13.41 that showed similar phenotypic signatures (ρ > 0.5) with genes OPLAH and TAF7 in both the discovery and the validation panels (S2 Table). In depth PheWAS analysis indicated OPLAH, and TAF7 as well as zinc finger proteins influence blood traits.
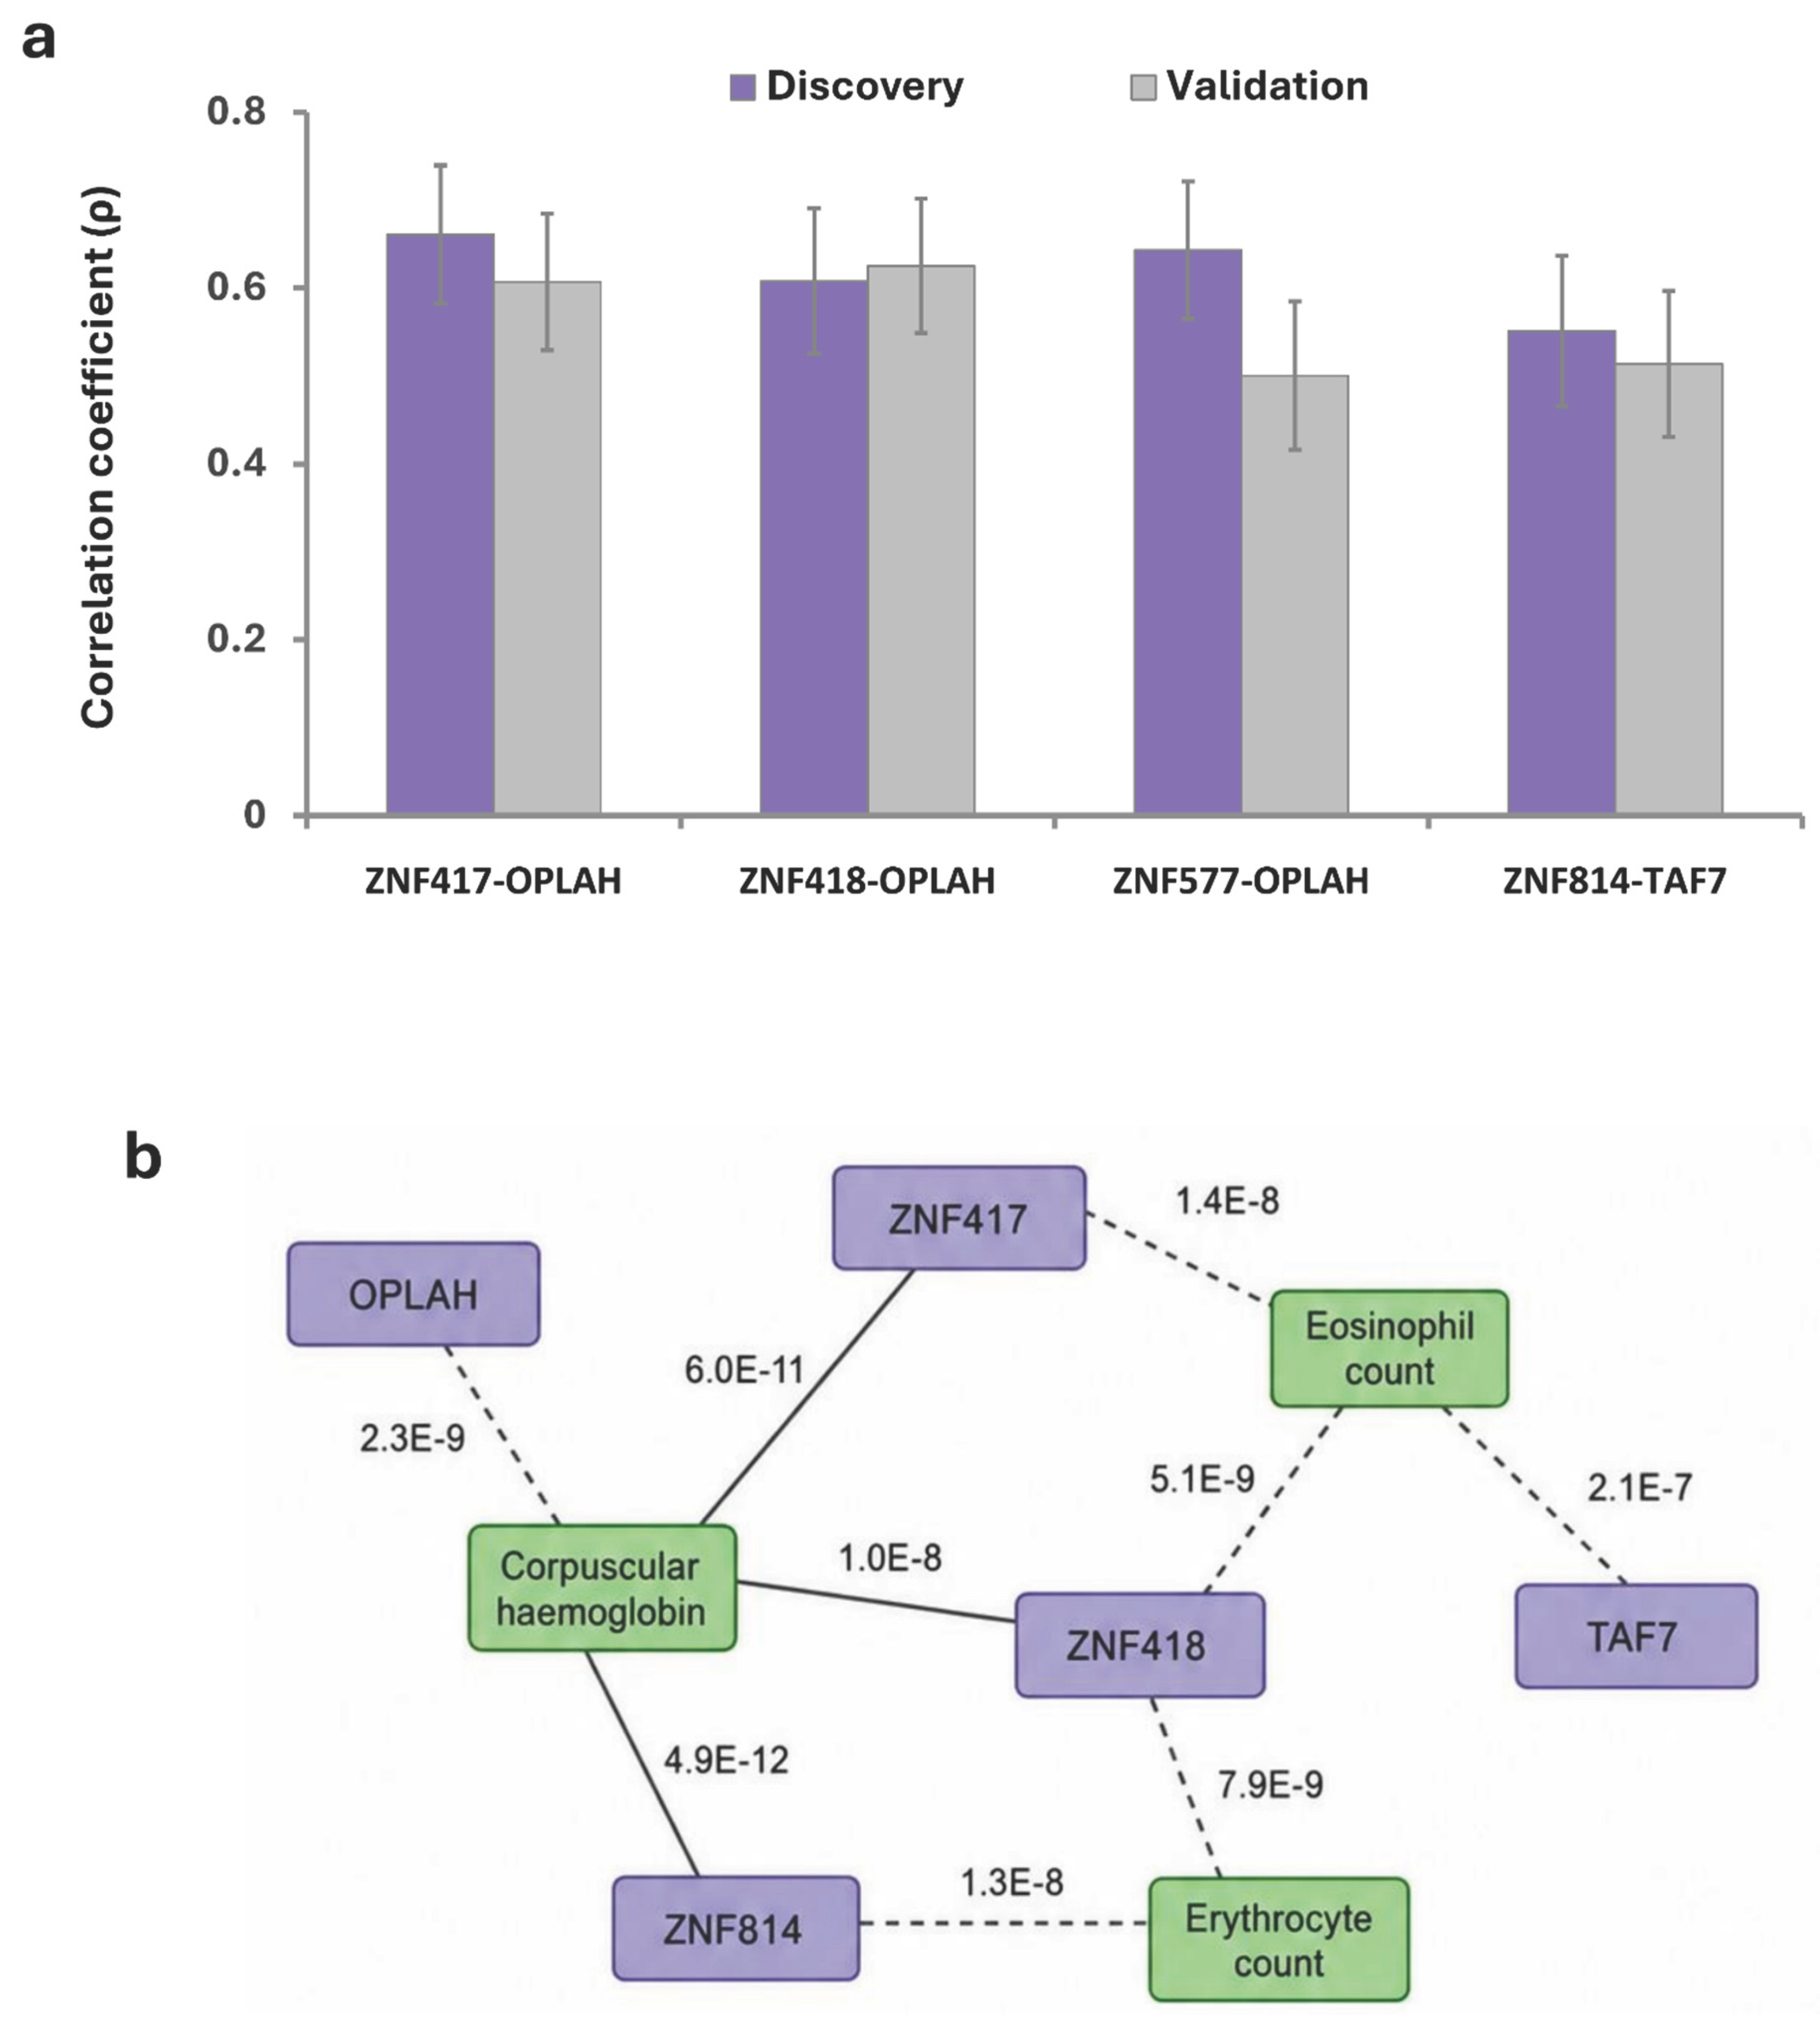
Figure 5.
The long coding RNA, MAPKAPK5-AS1 and the uncharacterized transcript GFOD1 showed similar phenotypic signatures to cluster of genes with immune function. Findings from the discovery and validation panels, indicated MAPKAPK5-AS1 had similar phenotypic signature to genes, GBP1, UBE2L6, GBP5 and ECT2 that are involved interferon signaling. While GFOD1 showed similar signature to genes involved in natural killer cell biology and cytotoxic lymphocyte function including CD160, NCR1 and SORBS2.
Figure 5.
The long coding RNA, MAPKAPK5-AS1 and the uncharacterized transcript GFOD1 showed similar phenotypic signatures to cluster of genes with immune function. Findings from the discovery and validation panels, indicated MAPKAPK5-AS1 had similar phenotypic signature to genes, GBP1, UBE2L6, GBP5 and ECT2 that are involved interferon signaling. While GFOD1 showed similar signature to genes involved in natural killer cell biology and cytotoxic lymphocyte function including CD160, NCR1 and SORBS2.
Disclaimer/Publisher’s Note: The statements, opinions and data contained in all publications are solely those of the individual author(s) and contributor(s) and not of MDPI and/or the editor(s). MDPI and/or the editor(s) disclaim responsibility for any injury to people or property resulting from any ideas, methods, instructions or products referred to in the content. |
© 2026 by the authors. Licensee MDPI, Basel, Switzerland. This article is an open access article distributed under the terms and conditions of the Creative Commons Attribution (CC BY) license (http://creativecommons.org/licenses/by/4.0/).
Copyright: This open access article is published under a Creative Commons CC BY 4.0 license, which permit the free download, distribution, and reuse, provided that the author and preprint are cited in any reuse.