

Submitted:
10 August 2026
Posted:
10 August 2026
You are already at the latest version
Abstract
Background: Deafblindness is a distinct disability with major implications for communication, mobility, access to information, and participation. Population estimates vary substantially. Methods: We conducted a secondary cross-sectional analysis of nationally representative Spanish microdata from EDAD-Households 2020 and EDAD-Centres 2023, including persons aged ≥ 6 years. Functional deafblindness was defined as severe limitation in one sensory domain with at least moderate limitation in the other, accounting for residual functioning with assistive products. Weighted prevalence estimates and approximate 95% uncertainty intervals (UI) were obtained using a cluster bootstrap. Results: The integrated population represented 44.9 million persons. The primary definition identified an estimated 45,951 persons with functional deafblindness, corresponding to 102.3 per 100,000 population (95% UI, 82.5–125.1). Prevalence increased markedly with age, reaching 438.0 per 100,000 among persons aged ≥ 65 years. A broader sensitivity definition yielded 202.3 per 100,000 (95% UI, 175.8–231.2). Conclusions: Functional deafblindness affects tens of thousands of people in Spain and is concentrated at older ages and in residential settings. Population-based estimates are needed to complement administrative data and inform equitable planning of specialized, accessible health, social-care, and communication services.
Keywords:
deafblindness
; dual sensory impairment
; prevalence
; disability
; sensory impairment
; residential care
; population survey
; Spain
1. Introduction
Deafblindness is a distinct disability resulting from the combined effects of visual and hearing impairments. According to the functional definition adopted internationally by the World Federation of the Deafblind, the combination is sufficiently severe for the two sensory modalities to have difficulty compensating for one another, thereby affecting communication, access to information, orientation, mobility, and participation [1]. Deafblindness therefore does not necessarily imply complete blindness and profound deafness, and its functional consequences cannot be inferred solely from the severity of each sensory impairment considered independently. Residual sensory function, age at onset, communication strategies, assistive products, and environmental factors may all influence its impact on daily functioning.
Estimating the prevalence of deafblindness is challenging because epidemiological studies use heterogeneous concepts and case definitions. Terms such as deafblindness, dual sensory impairment, and dual sensory loss are frequently applied to populations that are not directly comparable. Studies differ in sensory thresholds, age ranges, consideration of assistive products, residential setting, and whether impairment is measured clinically, self-reported, or reported by proxies. A recent scoping review identified 75 different definitions across 153 primary studies, illustrating the substantial methodological heterogeneity in this field [2].
International prevalence estimates consequently vary widely. The World Federation of the Deafblind estimated a weighted prevalence of approximately 0.21% for severe deafblindness among persons aged five years or older, whereas broader definitions including concurrent visual and hearing difficulties produced estimates of around 2.1% [1]. A recent meta-analysis of clinically assessed dual sensory impairment reported a pooled prevalence of 5.50% (95% CI, 2.88–10.26), although between-study heterogeneity was extreme and the evidence was predominantly derived from older populations, with most of the date derived from population older than 60 years [3]. Prevalence increases markedly with age and may be substantially higher in residential and long-term care populations than among community-dwelling individuals[2,3,4,5,6]. These differences highlight the importance of case definition, age structure, and population setting when comparing prevalence estimates.
In Spain, population-based evidence remains limited. A 2022 national report based mainly on the 2020 Survey on Disability, Personal Autonomy and Dependency Situations in Households (EDAD-Households) estimated 229,948 persons (0.48%) using a broad definition of concurrent visual and hearing difficulty and 34,137 persons (0.07%) when difficulties were required to persist despite the use of assistive products [7]. These estimates were restricted to people living in private households and did not include the institutionalized population. Administrative sources identify substantially fewer individuals, reflecting differences in eligibility, classification, and purpose rather than directly comparable estimates of population prevalence.
The subsequent availability of EDAD-Centres 2023 [8] provides an opportunity to address an important gap by incorporating people living in residential settings, a population that is relatively small but disproportionately older and affected by disability. Accordingly, this study aimed to estimate the prevalence of functional deafblindness among the Spanish population aged six years or older by integrating EDAD-Households 2020 and EDAD-Centres 2023. A restrictive and reproducible primary case definition was applied, together with a broader sensitivity definition, and prevalence was examined according to residential setting, sex, age, and autonomous community, with statistical uncertainty explicitly quantified.
2. Materials and Methods
We conducted a secondary cross-sectional analysis of anonymized public-use microdata from two nationally representative surveys conducted by the Spanish National Statistics Institute (Instituto Nacional de Estadística, INE): the 2020 Survey on Disability, Personal Autonomy and Dependency Situations in Households (EDAD-Households) and the 2023 Survey on Disability in Residential Settings (EDAD-Centres) [8,9]. EDAD-Households covered persons aged ≥6 years living in private households. It used a stratified two-stage sampling design, with census sections as primary sampling units and family dwellings as secondary units. A first-stage household screening identified individuals eligible for the detailed disability questionnaire. EDAD-Centres covered persons aged ≥6 years living in residential facilities for older persons or persons with disabilities, supported or supervised housing, and selected psychiatric or geriatric hospitals, using a stratified two-stage design with centres and residents as sampling units. The two surveys were analysed separately and subsequently combined to provide an estimate covering the complementary household and residential populations. Because they refer to different survey periods, the combined estimate should be regarded as a synthetic integrated prevalence estimate rather than a single-year point prevalence.
Reporting followed the STROBE recommendations for cross-sectional studies, with relevant items from the 2025 STROBE-Equity extension considered for the reporting of population subgroups[10]. The completed STROBE checklist is provided in Table S1. The study was initiated in the context of APASCIDE's institutional interest in improving population-based knowledge of deafblindness in Spain; all operational definitions and analytical procedures were developed and implemented by the authors using publicly available INE microdata.
The analytic population included all persons aged ≥6 years represented in the two survey population frames. Survey records were retained according to the original questionnaire routing; household participants who did not receive the second-stage individual disability questionnaire were retained in the household denominator and were not considered to have missing individual questionnaire data.
The primary case definition was designed to identify concurrent, functionally relevant visual and hearing impairment while minimizing inclusion of mild sensory limitations. Severe visual impairment was defined as declared blindness or great difficulty/inability in the relevant vision activities despite the usual assistive devices when applicable. Moderate-to-severe visual impairment additionally included moderate difficulty. Hearing impairment was defined analogously, with declared deafness retained as an independent criterion. Functional deafblindness was classified when either severe visual impairment coexisted with at least moderate-to-severe hearing impairment, or severe hearing impairment coexisted with at least moderate-to-severe visual impairment. A complete mapping of questionnaire variables, response categories, routing rules, and derived variables is provided in Table S2.
A prespecified broader sensitivity definition was also evaluated to increase sensitivity to sensory impairment. This definition incorporated additional baseline visual-difficulty information before the use of visual aids while retaining the same requirement for severe impairment in one sensory domain and at least moderate impairment in the other. Full operational details and corresponding estimates are reported in Table S4.
All prevalence estimates were calculated using the final person-level survey weights supplied by INE [8,9]. Weighted case counts were divided by the corresponding weighted population denominators and expressed as cases per 100,000 population. Estimates were calculated for the household and residential populations separately and for the integrated population. Prespecified subgroup analyses included sex, age, and autonomous community. The primary age categories were 6–34, 35–64, and ≥65 years. A more detailed age classification was examined in the broader sensitivity analysis. All subgroup estimates were crude and were not age-standardized. Comparisons between sex, age, residential setting, and autonomous communities were descriptive; no adjusted hypothesis-testing model was used.
Questionnaire structure, routing consistency, linkage between household and individual files, sensory-variable response codes, and missing/non-response categories were audited before analysis. Structural blanks resulting from questionnaire routing were distinguished from explicit non-response codes and were not treated as missing values. No imputation was performed. As a conservative sensitivity analysis, prevalence was recalculated after excluding records containing any explicit non-response code in the sensory variables used for case ascertainment. Both surveys permitted proxy responses when direct participation was not possible or appropriate. Proxy responses were retained in the primary analysis; their distribution overall and among identified cases is reported separately. Detailed data-quality checks, missingness and routing results are provided in Table S3, the conservative non-response sensitivity analysis in Table S4, and proxy-response analyses in Table S5.
Because the public-use datasets did not contain all variables required to reproduce the official INE variance-estimation procedures, uncertainty was estimated using a weighted cluster bootstrap with 5000 replicates, informed by established resampling methods for complex survey data [11,12,13]. For EDAD-Households, resampling was performed at the household-cluster level within pseudo-strata defined from the available sampling variables. For EDAD-Centres, an operational centre identifier was reconstructed from contiguous records sharing centre-level characteristics because the public-use dataset did not include a direct centre identifier. Clusters were resampled with replacement within operational pseudo-strata, while the original survey weights were retained and replicate contributions were recalibrated to preserve the weighted population total of each pseudo-stratum [14].
Within each bootstrap replicate, weights were recalibrated to preserve the original weighted population total of each pseudo-stratum. Household and residential replicates were generated independently and combined replicate-by-replicate for integrated estimates. The 2.5th and 97.5th percentiles of the bootstrap distribution were used as approximate 95% uncertainty limits; bootstrap standard errors and coefficients of variation (CVs) were also calculated [15]. These intervals are therefore reported as approximate 95% uncertainty intervals (UIs) and should not be interpreted as official INE sampling errors. Full resampling specifications, cluster reconstruction, pseudo-stratification, recalibration procedures, and diagnostics are reported in Table S6.
For autonomous-community estimates, interpretability was assessed using prespecified criteria incorporating the unweighted number of cases, CV, proportion of bootstrap replicates with a zero numerator, and lower uncertainty limit. Regional estimates were categorized as Feasible, Feasible with caution, Exploratory, or Not recommended for stand-alone interpretation. These categories were developed for this study and are not official INE classifications. Detailed criteria and regional sensitivity results are provided in Table S7.
Analyses were conducted in R version 4.5.2 (R Foundation for Statistical Computing, Vienna, Austria), using reproducible analysis scripts and a fixed random seed (20260804) for bootstrap procedures. The main data-management and output procedures used the data.table and openxlsx packages. Analytical definitions, variable mappings, sensitivity analyses, and sampling diagnostics are documented in the Supplementary Materials. Generative artificial intelligence was used as an assistive tool for manuscript drafting, methodological documentation, and the development and review of R code. All analytical procedures, outputs, and interpretations were reviewed and validated by the authors.
The study consisted exclusively of secondary analysis of fully anonymized public-use microdata released by the INE. The investigators had no contact with survey participants and no access to direct personal identifiers. The original EDAD surveys were voluntary and conducted under the confidentiality requirements applicable to official Spanish statistics [8,9]. No additional participant consent was obtained for the present secondary analysis, and study-specific prospective ethics committee review was not required for the analysis of these anonymized public-use data. The study was conducted in accordance with applicable Spanish legislation and the ethical principles of the Declaration of Helsinki insofar as applicable to secondary research using anonymized data [16].
3. Results
3.1. Analytic Population and Participant Flow
The two complementary population frames included 169,296 unweighted records, representing a combined weighted population of 44,907,100 persons aged ≥6 years. EDAD-Households contributed 156,778 records, representing 44,529,089 persons, whereas EDAD-Centres contributed 12,518 records, representing 378,011 residents. Thus, the residential-setting component represented approximately 0.84% of the integrated weighted population (Table 1). Within the household survey, 11,650 participants received the detailed individual disability questionnaire following first-stage screening. The remaining household records did not receive the individual questionnaire because of the structural routing of the original survey and were retained in the population denominator rather than treated as having missing outcome information. Linkage between the household population file and the individual disability questionnaire was complete, with no duplicated linkage keys or unmatched individual questionnaires (Figure 1; Table S3).
Women represented 51.2% of the combined weighted population and men 48.8%. The integrated population comprised 32.2% persons aged 6–34 years, 47.0% aged 35–64 years, and 20.8% aged ≥65 years. The residential-setting population had a markedly older age distribution, with 84.8% aged ≥65 years, compared with 20.3% of the household population. Women represented 64.1% of the residential-setting population. Most residents lived in residential facilities for older persons (83.6% of the weighted residential population), followed by residential facilities for persons with disabilities (10.0%), supported or supervised housing (4.3%), and psychiatric or geriatric hospitals (2.1%) (Table 1).
3.2. Primary Prevalence of Functional Deafblindness
Using the restrictive reproducible primary case definition, 283 unweighted cases of functional deafblindness were identified: 92 among persons living in private households and 191 among persons living in residential settings. After application of the final survey weights, these observations represented an estimated 45,951 persons with functional deafblindness in the integrated population. The resulting crude prevalence was 102.3 per 100,000 population (approximate 95% UI, 82.5–125.1; CV, 10.7%) (Table 2; Figure 2A).
Prevalence differed markedly between population settings. Among persons living in private households, the estimated prevalence was 90.3 per 100,000 (95% UI, 70.6–113.1), corresponding to approximately 40,213 persons. Among persons living in residential settings, prevalence was 1517.9 per 100,000 (95% UI, 1254.1–1819.5), corresponding to approximately 5738 persons (Table 2; Figure 2A). The crude prevalence in residential settings was therefore approximately 16.8 times that observed in private households. Nevertheless, because the household population was substantially larger, approximately 87.5% of the estimated weighted cases were living in private households.
Because the household and residential surveys covered different reference periods, the combined estimate should be interpreted as a synthetic integrated prevalence estimate across complementary population frames rather than a single-year point prevalence.
3.3. Prevalence According to Sex and Age
Marked differences were also observed according to sex and, particularly, age (Table 2; Figure 2B). Among women, 193 unweighted cases represented approximately 29,631 persons, yielding a crude prevalence of 128.9 per 100,000 (95% UI, 98.9–163.1). Among men, 90 cases represented approximately 16,320 persons, corresponding to 74.4 per 100,000 (95% UI, 50.9–102.0). The crude female-to-male prevalence ratio was approximately 1.73. These estimates were not age-standardized, and no formal adjusted comparison between sexes was performed.
A particularly steep age gradient was observed. Prevalence was 6.0 per 100,000 among persons aged 6–34 years (95% UI, 0.0–14.7), 19.8 per 100,000 among those aged 35–64 years (95% UI, 8.8–32.7), and 438.0 per 100,000 among those aged ≥65 years (95% UI, 345.6–541.1) (Figure 2B). The prevalence among persons aged ≥65 years was approximately 22 times that among those aged 35–64 years. Persons aged ≥65 years accounted for 261 of the 283 unweighted cases and for approximately 40,904 of the 45,951 weighted cases (89.0%). Conversely, the estimate for the 6–34-year age group was based on only three unweighted cases and was highly imprecise (CV, 65.9%); it should therefore be interpreted with particular caution. Figure 2 summarizes the strong contrast between household and residential populations and the marked age gradient. The vertical dashed line in Figure 2B represents the overall integrated primary prevalence of 102.3 per 100,000.
3.4. Geographic Distribution
Primary crude prevalence estimates varied across autonomous communities and cities (Table 3; Figure 3). Point estimates ranged from 27.6 per 100,000 in Principado de Asturias to 178.8 per 100,000 in Castilla-La Mancha. Other comparatively high point estimates were observed in Comunidad Valenciana (157.3 per 100,000) and Comunidad de Madrid (126.7 per 100,000), whereas lower estimates included Comunidad de Navarre (31.1 per 100,000), Región de Murcia (40.1 per 100,000), and Extremadura (49.5 per 100,000).
Precision varied substantially among regions. Under the prespecified precision criteria, Andalucía, Comunidad de Valencia, and Comunidad de Madrid were classified as “Feasible”, whereas the Principado de Asturias, Castilla y León, Castilla-La Mancha, and Cataluña were classified as “Feasible with caution”. The remaining regional estimates were classified as exploratory or not recommended for stand-alone interpretation according to the prespecified criteria.
Approximate 95% UIs were wide for several autonomous communities and overlapped extensively. For example, the primary estimate for Castilla-La Mancha was 178.8 per 100,000 with an approximate 95% UI of 85.7–296.2, compared with 157.3 per 100,000 (75.8–253.5) in Comunidad de Valencia and 126.7 per 100,000 (61.2–207.9) in Comunidad de Madrid. Consequently, the regional estimates and Figure 3 should be interpreted as a descriptive representation of crude geographic variation and not as a statistical ranking of autonomous communities.
3.5. Sensitivity Analysis Using the Broader Case Definition
Application of the broader sensitivity definition identified 586 unweighted cases, corresponding to an estimated 90,846 persons and an integrated crude prevalence of 202.3 per 100,000 (95% UI, 175.8–231.2) (Table S4; Figure S1). This estimate was approximately 1.98 times the primary estimate of 102.3 per 100,000. The difference reflects the broader operational case definition and should not be interpreted as a temporal difference in prevalence. The principal demographic patterns remained evident under the broader definition. Prevalence was 275.2 per 100,000 among women (95% UI, 232.2–321.2) and 125.9 per 100,000 among men (95% UI, 97.2–158.7). Corresponding prevalence estimates were 7.2 per 100,000 among persons aged 6–34 years, 33.5 per 100,000 among those aged 35–64 years, and 885.7 per 100,000 among persons aged ≥65 years (Figure S1). Further subdivision of age under the broader definition yielded prevalence estimates of 12.3 per 100,000 at ages 18–34 years, 33.5 per 100,000 at ages 35–64 years, 285.3 per 100,000 at ages 65–79 years, and 2246.7 per 100,000 among persons aged ≥80 years. No sampled cases were identified in the 6–17-year group. Given the rarity of the outcome and the survey sampling structure, the absence of sampled cases in this group should not be interpreted as evidence of zero population prevalence.
The effect of broadening the operational definition was also evident geographically (Table S7; Figure S2). The broader definition produced a higher point estimate than the primary definition in each autonomous community or city, although the magnitude of the increase varied between territories and the ordering of regional estimates was not preserved. Thus, differences between the two series should primarily be interpreted as evidence of the sensitivity of absolute prevalence estimates to the operational definition rather than as evidence of geographic change.
Under the broader definition, regional point estimates ranged from approximately 110.3 per 100,000 in Ceuta to 377.7 per 100,000 in Castilla y León. Precision also improved in several regions because of the increased number of identified cases. Ten regional estimates met the prespecified “Feasible” criteria and five were classified as “Feasible with caution”, compared with seven regions meeting either of these two categories under the primary definition. Two estimates remained exploratory and two were not recommended for stand-alone interpretation. Figure S2 directly displays the primary and broader estimates and their approximate 95% UIs for all autonomous communities and cities. The extensive overlap of the uncertainty intervals, both within and between case definitions, further supports avoiding formal territorial ranking. Figure S3 provides the complementary geographic representation of the broader sensitivity definition.
3.6. Missing Data, Proxy Responses, and Robustness Analyses
The audit of the 22 sensory variables used for case ascertainment identified at least one explicit no-answer (NC) code in 259 of 11,650 household individual questionnaires (2.2%) and 648 of 12,518 residential-setting questionnaires (5.2%). No unexpected sensory response codes were identified. All questionnaire routes classified as incomplete coincided with the presence of an NC code, and no contradictory questionnaire-routing patterns were identified. No missing values were detected for age, sex, autonomous community, respondent type, or final survey weight (Table S3). In the deliberately conservative sensitivity analysis excluding every record containing any sensory NC code, the integrated primary estimate decreased only slightly, from 102.3 to 100.8 per 100,000, corresponding to a relative change of approximately −1.5%. The household estimate changed from 90.3 to 89.6 per 100,000 and the residential-setting estimate from 1517.9 to 1423.6 per 100,000. The broader integrated estimate was somewhat more sensitive to this exclusion, decreasing from 202.3 to 186.4 per 100,000 (Table S4). Separate bootstrap UIs were not calculated for this conservative NC-exclusion analysis. Proxy responses accounted for 35.3% of household individual questionnaires and 38.4% of residential-setting questionnaires. Among primary cases, proxy respondents represented an estimated 57.7% of weighted household cases and 53.1% of weighted residential-setting cases (Table S5). Sampling diagnostics identified 67,488 operational household clusters distributed across 73 pseudo-strata and 854 reconstructed residential-setting clusters across 55 pseudo-strata. Following the prespecified collapsing procedure, no singleton pseudo-strata remained. These structures were used for the 5000-replicate weighted cluster bootstrap. The resulting intervals should therefore be regarded as approximate uncertainty intervals rather than official INE sampling errors (Table S6).
4. Discussion
This study provides a population-based estimate of functional deafblindness in Spain incorporating both people living in private households and those living in residential settings. Using the restrictive primary definition, approximately 45,951 persons aged ≥6 years were estimated to have functional deafblindness, corresponding to 102.3 per 100,000 population. The broader sensitivity definition increased the estimate to 90,846 persons, or 202.3 per 100,000. Despite the approximately two-fold difference in absolute magnitude, both definitions reproduced the same main epidemiological pattern: a marked increase with age and a substantially higher prevalence in residential settings. These findings indicate that functional deafblindness affects a population measured in tens of thousands and is therefore sufficiently frequent to require explicit consideration in health, social-care, accessibility, and disability-service planning.
The difference between the primary and broader estimates illustrates a central difficulty in deafblindness epidemiology. There is no universally applied epidemiological case definition, and deafblindness, dual sensory impairment, and dual sensory loss often refer to substantially different populations. A recent scoping review identified 75 definitions across 153 primary studies, with prevalence varying according to age, sensory thresholds, assessment method, and population setting [2]. Similarly, the WFDB analysis of 22 national censuses and surveys estimated approximately 0.21% for severe deafblindness among people aged ≥5 years but approximately 2.1% when at least some concurrent visual and hearing difficulty was included [1]. These values therefore represent different levels of functional impairment rather than the boundaries of a single prevalence interval.
Against this background, our estimates occupy a plausible position within the international evidence. The primary estimate of 0.102% is lower than the approximately 0.21% reported by WFDB for severe deafblindness, whereas the sensitivity estimate of 0.202% is numerically close to it. An older national survey in Oman using objective visual and hearing assessment and relatively severe thresholds reported a prevalence of 0.246%, also of a similar order of magnitude [17]. However, numerical similarity should not be interpreted as methodological equivalence. Differences in age structure, functional thresholds, assistive-device use, clinical versus self-reported assessment, and inclusion of institutionalized populations prevent direct comparison between studies.
Much higher estimates are reported when the construct is broadened to clinically measurable dual sensory impairment, particularly among older adults. A recent systematic review and meta-analysis estimated a pooled prevalence of 5.50% (95% CI 2.88–10.26), but with extreme between-study heterogeneity and a predominance of older populations [3]. National or population-based studies have reported approximately 1.3–2.5% among Australians aged ≥50 years, around 6% among Canadians aged 45–85 years, 7.3% among Singaporean adults aged ≥60 years, and 22% among community-dwelling US adults aged ≥71 years assessed using objective sensory testing [18,19,20]–11]. In the latter study, prevalence reached 59% among persons aged ≥90 years. These figures should not be interpreted as estimates of severe functional deafblindness equivalent to our case definition; rather, they demonstrate how strongly prevalence increases when milder clinically detectable visual and hearing losses are included.
The same methodological effect is evident in studies based on self-reported sensory difficulty. Estimates of concurrent visual and hearing impairment have included 5.9% among adults aged ≥50 years across 11 European countries, 3.7% in a nationally representative English household sample, and 3.9% in the Spanish National Health Survey [21,22,23]. These studies used substantially broader constructs than the present analysis and did not require severe impairment in either sensory domain. The wide international range therefore does not indicate epidemiological inconsistency alone; it reflects differences in what is being measured. This distinction is particularly important when prevalence estimates are intended to inform service provision, as clinically detectable dual sensory loss, functional deafblindness requiring specific support, and administrative recognition represent overlapping but non-equivalent populations.
Our findings are more directly comparable with the previous Spanish analysis based on EDAD-Households 2020. That report estimated 229,948 persons (0.48%) when several scenarios of concurrent visual and hearing difficulty were combined without accounting for assistive products, whereas the estimate decreased to 34,137 persons (0.07%) when difficulties were required to persist despite their use [7]. The latter is of the same order of magnitude as our primary household estimate. The difference should not be interpreted as temporal change because the operational definitions are not identical. The previous report was also restricted to people living in private households, whereas the present study extends population coverage to residential settings.
The contrast with administrative identification is substantially greater. Only about one thousand persons were classified with deafblindness as their primary impairment in the Spanish State Database of Persons Assessed for Degree of Disability in 2020–2022 [24]. The database explicitly reflects people who have undergone formal disability assessment rather than the whole population, and classification depended on deafblindness being recorded as the principal impairment. Accordingly, the difference between approximately one thousand administrative records and several tens of thousands of functionally identified persons cannot be interpreted quantitatively as an “underdiagnosis rate”. It does, however, demonstrate that administrative recognition is not an appropriate denominator for estimating the potential population requiring deafblindness-related support.
Age was the strongest demographic pattern in our study. Under the primary definition, prevalence among persons aged ≥65 years was approximately 22 times that observed among those aged 35–64 years, and older adults accounted for most estimated cases. Under the broader definition, prevalence reached 2246.7 per 100,000 among persons aged ≥80 years. This pronounced gradient is consistent with the international literature and supports the expectation that demographic ageing will increase the population requiring assessment and support for combined sensory impairment, even if age-specific prevalence remains unchanged. At the same time, congenital and early-onset deafblindness should not be overlooked. International Multiple Indicator Cluster Surveys data estimated severe deafblindness in approximately 0.05% of children aged 2–17 years, while specialized registries and other studies produce lower or higher estimates depending on case definition [25]. Although numerically smaller, children and younger adults with deafblindness may require intensive and long-term educational, communication, family, and social support, which cannot be inferred from their population frequency alone.
The contribution of residential settings is another important finding. Residents represented approximately 0.84% of the integrated denominator but around 12.5% of estimated primary cases, and their crude prevalence was approximately 16.8 times that observed in private households. International evidence consistently identifies long-term care as a setting with a high burden of concurrent sensory impairment. Estimates include approximately 5–17% in different residential settings in the Netherlands, 18.2% among Japanese long-term care recipients, and approximately 25% in Canadian long-term care data [4,5,26]. An even higher estimate of 78.9% was reported in a small Singaporean residential sample, although a particularly sensitive audiological criterion was used and direct comparison is inappropriate [6]. These studies reinforce the importance of including institutionalized populations while simultaneously illustrating why prevalence from residential samples cannot simply be extrapolated to the general population.
Nevertheless, approximately 87.5% of the weighted primary cases in our analysis lived in private households. Planning should therefore combine systematic identification and communication accessibility within residential and long-term care facilities with adequately developed community services. The relevant needs may include sensory rehabilitation, assistive technologies, guide-interpreting and communication mediation, accessible health and social-care services, environmental adaptation, support for informal caregivers, and professionals trained to recognize the interaction between visual and hearing impairment. Prevalence cannot be translated mechanically into staffing ratios because support requirements vary considerably according to age at onset, residual sensory function, communication mode, comorbidity, cognitive status, living arrangement, and informal support. Nevertheless, whether the potentially relevant population is counted in hundreds, thousands, or tens of thousands fundamentally changes the scale at which services need to be considered.
This issue is especially relevant in the Spanish policy context. Law 27/2007 [27] explicitly recognized the need to determine the number of persons with deafblindness, their living conditions, and their geographical distribution to inform the resources required for this population. The 2023 national report similarly framed population measurement as a prerequisite for developing evidence-informed public policies and improving living conditions [7]. Subsequent regulations have further developed accessibility and specialized-support provisions. Our results therefore have implications beyond epidemiological description: future regulatory development, regional service portfolios, professional workforce planning, accessibility standards, and reference-service organization should be informed by population-based estimates in addition to administrative records and current service utilization.
Reliable measurement is particularly important for a relatively low-frequency disability at risk of statistical and service invisibility. If resource planning is based predominantly on persons already formally identified or using specialized services, unmet need may remain hidden. This may generate a self-reinforcing process in which limited recognition leads to limited service provision, which in turn reduces opportunities for identification and referral. WFDB has highlighted the risk that persons with deafblindness are excluded both from disability-specific programmes and from mainstream services because of communication barriers, limited professional expertise, and insufficient recognition of their specific needs [1,28]. Accurate population estimates cannot by themselves guarantee adequate services, but they are a necessary basis for estimating their potential scale and for preventing a relatively small and heterogeneous sector of society from being systematically overlooked.
The geographical results may also assist service planning, although they should be interpreted cautiously. Crude point estimates varied substantially across autonomous communities, but uncertainty intervals were wide and frequently overlapped, and several estimates relied on small numbers of sampled cases. Regional results should therefore be regarded as exploratory rather than as a ranking of territories. Nevertheless, geographical information is relevant when determining how highly specialized resources should be organized. For a dispersed, relatively uncommon disability, an appropriate model may require a balance between national or supraregional reference expertise, regional professional networks, and accessible local or community-based support. Future analyses using larger samples and age-standardized estimates would provide a stronger basis for such territorial planning.
Several strengths support the present findings. The analysis integrated two complementary nationally representative population frames, included persons living in residential settings, applied an explicit and reproducible functional definition, examined an alternative sensitivity definition, used survey weights, and quantified statistical uncertainty. However, several limitations should be acknowledged. EDAD-Households and EDAD-Centres correspond to different survey periods, and the integrated estimate should therefore be regarded as a synthetic prevalence estimate rather than a single-year point prevalence. Deafblindness was operationalized from functional survey responses rather than specialist ophthalmological, audiological, and deafblindness-specific assessment. Proxy responses were frequent, particularly among cases. In addition, the public-use data did not permit exact reproduction of the official INE variance-estimation procedure, and the reported uncertainty intervals are therefore approximate rather than official sampling errors. Finally, sex-, age-, and regional estimates were crude and were not age-standardized, and rare-event sampling resulted in considerable uncertainty in younger age groups and several autonomous communities.
Overall, our findings place the prevalence of functional deafblindness in Spain at approximately 0.10% under a restrictive definition and 0.20% under a broader sensitivity definition. International evidence indicates that substantially higher figures arise when milder sensory losses, older populations, or residential settings are studied, reinforcing the need to interpret prevalence in relation to the underlying case definition. The exact numerical boundary of deafblindness remains methodologically uncertain, but the policy implication is less ambiguous: the potentially affected population is considerably larger than suggested by specialist administrative classifications and is large enough to require deliberate planning. Improving epidemiological visibility is therefore not merely a statistical objective; it is a prerequisite for anticipating support needs, distributing specialized expertise, developing accessible services, and ensuring that persons with deafblindness are not left outside the health, social-care, accessibility, and disability policies intended to promote autonomy and participation.
5. Conclusions
This study provides a population-based estimate of functional deafblindness in Spain that incorporates both people living in private households and those living in residential settings. Depending on the operational definition applied, an estimated 45,951 to 90,846 persons aged ≥6 years may experience functionally relevant combined visual and hearing impairment, corresponding to approximately 102–202 per 100,000 population. The consistency of the main patterns across definitions—particularly the marked age gradient and the substantially higher prevalence in residential settings—supports the robustness of the overall epidemiological picture. These estimates are substantially higher than the number of people identified through specific administrative classifications and highlight the distinction between population-level functional deafblindness and formal administrative recognition. At the same time, the wide variation in prevalence reported internationally confirms that estimates are strongly dependent on case definition, age structure, assessment method, and residential setting; consequently, comparisons between countries require careful methodological interpretation.
The findings have implications beyond epidemiological description. Reliable estimates of the magnitude and geographic distribution of deafblindness are necessary to anticipate needs for specialized communication support, rehabilitation, assistive technologies, accessible health and social care, trained professionals, and appropriately distributed reference and community services. This is particularly relevant in an ageing population, while recognizing that people with congenital or early-onset deafblindness may have less frequent but highly intensive and lifelong support needs. Future disability policies and regulatory developments should therefore be informed by population-based evidence in addition to administrative records and current service utilization. Improving the epidemiological visibility of deafblindness is an essential step toward ensuring that the scale of services reflects the population potentially requiring them and that people with deafblindness are not overlooked in the planning of health, social-care, accessibility, and disability policies.
Supplementary Materials
The following supporting information can be downloaded at the website of this paper posted on Preprints.org, Supplementary Methods S1: Extended Methods and Analytical Procedures; Table S1: STROBE checklist for reporting the present cross-sectional study; Table S2: Questionnaire variables, response categories, and operational construction of the primary and broader functional deafblindness case definitions; Table S3: Data-quality audit, questionnaire routing, linkage, and sensory-item non-response; Table S4: Sensitivity analyses using the broader case definition and conservative exclusion of sensory no-answer codes; Table S5: Distribution of direct and proxy responses; Table S6: Operational resampling structure and diagnostics for the weighted cluster bootstrap; Table S7: Crude prevalence by autonomous community under the broader sensitivity case definition; Figure S1: Comparison of primary and broader prevalence estimates by population setting, sex, and age; Figure S2: Comparison of primary and broader prevalence estimates by autonomous community; Figure S3: Geographic distribution of prevalence under the broader sensitivity definition.
Author Contributions
Conceptualization, M.d.M., J.C. and D.; methodology, M.d.M., J.C. and D.; formal analysis, J.C.; visualization, M.d.M.; writing—original draft preparation, M.d.M., J.C. and D.; writing—review and editing, M.d.M., J.C. and D. All authors have read and agreed to the published version of the manuscript and agree to be accountable for all aspects of the work.
Funding
This research received no external funding.
Informed Consent Statement
Informed consent was not required for this secondary analysis of anonymized public-use data. The investigators had no access to participant identifiers and no possibility of contacting individual respondents.
Data Availability Statement
The anonymized public-use microdata analyzed in this study are publicly available from the Spanish National Statistics Institute (Instituto Nacional de Estadistica, INE) through the EDAD-Households 2020 and EDAD-Centres 2023 data resources. Individual-level microdata are not redistributed with this article or in the associated reproducibility repository. The original R scripts used for data processing, construction of the primary and sensitivity case definitions, prevalence estimation, bootstrap uncertainty analysis, and generation of aggregate analytical outputs, together with derived aggregate tables and reproducibility documentation, are available in Zenodo at https://doi.org/10.5281/zenodo.21843639. The repository licenses apply only to original study code, documentation, methodological materials, and aggregate outputs and do not relicense the underlying INE source data.
Acknowledgments
The authors thank the Spanish National Statistics Institute (Instituto Nacional de Estadística, INE) for making the anonymized public-use microdata and methodological documentation of EDAD-Households 2020 and EDAD-Centres 2023 publicly available. During the preparation of this manuscript and its reproducibility materials, the authors used ChatGPT (OpenAI, GPT-5.6 Sol) to assist with manuscript drafting and language refinement, methodological documentation, and the development and review of R code. All analytical decisions, code, calculations, statistical outputs, interpretations, and final text were critically reviewed and validated by the authors, who take full responsibility for the content of this publication.
Conflicts of Interest
All authors are members of the Board of Directors of APASCIDE (Asociación Española de Familias de Personas con Sordoceguera): María del Mar [surname] serves as a Board Member, Juan C. [surname] as Secretary, and Dolores [surname] as President. APASCIDE is a non-profit family association that advocates for the rights and inclusion of persons with deafblindness and their families and promotes research and knowledge generation concerning deafblindness, its causes, detection, services, and social inclusion. APASCIDE promoted the undertaking of the present study as part of this institutional mission. APASCIDE receives public funding from the Spanish Ministry of Social Rights, Consumer Affairs and 2030 Agenda, including funding for activities related to good practices and knowledge generation in deafblindness and institutional support for the maintenance of the association. These affiliations and institutional interests are disclosed as potential non-financial and institutional financial interests. The Ministry had no role in the design, analysis, interpretation, manuscript preparation, or decision to publish the present study. All analytical decisions, interpretations, and conclusions are the responsibility of the authors. The authors declare no personal financial conflicts of interest.
Disability Language/Terminology Positionality Statement
All authors serve on the Board of Directors of APASCIDE (Asociación Española de Familias de Personas con Sordoceguera), a family association that advocates for the rights, inclusion, and support of persons with deafblindness and their families and promotes research to improve knowledge of deafblindness, its causes and detection, and the development of appropriate services and supports. This institutional and advocacy perspective contributed to identifying the epidemiological visibility of deafblindness as a relevant research question. The authors use predominantly person-first language (e.g., “persons with deafblindness” and “people with deafblindness”) throughout this manuscript. This choice reflects terminology commonly used in the Spanish disability context and by APASCIDE. We recognize that preferences regarding person-first and identity-first language vary among individuals and communities, and that some people may identify as deafblind and prefer identity-first terminology. In this study, the term “functional deafblindness” is used specifically to describe the operational epidemiological construct derived from concurrent visual and hearing functional limitations in the EDAD surveys; it should not be interpreted as a clinical diagnosis or as implying that all individuals meeting the study criteria self-identify as deafblind. The terms “dual sensory impairment” and “dual sensory loss” are retained when referring to previous studies that used those terms and are not assumed to be fully equivalent to deafblindness as a distinct disability. Throughout the manuscript, terminology was selected to emphasize dignity, heterogeneity, participation, and the interaction between individual functioning and environmental barriers rather than to portray disability solely as an individual deficit.
Abbreviations
The following abbreviations are used in this manuscript:
| CI | Confidence Interval |
| CV | Coefficient of Variation |
| EDAD | Survey on Disability, Personal Autonomy and Dependency Situations (Encuesta de Discapacidad, Autonomía Personal y Situaciones de Dependencia) |
| INE | Spanish National Statistics Institute (Instituto Nacional de Estadística) |
| NC | No Answer/Non-response (No contesta) |
| STROBE | Strengthening the Reporting of Observational Studies in Epidemiology |
| UI | Uncertainty Interval |
| WFDB | World Federation of the Deafblind |
References
- World Federation of the Deafblind (WFDB). At Risk of Exclusion from CRPD and SDGs Implementation: Inequality and Persons with Deafblindness. In itial Global Report on Situation and Rights of Persons with Deafblindness; WFDB: Brussels, Belgium, 2018; Available online: https://wfdb.eu/wfdb-report-2018/ (accessed on 6 August 2026).
- Bright, T.; Ramke, J.; Zhang, J.H.; Kitema, G.F.; Safi, S.; Mdala, S.; Yoshizaki, M.; Brennan-Jones, C.G.; Mactaggart, I.; Gordon, I.; et al. Prevalence and Impact of Combined Vision and Hearing (Dual Sensory) Impairment: A Scoping Review. PLoS Glob. Public Health 2023, 3, e0001905. [Google Scholar] [CrossRef]
- Yeo, B.S.Y.; Gao, E.Y.; Tan, B.K.J.; Ong, B.D.C.; Cho, R.W.Y.; Lim, C.Y.; Man, R.E.K.; Fenwick, E.K.; Gupta, P.; Chen, C.L.-H.; et al. Dual Sensory Impairment: Global Prevalence, Future Projections, and Its Association with Cognitive Decline. Alzheimers Dement. 2025, 21, e14465. [Google Scholar] [CrossRef] [PubMed]
- Guthrie, D.M.; Williams, N.; Jaiswal, A.; Mick, P.; O’Rourke, H.M.; Pichora-Fuller, M.K.; Wittich, W.; Sutradhar, R. Prevalence of Sensory Impairments in Home Care and Long-Term Care Using interRAI Data from across Canada. BMC Geriatr. 2022, 22(944), 03671–7. [Google Scholar] [CrossRef] [PubMed]
- Mitoku, K.; Masaki, N.; Ogata, Y.; Okamoto, K. Vision and Hearing Impairments, Cognitive Impairment and Mortality among Long-Term Care Recipients: A Population-Based Cohort Study. BMC Geriatr. 2016, 16(112), 0286–2. [Google Scholar] [CrossRef] [PubMed]
- Ho, K.C.; Fenwick, E.K.; Gupta, P.; Gan, A.; Loo, J.H.; Ma, L.; Koh, G.; Wong, T.Y.; Lamoureux, E.L.; Man, R.E. Prevalence, Associated Factors and Health-Related Quality of Life of Dual Sensory Impairment in Residential Care Facilities in Singapore. Ophthalmic Epidemiol. 2022, 29, 310–318. [Google Scholar] [CrossRef] [PubMed]
- Bascones Serrano, L.M.; Martínez Madrigal, B. Estudio sobre la Situación de las Personas Sordociegas en España: Informe Final; ILUNION Accesibilidad, Real Patronato sobre Discapacidad, Ministerio de Derechos Sociales y Agenda 2030: Madrid, Spain, 2023. Available online: https://www.rpdiscapacidad.gob.es/estudios-publicaciones/Sordoceguera_En_Espana.htm (accessed on 6 August 2026).
- Instituto Nacional de Estadística (INE). Encuesta de Discapacidad, Autonomía Personal y Situaciones de Dependencia. Personas Residentes en Centros 2023 (EDAD Centros 2023): Metodología; Instituto Nacional de Estadística: Madrid, Spain, 2024; Available online: https://ine.es/metodologia/t15/meto_edad_2023.pdf (accessed on 8 May 2026).
- Instituto Nacional de Estadística (INE). Encuesta de Discapacidad, Autonomía y Situaciones de Dependencia 2020 (EDAD 2020): Metodología; Instituto Nacional de Estadística: Madrid, Spain, 2022; Available online: https://ine.es/metodologia/t15/meto_edad_2020.pdf (accessed on 8 May 2026).
- Dewidar, O.; Shamseer, L.; Melendez-Torres, G.J.; Akl, E.A.; Ramke, J.; Wang, X.; Oloyede, O.; Young, T.; Nicholls, S.G.; Marshall, Z.; et al. Improving the Reporting on Health Equity in Observational Research (STROBE-Equity): Extension Checklist and Elaboration. BMJ 2025, 390, e083882. [Google Scholar] [CrossRef] [PubMed]
- Sitter, R.R. A Resampling Procedure for Complex Survey Data. J. Am. Stat. Assoc. 1992, 87, 755–765. [Google Scholar] [CrossRef]
- Rao, J.N.K.; Wu, C.F.J. Resampling Inference with Complex Survey Data. J. Am. Stat. Assoc. 1988, 83, 231–241. [Google Scholar] [CrossRef]
- Rust, K.F.; Rao, J.N. Variance Estimation for Complex Surveys Using Replication Techniques. Stat. Methods Med. Res. 1996, 5, 283–310. [Google Scholar] [CrossRef] [PubMed]
- Deville, J.-C.; Särndal, C.-E. Calibration Estimators in Survey Sampling. J. Am. Stat. Assoc. 1992, 87, 376–382. [Google Scholar] [CrossRef]
- Davison, A.C.; Hinkley, D.V. Bootstrap Methods and Their Application. In Cambridge Series in Statistical and Probabilistic Mathematics; Cambridge University Press: Cambridge, UK, 1997; ISBN 978-0-521-57471-6. [Google Scholar]
- World Medical Association World Medical Association Declaration of Helsinki: Ethical Principles for Medical Research Involving Human Participants. JAMA 2025, 333, 71–74. [CrossRef] [PubMed]
- Khandekar, R.; Al Khabori, M. Double Disability: The Hearing-Impaired Blind in the Sultanate of Oman. Int. J. Audiol. 2004, 43, 172–176. [Google Scholar] [CrossRef] [PubMed]
- Gopinath, B.; Macken, O.; Kha, R.; Low, G.; Kapucu, Y.; Newall, J.; Waddell, C.; Fricke, T.; Yang, E.; Indrakumar, M.; et al. Prevalence of Dual Sensory Impairment in Australia: A Nationally Representative Population-Based Survey of Indigenous and Non-Indigenous Australians. Lancet Reg. Health West. Pac. 2026, 71, 101897. [Google Scholar] [CrossRef] [PubMed]
- Mick, P.T.; Hämäläinen, A.; Kolisang, L.; Pichora-Fuller, M.K.; Phillips, N.; Guthrie, D.; Wittich, W. The Prevalence of Hearing, Vision, and Dual Sensory Loss in Older Canadians: An Analysis of Data from the Canadian Longitudinal Study on Aging. Can. J. Aging Rev. Can. Vieil. 2021, 40, 1–22. [Google Scholar] [CrossRef] [PubMed]
- Garcia Morales, E.E.; Reed, N.S.; Zhou, Y.; Assi, S.; Varadaraj, V.; Lin, F.R.; Ehrlich, J.R.; Deal, J.A. Population Prevalence of Dual Sensory Loss in Community-Dwelling US Adults 71 Years and Older: Evidence from the National Health and Aging Trends Study. J. Am. Geriatr. Soc. 2024, 72, 536–543. [Google Scholar] [CrossRef] [PubMed]
- Viljanen, A.; Törmäkangas, T.; Vestergaard, S.; Andersen-Ranberg, K. Dual Sensory Loss and Social Participation in Older Europeans. Eur. J. Ageing 2014, 11, 155–167. [Google Scholar] [CrossRef] [PubMed]
- Khurana, M.; Shoham, N.; Cooper, C.; Pitman, A.L. Association between Sensory Impairment and Suicidal Ideation and Attempt: A Cross-Sectional Analysis of Nationally Representative English Household Data. BMJ Open 2021, 11, e043179. [Google Scholar] [CrossRef] [PubMed]
- Pardhan, S.; Smith, L.; Bourne, R.; Davis, A.; Leveziel, N.; Jacob, L.; Koyanagi, A.; López-Sánchez, G.F. Combined Vision and Hearing Difficulties Results in Higher Levels of Depression and Chronic Anxiety: Data From a Large Sample of Spanish Adults. Front. Psychol. 2021, 11, 627980. [Google Scholar] [CrossRef] [PubMed]
- Instituto de Mayores y Servicios Sociales (IMSERSO). Base Estatal de Datos de Personas con Discapacidad [Data Set]. Available online: https://datos.gob.es/es/catalogo/ea0043088-estatal-datos-personas-con-discapacidad (accessed on 8 August 2026).
- Rotenberg, S.; Davey, C.; Banks, L.M. Health, Education and Well-Being for Children with Deafblindness: A Secondary Analysis of 36 Multiple Indicator Cluster Surveys. Arch. Dis. Child. 2025, 110, 480–486. [Google Scholar] [CrossRef] [PubMed]
- Vaal, J.; Gussekloo, J.; de Klerk, M.M.; Frijters, D.H.; Evenhuis, H.M.; van Beek, A.P.; van Nispen, R.M.; Smits, C.; Deeg, D.J.; LEGend. 2007; pp. 1459–1463.
- Jefatura del Estado. Ley 27/2007, de 23 de octubre, por la que se reconocen las lenguas de signos españolas y se regulan los medios de apoyo a la comunicación oral de las personas sordas, con discapacidad auditiva y sordociegas. Boletín Of. Del Estado 2007, 255, 43251–43259. Available online: https://www.boe.es/eli/es/l/2007/10/23/27 (accessed on 8 August 2026).
- World Federation of the Deafblind (WFDB). WFDB Second Global Report 2023: Good Practices and Recommendations for the Inclusion of Persons with Deafblindness; World Federation of the Deafblind: Brussels, Belgium, 2023; Available online: https://wfdb.eu/wfdb-report-2022/ (accessed on 8 August 2026).
- Jefatura del Estado. Ley 14/2007, de 3 de julio, de Investigación Biomédica. Boletín Of. Del Estado 2007, 159, 28826–28848. Available online: https://www.boe.es/eli/es/l/2007/07/03/14 (accessed on 8 August 2026).
- European Parliament; Council of the European Union. Regulation (EU) 2016/679 of the European Parliament and of the Council of 27 April 2016 on the Protection of Natural Persons with Regard to the Processing of Personal Data and on the Free Movement of Such Data, and Repealing Directive 95/46/EC (General Data Protection Regulation). Off. J. Eur. Union 2016, L 119, 1–88. Available online: https://eur-lex.europa.eu/eli/reg/2016/679/oj (accessed on 8 August 2026).
Figure 1.
Participant flow and construction of the integrated analytical population. Flow diagram showing the construction of the analytical population from EDAD-Households 2020 and EDAD-Centres 2023, including the household questionnaire structure, residential-setting population, identification of primary functional deafblindness cases, and integration of the two complementary population frames. The combined analytical population comprised 169,296 unweighted records representing 44,907,100 persons aged ≥6 years. The integrated estimate should be interpreted as a synthetic estimate across complementary population frames because the household and residential-setting surveys refer to different survey periods.
Figure 1.
Participant flow and construction of the integrated analytical population. Flow diagram showing the construction of the analytical population from EDAD-Households 2020 and EDAD-Centres 2023, including the household questionnaire structure, residential-setting population, identification of primary functional deafblindness cases, and integration of the two complementary population frames. The combined analytical population comprised 169,296 unweighted records representing 44,907,100 persons aged ≥6 years. The integrated estimate should be interpreted as a synthetic estimate across complementary population frames because the household and residential-setting surveys refer to different survey periods.
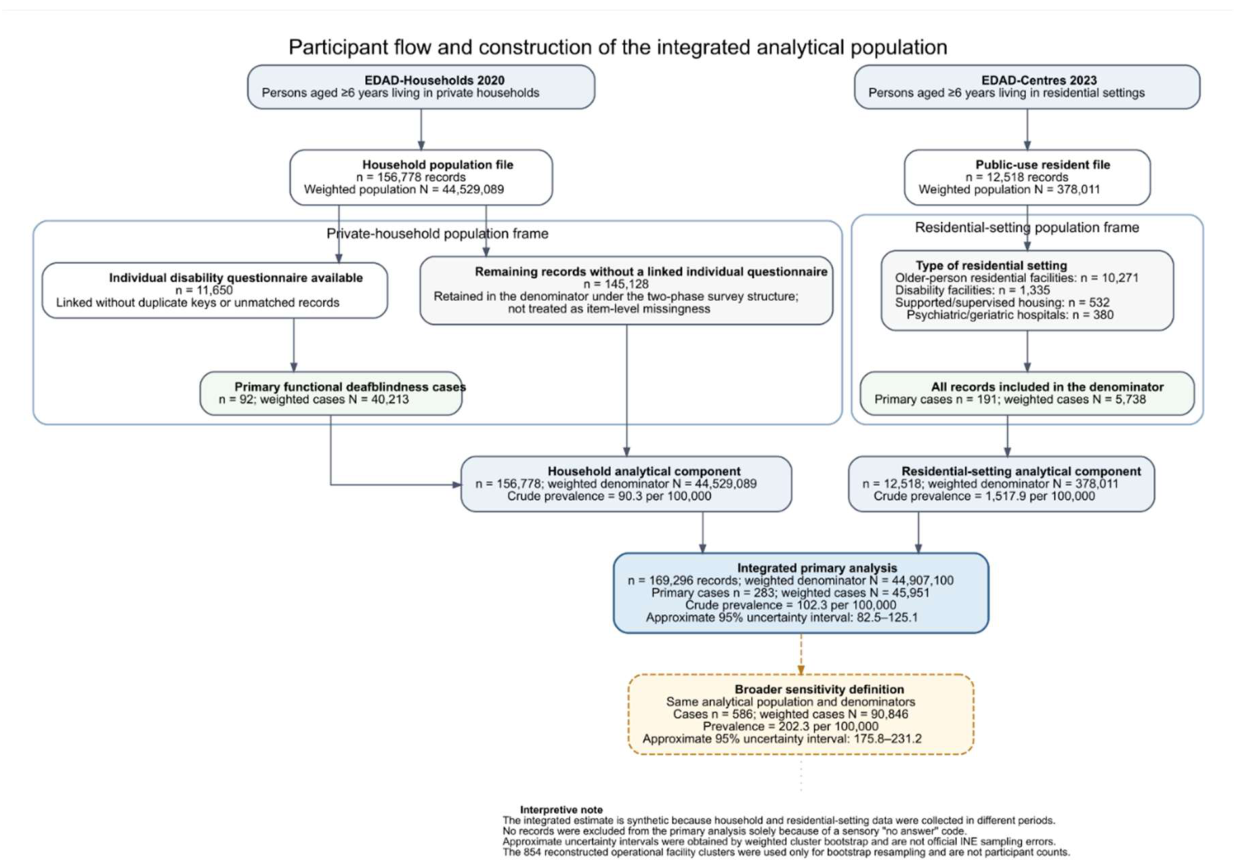
Figure 2.
Crude prevalence of functional deafblindness according to population setting, sex, and age group under the primary case definition. (A) Overall integrated population and estimates for private households and residential settings. (B) Estimates according to sex and age group. Points represent crude prevalence estimates per 100,000 population and horizontal lines represent approximate 95% uncertainty intervals obtained using the weighted cluster bootstrap. The vertical dashed line in panel B indicates the overall integrated prevalence (102.3 per 100,000). Sex- and age-specific estimates were not age-standardized.
Figure 2.
Crude prevalence of functional deafblindness according to population setting, sex, and age group under the primary case definition. (A) Overall integrated population and estimates for private households and residential settings. (B) Estimates according to sex and age group. Points represent crude prevalence estimates per 100,000 population and horizontal lines represent approximate 95% uncertainty intervals obtained using the weighted cluster bootstrap. The vertical dashed line in panel B indicates the overall integrated prevalence (102.3 per 100,000). Sex- and age-specific estimates were not age-standardized.
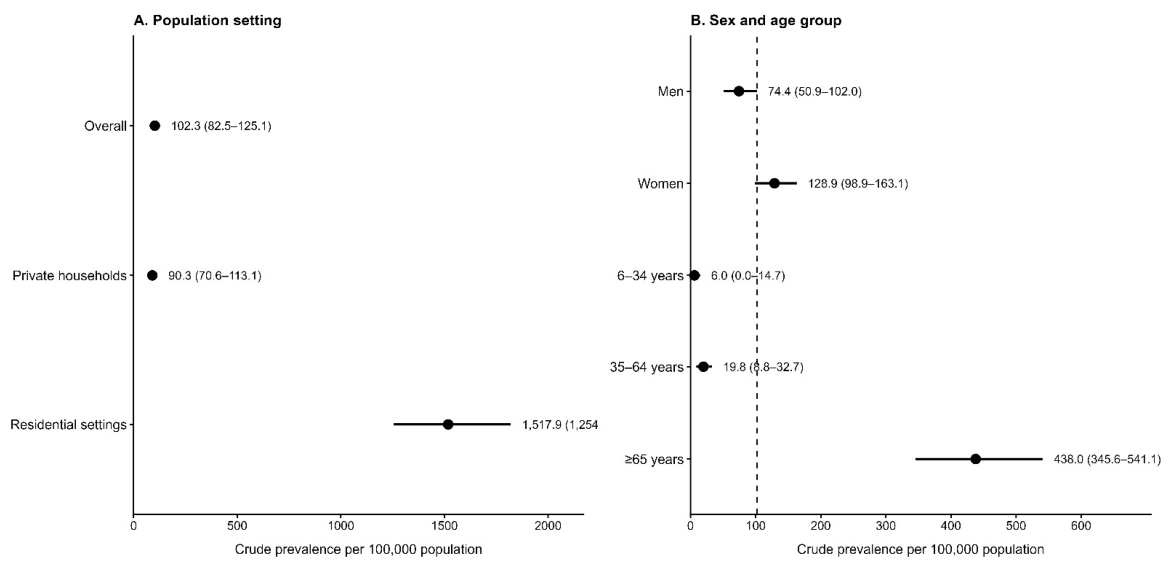
Figure 3.
Geographic distribution of crude functional deafblindness prevalence by autonomous community under the primary case definition. The map shows crude prevalence estimates per 100,000 population aged ≥6 years obtained by synthetically integrating EDAD-Households 2020 and EDAD-Centres 2023. Estimates were not age-standardized. The map displays point estimates only and is intended to provide a descriptive representation of geographic variation rather than a statistical ranking of autonomous communities. Regional uncertainty intervals and precision classifications are reported in Table 3. Geographic boundaries were obtained from Eurostat GISCO through the mapSpain package; the Canary Islands were relocated for cartographic display only.
Figure 3.
Geographic distribution of crude functional deafblindness prevalence by autonomous community under the primary case definition. The map shows crude prevalence estimates per 100,000 population aged ≥6 years obtained by synthetically integrating EDAD-Households 2020 and EDAD-Centres 2023. Estimates were not age-standardized. The map displays point estimates only and is intended to provide a descriptive representation of geographic variation rather than a statistical ranking of autonomous communities. Regional uncertainty intervals and precision classifications are reported in Table 3. Geographic boundaries were obtained from Eurostat GISCO through the mapSpain package; the Canary Islands were relocated for cartographic display only.
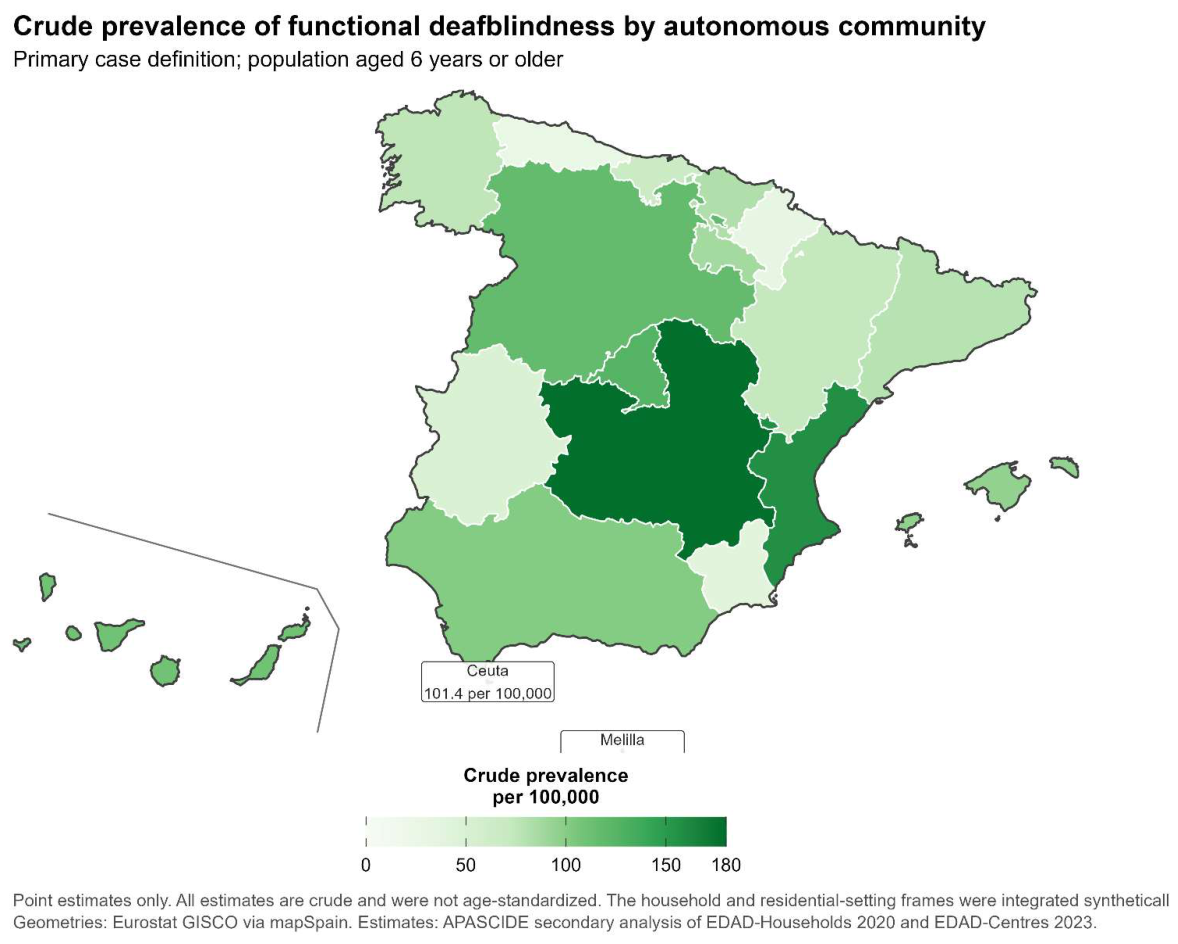

Table 1.
Characteristics of the analytic population setting.
| Panel A. Population-frame characteristics | ||||||||||
|---|---|---|---|---|---|---|---|---|---|---|
| Characteristic | Category | Household n | Household weighted N | Household weighted % | Residential n | Residential weighted N | Residential weighted % | Combined n | Combined weighted N | Combined weighted % |
| Population frame | Total | 156.778 | 44.529.089 | 100,0 | 12.518 | 378.011 | 100,0 | 169.296 | 44.907.100 | 100,0 |
| Sex | Men | 76.030 | 21.789.748 | 48,9 | 4.594 | 135.703 | 35,9 | 80.624 | 21.925.451 | 48,8 |
| Sex | Women | 80.748 | 22.739.341 | 51,1 | 7.924 | 242.309 | 64,1 | 88.672 | 22.981.649 | 51,2 |
| Age group | 6–34 years | 46.791 | 14.444.331 | 32,4 | 283 | 7.789 | 2,1 | 47.074 | 14.452.120 | 32,2 |
| Age group | 35–64 years | 77.193 | 21.065.394 | 47,3 | 1.776 | 49.764 | 13,2 | 78.969 | 21.115.157 | 47,0 |
| Age group | ≥65 years | 32.794 | 9.019.364 | 20,3 | 10.459 | 320.459 | 84,8 | 43.253 | 9.339.823 | 20,8 |
| Panel B. Composition of the EDAD-Centres residential-setting frame | ||||||||||
| Type of residential setting | Unweighted n | Unweighted % | Weighted N | Weighted % | Survey code | Scope | ||||
| Residential care facilities for older persons | 10.271 | 82,0 | 316.154 | 83,64 | 1 | Residential-setting frame only | ||||
| Residential facilities for persons with disabilities | 1.335 | 10,7 | 37.669 | 9,96 | 2 | Residential-setting frame only | ||||
| Supported or supervised housing | 532 | 4,2 | 16.285 | 4,31 | 3 | Residential-setting frame only | ||||
| Psychiatric or geriatric hospitals | 380 | 3,0 | 7.903 | 2,09 | 4 | Residential-setting frame only | ||||
| Total | 12.518 | 100,0 | 378.011 | 100,00 | Residential-setting frame only | |||||
Notes: Prevalence estimates are expressed per 100,000 population aged ≥6 years and combine the complementary EDAD-Households 2020 and EDAD-Centres 2023 population frames. n, unweighted number of cases; UI, uncertainty interval; CV, coefficient of variation. Approximate 95% UIs and CVs were obtained using the weighted cluster bootstrap and are not official INE sampling errors. Estimates are crude and were not age-standardized. Regional precision categories (Feasible, Feasible with caution, Exploratory, and Not recommended for stand-alone interpretation) were defined a priori for this study using the unweighted number of cases, CV, proportion of bootstrap replicates with a zero numerator, and lower 95% UI; they are not official INE reliability classifications. Regional estimates are intended for descriptive comparison and should not be interpreted as a statistical ranking of autonomous communities.
Table 2.
Crude prevalence of functional deafblindness under the primary case definition, overall and according to population setting, sex, and age group.
Table 2.
Crude prevalence of functional deafblindness under the primary case definition, overall and according to population setting, sex, and age group.
| Setting | Population component | Cases n | Estimated cases N | Weighted population N | Crude prevalence per 100,000 | Approx. 95% UI lower | Approx. 95% UI upper | CV, % | Precision | |
|---|---|---|---|---|---|---|---|---|---|---|
| Total | Integrated household + residential frames | 283 | 45.951 | 44.907.100 | 102,3 | 82,5 | 125,1 | 10,7 | Acceptable precision | |
| Private households | EDAD-Households 2020 | 92 | 40.213 | 44.529.089 | 90,3 | 70,6 | 113,1 | 12,1 | Acceptable precision | |
| Residential settings | EDAD-Centres 2023 | 191 | 5.738 | 378.011 | 1517,9 | 1254,1 | 1819,5 | 9,5 | Acceptable precision | |
| Sex | Men | Integrated household + residential frames | 90 | 16.320 | 21.925.451 | 74,4 | 50,9 | 102,0 | 17,6 | Acceptable precision |
| Women | Integrated household + residential frames | 193 | 29.631 | 22.981.649 | 128,9 | 98,9 | 163,1 | 12,6 | Acceptable precision | |
| Age | 6–34 years | Integrated household + residential frames | 3 | 865 | 14.452.120 | 6,0 | 0,0 | 14,7 | 65,9 | Very low precision: n<5 |
| 35–64 years | Integrated household + residential frames | 19 | 4.182 | 21.115.157 | 19,8 | 8,8 | 32,7 | 31,2 | Caution: CV 30–40% | |
| ≥65 years | Integrated household + residential frames | 261 | 40.904 | 9.339.823 | 438,0 | 345,6 | 541,1 | 11,4 | Acceptable precision | |
Notes: Prevalence estimates are expressed per 100,000 population and were calculated using the final person-level survey weights provided by the Spanish National Statistics Institute (INE). n, unweighted number of cases; N, weighted estimated number of cases; UI, uncertainty interval; CV, coefficient of variation. Approximate 95% UIs and CVs were obtained using a 5000-replicate weighted cluster bootstrap and should not be interpreted as official INE sampling errors. Estimates by sex and age are crude and were not age-standardized. The integrated estimate combines EDAD-Households 2020 and EDAD-Centres 2023 and should therefore be interpreted as a synthetic integrated prevalence estimate rather than as a single-year point prevalence.
Table 3.
Crude prevalence of functional deafblindness by autonomous community under the primary case definition.
Table 3.
Crude prevalence of functional deafblindness by autonomous community under the primary case definition.
| Autonomous community | Cases: n | Estimated cases: N | Weighted population: N | Crude prevalence per 100,000 | Approx. 95% UI lower | Approx. 95% UI upper | CV, % | Zero-numerator replicates, % | Reporting category |
|---|---|---|---|---|---|---|---|---|---|
| Andalucía | 32 | 8.149 | 8.022.357 | 101,6 | 56,4 | 154,5 | 24,4 | 0,00 | Feasible |
| Aragón | 9 | 918 | 1.261.303 | 72,8 | 14,3 | 149,5 | 47,3 | 0,18 | Exploratory |
| Principado de Asturias | 11 | 271 | 979.369 | 27,6 | 11,6 | 46,4 | 32,6 | 0,00 | Feasible with caution |
| Illes Balears | 23 | 1.098 | 1.153.572 | 95,2 | 33,5 | 182,7 | 40,5 | 0,00 | Exploratory |
| Canarias | 23 | 2.358 | 2.143.576 | 110,0 | 31,4 | 209,8 | 41,9 | 0,00 | Exploratory |
| Cantabria | 11 | 376 | 560.117 | 67,1 | 20,6 | 129,1 | 42,1 | 0,00 | Exploratory |
| Castilla y León | 25 | 2.679 | 2.283.437 | 117,3 | 52,2 | 199,0 | 32,0 | 0,00 | Feasible with caution |
| Castilla-La Mancha | 24 | 3.465 | 1.938.551 | 178,8 | 85,7 | 296,2 | 30,1 | 0,00 | Feasible with caution |
| Cataluña | 38 | 5.741 | 7.246.777 | 79,2 | 31,5 | 145,9 | 36,8 | 0,00 | Feasible with caution |
| Comunitat Valenciana | 17 | 7.530 | 4.787.416 | 157,3 | 75,8 | 253,5 | 29,2 | 0,00 | Feasible |
| Extremadura | 7 | 499 | 1.008.066 | 49,5 | 5,7 | 114,2 | 58,4 | 0,06 | Not recommended |
| Galicia | 10 | 1.962 | 2.587.372 | 75,8 | 19,1 | 146,8 | 43,1 | 0,00 | Exploratory |
| Comunidad de Madrid | 23 | 8.069 | 6.366.178 | 126,7 | 61,2 | 207,9 | 29,9 | 0,00 | Feasible |
| Región de Murcia | 6 | 569 | 1.419.110 | 40,1 | 1,4 | 101,1 | 66,9 | 0,48 | Not recommended |
| Comunidad Foral de Navarra | 4 | 193 | 619.809 | 31,1 | 2,4 | 83,4 | 76,3 | 1,56 | Not recommended |
| País Vasco | 11 | 1.701 | 2.077.012 | 81,9 | 21,0 | 160,9 | 44,2 | 0,00 | Exploratory |
| La Rioja | 6 | 262 | 299.469 | 87,4 | 7,5 | 188,7 | 53,8 | 0,80 | Not recommended |
| Ceuta | 2 | 61 | 60.493 | 101,4 | 0,0 | 300,1 | 90,6 | 11,56 | Not recommended |
| Melilla | 1 | 50 | 93.117 | 53,6 | 0,0 | 165,6 | 98,4 | 36,38 | Not recommended |
Notes: Prevalence estimates are expressed per 100,000 population aged ≥6 years and combine the complementary EDAD-Households 2020 and EDAD-Centres 2023 population frames. n, unweighted number of cases; UI, uncertainty interval; CV, coefficient of variation. Approximate 95% UIs and CVs were obtained using the weighted cluster bootstrap and are not official INE sampling errors. Estimates are crude and were not age-standardized. Regional precision categories (Feasible, Feasible with caution, Exploratory, and Not recommended for stand-alone interpretation) were defined a priori for this study using the unweighted number of cases, CV, proportion of bootstrap replicates with a zero numerator, and lower 95% UI; they are not official INE reliability classifications. Regional estimates are intended for descriptive comparison and should not be interpreted as a statistical ranking of autonomous communities.
Disclaimer/Publisher’s Note: The statements, opinions and data contained in all publications are solely those of the individual author(s) and contributor(s) and not of MDPI and/or the editor(s). MDPI and/or the editor(s) disclaim responsibility for any injury to people or property resulting from any ideas, methods, instructions or products referred to in the content. |
© 2026 by the authors. Licensee MDPI, Basel, Switzerland. This article is an open access article distributed under the terms and conditions of the Creative Commons Attribution (CC BY) license (http://creativecommons.org/licenses/by/4.0/).
Copyright: This open access article is published under a Creative Commons CC BY 4.0 license, which permit the free download, distribution, and reuse, provided that the author and preprint are cited in any reuse.


